Embed Size (px)
Citation preview

FINANCIAL REPORT2014
WWW.EBRD.COM/FINANCIALREPORT
European Bank for Reconstruction and Development One Exchange Square London EC2A 2JN United Kingdom
Tel: +44 20 7338 6000 Fax: +44 20 7338 6100 Requests for publications: [email protected]
FINANCIAL REPORT2014
WWW.EBRD.COM/FINANCIALREPORT
FINAN
CIAL R
EPO
RT 201
4
View this Financial Report online www.ebrd.com/financialreport
The Financial Report 2014 includes the approved and audited financial statements required to be submitted under Article 27 of the Agreement Establishing the European Bank for Reconstruction and Development and Section 13 of its By-Laws.
The EBRD is investing in changing people’s lives and environments from central Europe to Central Asia, the Western Balkans and the southern and eastern Mediterranean region. With an emphasis on working with the private sector, we invest in projects, engage in policy dialogue and provide technical advice that fosters innovation and builds sustainable and open-market economies.
Controller’s officeNigel KerbyTerry CullenGordon JonesLiyuan Malone
Editorial productionLucy PlaskettJane RossNatasha Treloar
Design and print managementDaniel Kelly
European Bank for Reconstruction and DevelopmentOne Exchange SquareLondon EC2A 2JNUnited KingdomSwitchboard/central contactTel: +44 20 7338 6000Fax: +44 20 7338 6100
Information requests
For information requests and general enquiries, please use the form at www.ebrd.com/inforequest
Project enquiries
Tel: +44 20 7338 7168Fax: +44 20 7338 7380Email: [email protected]
EBRD publicationsTel: +44 20 7338 7553Fax: +44 20 7338 6102Email: [email protected]
Websitewww.ebrd.com
Printed in England by Park Communications which operates an environmental waste and paper recycling programme. The Financial Report 2014 is printed on GalerieArt Satin™ containing 100 per cent virgin fibre sourced from responsibly managed, FSC® and PEFC certified forests. The pulp used in this product is bleached using an Elemental Chlorine Free (ECF) process and the inks are vegetable oil based and environmentally friendly. The cover is printed on Vision Superior.
Park Communications is an EMAS-certified company and its Environmental Management System is certified to ISO 14001.
539 Financial Report 2014 (E/2,000)
© European Bank for Reconstruction and Development
All rights reserved. No part of this publication may be reproduced or transmitted in any form or by any means including photocopying and recording, without the written permission of the copyright holder. Such written permission must also be obtained before any part of this publication is stored in a retrieval system of any nature.
Applications for such permission should be addressed to: Head, Long-term Communications Output, Communications, EBRD, One Exchange Square, London EC2A 2JN, United Kingdom, or by email to: [email protected]

EBRD Financial Report 2014 1
2 Highlights
4 Financial results 7 Key financial indicators: 2010-14
8 Additional reporting and disclosures
13 Financial statements 13 Income statement 14 Statement of comprehensive income 15 Balance sheet 16 Statement of changes in equity 17 Statement of cash flows 18 Accounting policies 26 Risk management 55 Notes to the financial statements
80 Responsibility for external financial reporting
81 Report of the independent auditor
82 Independent auditor’s report to the Governors
Highlights
2 EBRD Financial Report 2014
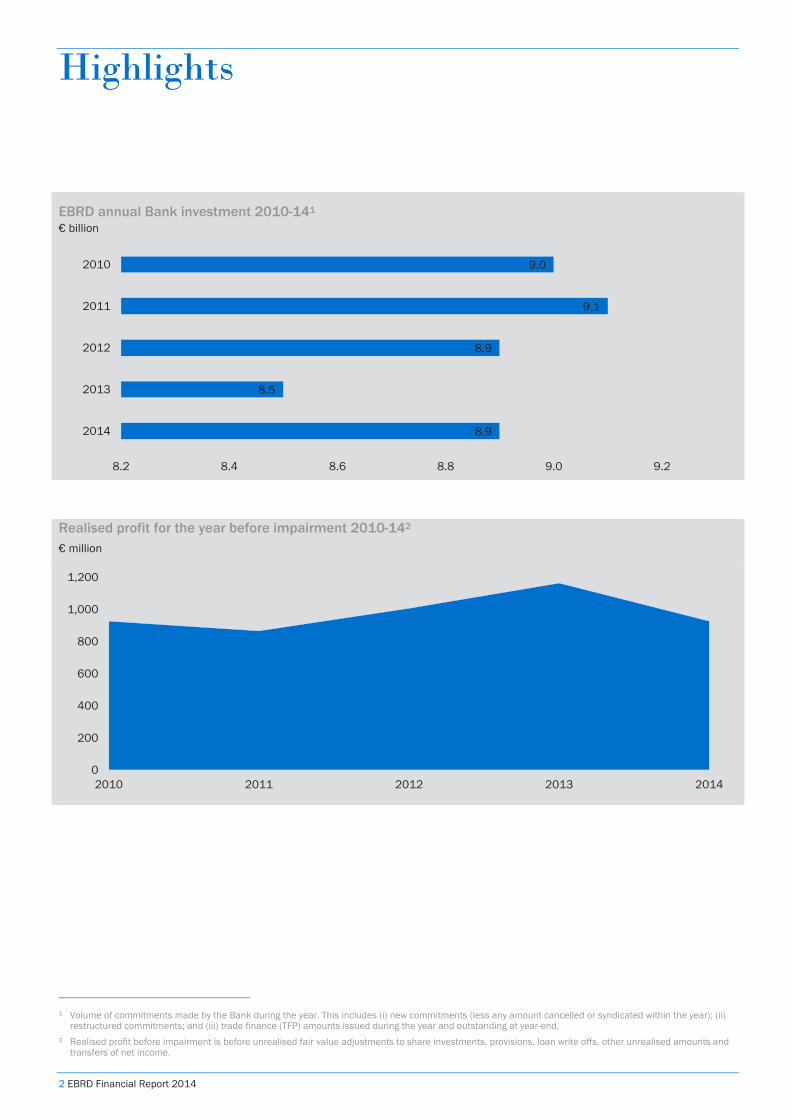
EBRD annual Bank investment 2010-141 € billion
Realised profit for the year before impairment 2010-142 € million
1 Volume of commitments made by the Bank during the year. This includes (i) new commitments (less any amount cancelled or syndicated within the year); (ii)
restructured commitments; and (iii) trade finance (TFP) amounts issued during the year and outstanding at year-end. 2 Realised profit before impairment is before unrealised fair value adjustments to share investments, provisions, loan write offs, other unrealised amounts and
transfers of net income.
8.9
8.5
8.9
9.1
9.0
8.2 8.4 8.6 8.8 9.0 9.2
2014
2013
2012
2011
2010
0
200
400
600
800
1,000
1,200
2010 2011 2012 2013 2014
EBRD Financial Report 2014 3
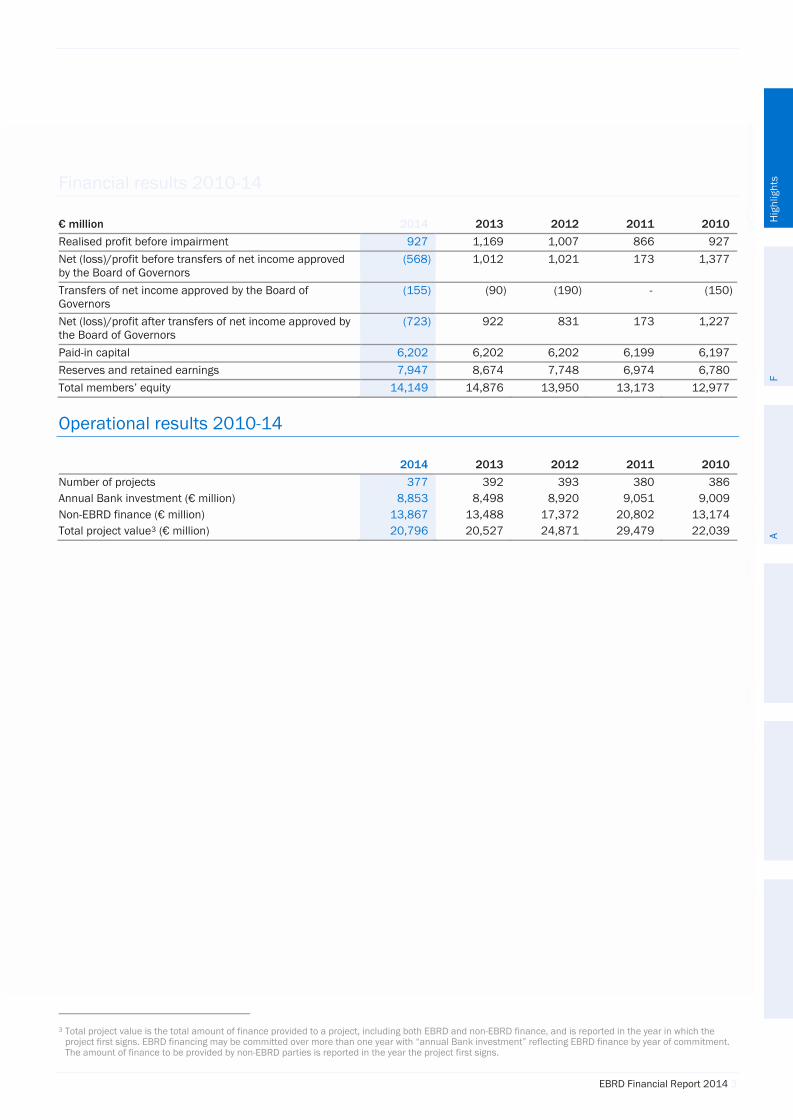
Financial results 2010-14
€ million
2014 2013
2012 2011 2010 Realised profit before impairment 927 1,169 1,007 866 927 Net (loss)/profit before transfers of net income approved by the Board of Governors
(568) 1,012 1,021 173 1,377
Transfers of net income approved by the Board of Governors
(155) (90) (190) - (150)
Net (loss)/profit after transfers of net income approved by the Board of Governors
(723) 922 831 173 1,227
Paid-in capital 6,202 6,202 6,202 6,199 6,197 Reserves and retained earnings 7,947 8,674 7,748 6,974 6,780 Total members’ equity 14,149 14,876 13,950 13,173 12,977
Operational results 2010-14
2014 2013 2012 2011 2010 Number of projects 377 392 393 380 386 Annual Bank investment (€ million) 8,853 8,498 8,920 9,051 9,009 Non-EBRD finance (€ million) 13,867 13,488 17,372 20,802 13,174 Total project value3 (€ million) 20,796 20,527 24,871 29,479 22,039
3 Total project value is the total amount of finance provided to a project, including both EBRD and non-EBRD finance, and is reported in the year in which the
project first signs. EBRD financing may be committed over more than one year with “annual Bank investment” reflecting EBRD finance by year of commitment. The amount of finance to be provided by non-EBRD parties is reported in the year the project first signs.
Highlights
2 EBRD Financial Report 2014
EBRD annual Bank investment 2010-141 € billion
Realised profit for the year before impairment 2010-142 € million
1 Volume of commitments made by the Bank during the year. This includes (i) new commitments (less any amount cancelled or syndicated within the year); (ii)
restructured commitments; and (iii) trade finance (TFP) amounts issued during the year and outstanding at year-end. 2 Realised profit before impairment is before unrealised fair value adjustments to share investments, provisions, loan write offs, other unrealised amounts and
transfers of net income.
8.9
8.5
8.9
9.1
9.0
8.2 8.4 8.6 8.8 9.0 9.2
2014
2013
2012
2011
2010
0
200
400
600
800
1,000
1,200
2010 2011 2012 2013 2014
EBRD Financial Report 2014 3
Financial results 2010-14
€ million
2014 2013
2012 2011 2010 Realised profit before impairment 927 1,169 1,007 866 927 Net (loss)/profit before transfers of net income approved by the Board of Governors
(568) 1,012 1,021 173 1,377
Transfers of net income approved by the Board of Governors
(155) (90) (190) - (150)
Net (loss)/profit after transfers of net income approved by the Board of Governors
(723) 922 831 173 1,227
Paid-in capital 6,202 6,202 6,202 6,199 6,197 Reserves and retained earnings 7,947 8,674 7,748 6,974 6,780 Total members’ equity 14,149 14,876 13,950 13,173 12,977
Operational results 2010-14
2014 2013 2012 2011 2010 Number of projects 377 392 393 380 386 Annual Bank investment (€ million) 8,853 8,498 8,920 9,051 9,009 Non-EBRD finance (€ million) 13,867 13,488 17,372 20,802 13,174 Total project value3 (€ million) 20,796 20,527 24,871 29,479 22,039
3 Total project value is the total amount of finance provided to a project, including both EBRD and non-EBRD finance, and is reported in the year in which the
project first signs. EBRD financing may be committed over more than one year with “annual Bank investment” reflecting EBRD finance by year of commitment. The amount of finance to be provided by non-EBRD parties is reported in the year the project first signs.
Financial results
4 EBRD Financial Report 2014
In 2014 the EBRD continued to generate net realised profit within the expected target range, achieving €0.9 billion against €1.2 billion in 2013. Realised profit is mainly generated by net interest income together with dividends and sale proceeds from exiting equity investments.
However events in Russia and Ukraine have had a major impact on unrealised elements of the Bank’s financial performance resulting in a net loss, before transfers approved by the Board of Governors, of €0.6 billion compared with a net profit of €1.0 billion in 2013.
The impact of these events was felt most acutely in the Bank’s equity portfolio where valuations of investments fell significantly, particularly as a result of the steep decline in the value of the Russian rouble. The weakened state of the Ukrainian economy has had an impact on credit risk in the Bank’s loan exposure to borrowers in that country, resulting in higher charges for both specific and general provisions.
The net loss, together with transfers of €155 million approved by the Bank’s Board of Governors, resulted in reserves of €7.9 billion at the end of 2014, down from €8.7 billion at the end of 2013.
The Bank continues to be rated AAA or equivalent, with a stable outlook, by all three major rating agencies. It maintains a robust capital position, high levels of liquidity and enjoys the strong support of its members.
EBRD Financial Report 2014 5
Bank operations
Operational results Annual Bank investment amounted to €8.9 billion in 2014, comprising 377 operations and 80 active trade finance agreements under the 2014 trade facilitation programme (2013: €8.5 billion, 392 projects and 72 trade finance agreements). This total included 15 commitments in Egypt for €593 million funded through the SEMED4 Investment Special Fund. The EBRD invested in 34 countries in 2014 with investments by region as follows: Central Asia €0.8 billion, Turkey €1.4 billion, Eastern Europe and the Caucasus €2.1 billion, South-eastern Europe €1.7 billion, Central Europe and the Baltic states €1.1 billion, SEMED €1.1 billion, Cyprus €0.1 billion and Russia €0.6 billion. The EBRD continued to support key economic sectors in line with its operational strategy. Annual Bank investment in the diversified corporate sectors reached €2.3 billion in 2014; in the financial sector it reached €2.8 billion, with priority given to SME financing, in the infrastructure sector €2.1 billion and in the energy sector €1.7 billion. The Bank’s portfolio of investment operations5 increased from €37.8 billion in 2013 to €38.7 billion by the end of 2014 with finance provided through new investment operations exceeding reflows from existing investment operations and cancellations of unutilised amounts. Gross disbursements reached €6.5 billion in 2014, up from €5.9 billion in 2013, with loan repayments of €4.7 billion (2013: €4.7 billion) and equity divestments of €1.2 billion (2013: €0.7 billion) resulting in operating assets6 of €27.2 billion at end 2014, up from €26.4 billion at end 2013. Operating assets comprised €21.0 billion of disbursed outstanding loans (2013: €20.0 billion) and €6.2 billion of disbursed outstanding equity investments at historic cost (2013: €6.4 billion) at 31 December 2014. The Bank’s projects included additional non-EBRD finance of approximately €13.9 billion in 2014 (2013: €13.5 billion). Of this, the Bank directly mobilised €1.2 billion of investment from co-financiers, €865 million through loan syndications (2013: €759 million) with the balance representing arranged finance. In addition, the Bank’s activities remained strongly supported by donor funding, including the Special Funds programme and the technical and investment cooperation funds. These broad-based results reflect an ongoing commitment to the transition of countries in the EBRD region as they build and strengthen open market economies.
4 SEMED = southern and eastern Mediterranean region. 5 Investment operations refers to the Bank’s loan and equity portfolios at
cost together with undrawn commitments. 6 Operating assets are the total amounts disbursed less reflows. They do
not include accounting fair value adjustments or the deferral of fees associated with the origination of amortised cost assets.
Financial performance Banking operations recorded a net loss of €614 million7 for 2014 (2013: profit of €791 million), reflecting the financial fallout from the events which arose between Russia and Ukraine. The largest contributor to the net loss was the performance of the Banking’s equity portfolio which returned a loss of €748 million compared to a profit of €376 million in 2013. The portfolio’s Russian exposure was the main factor in this loss with the sharp fall in the value of the Russian rouble having a major impact on valuations. While the Banking loan book continued to generate strong net interest income of €772 million (2013: €743 million), higher provisions of €440 million were required compared to €133 million in 2013. This increase in provisioning was primarily due to the deteriorating economic environment in Ukraine.
Treasury operations
Portfolio The value of assets under Treasury management at 31 December 2014 was €22.5 billion (2013: €20.1 billion). This increase is mainly due to the decline in the value of the euro against the United States dollar, resulting in a corresponding uplift in the value of dollar-denominated assets when translated into euro.
Financial performance Treasury operations reported an operating profit of €137 million for 2014 (2013: €147 million) before hedge accounting adjustments and the impact of currency basis swap spreads. Treasury uses currency swaps for funding its banking loan operations, primarily the Russian rouble-denominated portfolio. These swaps will be held to maturity and so the unrealised losses caused by volatility in currency basis swap spreads will reverse over time. After allowing for the impact of hedge accounting and currency basis swap spreads, Treasury returned a profit of €46 million (2013: €221 million).
Capital The Bank’s authorised share capital is €30.0 billion (2013: €30.0 billion). At 31 December 2014, subscribed capital was €29.7 billion (2013: €29.7 billion). Paid-in capital was €6.2 billion at 31 December 2014 (2013: €6.2 billion), of which €11 million was overdue (2013: €10 million).8 The calculation of capital for gearing purposes under the Agreement Establishing the Bank is explained under the Capital Management section of this report on page 49.
7 See Note 2 on page 55 for further detail. 8 The movement in paid-in capital during 2014 is attributable to foreign
exchange movements.
6 EBRD Financial Report 2014
Reserves The Bank’s reserves decreased from €8.7 billion at the end of 2013 to €7.9 billion at the end of 2014, reflecting the total comprehensive loss for the year.
Expenses The Bank continues to focus on budgetary discipline, effective cost controls and a proactive cost-recovery programme. The Bank’s general administrative expenses for 2014, including depreciation and amortisation, totalled €355 million (2013: €345 million). Sterling general administrative expenses for 2014, including depreciation and amortisation, totalled £300 million (2013: £295 million).
Outlook for 2015 The Bank expects its net realised profit before impairment to remain relatively stable. However continuing geopolitical tensions, market and currency volatility, as well as a slowdown in growth in many of the countries in which the Bank invests, will create volatility in the Bank’s overall financial performance. This volatility will typically be hardest felt in the valuations of the Bank’s equity portfolio and the level of provisioning against its Banking loan book.
Key financial indicators 2010-14
EBRD Financial Report 2014 7
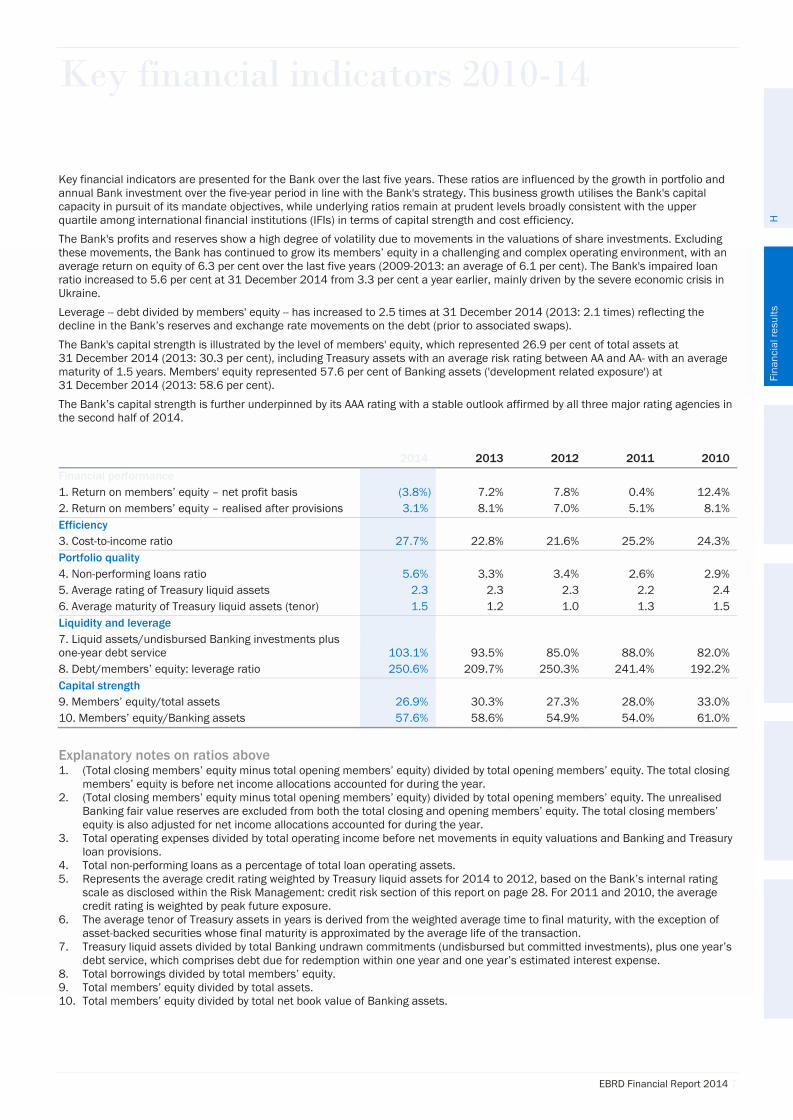
Key financial indicators are presented for the Bank over the last five years. These ratios are influenced by the growth in portfolio and annual Bank investment over the five-year period in line with the Bank's strategy. This business growth utilises the Bank's capital capacity in pursuit of its mandate objectives, while underlying ratios remain at prudent levels broadly consistent with the upper quartile among international financial institutions (IFIs) in terms of capital strength and cost efficiency. The Bank's profits and reserves show a high degree of volatility due to movements in the valuations of share investments. Excluding these movements, the Bank has continued to grow its members’ equity in a challenging and complex operating environment, with an average return on equity of 6.3 per cent over the last five years (2009-2013: an average of 6.1 per cent). The Bank's impaired loan ratio increased to 5.6 per cent at 31 December 2014 from 3.3 per cent a year earlier, mainly driven by the severe economic crisis in Ukraine. Leverage -- debt divided by members' equity -- has increased to 2.5 times at 31 December 2014 (2013: 2.1 times) reflecting the decline in the Bank’s reserves and exchange rate movements on the debt (prior to associated swaps). The Bank's capital strength is illustrated by the level of members' equity, which represented 26.9 per cent of total assets at 31 December 2014 (2013: 30.3 per cent), including Treasury assets with an average risk rating between AA and AA- with an average maturity of 1.5 years. Members' equity represented 57.6 per cent of Banking assets ('development related exposure') at 31 December 2014 (2013: 58.6 per cent). The Bank’s capital strength is further underpinned by its AAA rating with a stable outlook affirmed by all three major rating agencies in the second half of 2014.
Explanatory notes on ratios above 1. (Total closing members’ equity minus total opening members’ equity) divided by total opening members’ equity. The total closing
members’ equity is before net income allocations accounted for during the year. 2. (Total closing members’ equity minus total opening members’ equity) divided by total opening members’ equity. The unrealised
Banking fair value reserves are excluded from both the total closing and opening members’ equity. The total closing members’ equity is also adjusted for net income allocations accounted for during the year.
3. Total operating expenses divided by total operating income before net movements in equity valuations and Banking and Treasury loan provisions.
4. Total non-performing loans as a percentage of total loan operating assets. 5. Represents the average credit rating weighted by Treasury liquid assets for 2014 to 2012, based on the Bank’s internal rating
scale as disclosed within the Risk Management: credit risk section of this report on page 28. For 2011 and 2010, the average credit rating is weighted by peak future exposure.
6. The average tenor of Treasury assets in years is derived from the weighted average time to final maturity, with the exception of asset-backed securities whose final maturity is approximated by the average life of the transaction.
7. Treasury liquid assets divided by total Banking undrawn commitments (undisbursed but committed investments), plus one year’s debt service, which comprises debt due for redemption within one year and one year’s estimated interest expense.
8. Total borrowings divided by total members’ equity. 9. Total members’ equity divided by total assets. 10. Total members’ equity divided by total net book value of Banking assets.
2014 2013 2012 2011 2010 Financial performance 1. Return on members’ equity – net profit basis (3.8%) 7.2% 7.8% 0.4% 12.4% 2. Return on members’ equity – realised after provisions 3.1% 8.1% 7.0% 5.1% 8.1% Efficiency 3. Cost-to-income ratio 27.7% 22.8% 21.6% 25.2% 24.3% Portfolio quality 4. Non-performing loans ratio 5.6% 3.3% 3.4% 2.6% 2.9% 5. Average rating of Treasury liquid assets 2.3 2.3 2.3 2.2 2.4 6. Average maturity of Treasury liquid assets (tenor) 1.5 1.2 1.0 1.3 1.5 Liquidity and leverage 7. Liquid assets/undisbursed Banking investments plus one-year debt service 103.1% 93.5% 85.0% 88.0% 82.0% 8. Debt/members’ equity: leverage ratio 250.6% 209.7% 250.3% 241.4% 192.2% Capital strength 9. Members’ equity/total assets 26.9% 30.3% 27.3% 28.0% 33.0% 10. Members’ equity/Banking assets 57.6% 58.6% 54.9% 54.0% 61.0%
6 EBRD Financial Report 2014
Reserves The Bank’s reserves decreased from €8.7 billion at the end of 2013 to €7.9 billion at the end of 2014, reflecting the total comprehensive loss for the year.
Expenses The Bank continues to focus on budgetary discipline, effective cost controls and a proactive cost-recovery programme. The Bank’s general administrative expenses for 2014, including depreciation and amortisation, totalled €355 million (2013: €345 million). Sterling general administrative expenses for 2014, including depreciation and amortisation, totalled £300 million (2013: £295 million).
Outlook for 2015 The Bank expects its net realised profit before impairment to remain relatively stable. However continuing geopolitical tensions, market and currency volatility, as well as a slowdown in growth in many of the countries in which the Bank invests, will create volatility in the Bank’s overall financial performance. This volatility will typically be hardest felt in the valuations of the Bank’s equity portfolio and the level of provisioning against its Banking loan book.
Key financial indicators 2010-14
EBRD Financial Report 2014 7
Key financial indicators are presented for the Bank over the last five years. These ratios are influenced by the growth in portfolio and annual Bank investment over the five-year period in line with the Bank's strategy. This business growth utilises the Bank's capital capacity in pursuit of its mandate objectives, while underlying ratios remain at prudent levels broadly consistent with the upper quartile among international financial institutions (IFIs) in terms of capital strength and cost efficiency. The Bank's profits and reserves show a high degree of volatility due to movements in the valuations of share investments. Excluding these movements, the Bank has continued to grow its members’ equity in a challenging and complex operating environment, with an average return on equity of 6.3 per cent over the last five years (2009-2013: an average of 6.1 per cent). The Bank's impaired loan ratio increased to 5.6 per cent at 31 December 2014 from 3.3 per cent a year earlier, mainly driven by the severe economic crisis in Ukraine. Leverage -- debt divided by members' equity -- has increased to 2.5 times at 31 December 2014 (2013: 2.1 times) reflecting the decline in the Bank’s reserves and exchange rate movements on the debt (prior to associated swaps). The Bank's capital strength is illustrated by the level of members' equity, which represented 26.9 per cent of total assets at 31 December 2014 (2013: 30.3 per cent), including Treasury assets with an average risk rating between AA and AA- with an average maturity of 1.5 years. Members' equity represented 57.6 per cent of Banking assets ('development related exposure') at 31 December 2014 (2013: 58.6 per cent). The Bank’s capital strength is further underpinned by its AAA rating with a stable outlook affirmed by all three major rating agencies in the second half of 2014.
Explanatory notes on ratios above 1. (Total closing members’ equity minus total opening members’ equity) divided by total opening members’ equity. The total closing
members’ equity is before net income allocations accounted for during the year. 2. (Total closing members’ equity minus total opening members’ equity) divided by total opening members’ equity. The unrealised
Banking fair value reserves are excluded from both the total closing and opening members’ equity. The total closing members’ equity is also adjusted for net income allocations accounted for during the year.
3. Total operating expenses divided by total operating income before net movements in equity valuations and Banking and Treasury loan provisions.
4. Total non-performing loans as a percentage of total loan operating assets. 5. Represents the average credit rating weighted by Treasury liquid assets for 2014 to 2012, based on the Bank’s internal rating
scale as disclosed within the Risk Management: credit risk section of this report on page 28. For 2011 and 2010, the average credit rating is weighted by peak future exposure.
6. The average tenor of Treasury assets in years is derived from the weighted average time to final maturity, with the exception of asset-backed securities whose final maturity is approximated by the average life of the transaction.
7. Treasury liquid assets divided by total Banking undrawn commitments (undisbursed but committed investments), plus one year’s debt service, which comprises debt due for redemption within one year and one year’s estimated interest expense.
8. Total borrowings divided by total members’ equity. 9. Total members’ equity divided by total assets. 10. Total members’ equity divided by total net book value of Banking assets.
2014 2013 2012 2011 2010 Financial performance 1. Return on members’ equity – net profit basis (3.8%) 7.2% 7.8% 0.4% 12.4% 2. Return on members’ equity – realised after provisions 3.1% 8.1% 7.0% 5.1% 8.1% Efficiency 3. Cost-to-income ratio 27.7% 22.8% 21.6% 25.2% 24.3% Portfolio quality 4. Non-performing loans ratio 5.6% 3.3% 3.4% 2.6% 2.9% 5. Average rating of Treasury liquid assets 2.3 2.3 2.3 2.2 2.4 6. Average maturity of Treasury liquid assets (tenor) 1.5 1.2 1.0 1.3 1.5 Liquidity and leverage 7. Liquid assets/undisbursed Banking investments plus one-year debt service 103.1% 93.5% 85.0% 88.0% 82.0% 8. Debt/members’ equity: leverage ratio 250.6% 209.7% 250.3% 241.4% 192.2% Capital strength 9. Members’ equity/total assets 26.9% 30.3% 27.3% 28.0% 33.0% 10. Members’ equity/Banking assets 57.6% 58.6% 54.9% 54.0% 61.0%

Additional reporting and disclosures
8 EBRD Financial Report 2014
Corporate governance The EBRD is committed to the highest standards of corporate governance. Responsibilities and related controls throughout the Bank are properly defined and delineated. Transparency and accountability are integral elements of its corporate governance framework. This structure is further supported by a system of reporting, with information appropriately tailored for, and disseminated to, each level of responsibility within the Bank to enable the system of checks and balances on the Bank’s activities to function effectively. The Bank’s governing constituent document is the Agreement Establishing the Bank (the Agreement), which states that the institution will have a Board of Governors, a Board of Directors, a President, Vice Presidents, officers and staff.
Board of Governors All the powers of the Bank are vested in the Board of Governors, which represents the Bank’s 66 members. With the exception of certain reserved powers, the Board of Governors has delegated the exercise of its powers to the Board of Directors, while retaining overall authority.
Board of Directors The Board of Directors comprises 23 Directors and is chaired by the President. Each Director represents one or more members. Subject to the Board of Governors’ overall authority, the Board of Directors is responsible for the direction of the Bank’s general operations and policies. It exercises the powers expressly assigned to it by the Agreement and those powers delegated to it by the Board of Governors.
Board Committees The Board of Directors has established three Board Committees to assist with its work: The Audit Committee assists the Board of Directors in fulfilling its responsibilities in relation to the following:
the integrity of the Bank’s financial statements and its accounting, financial reporting and disclosure policies and practices the soundness of the Bank’s systems of internal controls that management has established regarding finance and
accounting matters and their effective implementation the status, the ability to perform duties independently and the performance of the Bank’s compliance, internal audit,
evaluation and risk management functions the independence, qualifications and performance of the Bank’s external auditor other responsibilities within its remit.
The Budget and Administrative Affairs Committee assists the Board of Directors in fulfilling its responsibilities in relation to the following:
the budgetary, staff and administrative resources of the Bank efficiency, cost control and budgetary prudence the EBRD Shareholder Special Fund, the use of donor funding and relations with the donor community the Bank’s Human Resources policies specific responsibilities in relation to Governors, the President, Vice Presidents and Directors of the Bank policies relating to governance and ethics the Bank’s administrative arrangements other responsibilities within its remit.
The Financial and Operations Policies Committee assists the Board of Directors in fulfilling its responsibilities in relation to the following:
the Bank’s financial policies the Bank’s Treasury operations, Liquidity Policy and Borrowing Programme the Bank’s operational policies the Bank’s strategic portfolio management within the framework of the Medium Term Strategy transparency and accountability of the Bank’s operations within the framework of the Public Information Policy and the
Project Complaint Mechanism other responsibilities within its remit.
The composition of these committees during 2014 is detailed in the separate Review section of the Annual Report.
The President The President is elected by the Board of Governors. He is the legal representative and chief of staff of the Bank. Under the direction of the Board of Directors, the President conducts the day-to-day business of the Bank. The President chairs the Bank’s Executive Committee, which also includes the Vice Presidents and other members of the Bank’s senior management.
EBRD Financial Report 2014 9
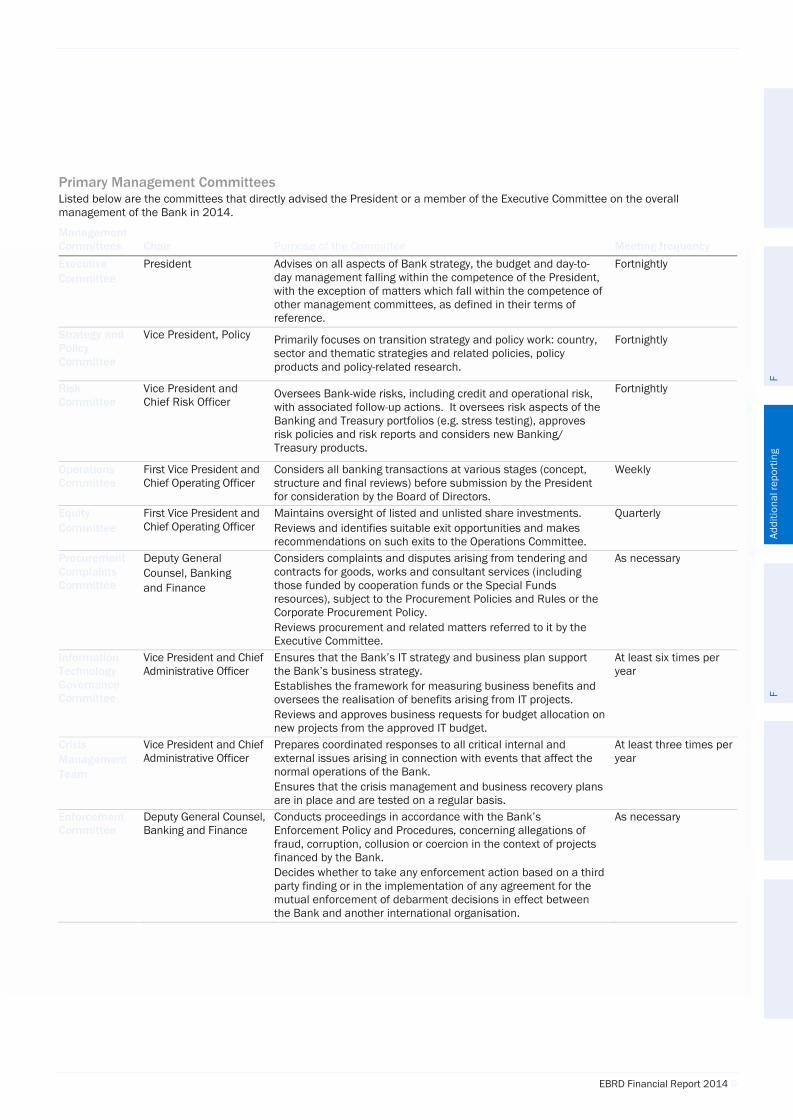
Primary Management Committees Listed below are the committees that directly advised the President or a member of the Executive Committee on the overall management of the Bank in 2014.
Management Committees Chair Purpose of the Committee Meeting frequency Executive Committee
President Advises on all aspects of Bank strategy, the budget and day-to-day management falling within the competence of the President, with the exception of matters which fall within the competence of other management committees, as defined in their terms of reference.
Fortnightly
Strategy and Policy Committee
Vice President, Policy Primarily focuses on transition strategy and policy work: country, sector and thematic strategies and related policies, policy products and policy-related research.
Fortnightly
Risk Committee
Vice President and Chief Risk Officer
Oversees Bank-wide risks, including credit and operational risk, with associated follow-up actions. It oversees risk aspects of the Banking and Treasury portfolios (e.g. stress testing), approves risk policies and risk reports and considers new Banking/ Treasury products.
Fortnightly
Operations Committee
First Vice President and Chief Operating Officer
Considers all banking transactions at various stages (concept, structure and final reviews) before submission by the President for consideration by the Board of Directors.
Weekly
Equity Committee
First Vice President and Chief Operating Officer
Maintains oversight of listed and unlisted share investments. Reviews and identifies suitable exit opportunities and makes recommendations on such exits to the Operations Committee.
Quarterly
Procurement Complaints Committee
Deputy General Counsel, Banking and Finance
Considers complaints and disputes arising from tendering and contracts for goods, works and consultant services (including those funded by cooperation funds or the Special Funds resources), subject to the Procurement Policies and Rules or the Corporate Procurement Policy. Reviews procurement and related matters referred to it by the Executive Committee.
As necessary
Information Technology Governance Committee
Vice President and Chief Administrative Officer
Ensures that the Bank’s IT strategy and business plan support the Bank’s business strategy. Establishes the framework for measuring business benefits and oversees the realisation of benefits arising from IT projects. Reviews and approves business requests for budget allocation on new projects from the approved IT budget.
At least six times per year
Crisis Management Team
Vice President and Chief Administrative Officer
Prepares coordinated responses to all critical internal and external issues arising in connection with events that affect the normal operations of the Bank. Ensures that the crisis management and business recovery plans are in place and are tested on a regular basis.
At least three times per year
Enforcement Committee
Deputy General Counsel, Banking and Finance
Conducts proceedings in accordance with the Bank’s Enforcement Policy and Procedures, concerning allegations of fraud, corruption, collusion or coercion in the context of projects financed by the Bank. Decides whether to take any enforcement action based on a third party finding or in the implementation of any agreement for the mutual enforcement of debarment decisions in effect between the Bank and another international organisation.
As necessary
Additional reporting and disclosures
8 EBRD Financial Report 2014
Corporate governance The EBRD is committed to the highest standards of corporate governance. Responsibilities and related controls throughout the Bank are properly defined and delineated. Transparency and accountability are integral elements of its corporate governance framework. This structure is further supported by a system of reporting, with information appropriately tailored for, and disseminated to, each level of responsibility within the Bank to enable the system of checks and balances on the Bank’s activities to function effectively. The Bank’s governing constituent document is the Agreement Establishing the Bank (the Agreement), which states that the institution will have a Board of Governors, a Board of Directors, a President, Vice Presidents, officers and staff.
Board of Governors All the powers of the Bank are vested in the Board of Governors, which represents the Bank’s 66 members. With the exception of certain reserved powers, the Board of Governors has delegated the exercise of its powers to the Board of Directors, while retaining overall authority.
Board of Directors The Board of Directors comprises 23 Directors and is chaired by the President. Each Director represents one or more members. Subject to the Board of Governors’ overall authority, the Board of Directors is responsible for the direction of the Bank’s general operations and policies. It exercises the powers expressly assigned to it by the Agreement and those powers delegated to it by the Board of Governors.
Board Committees The Board of Directors has established three Board Committees to assist with its work: The Audit Committee assists the Board of Directors in fulfilling its responsibilities in relation to the following:
the integrity of the Bank’s financial statements and its accounting, financial reporting and disclosure policies and practices the soundness of the Bank’s systems of internal controls that management has established regarding finance and
accounting matters and their effective implementation the status, the ability to perform duties independently and the performance of the Bank’s compliance, internal audit,
evaluation and risk management functions the independence, qualifications and performance of the Bank’s external auditor other responsibilities within its remit.
The Budget and Administrative Affairs Committee assists the Board of Directors in fulfilling its responsibilities in relation to the following:
the budgetary, staff and administrative resources of the Bank efficiency, cost control and budgetary prudence the EBRD Shareholder Special Fund, the use of donor funding and relations with the donor community the Bank’s Human Resources policies specific responsibilities in relation to Governors, the President, Vice Presidents and Directors of the Bank policies relating to governance and ethics the Bank’s administrative arrangements other responsibilities within its remit.
The Financial and Operations Policies Committee assists the Board of Directors in fulfilling its responsibilities in relation to the following:
the Bank’s financial policies the Bank’s Treasury operations, Liquidity Policy and Borrowing Programme the Bank’s operational policies the Bank’s strategic portfolio management within the framework of the Medium Term Strategy transparency and accountability of the Bank’s operations within the framework of the Public Information Policy and the
Project Complaint Mechanism other responsibilities within its remit.
The composition of these committees during 2014 is detailed in the separate Review section of the Annual Report.
The President The President is elected by the Board of Governors. He is the legal representative and chief of staff of the Bank. Under the direction of the Board of Directors, the President conducts the day-to-day business of the Bank. The President chairs the Bank’s Executive Committee, which also includes the Vice Presidents and other members of the Bank’s senior management.
EBRD Financial Report 2014 9
Primary Management Committees Listed below are the committees that directly advised the President or a member of the Executive Committee on the overall management of the Bank in 2014.
Management Committees Chair Purpose of the Committee Meeting frequency Executive Committee
President Advises on all aspects of Bank strategy, the budget and day-to-day management falling within the competence of the President, with the exception of matters which fall within the competence of other management committees, as defined in their terms of reference.
Fortnightly
Strategy and Policy Committee
Vice President, Policy Primarily focuses on transition strategy and policy work: country, sector and thematic strategies and related policies, policy products and policy-related research.
Fortnightly
Risk Committee
Vice President and Chief Risk Officer
Oversees Bank-wide risks, including credit and operational risk, with associated follow-up actions. It oversees risk aspects of the Banking and Treasury portfolios (e.g. stress testing), approves risk policies and risk reports and considers new Banking/ Treasury products.
Fortnightly
Operations Committee
First Vice President and Chief Operating Officer
Considers all banking transactions at various stages (concept, structure and final reviews) before submission by the President for consideration by the Board of Directors.
Weekly
Equity Committee
First Vice President and Chief Operating Officer
Maintains oversight of listed and unlisted share investments. Reviews and identifies suitable exit opportunities and makes recommendations on such exits to the Operations Committee.
Quarterly
Procurement Complaints Committee
Deputy General Counsel, Banking and Finance
Considers complaints and disputes arising from tendering and contracts for goods, works and consultant services (including those funded by cooperation funds or the Special Funds resources), subject to the Procurement Policies and Rules or the Corporate Procurement Policy. Reviews procurement and related matters referred to it by the Executive Committee.
As necessary
Information Technology Governance Committee
Vice President and Chief Administrative Officer
Ensures that the Bank’s IT strategy and business plan support the Bank’s business strategy. Establishes the framework for measuring business benefits and oversees the realisation of benefits arising from IT projects. Reviews and approves business requests for budget allocation on new projects from the approved IT budget.
At least six times per year
Crisis Management Team
Vice President and Chief Administrative Officer
Prepares coordinated responses to all critical internal and external issues arising in connection with events that affect the normal operations of the Bank. Ensures that the crisis management and business recovery plans are in place and are tested on a regular basis.
At least three times per year
Enforcement Committee
Deputy General Counsel, Banking and Finance
Conducts proceedings in accordance with the Bank’s Enforcement Policy and Procedures, concerning allegations of fraud, corruption, collusion or coercion in the context of projects financed by the Bank. Decides whether to take any enforcement action based on a third party finding or in the implementation of any agreement for the mutual enforcement of debarment decisions in effect between the Bank and another international organisation.
As necessary
10 EBRD Financial Report 2014
EBRD Codes of Conduct The EBRD has a Code of Conduct for Officials of the Board of Directors and a separate Code of Conduct for Bank Personnel, which, respectively, articulate the values, duties and ethical standards that the Bank expects of its Board officials and staff. These Codes were last reviewed in 2011 and the revised versions were adopted by the Bank’s Board of Governors in February 2012. The Codes of Conduct can be obtained at www.ebrd.com/integrity-and-compliance.html
Compliance The EBRD has an independent Office of the Chief Compliance Officer (OCCO). This is headed by a Chief Compliance Officer (CCO) who reports directly to the President, and to the Audit Committee, quarterly or as necessary. Any decision to remove the CCO (other than for misconduct) shall be taken by the President in accordance with guidance given by the Board of Directors in an Executive Session. OCCO’s mission is to protect the integrity and reputation of the Bank, to promote ethical standards of behaviour and to strengthen the Bank’s accountability and transparency. OCCO assists in identifying, assessing, and monitoring integrity risks arising from failure to comply with the Bank’s standards and policies and contributes, in an independent manner, to the Bank’s effective management thereof. OCCO is also responsible for the development and maintenance of the policies and standards it enforces. The EBRD’s Integrity Risks Policy and Terms of Reference for OCCO, last revised in June 2014, and available at www.ebrd.com/downloads/integrity/integrityriskpol.pdf sets out, for the benefit of the Bank’s stakeholders, the manner in which OCCO helps the Bank to protect its integrity and reputation and to manage integrity risks related to clients and personal conduct related risks. Financial and integrity due diligence are integrated into the Bank’s normal approval of new business and in the monitoring of its existing operations. OCCO provides independent expert advice to management on significant integrity concerns and assesses whether the potential risk is acceptable to the Bank. It monitors the integrity due diligence information provided by the Banking Department to ensure that it is accurate and that integrity concerns are properly identified and, where possible, mitigated. OCCO is further responsible for investigating allegations of staff misconduct as well as allegations of fraud and corruption in relation to Bank projects and counterparties. Allegations of staff misconduct are investigated under the Conduct and Disciplinary Rules and Procedures (CDRPs), most recently revised to reflect the adoption by the Bank of an enhanced whistleblower protection regime. The CDRPs specify the rights and duties of both the Bank and staff member during the investigative and disciplinary processes and provide safeguards for the subject of the investigation. Allegations of misconduct on the part of Board officials on the one hand, and on the part of the President, Vice Presidents, Chief Evaluator and the CCO on the other, are dealt with in accordance with the provisions of the Code of Conduct for EBRD Board Officials or the Code of Conduct for EBRD Personnel, respectively. Allegations of fraud and corruption in relation to activities and projects financed from the Bank’s ordinary capital resources (including the purchase of goods, works or services for the Bank) or from Special Funds resources, or from cooperation funds administered by the Bank, are investigated under the Bank’s Enforcement Policy and Procedures (EPPs). The EPPs also describe the process by which the Bank applies sanctions imposed by other multilateral development banks pursuant to the Agreement for the Mutual Enforcement of Debarment Decisions. In 2014 the Bank cross debarred 54 corporations and 33 individuals following debarment decisions issued by the World Bank Group, the Asian Development Bank, the Inter-American Development Bank and the African Development Bank. In addition, during the course of 2014, debarment decisions were issued pursuant to enforcement proceedings instituted under the EPPs against Mr Alexander Capelson and Alfred C. Toepfer International (Ukraine) Ltd. Details of the individuals, entities and sanctions are posted at www.ebrd.com/ineligible-entities.html. OCCO is also responsible for training Bank personnel in relation to the Bank’s integrity, anti-money-laundering and counter-terrorist finance requirements. In addition, it provides specialist training and advises, as necessary, individuals who are nominated by the Bank to serve as directors on the boards of companies in which the Bank holds an equity interest. The Bank has an accountability mechanism that assesses and reviews complaints about Bank-financed projects and provides, where warranted, a determination as to whether the Bank acted in compliance with its relevant policies when it approved a particular project. The Project Complaint Mechanism (PCM) is administered by a dedicated PCM Officer, appointed by the President. The role of the CCO, as the head of the Office in which the PCM is located, is limited to ensuring that the PCM Officer officer carries out the PCM functions and administrative responsibilities according to the PCM rules of procedure. Information about the PCM and registered complaints can be found at www.ebrd.com/work-with-us/project-finance/project-complaint-mechanism.html. The Bank’s annual Anti-Corruption Report is published by OCCO. The report describes the Bank’s strategy to promote integrity and prevent fraud and corruption, and highlights the most recent measures taken. The Report also summarises the Bank’s technical cooperation, economic research and analysis, and international dialogue activities in relation to integrity and anti-corruption. The Report can be found at www.ebrd.com/integrity-and-compliance.html.
EBRD Financial Report 2014 11
Reporting The EBRD’s corporate governance structure is supported by appropriate financial and management reporting. The Bank has a functioning mechanism to be able to certify in the Financial Report 2014 as to the effectiveness of internal controls over external financial reporting, using the COSO (Committee of Sponsoring Organisations of the Treadway Commission) internal control framework (2013).9 This annual certification statement is signed by both the President and the Vice President and Chief Financial Officer (VP & CFO) and is subject to a review and an attestation by the Bank’s external auditor. In addition, the Bank has a comprehensive system of reporting to its Board of Directors and its committees. This includes reporting to the Audit Committee on the activities of the Evaluation Department and the Internal Audit Department.
Financial risks and operational risks Financial risks and operational risks are discussed in the Risk Management section of this report.
External auditor The external auditor is appointed by the Board of Directors, on the recommendation of the President. In 2014 the Board approved an extension of the term of appointment from four years to five with a maximum of two consecutive terms. Deloitte LLP (UK) completes its first four-year term in 2014 and has been re-appointed for the five-year period 2015 - 2019. The external auditor performs an annual audit in order to be able to express an opinion on whether the financial statements present fairly the financial position and the profit of the Bank in accordance with International Financial Reporting Standards (IFRS). In addition, the external auditor reviews and offers its opinion on management’s assertion as to the effectiveness of internal controls over financial reporting. This opinion is given as a separate report to the audit opinion. At the conclusion of its annual audit, the external auditor prepares a management letter for the Board of Governors, setting out its views and management’s responses on the effectiveness and efficiency of internal controls and other matters. This letter is reviewed in detail and discussed with the Audit Committee. The Audit Committee reviews the performance and independence of the external auditor annually. There are key provisions in the Bank’s policies regarding the independence of the external auditor. The external auditor is prohibited from providing non-audit related services unless such service is judged to be in the interest of the Bank and unless it is approved by the Audit Committee. However, the external auditor can provide consultancy services paid for by cooperation funds relating to client projects; such incidents are reported periodically to the Audit Committee.
Compensation policy The Bank has designed a market-oriented staff compensation policy, within the constraints of the Bank’s status as a multilateral institution, to meet the following objectives:
to be competitive enough to attract and retain high calibre employees from a wide range of member countries to motivate and encourage superior performance to take account of differing levels of responsibility to allow the Bank flexibility to respond rapidly to changing conditions to support a climate of constant staff development to deliver benefits that provide social security in daily life.
To help meet these objectives, the Bank’s members have agreed that the Bank should use market comparators in evaluating elements of its compensation and benefits package, and also that salary and performance-based compensation awards should be driven by performance. Market comparators for the Bank are primarily private sector financial institutions in each of its locations plus other IFIs. The performance-based compensation awards are structured to recognise individual and team contributions to the Bank’s overall performance. These payments represent a limited proportion of the overall total compensation and benefits package provided to staff.
EBRD staff remuneration All staff on fixed-term or regular contracts receive a salary which is reviewed on 1 April each year. In addition, members of staff who are not eligible for overtime pay are eligible to receive a performance-based compensation award depending on the Bank’s and the individual staff member’s performance. All staff on fixed-term10 or regular contracts, as well as most of the Board of Directors,11 the President and Vice Presidents, are covered by medical insurance, life insurance and participate in the Bank’s retirement plans. Certain staff hired from abroad may be eligible for some allowances to assist with costs related to their relocation.
9 In line with other organisations the Bank adopted the revised 2013 framework during 2014. The Bank previously applied the COSO 1992 framework. 10 Fixed-term contracts which are of a duration of two years or more. 11 Some Directors and Alternates are paid directly by their constituency and do not participate in the Bank’s retirement plans and/or other benefits.

12 EBRD Financial Report 2014
There are two retirement plans in operation. The Money Purchase Plan is a defined contribution scheme to which both the Bank and staff contribute, with Plan members making individual investment decisions. The Final Salary Plan is a defined benefit scheme, to which only the Bank contributes. Both plans provide a lump sum benefit on leaving the Bank or at retirement age, such that retirement plan obligations to staff once they have left the Bank or retired are minimal (being limited to inflation adjustments on undrawn or deferred benefits under each plan). The rules for the retirement plans are approved by the Board of Directors and are monitored by a Retirement Plan Committee, a Retirement Plan Administration Committee and a Retirement Plan Investment Committee. The salaries and emoluments of all staff are subject to an internal tax, applied at rates that vary according to the individual’s salary and personal circumstances. Their salaries and emoluments are exempt from national income tax in the United Kingdom.
President and Vice Presidents The President is elected by the Board of Governors and typically receives a fixed-term contract of four years. The President’s salary and benefits are approved by the Board of Governors. The President can participate in the same benefit schemes as the staff but s/he is not eligible for performance-based compensation awards. The Vice Presidents are appointed by the Board of Directors on the recommendation of the President and typically have fixed-term contracts of four years. Their salaries and benefits are approved by the Board of Directors. The Vice Presidents can participate in the same benefit schemes as the staff but are not eligible for performance-based compensation awards. The gross salaries paid for each of these positions, from which internal tax is deducted, are as follows:
Board of Directors Directors are elected by the Board of Governors for a term of three years and may be re-elected. Directors appoint Alternate Directors. The salaries of Directors and Alternate Directors are approved by the Board of Governors. They can participate in the same benefit schemes as staff but are not eligible for performance-based compensation awards. Some Directors and Alternates are paid directly by the directorship that they represent. In such cases, the funds that would otherwise be used by the Bank to pay such Directors and Alternates are made available to the directorship to offset other eligible costs to the directorship. The most recently approved gross salaries for these positions, from which internal tax is deducted, are as follows:
Senior management Key management personnel comprises: members of the Bank’s Executive Committee; Director of the President’s Office; Managing Directors; the Treasurer; the Controller; the Head of Internal Audit; the Chief Evaluator; and the CCO. This group, excluding the President and Vice Presidents (for whom information is given above), consists of 34 individuals whose most recently approved gross salaries, from which internal tax is deducted, are in the ranges shown in the table below. The average performance-based compensation award for this group was 22 per cent of annual gross salaries in 2014 (2013: 22 per cent).
12 Role changed hands on 1 March 2013. 13 Role changed hands on 9 October 2014. 14 Changed positions from Vice President, Risk and Resources to Vice President and Chief Risk Officer on 1 October 2013. 15 Employed from 1 October 2013. 16 Role changed hands on both 9 October 2014 and on 1 July 2013.
2014 £ 000
2014 € 000
2013 £ 000
2013 € 000
President 341 424 329 388 First Vice President and Chief Operating Officer12 310 385 304 359 Vice President and Chief Financial Officer13 283 351 277 327 Vice President and Chief Risk Officer14 283 351 277 327 Vice President and Chief Administrative Officer15 283 351 70 83 Vice President, Policy16 260 323 219 258
2014 £ 000
2014 € 000
2013 £ 000
2013 € 000
Director 143 178 143 169 Alternate Director 118 147 118 139
2014 £ 000
2014 € 000
2013 £ 000
2013 € 000
Minimum 90 112 100 118 Median 178 221 176 208 Maximum 216 268 213 251 No. in group 34 34 30 30
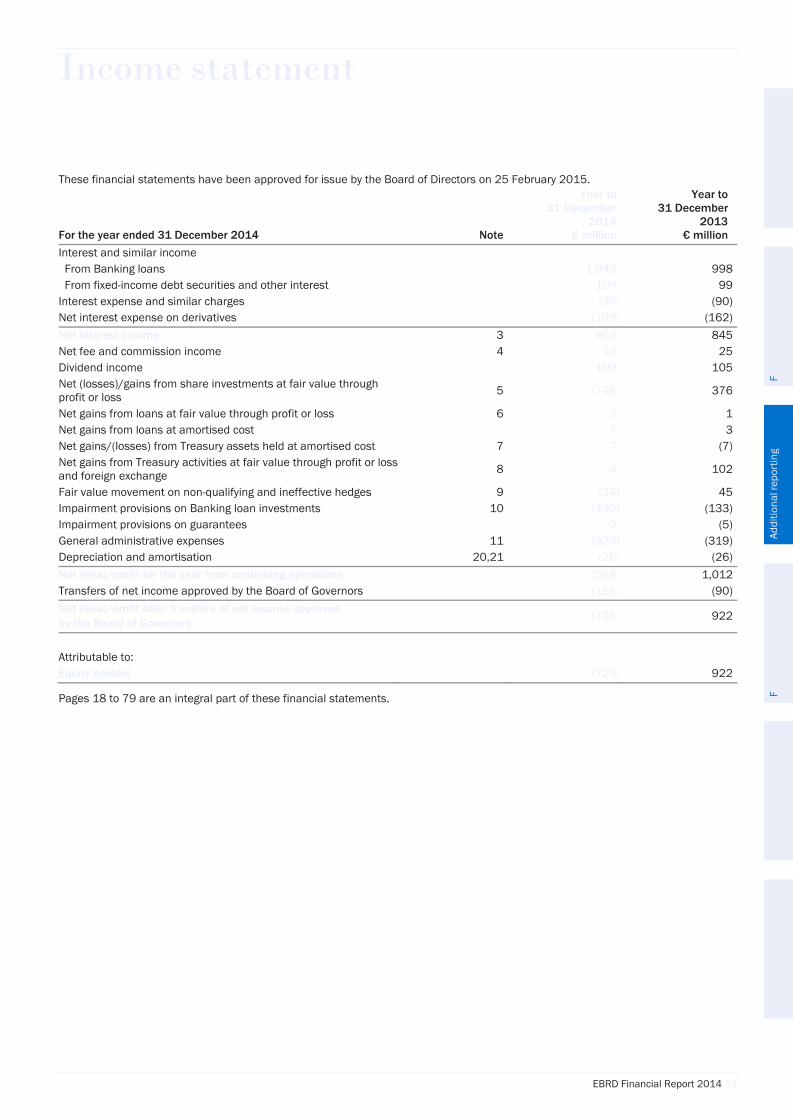
Income statement
EBRD Financial Report 2014 13
These financial statements have been approved for issue by the Board of Directors on 25 February 2015.
Pages 18 to 79 are an integral part of these financial statements.
For the year ended 31 December 2014 Note
Year to 31 December
2014 € million
Year to 31 December
2013 € million
Interest and similar income From Banking loans 1,043 998 From fixed-income debt securities and other interest 109 99 Interest expense and similar charges (90) (90) Net interest expense on derivatives (199) (162) Net interest income 3 863 845 Net fee and commission income 4 14 25 Dividend income 109 105 Net (losses)/gains from share investments at fair value through profit or loss 5 (748) 376
Net gains from loans at fair value through profit or loss 6 3 1 Net gains from loans at amortised cost 7 3 Net gains/(losses) from Treasury assets held at amortised cost 7 7 (7) Net gains from Treasury activities at fair value through profit or loss and foreign exchange 8 4 102
Fair value movement on non-qualifying and ineffective hedges 9 (34) 45 Impairment provisions on Banking loan investments 10 (440) (133) Impairment provisions on guarantees 2 (5) General administrative expenses 11 (329) (319) Depreciation and amortisation 20,21 (26) (26) Net (loss)/profit for the year from continuing operations (568) 1,012 Transfers of net income approved by the Board of Governors (155) (90) Net (loss)/profit after transfers of net income approved by the Board of Governors (723) 922
Attributable to: Equity holders (723) 922
12 EBRD Financial Report 2014
There are two retirement plans in operation. The Money Purchase Plan is a defined contribution scheme to which both the Bank and staff contribute, with Plan members making individual investment decisions. The Final Salary Plan is a defined benefit scheme, to which only the Bank contributes. Both plans provide a lump sum benefit on leaving the Bank or at retirement age, such that retirement plan obligations to staff once they have left the Bank or retired are minimal (being limited to inflation adjustments on undrawn or deferred benefits under each plan). The rules for the retirement plans are approved by the Board of Directors and are monitored by a Retirement Plan Committee, a Retirement Plan Administration Committee and a Retirement Plan Investment Committee. The salaries and emoluments of all staff are subject to an internal tax, applied at rates that vary according to the individual’s salary and personal circumstances. Their salaries and emoluments are exempt from national income tax in the United Kingdom.
President and Vice Presidents The President is elected by the Board of Governors and typically receives a fixed-term contract of four years. The President’s salary and benefits are approved by the Board of Governors. The President can participate in the same benefit schemes as the staff but s/he is not eligible for performance-based compensation awards. The Vice Presidents are appointed by the Board of Directors on the recommendation of the President and typically have fixed-term contracts of four years. Their salaries and benefits are approved by the Board of Directors. The Vice Presidents can participate in the same benefit schemes as the staff but are not eligible for performance-based compensation awards. The gross salaries paid for each of these positions, from which internal tax is deducted, are as follows:
Board of Directors Directors are elected by the Board of Governors for a term of three years and may be re-elected. Directors appoint Alternate Directors. The salaries of Directors and Alternate Directors are approved by the Board of Governors. They can participate in the same benefit schemes as staff but are not eligible for performance-based compensation awards. Some Directors and Alternates are paid directly by the directorship that they represent. In such cases, the funds that would otherwise be used by the Bank to pay such Directors and Alternates are made available to the directorship to offset other eligible costs to the directorship. The most recently approved gross salaries for these positions, from which internal tax is deducted, are as follows:
Senior management Key management personnel comprises: members of the Bank’s Executive Committee; Director of the President’s Office; Managing Directors; the Treasurer; the Controller; the Head of Internal Audit; the Chief Evaluator; and the CCO. This group, excluding the President and Vice Presidents (for whom information is given above), consists of 34 individuals whose most recently approved gross salaries, from which internal tax is deducted, are in the ranges shown in the table below. The average performance-based compensation award for this group was 22 per cent of annual gross salaries in 2014 (2013: 22 per cent).
12 Role changed hands on 1 March 2013. 13 Role changed hands on 9 October 2014. 14 Changed positions from Vice President, Risk and Resources to Vice President and Chief Risk Officer on 1 October 2013. 15 Employed from 1 October 2013. 16 Role changed hands on both 9 October 2014 and on 1 July 2013.
2014 £ 000
2014 € 000
2013 £ 000
2013 € 000
President 341 424 329 388 First Vice President and Chief Operating Officer12 310 385 304 359 Vice President and Chief Financial Officer13 283 351 277 327 Vice President and Chief Risk Officer14 283 351 277 327 Vice President and Chief Administrative Officer15 283 351 70 83 Vice President, Policy16 260 323 219 258
2014 £ 000
2014 € 000
2013 £ 000
2013 € 000
Director 143 178 143 169 Alternate Director 118 147 118 139
2014 £ 000
2014 € 000
2013 £ 000
2013 € 000
Minimum 90 112 100 118 Median 178 221 176 208 Maximum 216 268 213 251 No. in group 34 34 30 30
Income statement
EBRD Financial Report 2014 13
These financial statements have been approved for issue by the Board of Directors on 25 February 2015.
Pages 18 to 79 are an integral part of these financial statements.
For the year ended 31 December 2014 Note
Year to 31 December
2014 € million
Year to 31 December
2013 € million
Interest and similar income From Banking loans 1,043 998 From fixed-income debt securities and other interest 109 99 Interest expense and similar charges (90) (90) Net interest expense on derivatives (199) (162) Net interest income 3 863 845 Net fee and commission income 4 14 25 Dividend income 109 105 Net (losses)/gains from share investments at fair value through profit or loss 5 (748) 376
Net gains from loans at fair value through profit or loss 6 3 1 Net gains from loans at amortised cost 7 3 Net gains/(losses) from Treasury assets held at amortised cost 7 7 (7) Net gains from Treasury activities at fair value through profit or loss and foreign exchange 8 4 102
Fair value movement on non-qualifying and ineffective hedges 9 (34) 45 Impairment provisions on Banking loan investments 10 (440) (133) Impairment provisions on guarantees 2 (5) General administrative expenses 11 (329) (319) Depreciation and amortisation 20,21 (26) (26) Net (loss)/profit for the year from continuing operations (568) 1,012 Transfers of net income approved by the Board of Governors (155) (90) Net (loss)/profit after transfers of net income approved by the Board of Governors (723) 922
Attributable to: Equity holders (723) 922
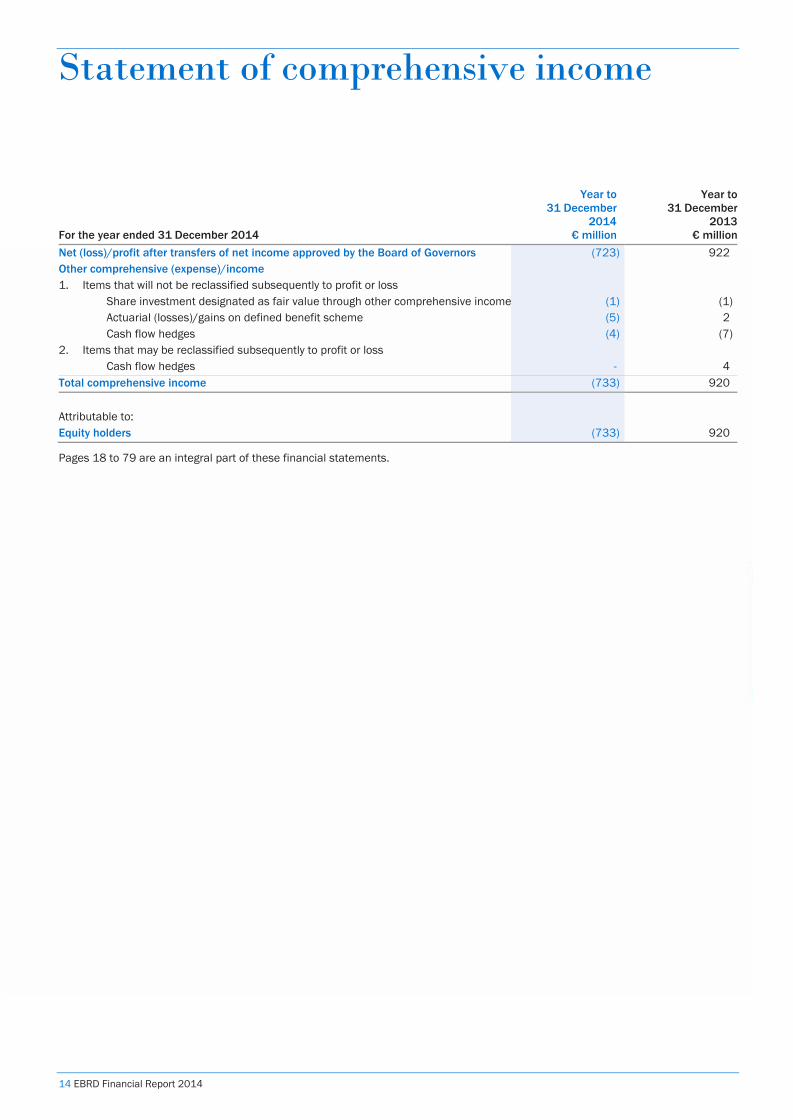
Statement of comprehensive income
14 EBRD Financial Report 2014
Pages 18 to 79 are an integral part of these financial statements.
For the year ended 31 December 2014
Year to 31 December
2014 € million
Year to31 December
2013€ million
Net (loss)/profit after transfers of net income approved by the Board of Governors (723) 922 Other comprehensive (expense)/income 1. Items that will not be reclassified subsequently to profit or loss
Share investment designated as fair value through other comprehensive income (1) (1) Actuarial (losses)/gains on defined benefit scheme (5) 2 Cash flow hedges (4) (7)
2. Items that may be reclassified subsequently to profit or loss Cash flow hedges - 4
Total comprehensive income (733) 920 Attributable to: Equity holders (733) 920
Balance sheet
EBRD Financial Report 2014 15
At 31 December 2014 Note € million31 December 2014
€ million € million 31 December 2013
€ millionAssets Placements with and advances to credit institutions 12 10,612 7,266 Debt securities 13
At fair value through profit or loss 106 139 At amortised cost 11,688 12,398
11,794 12,537 Collateralised placements 14 57 247
22,463 20,050
Other financial assets 15 Derivative financial instruments 4,978 3,094 Other financial assets 345 314 5,323 3,408
Loan investments Banking portfolio: Loans at amortised cost 16 20,358 19,458 Less: Provisions for impairment 10 (1,209) (817) Loans at fair value through profit or loss 17 338 223
19,487 18,864 Share investments
Banking portfolio: At fair value through profit or loss 18 5,069 6,490 Treasury portfolio: Share investments at fair value through other comprehensive income 19 62 63
5,131 6,553
Intangible assets 20 43 39 Property, technology and office equipment 21 40 44 Total assets 52,487 48,958
Liabilities Borrowings
Amounts owed to credit institutions and other third parties 22 2,534 1,543 Debts evidenced by certificates 23 32,922 29,659
35,456 31,202 Other financial liabilities 24
Derivative financial instruments 2,430 2,475 Other financial liabilities 452 405
2,882 2,880 Total liabilities 38,338 34,082
Members’ equity attributable to equity holders Paid-in capital 25 6,202 6,202 Reserves and retained earnings 26 7,947 8,674 Total members’ equity 14,149 14,876 Total liabilities and members’ equity 52,487 48,958
Memorandum items Undrawn commitments 27 11,531 11,434
Pages 18 to 79 are an integral part of these financial statements.
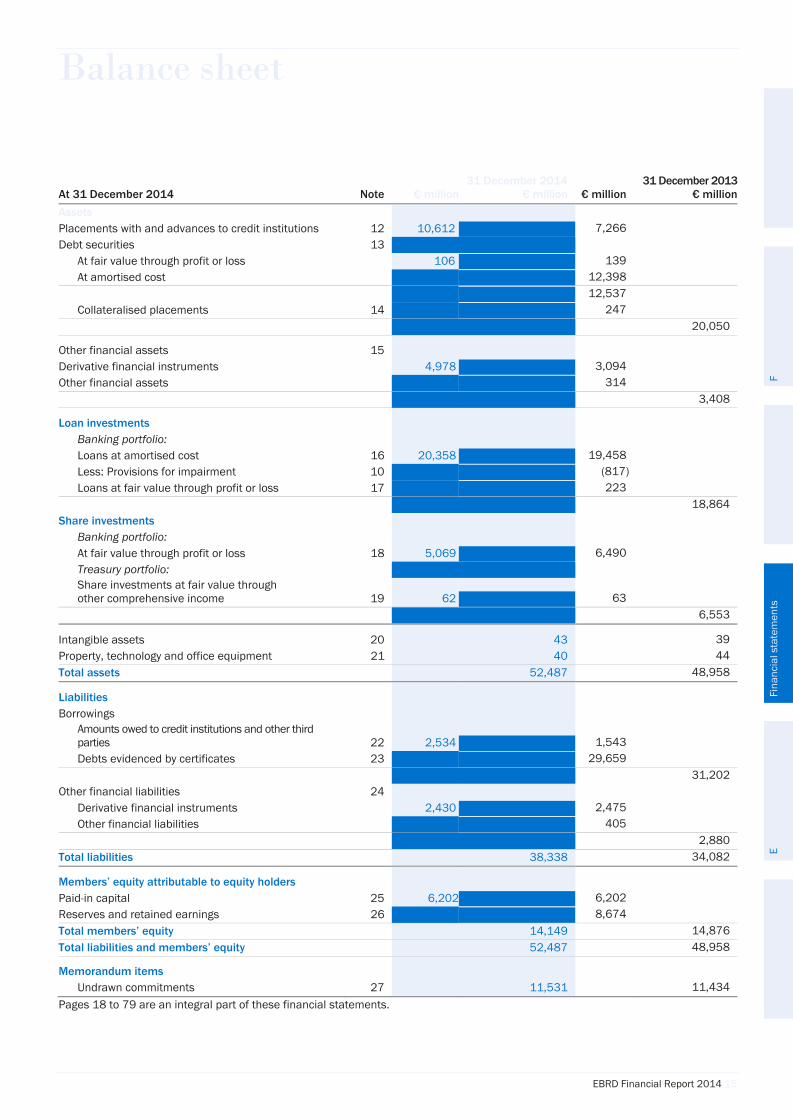
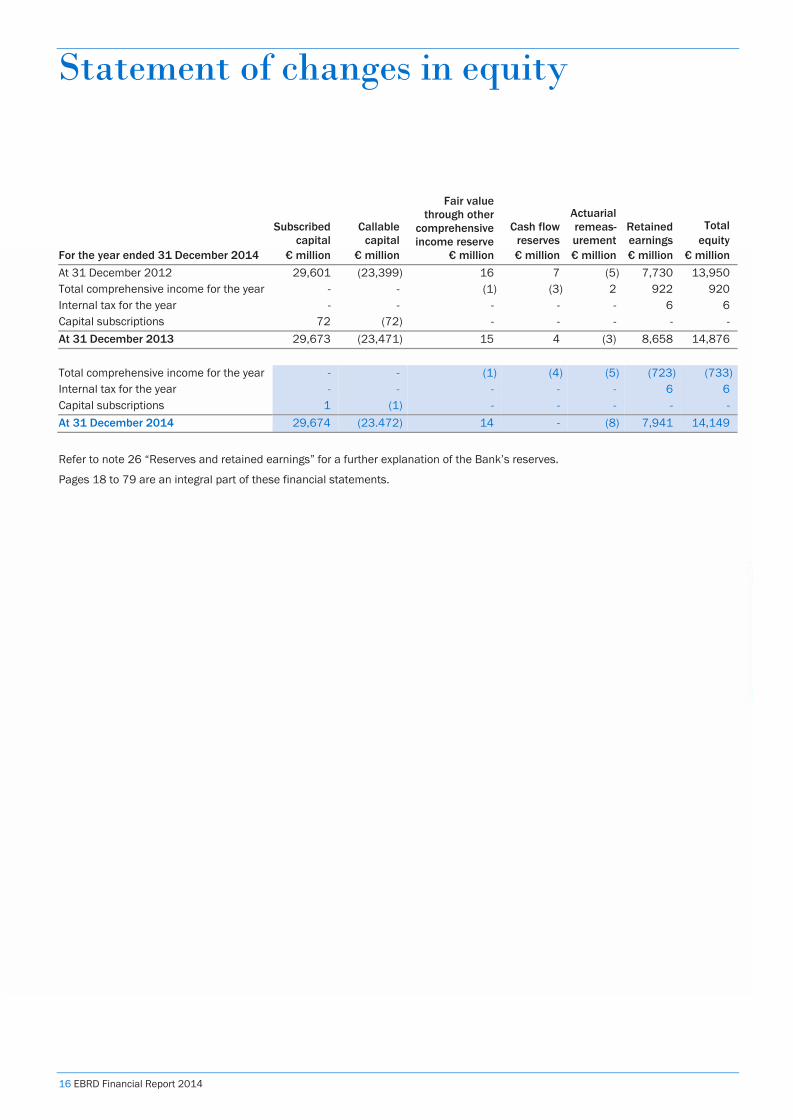
Statement of changes in equity
16 EBRD Financial Report 2014
For the year ended 31 December 2014
Subscribed capital
€ million
Callable capital
€ million
Fair value through other
comprehensive income reserve
€ million
Cash flow reserves € million
Actuarial remeas-urement € million
Retained earnings € million
Total equity
€ million At 31 December 2012 29,601 (23,399) 16 7 (5) 7,730 13,950 Total comprehensive income for the year - - (1) (3) 2 922 920 Internal tax for the year - - - - - 6 6 Capital subscriptions 72 (72) - - - - - At 31 December 2013 29,673 (23,471) 15 4 (3) 8,658 14,876 Total comprehensive income for the year - - (1) (4) (5) (723) (733) Internal tax for the year - - - - - 6 6 Capital subscriptions 1 (1) - - - - - At 31 December 2014 29,674 (23.472) 14 - (8) 7,941 14,149
Refer to note 26 “Reserves and retained earnings” for a further explanation of the Bank’s reserves.
Pages 18 to 79 are an integral part of these financial statements.
Statement of cash flows
EBRD Financial Report 2014 17
For the year ended 31 December 2014 € million
Year to 31 December
2014 € million € million
Year to 31 December
2013 € million
Cash flows from operating activities
Cash and cash equivalents are amounts with an original tenor of less than three months, available for use at short notice and subject to insignificant risk of change in value. Within the 2014 balance is €655 million restricted for signed projects and operational costs for the SEMED Investment Special Fund (ISF), and €14 million restricted for technical assistance to be provided to member countries in the SEMED region.
Pages 18 to 79 are an integral part of these financial statements.
17 See note 12 for total amounts in ‘placements with and advances to credit institutions’.
Net (loss)/profit for the year (723) 922 Adjustments for: Unwinding of the discount relating to impaired identified assets (13) (15) Interest income (1,139) (1,082) Interest expenses and similar charges 289 252 Net deferral of fees and direct costs 96 88 Dividend income (109) (105) Internal tax 6 6 Realised gains on share investments and equity derivatives (281) (439) Unrealised losses on share investments and equity derivatives at fair value through profit or loss 1,029 63 Unrealised (gains)/losses from loans at fair value through profit or loss (3) 1 Realised gains on Banking loans (7) (3) Realised gains on Treasury investments (7) (8) Fair value movement on hedges 34 (45) Unrealised fair value movement 287 398 Depreciation and amortisation 26 26 Profit on disposal of property, technology and office equipment - (1) Release of provisions for impairment of debt securities at amortised cost - (2) Gross provisions charge for Banking loan losses and guarantees 438 138 Adjusted net profit (77) 194 Interest income received 1,015 990 Interest expenses and similar charges paid (266) (265) Dividend income received 89 105 (Increase)/decrease in operating assets: Prepaid expenses (22) (1) Proceeds from repayments of Banking loans 7,406 6,979 Funds advanced for Banking loans (8,250) (7,656) Proceeds from sale of Banking share investments and equity derivatives 1,507 1,161 Funds advanced for Banking share investments (1,052) (531) Net placements to credit institutions 122 (2,685) Net proceeds from settlement of derivatives 747 (258) Increase in operating liabilities: Accrued expenses 22 11 Net cash from/(used in) operating activities 1,241 (1,956) Cash flows used in investing activities Proceeds from debt securities at amortised cost 15,541 16,843 Purchases of debt securities at amortised cost (14,468) (17,857) Proceeds from sale of debt securities held at fair value through profit or loss 223 473 Purchases of debt securities held at fair value through profit or loss (208) (473) Proceeds from sale of property, technology and office equipment - 3 Purchases of intangible assets, property, technology and office equipment (26) (29) Net cash from/(used in) investing activities 1,062 (1,040) Cash flows from financing activities Capital received - 2 Issue of debts evidenced by certificates 9,484 12,182 Redemption of debts evidenced by certificates (9,499) (10,933) Net cash (used in)/from financing activities (15) 1,251
Net increase/(decrease) in cash and cash equivalents 2,288 (1,745) Cash and cash equivalents at beginning of the year 4,147 5,892 Cash and cash equivalents at 31 December17 6,435 4,147
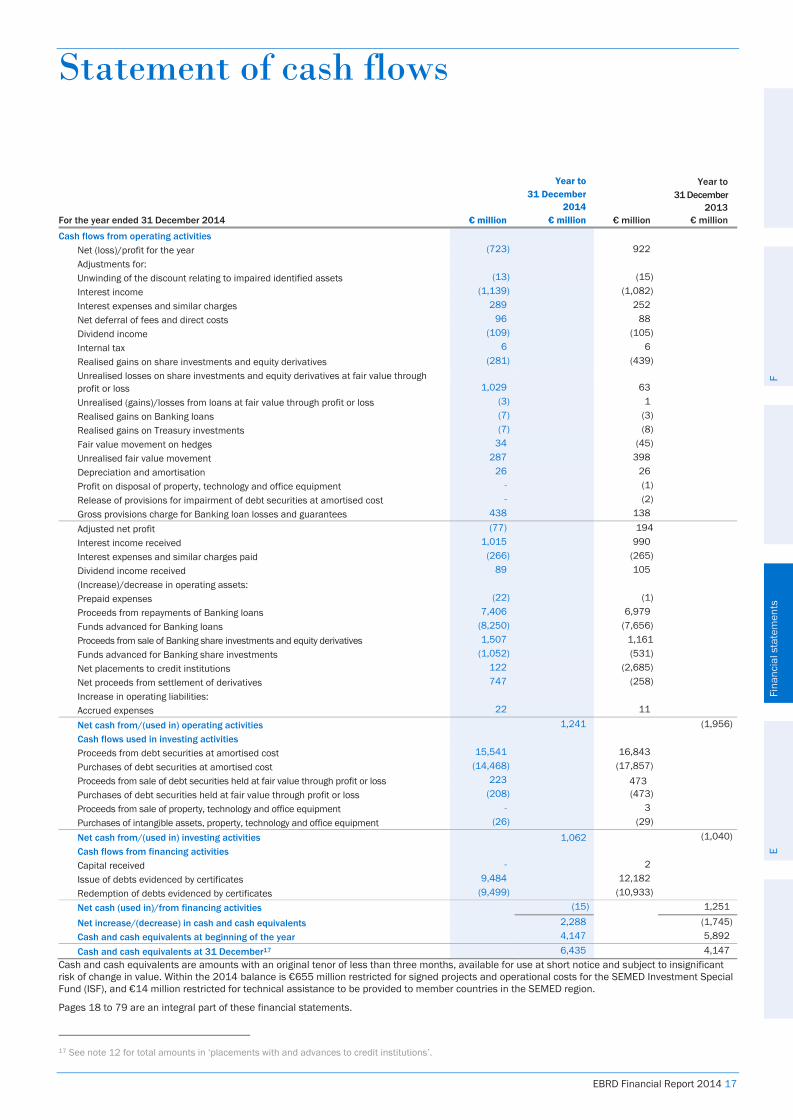
Accounting Policies
18 EBRD Financial Report 2014
The principal accounting policies applied in the preparation of these financial statements are set out below. These policies have been consistently applied to all the years presented, unless otherwise stated.
A. Basis of preparation These financial statements have been prepared in accordance with International Financial Reporting Standards (IFRS) as issued by the International Accounting Standards Board (IASB). The financial statements have been prepared under the historical cost convention, as modified by the revaluation of financial assets at fair value through other comprehensive income, financial assets and financial liabilities held at fair value through profit or loss and all derivative contracts. In addition, financial assets and liabilities subject to amortised cost measurement which form part of a qualifying hedge relationship have been accounted for in accordance with hedge accounting rules – see “Derivative financial instruments and hedge accounting” within the Accounting Policies section. The financial statements have been prepared on a going concern basis. The going concern assessment is made by the Bank’s Board of Directors at the time of approving the Bank’s annual Liquidity Policy in the fourth quarter of the year. The assessment was re-confirmed by the President and Vice President and CFO on 25 February 2015, the date on which they signed the financial statements.
The preparation of financial statements in conformity with IFRS requires the use of certain critical accounting estimates. It also requires management to exercise its judgment in the process of applying the Bank’s policies. The areas involving a higher degree of judgment or complexity, or areas where judgments and estimates are significant to the financial statements, are disclosed in “Critical accounting estimates and judgments” within the section for Accounting Policies.
New and amended IFRS mandatorily effective for the current reporting period The following new and amended standards are effective for the current reporting period:
Pronouncement Nature of change Impact Investment entities – amendments to IFRS 10, IFRS 12 and IAS 27
Introduces an exception to consolidating particular subsidiaries for “investment entities”, requiring instead such subsidiaries to be measured at fair value through profit or loss in accordance with IFRS 9 Financial Instruments. New disclosure requirements are also introduced.
Not applicable as the Bank is not an investment entity.
IAS 32 (Amendment) Financial Instruments: Presentation – Offsetting of Financial Assets and Financial Liabilities
Updates the application guidance and basis of conclusions in relation to the offsetting of financial assets and financial liabilities.
Applicable but no changes of presentation required.
IFRS not yet mandatorily effective but adopted early IFRS 9: ‘Financial Instruments’ is the IASB’s replacement project for IAS 39. The Standard has developed in phases and was completed in July 2014 with a mandatory application date for annual reporting periods beginning on or after 1 January 2018. The Bank adopted the first phase ‘recognition and measurement of financial assets’ (November 2009) in its 2010 financial statements. See the accounting policy for financial assets on page 19 for more details.
EBRD Financial Report 2014 19
IFRS not yet mandatorily effective and not adopted early The following standards are not yet effective and have not been adopted early.
Pronouncement Nature of change Potential impact IFRS 9: Financial Instruments Classification and measurement of financial liabilities (October 2010).
Hedge accounting (November 2013). Impairment methodology and introduction of ‘fair value through other comprehensive income’ measurement category for financial assets represented by simple debt instruments (July 2014). IFRS 9 to be adopted in its entirety for annual reporting periods beginning on or after January 1, 2018.
The Bank has yet to assess the potential impact of adopting this standard.
Amendments to: IFRS 10: Consolidation Financial Statements and IAS 28: Investments in Associates and Joint Ventures
Provides guidance for the accounting for the loss of control of a subsidiary as a result of a transaction involving an associate or a joint venture that is accounted for using the equity method. Effective for annual reporting periods beginning on or after 1 January 2016.
The Bank has yet to assess the potential impact of adopting this standard.
Amendments to: IFRS 11: Joint Arrangements
Provides guidance on the accounting for acquisitions of interests in joint operations in which the activity constitutes a business. Effective for accounting periods beginning on or after 1 July 2016.
The Bank has yet to assess the potential impact of adopting this standard.
IFRS 15: Revenue from Contracts with Customers
Establishes principles for reporting useful information to users of financial statements about the nature, amount, timing and uncertainty of revenue and cash flows arising from an entity’s contracts with customers. Effective for annual reporting periods beginning on or after 1 January 2017.
The Bank has yet to assess the potential impact of adopting this standard
Amendments to: IAS 1: Presentation of Financial Statements
Various amendments to improve presentation and disclosure under IAS 1. Effective for annual reporting periods beginning on or after 1 January 2016.
The Bank has yet to assess the potential impact of adopting this standard
Amendments to: IAS 16: Property, Plant and Equipment and IAS 38: Intangible Assets
Clarification of acceptable methods of depreciation and amortisation Effective for annual reporting periods beginning on or after 1 January 2016.
The Bank has yet to assess the potential impact of adopting this standard.
A number of existing standards were reviewed by the IASB in December 2014 as part of the IFRS annual improvements cycle. It is the Bank’s opinion that none of these amendments, effective for accounting periods beginning on or after 1 January 2016, will have a material impact on the Bank’s financial statements.
B. Significant accounting policies
Financial assets – Classification and measurement The Bank early adopted the first instalment of IFRS 9: Financial Instruments, concerning the classification and measurement of financial assets, with effect from 1 January 2010. Pursuant to that adoption, the Bank classifies its financial assets in the following categories: those measured at amortised cost and those measured at fair value. This classification depends on both the contractual characteristics of the assets and the business model adopted for their management.
Financial assets at amortised cost An investment is classified as ‘amortised cost’ only if both of the following criteria are met: the objective of the Bank’s business model is to hold the asset to collect the contractual cash flows; and the contractual terms give rise on specified dates to cash flows that are solely payments of principal and interest on the principal outstanding, interest being consideration for the time value of money and the credit risk associated with the principal amount outstanding.
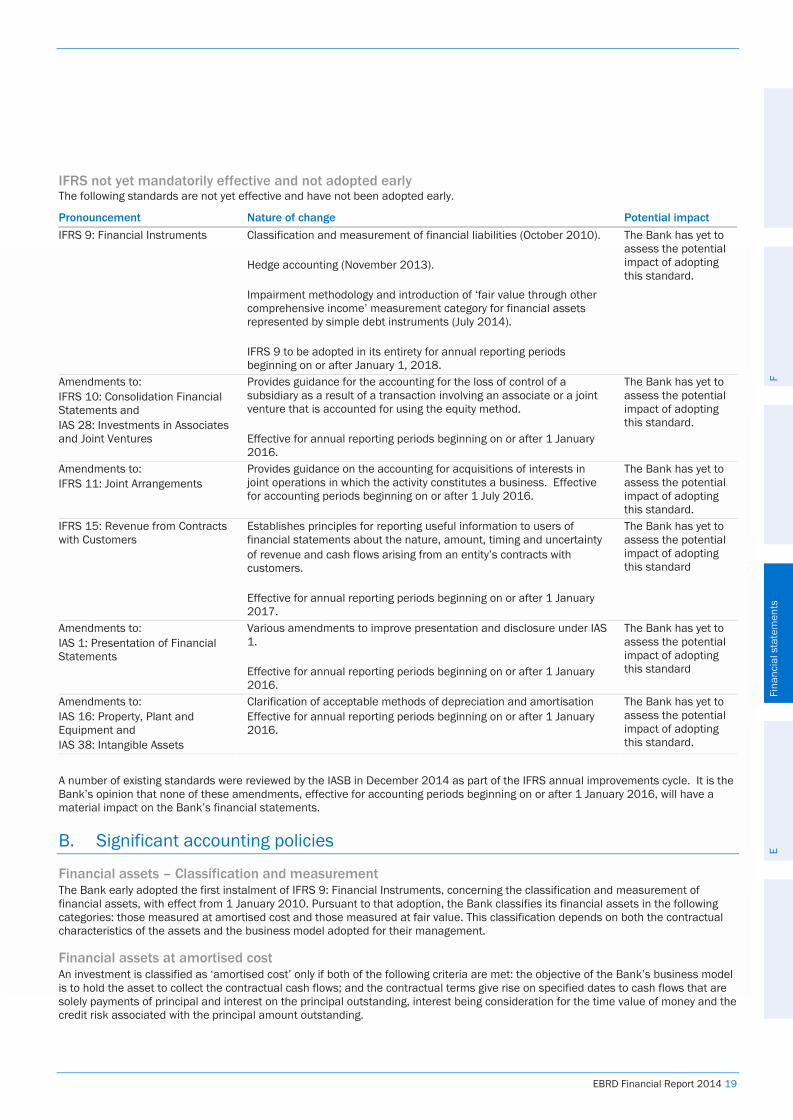
20 EBRD Financial Report 2014
Investments meeting these criteria are measured initially at fair value plus transaction costs that are directly attributable to the acquisition of the financial assets. They are subsequently measured at amortised cost using the effective interest method less any impairment. Except for debt securities held at amortised cost, which are recognised on trade date, the Bank’s financial assets at amortised cost are recognised at settlement date. Collateralised placements are measured at amortised cost. These are structures wherein the risks and rewards associated with the ownership of a reference asset are transferred to another party through the use of a ‘total return’ swap contract, and represent a form of collateralised lending.
Financial assets at fair value If either of the two criteria above is not met, the debt instrument is classified as ‘fair value through profit or loss’. The presence of an embedded derivative, which could potentially change the cash flows arising on a debt instrument so that they no longer represent solely payments of principal and interest, requires that instrument to be classified at fair value through profit or loss, an example being a convertible loan. Debt instruments classified at fair value through profit or loss are recognised on a settlement date basis if within the Banking loan portfolio and on a trade date basis if within the Treasury portfolio. The Bank’s share investments – equity investments held within its Banking portfolio – are measured at fair value through profit or loss, including associate investments. The Bank considers the latter to be venture capital investments for which IAS 28: Investments in Associates and Joint Ventures does not require the equity method of accounting. When an instrument which is required to be measured at fair value through profit or loss has characteristics of both a debt and equity instrument, the Bank determines its classification as a debt or an equity instrument on the basis of how the investment was internally appraised and presented at its Operations Committee for approval. The basis of fair value for listed share investments in an active market is the quoted bid market price on the balance sheet date. The basis of fair value for share investments that are either unlisted or listed in an inactive market is determined using valuation techniques appropriate to the market and industry of each investment. The primary valuation techniques used are net asset value and earnings-based valuations to which a multiple is applied based on information from comparable companies and discounted cash flows. Techniques used to support these valuations include industry valuation benchmarks and recent transaction prices. The Bank’s share investments are recognised on a trade date basis. At initial recognition, the Bank measures these assets at their fair value. Transaction costs of financial assets carried at fair value through profit or loss are expensed in the income statement. Such assets are carried at fair value on the balance sheet with changes in fair value included in the income statement in the period in which they occur. A strategic equity investment held by Treasury is measured at fair value through other comprehensive income. All fair value gains or losses are recognised in the statement of comprehensive income and not recycled through the income statement.
Derecognition of financial assets The Bank derecognises a financial asset, or a portion of a financial asset, where the contractual rights to that asset have expired or where the rights to further cash flows from the asset have been transferred to a third party and, with them, either:
(i) substantially all the risks and rewards of the asset; or (ii) significant risks and rewards, along with the unconditional ability to sell or pledge the asset.
Where significant risks and rewards have been transferred, but the transferee does not have the unconditional ability to sell or pledge the asset, the Bank continues to account for the asset to the extent of its continuing involvement. Where neither derecognition nor continuing involvement accounting is appropriate, the Bank continues to recognise the asset in its entirety and recognises any consideration received as a financial liability.
Financial liabilities The Bank has not adopted early that part of IFRS 9 which relates to financial liabilities and therefore still applies IAS 39: Financial Instruments. With the exception of derivative instruments which must be measured at fair value, the Bank does not designate any financial liabilities at fair value through profit or loss. All are measured at amortised cost, unless they qualify for hedge accounting in which case the amortised cost is adjusted for the fair value attributable to the risks being hedged. Liabilities deriving from issued securities are recognised on a trade date basis with other liabilities on a settlement date basis. Interest expense is accrued using the effective interest rate method and is recognised within the ‘interest expense and similar charges’ line of the income statement, except for the allocated cost funding Treasury’s trading assets which is recognised within ‘net gains from Treasury activities at fair value through profit or loss’.
Contingent liabilities Contingent liabilities are possible obligations arising from past events, whose existence will be confirmed only by uncertain future events, or present obligations arising from past events that are not recognised because either an outflow of economic benefits is not probable or the amount of the obligation cannot be reliably measured. Contingent liabilities are not recognised but information about them is disclosed unless the possibility of any outflow of economic benefits in settlement is remote.
EBRD Financial Report 2014 21
Derivative financial instruments and hedge accounting The Bank primarily makes use of derivatives for four purposes:
(i) the majority of the Bank’s issued securities, excluding commercial paper, are individually paired with a swap to convert the issuance proceeds into the currency and interest rate structure sought by the Bank;
(ii) to manage the net interest rate risks and foreign exchange risks arising from all of its financial assets and liabilities; (iii) to provide potential exit strategies for its unlisted equity investments through negotiated put options; (iv) through currency swaps, to manage funding requirements for the Bank’s loan portfolio.
All derivatives are measured at fair value through the income statement unless they form part of a qualifying cash flow hedge, in which case the fair value is taken to reserves and released into the income statement at the same time as the risks on the hedged instrument are recognised therein. Any hedge ineffectiveness will result in the relevant proportion of the fair value remaining in the income statement. Fair values are derived primarily from discounted cash flow models, option pricing models and from third party quotes. Derivatives are carried as assets when their fair values are positive and as liabilities when their fair values are negative. All hedging activity is explicitly identified and documented by the Bank’s Treasury department.
Hedge accounting The Bank has not adopted early that part of IFRS 9 which relates to hedge accounting and therefore still applies IAS 39: Financial Instruments. Hedge accounting is designed to bring accounting consistency to financial instruments that would not otherwise be permitted. A valid hedge relationship exists when a specific relationship can be identified between two or more financial instruments in which the change in value of one instrument (the hedging instrument) is highly negatively correlated to the change in value of the other (the hedged item). To qualify for hedge accounting this correlation must be within a range of 80 to 125 per cent, with any ineffectiveness within these boundaries recognised within “Fair value movement on non-qualifying and ineffective hedges” in the income statement. The Bank applies hedge accounting treatment to individually identified hedge relationships. Also included within this caption of the income statement are the gains and losses attributable to derivatives that the Bank uses for hedging interest-rate risk on a macro basis, but for which the Bank does not apply hedge accounting. The Bank documents the relationship between hedging instruments and hedged items upon initial recognition of the transaction. The Bank also documents its assessment, on an ongoing basis, of whether the derivatives that are used in hedging transactions are highly effective in offsetting changes in fair values or cash flows of hedged items.
Fair value hedges The Bank’s hedging activities are primarily designed to mitigate interest rate risk by using swaps to convert the interest rate risk profile, on both assets and liabilities, into floating rate risk. Such hedges are known as “fair value” hedges. Changes in the fair value of the derivatives that are designated and qualify as fair value hedges, and that prove to be highly effective in relation to hedged risk, are included in the income statement, along with the corresponding change in fair value of the hedged asset or liability that is attributable to that specific hedged risk. In the case of a fair value hedge of a financial liability, where the hedge ceases to qualify for hedge accounting and the financial liability contains an embedded derivative which is of a different economic character to the host instrument, that embedded derivative is bifurcated and measured at fair value through the income statement. This is not required of hedged financial assets as IFRS 9 does not require bifurcation of embedded derivatives in the case of financial assets.
Cash flow hedges The Bank has engaged in cash flow hedges, principally to minimise the exchange rate risk associated with the fact that its administrative expenses are incurred in sterling. The amount and timing of such hedges fluctuates in line with the Bank’s view on opportune moments to execute the hedges. Hedging is mainly through the purchase of sterling in the forward foreign exchange market, but currency options can also be used. The movement in the fair value of cash flow hedges is recognised directly in reserves until such time as the relevant expenditure is incurred. At 31 December 2014 the Bank had no cash flow hedges in place for future budgeted administrative expenditure to be incurred in sterling. For further information on risk and related management policies see the Risk Management section of the report.
Financial guarantees Issued financial guarantees are initially recognised at their fair value, and subsequently measured at the higher of the unamortised balance of the related fees received and deferred, and the expenditure required to settle the commitment at the balance sheet date. The latter is recognised when it is both probable that the guarantee will need to be settled and that the settlement amount can be reliably estimated. Financial guarantees are recognised within other financial assets and other financial liabilities.
Impairment of financial assets Financial assets at amortised cost The Bank has not adopted early that part of IFRS 9 which relates to impairment and therefore still applies IAS 39: Financial Instruments. Where there is objective evidence that an identified loan asset is impaired, specific provisions for impairment are recognised in the income statement. Impairment is quantified as the difference between the carrying amount of the asset and the net present value of expected future cash flows discounted at the asset’s original effective interest rate where applicable. The carrying amount of the asset

22 EBRD Financial Report 2014
is reduced through the use of an allowance account and the amount of the loss is recognised in the income statement. The carrying amount of the asset is reduced directly only upon write-off. Resulting adjustments include the unwinding of the discount in the income statement over the life of the asset, and any adjustments required in respect of a reassessment of the initial impairment. The criteria that the Bank uses to determine that there is objective evidence of an impairment loss include:
delinquency in contractual payments of principal or interest cash flow difficulties experienced by the borrower breach of loan covenants or conditions initiation of bankruptcy proceedings deterioration in the borrower’s competitive position deterioration in the value of collateral.
Provisions for impairment of classes of similar assets that are not individually identified as impaired are calculated on a portfolio basis (the general provision). The methodology used for assessing such impairment is based on a risk-rated approach for non-sovereign assets. A separate methodology is applied for all sovereign risk assets that takes into account the Bank’s preferred creditor status afforded by its members. The Bank’s methodology calculates impairment on an incurred loss basis.18 Impairment is deducted from the asset categories on the balance sheet. The Bank maintains a loan loss reserve to set aside an amount of retained earnings within members’ equity equal to the difference between the impairment losses expected over the full life of the loan portfolio, and the cumulative amount provisioned through the Bank’s income statement on an incurred loss basis. Impairment, less any amounts reversed during the year, is charged to the income statement. When a loan is deemed uncollectible the principal is written off against the related impairment provision. Such loans are written off only after all necessary procedures have been completed and the amount of the loss has been determined. Recoveries are credited to the income statement if previously written off. Loans and advances are generally renegotiated in response to an adverse change in the circumstances of the borrower. Depending upon the degree to which the original loan is amended, it may continue to be recognised or will be derecognised and replaced with a new loan. To the extent the original loan is retained, it will continue to be shown as overdue if appropriate and individually impaired where the renegotiated payments of interest and principal will not recover the original carrying amount of the asset.
Statement of cash flows The statement of cash flows is prepared using the indirect method. Cash and cash equivalents comprise balances with less than three months maturity from the date of the transaction, which are available for use at short notice and that are subject to insignificant risk of changes in value.
Foreign currencies The Bank’s reporting currency for the presentation of its financial statements is the euro (€). Foreign currency transactions are initially translated into euro using the exchange rates prevailing at the dates of the transactions. Foreign exchange gains and losses resulting from the settlement of such transactions, and from the translation at the year-end exchange rate of monetary assets and liabilities denominated in foreign currencies, are included in the income statement, except when deferred in reserves as qualifying cash flow hedges.
Capital subscriptions The Bank’s share capital is denominated in euro.
Intangible assets Costs associated with maintaining computer software programmes are recognised as an expense as incurred. Costs that are directly associated with identifiable and unique software products controlled by the Bank, and that will generate economic benefits exceeding costs beyond one year, are recognised as intangible assets. Direct costs include the staff costs of the software development team and an appropriate portion of relevant overheads. Expenditure that enhances or extends the performance of computer software programmes beyond their original specifications is recognised as a capital improvement and is added to the original cost of the software. Computer software development costs recognised as intangible assets are amortised using the straight-line method over an estimated life of three years.
Property, technology and office equipment Property, technology and office equipment is stated at cost less accumulated depreciation. Depreciation is calculated on the straight-line method to write off the cost of each asset to its residual value over the estimated life as follows: Freehold property 30 years Improvements on leases of less than 50 years unexpired Unexpired periods Technology and office equipment Three years 18 See ‘Loss emergence period’ under ‘Critical accounting estimates and judgements’.
EBRD Financial Report 2014 23
Accounting for leases Leases of assets under which all the risks and benefits of ownership are effectively retained by the lessor are classified as operating leases. The Bank has entered into such leases for most of its office accommodation, both in London and in other countries in which it has a presence. Payments made under operating leases are charged to the income statement on a straight-line basis over the period of the lease. When an operating lease is terminated before the lease period has expired, any payment required to be made to the lessor by way of penalty is recognised as an expense in the period in which the termination takes place.
Interest, fees, commissions and dividends Interest income and expense is recognised on an accruals basis using the effective interest rate method (EIR). This method requires that, in addition to the contractual interest rate attaching to a financial instrument, those fees and direct costs associated with originating and maintaining the instrument are also recognised as interest income or expense over the life of the instrument. The amortisation of such fees and costs is recognised in the same line of interest income or expense as the instruments to which they relate. Further details are provided below.
Banking loans: this represents interest income on banking loans. Interest is recognised on impaired loans through unwinding the discount used in deriving the present value of expected future cash flows.
Fixed-income debt securities and other: this represents interest income on Treasury investments with the exception of those measured at fair value where the interest is recognised in ‘net gains from Treasury activities at fair value through profit or loss’. Where hedge accounting is applied to an underlying investment – typically using a swap to convert fixed-rate interest into floating – the net interest of the swap is included within this interest income line.
Interest expense and similar charges: this represents interest expense on all borrowed funds. The majority of the Bank’s borrowings are undertaken through the issuance of bonds that are almost always paired with a one-to-one swap to convert the proceeds into the currency and floating rate profile sought by the Bank. Hedge accounting is applied to such relationships and the net interest of the associated swap is included within interest expense.
Net interest income/(expense) on derivatives: in addition to swaps where the interest is associated with specific investments or borrowings, the Bank also employs a range of derivatives to manage the risk deriving from interest rate mismatches between the asset and liability side of the balance sheet. The net interest associated with these derivatives is presented separately as it is not identifiable to individual assets or liabilities presented elsewhere within ‘net interest income’. This lack of specific “matching” also means that hedge accounting is not applied in respect of the risks hedged by these derivatives.
Fees received in respect of services provided over a period of time are recognised as income as the services are provided. Other fees and commissions are classed as income when received. Issuance fees and redemption premiums or discounts are amortised over the period to maturity of the related borrowings on an effective yield basis. Dividends relating to share investments are recognised in accordance with IAS 18 when the Bank’s right to receive payments has been established, and when it is probable that the economic benefits will flow to the Bank and the amount can be reliably measured.
Staff retirement schemes The Bank has a defined contribution scheme and a defined benefit scheme to provide retirement benefits to its staff. The Bank keeps all contributions to the schemes, and all other assets and income held for the purposes of the schemes, separately from all of its other assets. Under the defined contribution scheme, the Bank and staff contribute to provide a lump sum benefit, such contributions being charged to the income statement and transferred to the scheme’s independent custodians. The defined benefit scheme is funded entirely by the Bank and benefits are based on years of service and a percentage of final gross base salary as defined in the scheme. Independent actuaries calculate the defined benefit obligation at least every three years by using the projected unit credit method. The present value of the defined benefit obligation is determined by discounting the estimated future cash outflows (relating to service accrued to the balance sheet date) using the yields available on high-quality corporate bonds. For intermediate years, the defined benefit obligation is estimated using approximate actuarial roll-forward techniques that allow for additional benefit accrual, actual cash flows and changes in the underlying actuarial assumptions. The Bank’s contributions to the defined benefit scheme are determined by the Retirement Plan Committee, with advice from the Bank’s actuaries, and the contributions are transferred to the scheme’s independent custodians. The defined benefit cost charged to the income statement represents the service cost and the net interest income/(cost) on the plan’s net asset or liability. Remeasurements due to actuarial assumptions, including the difference between expected and actual net interest, are recognised in ‘other comprehensive income’. The net defined benefit or liability recognised on the balance sheet is equal to the actual surplus or deficit of the defined benefit plan.
Taxation In accordance with Article 53 of the Agreement, within the scope of its official activities, the Bank, its assets, property and income are exempt from all direct taxes. Taxes and duties levied on goods or services are likewise exempted or reimbursable except for those parts of taxes or duties that represent charges for public utility services.
24 EBRD Financial Report 2014
C. Critical accounting estimates and judgements Preparing financial statements in conformity with IFRS requires the Bank to make estimates and judgements that affect the reported amounts of assets and liabilities at the date of the financial statements and the reported amounts included in the income statement during the reporting period. Estimates and judgements are continually evaluated and are based on historical experience and other factors, including expectations of future events that are believed to be reasonable under the circumstances. These estimates are highly dependent on a number of variables that reflect the economic environment and financial markets of the countries in which the Bank invests, but which are not directly correlated to market risks such as interest rate and foreign exchange risk. The Bank’s critical accounting estimates and judgements are outlined below.
Fair value of derivative financial instruments The fair values of the Bank’s derivative financial instruments are determined by using discounted cash flow models. These cash flow models are based on underlying market prices for currencies, interest rates and option volatilities. Where market data is not available for all elements of a derivative’s valuation, extrapolation and interpolation of existing data has been used. Where unobservable inputs have been used, a sensitivity analysis has been included under “fair value hierarchy” within the Risk Management section of the report.
Fair value of Banking loans at fair value through profit or loss The fair values of the Bank’s loans at fair value through profit or loss are determined by using a combination of discounted cash flow models and options pricing models. These models incorporate market data pertaining to interest rates, a borrower’s credit spreads, underlying equity prices and dividend cash flows. Where relevant market data is not available extrapolation and interpolation of existing data has been used. Where unobservable inputs have been used, a sensitivity analysis has been included under “fair value hierarchy” within the Risk Management section of the report.
Fair value of share investments The Bank’s method for determining the fair value of share investments is described under “Financial assets” in the Accounting Policies section of the report and an analysis of the share investment portfolio is provided in note 18. In relation to the Bank’s share investments where the valuations are not based on observable market inputs, additional sensitivity information has been included under “fair value hierarchy” in the Risk Management section of the report
Provisions for the impairment of loan investments The Bank’s method for determining the level of impairment of loan investments is described within the Accounting Policies section of the report and further explained under credit risk within the Risk Management section of the report. Portfolio provisions for the unidentified impairment of non-sovereign loan investments at 31 December 2014 were €538 million (2013: €417 million). The sensitivity of portfolio provisions to the key variables used in determining the level of impairment is provided below.
Risk ratings If all non-sovereign loan investments were upgraded by three ‘notches’ or detailed ratings within the Bank’s probability of
default rating scale, this would result in a reduction of €446 million (2013: €351 million) in portfolio provisions on non-sovereign loans.
Conversely, if all non-sovereign loan investments were downgraded by three ‘notches’ or detailed ratings within the Bank’s probability of default rating scale this would result in a charge to the income statement of €826 million (2013: €977 million) in relation to portfolio provisions for non-sovereign loans.
Loss emergence period Provisions for unidentified impairment are made to reflect losses arising from events existing but not identified at the
balance sheet date and which will emerge within a 12 month period from that date. If the loss emergence period was reduced to three months it is broadly estimated that this would result in a decrease in portfolio provisions charged to the income statement of approximately €388 million (2013: €313 million). The loan loss reserve in members’ equity would increase by an offsetting amount as the change of the emergence period does not affect the overall estimated loss on the portfolio.
Probability of default rates In determining the probabilities of default for each risk rating, the relative weighting applied to external data and the Bank’s
own experience is reviewed annually. The 2014 general provisioning methodology applies a 50 per cent weighting to the Bank’s own experience and a 50 per cent weighting to external data, which is consistent with the methodology applied in the previous year. A 10 percentage points change in the weighting assigned to the Bank’s own experience would lead to a change in portfolio provisions of +/- €60 million (2013: €46 million).
EBRD Financial Report 2014 25
Loss given default rates A change in loss given default rates of 10 percentage points would lead to a change in portfolio provisions of +/- €83 million
(2013: €65 million). With respect to specific provisions, an increase or decrease of 10 percentage points on the current loss given default level
would have an impact of +/- €117 million (2013: €65 million)
Sovereign ratings Portfolio provisions for the unidentified impairment of sovereign loan investments at 31 December 2014 amounted to
€40 million (2013: €18 million). If all sovereign loans were downgraded by three ‘notches’ or detailed ratings within the Bank’s probability of default rating scale this would result in a total charge to income statement of €77 million. Similarly, if the portfolio were upgraded this would result in a release to the income statement of €32 million. In 2013 these sensitivities would not have had a significant impact on the level of sovereign portfolio provisions, and hence on the income statement.
The methodology and judgements used for estimating provisions for the impairment of loan investments are reviewed annually to reduce any differences between loss estimates and actual experience.
Risk management
26 EBRD Financial Report 2014
Financial risks
Risk governance Matters related to Bank-wide risk and associated policies and procedures are considered by the Risk Committee. The Risk Committee is accountable to the President. It oversees all aspects of the Banking and Treasury portfolios across all sectors and countries, and provides advice on Risk Management policies, measures and controls. It also approves proposals for new products submitted by Banking. The membership comprises senior managers across the Bank including representatives from Risk Management, Finance, Banking and the Office of the General Counsel. The Risk Committee is chaired by the Vice President Risk and Chief Risk Officer (VP & CRO) who is ultimately responsible for the independent identification, measurement, monitoring and mitigation of all risks incurred by the Bank. The VP & CRO has the overall responsibility for formulating the risk management strategy. The Managing Director Risk Management reports directly to the VP & CRO and leads the overall management of the department. Risk Management provides an independent assessment of risks associated with individual investments and loans undertaken by the Bank and performs an ongoing review of the portfolio to monitor the risk presented by investments and loans from inception to exit. It develops and maintains the Risk Management policies to facilitate Banking operations and promotes risk awareness across the Bank. In exercising its responsibilities, Risk Management is guided by its mission to:
Provide assurance to stakeholders that risk decision-making in the Bank is balanced and within agreed appetite, and that control processes are rigorously designed and applied; and
Support the Bank’s business strategy including the maximisation of transition impact through provision of efficient and effective delivery of risk management advice, challenge and decision-making.
Risks in 2015 Below is a summary of current top and emerging risks identified by the Bank. These are risks that, if they were to crystallise, have the potential to negatively affect the Bank in its mission to carry out its mandate and which would cause a material deterioration in its portfolio. These risks therefore provide a background to understanding the changes in the Bank’s risk profile and exposures and are closely monitored by management.
Continued conflict in eastern Ukraine, its direct impact on the economic performance of the country, cross border economic linkages, as well as the access to and availability of capital for future investments.
A sustained period of low commodity prices and the resulting deterioration of economic and fiscal performance in several oil and other commodity producing countries, most notably Russia, Kazakhstan, Azerbaijan and Mongolia, as well as spill-over effects to Commonwealth of Independent States countries with strong linkages and reliance on Russia through remittances and/or exports.
Prolonged regional geo-political tensions, particularly the increased isolation of Russia, the impact of international sanctions on its economy, and more confrontational political dynamics between Russia and the United States (US)/European Union (EU). The combined effects of the sanctions and decline in oil prices have already depressed Russia’s growth prospects and triggered a sharp depreciation of the rouble, and they have the potential to further affect the quality of the Bank’s loan and equity investments in the country.
Sluggish recovery and risk of protracted stagnation in the eurozone, and the resulting reduced demand for exports from the Bank's region, particularly in central and south-eastern Europe.
Continued uncertainty about the capital adequacy of the European banking sector and the terms of creditor bail-ins and the resulting risk of withdrawal from, or contraction of, lending activity in the Bank's region.
In carrying out its mission, the Bank is exposed to financial risks through both its Banking and Treasury activities, principally credit, market, operational and liquidity risks.
EBRD Financial Report 2014 27
A. Credit risk Credit risk is the potential loss to a portfolio that could result from either the default of a counterparty or the deterioration of its creditworthiness. The Bank also monitors concentration risk, which arises from too high a proportion of the portfolio being allocated to a specific country, industry sector or obligor, or to a particular type of instrument or individual transaction. The Bank is exposed to credit risk in both its Banking and Treasury activities, as borrowers and Treasury counterparties could default on their contractual obligations, or the value of the Bank’s investments could become impaired. The Bank’s maximum exposure to credit risk from financial instruments is represented on the balance sheet, inclusive of the undrawn commitments related to loans and guarantees (see note 27). Details of collateral and other forms of risk reduction are provided within the respective sections on Banking and Treasury below.
Credit risk in the Banking portfolio: Management Underlying principles and procedures The Board of Directors approves a credit process document that defines the procedures for the approval, management and review of Banking exposures. The Audit Committee periodically reviews the credit process and its review is submitted to the Board for approval.
Individual projects The Operations Committee, which is chaired by the First Vice President Banking and whose membership comprises senior managers of the Bank, including the VP & CRO and Managing Director Risk Management, reviews all Banking projects prior to their submission for Board approval. A number of frameworks for smaller projects are considered by the Small Business Investment Committee or by senior management under a delegated authority framework supervised by the Operations Committee. The project approval process is designed to ensure compliance with the Bank’s criteria for sound banking, transition impact and additionality. It operates within the authority delegated by the Board, via the Executive Committee, to approve projects within Board-approved framework operations. The Operations Committee is also responsible for approving significant changes to existing operations. The Equity Committee acts as the governance committee for the equity portfolio and the Bond Portfolio Review Committee oversees the Banking bond investments. Both these committees report to the Operations Committee. Risk Management conducts reviews of all exposures within the Banking portfolio. At each review, Risk Management assesses whether there has been any change in the risk profile of the exposure, recommends actions to mitigate risk and reconfirms or adjusts the risk rating. It also reviews the fair value of equity investments.
Portfolio level review Risk Management reports on the development of the portfolio as a whole on a quarterly basis to the Audit Committee of the Board. The report includes a summary of key factors affecting the portfolio and provides analysis and commentary on trends within the portfolio and various sub-portfolios. It also includes reporting on compliance with all portfolio risk limits including an explanation of any limit breaches.
EBRD internal ratings Probability of default (PD) The Bank assigns its internal risk ratings to all counterparties, including borrowers, investee companies, guarantors, put counterparties and sovereigns in the Banking and Treasury portfolios. Risk ratings reflect the financial strength of the counterparty as well as consideration of any implicit support, for example from a major shareholder. The sovereign rating takes into consideration the ratings assigned by external rating agencies. For sovereign risk projects, the overall rating is the same as the sovereign rating. For non-sovereign operations, probability of default ratings are normally capped by the sovereign rating, except where the Bank has recourse to a guarantor from outside the country which may have a better rating than the local sovereign rating.
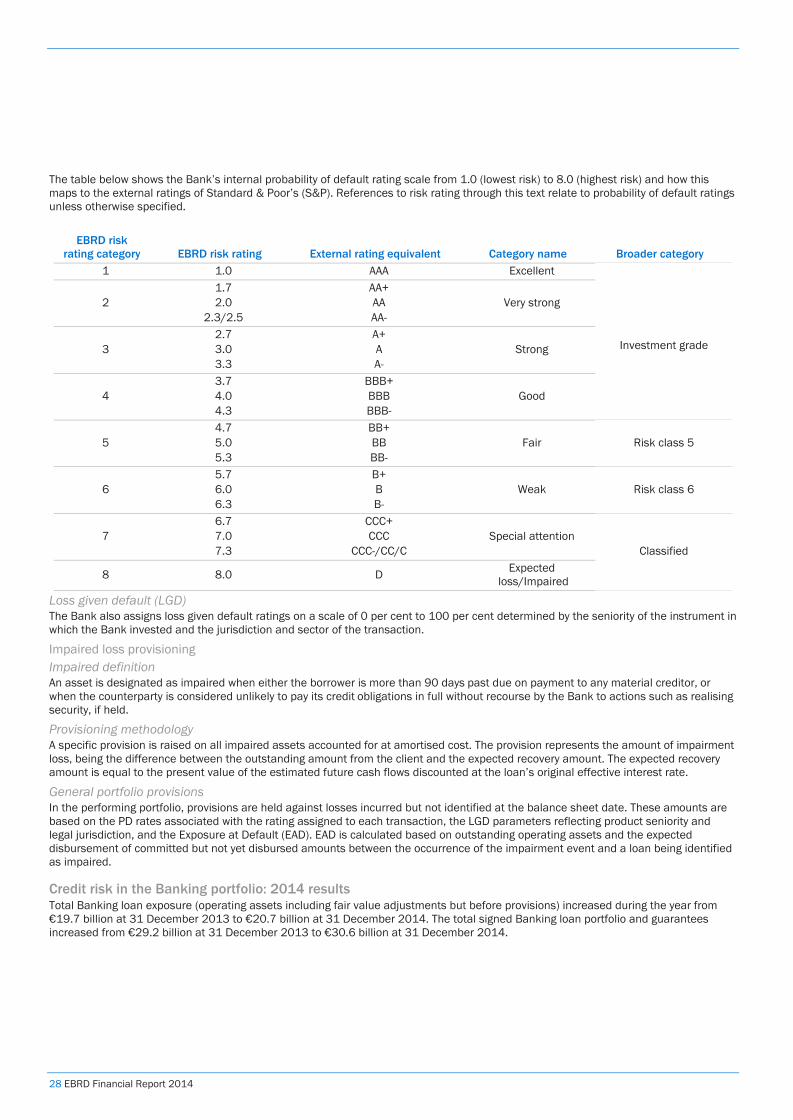
28 EBRD Financial Report 2014
The table below shows the Bank’s internal probability of default rating scale from 1.0 (lowest risk) to 8.0 (highest risk) and how this maps to the external ratings of Standard & Poor’s (S&P). References to risk rating through this text relate to probability of default ratings unless otherwise specified.
EBRD risk rating category EBRD risk rating External rating equivalent Category name Broader category
1 1.0 AAA Excellent
Investment grade
2 1.7 2.0
2.3/2.5
AA+ AA AA-
Very strong
3 2.7 3.0 3.3
A+ A A-
Strong
4 3.7 4.0 4.3
BBB+ BBB BBB-
Good
5 4.7 5.0 5.3
BB+ BB BB-
Fair
Risk class 5
6 5.7 6.0 6.3
B+ B B-
Weak
Risk class 6
7 6.7 7.0 7.3
CCC+ CCC
CCC-/CC/C Special attention
Classified
8 8.0 D Expected loss/Impaired
Loss given default (LGD) The Bank also assigns loss given default ratings on a scale of 0 per cent to 100 per cent determined by the seniority of the instrument in which the Bank invested and the jurisdiction and sector of the transaction.
Impaired loss provisioning Impaired definition An asset is designated as impaired when either the borrower is more than 90 days past due on payment to any material creditor, or when the counterparty is considered unlikely to pay its credit obligations in full without recourse by the Bank to actions such as realising security, if held.
Provisioning methodology A specific provision is raised on all impaired assets accounted for at amortised cost. The provision represents the amount of impairment loss, being the difference between the outstanding amount from the client and the expected recovery amount. The expected recovery amount is equal to the present value of the estimated future cash flows discounted at the loan’s original effective interest rate.
General portfolio provisions In the performing portfolio, provisions are held against losses incurred but not identified at the balance sheet date. These amounts are based on the PD rates associated with the rating assigned to each transaction, the LGD parameters reflecting product seniority and legal jurisdiction, and the Exposure at Default (EAD). EAD is calculated based on outstanding operating assets and the expected disbursement of committed but not yet disbursed amounts between the occurrence of the impairment event and a loan being identified as impaired.
Credit risk in the Banking portfolio: 2014 results Total Banking loan exposure (operating assets including fair value adjustments but before provisions) increased during the year from €19.7 billion at 31 December 2013 to €20.7 billion at 31 December 2014. The total signed Banking loan portfolio and guarantees increased from €29.2 billion at 31 December 2013 to €30.6 billion at 31 December 2014.
EBRD Financial Report 2014 29
The average credit profile of the portfolio deteriorated in 2014 as the weighted average probability of default rating worsened to 5.8 (2013: 5.6). Classified assets (those risk rated 6.7 to 8.0) increased from 11.1 to 24.9 per cent and the absolute level now stands at €7.7 billion (2013: €3.3 billion). This performance largely reflected a deterioration in the economic and political environment at the end of 2014 in the countries where the Bank invests, most notably in Ukraine and Russia.
Credit risk in the Banking portfolio 2014
Impaired assets19 still remain low relative to the average portfolio risk rating, amounting to €1.2 billion at year-end 2014, equal to 5.6 per cent of operating assets (2013: €663 million equal to 3.3 per cent). Distressed restructured loans20 were also relatively low, comprising an additional €568 million or 2.7 per cent of operating assets at year-end 2014. Net write-offs amounted to €76 million in 2014. This brings the total net write-offs over the last five years to €137 million. Write-offs are typically relatively low as the Bank benefits from its strong liquidity and capitalisation to work out distressed loans. Specific provisions increased materially in 2014, reflecting the deteriorating macro-financial environment in the countries in which the Bank invests, particularly in Ukraine, which in turn affected the quality of the Bank’s portfolio. This has also contributed to an increase in write-offs in 2014.
19 Impaired assets are either: where the borrower is more than 90 days past due on payment to any material creditor, or where the Bank considers the counterparty
is unlikely to pay its credit obligations in full, without recourse by the Bank to actions such as realised security (if held). Impaired assets include impaired loans at amortised cost of €1.2 billion (2013: €655 million) and loans at fair value through profit or loss with an original cost of €14 million (2013: €8 million).
20 Defined as a loan in which any of the key terms and conditions have been amended due to the financial stress of the borrower, and without such amendment(s) would likely have become an impaired loan.
21 Includes loans at fair value which have no associated specific provisions.
0%
10%
20%
30%
40%
50%
Dec-11 Dec-12 Dec 13 Dec-14
Perc
enta
ge o
f deb
t po
rtfo
lio
Investment Grade Risk Class 5 Risk Class 6 Classified
Movement in impaired assets21 2014
€ million 2013
€ million Opening balance 663 676 Repayments (141) (174) Write-offs (76) (12) New impaired assets 679 193 Other movements 58 (20) Closing balance 1,183 663
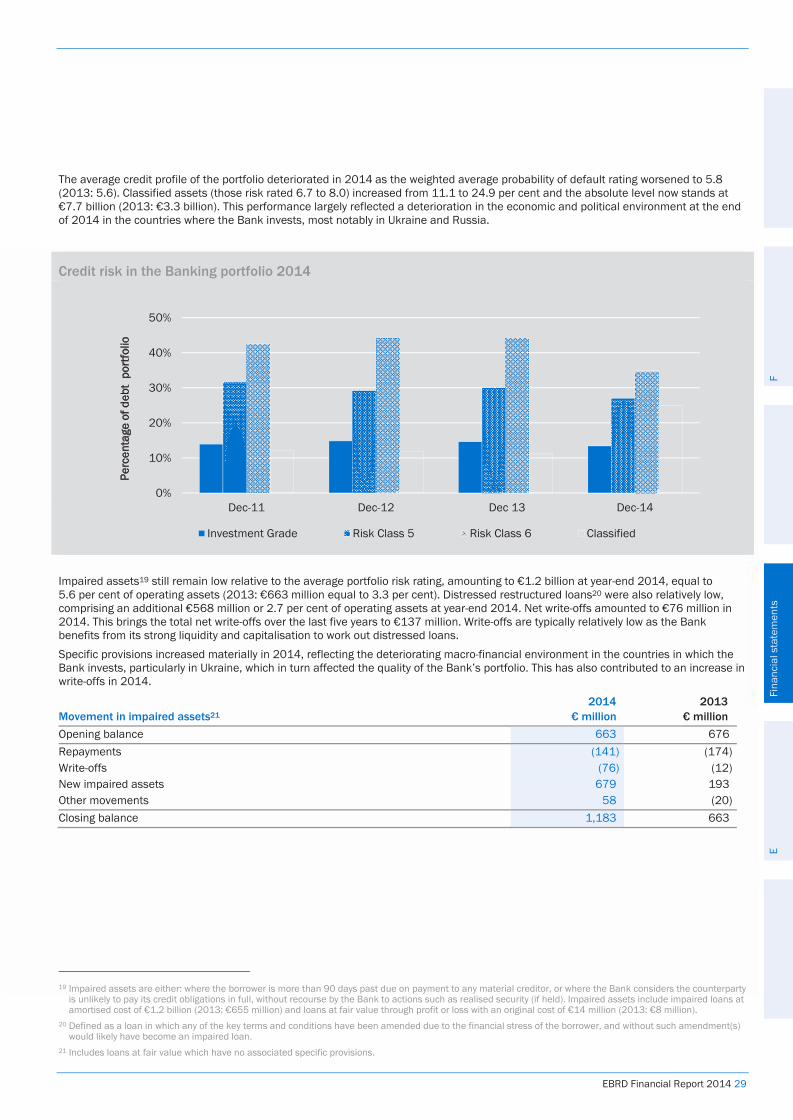
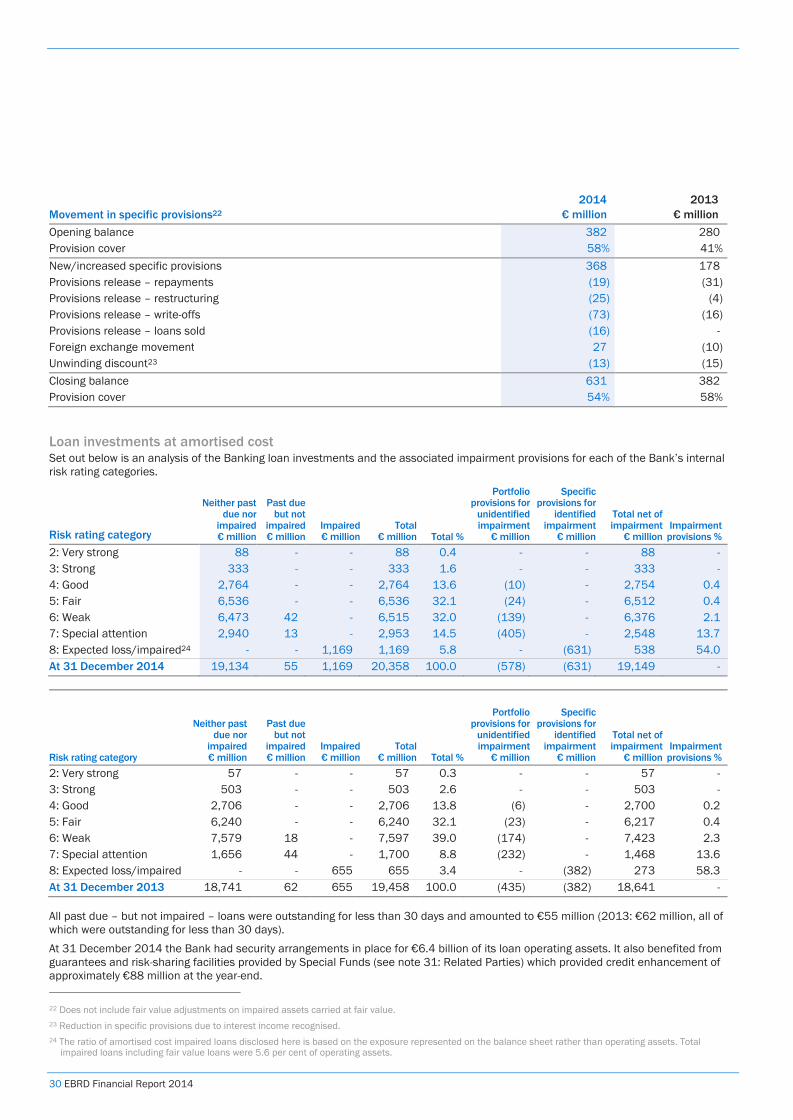
30 EBRD Financial Report 2014
Loan investments at amortised cost Set out below is an analysis of the Banking loan investments and the associated impairment provisions for each of the Bank’s internal risk rating categories.
Risk rating category
Neither past due nor
impaired € million
Past due but not
impaired € million
Impaired€ million
Total € million Total %
Portfolioprovisions for
unidentified impairment
€ million
Specific provisions for
identified impairment
€ million
Total net of impairment
€ millionImpairment
provisions % 2: Very strong 88 - - 88 0.4 - - 88 - 3: Strong 333 - - 333 1.6 - - 333 - 4: Good 2,764 - - 2,764 13.6 (10) - 2,754 0.4 5: Fair 6,536 - - 6,536 32.1 (24) - 6,512 0.4 6: Weak 6,473 42 - 6,515 32.0 (139) - 6,376 2.1 7: Special attention 2,940 13 - 2,953 14.5 (405) - 2,548 13.7 8: Expected loss/impaired24 - - 1,169 1,169 5.8 - (631) 538 54.0 At 31 December 2014 19,134 55 1,169 20,358 100.0 (578) (631) 19,149 -
Risk rating category
Neither past due nor
impaired € million
Past due but not
impaired € million
Impaired€ million
Total € million Total %
Portfolioprovisions for
unidentified impairment
€ million
Specific provisions for
identified impairment
€ million
Total net of impairment
€ millionImpairment
provisions % 2: Very strong 57 - - 57 0.3 - - 57 - 3: Strong 503 - - 503 2.6 - - 503 - 4: Good 2,706 - - 2,706 13.8 (6) - 2,700 0.2 5: Fair 6,240 - - 6,240 32.1 (23) - 6,217 0.4 6: Weak 7,579 18 - 7,597 39.0 (174) - 7,423 2.3 7: Special attention 1,656 44 - 1,700 8.8 (232) - 1,468 13.6 8: Expected loss/impaired - - 655 655 3.4 - (382) 273 58.3 At 31 December 2013 18,741 62 655 19,458 100.0 (435) (382) 18,641 -
All past due – but not impaired – loans were outstanding for less than 30 days and amounted to €55 million (2013: €62 million, all of which were outstanding for less than 30 days). At 31 December 2014 the Bank had security arrangements in place for €6.4 billion of its loan operating assets. It also benefited from guarantees and risk-sharing facilities provided by Special Funds (see note 31: Related Parties) which provided credit enhancement of approximately €88 million at the year-end. 22 Does not include fair value adjustments on impaired assets carried at fair value. 23 Reduction in specific provisions due to interest income recognised. 24 The ratio of amortised cost impaired loans disclosed here is based on the exposure represented on the balance sheet rather than operating assets. Total
impaired loans including fair value loans were 5.6 per cent of operating assets.
Movement in specific provisions22 2014
€ million 2013
€ million Opening balance 382 280 Provision cover 58% 41% New/increased specific provisions 368 178 Provisions release – repayments (19) (31) Provisions release – restructuring (25) (4) Provisions release – write-offs (73) (16) Provisions release – loans sold (16) - Foreign exchange movement 27 (10) Unwinding discount23 (13) (15) Closing balance 631 382 Provision cover 54% 58%
EBRD Financial Report 2014 31
Loans at fair value through profit or loss Set out below is an analysis of the Bank’s loans held at fair value through profit or loss for each of the Bank’s relevant internal risk rating categories.
Undrawn loan commitments and guarantees Set out below is an analysis of the Bank’s undrawn loan commitments and guarantees for each of the Bank’s relevant internal risk rating categories.
Risk rating category
Undrawn loan commitments
2014 € million
Guarantees 2014
€ million
Undrawn loan commitments
2013 € million
Guarantees 2013
€ million 2: Very strong 53 - - - 3. Strong 21 - 29 - 4: Good 843 - 953 13 5. Fair 1,472 44 2,451 93 6: Weak 3,790 270 4,700 486 7: Special attention 2,923 309 657 30 8: Expected loss/impaired 128 5 122 5 At 31 December 9,230 628 8,912 627 The Bank would typically have conditions precedent that would need to be satisfied before further disbursements on its debt transactions. In addition, for projects risk rated 8, it is unlikely that commitments would be drawn down without additional assurances that credit quality would improve.
Risk rating category
Fair value 2014
€ million
Fair value 2013
€ million 5: Fair 138 17 6: Weak 66 123 7: Special attention 131 83 8: Expected loss/impaired 3 - At 31 December 338 223
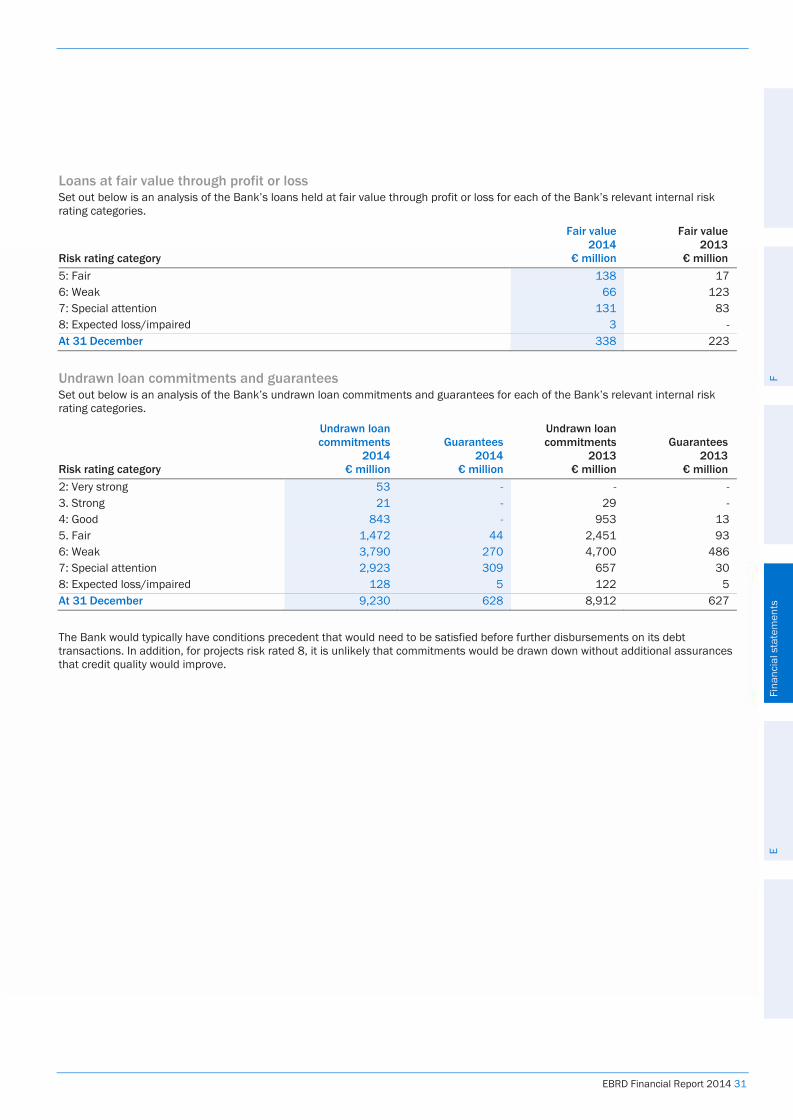
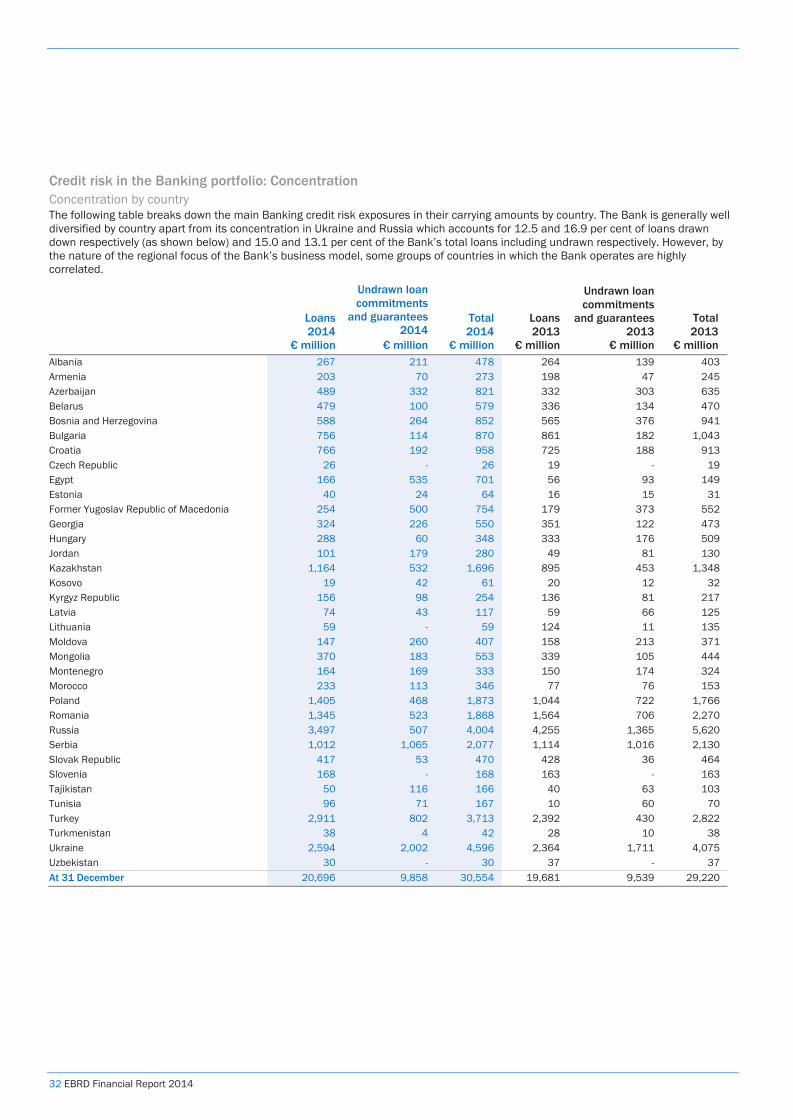
32 EBRD Financial Report 2014
Credit risk in the Banking portfolio: Concentration Concentration by country The following table breaks down the main Banking credit risk exposures in their carrying amounts by country. The Bank is generally well diversified by country apart from its concentration in Ukraine and Russia which accounts for 12.5 and 16.9 per cent of loans drawn down respectively (as shown below) and 15.0 and 13.1 per cent of the Bank’s total loans including undrawn respectively. However, by the nature of the regional focus of the Bank’s business model, some groups of countries in which the Bank operates are highly correlated.
Loans 2014
€ million
Undrawn loan commitments
and guarantees 2014
€ million
Total 2014
€ million
Loans 2013
€ million
Undrawn loan commitments
and guarantees 2013
€ million
Total 2013
€ million Albania 267 211 478 264 139 403 Armenia 203 70 273 198 47 245 Azerbaijan 489 332 821 332 303 635 Belarus 479 100 579 336 134 470 Bosnia and Herzegovina 588 264 852 565 376 941 Bulgaria 756 114 870 861 182 1,043 Croatia 766 192 958 725 188 913 Czech Republic 26 - 26 19 - 19 Egypt 166 535 701 56 93 149 Estonia 40 24 64 16 15 31 Former Yugoslav Republic of Macedonia 254 500 754 179 373 552 Georgia 324 226 550 351 122 473 Hungary 288 60 348 333 176 509 Jordan 101 179 280 49 81 130 Kazakhstan 1,164 532 1,696 895 453 1,348 Kosovo 19 42 61 20 12 32 Kyrgyz Republic 156 98 254 136 81 217 Latvia 74 43 117 59 66 125 Lithuania 59 - 59 124 11 135 Moldova 147 260 407 158 213 371 Mongolia 370 183 553 339 105 444 Montenegro 164 169 333 150 174 324 Morocco 233 113 346 77 76 153 Poland 1,405 468 1,873 1,044 722 1,766 Romania 1,345 523 1,868 1,564 706 2,270 Russia 3,497 507 4,004 4,255 1,365 5,620 Serbia 1,012 1,065 2,077 1,114 1,016 2,130 Slovak Republic 417 53 470 428 36 464 Slovenia 168 - 168 163 - 163 Tajikistan 50 116 166 40 63 103 Tunisia 96 71 167 10 60 70 Turkey 2,911 802 3,713 2,392 430 2,822 Turkmenistan 38 4 42 28 10 38 Ukraine 2,594 2,002 4,596 2,364 1,711 4,075 Uzbekistan 30 - 30 37 - 37 At 31 December 20,696 9,858 30,554 19,681 9,539 29,220
EBRD Financial Report 2014 33
Concentration by industry sector The following table breaks down the main Banking credit exposures in their carrying amounts by the industry sector of the project. The portfolio is generally well diversified with only Depository credit (banks) constituting a material sector concentration.
Concentration by counterparty Maximum exposure (after risk transfers) to a non-sovereign economic group was €647 million at year-end 2014. The Bank has a maximum nominal non-sovereign Banking counterparty exposure limit of 4, 6 or 8 per cent of the Bank’s available economic capital base depending on the rating of the ultimate obligor, as well as more risk-sensitive obligor limits measured in terms of required economic capital over available economic capital.
Credit risk in Treasury: Management The Board of Directors approve a Treasury and Treasury Risk Management Authority (T&TRMA), which defines the risk parameters for funding, cash management, asset and liability management and the investment activities of the Bank. The T&TRMA is the document by which the Board of Directors delegates authority to the Vice President Finance and Chief Financial Officer (VP & CFO) to manage and the VP & CRO to identify, measure, monitor and mitigate the Bank’s Treasury exposures. The two Vice Presidents jointly interpret the T&TRMA and notify the Board of Directors of any material interpretation. The Financial and Operations Policies Committee reviews the T&TRMA annually and its review is submitted to the Board for approval. It covers all aspects of Treasury where financial risks arise and also Risk Management’s identification, measurement, management and mitigation of those risks. In addition, Treasury and Treasury Risk Management Guidelines (T&TRMG) have been approved in respect of Treasury risk taking and the related risk management processes and procedures. Eligible Treasury counterparties and investments are normally rated between 1.0 and 3.3 (approximately equivalent to S&P AAA to A– ratings), with the exception of counterparties approved for local currency activities in the countries where the Bank invests. These activities support the Bank’s initiatives to provide local currency financing to Banking clients and to develop local capital markets. In cases where the creditworthiness of an issuer or counterparty deteriorates to levels below the standard of eligibility for new exposures, Risk Management and Treasury jointly recommend actions for the approval of the VP & CRO and the VP & CFO. Any decision to retain ineligible exposures is reported to the Audit Committee. The T&TRMA states the minimum rating and maximum tenor by type of eligible counterparty, and the T&TRMG set the maximum credit limits per rating. The internal credit rating scale is the same as that used for Banking exposure. The actual credit limit and/or tenor approved for individual counterparties by Risk Management may be smaller or shorter, respectively, based on the likely direction of creditworthiness over the medium term, or on sector considerations. The limits apply across the range of eligible Treasury products for the relevant counterparty with exposures measured on a risk-adjusted basis. All individual counterparty and investment credit lines are monitored and reviewed by Risk Management at least annually.
Loans 2014
€ million
Undrawn loan commitments
and guarantees 2014
€ million
Total 2014
€ million
Loans 2013
€ million
Undrawn loan commitments
and guarantees 2013
€ million
Total 2013
€ million Agribusiness 2,181 435 2,616 2,136 663 2,799
Depository credit (banks) 4,942 1,120 6,062 5,161 1,022 6,183
Information and communication technologies
230 31 261 348 24 372
Insurance, pension, mutual funds 58 1 59 33 3 36
Leasing finance 332 134 466 341 107 448
Manufacturing and services 2,375 341 2,716 2,515 252 2,767
Municipal and environmental infrastructure
1,093 1,036 2,129 1,079 1,031 2,110
Natural resources 1,498 486 1,984 973 894 1,867
Non-depository credit (non-bank) 462 8 470 433 10 443
Power and energy 2,439 1,040 3,479 2,113 1,416 3,529
Property and tourism 370 199 569 354 171 525
Transport 1,796 532 2,328 1,394 391 1,785
Non-sovereign 17,776 5,363 23,139 16,880 5,984 22,864 Sovereign 2,920 4,495 7,415 2,801 3,555 6,356 At 31 December 20,696 9,858 30,554 19,681 9,539 29,220
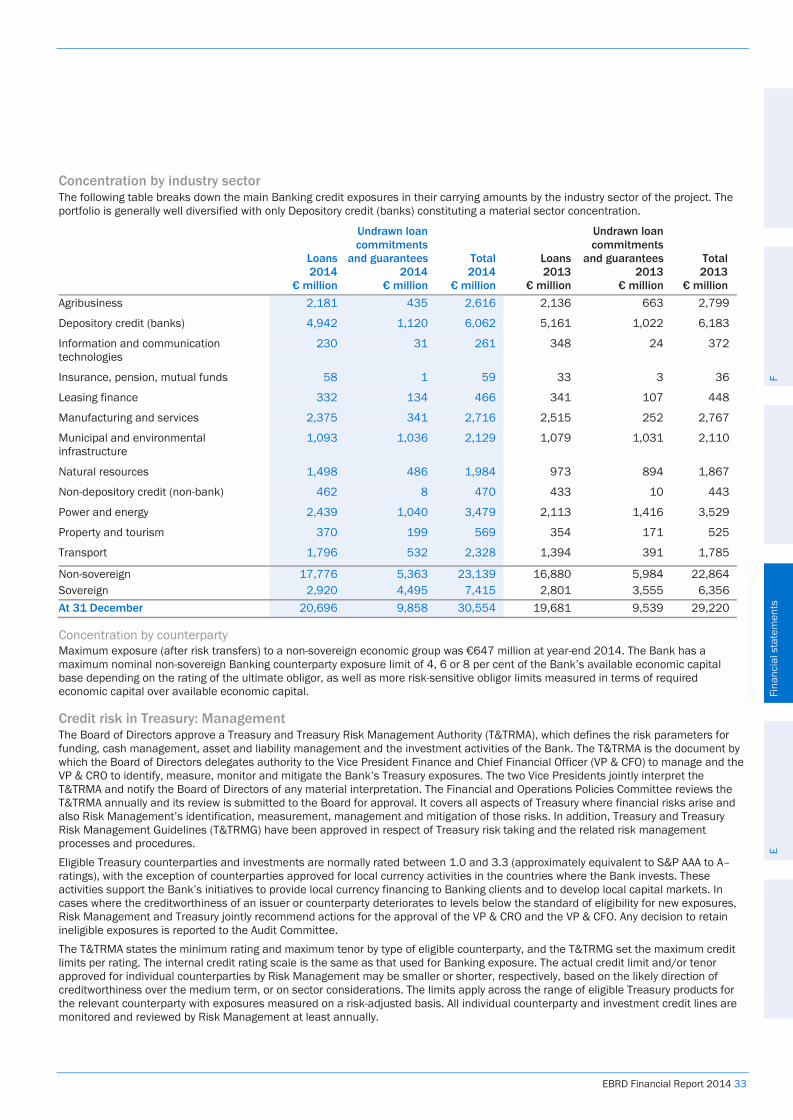
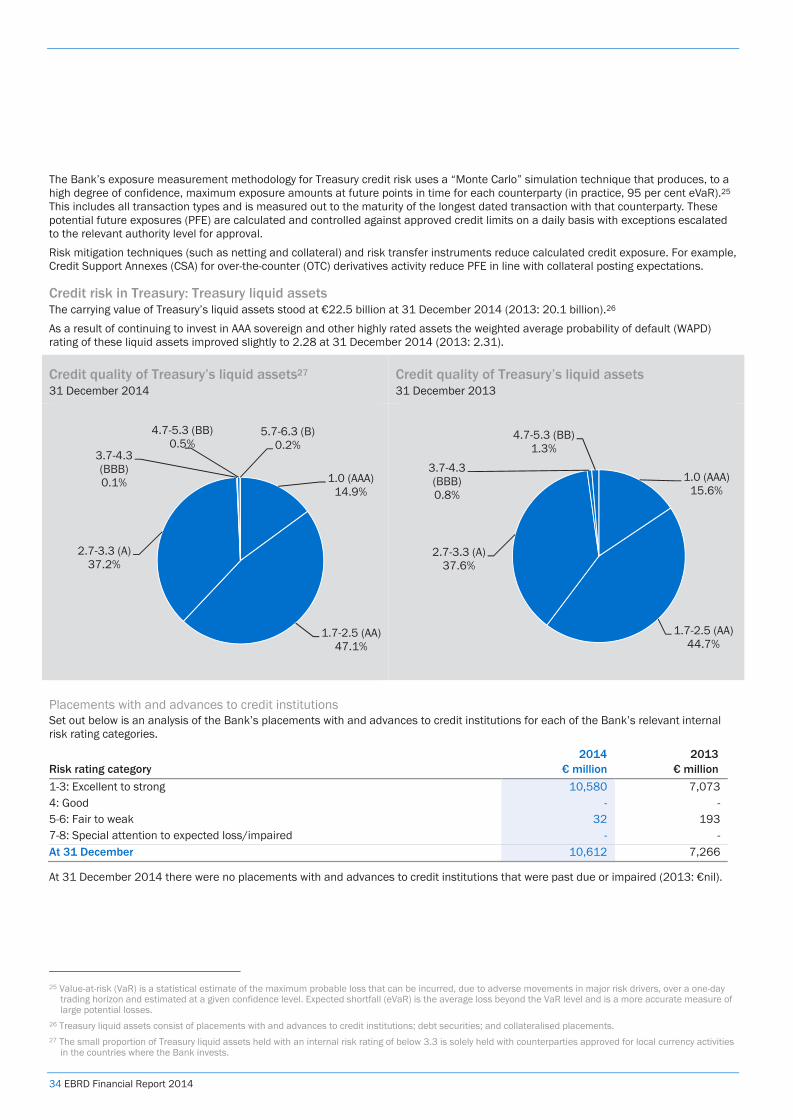
34 EBRD Financial Report 2014
The Bank’s exposure measurement methodology for Treasury credit risk uses a “Monte Carlo” simulation technique that produces, to a high degree of confidence, maximum exposure amounts at future points in time for each counterparty (in practice, 95 per cent eVaR).25 This includes all transaction types and is measured out to the maturity of the longest dated transaction with that counterparty. These potential future exposures (PFE) are calculated and controlled against approved credit limits on a daily basis with exceptions escalated to the relevant authority level for approval. Risk mitigation techniques (such as netting and collateral) and risk transfer instruments reduce calculated credit exposure. For example, Credit Support Annexes (CSA) for over-the-counter (OTC) derivatives activity reduce PFE in line with collateral posting expectations.
Credit risk in Treasury: Treasury liquid assets The carrying value of Treasury’s liquid assets stood at €22.5 billion at 31 December 2014 (2013: 20.1 billion).26 As a result of continuing to invest in AAA sovereign and other highly rated assets the weighted average probability of default (WAPD) rating of these liquid assets improved slightly to 2.28 at 31 December 2014 (2013: 2.31).
Credit quality of Treasury’s liquid assets27 31 December 2014
Credit quality of Treasury’s liquid assets 31 December 2013
Placements with and advances to credit institutions Set out below is an analysis of the Bank’s placements with and advances to credit institutions for each of the Bank’s relevant internal risk rating categories.
At 31 December 2014 there were no placements with and advances to credit institutions that were past due or impaired (2013: €nil).
25 Value-at-risk (VaR) is a statistical estimate of the maximum probable loss that can be incurred, due to adverse movements in major risk drivers, over a one-day
trading horizon and estimated at a given confidence level. Expected shortfall (eVaR) is the average loss beyond the VaR level and is a more accurate measure of large potential losses.
26 Treasury liquid assets consist of placements with and advances to credit institutions; debt securities; and collateralised placements. 27 The small proportion of Treasury liquid assets held with an internal risk rating of below 3.3 is solely held with counterparties approved for local currency activities
in the countries where the Bank invests.
1.0 (AAA)14.9%
1.7-2.5 (AA)47.1%
2.7-3.3 (A)37.2%
3.7-4.3 (BBB)0.1%
4.7-5.3 (BB)0.5%
5.7-6.3 (B)0.2%
1.0 (AAA)15.6%
1.7-2.5 (AA)44.7%
2.7-3.3 (A)37.6%
3.7-4.3 (BBB)0.8%
4.7-5.3 (BB)1.3%
Risk rating category 2014
€ million 2013
€ million 1-3: Excellent to strong 10,580 7,073 4: Good - - 5-6: Fair to weak 32 193 7-8: Special attention to expected loss/impaired - - At 31 December 10,612 7,266
EBRD Financial Report 2014 35
Debt securities at fair value through profit or loss Set out below is an analysis of the Bank’s debt securities at fair value through profit or loss for each of the Bank’s relevant internal risk rating categories.
Risk rating category 2014
€ million 2013
€ million 1-3: Excellent to strong 11 4 4: Good 18 88 5-6: Fair to weak 77 47 7-8: Special attention to expected loss/impaired - - At 31 December 106 139
There were no debt securities at fair value past due in 2014 (2013: €nil).
Debt securities at amortised cost Set out below is an analysis of the Bank’s debt securities at amortised cost for each of the Bank’s relevant internal risk rating categories.
Risk rating category 2014
€ million 2013
€ million 1-3: Excellent to strong 11,653 12,292 4: Good 12 83 5-6: Fair to weak 23 23 7-8: Special attention to expected loss/impaired - At 31 December 11,688 12,398
There were no debt securities at amortised cost past due in 2014 (2013: €nil).
Collateralised placements Collateralised placements of €57 million (2013: €247 million) were all internally risk rated 1-3: excellent to strong, with none that were past due or impaired (2013: €nil).
Treasury potential future exposure In addition to Treasury’s liquid assets there are other products such as OTC swaps and forward contracts that are included within Treasury’s overall PFE. PFE calculations show the future exposure throughout the life of a transaction or, in the case of collateralised portfolios, over the appropriate unwind periods. This is particularly important for Treasury’s repo/reverse repo activity and hedging products such as OTC swaps and forwards. Calculation of PFE reduces counterparty exposures through standard risk mitigations such as netting and collateral, which enables Risk Management to see a comprehensive exposure profile of all Treasury products (including liquid assets) against a specific counterparty limit on a daily basis. Treasury PFE stood at €18.8 billion at 31 December 2014 (2013: €17.6 billion). Treasury maintained a low average credit risk profile during 2014 by investing liquidity in AAA sovereign and other highly rated assets. This resulted in a slight improvement in the weighted average probability of default (WAPD) rating for the Treasury portfolio of 2.17 at 31 December 2014 (2013: 2.23).
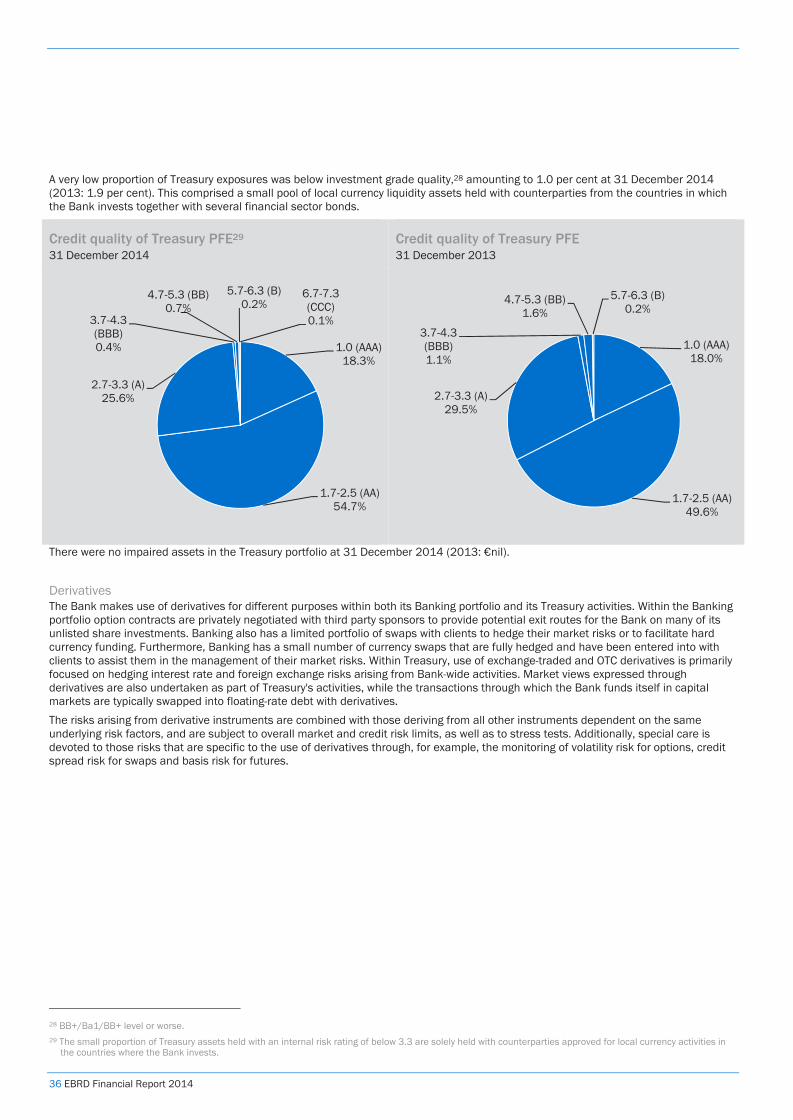
36 EBRD Financial Report 2014
A very low proportion of Treasury exposures was below investment grade quality,28 amounting to 1.0 per cent at 31 December 2014 (2013: 1.9 per cent). This comprised a small pool of local currency liquidity assets held with counterparties from the countries in which the Bank invests together with several financial sector bonds.
Credit quality of Treasury PFE29 31 December 2014
Credit quality of Treasury PFE 31 December 2013
There were no impaired assets in the Treasury portfolio at 31 December 2014 (2013: €nil).
Derivatives The Bank makes use of derivatives for different purposes within both its Banking portfolio and its Treasury activities. Within the Banking portfolio option contracts are privately negotiated with third party sponsors to provide potential exit routes for the Bank on many of its unlisted share investments. Banking also has a limited portfolio of swaps with clients to hedge their market risks or to facilitate hard currency funding. Furthermore, Banking has a small number of currency swaps that are fully hedged and have been entered into with clients to assist them in the management of their market risks. Within Treasury, use of exchange-traded and OTC derivatives is primarily focused on hedging interest rate and foreign exchange risks arising from Bank-wide activities. Market views expressed through derivatives are also undertaken as part of Treasury's activities, while the transactions through which the Bank funds itself in capital markets are typically swapped into floating-rate debt with derivatives. The risks arising from derivative instruments are combined with those deriving from all other instruments dependent on the same underlying risk factors, and are subject to overall market and credit risk limits, as well as to stress tests. Additionally, special care is devoted to those risks that are specific to the use of derivatives through, for example, the monitoring of volatility risk for options, credit spread risk for swaps and basis risk for futures.
28 BB+/Ba1/BB+ level or worse. 29 The small proportion of Treasury assets held with an internal risk rating of below 3.3 are solely held with counterparties approved for local currency activities in
the countries where the Bank invests.
1.0 (AAA)18.3%
1.7-2.5 (AA)54.7%
2.7-3.3 (A)25.6%
3.7-4.3 (BBB)0.4%
4.7-5.3 (BB)0.7%
5.7-6.3 (B)0.2%
6.7-7.3 (CCC)0.1%
1.0 (AAA)18.0%
1.7-2.5 (AA)49.6%
2.7-3.3 (A)29.5%
3.7-4.3 (BBB)1.1%
4.7-5.3 (BB)1.6%
5.7-6.3 (B)0.2%
EBRD Financial Report 2014 37
The table below shows the fair value of the Bank’s derivative financial assets and liabilities at 31 December 2014 and 31 December 2013.
Set out below is an analysis of the Bank’s derivative financial assets for each of the Bank’s internal risk rating categories.
Risk rating category 2014
€ million 2013
€ million 1-3: Excellent to strong 4,513 2,898 4: Good 116 70 5-6: Fair to weak 297 113 7-8: Special attention to expected loss/impaired 52 13 At 31 December 4,978 3,094
There were no derivative financial assets past due in 2014 (2013: €nil). In order to manage credit risk in OTC derivative transactions,31 the Bank’s policy is to approve, ex ante, each counterparty individually and to review its creditworthiness and eligibility regularly. Derivatives limits are included in overall counterparty credit limits. OTC derivative transactions are normally carried out only with the most creditworthy counterparties, rated at the internal equivalent of A and above. Furthermore, the Bank pays great attention to mitigating the credit risk of OTC derivatives through the negotiation of appropriate legal documentation with counterparties. OTC derivative transactions are documented under a Master Agreement (MA) and a CSA. These provide for close-out netting and the posting of collateral by the counterparty once the Bank’s exposure exceeds a given threshold, which is usually a function of the counterparty’s risk rating.
30 Where a financial liability held at amortised cost contains an embedded derivative which is of a different economic character to the host instrument, and the
liability does not qualify for hedge accounting, that embedded derivative is bifurcated and measured at fair value through the income statement. All such derivatives bifurcated by the Bank are embedded in Debts Evidenced by Certificates.
31 This does not include negotiated options associated with share investments.
Assets 2014
€ million
Liabilities 2014
€ million
Total 2014
€ million
Assets 2013
€ million
Liabilities 2013
€ million
Total 2013
€ million
Portfolio derivatives not designated as hedges
OTC foreign currency products
Currency swaps 904 (70) 834 224 (38) 186
Spot and forward currency transactions 379 (80) 299 109 (119) (10)
1,283 (150) 1,133 333 (157) 176
OTC interest rate products
Interest rate swaps 76 (209) (133) 101 (103) (2)
OTC credit products
Credit default swaps - - - - (1) (1)
Banking derivatives
Fair value of equity derivatives held in relation to the Banking portfolio 506 (81) 425 315 (97) 218 Total portfolio derivatives not designated as hedges and Banking derivatives 1,865 (440) 1,425 749 (358) 391
Derivatives held for hedging
Derivatives designated as fair value hedges
Interest rate swaps 1,548 (330) 1,218 1,077 (426) 651
Cross currency interest rate swaps 1,565 (1,471) 94 1,259 (1,494) (235)
Embedded derivatives30 - (189) (189) 5 (197) (192)
3,113 (1,990) 1,123 2,341 (2,117) 224
Derivatives designated as cash flow hedges
Forward currency transactions - - - 4 - 4
Total derivatives held for hedging 3,113 (1,990) 1,123 2,345 (2,117) 228
Total derivatives at 31 December 4,978 (2,430) 2,548 3,094 (2,475) 619
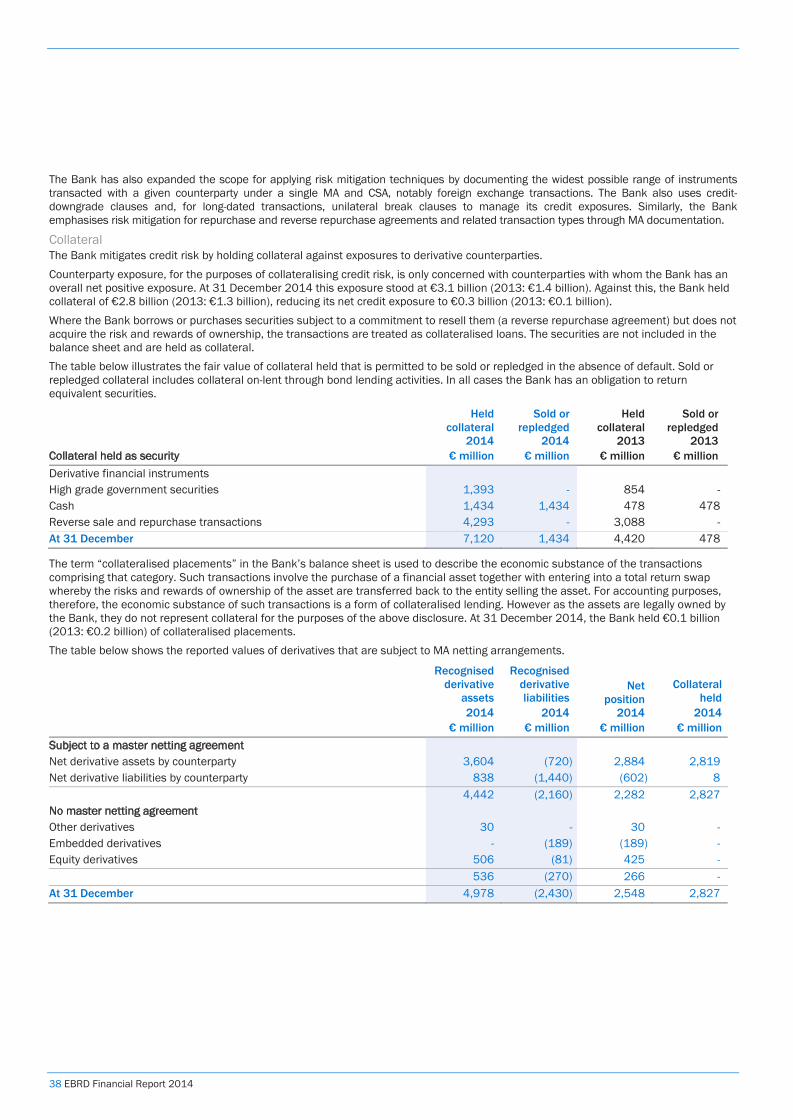
38 EBRD Financial Report 2014
The Bank has also expanded the scope for applying risk mitigation techniques by documenting the widest possible range of instruments transacted with a given counterparty under a single MA and CSA, notably foreign exchange transactions. The Bank also uses credit-downgrade clauses and, for long-dated transactions, unilateral break clauses to manage its credit exposures. Similarly, the Bank emphasises risk mitigation for repurchase and reverse repurchase agreements and related transaction types through MA documentation.
Collateral The Bank mitigates credit risk by holding collateral against exposures to derivative counterparties. Counterparty exposure, for the purposes of collateralising credit risk, is only concerned with counterparties with whom the Bank has an overall net positive exposure. At 31 December 2014 this exposure stood at €3.1 billion (2013: €1.4 billion). Against this, the Bank held collateral of €2.8 billion (2013: €1.3 billion), reducing its net credit exposure to €0.3 billion (2013: €0.1 billion). Where the Bank borrows or purchases securities subject to a commitment to resell them (a reverse repurchase agreement) but does not acquire the risk and rewards of ownership, the transactions are treated as collateralised loans. The securities are not included in the balance sheet and are held as collateral. The table below illustrates the fair value of collateral held that is permitted to be sold or repledged in the absence of default. Sold or repledged collateral includes collateral on-lent through bond lending activities. In all cases the Bank has an obligation to return equivalent securities.
The term “collateralised placements” in the Bank’s balance sheet is used to describe the economic substance of the transactions comprising that category. Such transactions involve the purchase of a financial asset together with entering into a total return swap whereby the risks and rewards of ownership of the asset are transferred back to the entity selling the asset. For accounting purposes, therefore, the economic substance of such transactions is a form of collateralised lending. However as the assets are legally owned by the Bank, they do not represent collateral for the purposes of the above disclosure. At 31 December 2014, the Bank held €0.1 billion (2013: €0.2 billion) of collateralised placements. The table below shows the reported values of derivatives that are subject to MA netting arrangements.
Collateral held as security
Held collateral
2014 € million
Sold or repledged
2014 € million
Held collateral
2013 € million
Sold or repledged
2013 € million
Derivative financial instruments High grade government securities 1,393 - 854 - Cash 1,434 1,434 478 478 Reverse sale and repurchase transactions 4,293 - 3,088 - At 31 December 7,120 1,434 4,420 478
Recognised derivative
assets 2014
€ million
Recognised derivative liabilities
2014 € million
Net position
2014 € million
Collateral held
2014 € million
Subject to a master netting agreement Net derivative assets by counterparty 3,604 (720) 2,884 2,819 Net derivative liabilities by counterparty 838 (1,440) (602) 8 4,442 (2,160) 2,282 2,827 No master netting agreement Other derivatives 30 - 30 - Embedded derivatives - (189) (189) - Equity derivatives 506 (81) 425 - 536 (270) 266 - At 31 December 4,978 (2,430) 2,548 2,827
EBRD Financial Report 2014 39
Total return swaps are excluded from the fair values of the above tables as they are accounted for as collateralised placements and not stand-alone derivatives. The full amount of collateral held from the counterparty to those swaps is, however, reported above as it relates to the net exposure on the entire derivatives portfolio with that counterparty. At 31 December 2014, the amount of collateral held in relation to total return swaps was €nil (2013: €6 million).
Recognised derivative
assets 2013
€ million
Recognised derivative liabilities
2013 € million
Net position
2013 € million
Collateral held
2013 € million
Subject to a master netting agreement Net derivative assets by counterparty 2,073 (674) 1,399 1,314 Net derivative liabilities by counterparty 693 (1,494) (801) 18 2,766 (2,168) 598 1,332 No master netting agreement Other derivatives 8 (13) (5) - Embedded derivatives 5 (197) (192) - Equity derivatives 315 (97) 218 - 328 (307) 21 At 31 December 3,094 (2,475) 619 1,332
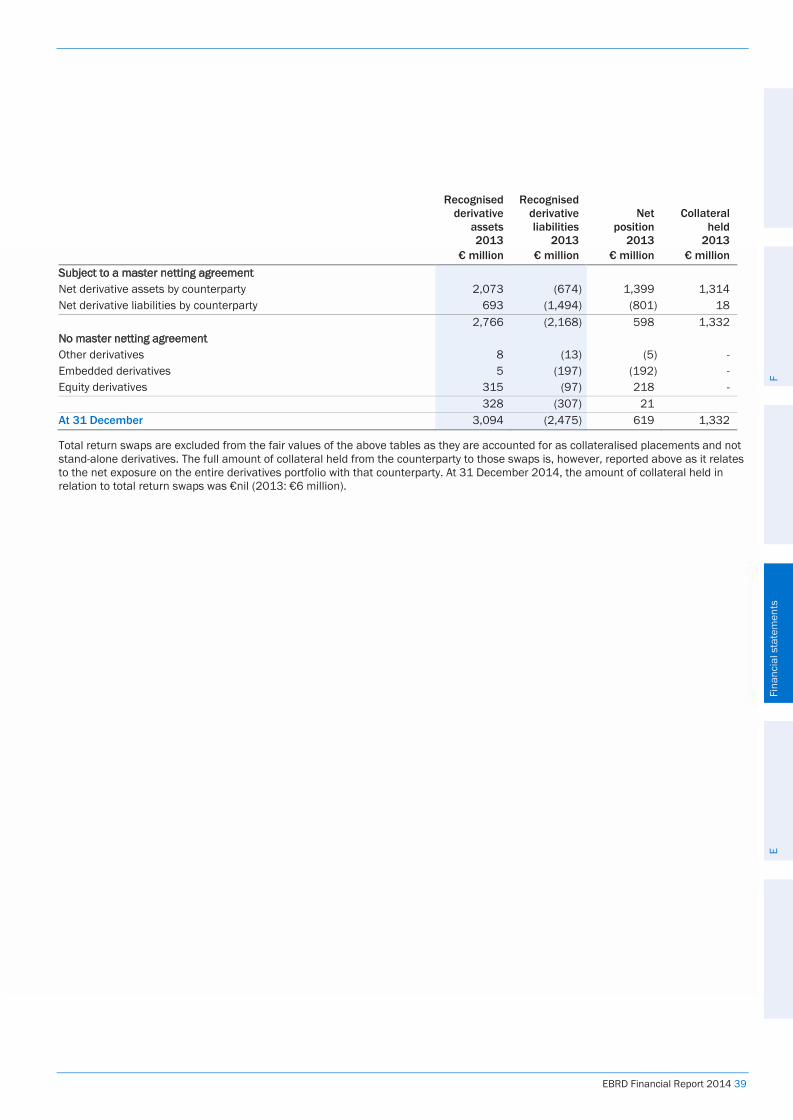
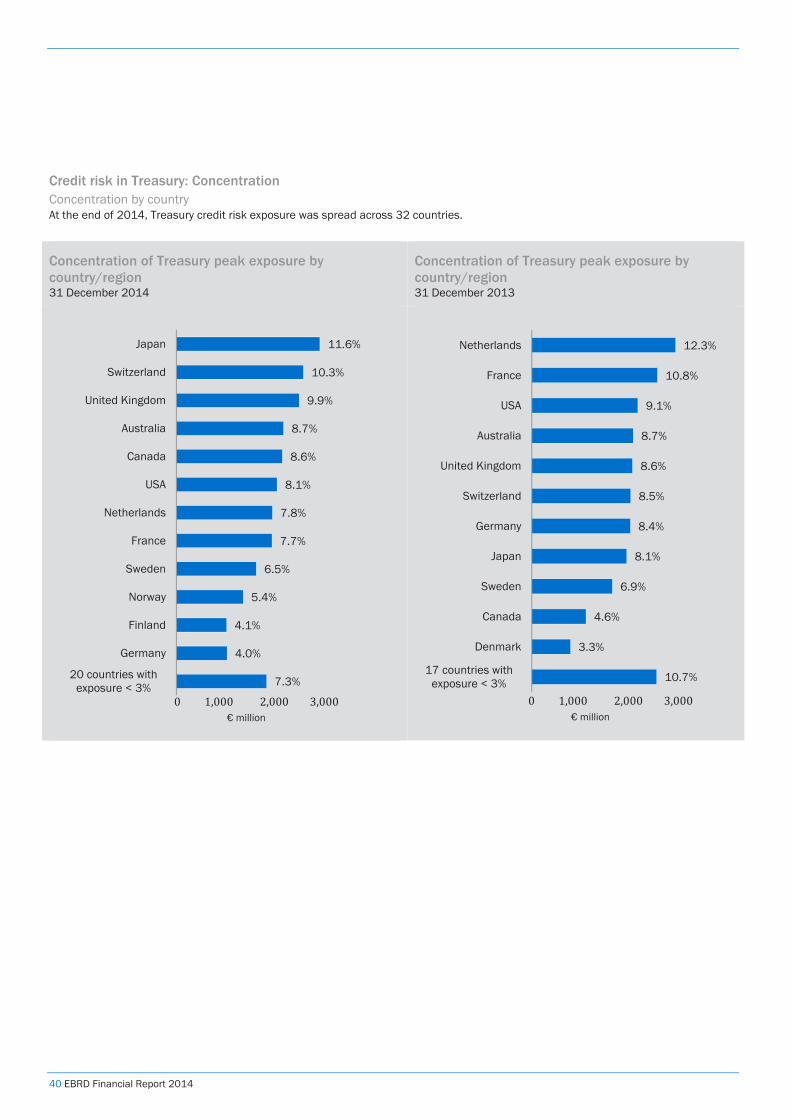
40 EBRD Financial Report 2014
Credit risk in Treasury: Concentration Concentration by country At the end of 2014, Treasury credit risk exposure was spread across 32 countries.
Concentration of Treasury peak exposure by country/region 31 December 2014
Concentration of Treasury peak exposure by country/region 31 December 2013
7.3%
4.0%
4.1%
5.4%
6.5%
7.7%
7.8%
8.1%
8.6%
8.7%
9.9%
10.3%
11.6%
20 countries withexposure < 3%
Germany
Finland
Norway
Sweden
France
Netherlands
USA
Canada
Australia
United Kingdom
Switzerland
Japan
10.7%
3.3%
4.6%
6.9%
8.1%
8.4%
8.5%
8.6%
8.7%
9.1%
10.8%
12.3%
17 countries withexposure < 3%
Denmark
Canada
Sweden
Japan
Germany
Switzerland
United Kingdom
Australia
USA
France
Netherlands
01,0002,0003,000€ million
01,0002,0003,000€ million
EBRD Financial Report 2014 41
Concentration by counterparty type The Bank continues to be largely exposed to banks in the Treasury portfolio which accounted for 53 per cent of the portfolio peak exposure (2013: 59 per cent). Direct sovereign exposure32 slightly decreased to 24 per cent (2013: 27 per cent), while exposure to counterparties in the countries in which the Bank invests decreased by 1 per cent on a PFE basis.
Concentration of peak exposure by counterparty type, 31 December 2014 € million
Concentration of peak exposure by counterparty type, 31 December 2013 € million
CoO: Countries of operation ABS: Asset-backed securities PSEs: Public sector entities DPCs: Derivative product companies
B. Market risk Market risk is the potential loss that could result from adverse market movements. The drivers of market risk are: (i) interest rate risk; (ii) foreign exchange risk; (iii) equity risk; and (iv) commodity price risk. The year was marked by the return of volatility to financial markets. In the fourth quarter, the VIX index of equity market volatility33 reached levels last seen in the first half of 2012, on fears of deflation and lack of global growth. Interest rates (and bond yields) on hard currencies continued at historical lows, although interest rate and currency volatilities picked up towards the end of the year. Rouble-US dollar cross-currency basis spread volatility also increased dramatically in the last quarter of the year. Equity markets in the countries in which the Bank’s invests were significantly down in the year that saw crisis in Ukraine, sanctions against Russia and a decline in the price of oil from above US$ 110 at the end of June to below US$ 60 by the end of the year.
Market risk in the Banking portfolio The Banking loan portfolio is match-funded by Treasury in terms of currency, so for loan facilities extended in currencies other than euro the foreign exchange risk is hedged by Treasury. Likewise, interest rate risk to which the Banking loan portfolio would normally be exposed is managed through the Treasury portfolio. As such there is minimal residual foreign exchange or interest rate risk present in the Banking loan portfolio. The main exposure to market risk in the Banking portfolio arises from the exposure of share investments to foreign exchange and equity price risk, neither of which is captured in the VaR figures discussed under “Market risk in the Treasury portfolio”. Additional sensitivity information for the Bank’s share investments has been included under “fair value hierarchy” later in this section of the report. The EBRD takes a long-term view of its equity investments, and therefore accepts the short-term volatilities in value arising from exchange rate risk and price risk.
32 Indirect exposure is not included – that is, where the Bank holds government securities as collateral. 33 The Chicago Board Options Exchange Market Volatility Index.
Banks10,593
Sovereigns4,823
ABS1,165
Insurance Co /DPCs
365
PSEs650
Corporates99
CoO Counter-parties,
278
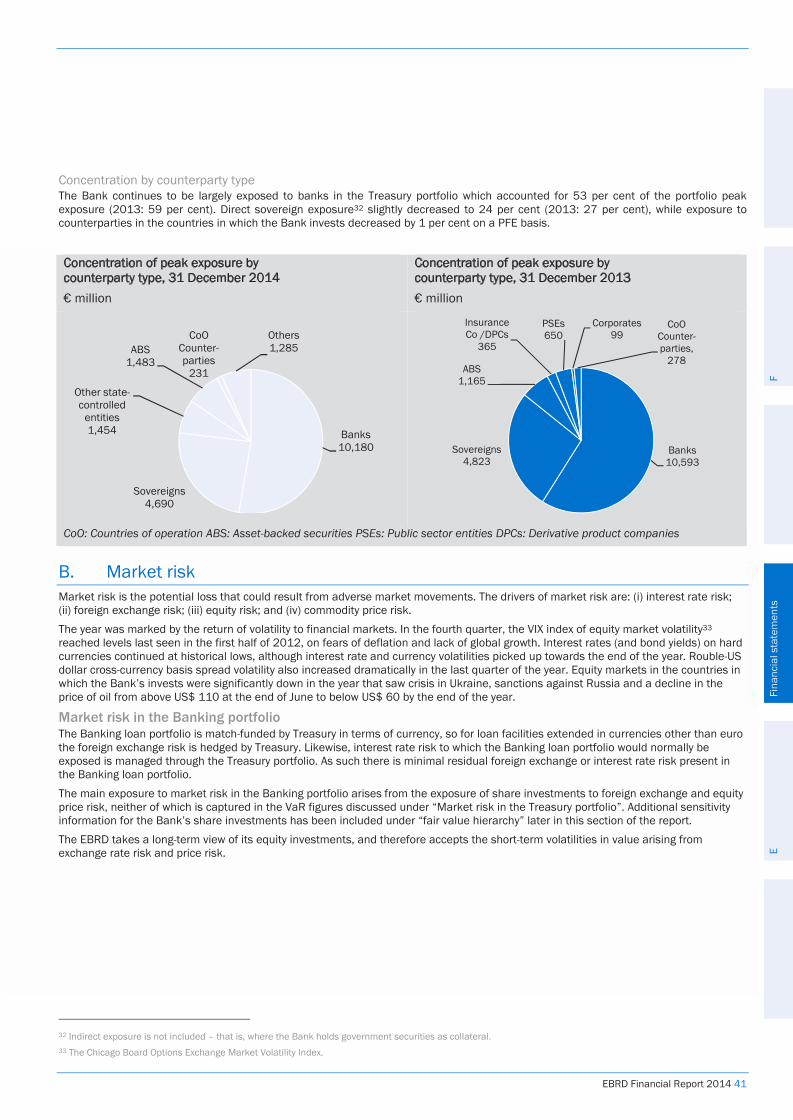
Banks 10179.61Sovereigns 4689.69Other state-controlled en 1454.39ABS 1483.11CoO Counter-parties 230.67Others 1284.91
Banks 10593.16Sovereigns 4823.22ABS 1164.57Insurance Co /DPCs 364.74PSEs 649.93Corporates 98.85CoO Counterparties 278.46
[TITLE] Concentration of peak exposure by counterparty type, 31 December 2013 ( € million)
[TITLE] Concentration of peak exposure by counterparty type, 31 December 2014 ( € million)
Banks10,180
Sovereigns4,690
Other state-controlled
entities1,454
ABS1,483
CoO Counter-parties
231
Others1,285
Banks10,593
Sovereigns4,823
ABS1,165
Insurance Co /DPCs
365
PSEs650
Corporates99
CoO Counter-parties393
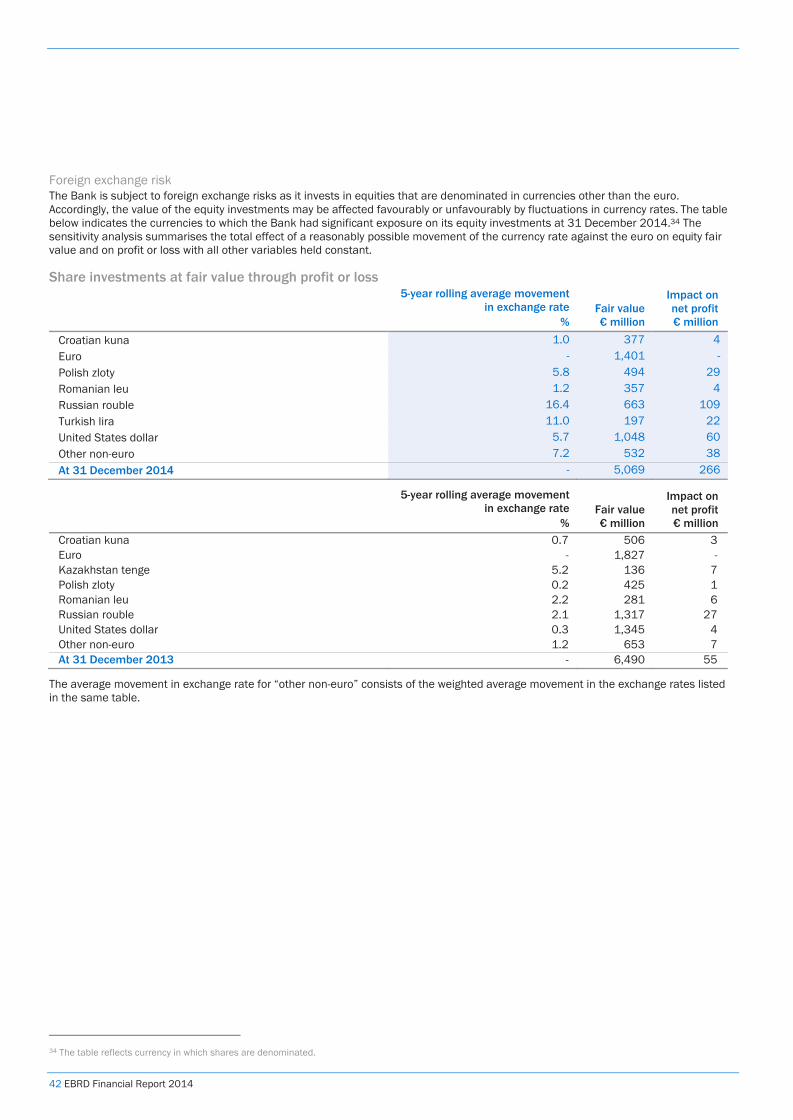
42 EBRD Financial Report 2014
Foreign exchange risk The Bank is subject to foreign exchange risks as it invests in equities that are denominated in currencies other than the euro. Accordingly, the value of the equity investments may be affected favourably or unfavourably by fluctuations in currency rates. The table below indicates the currencies to which the Bank had significant exposure on its equity investments at 31 December 2014.34 The sensitivity analysis summarises the total effect of a reasonably possible movement of the currency rate against the euro on equity fair value and on profit or loss with all other variables held constant.
Share investments at fair value through profit or loss
5-year rolling average movement in exchange rate
% Fair value € million
Impact on net profit € million
Croatian kuna 1.0 377 4 Euro - 1,401 - Polish zloty 5.8 494 29 Romanian leu 1.2 357 4 Russian rouble 16.4 663 109 Turkish lira 11.0 197 22 United States dollar 5.7 1,048 60 Other non-euro 7.2 532 38 At 31 December 2014 - 5,069 266
The average movement in exchange rate for “other non-euro” consists of the weighted average movement in the exchange rates listed in the same table.
34 The table reflects currency in which shares are denominated.
5-year rolling average movement in exchange rate
% Fair value € million
Impact on net profit € million
Croatian kuna 0.7 506 3 Euro - 1,827 - Kazakhstan tenge 5.2 136 7 Polish zloty 0.2 425 1 Romanian leu 2.2 281 6 Russian rouble 2.1 1,317 27 United States dollar 0.3 1,345 4 Other non-euro 1.2 653 7 At 31 December 2013 - 6,490 55
EBRD Financial Report 2014 43
Equity price risk Equity price risk is the risk of unfavourable changes in the fair values of equities as the result of changes in the levels of equity indices and the value of individual shares. In terms of equity price risk, the Bank expects the effect on net profit will bear a linear relationship to the movement in equity indices, for both listed and unlisted equity investments. The table below summarises the potential impact on the Bank’s net profit from a reasonably possible change in equity indices.
Share investments at fair value through profit or loss
5-year rolling average movement in benchmark index
% Fair value € million
Impact on net profit € million
Croatia CROBEX Index 5.7 377 22 Kazakhstan KASE Index 11.7 134 16 Poland WIG Index 14.8 528 78 Romania BET Index 15.6 367 57 Russia MICEX Index 10.9 1,128 123 Serbia BELEX15 Index 11.3 100 11 Turkey XU100 Index 27.9 242 68 Ukraine PFTS Index 38.2 74 28 Regional and other Weighted average 13.7 2,119 290 At 31 December 2014 - 5,069 693
The average movement in benchmark index for “regional and other” is made up of the weighted average movement in benchmark indices of the countries listed in the same table.
Commodity risk in the Banking portfolio The Bank is exposed to commodity risk through some of its investments and due to the significant importance of commodities in a number of the countries in which it invests. The Bank’s commodity risk is relatively limited, with the aggregate exposure to oil and gas extraction, metal ore mining and coal mining (and related support activities) amounting to only 3.7 per cent (2013: 3.2 per cent) of the overall banking portfolio. The potential overall risk is however more substantial, as several countries in which the Bank invests, most notably Russia, are heavily reliant on hydrocarbon exports to support their economic growth, domestic demand and budgetary revenues. A prolonged and material decline in oil prices would have an adverse effect on hydrocarbon producers and processors, as well as on the relevant sovereigns and corporate clients reliant on domestic demand. The Bank monitors this risk carefully and periodically stress tests its portfolio to oil price decline.
5-year rolling average movement in benchmark index
% Fair value € million
Impact on net profit € million
Croatia CROBEX Index 1.4 506 7 Georgia BGAX Index 17.9 128 23 Kazakhstan KASE Index 4.8 167 8 Poland WIG Index 15.8 698 110 Romania BET Index 20.9 304 63 Russia RTS Index 26.8 2,154 578 Serbia BELEX15 Index 0.7 179 1 Ukraine PFTS Index 13.6 149 20 Regional and other Weighted average 18.9 2,205 417 At 31 December 2013 - 6,490 1,227
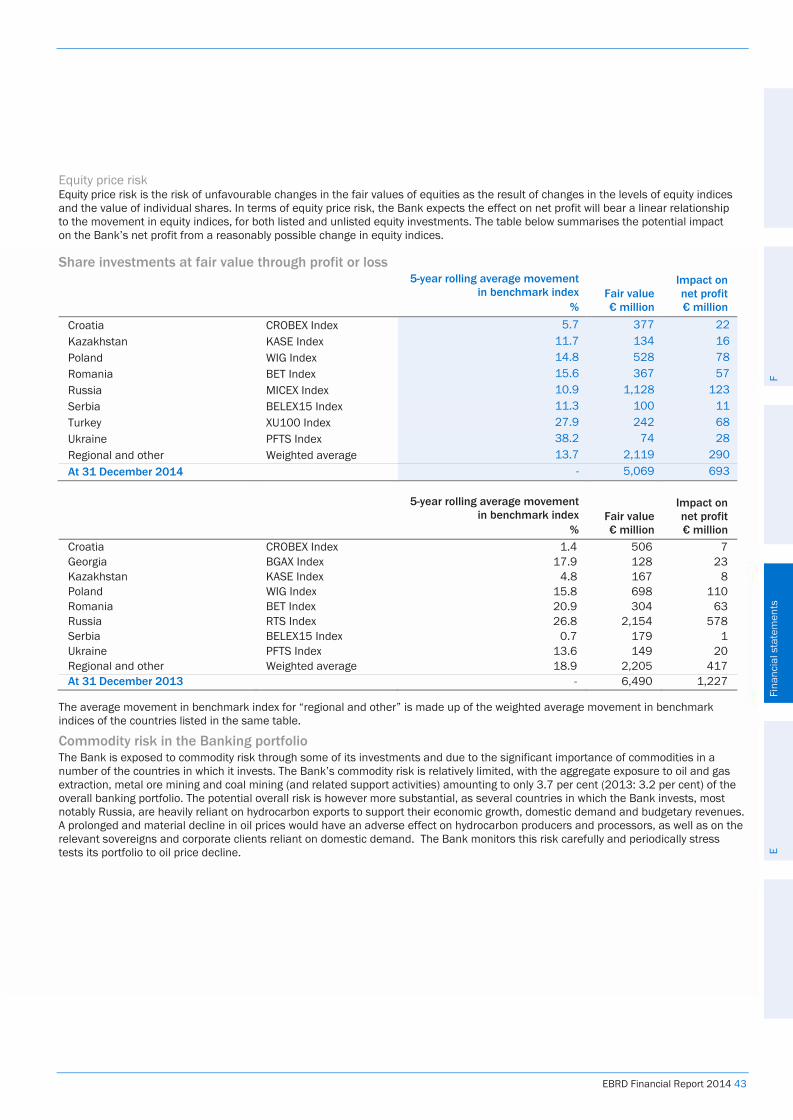
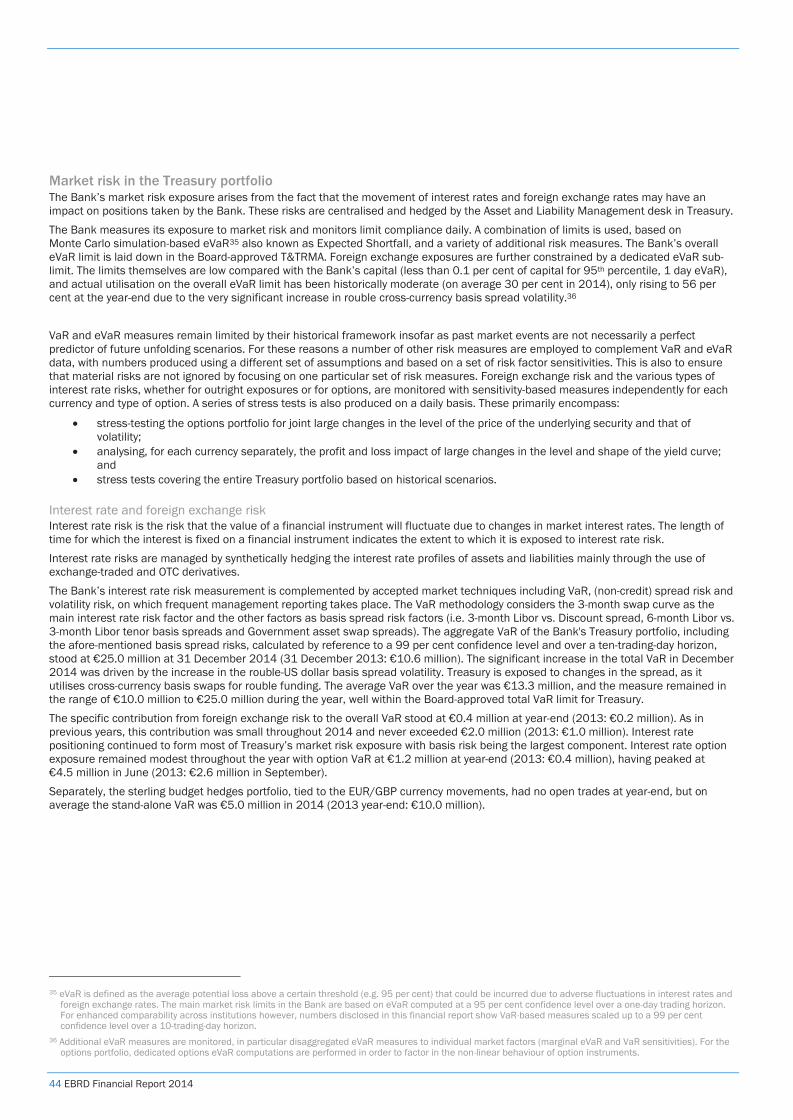
44 EBRD Financial Report 2014
Market risk in the Treasury portfolio The Bank’s market risk exposure arises from the fact that the movement of interest rates and foreign exchange rates may have an impact on positions taken by the Bank. These risks are centralised and hedged by the Asset and Liability Management desk in Treasury. The Bank measures its exposure to market risk and monitors limit compliance daily. A combination of limits is used, based on Monte Carlo simulation-based eVaR35 also known as Expected Shortfall, and a variety of additional risk measures. The Bank’s overall eVaR limit is laid down in the Board-approved T&TRMA. Foreign exchange exposures are further constrained by a dedicated eVaR sub-limit. The limits themselves are low compared with the Bank’s capital (less than 0.1 per cent of capital for 95th percentile, 1 day eVaR), and actual utilisation on the overall eVaR limit has been historically moderate (on average 30 per cent in 2014), only rising to 56 per cent at the year-end due to the very significant increase in rouble cross-currency basis spread volatility.36 VaR and eVaR measures remain limited by their historical framework insofar as past market events are not necessarily a perfect predictor of future unfolding scenarios. For these reasons a number of other risk measures are employed to complement VaR and eVaR data, with numbers produced using a different set of assumptions and based on a set of risk factor sensitivities. This is also to ensure that material risks are not ignored by focusing on one particular set of risk measures. Foreign exchange risk and the various types of interest rate risks, whether for outright exposures or for options, are monitored with sensitivity-based measures independently for each currency and type of option. A series of stress tests is also produced on a daily basis. These primarily encompass:
stress-testing the options portfolio for joint large changes in the level of the price of the underlying security and that of volatility;
analysing, for each currency separately, the profit and loss impact of large changes in the level and shape of the yield curve; and
stress tests covering the entire Treasury portfolio based on historical scenarios.
Interest rate and foreign exchange risk Interest rate risk is the risk that the value of a financial instrument will fluctuate due to changes in market interest rates. The length of time for which the interest is fixed on a financial instrument indicates the extent to which it is exposed to interest rate risk. Interest rate risks are managed by synthetically hedging the interest rate profiles of assets and liabilities mainly through the use of exchange-traded and OTC derivatives. The Bank’s interest rate risk measurement is complemented by accepted market techniques including VaR, (non-credit) spread risk and volatility risk, on which frequent management reporting takes place. The VaR methodology considers the 3-month swap curve as the main interest rate risk factor and the other factors as basis spread risk factors (i.e. 3-month Libor vs. Discount spread, 6-month Libor vs. 3-month Libor tenor basis spreads and Government asset swap spreads). The aggregate VaR of the Bank's Treasury portfolio, including the afore-mentioned basis spread risks, calculated by reference to a 99 per cent confidence level and over a ten-trading-day horizon, stood at €25.0 million at 31 December 2014 (31 December 2013: €10.6 million). The significant increase in the total VaR in December 2014 was driven by the increase in the rouble-US dollar basis spread volatility. Treasury is exposed to changes in the spread, as it utilises cross-currency basis swaps for rouble funding. The average VaR over the year was €13.3 million, and the measure remained in the range of €10.0 million to €25.0 million during the year, well within the Board-approved total VaR limit for Treasury. The specific contribution from foreign exchange risk to the overall VaR stood at €0.4 million at year-end (2013: €0.2 million). As in previous years, this contribution was small throughout 2014 and never exceeded €2.0 million (2013: €1.0 million). Interest rate positioning continued to form most of Treasury’s market risk exposure with basis risk being the largest component. Interest rate option exposure remained modest throughout the year with option VaR at €1.2 million at year-end (2013: €0.4 million), having peaked at €4.5 million in June (2013: €2.6 million in September). Separately, the sterling budget hedges portfolio, tied to the EUR/GBP currency movements, had no open trades at year-end, but on average the stand-alone VaR was €5.0 million in 2014 (2013 year-end: €10.0 million).
35 eVaR is defined as the average potential loss above a certain threshold (e.g. 95 per cent) that could be incurred due to adverse fluctuations in interest rates and
foreign exchange rates. The main market risk limits in the Bank are based on eVaR computed at a 95 per cent confidence level over a one-day trading horizon. For enhanced comparability across institutions however, numbers disclosed in this financial report show VaR-based measures scaled up to a 99 per cent confidence level over a 10-trading-day horizon.
36 Additional eVaR measures are monitored, in particular disaggregated eVaR measures to individual market factors (marginal eVaR and VaR sensitivities). For the options portfolio, dedicated options eVaR computations are performed in order to factor in the non-linear behaviour of option instruments.
EBRD Financial Report 2014 45
Total VaR (10 trading days, 99 per cent confidence level, BIS compliant dataset
Equity price risk The Bank has direct exposure to equity risk of €62 million at 31 December 2014 through one Treasury share investment (2013: €63 million). Indirect exposure to equity risk occurs in the form of linked structures that are traded on a back-to-back basis and therefore result in no outright exposure.
C. Operational risk The Bank defines operational risk as all aspects of risk-related exposure other than those falling within the scope of credit, market and liquidity risk. This includes the risk of loss resulting from inadequate or failed internal processes, people and systems or from external events and reputational risk. Examples include:
errors or failures in transaction support systems inadequate disaster recovery planning errors in the mathematical formulae of pricing or hedging models errors in the computation of the fair value of transactions damage to the Bank’s name and reputation, either directly by adverse comments or indirectly errors or omissions in the processing and settlement of transactions, whether in the areas of execution, booking or settlement
or due to inadequate legal documentation errors in the reporting of financial results or failures in controls, such as unidentified limit excesses or unauthorised
trading/trading outside policies dependency on a limited number of key personnel, inadequate or insufficient staff training or skill levels external events.
The Bank has a low tolerance for material losses arising from operational risk exposures. Where material operational risks are identified (that is, those that may lead to material loss if not mitigated), appropriate mitigation and control measures are put in place after a careful weighing of the risk/return trade-off. Maintaining the Bank’s reputation is of paramount importance and reputational risk has therefore been included in the Bank’s definition of operational risk. The Bank will always take all reasonable and practical steps to safeguard its reputation. The Bank’s Operational Risk Policy was updated in 2014 together with revised assessment and incident collation processes which are being rolled out across the Bank.
[TITLE] Total VaR (10 trading days, 99% confidence level, BIS compliant dataset)
Date VaR (€ millions)31/12/2013 10.61 03/01/2014 10.07 10/01/2014 10.21 17/01/2014 10.54 24/01/2014 12.24 31/01/2014 10.59 07/02/2014 10.61 14/02/2014 12.17 21/02/2014 12.68 28/02/2014 12.95 07/03/2014 14.00 14/03/2014 13.62 21/03/2014 16.10 28/03/2014 16.25 04/04/2014 15.37 11/04/2014 13.54 17/04/2014 13.49 25/04/2014 13.67 02/05/2014 13.31 09/05/2014 12.80 16/05/2014 13.46 23/05/2014 11.87 30/05/2014 12.25 06/06/2014 12.34 13/06/2014 16.26 20/06/2014 13.34 27/06/2014 12.42 04/07/2014 12.46 11/07/2014 11.99 18/07/2014 11.42 25/07/2014 12.44 01/08/2014 11.84 08/08/2014 11.57 15/08/2014 11.70 22/08/2014 12.02 29/08/2014 11.36 05/09/2014 11.75 12/09/2014 12.47 19/09/2014 14.23 26/09/2014 14.64 03/10/2014 14.97 10/10/2014 14.65 17/10/2014 14.13 24/10/2014 15.27 31/10/2014 13.03 07/11/2014 14.00 14/11/2014 12.71 21/11/2014 14.11 28/11/2014 12.57 05/12/2014 12.26 12/12/2014 17.91 19/12/2014 18.46 31/12/2014 25.02
‐
5
10
15
20
25
30
VaR (€
millions)
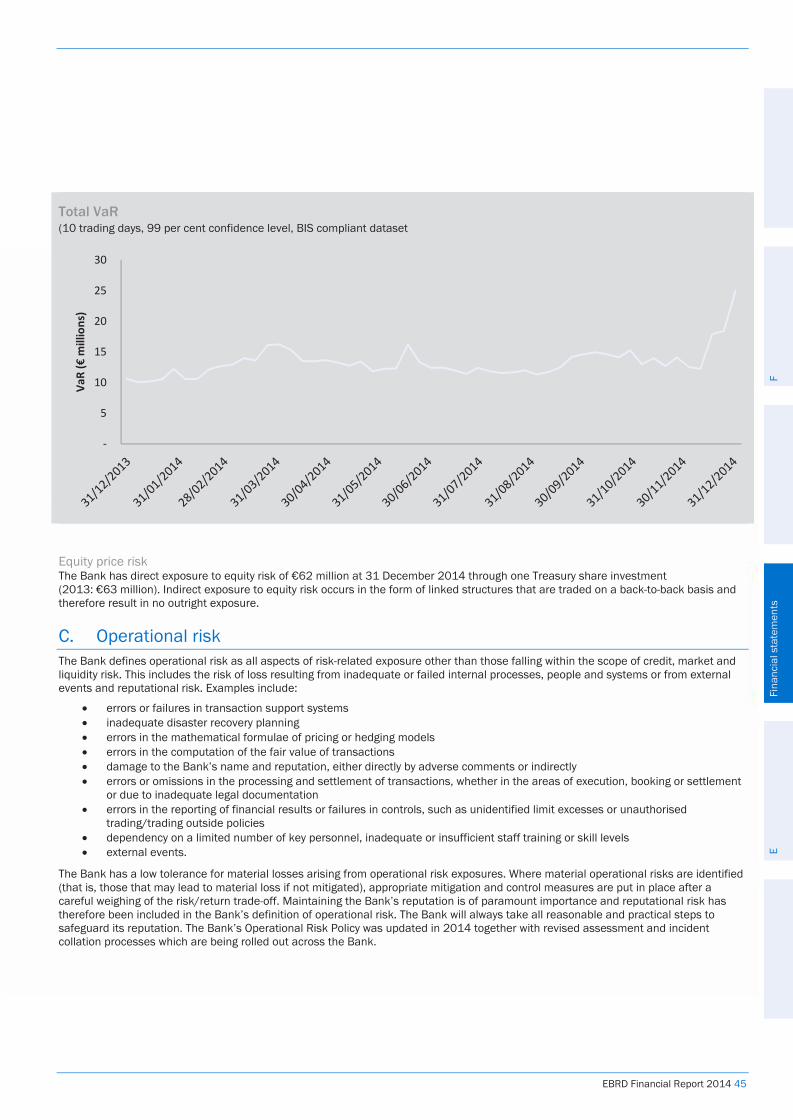
31/12/2013
31/01/2014
28/02/2014
31/03/2014
30/04/2014
31/05/2014
30/06/2014
31/07/2014
31/08/2014
30/09/2014
31/10/2014
30/11/2014
31/12/2014
46 EBRD Financial Report 2014
Within the Bank, there are policies and procedures in place covering all significant aspects of operational risk. These include consideration of the Bank’s high standards of business ethics, its established system of internal controls, checks and balances and segregation of duties. These are supplemented with:
the Bank’s Codes of Conduct disaster recovery/contingency planning the Public Information Policy the Environment and Social Policy client and project integrity due diligence procedures, including anti-money-laundering measures procedures for reporting and investigating suspected staff misconduct the Bank’s Enforcement Policies and Procedures the information security framework the Procurement Policies and Rules
Responsibility for developing the operational risk framework and for monitoring its implementation resides within the Risk Vice Presidency. Risk Management is responsible for the overall framework and structure to support line managers who control and manage operational risk as part of their day-to-day activities. The Bank’s current operational risk framework includes an agreed definition; the categorisation of different loss type events to assess the Bank’s exposure to operational risk; a group of key risk indicators to measure such risks; the identification of specific operational risks through an annual self-assessment exercise; internal loss data collection; and the contribution to, and use of, external loss data. Departments within the Bank identify their operational risk exposures and evaluate the mitigating controls that help to reduce the inherent or pre-control risk. Each risk (both inherent and post-control) is assessed for its impact, according to a defined value scale and the likelihood of occurrence, based on a frequency by time range. Operational risk incident losses or near misses above €5,000 are required to be reported. The collection of such data is primarily to improve the control environment by taking into account the cost of control strengthening and perceived potential future losses. The Bank is a member of the Global Operational Risk Loss Database (GOLD), the external loss database where members “pool” operational risk incident information over a monetary threshold. This provides the Bank with access to a depth of information wider than its own experience and supplements its own analysis on reported internal incidents. GOLD is run as an unincorporated not-for-profit consortium of financial services institutions.
D. Liquidity risk
Liquidity risk management process The Bank’s liquidity policies are set out in its Liquidity Policy Review which is updated annually and approved by the Board of Directors. The policies are designed to ensure that the Bank maintains a prudent level of liquidity, given the risk environment in which it operates, and to support its AAA credit rating. The Bank’s medium term liquidity policy has two elements to it and is based on a multi-year context:
net Treasury liquid assets should be at least 45 per cent of the next three years’ projected net cash requirements, with a 90 per cent operating target; and
gross Treasury liquid assets should be at least 75 per cent of the total of undrawn commitments plus one year’s debt service, with a 100 per cent operating target.
For the purposes of these ratios, all assets managed within the Treasury portfolio are considered to be liquid assets while ‘net’ treasury liquid assets represent gross treasury assets net of short-term debt.37 “One year’s debt service” represents all interest and principal outflows on debt which either matures within one year or could be called within the same period. On this basis the Bank exceeded the minimum requirement on each ratio, both at 31 December 2014 and consistently throughout the year. The average weighted maturity of assets managed by Treasury at 31 December 2014 was 1.5 years (2013: 1.2 years). The Bank’s short-term liquidity policy is based on the principles of the Liquidity Coverage Ratio within the Basel III reform package. The policy requires that the ratio of eligible liquid assets and scheduled cash inflows to cash outflows over both a 30-day and 90-day horizon must be a minimum of 100 per cent. These minimum ratios have been exceeded at 31 December 2014 and consistently throughout the year. In addition to the above, Treasury actively manages the Bank’s liquidity position on a daily basis. The Bank has a proven record of access to funding in the capital markets via its global medium-term note programme and commercial paper facilities. In 2014 the Bank raised €5.2 billion of medium- to long-term debt with an average tenor of 4.2 years (2013: €6.5 billion and 5.1 years). The Bank’s AAA credit rating with a stable outlook was affirmed by the three major rating agencies in the second half of 2014. The Bank’s liquidity policies are subject to independent review by Risk Management and by the Executive Committee prior to the submission for Board approval. 37 For this ratio, short-term debt is debt with a fixed or optional maturity of one year or less at the point of acquisition – that is, it is not debt where the
remaining maturity is one year or less.
EBRD Financial Report 2014 47
As the figures represent undiscounted cash flows, they do not agree to the balance sheet.
Financial liabilities at 31 December 2014
Up to and including 1 month € million
Over 1 month and up to and
including 3 months € million
Over 3 months and up to and
including 1 year
€ million
Over 1 year and up to and including
3 years € million
Over 3 years
€ million Total
€ million Non-derivative cash flows Amounts owed to credit institutions (2,403) (133) - - - (2,536) Debts evidenced by certificates (2,031) (779) (5,902) (13,564) (16,596) (38,872) Other financial liabilities (6) (15) (96) (39) - (156) At 31 December 2014 (4,440) (927) (5,998) (13,603) (16,596) (41,564) Trading derivative cash flows Net settling interest rate derivatives (6) (8) (50) (56) (99) (219) Gross settling interest rate derivatives – outflow (335) (100) (554) (1,185) (289) (2,463) Gross settling interest rate derivatives – inflow 309 75 544 1,188 260 2,376 Foreign exchange derivatives – outflow (57) (510) (502) - - (1,069) Foreign exchange derivatives – inflow 56 478 457 - - 991 Credit derivatives - - - (1) - (1) At 31 December 2014 (33) (65) (105) (54) (128) (385) Hedging derivative cash flows Net settling interest rate derivatives (8) 1 (35) (185) (131) (358) Gross settling interest rate derivatives – outflow (57) (131) (1,747) (3,523) (3,047) (8,505) Gross settling interest rate derivatives – inflow 68 160 1,532 2,903 2,755 7,418 At 31 December 2014 3 30 (250) (805) (423) (1,445) Total financial liabilities at 31 December 2014 (4,470) (962) (6,353) (14,462) (17,147) (43,394) Other financial instruments Undrawn commitments
Financial institutions (2,654) - - - - (2,654) Non-financial institutions (8,877) - - - - (8,877)
At 31 December 2014 (11,531) - - - - (11,531)
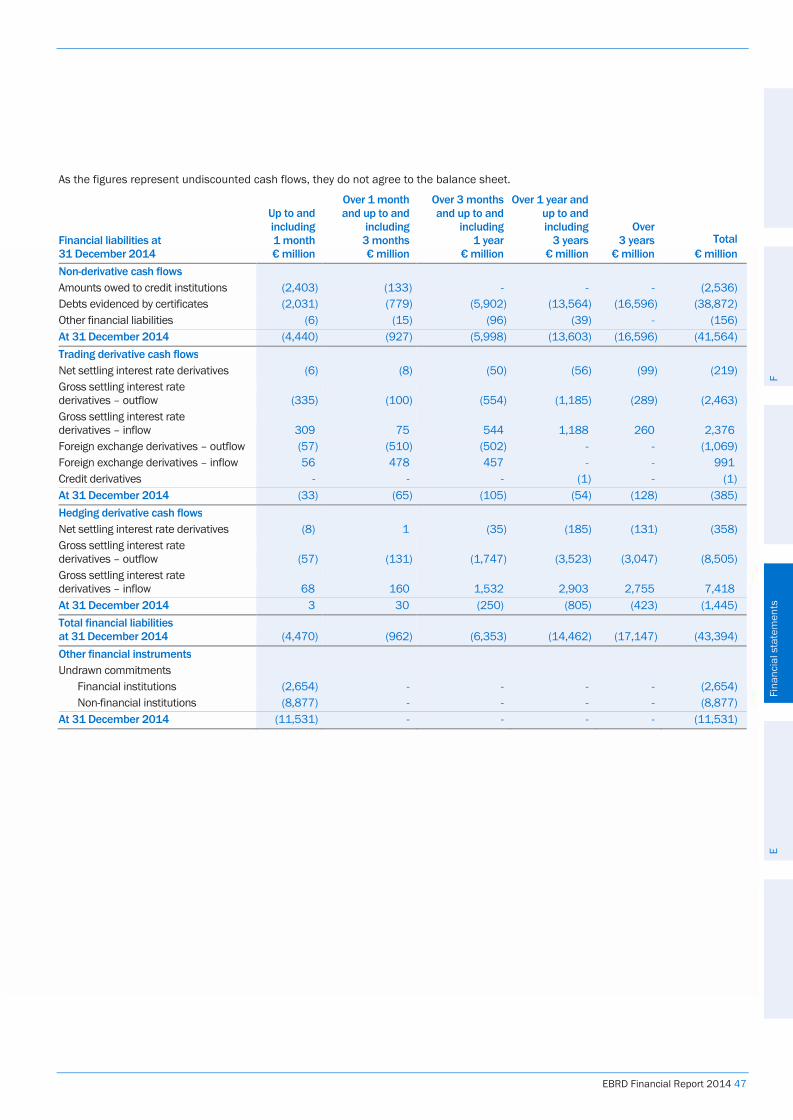
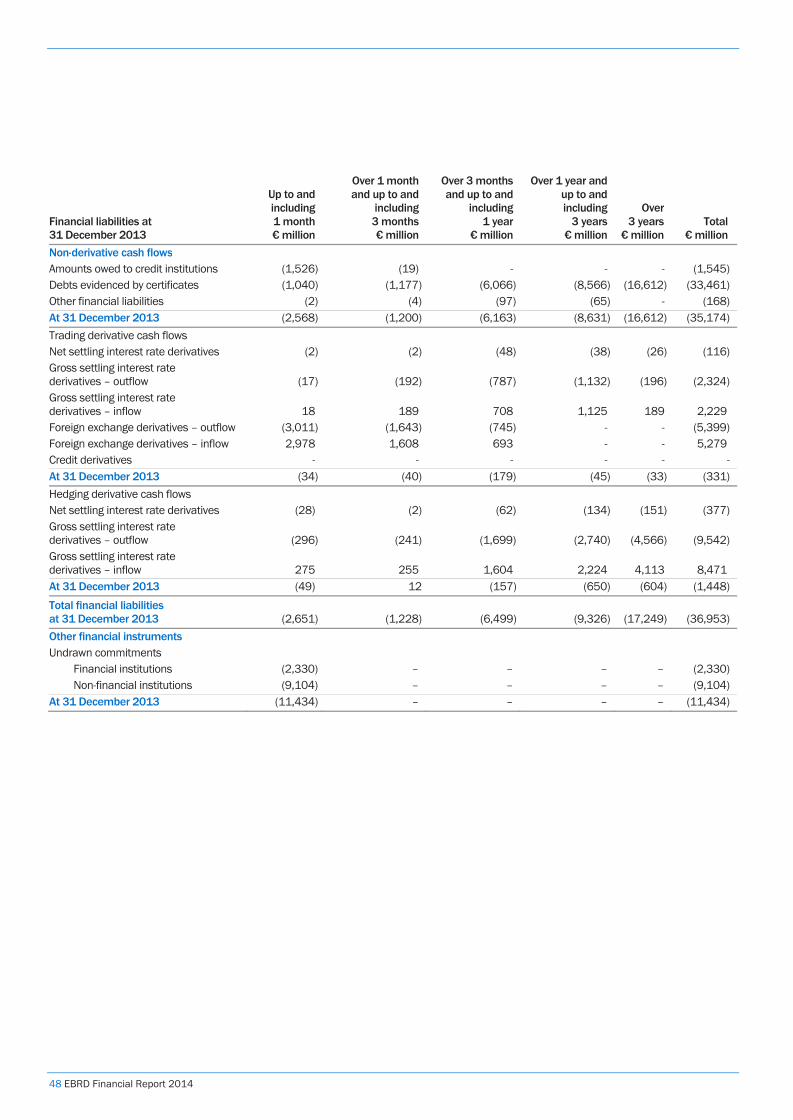
48 EBRD Financial Report 2014
Financial liabilities at 31 December 2013
Up to and including 1 month € million
Over 1 month and up to and
including 3 months € million
Over 3 months and up to and
including 1 year
€ million
Over 1 year and up to and including
3 years € million
Over 3 years
€ million Total
€ million Non-derivative cash flows Amounts owed to credit institutions (1,526) (19) - - - (1,545) Debts evidenced by certificates (1,040) (1,177) (6,066) (8,566) (16,612) (33,461) Other financial liabilities (2) (4) (97) (65) - (168) At 31 December 2013 (2,568) (1,200) (6,163) (8,631) (16,612) (35,174) Trading derivative cash flows Net settling interest rate derivatives (2) (2) (48) (38) (26) (116) Gross settling interest rate derivatives – outflow (17)
(192) (787) (1,132) (196) (2,324)
Gross settling interest rate derivatives – inflow 18
189 708 1,125 189 2,229
Foreign exchange derivatives – outflow (3,011) (1,643) (745) - - (5,399) Foreign exchange derivatives – inflow 2,978 1,608 693 - - 5,279 Credit derivatives - - - - - - At 31 December 2013 (34) (40) (179) (45) (33) (331) Hedging derivative cash flows Net settling interest rate derivatives (28) (2) (62) (134) (151) (377) Gross settling interest rate derivatives – outflow (296) (241) (1,699) (2,740) (4,566) (9,542) Gross settling interest rate derivatives – inflow 275 255 1,604 2,224 4,113 8,471 At 31 December 2013 (49) 12 (157) (650) (604) (1,448) Total financial liabilities at 31 December 2013 (2,651)
(1,228)
(6,499)
(9,326)
(17,249)
(36,953)
Other financial instruments Undrawn commitments
Financial institutions (2,330) – – – – (2,330) Non-financial institutions (9,104) – – – – (9,104)
At 31 December 2013 (11,434) – – – – (11,434)
EBRD Financial Report 2014 49
E. Capital management The Bank’s original authorised share capital was €10.0 billion. Under Resolution No. 59, adopted on 15 April 1996, the Board of Governors approved a doubling of the Bank’s authorised capital stock to €20.0 billion.
In accordance with the requirements of Article 5.3 of the Agreement, the Board of Governors reviews the capital stock of the Bank at intervals of not more than five years. At the Annual Meeting in May 2010 the Bank’s Board of Governors approved the Fourth Capital Resources Review (CRR4) which established the Bank’s strategy for the period 2011 to 2015. This included an analysis of the transition impact and operational activity of the Bank; an assessment of the economic outlook and transition challenges in the region; the formulation of medium-term portfolio development strategy and objectives; and a detailed analysis of the Bank’s projected future financial performance and capital adequacy. The review underlined the fact that the Bank relies on a strong capital base and stressed the need for prudent financial policies supporting conservative provisioning, strong liquidity and long-term profitability.
As a result of the assessment of capital requirements in CRR4, in May 2010 the Board of Governors approved a two-step increase in the authorised capital stock of the Bank: an immediate €1.0 billion increase in authorised paid-in shares (Resolution No. 126), and a €9.0 billion increase in authorised callable capital shares (Resolution No. 128). This amounts to an aggregate increase in the authorised capital stock of the Bank of €10.0 billion (collectively referred to as the second capital increase). The increase in callable capital became effective on 20 April 2011 when subscriptions were received for at least 50 per cent of the newly authorised callable capital. The callable shares are subject to redemption in accordance with the terms of Resolution No. 128. At 31 December 2014, €8.9 billion of the callable capital increase had been subscribed (2013: €8.9 billion).
The Bank does not have any other classes of capital.
The Bank’s capital usage is guided by statutory and financial policy parameters. Article 12 of the Agreement establishes a 1:1 gearing ratio which limits the total amount of outstanding loans, share investments and guarantees made by the Bank in the countries in which it invests to the total amount of the Bank’s unimpaired subscribed capital, reserves and surpluses. This capital base incorporates unimpaired subscribed capital, the unrestricted general reserves, loan loss reserve, special reserve and adjustments for accumulated specific and general loan impairment provisions on Banking exposures and unrealised equity losses. The capital base for these purposes amounted to €39.2 billion38 at 31 December 2014 after 2014 net income allocation decisions (2013: €38.7 billion).
The Bank interprets the gearing ratio on a ‘disbursed Banking assets’ or ‘operating assets’ basis. At 31 December 2014, the Bank’s gearing ratio on an aggregated basis was 69 per cent (2013: 68 per cent). Article 12 also limits the total amount of disbursed share investments to the total amount of the Bank's unimpaired paid-in subscribed capital, surpluses and general reserve. No capital utilisation limits were breached during the year (2013: none).
The Bank’s statutory measure of capital adequacy under the gearing ratio is supplemented by a risk-based prudential capital adequacy limit under its Economic Capital Policy.
The Bank defines required economic capital as the potential capital losses – both expected and unexpected – it may incur based on probabilities consistent with the Bank’s AAA credit rating. The main risk categories assessed under the economic capital framework are credit risk, market risk and operational risk, and the total risk is managed within an available economic capital base that excludes callable capital, while maintaining a prudent capital buffer.
One of the main objectives of the Economic Capital Policy is to manage the Bank’s capital within a medium-term planning framework, providing a consistent measurement of capital headroom over time. The Bank’s objective is to prevent the need to call on subscribed callable capital and to use only available risk capital including paid-in capital, reserves and provisions. The available economic capital managed by the Bank consists of paid-in capital, the unrestricted general reserves, loan loss reserve, special reserve and adjustments for accumulated general loan impairment provisions and unrealised equity losses, assessed at the period end. The capital base amounted to €15.1 billion at 31 December 2014 after 2014 net income allocation decisions (2013: €14.9 billion). At 31 December 2014 the ratio of required economic capital to available economic capital was 80 per cent (2013: 72 per cent) compared with a policy threshold for this ratio of 90 per cent. The Bank’s risk-based capital requirement under this policy is managed alongside the Bank’s statutory capital constraint. The Bank’s prudent approach to capital management is reflected in the key financial ratios presented on page 7. At 31 December 2014, the ratio of members’ equity to total assets was 27 per cent (2013: 30 per cent) and the ratio of members’ equity to Banking assets was 58 per cent (2013: 59 per cent).
38 This capital base incorporates subscribed capital (paid-in and callable), reserves and retained earnings, as well as provisions (as this capital base is
compared with operating assets prior to provisions). Deductions are made to exclude revaluation reserves related to Banking assets (as operating assets are considered at cost) and for net income allocations other than to the SEMED ISF (as the associated investments are included in operating assets).
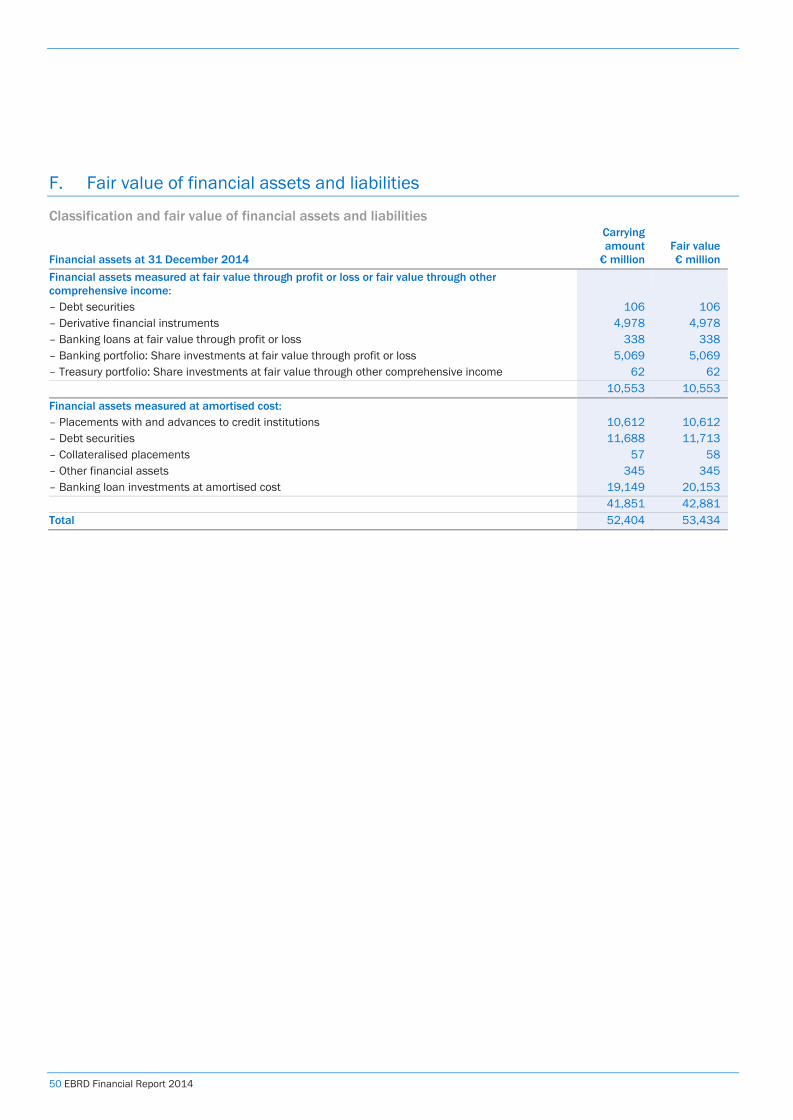
50 EBRD Financial Report 2014
F. Fair value of financial assets and liabilities
Classification and fair value of financial assets and liabilities
Financial assets at 31 December 2014
Carrying amount
€ million Fair value € million
Financial assets measured at fair value through profit or loss or fair value through other comprehensive income: – Debt securities 106 106 – Derivative financial instruments 4,978 4,978 – Banking loans at fair value through profit or loss 338 338 – Banking portfolio: Share investments at fair value through profit or loss 5,069 5,069 – Treasury portfolio: Share investments at fair value through other comprehensive income 62 62 10,553 10,553 Financial assets measured at amortised cost: – Placements with and advances to credit institutions 10,612 10,612 – Debt securities 11,688 11,713 – Collateralised placements 57 58 – Other financial assets 345 345 – Banking loan investments at amortised cost 19,149 20,153 41,851 42,881 Total 52,404 53,434
EBRD Financial Report 2014 51
Financial assets at 31 December 2013
Carrying amount
€ million Fair value € million
Financial assets measured at fair value through profit or loss or fair value through other comprehensive income: – Debt securities 139 139 – Derivative financial instruments 3,094 3,094 – Banking loans at fair value through profit or loss 223 223 – Banking portfolio: Share investments at fair value through profit or loss 6,490 6,490 – Treasury portfolio: Share investments at fair value through other comprehensive income 63 63 10,009 10,009 Financial assets measured at amortised cost: – Placements with and advances to credit institutions 7,266 7,266 – Debt securities 12,398 12,384 – Collateralised placements 247 248 – Other financial assets 314 314 – Banking loan investments at amortised cost 18,641 19,504 38,866 39,716 Total 48,875 49,725
Financial liabilities at 31 December 2014
Held for trading
€ million
At fair value through
profit or loss € million
Derivatives held for hedging
purposes € million
Financial liabilities at
amortised cost
€ million
Carrying amount
€ million Fair value € million
Amounts owed to credit institutions - - - (2,534) (2,534) (2,534) Debts evidenced by certificates - - - (32,922) (32,922) (32,818) Derivative financial instruments (359) (81) (1,990) - (2,430) (2,430) Other financial liabilities - - - (452) (452) (452) Total financial liabilities (359) (81) (1,990) (35,908) (38,338) (38,234)
IFRS 13 specifies classification of fair values on the basis of a three-level hierarchy of valuation methodologies. The classifications are determined based on whether the inputs used in the measurement of fair values are observable or unobservable. These inputs have created the following fair value hierarchy:
Level 1 – Quoted prices in active markets for identical assets or liabilities. This level includes listed share investments on stock exchanges.
Level 2 – Inputs other than quoted prices included within Level 1 that are observable for the asset or liability, either directly (that is, as prices) or indirectly (that is, derived from prices). This level includes debt securities and most derivative products. The sources of inputs include prices available from screen-based services such as SuperDerivatives and Bloomberg, broker quotes and observable market data such as interest rates and foreign exchange rates which are used in deriving the valuations of derivative products.
Level 3 – Inputs for the asset or liability that are not based on observable market data (unobservable inputs). This level includes share investments and debt securities or derivative products for which not all market data is observable.
Financial liabilities at 31 December 2013
Held for trading
€ million
At fair value through
profit or loss € million
Derivatives held for hedging
purposes € million
Financial liabilities at
amortised cost
€ million
Carrying amount
€ million Fair value € million
Amounts owed to credit institutions - - - (1,543) (1,543) (1,543) Debts evidenced by certificates - - - (29,659) (29,659) (29,506) Derivative financial instruments (261) (97) (2,117) - (2,475) (2,475) Other financial liabilities - - - (405) (405) (405) Total financial liabilities (261) (97) (2,117) (31,607) (34,082) (33,929)
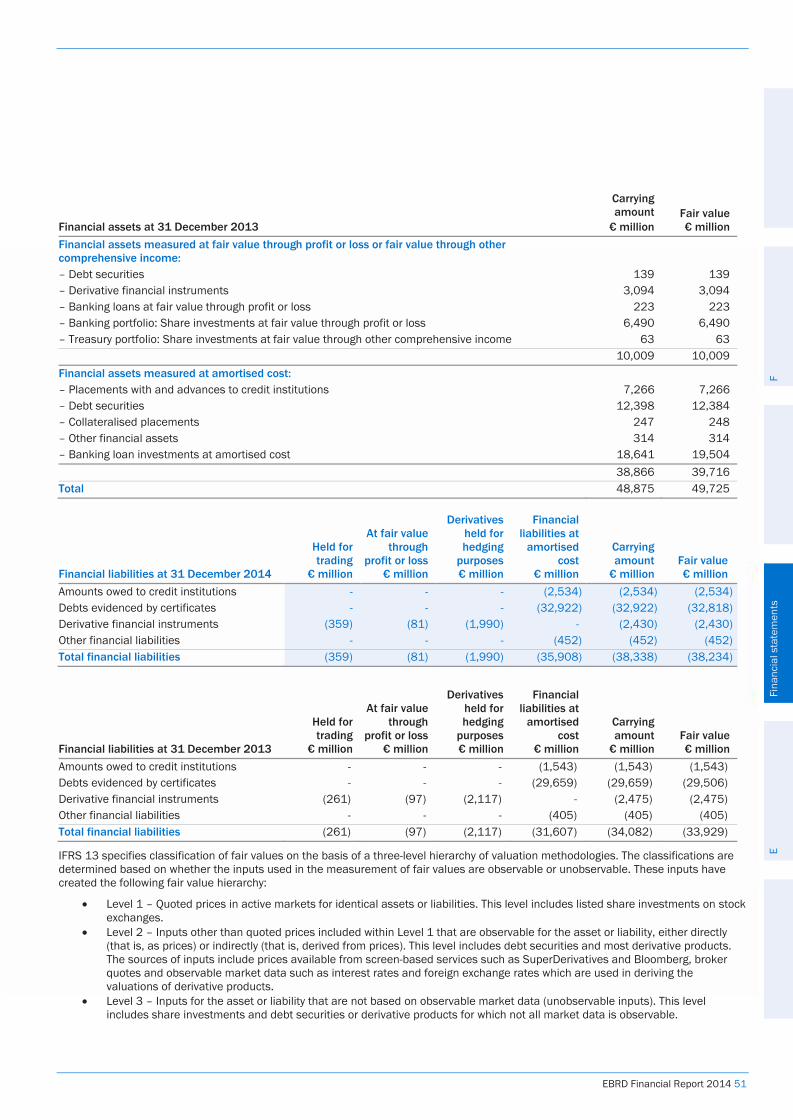
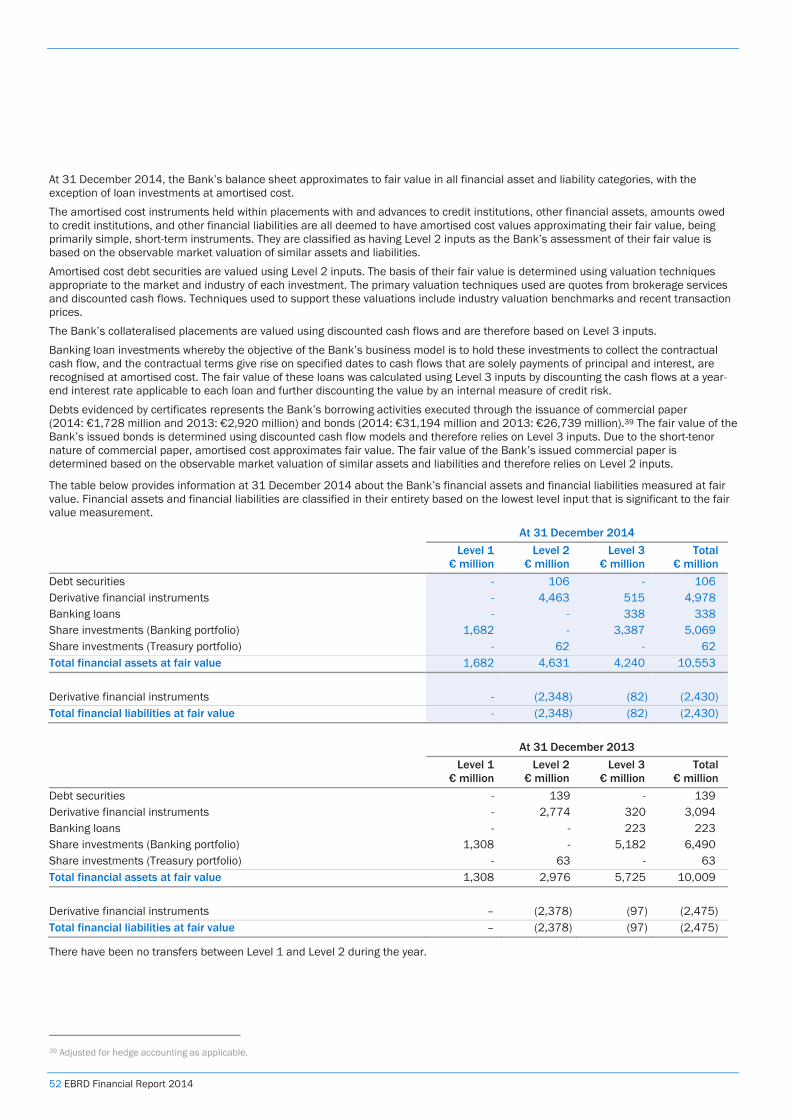
52 EBRD Financial Report 2014
At 31 December 2014, the Bank’s balance sheet approximates to fair value in all financial asset and liability categories, with the exception of loan investments at amortised cost. The amortised cost instruments held within placements with and advances to credit institutions, other financial assets, amounts owed to credit institutions, and other financial liabilities are all deemed to have amortised cost values approximating their fair value, being primarily simple, short-term instruments. They are classified as having Level 2 inputs as the Bank’s assessment of their fair value is based on the observable market valuation of similar assets and liabilities. Amortised cost debt securities are valued using Level 2 inputs. The basis of their fair value is determined using valuation techniques appropriate to the market and industry of each investment. The primary valuation techniques used are quotes from brokerage services and discounted cash flows. Techniques used to support these valuations include industry valuation benchmarks and recent transaction prices. The Bank’s collateralised placements are valued using discounted cash flows and are therefore based on Level 3 inputs. Banking loan investments whereby the objective of the Bank’s business model is to hold these investments to collect the contractual cash flow, and the contractual terms give rise on specified dates to cash flows that are solely payments of principal and interest, are recognised at amortised cost. The fair value of these loans was calculated using Level 3 inputs by discounting the cash flows at a year-end interest rate applicable to each loan and further discounting the value by an internal measure of credit risk. Debts evidenced by certificates represents the Bank’s borrowing activities executed through the issuance of commercial paper (2014: €1,728 million and 2013: €2,920 million) and bonds (2014: €31,194 million and 2013: €26,739 million).39 The fair value of the Bank’s issued bonds is determined using discounted cash flow models and therefore relies on Level 3 inputs. Due to the short-tenor nature of commercial paper, amortised cost approximates fair value. The fair value of the Bank’s issued commercial paper is determined based on the observable market valuation of similar assets and liabilities and therefore relies on Level 2 inputs.
The table below provides information at 31 December 2014 about the Bank’s financial assets and financial liabilities measured at fair value. Financial assets and financial liabilities are classified in their entirety based on the lowest level input that is significant to the fair value measurement.
At 31 December 2014
Level 1
€ million Level 2
€ million Level 3
€ million Total
€ million Debt securities - 106 - 106 Derivative financial instruments - 4,463 515 4,978 Banking loans - - 338 338 Share investments (Banking portfolio) 1,682 - 3,387 5,069 Share investments (Treasury portfolio) - 62 - 62 Total financial assets at fair value 1,682 4,631 4,240 10,553 Derivative financial instruments - (2,348) (82) (2,430) Total financial liabilities at fair value - (2,348) (82) (2,430)
At 31 December 2013
Level 1
€ million Level 2
€ million Level 3
€ million Total
€ million Debt securities - 139 - 139 Derivative financial instruments - 2,774 320 3,094 Banking loans - - 223 223 Share investments (Banking portfolio) 1,308 - 5,182 6,490 Share investments (Treasury portfolio) - 63 - 63 Total financial assets at fair value 1,308 2,976 5,725 10,009 Derivative financial instruments – (2,378) (97) (2,475) Total financial liabilities at fair value – (2,378) (97) (2,475)
There have been no transfers between Level 1 and Level 2 during the year.
39 Adjusted for hedge accounting as applicable.
EBRD Financial Report 2014 53
The table below provides a reconciliation of the fair values of the Bank’s Level 3 financial assets and financial liabilities for the year ended 31 December 2014.
Level 3 financial assets and financial liabilities
Year ended 31 December 2014
Debt securities € million
Derivative financial
instruments € million
Banking loans
€ million
Banking share investments €
million Total assets
€ million
Derivative financial
instruments€ million
Total liabilities € million
Balance at 31 December 2013 - 320 223 5,182 5,725 (97) (97) Total gains/(losses) for the year ended 31 December 2014 in: Net profit/(loss) - 215 (58) (1,047) (890) 15 15 Purchases/issues - - 248 594 842 - - Sales/settlements - (20) (72) (624) (716) - - Write offs - - (3) - (3) - - Transfers out of Level 3 - - - (718) (718) - - Balance at 31 December 2014 - 515 338 3,387 4,240 (82) (82) Total gains/(losses) for the period included in net profit from assets and liabilities held at 31 December 2014 - 305 (58) (910) (663) (1) (1)
Transfers into and out of Level 3 for Banking share investments relate to listed investments that switch from/(to) an actively traded market. Transfers into and out of Level 3 for derivative financial instruments relate to whether a model used to value a derivative is based on observable market inputs or otherwise.
Level 3 financial assets and financial liabilities
Year ended 31 December 2013
Debt securities € million
Derivative financial
instruments € million
Banking loans
€ million
Banking share
investments € million
Total assets € million
Derivative financial
instruments € million
Total liabilities € million
Balance at 31 December 2012
44 415 247 5,555 6,261 (60) (60)
Total gains/(losses) for the year ended 31 December 2013 in:
Net profit/(loss) 4 (95) (6) 95 (2) (37) (37) Purchases/issues - - 67 446 513 - - Sales/settlements (48) - (85) (714) (847) - - Transfers in to Level 3 - - - (200) (200) - - Balance at 31 December 2013 - 320 223 5,182 5,725 (97) (97) Total gains/(losses) for the period included in net profit for assets and liabilities held at 31 December 2013 - 85 (18) 124 191 (40) (40)
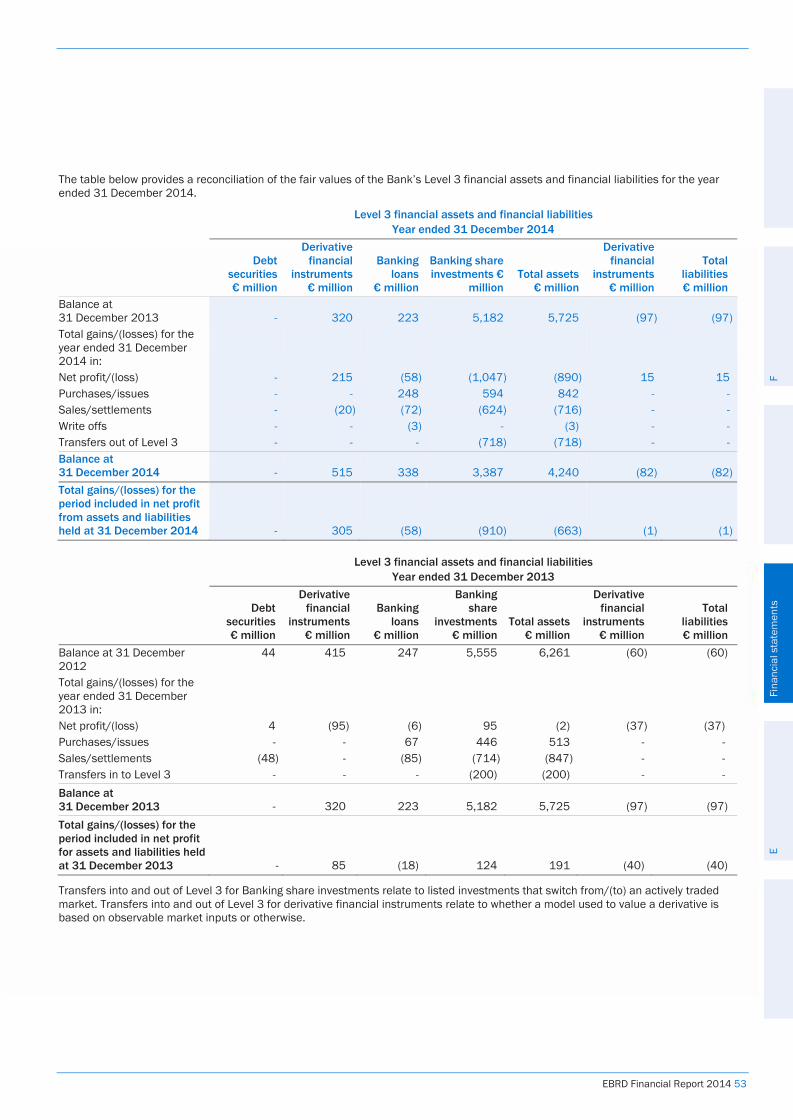
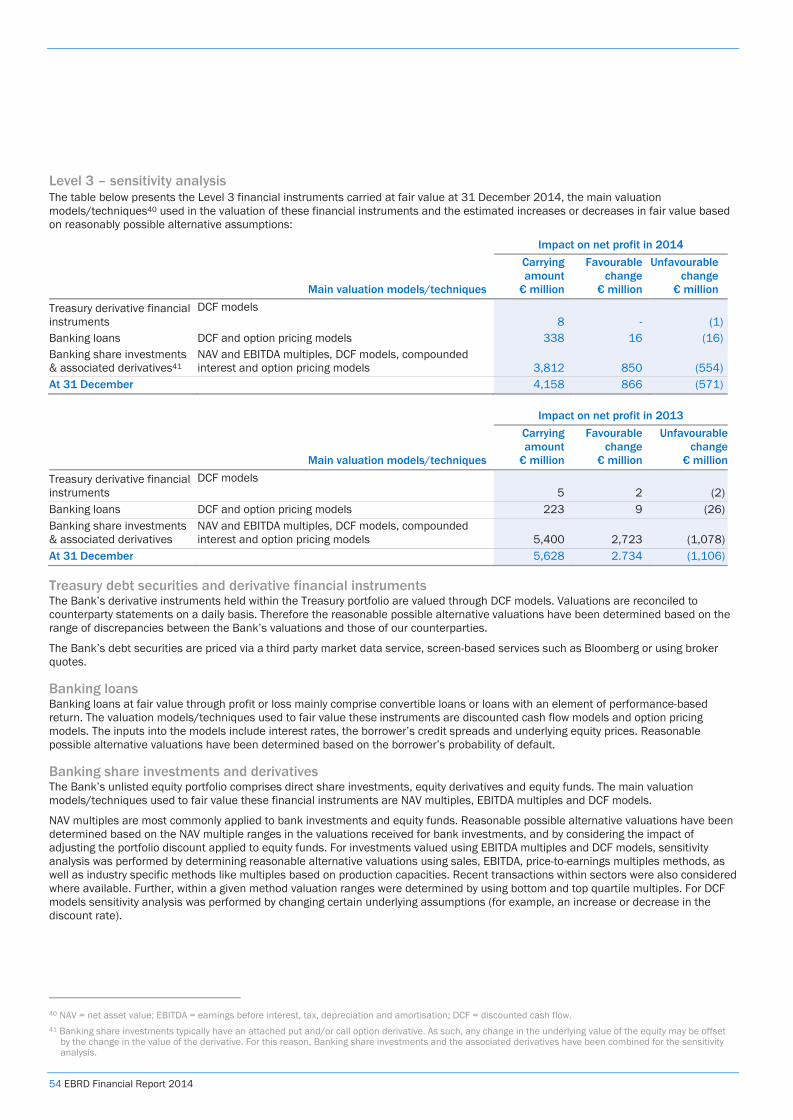
54 EBRD Financial Report 2014
Level 3 – sensitivity analysis The table below presents the Level 3 financial instruments carried at fair value at 31 December 2014, the main valuation models/techniques40 used in the valuation of these financial instruments and the estimated increases or decreases in fair value based on reasonably possible alternative assumptions:
Impact on net profit in 2014
Main valuation models/techniques
Carrying amount
€ million
Favourable change
€ million
Unfavourable change
€ million
Treasury derivative financial instruments
DCF models 8 - (1)
Banking loans DCF and option pricing models 338 16 (16) Banking share investments & associated derivatives41
NAV and EBITDA multiples, DCF models, compounded interest and option pricing models 3,812 850 (554)
At 31 December 4,158 866 (571)
Impact on net profit in 2013
Main valuation models/techniques
Carrying amount
€ million
Favourable change
€ million
Unfavourablechange
€ million
Treasury derivative financial instruments
DCF models 5 2 (2)
Banking loans DCF and option pricing models 223 9 (26) Banking share investments & associated derivatives
NAV and EBITDA multiples, DCF models, compounded interest and option pricing models 5,400 2,723 (1,078)
At 31 December 5,628 2.734 (1,106)
Treasury debt securities and derivative financial instruments The Bank’s derivative instruments held within the Treasury portfolio are valued through DCF models. Valuations are reconciled to counterparty statements on a daily basis. Therefore the reasonable possible alternative valuations have been determined based on the range of discrepancies between the Bank’s valuations and those of our counterparties.
The Bank’s debt securities are priced via a third party market data service, screen-based services such as Bloomberg or using broker quotes.
Banking loans Banking loans at fair value through profit or loss mainly comprise convertible loans or loans with an element of performance-based return. The valuation models/techniques used to fair value these instruments are discounted cash flow models and option pricing models. The inputs into the models include interest rates, the borrower’s credit spreads and underlying equity prices. Reasonable possible alternative valuations have been determined based on the borrower’s probability of default.
Banking share investments and derivatives The Bank’s unlisted equity portfolio comprises direct share investments, equity derivatives and equity funds. The main valuation models/techniques used to fair value these financial instruments are NAV multiples, EBITDA multiples and DCF models.
NAV multiples are most commonly applied to bank investments and equity funds. Reasonable possible alternative valuations have been determined based on the NAV multiple ranges in the valuations received for bank investments, and by considering the impact of adjusting the portfolio discount applied to equity funds. For investments valued using EBITDA multiples and DCF models, sensitivity analysis was performed by determining reasonable alternative valuations using sales, EBITDA, price-to-earnings multiples methods, as well as industry specific methods like multiples based on production capacities. Recent transactions within sectors were also considered where available. Further, within a given method valuation ranges were determined by using bottom and top quartile multiples. For DCF models sensitivity analysis was performed by changing certain underlying assumptions (for example, an increase or decrease in the discount rate).
40 NAV = net asset value; EBITDA = earnings before interest, tax, depreciation and amortisation; DCF = discounted cash flow. 41 Banking share investments typically have an attached put and/or call option derivative. As such, any change in the underlying value of the equity may be offset
by the change in the value of the derivative. For this reason, Banking share investments and the associated derivatives have been combined for the sensitivity analysis.
Notes to the financial statements
EBRD Financial Report 2014 55
1. Establishment of the Bank i Agreement Establishing the Bank The European Bank for Reconstruction and Development (the Bank), whose principal office is located in London, is an international organisation formed under the Agreement Establishing the Bank dated 29 May 1990 (the Agreement). At 31 December 2014, the Bank’s members comprised 64 countries, together with the European Union and the European Investment Bank.
ii Headquarters Agreement The status, privileges and immunities of the Bank and persons connected with the Bank in the United Kingdom are confirmed and supplemented in the Headquarters Agreement between the Government of the United Kingdom of Great Britain and Northern Ireland and the Bank (Headquarters Agreement). The Headquarters Agreement was signed in London at the start of the Bank’s operations on 15 April 1991.
2. Segment information The Bank’s activities are primarily Banking and Treasury. Banking activities represent investments in projects that, in accordance with the Agreement, are made for the purpose of assisting the countries in which the Bank invests in their transition to a market economy, while applying sound banking principles. The main investment products are loans, share investments and guarantees. Treasury activities include raising debt finance, investing surplus liquidity, managing the Bank’s foreign exchange and interest rate risks and assisting clients in asset and liability management matters.
Information on the financial performance of Banking and Treasury operations is prepared regularly and provided to the chief operating decision-maker. On this basis, Banking and Treasury operations have been identified as the operating segments. Operating segments are reported in a manner consistent with the internal reporting provided to the chief operating decision-maker. The chief operating decision-maker, who is responsible for allocating resources and assessing the performance of the operating segments, is the President.
Segment performance The President assesses the performance of the operating segments based on the net profit for the year, which is measured in a manner consistent with the financial statements. The segment information provided to the President for the operating segments for the year ended 31 December 2014 and 31 December 2013 is as follows:
42 Interest expense and similar charges and allocation of the return on capital equates to the interest expense and similar charges on the face of the income
statement.
Banking 2014
€ million
Treasury 2014
€ million
Aggregated 2014
€ million
Banking 2013
€ million
Treasury
2013 € million
Aggregated 2013
€ million Interest income 1,043 109 1,152 998 99 1,097 Other (expense)/income (615) 11 (604) 510 95 605 Total segment revenue 428 120 548 1,508 194 1,702 Less interest expense and similar charges42 (299) 178 (121) (278) 163 (115) Net interest expense on derivatives - (199) (199) - (162) (162) Allocation of the return on capital 28 3 31 23 2 25 Less general administrative expenses (309) (20) (329) (300) (19) (319) Less depreciation and amortisation (24) (2) (26) (24) (2) (26) Segment result before provisions and hedges (176) 80 (96) 929 176 1,105 Fair value movement on non-qualifying and ineffective hedges - (34) (34) - 45 45 Provisions for impairment of loan investments and guarantees (438) - (438) (138) - (138) Net (loss)/profit for the year (614) 46 (568) 791 221 1,012 Transfers of net income approved by the Board of Governors (155) (90) Net (loss)/profit after transfers approved by the Board of Governors (723) 922 Segment assets Total assets 25,367 27,120 52,487 25,919 23,039 48,958 Segment liabilities Total liabilities 254 38,084 38,338 261 33,821 34,082
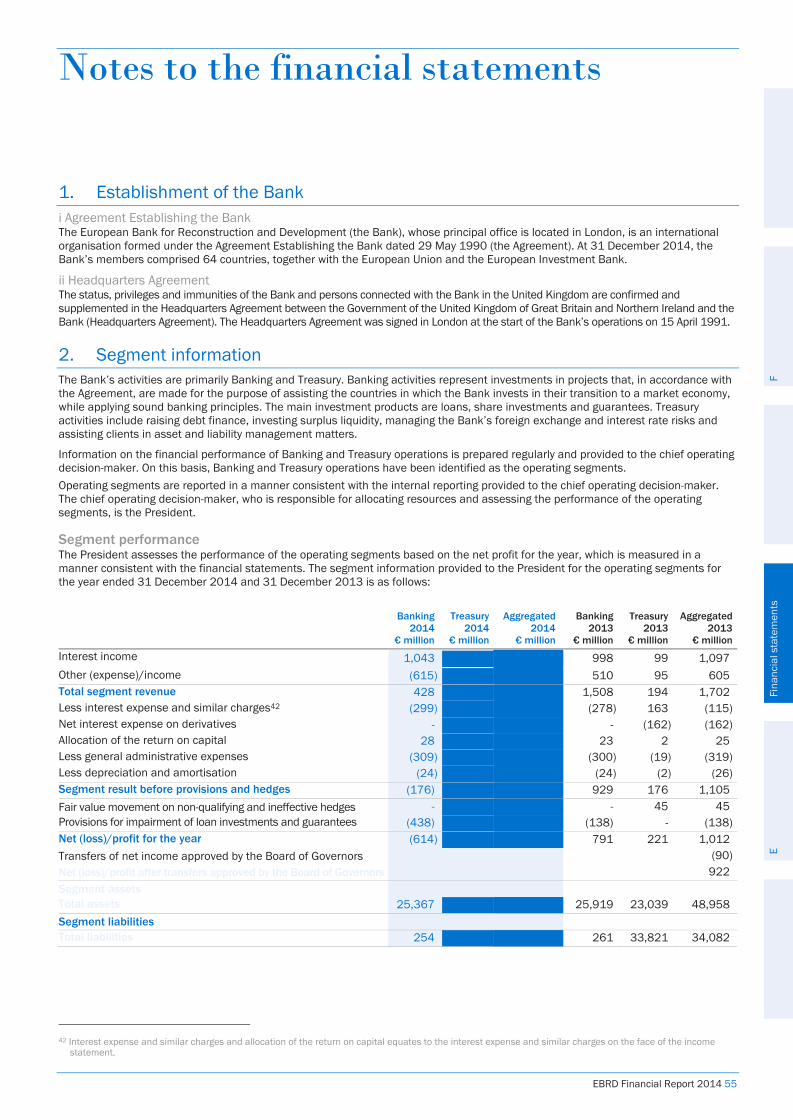

56 EBRD Financial Report 2014
Segment revenues – Geographic The Bank’s activities are divided into six regions for internal management purposes.
Revenues are attributed to countries on the basis of the location in which a project operates.
3. Net interest income
2014
€ million 2013
€ million Interest and similar income
Interest income accrued on impaired financial assets during 2014 was €13 million (2013: €15 million).46
43 Advanced countries are Croatia, Czech Republic, Estonia, Hungary, Latvia, Lithuania, Poland, Slovak Republic and Slovenia. 44 Early/Intermediate countries are Albania, Armenia, Azerbaijan, Belarus, Bosnia and Herzegovina, Bulgaria, Cyprus, Former Yugoslav Republic of Macedonia,
Georgia, Kazakhstan, Kosovo, Kyrgyz Republic, Moldova, Mongolia, Montenegro, Romania, Serbia, Tajikistan, Turkmenistan, Ukraine and Uzbekistan. 45 Member countries of the Organisation for Economic Co-operation and Development. www.oecd.org/about/membersandpartners/ 46 This interest income equates to the unwinding of the discount on expected future cash flows from impaired financial assets.
Segment revenue
2014 € million
Segment revenue
2013 € million
Advanced countries43 175 403 Early/Intermediate countries44 443 530 Russia (313) 458 SEMED 12 7 Turkey 111 110 OECD45 120 194 Total 548 1,702
Banking loans at amortised cost 1,043 998 Debt securities 64 63 Collateralised placements 1 2 Reverse repurchase agreements 5 4 Cash and short-term funds 39 26 Other 0 4 Interest and similar income 1,152 1,097 Interest expense and similar charges Debts evidenced by certificates (83) (85) Amounts owed to credit institutions (6) (4) Other (1) (1) Interest expense and similar charges (90) (90) Net interest expense on derivatives (199) (162) Net interest income 863 845
EBRD Financial Report 2014 57
4. Net fee and commission income The main components of net fee and commission income are as follows:
2014
€ million 2013
€ million Front end and commitment charges 1 - Trade finance fees 9 10 Administration fees 3 4 Syndication and agency fees 3 4 Prepayment fees 3 5 Equity fees (6) (1) Other 1 3 Net fee and commission income 14 25
Front-end and commitment fees of €101 million (2013: €94 million) received in 2014, together with related direct costs of €5 million (2013: €6 million), have been deferred on the balance sheet. They will be recognised in interest income over the period from disbursement to repayment of the related loan, in accordance with IAS 18. In 2014, €140 million (2013: €122 million) of previously deferred fees and direct costs were recognised in interest income.
5. Net (losses)/gains from share investments at fair value through profit or loss
On exit of an equity investment, the cumulative gain/loss is realised with a corresponding reversal of the cumulative unrealised gain/loss recorded prior to the exit.
6. Net gains from loans at fair value through profit or loss
7. Net gains/(losses) from Treasury assets held at amortised cost
During the year the Bank sold €3.1 billion of debt securities held at amortised cost (2013: €1.4 billion).
2014
€ million 2013
€ million Net realised gains from share investments and equity related derivatives 281 439 Net unrealised losses from share investments and equity related derivatives (1,029) (63) Net (losses)/gains from share investments at fair value through profit or loss (748) 376
2014
€ million 2013
€ million Net realised gains from loans at fair value through profit or loss - 2 Loan write-off (3) - Net unrealised gains/(losses) from changes in fair value 7 (1) Net unrealised foreign exchange losses (1) - Net gains from loans at fair value through profit or loss 3 1
2014
€ million 2013
€ million Net realised gains/(losses) from debt securities at amortised cost 7 (9) Recoveries of previously recognised impairments on debt securities - 2 Net gains/(losses) from Treasury assets held at amortised cost 7 (7)
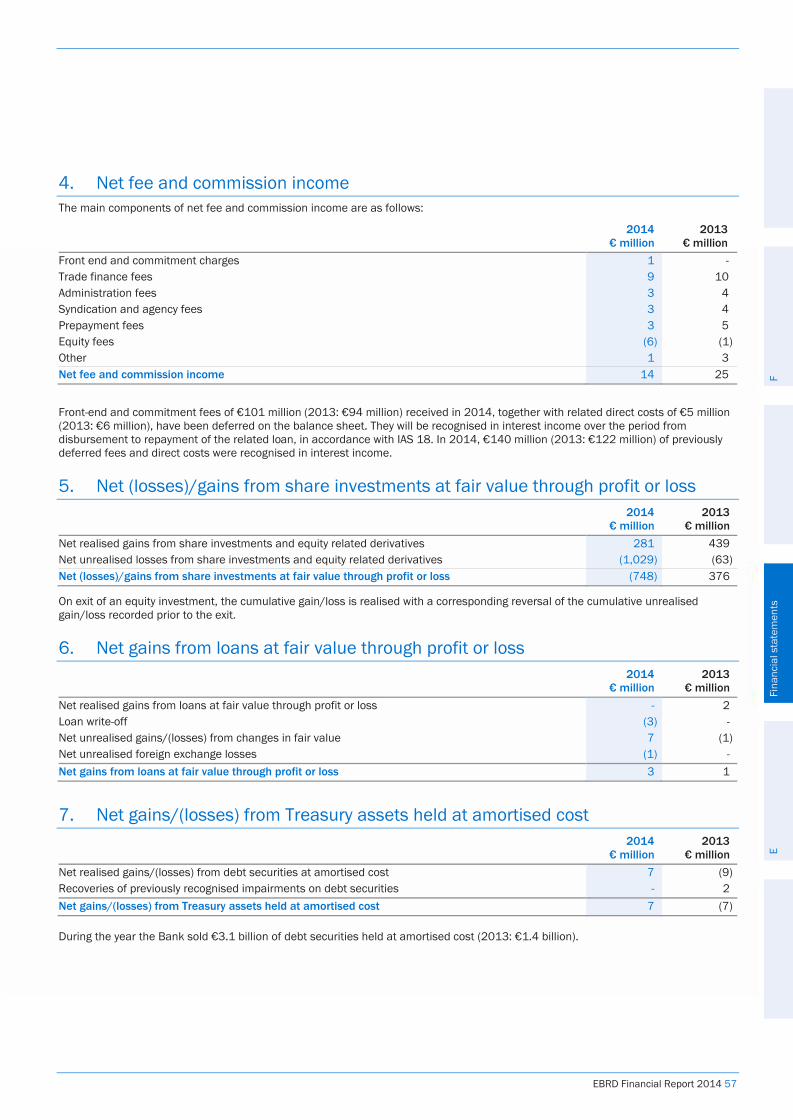
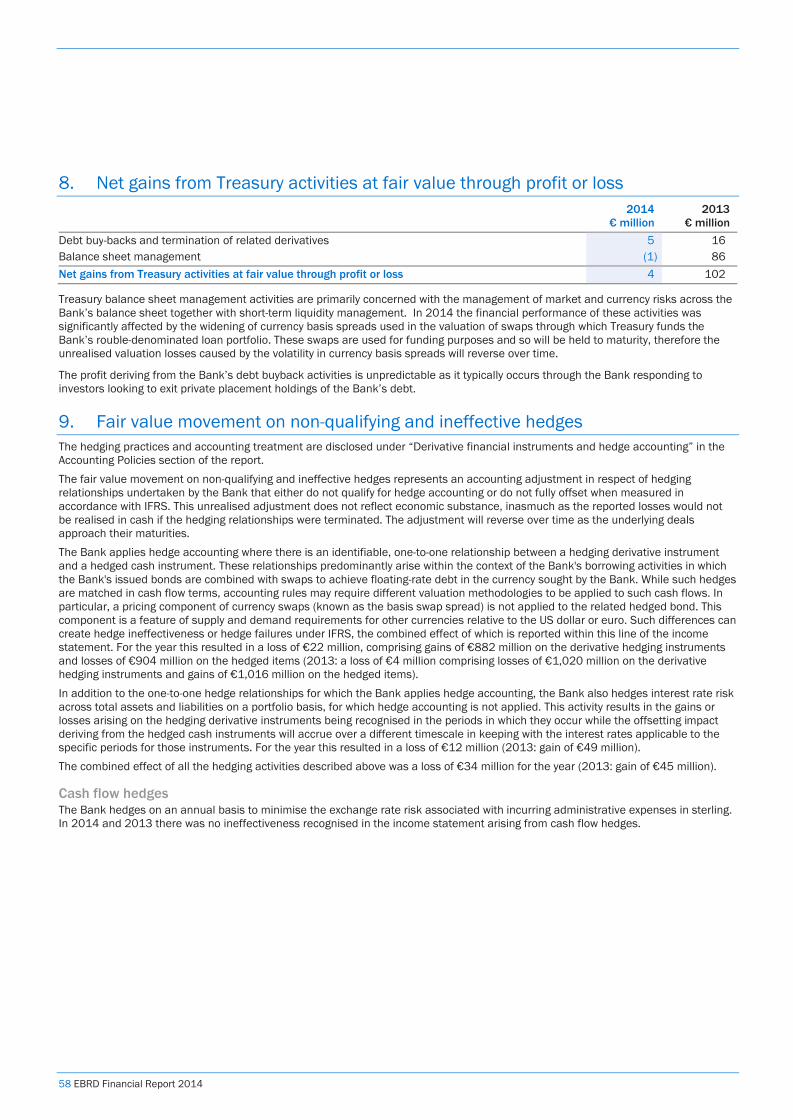
58 EBRD Financial Report 2014
8. Net gains from Treasury activities at fair value through profit or loss
Treasury balance sheet management activities are primarily concerned with the management of market and currency risks across the Bank’s balance sheet together with short-term liquidity management. In 2014 the financial performance of these activities was significantly affected by the widening of currency basis spreads used in the valuation of swaps through which Treasury funds the Bank’s rouble-denominated loan portfolio. These swaps are used for funding purposes and so will be held to maturity, therefore the unrealised valuation losses caused by the volatility in currency basis spreads will reverse over time.
The profit deriving from the Bank’s debt buyback activities is unpredictable as it typically occurs through the Bank responding to investors looking to exit private placement holdings of the Bank’s debt.
9. Fair value movement on non-qualifying and ineffective hedges The hedging practices and accounting treatment are disclosed under “Derivative financial instruments and hedge accounting” in the Accounting Policies section of the report. The fair value movement on non-qualifying and ineffective hedges represents an accounting adjustment in respect of hedging relationships undertaken by the Bank that either do not qualify for hedge accounting or do not fully offset when measured in accordance with IFRS. This unrealised adjustment does not reflect economic substance, inasmuch as the reported losses would not be realised in cash if the hedging relationships were terminated. The adjustment will reverse over time as the underlying deals approach their maturities. The Bank applies hedge accounting where there is an identifiable, one-to-one relationship between a hedging derivative instrument and a hedged cash instrument. These relationships predominantly arise within the context of the Bank's borrowing activities in which the Bank's issued bonds are combined with swaps to achieve floating-rate debt in the currency sought by the Bank. While such hedges are matched in cash flow terms, accounting rules may require different valuation methodologies to be applied to such cash flows. In particular, a pricing component of currency swaps (known as the basis swap spread) is not applied to the related hedged bond. This component is a feature of supply and demand requirements for other currencies relative to the US dollar or euro. Such differences can create hedge ineffectiveness or hedge failures under IFRS, the combined effect of which is reported within this line of the income statement. For the year this resulted in a loss of €22 million, comprising gains of €882 million on the derivative hedging instruments and losses of €904 million on the hedged items (2013: a loss of €4 million comprising losses of €1,020 million on the derivative hedging instruments and gains of €1,016 million on the hedged items). In addition to the one-to-one hedge relationships for which the Bank applies hedge accounting, the Bank also hedges interest rate risk across total assets and liabilities on a portfolio basis, for which hedge accounting is not applied. This activity results in the gains or losses arising on the hedging derivative instruments being recognised in the periods in which they occur while the offsetting impact deriving from the hedged cash instruments will accrue over a different timescale in keeping with the interest rates applicable to the specific periods for those instruments. For the year this resulted in a loss of €12 million (2013: gain of €49 million). The combined effect of all the hedging activities described above was a loss of €34 million for the year (2013: gain of €45 million).
Cash flow hedges The Bank hedges on an annual basis to minimise the exchange rate risk associated with incurring administrative expenses in sterling. In 2014 and 2013 there was no ineffectiveness recognised in the income statement arising from cash flow hedges.
2014
€ million 2013
€ million Debt buy-backs and termination of related derivatives 5 16 Balance sheet management (1) 86 Net gains from Treasury activities at fair value through profit or loss 4 102
EBRD Financial Report 2014 59
10. Provisions for impairment of Banking loan investments at amortised cost
11. General administrative expenses
The Bank’s expenses are predominantly incurred in sterling. The sterling equivalent of the Bank’s general administrative expenses totalled £279 million (2013: £273 million). Direct costs of €5 million (2013: €6 million) relating to loan origination in 2014 have been deferred on the balance sheet in accordance with IAS 18. These figures will be recognised in interest income over the period from disbursement to repayment of the related loans.
47 Comprised of €368 million of new provisions against €44 million of released provisions (2013: €178 million against €35 million respectively). 48 Excludes provisions for guarantees which are recorded in Other assets.
Charge for the year 2014
€ million 2013
€ million Portfolio provisions for the unidentified impairment of loan investments
Non-sovereign loan investments (94) 10 Sovereign loan investments (22) -
Specific provisions for the identified impairment of loan investments47 (324) (143) Provisions for impairment of Banking loan investments at amortised cost (440) (133)
Movement in provisions 2014
€ million 2013
€ million At 1 January (817) (736)
Charge for the year to the income statement48 (440) (133) Loans sold 16 - Unwinding of the discount relating to the identified impairment of assets 13 15 Foreign exchange adjustments (54) 21 Release against amounts written off 73 13 Release against amounts recovered from guarantees - 4 Recovery from amounts written off - (1) At 31 December (1,209) (817) Analysed between Portfolio provisions for the unidentified impairment of loan investments: Non-sovereign loan investments (538) (417) Sovereign loan investments (40) (18) Specific provisions for the identified impairment of loan investments (631) (382) At 31 December (1,209) (817)
2014
€ million 2013
€ million Personnel costs (241) (222) Overhead expenses (93) (93) General administrative expenses (334) (315) Release of deferral of direct costs related to loan origination and commitment maintenance 5 6 Pension past service cost - (10) Net general administrative expenses (329) (319)
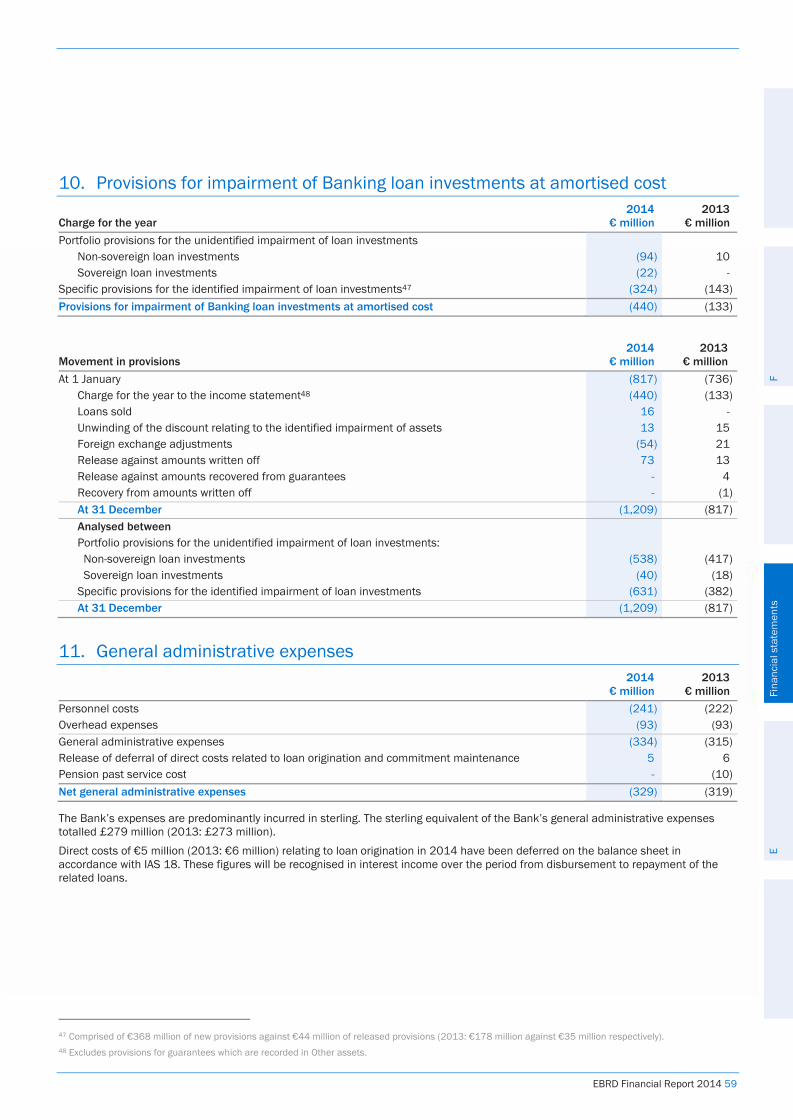
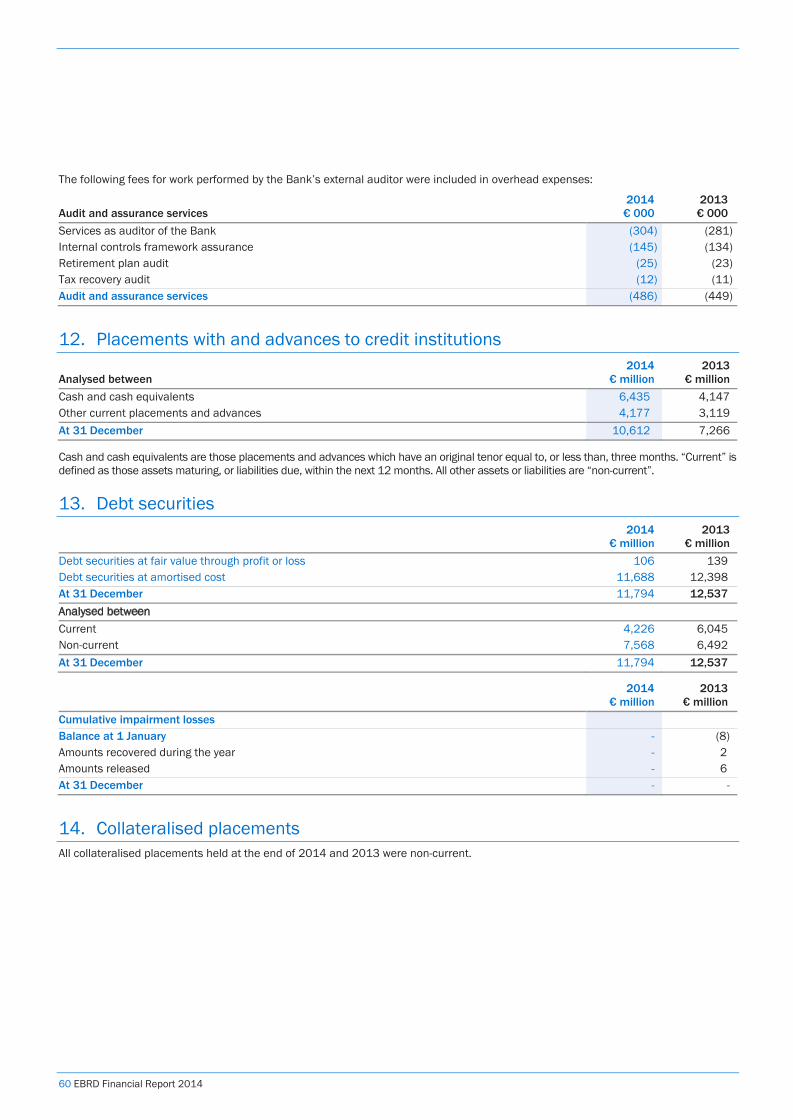
60 EBRD Financial Report 2014
The following fees for work performed by the Bank’s external auditor were included in overhead expenses:
12. Placements with and advances to credit institutions
Cash and cash equivalents are those placements and advances which have an original tenor equal to, or less than, three months. “Current” is defined as those assets maturing, or liabilities due, within the next 12 months. All other assets or liabilities are “non-current”.
13. Debt securities
2014
€ million 2013
€ million Debt securities at fair value through profit or loss 106 139 Debt securities at amortised cost 11,688 12,398 At 31 December 11,794 12,537 Analysed between Current 4,226 6,045 Non-current 7,568 6,492 At 31 December 11,794 12,537
14. Collateralised placements All collateralised placements held at the end of 2014 and 2013 were non-current.
Audit and assurance services 2014 € 000
2013 € 000
Services as auditor of the Bank (304) (281) Internal controls framework assurance (145) (134) Retirement plan audit (25) (23) Tax recovery audit (12) (11) Audit and assurance services (486) (449)
Analysed between 2014
€ million 2013
€ million Cash and cash equivalents 6,435 4,147 Other current placements and advances 4,177 3,119 At 31 December 10,612 7,266
2014
€ million 2013
€ million Cumulative impairment losses Balance at 1 January - (8) Amounts recovered during the year - 2 Amounts released - 6 At 31 December - -
EBRD Financial Report 2014 61
15. Other financial assets
2014
€ million 2013
€ million Fair value of derivatives designated as fair value hedges 3,113 2,341 Fair value of derivatives designated as cash flow hedges - 4 Fair value of portfolio derivatives not designated as hedges 1,359 434 Fair value of derivatives held in relation to the banking portfolio 506 315 Interest receivable 238 240 Paid-in capital receivable 11 10 Other 96 64 At 31 December 5,323 3,408 Analysed between Current 1,593 784 Non-current 3,730 2,624 At 31 December 5,323 3,408
Included within “Other” above are deferred fair value amounts related to banking derivative instruments that have a determinable return. Specifically, these relate to banking derivatives that are valued using valuation techniques other than observable market data. On initial recognition, the difference between the transaction price and the value derived from the valuation technique is deferred. These amounts are recognised in profit when market data becomes observable, when the underlying equity is exited or when the derivative is exercised. At 31 December 2014, net gains of €26 million were deferred (2013: €36 million).
16. Banking loan investments at amortised cost
2014 Sovereign
loans € million
2014 Non-sovereign
loans € million
2014 Total loans
€ million
2013 Sovereign
loans € million
2013 Non-sovereign
loans € million
2013 Total loans
€ million At 1 January 2,801 16,657 19,458 2,690 16,643 19,333
Movement in fair value revaluation49 - 17 17 - (34) (34) Disbursements 485 7,517 8,002 484 7,105 7,589 Repayments and prepayments (455) (6,879) (7,334) (380) (6,509) (6,889) Foreign exchange movements 83 165 248 (31) (529) (560) Movement in net deferral of front end fees and related direct costs 6 34 40 38 (6) 32
Written off - (73) (73) - (13) (13) At 31 December 2,920 17,438 20,358 2,801 16,657 19,458 Impairment at 31 December (40) (1,169) (1,209) (18) (799) (817) Total net of impairment at 31 December 2,880 16,269 19,149 2,783 15,858 18,641
Analysed between Current 3,123 2,982 Non-current 16,026 15,659 Total net of impairment at 31 December 2,880 16,269 19,149 2,783 15,858 18,641
At 31 December 2014 the Bank categorised 86 loan investments at amortised cost as impaired, with operating assets totalling €1.2 billion (2013: 68 loans totalling €655 million).
49 This movement in fair value relates to a hedge adjustment to fixed rate loans which qualify for hedge accounting for interest rate risk.
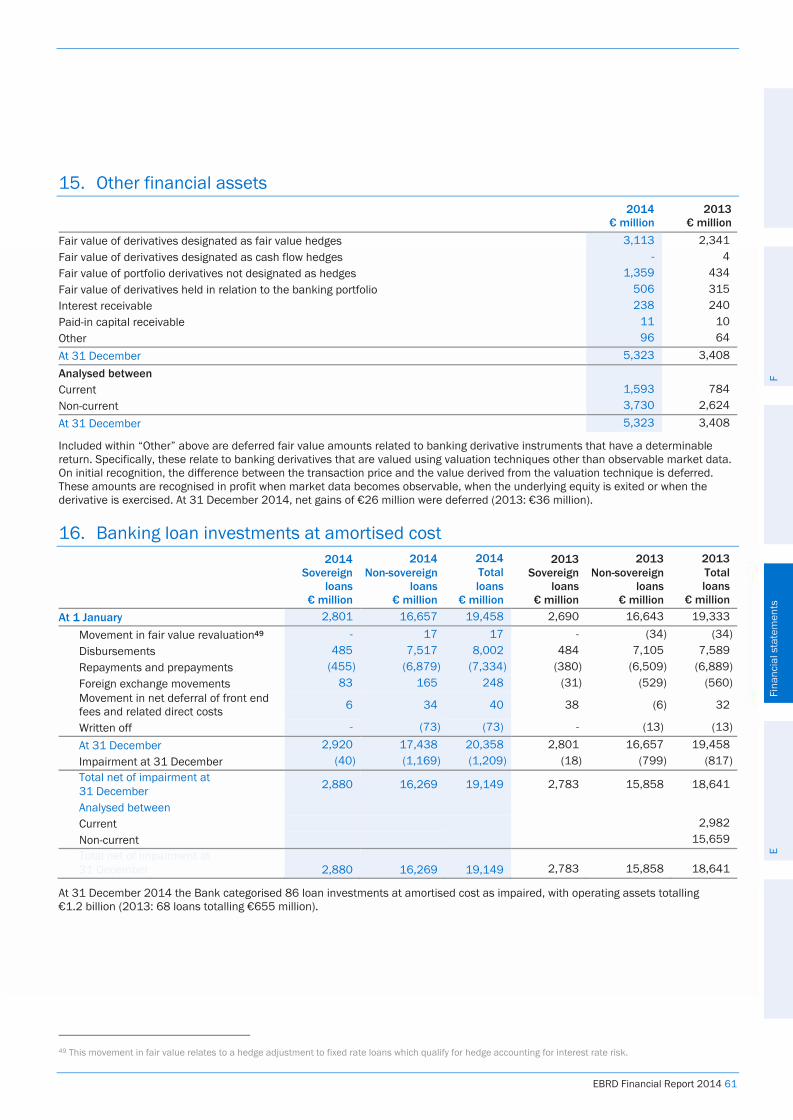
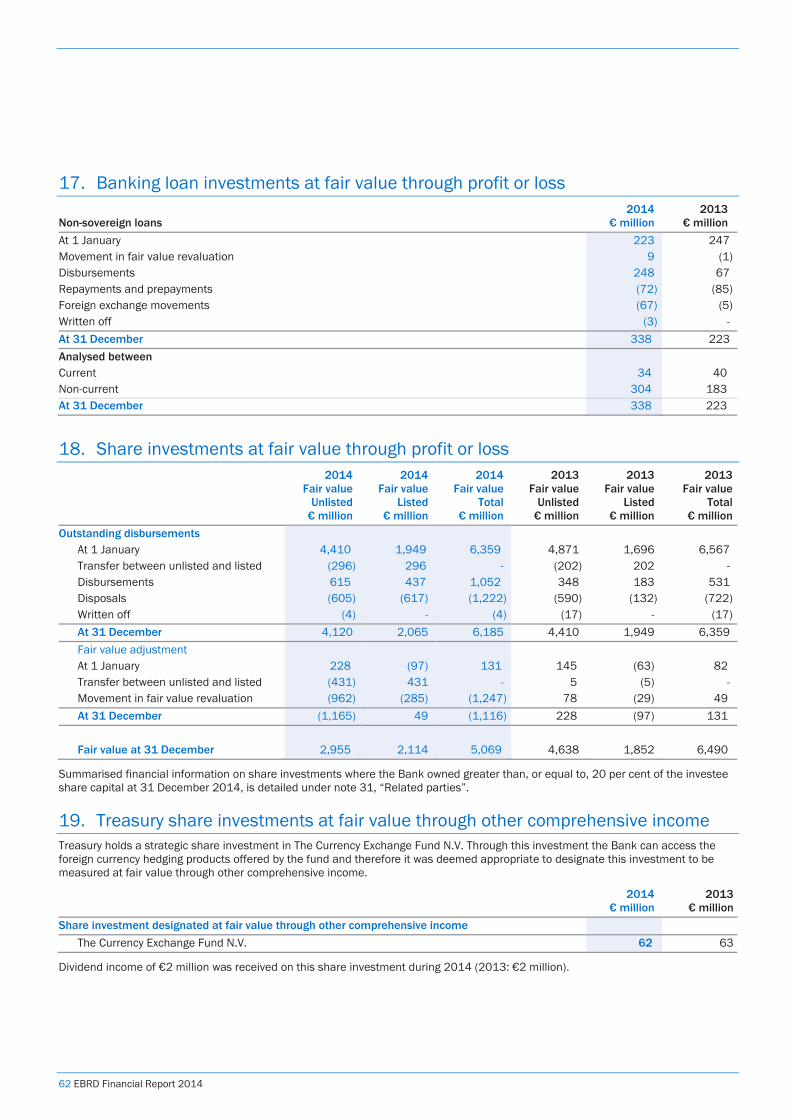
62 EBRD Financial Report 2014
17. Banking loan investments at fair value through profit or loss
18. Share investments at fair value through profit or loss
2014 Fair value
Unlisted € million
2014 Fair value
Listed € million
2014 Fair value
Total € million
2013 Fair value
Unlisted € million
2013 Fair value
Listed € million
2013 Fair value
Total € million
Outstanding disbursements At 1 January 4,410 1,949 6,359 4,871 1,696 6,567 Transfer between unlisted and listed (296) 296 - (202) 202 - Disbursements 615 437 1,052 348 183 531 Disposals (605) (617) (1,222) (590) (132) (722) Written off (4) - (4) (17) - (17) At 31 December 4,120 2,065 6,185 4,410 1,949 6,359 Fair value adjustment At 1 January 228 (97) 131 145 (63) 82 Transfer between unlisted and listed (431) 431 - 5 (5) - Movement in fair value revaluation (962) (285) (1,247) 78 (29) 49 At 31 December (1,165) 49 (1,116) 228 (97) 131 Fair value at 31 December 2,955 2,114 5,069 4,638 1,852 6,490
Summarised financial information on share investments where the Bank owned greater than, or equal to, 20 per cent of the investee share capital at 31 December 2014, is detailed under note 31, “Related parties”.
19. Treasury share investments at fair value through other comprehensive income Treasury holds a strategic share investment in The Currency Exchange Fund N.V. Through this investment the Bank can access the foreign currency hedging products offered by the fund and therefore it was deemed appropriate to designate this investment to be measured at fair value through other comprehensive income.
2014
€ million 2013
€ million Share investment designated at fair value through other comprehensive income
The Currency Exchange Fund N.V. 62 63
Dividend income of €2 million was received on this share investment during 2014 (2013: €2 million).
Non-sovereign loans 2014
€ million 2013
€ million At 1 January 223 247 Movement in fair value revaluation 9 (1) Disbursements 248 67 Repayments and prepayments (72) (85) Foreign exchange movements (67) (5) Written off (3) - At 31 December 338 223 Analysed between Current 34 40 Non-current 304 183 At 31 December 338 223
EBRD Financial Report 2014 63
20. Intangible assets
21. Property, technology and office equipment
22. Borrowings
50 See Note 32 for details of third parties.
Computer software development costs 2014
€ million Computer software development costs 2013
€ million Cost At 1 January 195 179 Additions 21 16 At 31 December 216 195 Amortisation At 1 January (156) (138) Charge (17) (18) At 31 December (173) (156) Net book value at 31 December 43 39
Property 2014
€ million
Property under
construction 2014
€ million
Technology and office
equipment 2014
€ million
Total 2014
€ million
Property 2013
€ million
Property under
construction 2013
€ million
Technology and office
equipment 2013
€ million
Total 2013
€ million Cost At 1 January 54 8 21 83 48 7 25 80 Additions 3 - 2 5 6 1 6 13 Transfers 11 (6) (5) - 7 - (7) - Disposals (1) - (2) (3) (7) - (3) (10) At 31 December 67 2 16 85 54 8 21 83 Depreciation At 1 January (27) - (12) (39) (20) - (18) (38) Charge (7) - (2) (9) (5) - (3) (8) Transfers - - - - (7) - 7 - Disposals 1 - 2 3 5 - 2 7 At 31 December (33) - (12) (45) (27) - (12) (39) Net book value at 31 December 34 2 4 40 27 8 9 44
2014
€ million 2013
€ million Amounts owed to credit institutions and other third parties Amounts owed to credit institutions (210) (96) Amounts held as collateral (1,434) (478) Amounts managed on behalf of third parties50 (890) (969) At 31 December (2,534) (1,543) Of which current: (2,534) (1,543)
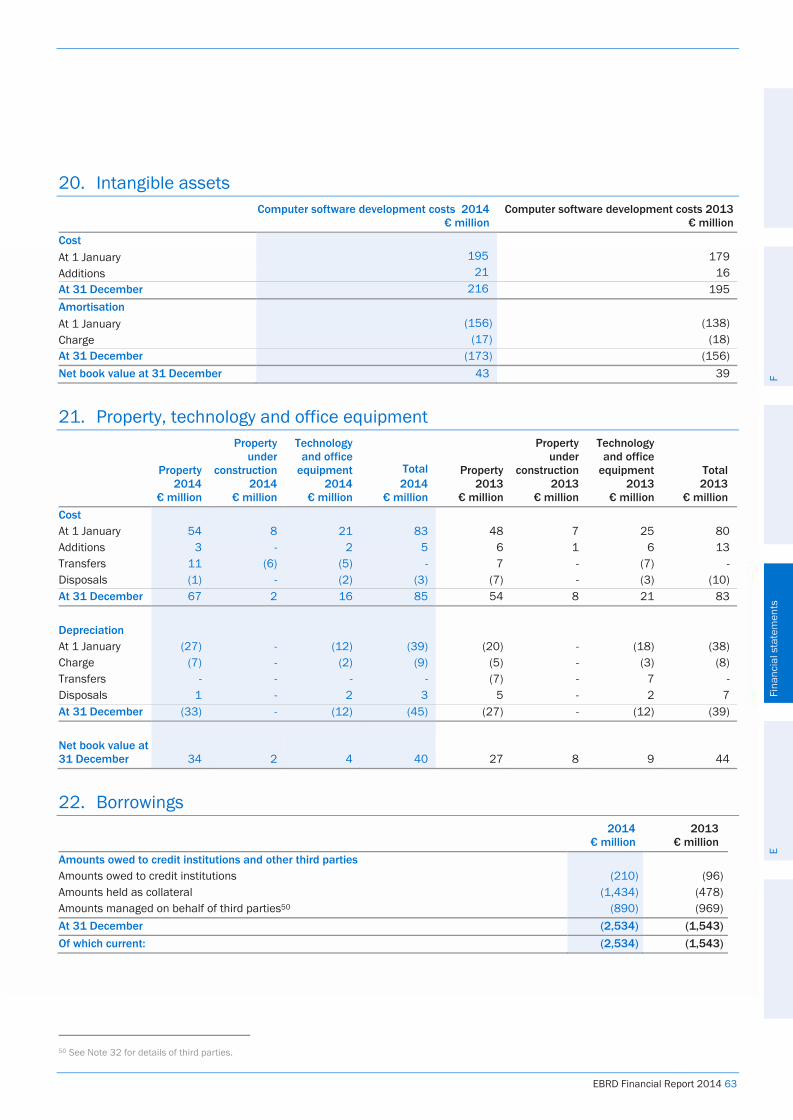
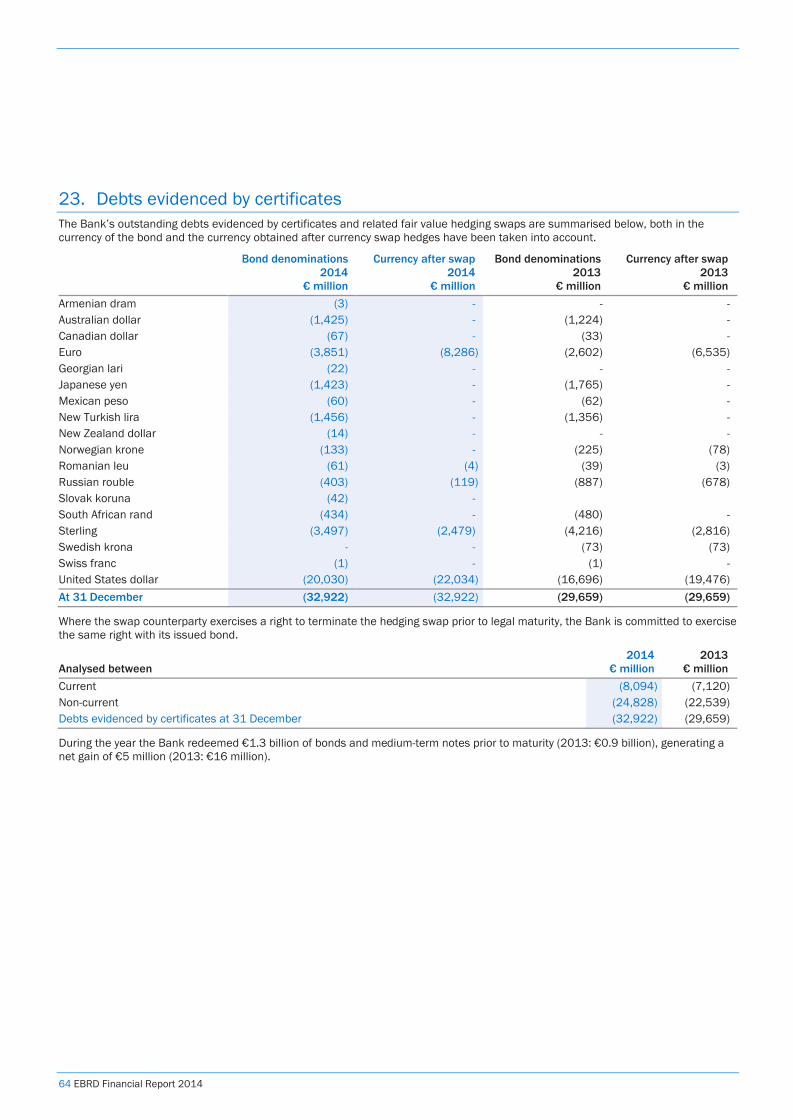
64 EBRD Financial Report 2014
23. Debts evidenced by certificates The Bank’s outstanding debts evidenced by certificates and related fair value hedging swaps are summarised below, both in the currency of the bond and the currency obtained after currency swap hedges have been taken into account.
Bond denominations 2014
€ million
Currency after swap 2014
€ million
Bond denominations 2013
€ million
Currency after swap 2013
€ million Armenian dram (3) - - - Australian dollar (1,425) - (1,224) - Canadian dollar (67) - (33) - Euro (3,851) (8,286) (2,602) (6,535) Georgian lari (22) - - - Japanese yen (1,423) - (1,765) - Mexican peso (60) - (62) - New Turkish lira (1,456) - (1,356) - New Zealand dollar (14) - - - Norwegian krone (133) - (225) (78) Romanian leu (61) (4) (39) (3) Russian rouble (403) (119) (887) (678) Slovak koruna (42) - South African rand (434) - (480) - Sterling (3,497) (2,479) (4,216) (2,816) Swedish krona - - (73) (73) Swiss franc (1) - (1) - United States dollar (20,030) (22,034) (16,696) (19,476) At 31 December (32,922) (32,922) (29,659) (29,659)
Where the swap counterparty exercises a right to terminate the hedging swap prior to legal maturity, the Bank is committed to exercise the same right with its issued bond.
Analysed between 2014
€ million 2013
€ million Current (8,094) (7,120) Non-current (24,828) (22,539) Debts evidenced by certificates at 31 December (32,922) (29,659)
During the year the Bank redeemed €1.3 billion of bonds and medium-term notes prior to maturity (2013: €0.9 billion), generating a net gain of €5 million (2013: €16 million).
EBRD Financial Report 2014 65
24. Other financial liabilities
2014
€ million 2013
€ million Fair value of derivatives designated as fair value hedges (1,990) (2,117) Fair value of portfolio derivatives not designated as hedges (359) (261) Fair value of other derivatives held in relation to the banking portfolio (81) (97) Interest payable (250) (227) Other (202) (178) At 31 December (2,882) (2,880)
25. Subscribed capital
2014 Number of
shares
2014 Total
€ million
2013 Number of
shares
2013 Total
€ million Authorised shared capital 3,000,000 30,000 3,000,000 30,000 of which Subscriptions by members – initial capital 993,055 9,931 993,055 9,931 Subscriptions by members – first capital increase 988,055 9,881 988,055 9,881 Subscriptions by members – second capital increase 986,325 9,862 986,146 9,861 Subscribed capital 2,967,435 29,674 2,967,256 29,673 Unsubscribed capital 32,565 326 32,744 327 At 31 December 3,000,000 30,000 3,000,000 30,000
The Bank’s capital stock is divided into paid-in shares and callable shares. Each share has a par value of €10,000. At the Bank’s Annual Meeting in May 2010, the Board of Governors approved a two-step increase in the authorised capital stock of the Bank: a €1.0 billion increase in authorised paid-in shares and a €9.0 billion increase in authorised callable capital shares, amounting to a €10.0 billion aggregate increase in the authorised capital stock of the Bank (collectively referred to as the second capital increase). Resolution No. 126 authorised the increase in authorised capital stock by 100,000 paid-in shares, each share having a par value of €10,000, taking the authorised capital stock of the Bank to €21.0 billion. Resolution No. 128 authorised the increase in the authorised capital stock of the Bank by 900,000 callable shares, each share having a par value of €10,000, with the shares subject to redemption in accordance with the terms of Resolution No. 128. The increase in callable capital became effective in April 2011. Payment for the paid-in shares issued as part of the original authorised capital stock, and as part of the first capital increase and subscribed to by members, is made over a period of years determined in advance. Payment for the paid-in shares issued under the second capital increase was by way of a reallocation of net income previously allocated to surplus for other purposes, namely for the payment of such paid-in shares, pursuant to Article 36.1 of the Agreement and approved by Board of Governors Resolution No. 126, dated 14 May 2010. Article 6.4 of the Agreement states that payment of the amount subscribed to the callable capital is subject to call by the Bank, taking account of Articles 17 and 42 of the Agreement, only as and when required by the Bank to meet its liabilities. Article 42.1 states that in the event of the termination of the Bank’s operations, the liability of all members for all uncalled subscriptions to the capital stock will continue until all claims of creditors, including all contingent claims, have been discharged. The Agreement allows for a member to withdraw from the Bank, in which case the Bank is required to repurchase the former member’s shares. No member has ever withdrawn its membership. The stability in the membership reflects the fact that the members are 64 countries and two inter-governmental organisations, and that the purpose of the Bank is to foster the transition process in politically qualifying countries from central Europe to central Asia and the SEMED region.
Analysed between 2014
€ million 2013
€ million Current (1,001) (1,333) Non-current (1,881) (1,547) At 31 December (2,882) (2,880)
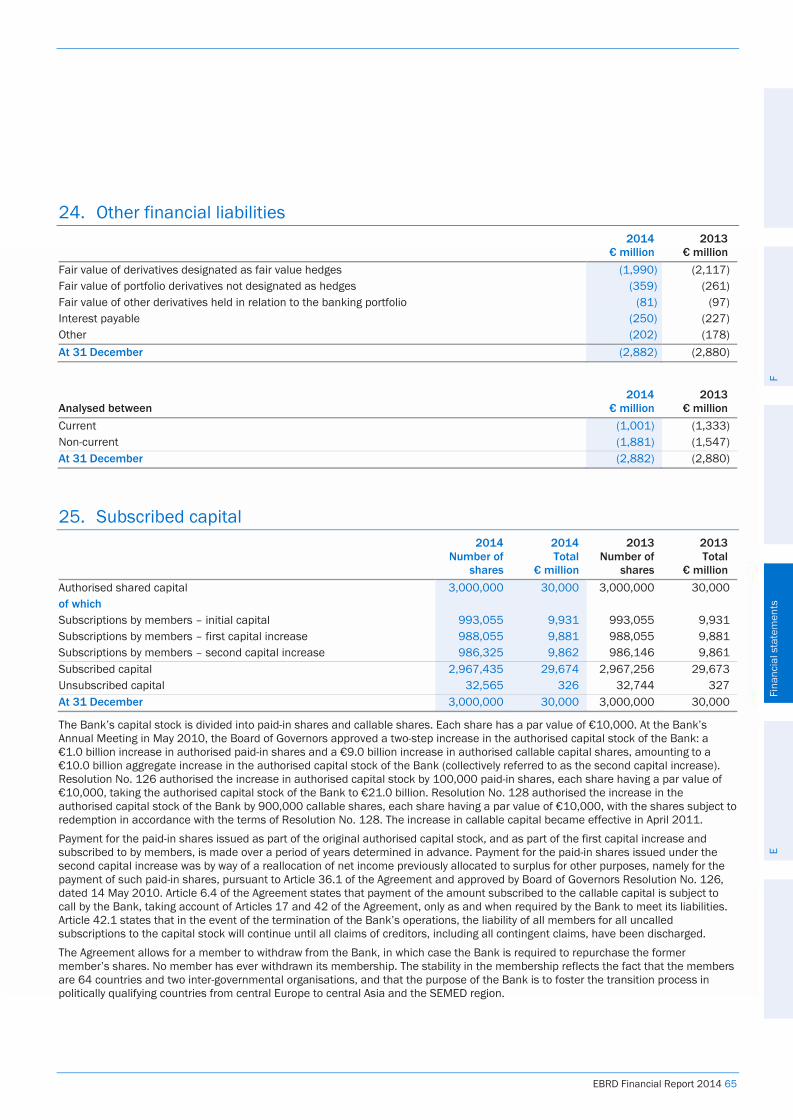
66 EBRD Financial Report 2014
Moreover, there is a financial disincentive to withdrawing membership. The upper limit of the amount of the repurchase price of the former member’s shares is the amount of its paid-in capital, yet a former member remains liable for its direct obligations and its contingent liabilities to the Bank for as long as any part of the loans, share investments or guarantees contracted before it ceased to be a member are outstanding. Were a member to withdraw from the Bank, the Bank would be able to impose conditions and set dates in respect of payments for shares repurchased. If, for example, paying a former member would have adverse consequences for the Bank’s financial position, the Bank could defer payment until the risk had passed, and indefinitely if appropriate. If a payment was then made to a former member, the member would be required to repay, on demand, the amount by which the repurchase price would have been reduced if the losses for which the former member remained liable had been taken into account at the time of payment. Under the Agreement, payment for the paid-in shares of the initial capital stock subscribed to by members was made in five equal annual instalments. Of each instalment, up to 50 per cent was payable in non-negotiable, non-interest-bearing promissory notes or other obligations issued by the subscribing member and payable to the Bank at par value upon demand. Under Resolution No. 59, payment for the paid-in shares subscribed to by members under the first capital increase was made in eight equal annual instalments. Under Resolution No. 126, payment for the paid-in shares issued to members under the second capital increase was made in one instalment immediately following approval of Resolution No. 126. A statement of capital subscriptions showing the amount of paid-in and callable shares subscribed to by each member, together with the amount of unallocated shares and votes, is set out in the following table. Under Article 29 of the Agreement, the voting rights of members that have failed to pay any part of the amounts due in respect of their capital subscription are proportionately reduced until payment is made.
EBRD Financial Report 2014 67
Statement of capital subscriptions
51 Voting rights are restricted for non-payment of amounts due in respect of the member’s obligations in relation to paid-in shares. Total votes before restrictions
amount to 2,967,435 (2013: 2,967,256).
At 31 December 2014 Members
Total shares (number)
Resulting votes51
(number)
Total capital
€ million
Callable capital
€ million
Paid-in capital
€ million Albania 3,001 2,511 30 24 6 Armenia 1,499 1,499 15 12 3 Australia 30,014 30,014 300 237 63 Austria 68,432 68,432 684 541 143 Azerbaijan 3,001 3,001 30 24 6 Belarus 6,002 6,002 60 47 13 Belgium 68,432 68,432 684 541 143 Bosnia and Herzegovina 5,071 5,071 51 40 11 Bulgaria 23,711 23,711 238 188 50 Canada 102,049 102,049 1,020 807 213 Croatia 10,942 10,942 109 86 23 Cyprus 3,001 3,001 30 24 6 Czech Republic 25,611 25,611 256 203 53 Denmark 36,017 36,017 360 285 75 Egypt 2,101 2,101 21 15 6 Estonia 3,001 3,001 30 24 6 European Investment Bank 90,044 90,044 900 712 188 European Union 90,044 90,044 900 712 188 Finland 37,518 37,518 375 297 78 Former Yugoslav Republic of Macedonia 1,762 1,762 17 13 4 France 255,651 255,651 2,557 2,024 533 Georgia 3,001 3,001 30 24 6 Germany 255,651 255,651 2,557 2,024 533 Greece 19,508 19,508 195 154 41 Hungary 23,711 23,711 237 188 49 Iceland 3,001 3,001 30 24 6 Ireland 9,004 9,004 90 71 19 Israel 19,508 19,508 195 154 41 Italy 255,651 255,651 2,557 2,024 533 Japan 255,651 255,651 2,557 2,024 533 Jordan 986 986 10 8 2 Kazakhstan 6,902 6,902 70 55 15 Korea, Republic of 30,014 30,014 300 237 63 Kosovo 580 580 6 5 1 Kyrgyz Republic 2,101 1,010 21 15 6 Latvia 3,001 3,001 30 24 6 Liechtenstein 599 599 6 5 1 Lithuania 3,001 3,001 30 24 6 Luxembourg 6,002 6,002 60 47 13 Malta 210 210 2 1 1 Mexico 4,501 4,501 46 35 11 Moldova 3,001 2,666 30 24 6 Mongolia 299 299 3 2 1 Montenegro 599 599 6 5 1
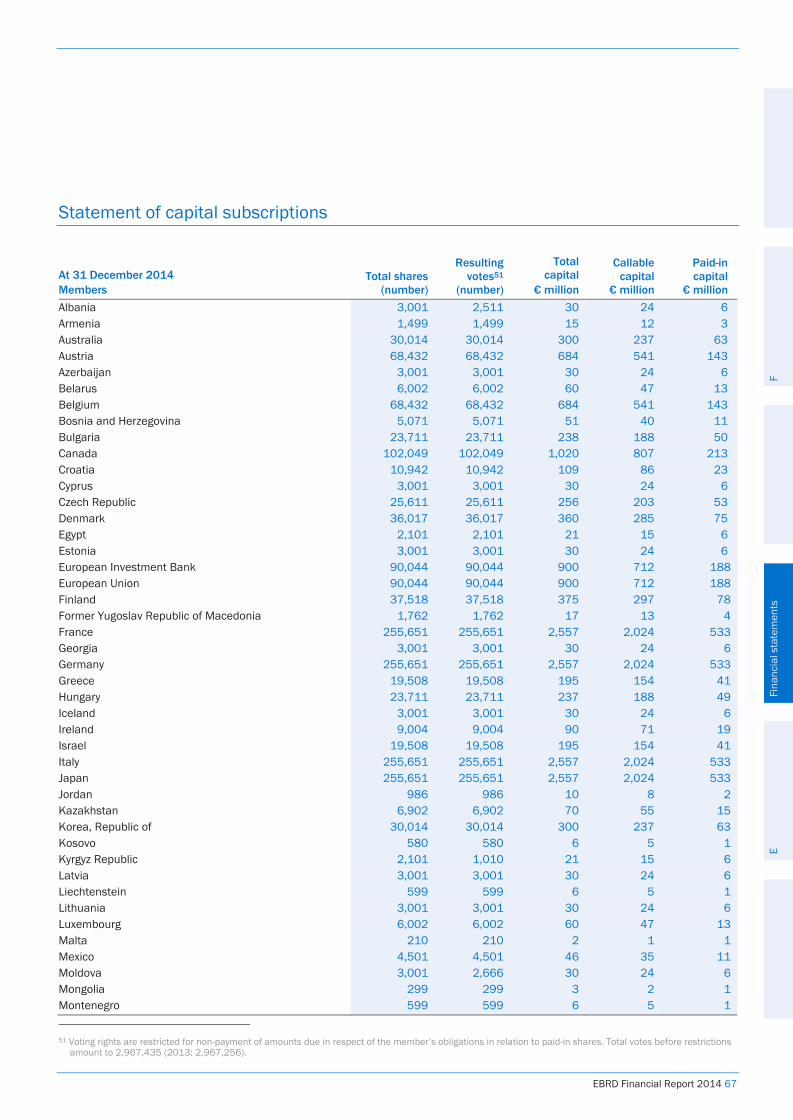
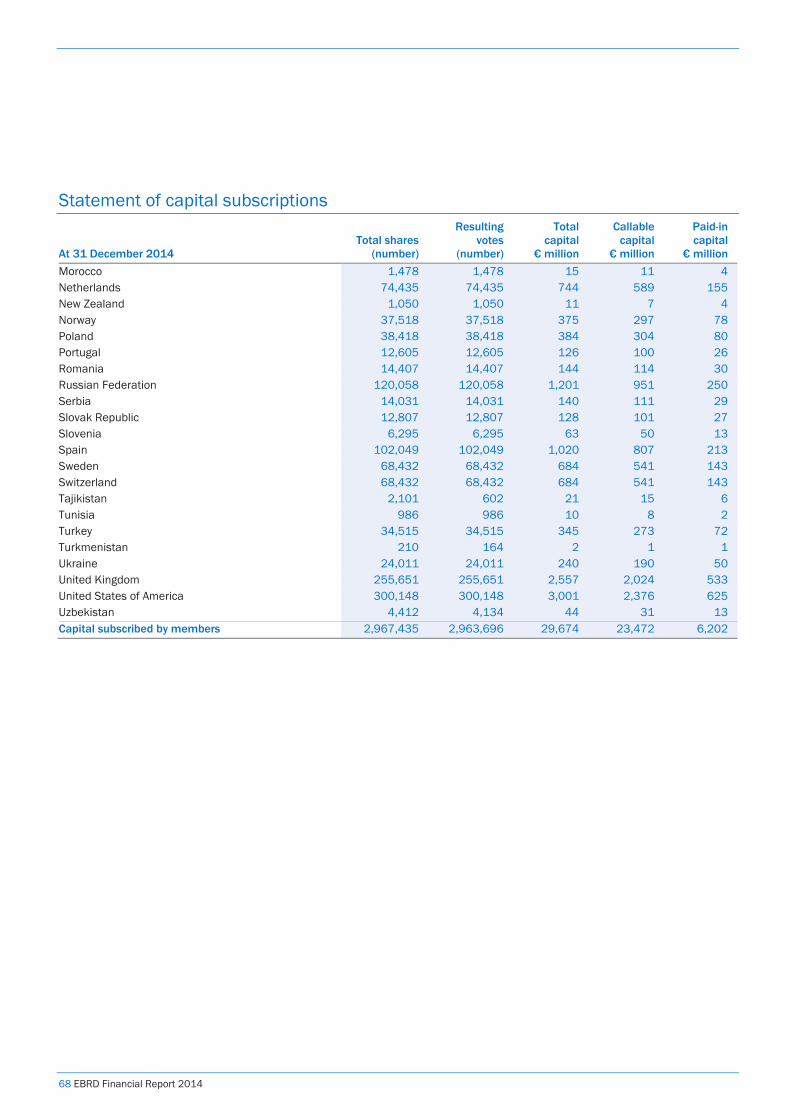
68 EBRD Financial Report 2014
Statement of capital subscriptions
At 31 December 2014 Total shares
(number)
Resulting votes
(number)
Total capital
€ million
Callable capital
€ million
Paid-in capital
€ million Morocco 1,478 1,478 15 11 4 Netherlands 74,435 74,435 744 589 155 New Zealand 1,050 1,050 11 7 4 Norway 37,518 37,518 375 297 78 Poland 38,418 38,418 384 304 80 Portugal 12,605 12,605 126 100 26 Romania 14,407 14,407 144 114 30 Russian Federation 120,058 120,058 1,201 951 250 Serbia 14,031 14,031 140 111 29 Slovak Republic 12,807 12,807 128 101 27 Slovenia 6,295 6,295 63 50 13 Spain 102,049 102,049 1,020 807 213 Sweden 68,432 68,432 684 541 143 Switzerland 68,432 68,432 684 541 143 Tajikistan 2,101 602 21 15 6 Tunisia 986 986 10 8 2 Turkey 34,515 34,515 345 273 72 Turkmenistan 210 164 2 1 1 Ukraine 24,011 24,011 240 190 50 United Kingdom 255,651 255,651 2,557 2,024 533 United States of America 300,148 300,148 3,001 2,376 625 Uzbekistan 4,412 4,134 44 31 13 Capital subscribed by members 2,967,435 2,963,696 29,674 23,472 6,202
EBRD Financial Report 2014 69
26. Reserves and retained earnings
2014
€ million 2013
€ million Special reserve
At 1 January 306 306 At 31 December 306 306
Loan loss reserve At 1 January 730 689 Transferred from retained earnings 8 41 At 31 December 738 730
Net income allocation
At 1 January 619 1,013 Transferred from/(to) retained earnings 1,488 (304) Distributions (155) (90) At 31 December 1,952 619
General reserve – other reserve
Revaluation reserve At 1 January 15 16 Net (losses) arising on revaluation of share investments at fair value through other comprehensive income (1) (1) At 31 December 14 15
Hedging reserve – cash flow hedges At 1 January 4 7 Gains/(losses) from changes in fair value of hedges recognised in equity 9 (6) (Losses)/gains reclassified to general administrative expenses (13) 3 At 31 December - 4
Other At 1 January 205 199 Internal tax for the year 6 6 At 31 December 211 205 General reserve – other reserve at 31 December 225 224
General reserve – retained earnings At 1 January 6,795 5,518 Net (loss)/profit before transfers of net income approved by the Board of Governors (568) 1,012 Transferred to loan loss reserve (8) (41) Transferred (to)/from net income allocation (1,488) 304 Actuarial (losses)/gains on defined benefit scheme (5) 2 General reserve retained earnings at 31 December 4,726 6,795
Total reserves and retained earnings at 31 December 7,947 8,674
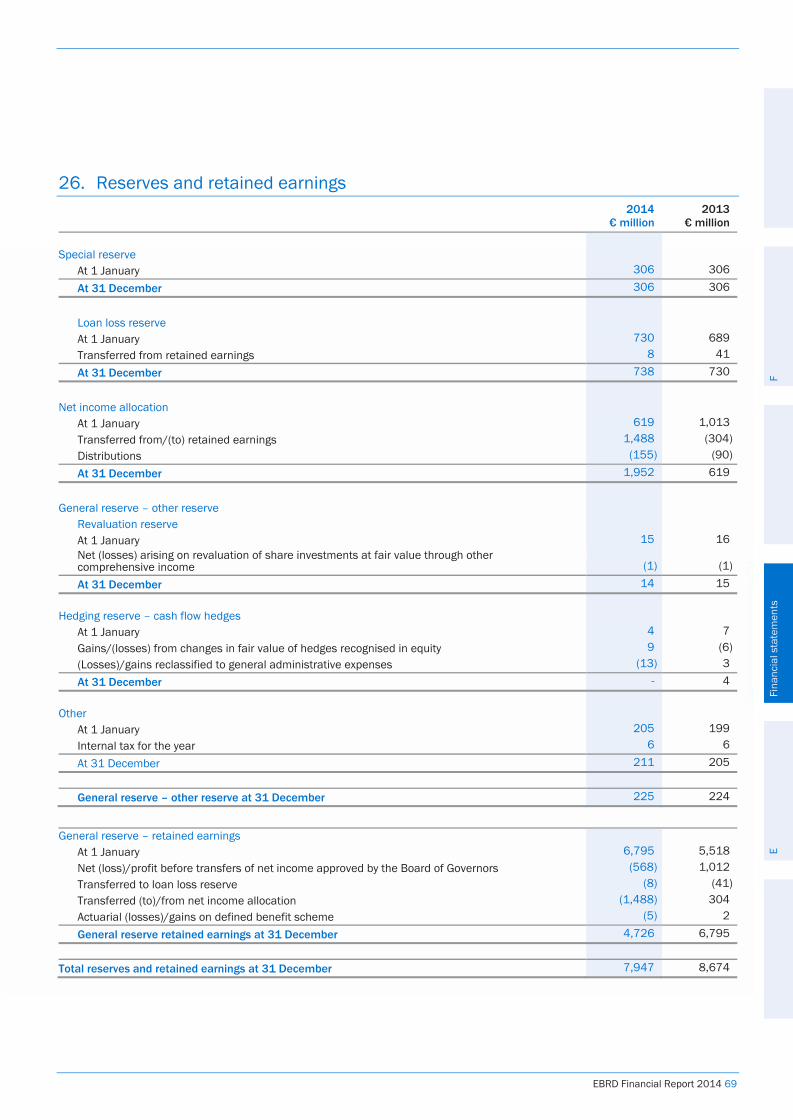
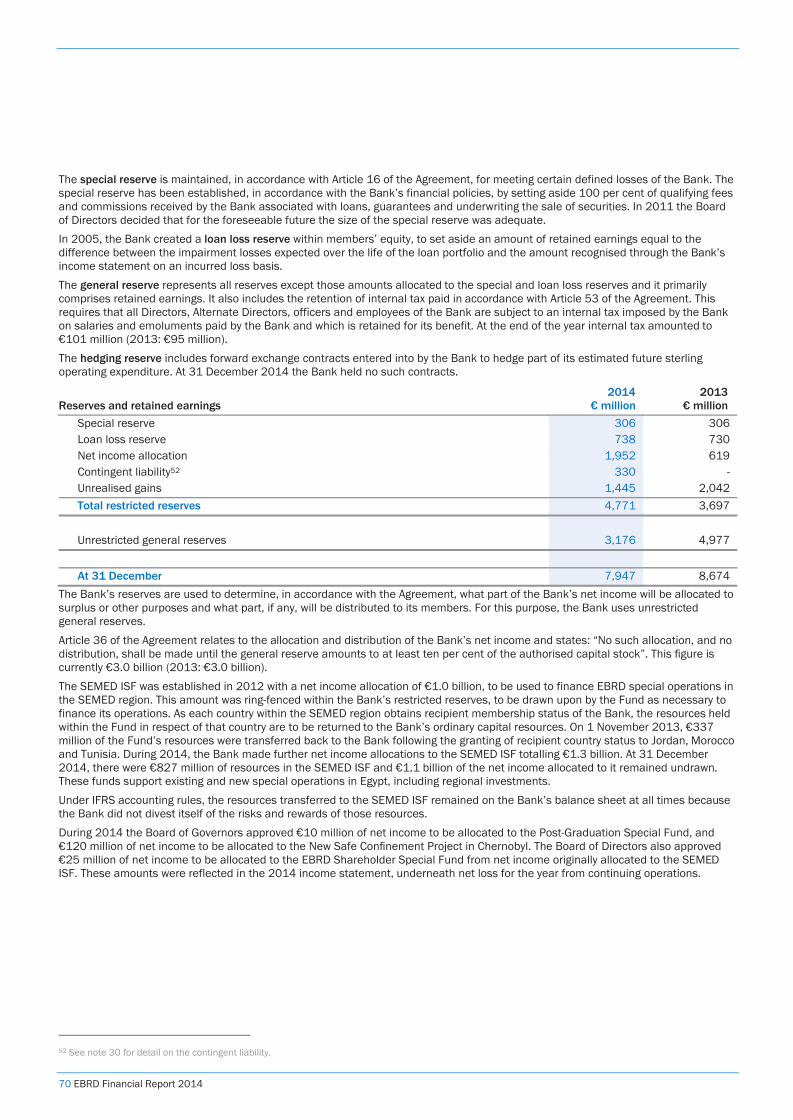
70 EBRD Financial Report 2014
The special reserve is maintained, in accordance with Article 16 of the Agreement, for meeting certain defined losses of the Bank. The special reserve has been established, in accordance with the Bank’s financial policies, by setting aside 100 per cent of qualifying fees and commissions received by the Bank associated with loans, guarantees and underwriting the sale of securities. In 2011 the Board of Directors decided that for the foreseeable future the size of the special reserve was adequate. In 2005, the Bank created a loan loss reserve within members’ equity, to set aside an amount of retained earnings equal to the difference between the impairment losses expected over the life of the loan portfolio and the amount recognised through the Bank’s income statement on an incurred loss basis. The general reserve represents all reserves except those amounts allocated to the special and loan loss reserves and it primarily comprises retained earnings. It also includes the retention of internal tax paid in accordance with Article 53 of the Agreement. This requires that all Directors, Alternate Directors, officers and employees of the Bank are subject to an internal tax imposed by the Bank on salaries and emoluments paid by the Bank and which is retained for its benefit. At the end of the year internal tax amounted to €101 million (2013: €95 million). The hedging reserve includes forward exchange contracts entered into by the Bank to hedge part of its estimated future sterling operating expenditure. At 31 December 2014 the Bank held no such contracts.
Special reserve 306 306 Loan loss reserve 738 730 Net income allocation 1,952 619 Contingent liability52 330 - Unrealised gains 1,445 2,042 Total restricted reserves 4,771 3,697 Unrestricted general reserves 3,176 4,977 At 31 December 7,947 8,674
The Bank’s reserves are used to determine, in accordance with the Agreement, what part of the Bank’s net income will be allocated to surplus or other purposes and what part, if any, will be distributed to its members. For this purpose, the Bank uses unrestricted general reserves. Article 36 of the Agreement relates to the allocation and distribution of the Bank’s net income and states: “No such allocation, and no distribution, shall be made until the general reserve amounts to at least ten per cent of the authorised capital stock”. This figure is currently €3.0 billion (2013: €3.0 billion). The SEMED ISF was established in 2012 with a net income allocation of €1.0 billion, to be used to finance EBRD special operations in the SEMED region. This amount was ring-fenced within the Bank’s restricted reserves, to be drawn upon by the Fund as necessary to finance its operations. As each country within the SEMED region obtains recipient membership status of the Bank, the resources held within the Fund in respect of that country are to be returned to the Bank’s ordinary capital resources. On 1 November 2013, €337 million of the Fund’s resources were transferred back to the Bank following the granting of recipient country status to Jordan, Morocco and Tunisia. During 2014, the Bank made further net income allocations to the SEMED ISF totalling €1.3 billion. At 31 December 2014, there were €827 million of resources in the SEMED ISF and €1.1 billion of the net income allocated to it remained undrawn. These funds support existing and new special operations in Egypt, including regional investments. Under IFRS accounting rules, the resources transferred to the SEMED ISF remained on the Bank’s balance sheet at all times because the Bank did not divest itself of the risks and rewards of those resources. During 2014 the Board of Governors approved €10 million of net income to be allocated to the Post-Graduation Special Fund, and €120 million of net income to be allocated to the New Safe Confinement Project in Chernobyl. The Board of Directors also approved €25 million of net income to be allocated to the EBRD Shareholder Special Fund from net income originally allocated to the SEMED ISF. These amounts were reflected in the 2014 income statement, underneath net loss for the year from continuing operations.
52 See note 30 for detail on the contingent liability.
Reserves and retained earnings 2014
€ million 2013
€ million
EBRD Financial Report 2014 71
27. Undrawn commitments and guarantees
28. Operating lease commitments The Bank leases its Headquarters building in London and some of its Resident Office buildings in the countries in which it invests. These are standard operating leases and include renewal options, periodic escalation clauses and are mostly non-cancellable in the normal course of business without the Bank incurring substantial penalties. The most significant lease is that for the Bank’s Headquarters building. Rent payable under the terms of this lease is reviewed every five years and is based on market rates. The last review was conducted in December 2011.
Minimum future lease payments under long-term non-cancellable operating leases and payments made under such leases during the year are shown below:
Payable 2014
€ million 2013
€ million Not later than one year 32 30 Later than one year and not later than five years 114 112 Later than five years 66 85 At 31 December 212 227 Expenditure incurred in the current year 28 26
The Bank had entered into sub-lease arrangements for two floors of its Headquarters building, which expired on 22 January 2015. No further lease payments were expected to be received as at 31 December 2014.
53 Trade finance guarantees represent stand-by letters of credit issued in favour of confirming banks that have undertaken the payment risk of issuing banks in
the countries where the Bank invests. 54 Other guarantees include unfunded full or partial risk participations.
Analysis by instrument 2014
€ million 2013
€ million Undrawn commitments
Loans 9,230 8,912 Share investments 1,673 1,895 At 31 December 10,903 10,807
Guarantees Trade finance guarantees53 500 475 Other guarantees54 128 152 At 31 December 628 627
Undrawn commitments and guarantees at 31 December 11,531 11,434
Receivable 2014
€ million 2013
€ million Not later than one year - 5 At 31 December - 5 Income received in the current year 5 5
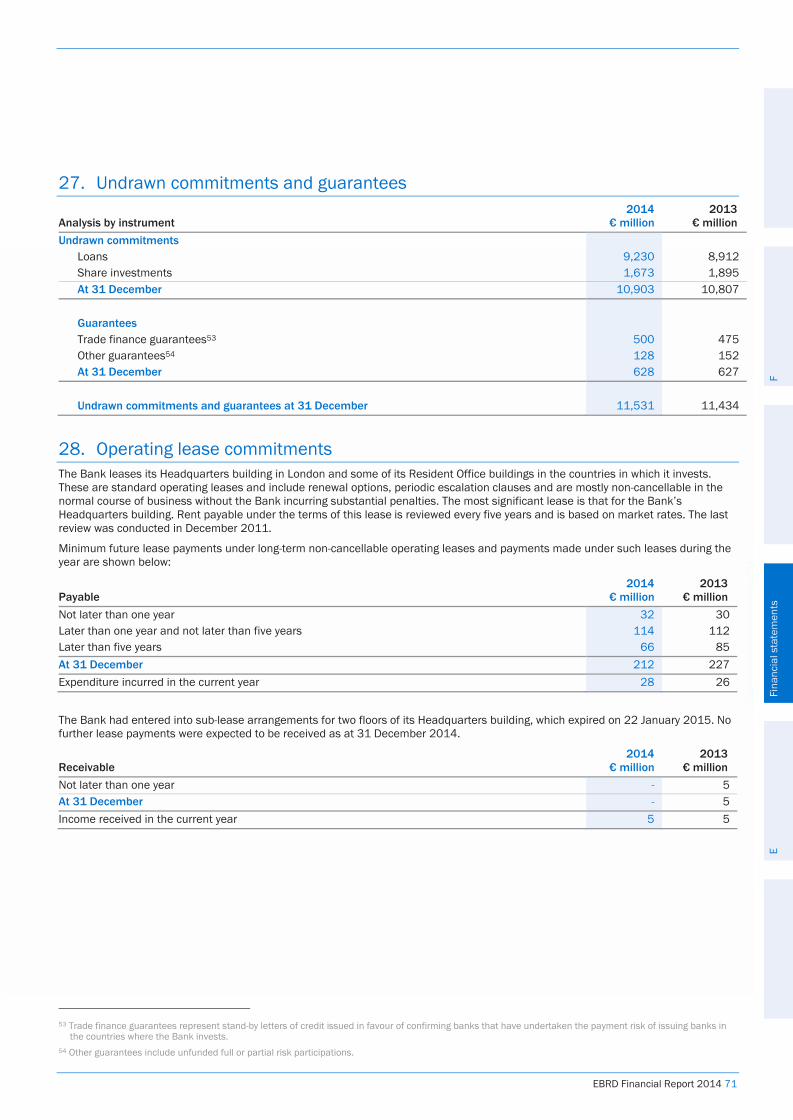
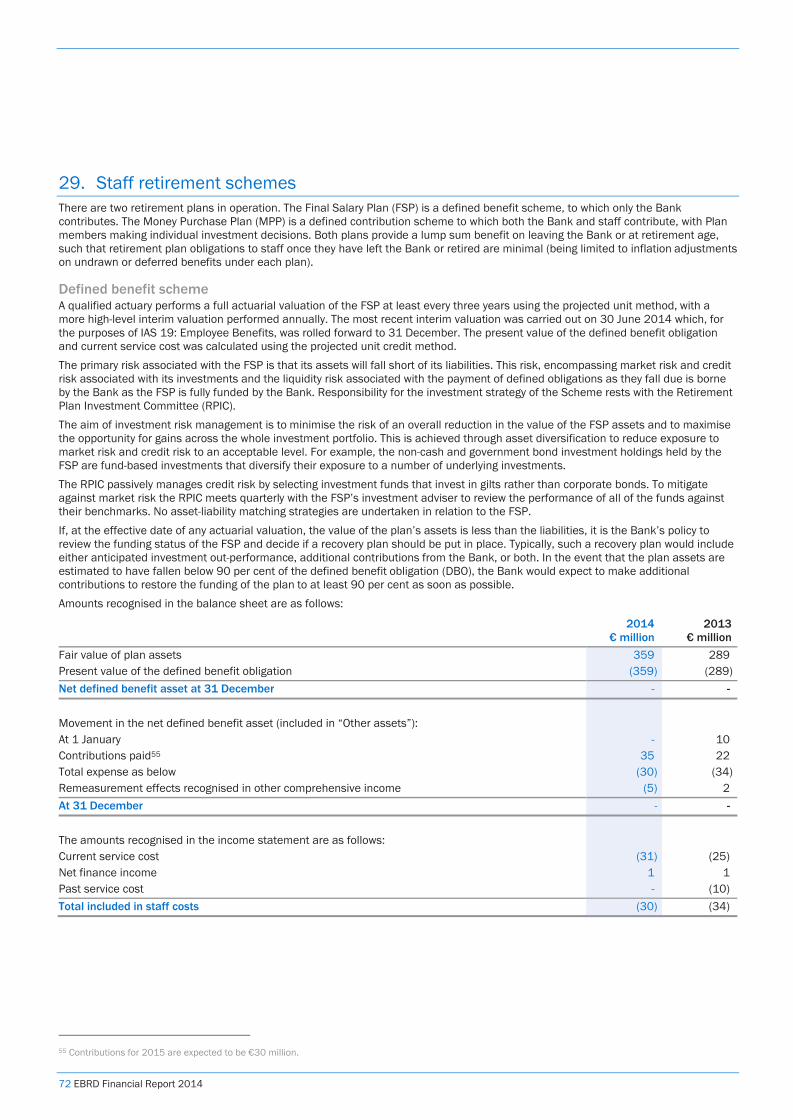
72 EBRD Financial Report 2014
29. Staff retirement schemes There are two retirement plans in operation. The Final Salary Plan (FSP) is a defined benefit scheme, to which only the Bank contributes. The Money Purchase Plan (MPP) is a defined contribution scheme to which both the Bank and staff contribute, with Plan members making individual investment decisions. Both plans provide a lump sum benefit on leaving the Bank or at retirement age, such that retirement plan obligations to staff once they have left the Bank or retired are minimal (being limited to inflation adjustments on undrawn or deferred benefits under each plan).
Defined benefit scheme A qualified actuary performs a full actuarial valuation of the FSP at least every three years using the projected unit method, with a more high-level interim valuation performed annually. The most recent interim valuation was carried out on 30 June 2014 which, for the purposes of IAS 19: Employee Benefits, was rolled forward to 31 December. The present value of the defined benefit obligation and current service cost was calculated using the projected unit credit method. The primary risk associated with the FSP is that its assets will fall short of its liabilities. This risk, encompassing market risk and credit risk associated with its investments and the liquidity risk associated with the payment of defined obligations as they fall due is borne by the Bank as the FSP is fully funded by the Bank. Responsibility for the investment strategy of the Scheme rests with the Retirement Plan Investment Committee (RPIC). The aim of investment risk management is to minimise the risk of an overall reduction in the value of the FSP assets and to maximise the opportunity for gains across the whole investment portfolio. This is achieved through asset diversification to reduce exposure to market risk and credit risk to an acceptable level. For example, the non-cash and government bond investment holdings held by the FSP are fund-based investments that diversify their exposure to a number of underlying investments. The RPIC passively manages credit risk by selecting investment funds that invest in gilts rather than corporate bonds. To mitigate against market risk the RPIC meets quarterly with the FSP’s investment adviser to review the performance of all of the funds against their benchmarks. No asset-liability matching strategies are undertaken in relation to the FSP. If, at the effective date of any actuarial valuation, the value of the plan’s assets is less than the liabilities, it is the Bank’s policy to review the funding status of the FSP and decide if a recovery plan should be put in place. Typically, such a recovery plan would include either anticipated investment out-performance, additional contributions from the Bank, or both. In the event that the plan assets are estimated to have fallen below 90 per cent of the defined benefit obligation (DBO), the Bank would expect to make additional contributions to restore the funding of the plan to at least 90 per cent as soon as possible. Amounts recognised in the balance sheet are as follows:
2014
€ million 2013
€ million Fair value of plan assets 359 289 Present value of the defined benefit obligation (359) (289) Net defined benefit asset at 31 December - - Movement in the net defined benefit asset (included in “Other assets”): At 1 January - 10 Contributions paid55 35 22 Total expense as below (30) (34) Remeasurement effects recognised in other comprehensive income (5) 2 At 31 December - - The amounts recognised in the income statement are as follows: Current service cost (31) (25) Net finance income 1 1 Past service cost - (10) Total included in staff costs (30) (34)
55 Contributions for 2015 are expected to be €30 million.
EBRD Financial Report 2014 73
Principal actuarial assumptions used:
2014 2013 Discount rate 3.20% 4.10% Expected return on plan assets 3.20% 4.10% Future salary increases 3.75% 4.25% Weighted average duration of the defined benefit obligation 11 years 11 years Sensitivity analysis on the key actuarial assumptions:
Assumption Sensitivity
(Decrease)/ Increase
in DBO € million
Discount rate 3.20% +/- 0.5% pa (19)/21 Price inflation 2.75% +/- 0.25% pa 9/(9) These sensitivity analyses have been determined based on reasonably possible changes of the respective assumptions occurring at the end of the reporting period, while holding all other assumptions constant. The sensitivity analysis presented above may not be representative of the actual change in the defined benefit obligation as it is unlikely that the change in assumptions would occur in isolation of one another as the assumptions may be correlated.
Plan asset allocation
2014 Listed
€ million
2014 Unlisted
€ million
2014 Total
€ million
2013 Listed
€ million
2013 Unlisted
€ million
2013 Total
€ million Equities 163 35 198 132 28 160 Index-linked bonds 128 - 128 103 - 103 Commodities - 13 13 - 14 14 Other - 14 14 - 12 12 Cash - 6 6 - - - Total 291 68 359 235 54 289
Changes in the present value of the defined benefit obligation are as follows: 2014
€ million 2013
€ million Present value of defined benefit obligation at 1 January (289) (247)
Service cost (31) (25) Interest cost (13) (9) Past service cost - (10) Effect of exchange rate movement (20) 5 Actuarial loss arising due to changes in assumptions56 (14) (11) Benefits paid 8 8 Present value of defined benefit obligation at 31 December (359) (289)
Changes in the fair value of plan assets are as follows: 2014
€ million 2013
€ million Present value of plan assets at 1 January 289 257
Interest income on plan assets 14 10 Return on assets greater/(less) than discount rate 9 14 Effect of exchange rate movement 20 (6) Contributions paid 35 22 Benefits paid (8) (8) Present value of plan assets at 31 December 359 289
56 All actuarial losses relate to changes in financial assumptions.
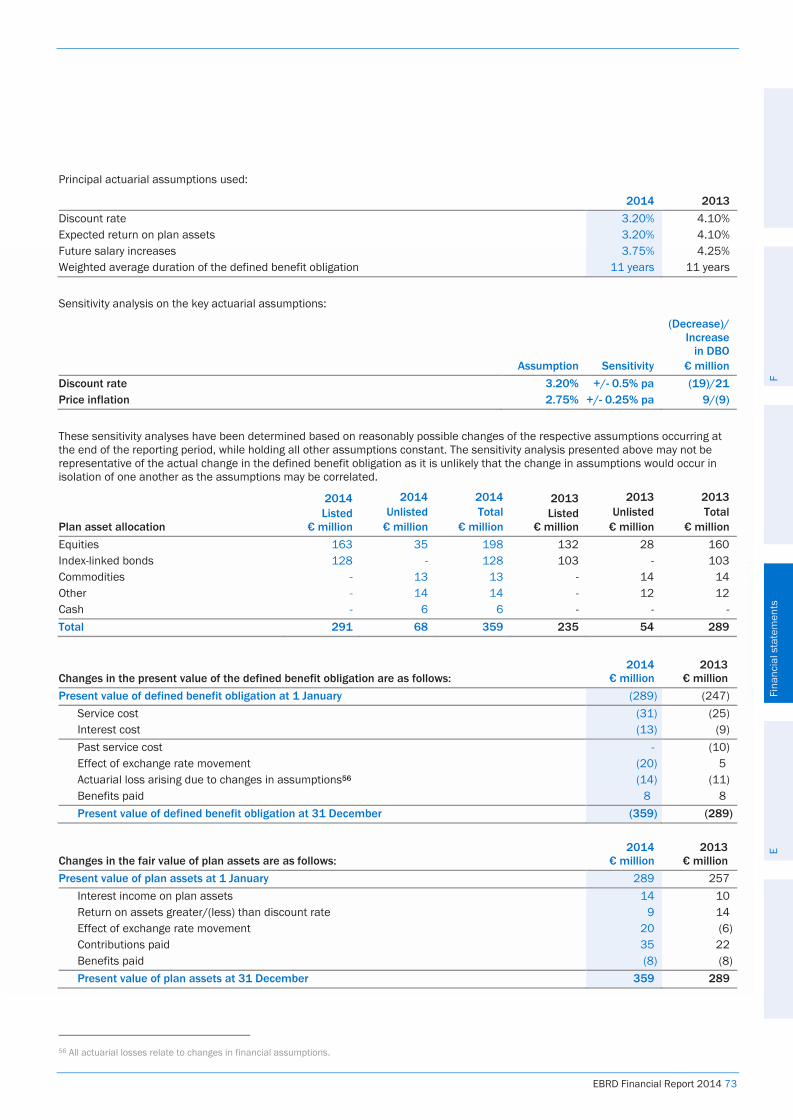
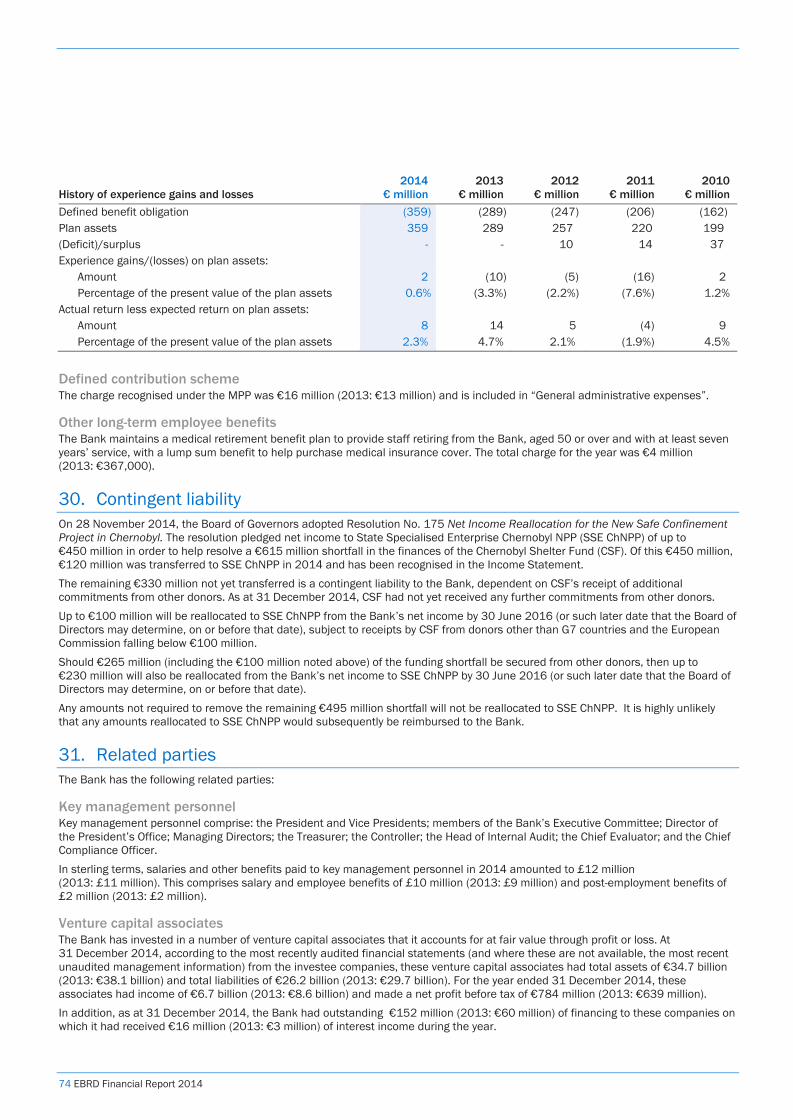
74 EBRD Financial Report 2014
Defined contribution scheme The charge recognised under the MPP was €16 million (2013: €13 million) and is included in “General administrative expenses”.
Other long-term employee benefits The Bank maintains a medical retirement benefit plan to provide staff retiring from the Bank, aged 50 or over and with at least seven years’ service, with a lump sum benefit to help purchase medical insurance cover. The total charge for the year was €4 million (2013: €367,000).
30. Contingent liability On 28 November 2014, the Board of Governors adopted Resolution No. 175 Net Income Reallocation for the New Safe Confinement Project in Chernobyl. The resolution pledged net income to State Specialised Enterprise Chernobyl NPP (SSE ChNPP) of up to €450 million in order to help resolve a €615 million shortfall in the finances of the Chernobyl Shelter Fund (CSF). Of this €450 million, €120 million was transferred to SSE ChNPP in 2014 and has been recognised in the Income Statement. The remaining €330 million not yet transferred is a contingent liability to the Bank, dependent on CSF’s receipt of additional commitments from other donors. As at 31 December 2014, CSF had not yet received any further commitments from other donors. Up to €100 million will be reallocated to SSE ChNPP from the Bank’s net income by 30 June 2016 (or such later date that the Board of Directors may determine, on or before that date), subject to receipts by CSF from donors other than G7 countries and the European Commission falling below €100 million. Should €265 million (including the €100 million noted above) of the funding shortfall be secured from other donors, then up to €230 million will also be reallocated from the Bank’s net income to SSE ChNPP by 30 June 2016 (or such later date that the Board of Directors may determine, on or before that date). Any amounts not required to remove the remaining €495 million shortfall will not be reallocated to SSE ChNPP. It is highly unlikely that any amounts reallocated to SSE ChNPP would subsequently be reimbursed to the Bank.
31. Related parties The Bank has the following related parties:
Key management personnel Key management personnel comprise: the President and Vice Presidents; members of the Bank’s Executive Committee; Director of the President’s Office; Managing Directors; the Treasurer; the Controller; the Head of Internal Audit; the Chief Evaluator; and the Chief Compliance Officer. In sterling terms, salaries and other benefits paid to key management personnel in 2014 amounted to £12 million (2013: £11 million). This comprises salary and employee benefits of £10 million (2013: £9 million) and post-employment benefits of £2 million (2013: £2 million).
Venture capital associates The Bank has invested in a number of venture capital associates that it accounts for at fair value through profit or loss. At 31 December 2014, according to the most recently audited financial statements (and where these are not available, the most recent unaudited management information) from the investee companies, these venture capital associates had total assets of €34.7 billion (2013: €38.1 billion) and total liabilities of €26.2 billion (2013: €29.7 billion). For the year ended 31 December 2014, these associates had income of €6.7 billion (2013: €8.6 billion) and made a net profit before tax of €784 million (2013: €639 million). In addition, as at 31 December 2014, the Bank had outstanding €152 million (2013: €60 million) of financing to these companies on which it had received €16 million (2013: €3 million) of interest income during the year.
History of experience gains and losses 2014
€ million 2013
€ million 2012
€ million 2011
€ million 2010
€ million Defined benefit obligation (359) (289) (247) (206) (162) Plan assets 359 289 257 220 199 (Deficit)/surplus - - 10 14 37 Experience gains/(losses) on plan assets:
Amount 2 (10) (5) (16) 2 Percentage of the present value of the plan assets 0.6% (3.3%) (2.2%) (7.6%) 1.2%
Actual return less expected return on plan assets: Amount 8 14 5 (4) 9 Percentage of the present value of the plan assets 2.3% 4.7% 2.1% (1.9%) 4.5%
EBRD Financial Report 2014 75
Set out below is summarised financial information for each venture capital associate deemed material to the Bank. The information presented is based on the latest set of audited financial statements available at the time for each company which was 31 December 2013.
Special Funds Special Funds are established in accordance with Article 18 of the Agreement Establishing the Bank and are administered under the terms of the rules and regulations for each such Special Fund. At 31 December 2014 the Bank administered 18 Special Funds (2013: 16 Funds) with aggregate pledged contributions amounting to €1.3 billion (2013: €1.1 billion).57 The Bank acts as manager and administrator of the Special Funds for which it receives management and cost recovery fees. In 2014 these fees amounted to €1.2 million (2013: €1.5 million). The Bank pays for guarantees from certain Special Funds in respect of specific exposures arising in its trade finance portfolios for which it paid €0.1 million in 2014 (2013: €0.1 million). In addition, the Bank also benefits from fee-free guarantee arrangements with certain Special Funds for losses that it could potentially incur in its investment activities. The provision of these guarantees qualifies such Special Funds as ‘unconsolidated structured entities’. The Bank’s only exposure to these Special Funds would arise in the period between recognising a guarantee receivable on its balance sheet and the settlement of that receivable. At 31 December 2014 the Bank had €1.3 million such exposure (2013: nil). Audit fees payable to the Bank's auditor for the 2014 audits of the Special Funds totalled €0.1 million (2013: €0.1 million). The financial statements of each Special Fund are approved separately by the Board of Governors at the Bank’s Annual Meeting.
57 This excludes the SEMED Investment Special Fund. See note 33 for an explanation of this fund.
Joint Stock Company Central-Asian
Electric-Power Corporation € million
Komercijalna Banka A.D Beograd
€ million
Privredna banka Zagreb d.d
€ million The Bank’s ownership percentage 24.2% 25.0% 20.9% Principal place of business Kazakhstan Serbia Croatia Summarised balance sheet
Current assets 140 1,760 4,052 Current liabilities 94 1,954 4,390 Non-current assets 582 1,235 5,104 Non-current liabilities 235 498 3,098
Summarised income statement
Revenue 374 239 686 Profit or loss from continuing operations 39 39 107 Other comprehensive income - 4 2 Total comprehensive income 39 42 109
Dividends 8 - 110
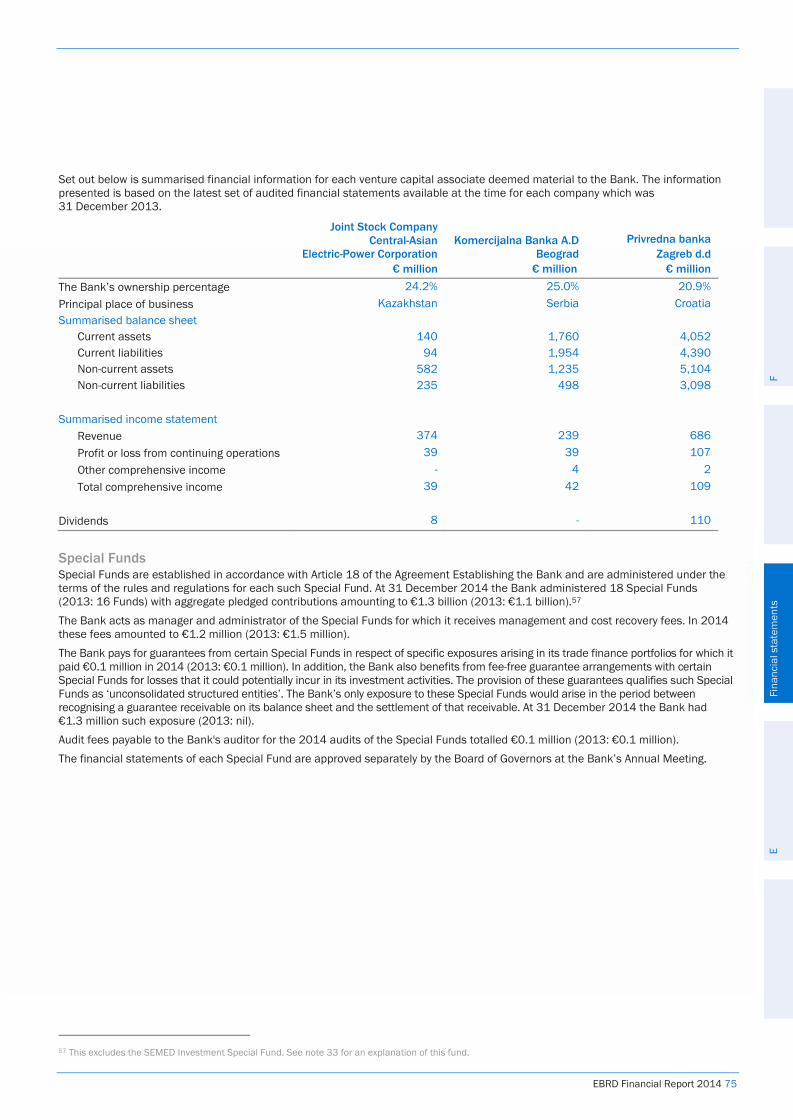
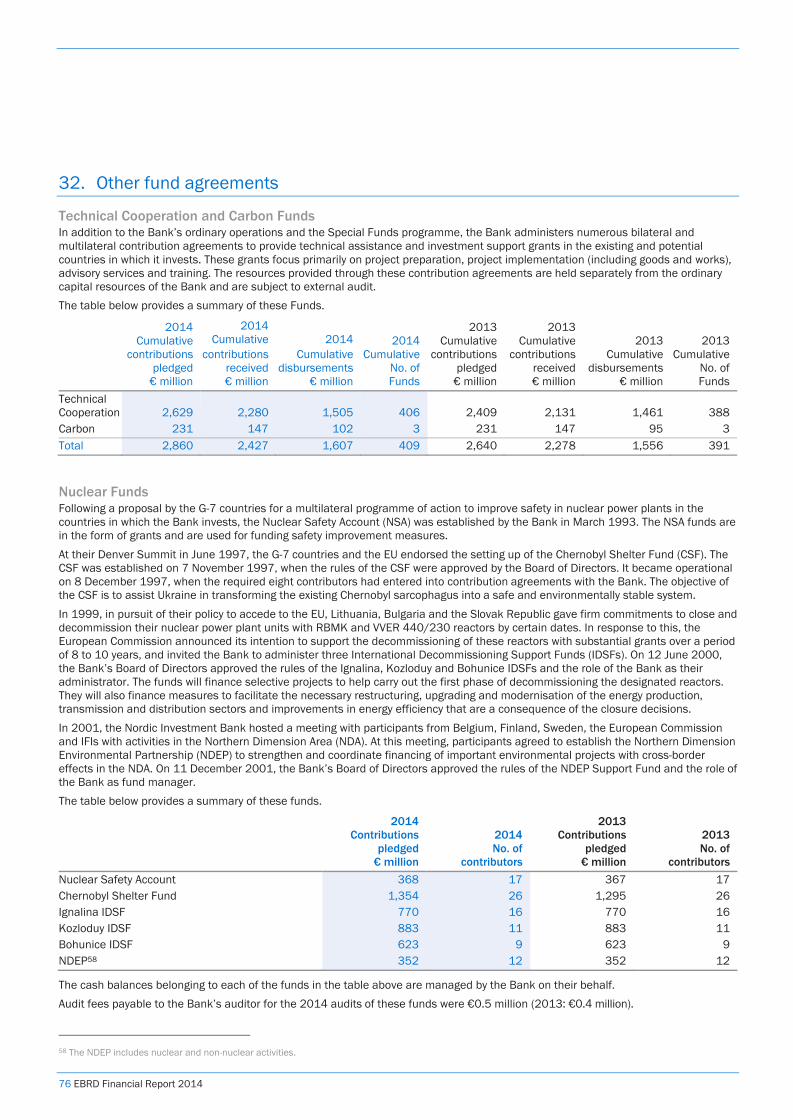
76 EBRD Financial Report 2014
32. Other fund agreements
Technical Cooperation and Carbon Funds In addition to the Bank’s ordinary operations and the Special Funds programme, the Bank administers numerous bilateral and multilateral contribution agreements to provide technical assistance and investment support grants in the existing and potential countries in which it invests. These grants focus primarily on project preparation, project implementation (including goods and works), advisory services and training. The resources provided through these contribution agreements are held separately from the ordinary capital resources of the Bank and are subject to external audit. The table below provides a summary of these Funds.
2014 Cumulative
contributions pledged
€ million
2014 Cumulative
contributions received € million
2014 Cumulative
disbursements € million
2014 Cumulative
No. of Funds
2013 Cumulative
contributions pledged
€ million
2013 Cumulative
contributions received € million
2013 Cumulative
disbursements € million
2013 Cumulative
No. of Funds
Technical Cooperation 2,629 2,280 1,505 406 2,409 2,131 1,461 388 Carbon 231 147 102 3 231 147 95 3 Total 2,860 2,427 1,607 409 2,640 2,278 1,556 391
Nuclear Funds Following a proposal by the G-7 countries for a multilateral programme of action to improve safety in nuclear power plants in the countries in which the Bank invests, the Nuclear Safety Account (NSA) was established by the Bank in March 1993. The NSA funds are in the form of grants and are used for funding safety improvement measures. At their Denver Summit in June 1997, the G-7 countries and the EU endorsed the setting up of the Chernobyl Shelter Fund (CSF). The CSF was established on 7 November 1997, when the rules of the CSF were approved by the Board of Directors. It became operational on 8 December 1997, when the required eight contributors had entered into contribution agreements with the Bank. The objective of the CSF is to assist Ukraine in transforming the existing Chernobyl sarcophagus into a safe and environmentally stable system. In 1999, in pursuit of their policy to accede to the EU, Lithuania, Bulgaria and the Slovak Republic gave firm commitments to close and decommission their nuclear power plant units with RBMK and VVER 440/230 reactors by certain dates. In response to this, the European Commission announced its intention to support the decommissioning of these reactors with substantial grants over a period of 8 to 10 years, and invited the Bank to administer three International Decommissioning Support Funds (IDSFs). On 12 June 2000, the Bank’s Board of Directors approved the rules of the Ignalina, Kozloduy and Bohunice IDSFs and the role of the Bank as their administrator. The funds will finance selective projects to help carry out the first phase of decommissioning the designated reactors. They will also finance measures to facilitate the necessary restructuring, upgrading and modernisation of the energy production, transmission and distribution sectors and improvements in energy efficiency that are a consequence of the closure decisions. In 2001, the Nordic Investment Bank hosted a meeting with participants from Belgium, Finland, Sweden, the European Commission and IFIs with activities in the Northern Dimension Area (NDA). At this meeting, participants agreed to establish the Northern Dimension Environmental Partnership (NDEP) to strengthen and coordinate financing of important environmental projects with cross-border effects in the NDA. On 11 December 2001, the Bank’s Board of Directors approved the rules of the NDEP Support Fund and the role of the Bank as fund manager. The table below provides a summary of these funds.
2014 Contributions
pledged € million
2014 No. of
contributors
2013 Contributions
pledged € million
2013 No. of
contributors Nuclear Safety Account 368 17 367 17
The cash balances belonging to each of the funds in the table above are managed by the Bank on their behalf. Audit fees payable to the Bank’s auditor for the 2014 audits of these funds were €0.5 million (2013: €0.4 million).
58 The NDEP includes nuclear and non-nuclear activities.
Chernobyl Shelter Fund 1,354 26 1,295 26 Ignalina IDSF 770 16 770 16 Kozloduy IDSF 883 11 883 11 Bohunice IDSF 623 9 623 9 NDEP58 352 12 352 12
EBRD Financial Report 2014 77
33. Results from ordinary operations For financial reporting purposes under IFRS, the Bank retains control of any funds transferred to the SEMED ISF59 and accordingly such amounts are recognised in its financial statements. As such, the Bank’s results include those from ordinary operations and its activities in potential countries of operation. Excluding the latter, the results from ordinary operations are disclosed below:
Income statement from ordinary operations
For the year ended 31 December 2014
Year to 31 December 2014
€ million
Year to
31 December 2013 € million
Interest and similar income From Banking loans 1,036 996 From fixed-income debt securities and other interest 109 99
Interest expense and similar charges (90) (90) Net interest expense on derivatives (199) (162) Net interest income 856 843 Net fee and commission income 14 25 Dividend income 109 105 Net (losses)/gains from share investments at fair value through profit or loss (748) 379 Net gains from loans at fair value through profit or loss 3 1 Net gains from loans at amortised cost 7 3 Net gains/(losses) from Treasury assets held at amortised cost 7 (7) Net (losses)/gains from Treasury activities at fair value through profit or loss and foreign exchange (65) 109
Fair value movement on non-qualifying and ineffective hedges (34) 45 Impairment provisions on Banking loan investments (424) (123) Impairment provisions on guarantees 2 (5) General administrative expenses (327) (311) Depreciation and amortisation (26) (26) Net (loss)/profit for the year from continuing operations (626) 1,038 Transfers of net income approved by the Board of Governors (130) (65) Net (loss)/profit after transfers of net income approved by the Board of Governors (756) 973 Attributable to: Equity holders (756) 973
59 Note 26 contains further information concerning the SEMED ISF.
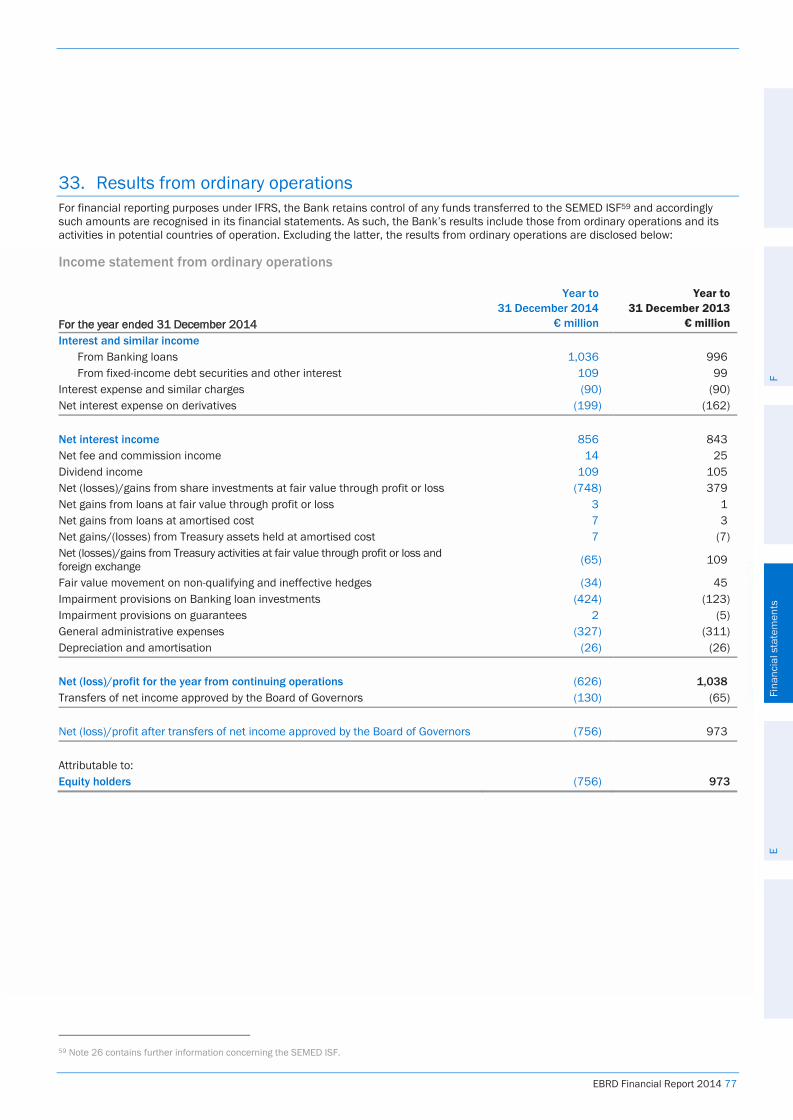
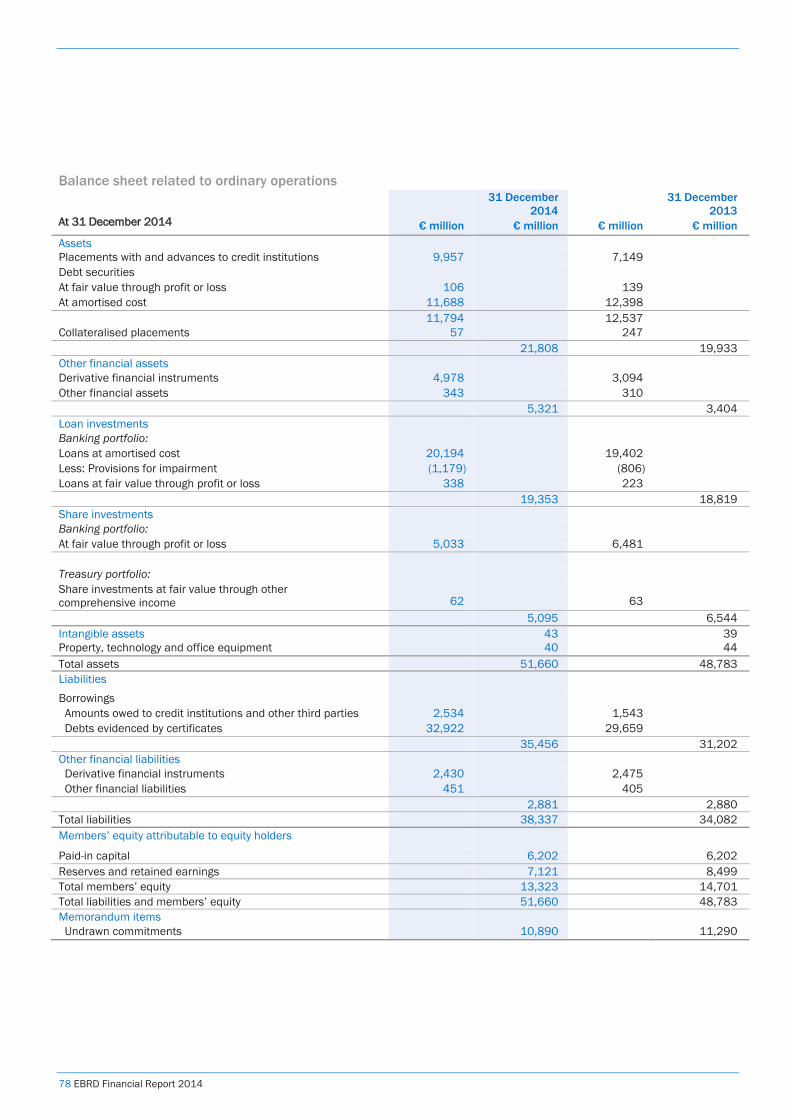
78 EBRD Financial Report 2014
Balance sheet related to ordinary operations
At 31 December 2014 € million
31 December 2014
€ million € million
31 December 2013
€ million Assets Placements with and advances to credit institutions 9,957 7,149 Debt securities At fair value through profit or loss 106 139 At amortised cost 11,688 12,398 11,794 12,537 Collateralised placements 57 247 21,808 19,933 Other financial assets Derivative financial instruments 4,978 3,094 Other financial assets 343 310 5,321 3,404 Loan investments Banking portfolio: Loans at amortised cost 20,194 19,402 Less: Provisions for impairment (1,179) (806) Loans at fair value through profit or loss 338 223 19,353 18,819 Share investments Banking portfolio: At fair value through profit or loss 5,033 6,481 Treasury portfolio: Share investments at fair value through other comprehensive income 62 63 5,095 6,544 Intangible assets 43 39 Property, technology and office equipment 40 44 Total assets 51,660 48,783 Liabilities Borrowings Amounts owed to credit institutions and other third parties 2,534 1,543 Debts evidenced by certificates 32,922 29,659 35,456 31,202 Other financial liabilities Derivative financial instruments 2,430 2,475 Other financial liabilities 451 405 2,881 2,880 Total liabilities 38,337 34,082 Members’ equity attributable to equity holders Paid-in capital 6,202 6,202 Reserves and retained earnings 7,121 8,499 Total members’ equity 13,323 14,701 Total liabilities and members’ equity 51,660 48,783 Memorandum items Undrawn commitments 10,890 11,290
EBRD Financial Report 2014 79
34. Post-balance sheet events There have been no material post-reporting date events that would require adjustment to these financial statements. Movements in the value of the Ukrainian hryvna in 2015 have resulted in a decline in the fair value of the Bank’s equity portfolio of approximately €75 million. Conversely, observable market movements in value of the Bank’s listed equities have resulted in an increase in value of approximately €105 million since 31 December 2014. These gains and losses will be recognised in the 2015 financial statements. Events in Ukraine in 2015 have also resulted in an increase in specific loan provisioning of approximately €40 million on Ukrainian based loans. There have been no other material provisioning moves following 31 December 2014. On 25th February 2015 the Board of Directors reviewed the financial statements and authorised them for issue. These financial statements will be submitted for approval to the Annual Meeting of the Board of Governors to be held on 14-15 May 2015. At 25 February 2015 there had been no other material post-reporting date events.
Responsibility for external financial reporting
80 EBRD Financial Report 2014
Management’s responsibility
Management’s report regarding the effectiveness of internal controls over external financial reporting The management of the European Bank for Reconstruction and Development (the Bank) is responsible for the preparation, integrity, and fair presentation of its published financial statements and associated disclosures presented in this Financial Report. The financial statements have been prepared in accordance with International Financial Reporting Standards (IFRS) issued by the International Accounting Standards Board. The financial statements have been audited by an independent accounting firm, which has been given unrestricted access to all financial records and related data, including minutes of all meetings of the Board of Directors and committees of the Board. Management believes that all representations made to the external auditor during its audit were valid and appropriate. The external auditor’s report accompanies the audited financial statements. Management is responsible for establishing and maintaining effective internal control over external financial reporting for financial presentation and measurement in conformity with IFRS. The system of internal control contains monitoring mechanisms, and actions are taken to correct deficiencies identified. Management believes that internal controls for external financial reporting – which are subject to scrutiny and testing by management and are revised, as considered necessary, taking account of any related internal audit recommendations – support the integrity and reliability of the financial statements. There are inherent limitations in the effectiveness of any system of internal control, including the possibility of human error and the circumvention of overriding controls. Accordingly, even an effective internal control system can provide only reasonable assurance with respect to financial statements. Furthermore, the effectiveness of an internal control system can change with circumstances. The Bank’s Board of Directors has appointed an Audit Committee, which assists the Board in its responsibility to ensure the soundness of the Bank’s accounting practices and the effective implementation of the internal controls that management has established relating to finance and accounting matters. The Audit Committee is comprised entirely of members of the Board of Directors. The Audit Committee meets periodically with management in order to review and monitor the financial, accounting and auditing procedures of the Bank and related financial reports. The external auditor and the internal auditor regularly meet with the Audit Committee, with and without other members of management being present, to discuss the adequacy of internal controls over financial reporting and any other matters that they believe should be brought to the attention of the Audit Committee. The Bank has assessed its internal controls over external financial reporting for 2014. Management’s assessment includes the Special Funds and other fund agreements referred to in notes 31 and 32 of the Financial Report 2014, and the retirement plans. However, the nature of the assessment is restricted to the controls over the reporting and disclosure of these funds/plans within the Bank’s financial statements, rather than the operational, accounting and administration controls in place for each fund. The Bank’s assessment was based on the criteria for effective internal controls over financial reporting described in the “Internal Control – Integrated Framework” issued by the Committee of Sponsoring Organisations of the Treadway Commission (2013 framework). Based upon this assessment, management asserts that at 31 December 2014 the Bank maintained effective internal controls over its financial reporting as contained in the Financial Report 2014. The Bank’s external auditor has provided an audit opinion on the fair presentation of the financial statements presented within the Financial Report 2014. In addition, it has issued an attestation report on management’s assessment of the Bank’s internal control over financial reporting, as set out on page 81.
Suma Chakrabarti President
András Simor Vice President and Chief Financial Officer
European Bank for Reconstruction and Development London 25 February 2015
Report of the independent auditor
EBRD Financial Report 2014 81
To the Governors of the European Bank for Reconstruction and Development We have examined management’s assessment that the European Bank for Reconstruction and Development (the Bank) maintained effective internal controls over financial reporting as contained in the Bank’s Financial Report 2014, based on the criteria for effective internal controls over financial reporting described in the “Internal Control – Integrated Framework” issued by the Committee of Sponsoring Organisations of the Treadway Commission (2013 framework). Management is responsible for maintaining effective internal controls over financial reporting and for the assessment of the effectiveness of internal control over financial reporting. Our responsibility is to express an opinion on management’s assertion over the effectiveness of the Bank’s internal control over financial reporting, based on our examination. We conducted our examination in accordance with the International Standard on Assurance Engagements (ISAE) 3000. Our examination included obtaining an understanding of internal control over financial reporting, evaluating management’s assessment and performing such other procedures as we considered necessary in the circumstances. We believe that our work provides a reasonable basis for our opinion. A bank’s internal controls over financial reporting are designed to provide reasonable assurance regarding the reliability of financial reporting and the preparation of financial statements for external purposes in accordance with generally accepted accounting principles. A bank’s internal controls over financial reporting include those policies and procedures that: (1) pertain to the maintenance of records that, in reasonable detail, accurately and fairly reflect the transactions and dispositions of the assets of the bank; (2) provide reasonable assurance that the transactions are recorded as necessary to permit preparation of financial statements in accordance with generally accepted accounting principles, and that receipts and expenditures of the bank are being made only in accordance with the authorisation of the bank’s management; and (3) provide reasonable assurance regarding prevention or timely detection of unauthorised acquisition, use, or disposition of the bank’s assets that could have a material effect on the financial statements. Because of its inherent limitations, internal control over financial reporting may not prevent or detect misstatements. Also, projections of any evaluation of effectiveness to future periods are subject to the risk that controls may become inadequate because of changes in conditions, or that the degree of compliance with the policies and procedures may deteriorate. In our opinion, management’s assertion that the Bank maintained effective internal control over financial reporting, included within the Responsibility for external financial reporting section of the Bank’s Financial Report 2014 is fairly stated, in all material respects, based on the criteria for effective internal controls over financial reporting described in the “Internal Control – Integrated Framework” issued by the Committee of Sponsoring Organisations of the Treadway Commission (2013 framework). This report, including the opinion, has been prepared for, and only for, the Board of Governors as a body in connection with management’s attestation for maintaining effective internal controls over financial reporting and for no other purpose. We do not, in giving this opinion, accept or assume responsibility for any other purpose or to any other person to whom this report is shown or into whose hands it may come, save where expressly agreed by our prior consent in writing.
Deloitte LLP Chartered Accountants London, United Kingdom 25 February 2015
Independent auditor’s report to the Governors of the European Bank for Reconstruction and Development
82 EBRD Financial Report 2014
Report on the financial statements We have audited the financial statements of the European Bank for Reconstruction and Development (the Bank) for the year ended 31 December 2014 which comprise the income statement, the statement of comprehensive income, the balance sheet, the statement of changes in equity, the statement of cash flows, the risk management disclosures, the accounting policies and the related notes 1 to 34. The financial reporting framework that has been applied in their preparation is the International Financial Reporting Standards as issued by the International Accounting Standards Board.
President’s responsibility for the financial statements The President is responsible for the preparation and fair presentation of the Financial Statements in accordance with the International Financial Reporting Standards issued by the International Accounting Standards Board, and for such internal control as the President determines is necessary to enable the preparation of financial statements that are free from material misstatement, whether due to fraud or error.
Auditor’s responsibility Our responsibility is to express an opinion on these Financial Statements based on our audit. We conducted our audit in accordance with International Standards on Auditing. Those Standards require that we comply with ethical requirements and plan and perform the audit to obtain reasonable assurance whether the Financial Statements are free from material misstatement. An audit involves performing procedures to obtain audit evidence about the amounts and disclosures in the Financial Statements. The procedures selected depend on the auditor's judgment, including the assessment of the risks of material misstatement of the Financial Statements, whether due to fraud or error. In making those risk assessments, the auditor considers internal control relevant to the Bank’s preparation and fair presentation of the Financial Statements in order to design audit procedures that are appropriate in the circumstances, but not for the purpose of expressing an opinion on the effectiveness of the Bank’s Internal control. An audit also includes evaluating the appropriateness of accounting policies used and the reasonableness of accounting estimates made by management, as well as evaluating the overall presentation of the Financial Statements. We believe that the audit evidence we have obtained is sufficient and appropriate to provide a basis for our audit opinion.
Opinion In our opinion the Financial Statements present fairly, in all material respects, the financial position of the Bank as at 31 December 2014 and its financial performance and cash flows for the year then ended in accordance with International Financial Reporting Standards issued by the International Accounting Standards Board.
Other reporting responsibilities We also report to you if, in our opinion, the financial results section of the Financial Report 2014 is not consistent with the Financial Statements, if the proper accounting records for the Bank have not been kept, or if we have not received all the information and explanations we require for our audit. We read the other information contained in the Financial Report 2014 and consider whether it is consistent with the financial statements. We consider the implications for our report if we become aware of any apparent misstatements or material inconsistencies with the financial statements. We have nothing to report to you in connection with these matters.
Other matters This Report, including the opinion, has been prepared for, and only for, the Board of Governors as a body in accordance with Article 24 of the Agreement Establishing the Bank dated 29 May 1990, and for no other purpose. We do not, in giving this opinion, accept or assume responsibility for any other purpose or to any other person to whom this Report is shown or into whose hands it may come, save where expressly agreed by our prior consent in writing.
Deloitte LLP Chartered Accountants London, United Kingdom 25 February 2015
Notes
EBRD Financial Report 2014 83

Notes
EBRD Financial Report 2014 83

Notes
84 EBRD Financial Report 2014

View this Financial Report online www.ebrd.com/financialreport
The Financial Report 2014 includes the approved and audited financial statements required to be submitted under Article 27 of the Agreement Establishing the European Bank for Reconstruction and Development and Section 13 of its By-Laws.
The EBRD is investing in changing people’s lives and environments from central Europe to Central Asia, the Western Balkans and the southern and eastern Mediterranean region. With an emphasis on working with the private sector, we invest in projects, engage in policy dialogue and provide technical advice that fosters innovation and builds sustainable and open-market economies.
Controller’s officeNigel KerbyTerry CullenGordon JonesLiyuan Malone
Editorial productionLucy PlaskettJane RossNatasha Treloar
Design and print managementDaniel Kelly
European Bank for Reconstruction and DevelopmentOne Exchange SquareLondon EC2A 2JNUnited KingdomSwitchboard/central contactTel: +44 20 7338 6000Fax: +44 20 7338 6100
Information requests
For information requests and general enquiries, please use the form at www.ebrd.com/inforequest
Project enquiries
Tel: +44 20 7338 7168Fax: +44 20 7338 7380Email: [email protected]
EBRD publicationsTel: +44 20 7338 7553Fax: +44 20 7338 6102Email: [email protected]
Websitewww.ebrd.com
Printed in England by Park Communications which operates an environmental waste and paper recycling programme. The Financial Report 2014 is printed on GalerieArt Satin™ containing 100 per cent virgin fibre sourced from responsibly managed, FSC® and PEFC certified forests. The pulp used in this product is bleached using an Elemental Chlorine Free (ECF) process and the inks are vegetable oil based and environmentally friendly. The cover is printed on Vision Superior.
Park Communications is an EMAS-certified company and its Environmental Management System is certified to ISO 14001.
539 Financial Report 2014 (E/2,000)
© European Bank for Reconstruction and Development
All rights reserved. No part of this publication may be reproduced or transmitted in any form or by any means including photocopying and recording, without the written permission of the copyright holder. Such written permission must also be obtained before any part of this publication is stored in a retrieval system of any nature.
Applications for such permission should be addressed to: Head, Long-term Communications Output, Communications, EBRD, One Exchange Square, London EC2A 2JN, United Kingdom, or by email to: [email protected]

FINANCIAL REPORT2014
WWW.EBRD.COM/FINANCIALREPORT
European Bank for Reconstruction and Development One Exchange Square London EC2A 2JN United Kingdom
Tel: +44 20 7338 6000 Fax: +44 20 7338 6100 Requests for publications: [email protected]
FINANCIAL REPORT2014
WWW.EBRD.COM/FINANCIALREPORT
FINANCIAL REPORT2014
WWW.EBRD.COM/FINANCIALREPORT
FINAN
CIAL R
EPO
RT 201
4