Embed Size (px)
Citation preview

© 2019 NIIT Technologies | www.niit-tech.com | Confidential
11© 2020 NIIT Technologies
Financial Performance– Q4FY20
May 05, 2020

© 2019 NIIT Technologies | www.niit-tech.com | Confidential
22
Agenda
▪ Financial Highlights
▪ Business Update
▪ Financial Statements• Income Statement
• Balance Sheet
▪ Business Analysis

© 2019 NIIT Technologies | www.niit-tech.com | Confidential
33© 2020 NIIT Technologies | www.niit-tech.com | Confidential
3
Financial Highlights – Q4FY20
Q4 Revenue at INR 11,093 Mn
• Up 14.1% YoY, Up 3.3% QoQ
• Up 19.0% YoY excl GIS business
• Constant currency organic revenue
growth is 3.0%
Net Profits at INR 1,136 Mn
• Up 7.7% YoY, down 7.9% QoQ
• Net Profit excl. GIS business Up 11.4%
YoY
EBITDA at INR 1,971 Mn
• Up 15.5% YoY, Up 1.6% QoQ
• EBITDA Margins at 17.8%, Down 31 bps
QoQ and up 22 bps YoY
Order Intake at $180 Mn
• $468 Mn of firm business executable
over next 12 months
© 2019 NIIT Technologies | www.niit-tech.com | Confidential
44© 2020 NIIT Technologies | www.niit-tech.com | Confidential
4
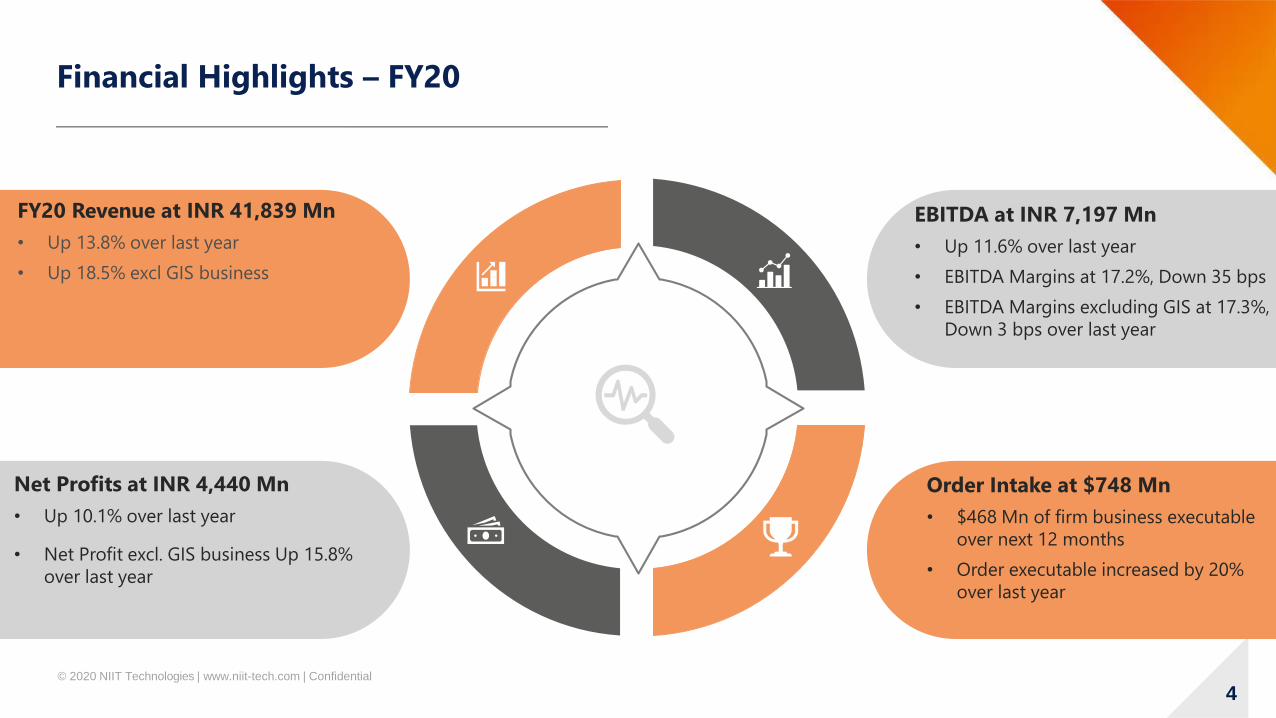
Financial Highlights – FY20
FY20 Revenue at INR 41,839 Mn
• Up 13.8% over last year
• Up 18.5% excl GIS business
Net Profits at INR 4,440 Mn
• Up 10.1% over last year
• Net Profit excl. GIS business Up 15.8%
over last year
EBITDA at INR 7,197 Mn
• Up 11.6% over last year
• EBITDA Margins at 17.2%, Down 35 bps
• EBITDA Margins excluding GIS at 17.3%,
Down 3 bps over last year
Order Intake at $748 Mn
• $468 Mn of firm business executable
over next 12 months
• Order executable increased by 20%
over last year
© 2019 NIIT Technologies | www.niit-tech.com | Confidential
55© 2020 NIIT Technologies | www.niit-tech.com | Confidential
5
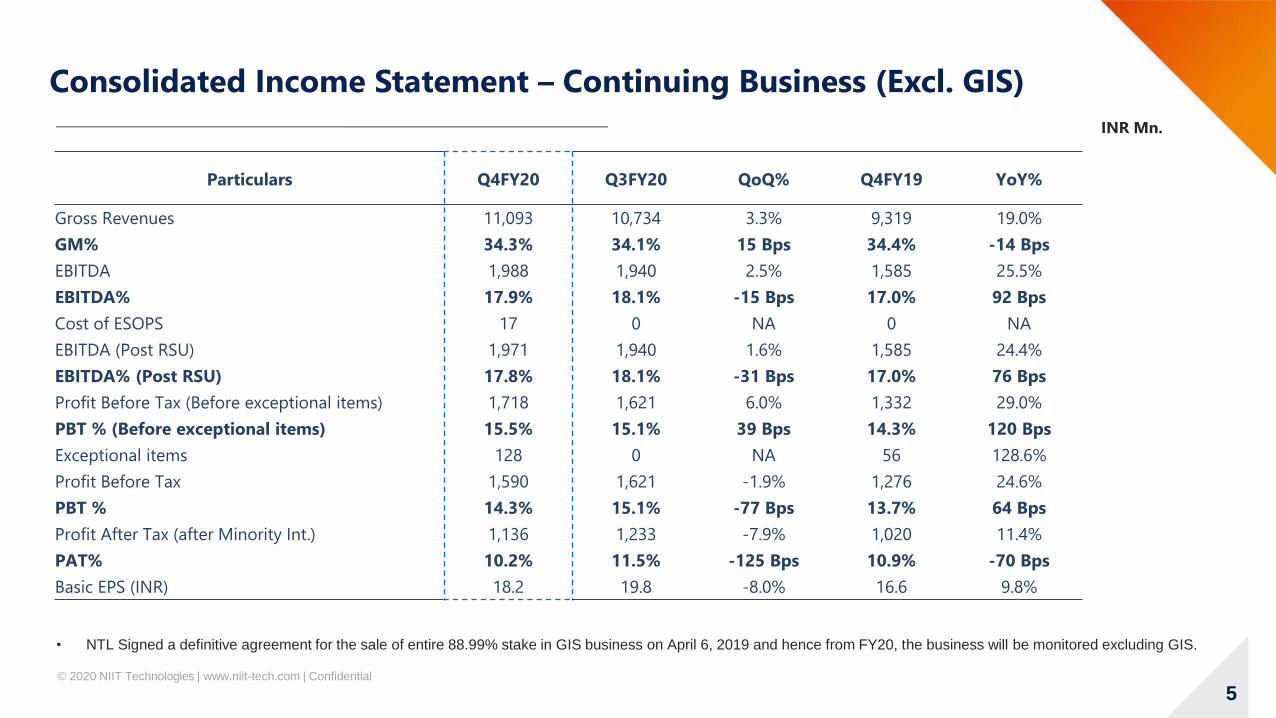
Consolidated Income Statement – Continuing Business (Excl. GIS)
• NTL Signed a definitive agreement for the sale of entire 88.99% stake in GIS business on April 6, 2019 and hence from FY20, the business will be monitored excluding GIS.
INR Mn.
Particulars Q4FY20 Q3FY20 QoQ% Q4FY19 YoY%
Gross Revenues 11,093 10,734 3.3% 9,319 19.0%
GM% 34.3% 34.1% 15 Bps 34.4% -14 Bps
EBITDA 1,988 1,940 2.5% 1,585 25.5%
EBITDA% 17.9% 18.1% -15 Bps 17.0% 92 Bps
Cost of ESOPS 17 0 NA 0 NA
EBITDA (Post RSU) 1,971 1,940 1.6% 1,585 24.4%
EBITDA% (Post RSU) 17.8% 18.1% -31 Bps 17.0% 76 Bps
Profit Before Tax (Before exceptional items) 1,718 1,621 6.0% 1,332 29.0%
PBT % (Before exceptional items) 15.5% 15.1% 39 Bps 14.3% 120 Bps
Exceptional items 128 0 NA 56 128.6%
Profit Before Tax 1,590 1,621 -1.9% 1,276 24.6%
PBT % 14.3% 15.1% -77 Bps 13.7% 64 Bps
Profit After Tax (after Minority Int.) 1,136 1,233 -7.9% 1,020 11.4%
PAT% 10.2% 11.5% -125 Bps 10.9% -70 Bps
Basic EPS (INR) 18.2 19.8 -8.0% 16.6 9.8%
© 2019 NIIT Technologies | www.niit-tech.com | Confidential
66© 2020 NIIT Technologies | www.niit-tech.com | Confidential
6
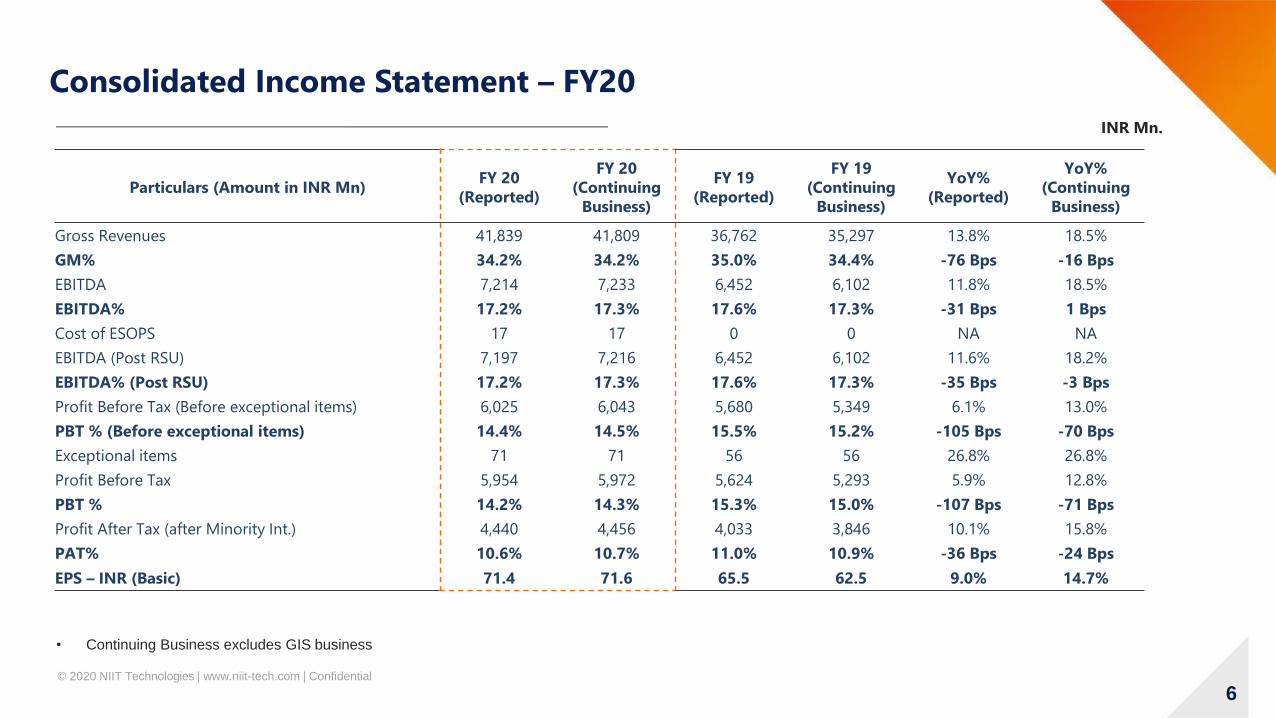
Consolidated Income Statement – FY20
• Continuing Business excludes GIS business
INR Mn.
Particulars (Amount in INR Mn)FY 20
(Reported)
FY 20
(Continuing
Business)
FY 19
(Reported)
FY 19
(Continuing
Business)
YoY%
(Reported)
YoY%
(Continuing
Business)
Gross Revenues 41,839 41,809 36,762 35,297 13.8% 18.5%
GM% 34.2% 34.2% 35.0% 34.4% -76 Bps -16 Bps
EBITDA 7,214 7,233 6,452 6,102 11.8% 18.5%
EBITDA% 17.2% 17.3% 17.6% 17.3% -31 Bps 1 Bps
Cost of ESOPS 17 17 0 0 NA NA
EBITDA (Post RSU) 7,197 7,216 6,452 6,102 11.6% 18.2%
EBITDA% (Post RSU) 17.2% 17.3% 17.6% 17.3% -35 Bps -3 Bps
Profit Before Tax (Before exceptional items) 6,025 6,043 5,680 5,349 6.1% 13.0%
PBT % (Before exceptional items) 14.4% 14.5% 15.5% 15.2% -105 Bps -70 Bps
Exceptional items 71 71 56 56 26.8% 26.8%
Profit Before Tax 5,954 5,972 5,624 5,293 5.9% 12.8%
PBT % 14.2% 14.3% 15.3% 15.0% -107 Bps -71 Bps
Profit After Tax (after Minority Int.) 4,440 4,456 4,033 3,846 10.1% 15.8%
PAT% 10.6% 10.7% 11.0% 10.9% -36 Bps -24 Bps
EPS – INR (Basic) 71.4 71.6 65.5 62.5 9.0% 14.7%

© 2019 NIIT Technologies | www.niit-tech.com | Confidential
77© 2020 NIIT Technologies | www.niit-tech.com | Confidential
7
INR Mn.
Balance Sheet
• Reserves and Surplus up INR 244 Mn over LQ. • Cash and Bank Balances Up by INR 305 Mn over LQ
• DSO – 74 days
• Capex during the Qtr – INR 128 Mn
ParticularsAs at Mar 31
2020
As at Dec 31
2019
As at Mar 31
2019Particulars
As at Mar 31
2020
As at Dec 31
2019
As at Mar 31
2019
Equity 625 625 618 Fixed Assets 4,805 4,867 4,223
Reserves & Surplus 23,340 23,096 20,105 Capital Work in Progress 3 34 14
Intangible Assets 5,988 6,211 3,996
NET Worth 23,965 23,721 20,723 Current Assets
Cash and Cash Equivalent 9,365 9,060 9,758
Bank Borrowings 315 41 71 Debtors 8,565 7,543 6,189
Deferred Payment Liabilities 37 169 63 Other Current Assets 4,369 3,805 3,428
Deferred Tax Liability 397 472 395 Current Liabilities -7,689 -6,639 -5,453
Minority Interest 0 0 75 Future Acquisition Liability -1,994 -1,753 -1,954
Deferred Tax Assets 1,302 1,275 1,126
24,714 24,402 21,327 24,714 24,402 21,327

© 2019 NIIT Technologies | www.niit-tech.com | Confidential
88© 2020 NIIT Technologies | www.niit-tech.com | Confidential
8
Geography Mix
Q4FY20:
• Growth in EMEA due to higher revenues in key accounts in BFS, NITL and
Whishworks
• Decline in Americas due to lower revenue in TTH
Americas48%
EMEA37%
ROW15%
Americas46%
EMEA40%
ROW14%
Q4FY20Q3FY20
Americas48%
EMEA37%
ROW15%
FY20
Americas49%
ROW18%
EMEA33%
FY19
FY20:
• Significant growth in EMEA due to higher revenues in key accounts in
BFS, TTH and growth in NITL Business and Whishworks Business

© 2019 NIIT Technologies | www.niit-tech.com | Confidential
99© 2020 NIIT Technologies | www.niit-tech.com | Confidential
9
Vertical Mix
Q4FY20:
• Insurance vertical grew due to growth in US and EMEA
• Decline in TTH
• Growth in Others vertical due to growth in Whishworks
BFS16%
Insurance30%
TTH29%
Others25%
Others27%
BFS15%
Insurance31%
TTH27%
Q4FY20Q3FY20
BFS16%
Insurance30%
TTH28%
Others26%
FY20
Insurance29%
BFS16%
TTH27%
Others28%
FY19
FY20:
• Growth in TTH on account of growth in top accounts in EMEA and US
• Insurance vertical grew mainly on account of growth top accounts in US
and NITL business

© 2019 NIIT Technologies | www.niit-tech.com | Confidential
1010© 2020 NIIT Technologies | www.niit-tech.com | Confidential
10
I
Service Mix
IMS
16%
ADM
73%
IP Based
6%
BPO
3%
SI & PI
2%
IP Based
8%
ADM
71%
BPO
3%
IMS
16%
SI & PI
2%
Q4FY20
IP Based
6%
ADM
73%
BPO
3%
SI & PI
1%
IMS
17%
FY20FY19
Q3FY20
ADM
69%
IMS
18%
IP Based
6%
BPO
4%
SI & PI
4%
Q4FY20:
• Digital revenue at 38%
• The product and IP based revenue stands at 8%
FY20:
• Digital revenue at 37%
• The product and IP based revenue stands at 6%

© 2019 NIIT Technologies | www.niit-tech.com | Confidential
1111© 2020 NIIT Technologies | www.niit-tech.com | Confidential
11
• 10 new customers added: 3 in US, 6 in EMEA and 1 in ROW
• $180 Mn order intake in the quarter leading to $ 468 Mn of firm business executable over next 12 months
• Geographical breakdown of order intake – US (81 Mn), EMEA (52 Mn), ROW (47 Mn)
Order Intake
175 176
218
180
80
100
120
140
160
180
200
220
240
Q1 FY20 Q2 FY20 Q3 FY20 Q4 FY20
Order Intake ($ Mn)

© 2019 NIIT Technologies | www.niit-tech.com | Confidential
1212© 2020 NIIT Technologies | www.niit-tech.com | Confidential
12
MM $ Clients 100 106
Top Client Mix
27% 27%
36% 37%
50% 50%
50% 50%
Q3'20 Q4'20
Others
Top 20
Top 10
Top 5

© 2019 NIIT Technologies | www.niit-tech.com | Confidential
1313© 2020 NIIT Technologies | www.niit-tech.com | Confidential
13
People Resources
10,297
10,800 10,849
11,156
June'19 Sept'19 Dec'19 Mar'20
People Data
Net Additions 34 503 49 307
Attrition% 12.98% 12.33% 11.93% 11.75%
Utilization 80.5% 80.7% 79.3% 78.1%

© 2019 NIIT Technologies | www.niit-tech.com | Confidential
1414
End of Document