Embed Size (px)
Citation preview
WORKING PAPER SERIESNO 1451 / JULY 2012
FINANCIAL MARKETS AND INTERNATIONAL RISK SHARING IN
EMERGING MARKET ECONOMIES
by Martin Schmitz
NOTE: This Working Paper should not be reported as representing the views of the European Central Bank (ECB). The views expressed are
those of the authors and do not necessarily refl ect those of the ECB.
In 2012 all ECB publications
feature a motif taken from
the €50 banknote.

© European Central Bank, 2012
AddressKaiserstrasse 29, 60311 Frankfurt am Main, Germany
Postal addressPostfach 16 03 19, 60066 Frankfurt am Main, Germany
Telephone+49 69 1344 0
Internethttp://www.ecb.europa.eu
Fax+49 69 1344 6000
All rights reserved.
ISSN 1725-2806 (online)
Any reproduction, publication and reprint in the form of a different publication, whether printed or produced electronically, in whole or in part, is permitted only with the explicit written authorisation of the ECB or the authors.
This paper can be downloaded without charge from http://www.ecb.europa.eu or from the Social Science Research Network electronic library at http://ssrn.com/abstract_id=2101194.
Information on all of the papers published in the ECB Working Paper Series can be found on the ECB’s website, http://www.ecb.europa.eu/pub/scientifi c/wps/date/html/index.en.html
AcknowledgementsForthcoming in International Journal of Finance and Economics. I am grateful for comments and discussions to an anonymous referee of the IJFE, Michael Fidora, Marcel Fratzscher, Philipp Hartmann, Christiane Hellmanzik, Danielle Kedan, Philip Lane and Mark Taylor.
Martin Schmitzat European Central Bank, Kaiserstrasse 29, D-60311 Frankfurt am Main, Germany; e-mail: [email protected]

Abstract
In light of rapidly increasing foreign equity liability positions of emerging market economies,
we test for a necessary condition of international risk sharing, namely for systematic pat-
terns between idiosyncratic output fluctuations and financial market developments. Panel
analysis of 22 emerging market economies shows strong evidence for pro-cyclicality of capital
gains on domestic stock markets both over short and medium term horizons. This implies
that domestic output fluctuations can be hedged through cross-border ownership of financial
markets.
Keywords: International risk sharing, capital gains, cross-border investment, financial
globalisation, emerging market economies
JEL Classification: F21, F30, G15
1

Non-technical summary
In light of rapidly increasing foreign equity liability positions of emerging market economies
(EMEs), we test for a necessary condition of international risk sharing, namely for systematic
patterns between idiosyncratic output fluctuations and financial market developments. With
a focus on stock market developments in EMEs, we analyse the potential for hedging against
domestic output and wealth fluctuations by means of cross-country ownership of financial assets.
In times of increasing international financial integration, both investment income flows and
capital gains are channels that can potentially provide international risk sharing. Emerging
markets have experienced a shift in their external liability position both in terms of quantity
and composition toward equity investments. Consequently, as capital markets are partly owned
by foreign investors, a pro-cyclical co-movement of stock markets with GDP growth brings about
wealth stabilisation. This implies that the performance of domestic stock markets should improve
in times of faster domestic GDP growth; that is delivering higher capital gains for domestic and
foreign investors. The benefit for foreign investors from an economic up-swing is in the form of
capital gains and dividend payments which represents a “benign loss” for the domestic economy.
This decreases domestic income and wealth commensurately, thus providing a smoothing or
“hedging” of the economic performance. Pro-cyclicality implies that this smoothing mechanism
also functions when the economy performs poorly, since now there should be capital losses (due
to falling share prices) and lower dividend payments.
To determine the cyclicality of stock markets, we analyse the co-movement of domestic output
innovations (GDP growth rates) and the performance of domestic stock markets as measured
by real rates of capital gains. In line with previous studies on co-movements of stock markets
and in the fiscal policy literature, we employ regression-based measures of cyclicality. Panel
analysis of 22 emerging market economies over the period 1996 to 2010 shows strong evidence
for pro-cyclicality of capital gains on domestic stock markets both over short and medium term
horizons. In particular, the results reveal that the idiosyncratic part of domestic GDP growth
is also reflected in domestic stock market capital gains. This implies that EMEs can share
part of their country-specific macroeconomic risks with foreign investors through cross-border
ownership of financial markets.
A country by country analysis reveals pro-cyclicality of capital gains for the majority of
countries. Consequently, given the growing foreign liability positions of EMEs in terms of
portfolio equity and FDI, international risk sharing is likely to act increasingly as an important
stabilising mechanism for these countries. For EMEs this finding is particularly relevant, as
these often face higher country specific productivity and growth risks than industrial countries.
Moreover, they tend to exhibit a higher volatility in their growth performance. Our results also
indicate that countries with higher financial development tend to have a more positive cyclicality
coefficient implying better hedging capacity vis-a-vis foreign investors.
2
1 Introduction
This paper provides a financial market approach on the topic of international risk sharing in
emerging market economies (EMEs). Most of the research on international risk sharing has
focused on indirect tests of the degree of risk sharing by analysing the co-movement of domestic
and foreign consumption growth rates.1
From a theoretical perspective this paper builds on Deveureux and Sutherland (2009) who
develop a DSGE model in order to compute equilibrium portfolios in a framework of alternative
international financial structures. They find a considerable degree of international risk shar-
ing in a setting where EMEs hold nominal bonds as foreign assets and issue claims on equity
investments (portfolio equity and FDI). This scenario is consistent with the present structure
of two-way capital flows between emerging and advanced economies (Figure 1 and Figure 4).
While accumulating large reserve assets since the late 1990s, emerging market economies have
received substantial portfolio equity and FDI inflows.
The empirical analysis of this paper follows the methods used by Schmitz (2010) who focuses
on a sample of industrial countries. In employing a capital market approach, we analyse the
potential for hedging against domestic output and wealth fluctuations by means of cross-country
ownership of financial assets. We test if a necessary condition for the sharing of macroeconomic
risks is fulfilled, namely that there are systematic patterns between macroeconomic fluctuations
and capital gains on financial markets. If domestic capital markets are partly owned by foreign
investors, a pro-cyclical co-movement of capital gains with GDP growth brings about wealth
stabilisation.2
Obstfeld (2004) shows that in an ideal world with complete Arrow-Debreu securities, a
country is fully insured against domestic output shocks. Hence, fluctuations in consumption
are decoupled from idiosyncratic fluctuations in output, with consumption growth rates across
countries being perfectly correlated. Securities that could in theory deliver international risk
sharing are bilateral GDP income swaps as proposed by Merton (1990) or GDP linked securities
(Shiller, 1993).
Due to the lack of these instruments we use the following application as in Schmitz (2010):
when domestic GDP grows faster, the domestic stock market performance should improve ac-
cordingly; that is delivering higher capital gains for domestic and foreign investors. The benefit
for foreign investors from this economic up-swing is in the form of capital gains and dividend
payments which represents a “benign loss” for the domestic economy. This decreases domestic
1Backus, Kehoe and Kydland (1995) and Lewis (1996) show that output growth is more highly correlatedacross countries than consumption growth (the consumption correlations puzzle). Recent work reports that thedegree of risk sharing has increased over time, which can be linked to the internationalisation of portfolios, thatis the declining home bias of financial investors (e.g. Sørensen et al., 2007).
2This is also a key assumption in the model of Devereux and Sutherland (2009), where equity returns in theforeign (emerging) economy co-vary positively with GDP in this country. Obstfeld (2006) argues that evaluatingthe potential for international risk sharing through the capital gains channel empirically is ‘essential’ in order toevaluate the stabilising effects of international investments.
3

income and wealth commensurately, thus providing a smoothing or “hedging” of the economic
performance across the different states of the world.3 Obviously, this smoothing mechanism also
functions when the economy performs poorly, since now there should be capital losses (due to
falling share prices) and lower income outflows.
Along with the model of Deveureux and Sutherland (2009), our application is related to
Davis, Nalewaik and Willen (2001) who develop a procedure to assess the gains to international
financial trade in risky assets depending on the correlations of domestic and international equity
returns and domestic output innovations.4 Another theoretical perspective is provided by factor
pricing models (for example Chen, Roll and Ross, 1986) where asset prices reflect innovations
in macroeconomic variables such as industrial production.
The international sharing of idiosyncratic macroeconomic risks is particularly relevant for
EMEs, as they often face higher country specific productivity and growth risk than industrial
countries. Moreover, they exhibit a higher volatility in their growth performance. Emerging
markets have experienced a shift in their external liability position both in terms of quantity
and composition toward equity investments. This can be partly attributed to a liberalisation of
the capital account in EMEs as well as further developed financial systems and policies favouring
equity investments. Faria et al. (2007) indeed find higher equity shares in the composition of
foreign liabilities in the last decade.
In times of increasing international financial integration, both investment income flows and
capital gains are channels that can potentially provide international risk sharing.5 For indus-
trial countries, Lane (2001) analysed the former channel using data on international investment
positions, whereas Schmitz (2010) investigated the latter (without finding evidence for income
smoothing or hedging through these channels at business cycle frequencies). The capital gains
channel is of growing relevance to EMEs with large equity shares in their portfolios which make
most of their returns in the form of capital gains (thus not affecting investment income flows).6
We focus in our analysis on capital gains on domestic stock markets (as a proxy for the foreign
equity liability side).7,8
For industrial countries, Schmitz (2010) finds evidence that this channel is functioning over
the medium-term by means of pro-cyclicality of capital gains on domestic stock markets. For
emerging markets the channel is largely unexplored. Kose, Prasad and Terrones (2009) find
that emerging market economies have not benefited from improved international (consumption)
3If firms choose not to pay out dividends, but instead to keep retained earnings, the mechanism works as well,since this should be reflected in higher stock prices and thus capital gains.
4See their paper for a model of international trade in risky financial assets under incomplete markets.5See Lane and Milesi-Ferretti (2007) for a documentation of the rapid growth in cross-border financial holdings.6The realisation of capital gains and losses involves liquidation costs however, which increase with the extent
of illiquidity. This applies to FDI in particular, but less to portfolio investments.7One could also use international investment positions and balance of payments data in order to approximate
capital gains on international investments, however these are usually similar to market rates, but often lessaccurate and poorer in terms of data availability - see Lane and Milesi-Ferretti (2009).
8Capital gains on foreign assets, on the other hand, are influenced by a broad range of global factors such thata satisfying analysis is beyond the scope of this paper.
4

risk sharing over the last decades, in contrast to industrial countries (Sørensen et al., 2007). In
particular they find that the issuance of debt liabilities (which were the dominant part of the
external liabilities of EMEs for a long period of time) are not conducive to risk sharing.9 Bracke
and Schmitz (2011) show that for industrial countries net capital gains on international portfolio
equity positions tend to be countercyclical and that countries with more countercyclical capital
gains tend to obtain better consumption risk sharing. Balli, Kalemli-Ozcan and Sørensen (2011)
analyse that capital gains have been as important as factor income flows in smoothing income
over the last decade, especially for countries in the European Monetary Union.10
Two main contributions are made in this paper: first the cyclicality of capital gains on
equity markets in EMEs is analysed in panel data and on the country level; second, cross-
country variation in cyclicality patterns is examined formally in order to find the fundamental
reasons for differing degrees of international risk sharing.11
Accordingly, the rest of this paper is organised as follows: section two presents the data,
while section three shows stylised facts on the external capital structure of EMEs. The empirical
strategy is presented in section four, while the empirical analysis starts in the fifth section by
investigating co-movements of domestic stock markets and GDP growth rates. Subsequently
determinants of country heterogeneity will be approached in section six; finally some concluding
remarks will be made.
2 Data
In order to study the cyclical properties of stock markets, we collected data on 21 emerging
market economies.12 This choice of the sample is very much determined by data availability
both in terms of length and scope. We are able to capture the time series from 1996 to 2010.
We employ the Morgan Stanley Capital International (MSCI) domestic and global equity
price indices in order to calculate annual rates of capital gains. These are available both in terms
of domestic currency and US dollars and have the advantage of including only pure equity prices
(thus without dividend payments). Hence these indices are appropriate in order to analyse the
capital gains channel of international investments. Furthermore we employ data provided by the
World Bank Financial Structure Dataset (Beck and Demirguc-Kunt, 2009) on domestic stock
market capitalisation.
9On the asset side, EMEs have accumulated large amounts of foreign reserves, which might not facilitateinternational risk sharing.
10Forster, Vasardani and Ca’ Zorzi (2011) mention as benefits of increased international financial integration(along with international risk sharing) the positive impact on domestic investment and growth as well as greaterdepth of domestic financial systems, while costs may arise for example from misallocation of resources as well aspro-cyclicality and volatility of cross-border flows.
11This two-step approach is adapted from Lane’s (2003) cyclicality analysis on fiscal policy and has been appliedto industrial countries by Schmitz (2010).
12Argentina, Brazil, China, Colombia, Czech Republic, Hong Kong, Hungary, India, Indonesia, Korea, Malaysia,Mexico, Peru, Philippines, Poland, Russia, Singapore, South Africa, Taiwan, Thailand, and Turkey.
5

GDP (at constant prices) and CPI data for individual countries and the world economy are
retrieved from Haver Analytics. Conventionally, GDP growth rates measure the average growth
rate in a given year; however, this is not appropriate for our analysis. As we are dealing with
stock market rates of capital gains - which are essentially year-end to year-end rates - one has
to apply the same logic to real rates of GDP growth. Consequently we construct a year-end to
year-end rate of GDP growth by considering real GDP in the last quarter of a given year relative
to the last quarter of the year before. Thus we obtain a real GDP growth rate which is consistent
with the other variables in our analysis. In an equivalent way we construct appropriate inflation
rates in order to calculate real rates of capital gains. Output per capita data are taken from the
World Bank’s World Development Indicators.
Given the data availability and the empirical focus on cyclical factors, the data used are at
annual frequency.
3 Stylised Facts on the External Capital Structure of EMEs
EMEs have seen a substantial increase in portfolio equity liabilities over the last decade. Figure
1 shows that for the big majority of countries in the sample the ratio of foreign portfolio equity
liabilities to GDP has grown from 1996 to 2007.13 The biggest increase can be observed for
Russia (by a factor of 19), Brazil, China, and Korea, while the ratio is the highest for Hong
Kong and Singapore (209% and 92% of GDP, respectively, not shown in Figure 1), followed by
Taiwan (53% of GDP).
It is a reasonable assumption that most of these holdings by foreign investors are invested in
market portfolios (as proxied by the respective MSCI indices) or in portfolios closely following
these. Moreover, capital gains on foreign direct investments also move very closely with domestic
stock market indices (as shown by Lane and Milesi-Feretti, 2003).14
Accordingly, the cyclicality analysis in this paper captures the hedging potential for EMEs
through both their portfolio equity and FDI liabilities. These constitute a large share of overall
foreign liabilities as visible in Figure 2: the equity share was between 60% to 70% of total
liabilities in 2007 for most EMEs, whereas it only amounted to around 20% to 30% in 1996.
Figure 3 shows that there was not only a shift in the composition of the external balance
sheet of EMEs, but also, financial development in terms of stock market capitalisation has
increased tremendously in most EMEs, thus offering more investment opportunities to domestic
and foreign investors.
In line with the model of Deveureux and Sutherland (2009), we find that not only the liability
side of EMEs is consistent with their model, but also the foreign asset side, where EMEs have
13The exceptions being Argentina, Chile, and Venezuela.14The authors find that domestic stock market returns explain returns on FDI measured at market value in the
international investment positions data much better than returns based on FDI measured at book-value (whichis still common practice for most countries). FDI, however, is often a considerably less liquid investment thanportfolio investments.
6

accumulated large reserve assets since 1996 (Figure 4).15
4 Empirical strategy
As outlined above we use the approach of Schmitz (2010) to analyse the co-movement of domestic
output innovations (that is GDP growth rates) and the performance of domestic stock markets
as measured by real rates of capital gains. The main focus of the paper lies on panel analyis;
however, we also estimate variants of the regression specifications on a country-by-country basis.
This allows for establishing potential country heterogeneity in cyclicality patterns which we seek
to explain in the second step of our analysis. Moreover, it offers a robustness check by observing
which countries drive the overall panel results.
It is crucial to stress that the aim of this paper is not to provide an econometric model
that explains capital gains. But the emphasis rather is on the co-movement of capital gains on
equity investments and GDP growth in order to establish conclusions about cyclicality and the
associated international risk sharing properties.
4.1 Panel Analysis
For our panel of countries we run the specification
kgit = αi + δt + βgit + eit (1)
where eit is first-order autoregressive with an error term zit which is assumed to be independent
and identically distributed with N(0, σ2z). kg is the annual real rate of capital gains on the
respective domestic stock market and g is the real annual rate of domestic GDP growth.16The
potential for international risk sharing and thus hedging is facilitated by β > 0.17
The regression estimation is by least squares. We employ a within-group fixed effects esti-
mator with first-order autoregressive disturbances (in order to adjust for persistence and auto-
correlation in the error term) as well as heteroskedasticity robust standard errors. The choice of
employing this simple, contemporaneous specification is determined by our goal to establish the
direction and magnitude of the co-movement between output growth and rates of capital gains.
We report panel estimations including country fixed effects (αi) and both country and time
fixed effects (δt). Time fixed effects have the property of controlling for common global shocks.
Consequently, the domestic GDP growth rate reflects solely the idiosyncratic part of domestic
15See for example IMF (2011).16In order to ensure that the results are not driven by extreme outliers, we drop all observations where kg is
larger than 100% or smaller than -100% in a given year. Also when these observations (13 in total) are included,all the main findings hold nevertheless.
17If β is < 0, thus counter-cyclical, risk sharing would be in theory possible if foreign investors take shortpositions in the domestic markets. However, this possibility is not very feasible on a large scale on currentfinancial markets.
7

growth and likewise for the rates of capital gains, whereas in the country fixed effects estimation
also global factors could drive the results.
Previous studies regarding co-movement of stock markets and in the fiscal policy literature
use a similar set-up. Forbes and Rigobon (1998) demonstrate that regression-based measures of
cyclicality are superior to unadjusted correlation coefficients when samples have different levels
of volatility. This is very applicable to an emerging market country sample.
Lane (2001) and Schmitz (2010) study the cyclicality of international investment income
flows and capital gains, respectively, in an equivalent set-up. In the fiscal policy literature
Sørensen et al. (2001), Lane (2003) and Alesina et al. (2008) measure cyclicality of government
spending in this particular specification. Moreover, the empirical risk sharing literature (for
example Sørensen et al., 2007) focusing on growth rates of GDP and consumption employs
simple co-movement estimations in a similar fashion.
We consider regression specifications with both all variables expressed in domestic currency
(thus taking the perspective of a domestic investor in one of the sample’s countries) and all
variables expressed in terms of US dollars in order to have a common currency among all coun-
tries. The latter can be understood as approaching the question from a foreign or international
investor’s point of view.
In addition to focusing on annual data, it is very crucial to know if extended periods of
economic growth are reflected in higher cumulative capital gains on financial markets. Or in
other words: are permanent output shocks reflected in financial markets such that they can be
‘shared’ internationally? Baxter (2011) points out that depending on the temporal dimension,
the nature of the shocks and the associated risk sharing patterns might be different.18
For this purpose we construct non-overlapping three-year GDP growth rates and cumulative
three-year rates of stock market capital gains. We run the estimation
kg3it = αi + βg3it + uit (2)
where kg3 is the cumulative three year real rate of capital gains on the domestic stock market
index and g3 is the cumulative real rate of domestic GDP growth over three years.
While Schmitz (2010) uses a five-year horizon, a three-year window is chosen as to maximise
the number of observations in the estimation.19 Nevertheless, robustness tests using five-year
periods confirm the results obtained at three-year horizons. In addition, three-year periods
might be more suitable for emerging market economies as their business cycles tend to be more
dynamic and volatile.
As persistence is much less of an issue over a three-year horizon, we do not employ an AR(1)
correction term in this estimation. uit is independent and identically distributed with N(0, σ2u).
18High-frequency shocks might be seasonal fluctuations in crop yields, whereas low frequency shocks could referto differences in potential growth rates.
19The stock market indices for our sample of countries start in 1995 (see Section 2).
8

We estimate a simple pooled specification, with country fixed effects, and with both country
and time fixed effects.
4.2 Country Analysis
In the individual country specification (3), we estimate similarly to the panel specification by
general least squares with a correction for first-order serial correlation in the error term. More-
over, heteroskedasticity robust standard errors are employed.
kgit = αi + βigit + eit (3)
where eit is first-order autoregressive with an error term zit which is assumed to be independent
and identically distributed with N(0, σ2z).
This estimation is the country-by-country equivalent to the country-fixed effects panel esti-
mation. Thus we do not isolate the idiosyncratic components of GDP growth and capital gains
on the stock market. In order to focus on the idiosyncratic components, we consider the co-
movement of the deviation of domestic GDP growth from global GDP growth and the deviation
of domestic rates of capital gains from global rates. Hence the question if the idiosyncratic part
of domestic growth is reflected in the idiosyncratic part of the financial market performance is
now also approached on an individual country level. Thus, we run
(kgit − kg∗it) = αi + βi (git − g∗it) + eit (4)
where eit is first-order autoregressive with an error term zit which is assumed to be independent
and identically distributed with N(0, σ2z). kg* is the annual real rate of capital gains on the
respective world financial index and g* is the annual real rate of world GDP growth.
The estimation strategy is analogous to (3), that is including a correction for first-order serial
correlation in the error term and heteroskedasticity robust standard errors.
We do not estimate cumulative three year specifications on a country-by-country basis, as
we do not have a sufficient amount of data points available for individual countries.
Once the individual cyclicality coefficients are obtained from the country level estimates, we
seek to explain the observed patterns across countries. For this we follow Schmitz (2010) by
employing the cross-sectional specification
β̂i = α+ λZi + νi (5)
where β̂i are the set of estimated parameters from the country regressions above. νi is inde-
pendent and identically distributed with N(0, σ2ν). Zi is a set of control variables. It includes
the domestic stock market capitalisation (as a share of GDP), the number of listed companies
(per capita) (both from the World Bank’s Financial Structure dataset), and output per capita in
9

natural log form (in PPP terms, taken from the World Bank’s World Development Indicators).20
In line with Schmitz (2010), these control variables are chosen as indicators for the economic and
financial development of the countries included in the sample. The stock market development
variables are included as a higher market capitalisation and a larger number of listed firms might
imply that business cycle fluctuations of an economy are better reflected in the performance of
the stock market.
Weighted least squares estimation is used in order to take varying levels of accuracy for the
(in the previous step) obtained dependent variable into account.21
This two-step approach is akin to Lane (2003) and Alesina et al. (2008) in the fiscal policy
analysis. In the risk sharing literature (for example Sørensen et al., 2007)), a similar analysis
is carried out, however with an imposed structure on the risk sharing coefficient β and thus
employing annual data of the structural variables in order to explain their role for the risk sharing
coefficient. Our approach has the advantage of not being affected by short-run fluctuations and
thus reflecting the impact of heterogeneous structural factors more appropriately.
5 The Cyclical Properties of Domestic Stock Markets
5.1 Panel Analysis
Panel analysis employing regression specification (1) shows that both in terms of domestic
currency and in US dollars there is pro-cyclicality of rates of capital gains on domestic stock
markets (significant at the 1% level (Table 1)). This implies that in our sample of emerging
economies a one percentage point increase in the domestic GDP growth rate co-moves with a
3.4 percentage points increase in the rate of capital gains (3.7 percentage points when estimated
in US dollars).22
In terms of international risk sharing, it is crucial to isolate the idiosyncratic component of
GDP growth, hence we include time fixed effects: again we obtain highly significant β-coefficients
of 1.1 (1.7 when estimated in US dollars). This result is very important as it shows the potential
for a significant contemporaneous risk sharing mechanism via domestic stock market capital
gains for the period of 1996 to 2010. This means that in the short-run of one year, the specific
state of a national economy is reflected in the idiosyncratic part of stock market capital gains.
This finding is in contrast to Schmitz (2010) where global factors explained most of the pro-
cyclicality of capital gains for industrial countries. This points towards domestic equity being
‘a claim on GDP’ in the short-run (that is one year).
With regard to EMEs this finding is important as these countries face a considerable country
specific productivity and output risk which can accordingly be shared with foreign investors. To
20We use average values by country for the explanatory variables.21We weight by the (in the previous step) obtained t-statistics.22The magnitude of the coefficient is substantially higher than found by Schmitz (2010) for industrial countries
(1.1)
10

illustrate one can consider the hedging implications of the idiosyncratic coefficient of 1.1 from
above: if excess domestic GDP growth (relative to global growth) increases by one percentage
point, this implies a commensurate increase in excess stock market returns of one percentage
point. Based on an unweighted average portfolio equity position of 30% of GDP in our sample,
this implies that there is a wealth transfer via financial markets to foreign investors of roughly
one third of the increase in GDP. On average this increases to even 80% when we also include
FDI in the considerations.
Moving from business cycle frequencies to a longer term horizon it is crucial to know if
permanent shocks to an economy can potentially be hedged via the stock market. Employing
specification (2), as outlined above, we find the following (Table 2): in terms of domestic currency
the cyclicality coefficient is 5.5, in US dollar terms 6.8 (both significant at the 1% level). The
result also holds (with coefficients being significant at the 1% level and 5% level, respectively,
but smaller in magnitude), when time effects are added or neither country nor time effects are
included.23
As for the short-run the outlined risk sharing mechanism also works over medium-term
horizons. This result is in line with Baxter (2011) who finds substantial international risk
sharing at medium and low frequencies.
5.2 Country Analysis
The country by country analysis (estimation (3)) shows a rather homogenous picture in terms
of direction of the cyclicality coefficients (Table 3). In terms of domestic currency, we find sig-
nificant pro-cyclical co-movements between GDP growth and the stock market for Argentina,
Brazil, China, Columbia, Czech Republic, Hong Kong, India, Indonesia, Malaysia, Peru, Singa-
pore, South Africa, Taiwan, Thailand and Turkey. China shows the highest coefficient (20.4),
implying that a percentage point increase of the GDP growth rates moves along with a more
than 20 percentage point increase in stock market capital gain rates. Hence, for the majority of
EMEs in our sample, an economic expansion is also reflected in higher share prices.24
The remaining countries in the sample do not show any significant co-movements in terms
of domestic currency. When the data are denominated in US dollars (column (3)) coefficients
and significance levels obtained are very similar (South Africa’s and Thailand’s coefficient turn
insignificant, whereas Mexiko’s coefficient is significant). These results are again very different
from Schmitz’s (2010) analysis of industrial countries, where substantial country heterogeneity
is established with many countries exhibiting countercyclical or acyclical stock markets.
Estimation (4) answers the question if the idiosyncratic part of domestic growth is reflected
23We find similar results when five-year horizons are employed (where 60 observations are available): thecoefficients are larger in magnitude, but slightly less significant. The findings are in line with Schmitz (2010) whoemploys five-year horizons for industrial countries.
24In Table 3 we focus on reporting the estimated β-coefficients and associated standard errors in order to presentthe key results as clearly and concisely as possible. More diagnostic statistics are available upon request.
11

in the idiosyncratic part of the stock market performance. Strikingly this holds for the majority
of countries that showed a significant coefficient in estimation (3).25 Hence for these countries
the idiosyncratic part of GDP growth is also reflected in the idiosyncratic component of the stock
market performance. As this also holds in terms of US dollars, it implies that an international
investor is able to reap exceptional economic expansions by means of excess stock market returns
in theses countries. Thus, for this group of countries international risk sharing via foreign equity
liabilities is feasible.
Overall, the potential for international risk sharing at business cycle frequencies is very high,
in particular considering idiosyncratic components. Consequently, given the growing importance
of equity and FDI in the foreign liabilities of EMEs, international risk sharing is likely to act
increasingly as an important stabilising mechanism for these countries.
6 Explaining Country Heterogeneity
The first-step analysis revealed some heterogeneity in cyclicality patterns across countries. In
contrast to Schmitz (2010), where substantial differences in cyclicality patterns were found for
industrial countries, we find stock markets in EMEs to be by and large procyclical (even though
to differing degrees, Table 4). However, in this second step - we want to identify the sources of the
differences in the size of the cyclicality coefficients across countries obtained in the estimations
run so far. For this we employ the cross-sectional specification (5).
When considering the simple β̂is obtained from specification (3), we obtain a negative coeffi-
cient for GDP per capita. This is in contrast to Schmitz (2010), where a country’s pro-cyclicality
indicator is increasing with higher economic development. Looking at the β̂is obtained from spec-
ification (4) (these are the “idiosyncratic” β-coefficients), we do not find any significance among
the explanatory variables proposed.
As there is a substantial variation in the level of stock market capitalisation (Figure 3), we
exclude countries that have a stock market to GDP ratio of more than 150% (on average over the
period 1996 - 2010) in the next set of regressions.26 One might suspect that for these countries
the impact of stock market size on the cyclicality coefficients differs due to the substantially
higher level of stock market capitalisation compared to the rest of the sample.
In these estimations we still obtain a negative coefficient on GDP per capita. However, while
the coefficient on stock market capitalisation is not significant, we find a significant positive
coefficient on the number of listed companies (per capita) for the “idiosyncratic” β-coefficients.
Our interpretation of this result is that the number of listed firms represents a (partial) mirror
of how the overall economic performance is reflected in stock market performance. This result
implies that a broader public listing of companies enhances the risk sharing potential of open
25The exceptions are Columbia, Malaysia, South Africa and Thailand26Accordingly we drop Hong Kong, Malaysia, Singapore and South Africa.
12

economies.27
7 Conclusion
In this paper the potential of emerging market economies to hedge their economic performance
across different states of the world is examined. When looking at capital gains on domestic
stock markets, hedging is feasible both at short and medium term horizons which consequently
allows to insure against shocks of a different nature (see Baxter, 2011). Country specific analysis
reveals pro-cyclicality of capital gains for a majority of countries.
This suggests that hedging through the capital gains channel is working for these countries.
This is in line with the theoretical model of Devereux and Sutherland (2009), thus hinting at a
considerable potential for international risk sharing of EMEs in the current configuration of the
international financial structure. For EMEs this finding is in particular relevant, as they often
face higher country specific productivity and growth risk than industrial countries. Moreover,
they exhibit a higher volatility in their growth performance.
Hence a necessary condition for the sharing of macroeconomic risks is fulfilled, namely that
there are systematic patterns between macroeconomic fluctuations and capital gains on stock
markets. Consequently, given the growing equity and FDI foreign liability positions of EMEs,
international risk sharing is likely to act increasingly as an important stabilising mechanism
for these countries. Countries with more financial development (in terms of listed companies)
tend to have a higher cyclicality coefficient implying better hedging capacity vis-a-vis foreign
investors.
It is crucial to stress that we focus merely on the foreign liability side of international invest-
ments in this paper. Moreover, the complete picture of international portfolios also incorporates
foreign assets, exchange rate and bilateral considerations.
27We also test if capital account openness as measured by Chinn and Ito (2008) affects the cyclicality coefficients.
However, while it has a negative (and significant) coefficient on the simple β̂is coefficients, it fails to be significantwhen included in the estimations for the “idiosyncratic” β-coefficients. Moreover, the findings reported in Table4 are robust to the inclusion of this variable.
13

References
[1] Alesina, Alberto, Filipe Campante and Guido Tabellini (2008), Why is Fiscal Policy often
Procyclical?, Journal of the European Economic Association 6(5), pp. 1006-1036.
[2] Backus, David, Patrick Kehoe and Finn Kydland (1995), International Cycles: Theory and
Evidence, in T. Cooley (Ed.), Frontiers of Business Cycle Research, Princeton University
Press, Princeton, pp. 331-356.
[3] Balli, F., Kalemli-Ozcan, S., Sørensen, B. E. (2011), Risk sharing through capital gains,
NBER Working paper, No. 17612.
[4] Baxter, Marianne (2011), International Risk Sharing in the short and in the long run, NBER
Working paper, No. 16789.
[5] Beck, Thorsten and Asli Demirguc-Kunt (2009), “Financial Institutions and Markets Across
Countries and over Time: Data and Analysis”, World Bank Policy Research Working Paper
No. 4943.
[6] Bracke, Thierry and Martin Schmitz (2011), Channels of international risk sharing: capital
gains versus income flows, International Economics and Economic Policy, Vol. 8, pp. 45-78.
[7] Chen, Nai-Fun, Richard Roll and Stephen A. Ross (1986), Economic Forces and the Stock
Market, The Journal of Business, Vol. 59, No. 3, pp. 383-403.
[8] Chinn, M.D. and Ito, H. (2008), “A New Measure of Financial Openness”, Journal of Com-
parative Policy Analysis 10(3): 307-320.
[9] Davis, Steven, Jeremy Nalewaik and Paul Willen (2001), On the Gains to International
Trade in Risky Financial Assets, mimeo, Chicago Graduate School of Business.
[10] Devereux, Michael B. and Alan Sutherland (2009), A portfolio model of capital flows to
emerging markets, Journal of Development Economics, Vol. 89, pp. 181-193.
[11] Faria, Andre, Philip R. Lane, Paolo Mauro and Gian Maria Milesi-Ferretti (2007), The
Shifting Composition of External Liabilities, Journal of European Economic Association Vol.
5 (2-3), pp. 480-490, April/May 2007.
[12] Forbes, Kristin and Roberto Rigobon (1998), No Contagion, Only Interdependence: Mea-
suring Stock Market Co-movements, NBER Working Paper No. 7267.
[13] Forster, Katrin, Vasardani, Melina and Michele Ca’ Zorzi (2011), Euro area cross-border
financial flows and the global financial crisis, ECB Occasional Paper No. 126.
[14] International Monetary Fund (2011), Assessing Reserve Adequacy, February 2011, Wash-
ington, D.C.
14

[15] Kose M. Ayhan, Eswar Prasad, Macro E. Terrones (2009), Does Financial Globalization
promote Risk Sharing?, Journal of Development Economics, Vol 89, pp. 258-270.
[16] Lane, Philip R. (2001), Do International Investment Income Flows Smooth Consumption?
Weltwirtschaftliches Archiv, No. 137, pp. 263-94.
[17] Lane, Philip R. (2003), The Cyclical Behaviour of Fiscal Policy: Evidence from the OECD.
Journal of Public Economics, No. 87, pp. 2661-2675.
[18] Lane, Philip R. and Gian Maria Milesi-Ferretti (2003), International Financial Integration.
International Monetary Fund Staff Paper 50, pp. 82-113.
[19] Lane, Philip R. and Gian Maria Milesi-Ferretti (2007), The External Wealth of Nations
Mark II: Revised and extended estimates of foreign assets and liabilities, 1970 2004 Journal
of International Economics, Vol. 73, Issue 2, pp. 223-250.
[20] Lane, Philip R. and Gian Maria Milesi-Ferretti (2009), “Where Did All The Borrowing Go?
A Forensic Analysis of the U.S. External Position”, Journal of the Japanese and International
Economies 23(2), pp. 177-199.
[21] Lewis, Karen (1996), What Can Explain the Apparent Lack of International Consumption
Risk-Sharing?, Journal of Political Economy, 104, 267-297.
[22] Merton, Robert C. (1990), The Financial System and Economic Performance, Journal of
Financial Services Research, Vol. 4, No. 4, pp. 263-300.
[23] Obstfeld, Maurice (2004), External Adjustment, Review of World Economics No. 140, pp.
541-568.
[24] Obstfeld, Maurice (2006), International Risk-Sharing and the Costs of Trade, The Ohlin
Lectures, Stockholm, November 2006.
[25] Schmitz, Martin (2010), Financial markets and international risk sharing, Open Economies
Review Vol. 21, pp. 413-431.
[26] Shiller, Robert J. (1993), Macro Markets: Creating Institutions for Managing Societys
Largest Economic Risks. Oxford: Oxford University Press, Clarendon Series.
[27] Sørensen, Bent, L. Wu and Oved Yosha (2001), Output fluctuations and fiscal policy: US
state and local governments 1978-1994, European Economic Review, Vol. 45, pp. 1271-1310.
[28] Sørensen, Bent, Yi-Tsung Wu, Oved Yosha and Yu Zhu (2007), Home Bias and International
Risk Sharing: Twin Puzzles Seperated at Birth, Journal of International Money and Finance,
Vol. 26, No. 4, pp. 587-605.
15

Figure 1: Foreign Portfolio Equity Liabilities (% of GDP)
0%
10%
20%
30%
40%
50%
60%
Argenti
naBraz
ilChil
eChin
a
Colombia
Czech
Rep
ublic
Hunga
ryInd
ia
Indon
esia
Korea
Malays
ia
Mexico Peru
Philipp
ines
Poland
Russia
South
Africa
Taiwan
Thaila
nd
Turkey
Venez
uela
Portfolio Equity 1996 Portfolio Equity 2007
Notes: Calculations are based on an updated and extended version of the dataset constructedby Lane and Milesi-Ferretti (2007). Hong Kong (24% in 1996 and 209% in 2007) and Singapore(20% in 1996 and 92% in 2007) are not shown in the figure.
16

Figure 2: Foreign Portfolio Equity and FDI Liabilities (% of Total Foreign Liabilities)
0%
10%
20%
30%
40%
50%
60%
70%
80%
90%
Argenti
naBraz
ilChil
eChin
a
Colombia
Czech
Rep
ublic
Hunga
ryInd
ia
Indon
esia
Korea
Malays
ia
Mexico Peru
Philipp
ines
Poland
Russia
South
Africa
Taiwan
Thaila
nd
Turkey
Venez
uela
Singap
ore
Hong K
ong
Portfolio Equity and FDI 1996 Portfolio Equity and FDI 2007
Notes: Calculations are based on an updated and extended version of the dataset constructedby Lane and Milesi-Ferretti (2007).
17

Figure 3: Stock Market Capitalisation (% of GDP)
0%
50%
100%
150%
200%
250%
300%
350%
Argenti
naBraz
ilChil
eChin
a
Colombia
Czech
Rep
ublic
Hunga
ryInd
ia
Indon
esia
Korea
Malays
ia
Mexico Peru
Philipp
ines
Poland
Russia
South
Africa
Taiwan
Thaila
nd
Turkey
Singap
ore
SMCAP 1996 SMCAP 2009
Notes: Calculations are based on an updated version of the dataset constructed by Beck andDemirguc-Kunt (2009). Hong Kong (237% in 1996 and 603% in 2009) is not shown in the figure.
18

Figure 4: Reserve Assets (% of GDP)
0%
20%
40%
60%
80%
100%
120%
Argenti
naBraz
ilChil
eChin
a
Colombia
Czech
Rep
ublic
Hunga
ryInd
ia
Indon
esia
Korea
Malays
ia
Mexico Peru
Philipp
ines
Poland
Russia
South
Africa
Taiwan
Thaila
nd
Turkey
Venez
uela
Singap
ore
Hong K
ong
Reserve Assets 1996 Reserve Assets 2007
Notes: Calculations are based on an updated and extended version of the dataset constructedby Lane and Milesi-Ferretti (2007).
19
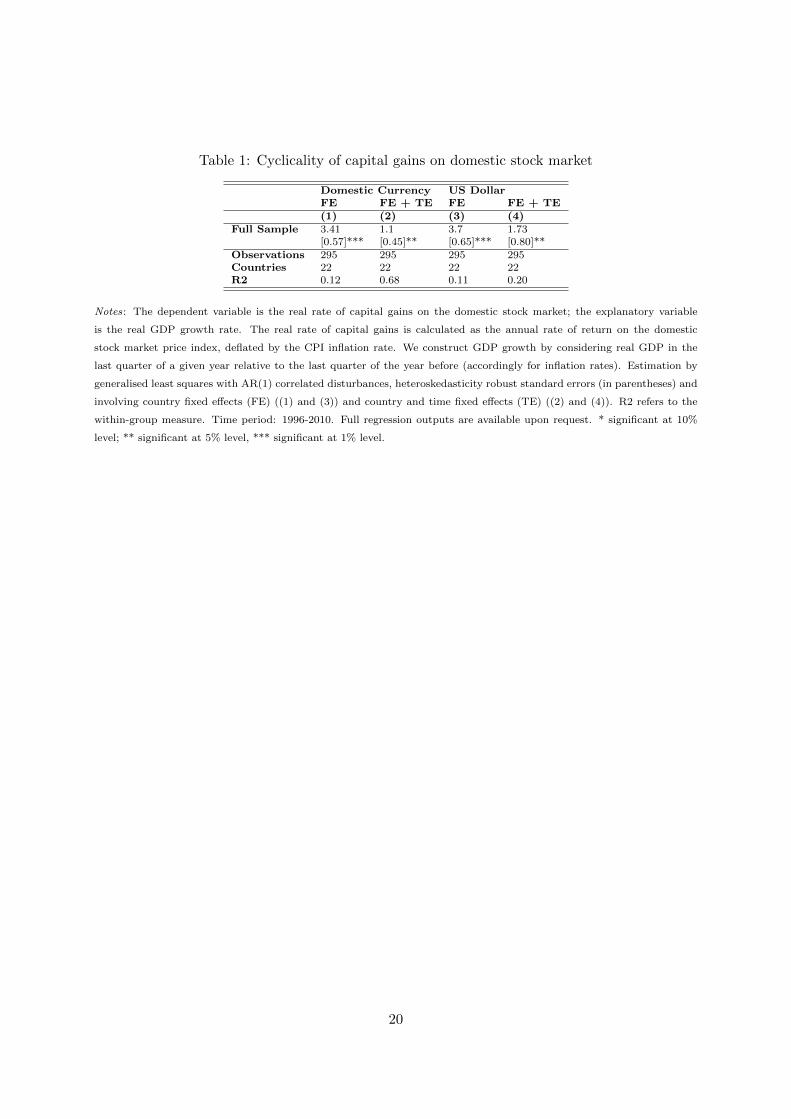
Table 1: Cyclicality of capital gains on domestic stock market
Domestic Currency US DollarFE FE + TE FE FE + TE(1) (2) (3) (4)
Full Sample 3.41 1.1 3.7 1.73[0.57]*** [0.45]** [0.65]*** [0.80]**
Observations 295 295 295 295Countries 22 22 22 22R2 0.12 0.68 0.11 0.20
Notes: The dependent variable is the real rate of capital gains on the domestic stock market; the explanatory variable
is the real GDP growth rate. The real rate of capital gains is calculated as the annual rate of return on the domestic
stock market price index, deflated by the CPI inflation rate. We construct GDP growth by considering real GDP in the
last quarter of a given year relative to the last quarter of the year before (accordingly for inflation rates). Estimation by
generalised least squares with AR(1) correlated disturbances, heteroskedasticity robust standard errors (in parentheses) and
involving country fixed effects (FE) ((1) and (3)) and country and time fixed effects (TE) ((2) and (4)). R2 refers to the
within-group measure. Time period: 1996-2010. Full regression outputs are available upon request. * significant at 10%
level; ** significant at 5% level, *** significant at 1% level.
20

Table 2: 3-year cyclicality of capital gains on domestic stock market
Domestic Currency US DollarFE FE +TE FE FE +TE(1) (2) (3) (4) (5) (6)
Stock 5.52 2.02 3.82 6.75 2.40 4.44Market [0.79]*** [0.81]** [0.68]*** [0.97]*** [0.95]** [0.85]***Observations 102 102 102 102 102 102Countries 22 22 22 22 22 22R2 0.38 0.63 0.24 0.38 0.65 0.22
Notes: The explanatory variable is the cumulative real GDP growth rate over three years; the dependent variable is the
cumulative real rate of capital gains over three years. The real rate of capital gains is calculated as the three year rate of
return on the domestic stock market price index, deflated by the CPI inflation rate. We also construct cumulative three year
GDP growth rates. Estimation by ordinary least squares with heteroskedasticity robust standard errors (in parentheses)
and involving country fixed effects (FE) ((1) and (4)) and involving country and time fixed effects (TE) ((2) and (5)). R2
refers to the within-group measure (except for columns (3) and (6)). Time period: 1996-2010. Full regression outputs are
available upon request. * significant at 10% level; ** significant at 5% level, *** significant at 1% level.
21

Table 3: Cyclicality of capital gains on domestic stock market
Dependent VariableDomestic Currency US Dollar
(1) (2) (3) (4)Simple Relative to Global Simple Relative to Global
Argentina 2.85 [0.95]** 4.00 [1.78]** 4.48 [1.04]*** 3.11 [1.05]**Brazil 6.76 [2.12]*** 5.52 [2.36]** 14.01 [2.55]*** 7.22 [2.50]**Chile 1.61 [2.84] 1.98 [2.15] 2.45 [3.49] 2.04 [2.54]China, P.R. 20.43 [2.87]*** 7.96 [2.94]** 21.38 [2.76]*** 8.04 [2.83]**Colombia 5.48 [2.89]* 3.74 [2.70] 5.61 [2.67]* 3.52 [2.42]Czech Republic 6.27 [1.73]*** 9.96 [1.80]*** 7.21 [2.15]*** 9.15 [1.74]***Hong Kong 4.05 [1.16]*** 2.61 [0.79]*** 3.88 [1.24]*** 2.60 [0.79]***Hungary 0.74 [4.85] 1.82 [2.73] 1.15 [4.77] 2.07 [2.92]India 7.87 [1.73]*** 6.20 [1.76]*** 10.42 [2.07]*** 6.77 [1.79]***Indonesia 4.57 [0.81]*** 5.43 [1.44]*** 3.28 [0.85]*** 3.51 [1.05]***Korea, Republic of 1.29 [3.59] 1.61 [3.60] -0.18 [6.18] -0.32 [5.02]Malaysia 2.39 [0.91]** 0.93 [0.71] 4.15 [1.19]*** 3.09 [1.27]**Mexico 2.28 [1.81] 0.26 [1.53] 4.19 [1.84]** 0.53 [1.44]Peru 5.08 [1.95]** 1.30 [6.89] 5.62 [1.99]** 4.72 [1.74]**Philippines 3.38 [2.73] 6.38 [2.94]** 2.70 [3.37] 3.71 [3.22]Poland 2.27 [2.81] -3.48 [2.21] 1.64 [3.23] -3.10 [2.09]Russian Federation 2.09 [3.16] 5.00 [2.95] 1.31 [3.02] 2.27 [3.40]Singapore 3.76 [1.12]*** 1.67 [0.74]** 4.01 [1.13]*** 1.72 [0.70]**South Africa 4.55 [1.67]** 5.15 [3.56] 1.98 [3.82] 5.85 [5.33]Taiwan 5.08 [1.11]*** 2.41 [1.27]* 5.28 [1.05]*** 2.64 [1.34]*Thailand 5.16 [1.70]** 7.00 [4.27] 5.02 [2.86] 4.36 [2.72]Turkey 5.37 [0.96]*** 4.45 [1.11]*** 6.11 [1.22]*** 3.76 [1.11]***
Notes: The dependent variables are the real rate of capital gains on the domestic stock market ((1) and (3)) and the
deviation of the rate of capital gains on the domestic stock market from the global stock market ((2) and (4)), respectively.
The explanatory variables are the real GDP growth rate ((1) and (3)) and the deviation of the real domestic GDP growth
rate from global GDP growth ((2) and (4)), respectively. The real rate of capital gains is calculated as the annual rate
of return on the domestic stock market price index, deflated by the CPI inflation rate. We construct GDP growth by
considering real GDP in the last quarter of a given year relative to the last quarter of the year before (accordingly for
inflation rates). For the respective global rates, we use the same method using global stock market price indices and
world GDP. Estimation by generalised least squares with AR(1) correlated disturbances and semi-robust standard errors
(in parentheses). Time period: 1996-2010. Full regression outputs are available upon request. * significant at 10% level; **
significant at 5% level, *** significant at 1% level.
22

Table 4: Determinants of variation in country cyclicality
Domestic Currency US DollarFull Sample Simple Relative to global Simple Relative to global
(1) (2) (4) (5)GDP-PC -3.67 -0.80 -3.87 -0.61
[1.08]*** [0.74] [1.24]*** [0.73]Stock Market Capitalisation -1.39 -1.34 -1.13 -0.67
[1.39] [1.04] [2.03] [1.04]No. of listed companies 5.35 1.64 3.19 0.30
[4.20] [3.17] [5.70] [3.14]R2 0.23 0.15 0.24 0.10
Stock Market Capitalisation <150%(5) (6) (7) (8)
GDP-PC -3.83 -2.07 -2.69 -1.83[1.70]** [0.89]** [1.79] [0.90]**
Stock Market Capitalisation -5.24 -2.96 2.63 -0.62[6.08] [2.86] [6.64] [2.99]
No. of listed companies -4.4 27.9 -22.19 30.96[18.57] [8.80]*** [20.84] [8.95]***
R2 0.19 0.26 0.17 0.28
Notes: The dependent variables are the estimated beta-coefficients from the individual country analysis; the explanatory
variables are country averages of GDP per capita in natural log form and domestic stock market capitalisation (as ratio
to GDP) as well as the number of companies listed on the stock market (relative to population size). Estimation by
weighted least squares (weighting by t-statistics of ‘first-step’ estimation). Stock market capitalisation to GDP ratio is
higher than 150% on average over the sample period for Hong Kong, Malaysia, Singapore and South Africa. Standard
errors in parentheses. * significant at 10% level; ** significant at 5% level, *** significant at 1% level.
23