Embed Size (px)
Citation preview
FINANCIAL MANAGEMENTDr. Ahmed Elyamany
1
Financial Management & Accounting in Construction (CUE304)
Course Content
• Project financial management: ▫ Cash flow prediction, Cash flow analysis, Cost of finance
• Basics of accounting: ▫ base of accounting, accounting conventions, Methods of income recognition
• Company financial documents: ▫ Balance sheet, Income statement
• Compilation of financial statement: ▫ Transaction recording, Book keeping fundamentals
• Analysis of financial statement:▫ Vertical analysis, Horizontal analysis, Ratio analysis
• Construction financing: ▫ Sources of finance, cost of finance and company cost of capital
2
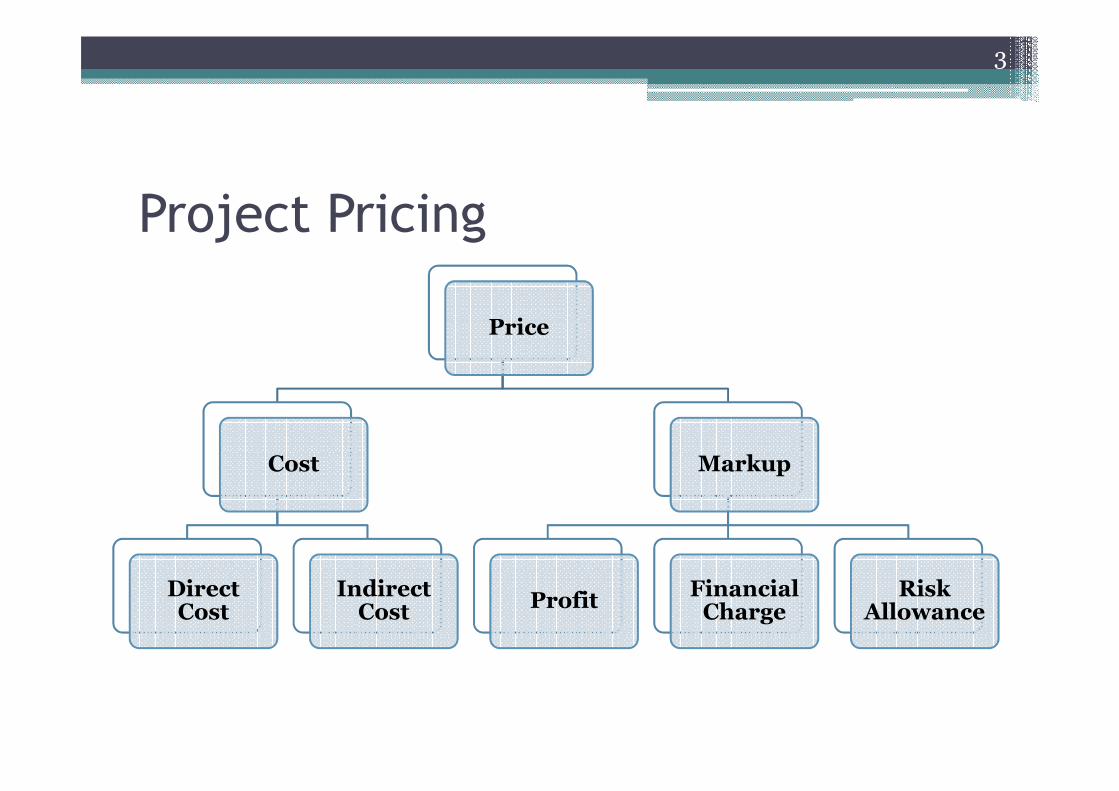
Project Pricing
3
Price
Cost
Direct Cost
Indirect Cost
Markup
ProfitFinancial Charge
Risk Allowance
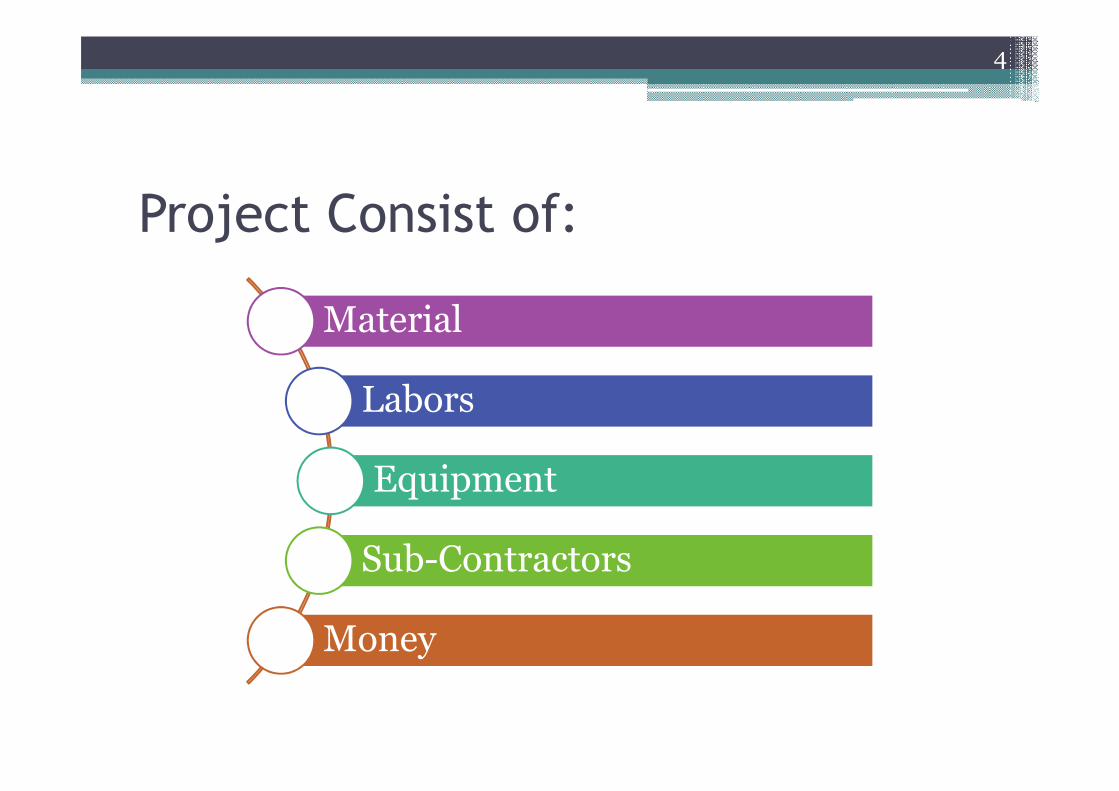
Project Consist of:
4
Material
Labors
Equipment
Sub-Contractors
Money
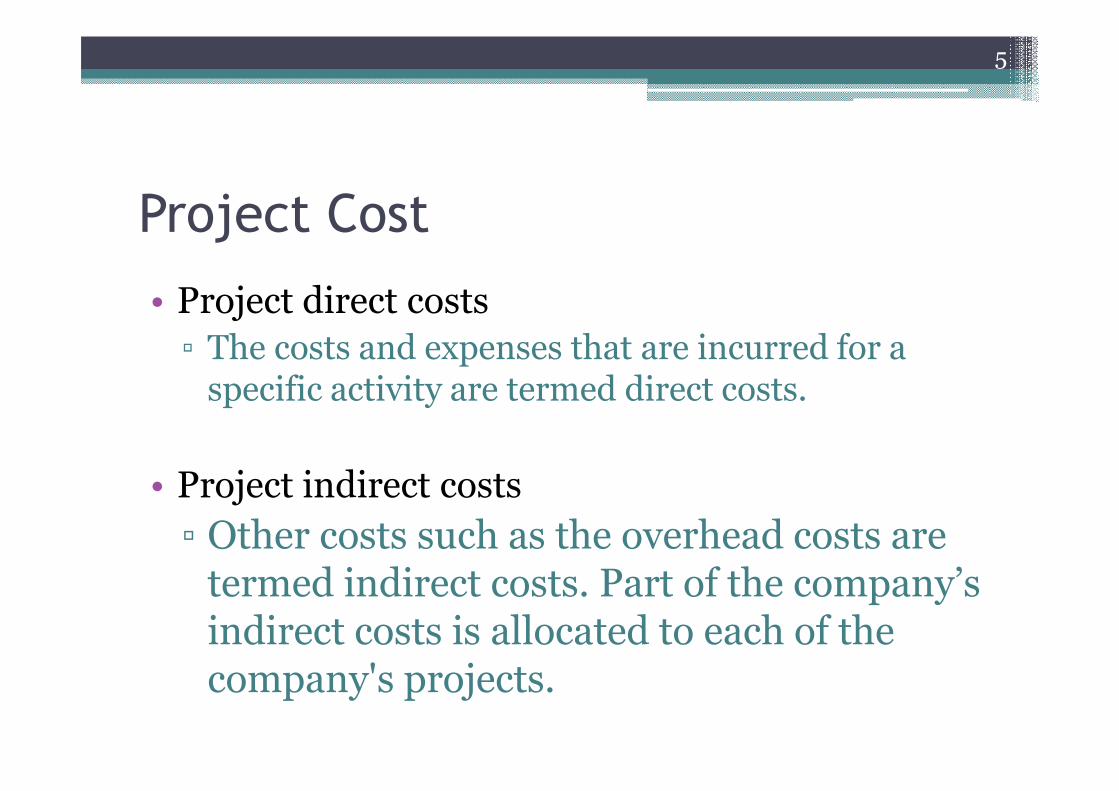
Project Cost
• Project direct costs
▫ The costs and expenses that are incurred for a specific activity are termed direct costs.
• Project indirect costs
▫ Other costs such as the overhead costs are termed indirect costs. Part of the company’s indirect costs is allocated to each of the company's projects.
5
Indirect costs
6
The indirect costs are classified to:• Project (site) overhead• General (head-office) overhead.

Project overhead
• Project overhead are site-related costs and includes the cost of items that can not be directly charged to a specific work element and it can be a fixed or time-related costs. The Project Overhead includes the costs of
7
Site utilities,
Supervisors,
Housing of project staff,
Parking facilities,
Offices,
Workshops
……..
General overhead
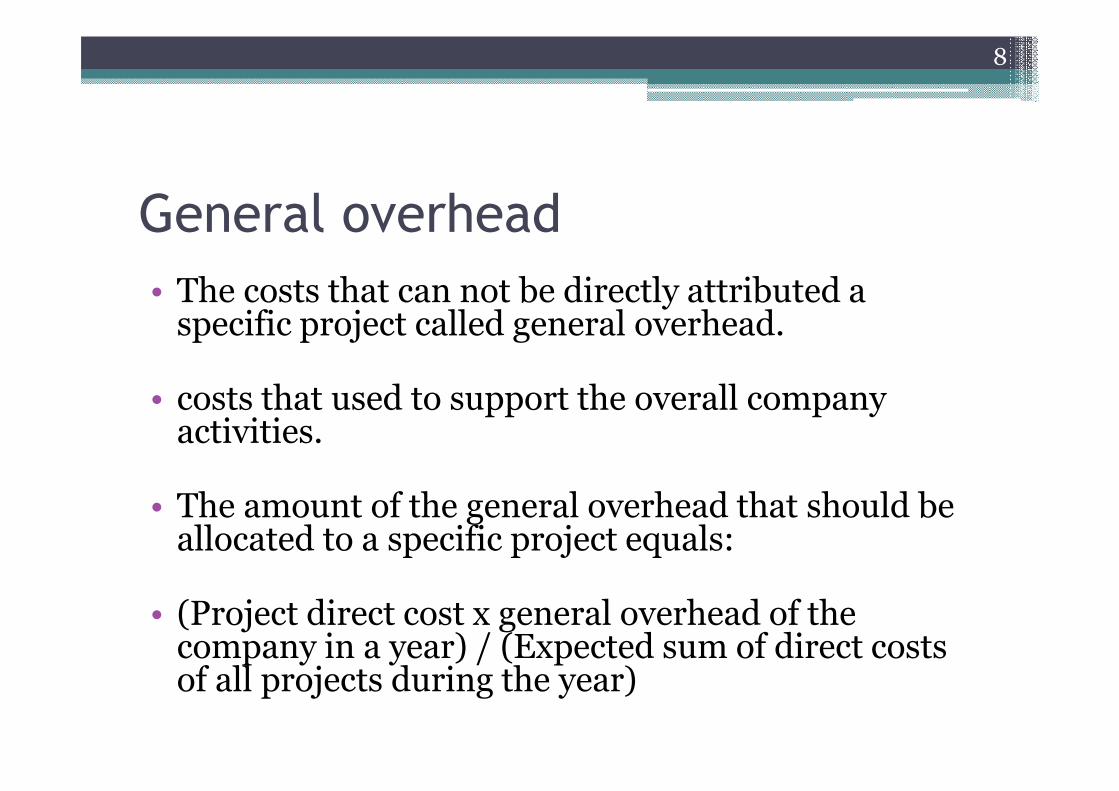
• The costs that can not be directly attributed a specific project called general overhead.
• costs that used to support the overall company activities.
• The amount of the general overhead that should be allocated to a specific project equals:
• (Project direct cost x general overhead of the company in a year) / (Expected sum of direct costs of all projects during the year)
8

9
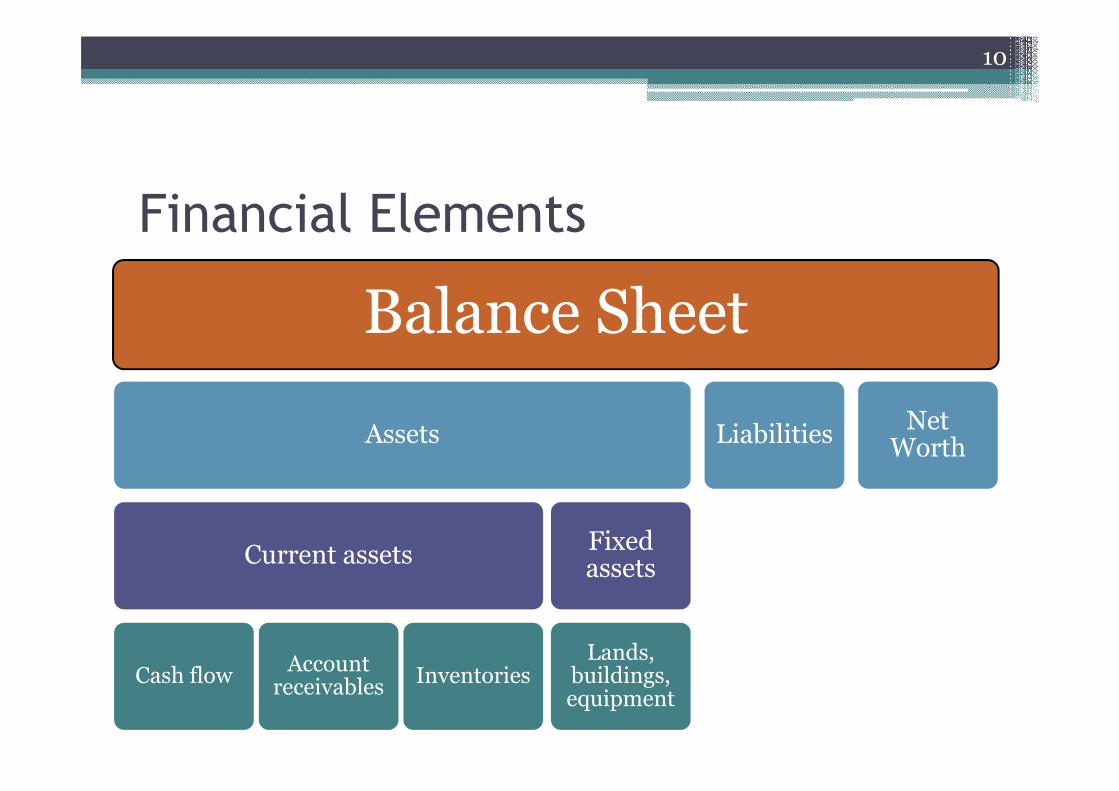
Financial Elements
10
Balance Sheet
Assets
Current assets
Cash flowAccount receivables
Inventories
Fixed assets
Lands, buildings, equipment
LiabilitiesNet Worth
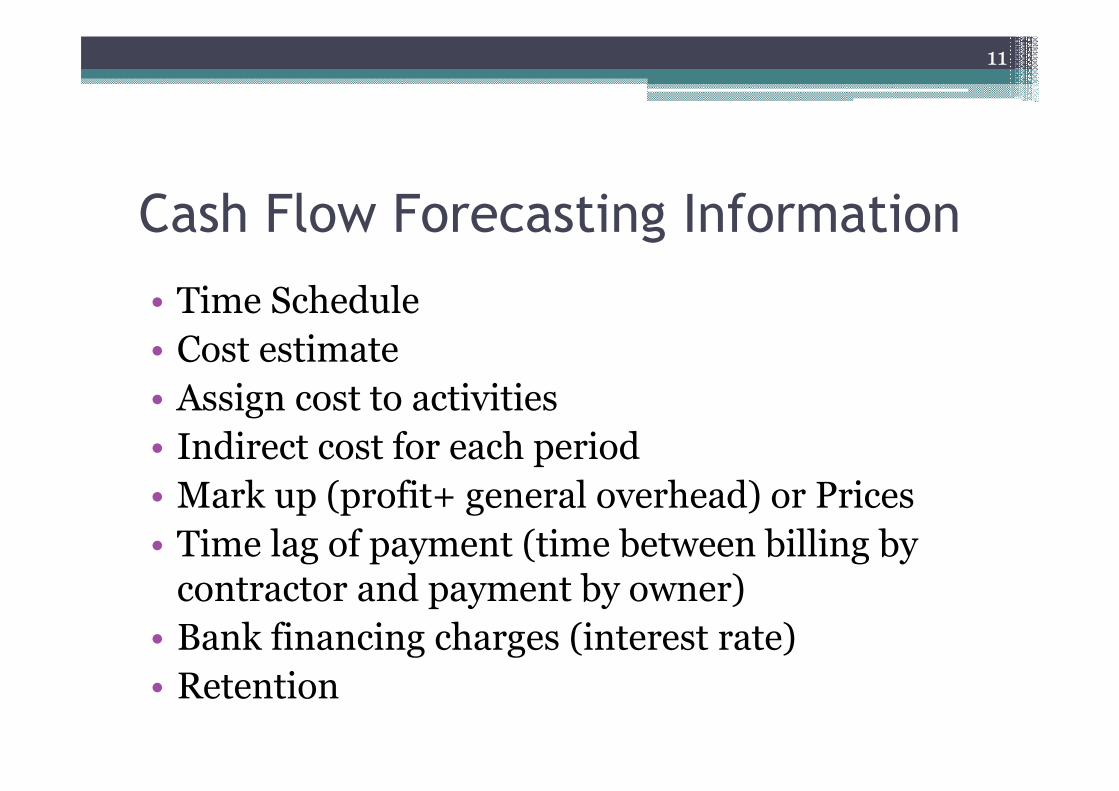
Cash Flow Forecasting Information
• Time Schedule
• Cost estimate
• Assign cost to activities
• Indirect cost for each period
• Mark up (profit+ general overhead) or Prices
• Time lag of payment (time between billing by contractor and payment by owner)
• Bank financing charges (interest rate)
• Retention
11
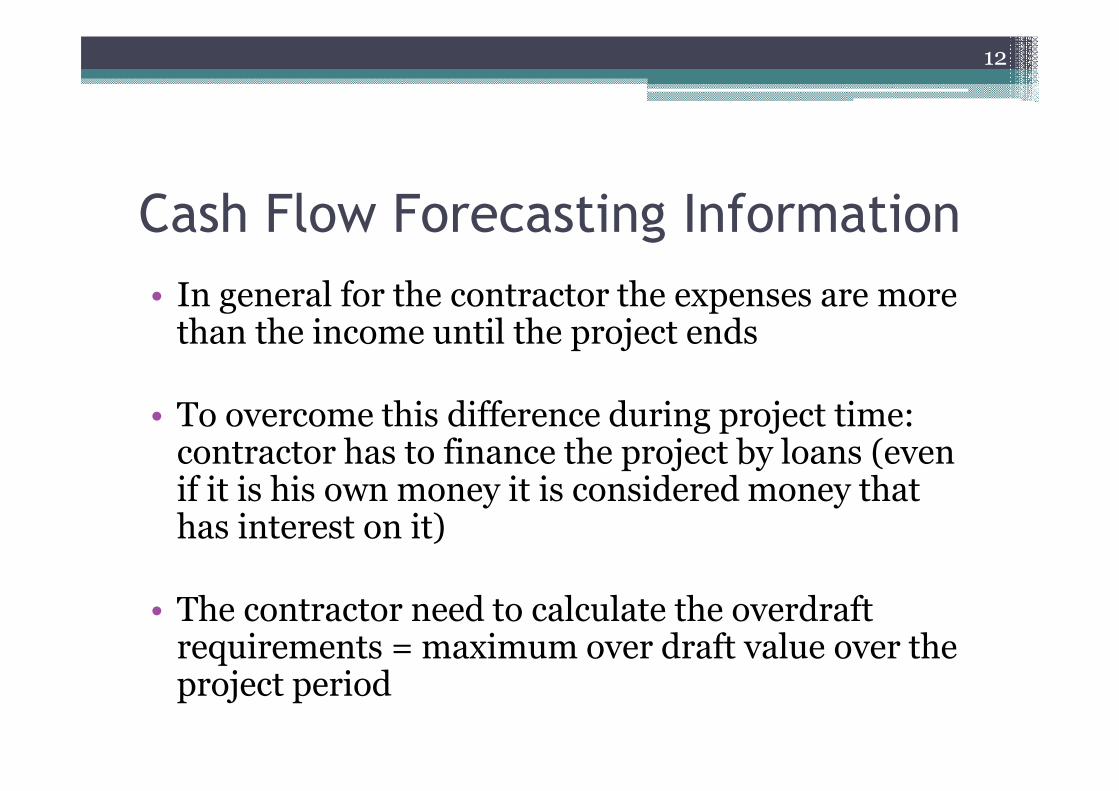
Cash Flow Forecasting Information
• In general for the contractor the expenses are more than the income until the project ends
• To overcome this difference during project time: contractor has to finance the project by loans (even if it is his own money it is considered money that has interest on it)
• The contractor need to calculate the overdraft requirements = maximum over draft value over the project period
12

How To reduce the over draft:
13
• Subcontracting
• Delay supplier payment
• Initial or down payment
• Unbalancing the bid
Reduce OverdraftReduce Overdraft

Financial Management
• Objective is to supply the project financial requirements: How Much and When?
• Cash Flow Prediction:• Cash flow = Cash in – Cash out = Income – Expense▫ Cash Out (expenses):
� Time Schedule
� Cost Estimate
▫ Cash In (income payments):� Time Schedule
� Unit Price
14

Financial Management
• S-Curve
▫ The curve represents the cumulative expenditures of a project direct and indirect costs over time
• Project Expenses (Cash out)
▫ represents the aggregate of the payments which the contractor will make over a period of time for all resources used in the project such as labor, equipment, material, and subcontractors.
15

Project Expenses (Cash out)
• Project direct costs▫ The costs and expenses that are incurred for a specific activity are termed direct costs.
• Project indirect costs▫ Other costs such as the overhead costs are termed indirect costs. Part of the company’s indirect costs is allocated to each of the company's projects.
• The indirect costs classified to:▫ project (site) overhead▫ General (head-office) overhead.
16

Project Income (Cash-in)
• The flow of money from the owner to the contractor is in the form of progress payments.
• Retention▫ Retention is the amount of money retained by the owner from every invoice, before a payment is made to the contractor.
• Advanced payment▫ This is amount of money paid to the contractor for mobilization purposes.
17

18

How to Reduce negative Cash Flow?
• Unbalanced Bid: ▫ Raising the Price of the earlier items
• Down Payment : ▫ Needs conceptual approval by the owner(client)
• Using Sub-Contractor: ▫ He will fund the job (migrate the expenses)
• Trade Credit Finance: ▫ Crediting material and resources
• If all of the above is not applicable we can use External Source of Finance (e.g.: Bank)
19

Example 1
• For a given construction project the monthly costs are
provided in the following Table and given that:
• Project mark up = 10%
• Financing cost = 1% /month
• Retentions = 15% of the billing amount
• Time Lag of payment = 1 month
20
Month 1 2 3 4
Direct cost 25,000 70,000 90,000 35,000
Indirect cost 5000 5000 5000 5000

Example 1
• You are required to:
• Draw the cash flow diagram for that project including:▫ Cash out▫ Cash in▫ Over draft line
• Calculate the maximum over draft• Calculate Contractor final profit considering the financing cost
21

Example 1
22
Month 0 1 2 3 4 5 6
Direct cost 0 25,000 70,000 90,00035,000
Indirect cost 0 5000 5000 5000 5000
Total monthly
Cost0 30,000 75,000
95,00040,000
billed 0 33000 82500 104500 44000
retinage 0 4950 12375 15675 6600
Money received 0 0 28050 70125 88825 77,000
Commulative
cost0 30,000 105,000 200,000 240,000 240,000 240,000
Commulative
money received0 0 28050 98175 187000 264000

Example 1
23
240,000264000
0
50000
100000
150000
200000
250000
300000
0 1 2 3 4 5 6 7
Commulative cost Commulative money received

Example 1
24
240,000
264000
18,890
-200000
-150000
-100000
-50000
0
50000
100000
150000
200000
250000
300000
0 1 2 3 4 5 6 7
Commulative cost Commulative money received
Total amont financed

Example 2.1
• Monthly Indirect cost 5000/Month▫ Mark Up 5%▫ Retain age 10%▫ Periodic Payment are billed at the end of the month and received one month later.
▫ The accumulated Retain age will be paid within the last payment.
• Req.:▫ Sketch the cash flow profile▫ Sketch the net cash flow profile
25

Example 2.1
26

Example 2.1• Cash Out:▫ Month 1=25,000+5,000=30,000
▫ Month 2=65,000+5,000=70,000
▫ Month 3=75,000+5,000=80,000
▫ Month 4=15,000+5,000=20,000
• Cash In:▫ Pay 1=30,000×1.05×0.9=28,350
▫ Pay 2=70,000×1.05×0.9=66,150
▫ Pay 3=80,000×1.05×0.9=75,600
▫ Pay 4=20,000×1.05×0.9+200,000×1.05×0.1=39,900
27

28

Example 2.2• Using the previous example givens sketch the net cash flow when we use external source of finance (bank):
29
Month
Trans.
1 2 3 4 5 6
Expenses 30,000 70,000 80,000 20,000 -
(5747)
Overdraft 30,000 100,300 152,953 108,332 33815
Interest 1% 300 1,003 1,529 1,083 338
Total 30,300 101,303 154,482 109,415 34153
Payments - 28,350 66,150 75,600 39,900
Residue 30,300 72,953 88,332 33,815 (5747)

30

Example 2.3
• Using example 2 givens sketch the net cash flow if there is Down Payment 20% of tender price:▫ Pay 0=0.2×210,000=42,000
▫ Pay 1=30,000×1.05×0.9×0.8=22,680
▫ Pay 2=70,000×1.05×0.9×0.8=52,920
▫ Pay 3=80,000×1.05×0.9×0.8=60,480
▫ Pay 4=20,000×1.05×0.8×0.9+200,000×1.05×0.1×0.8=31,920
31

32

Example 2.4
• For the previous example, sketch the net cash flow if using external source of finance (bank):
33
Month
Trans.0 1 2 3 4 5 6
Expenses - 30,000 70,000 80,000 20,000 -
(7175)
Overdraft - - 58,000 115,900 84,139 24,500
Interest 1% - - 580 1159 841 245
Total - 30,000 58,580 117,059 84,980 24745
Payments 42000 - 22,680 52,920 60,480 31,920
Residue (42000) (12,000) 35,900 64,139 24,500 (7175)

34

Discounted Cash Flow
• The value of money is dependent on the time at which it is received.
• A sum of money on hand today is worth more than the same sum of money to be received in the future because the money on hand today can be invested to earn interest to gain more than the same money in the future.
• Studying the present value of money (or the discounted value) that will be received in the future is very important.
35

Present Value
• Present value (PV) describes the process of determining what a cash flow to be received in the future is worth in today's pounds.
• The Present Value of a future cash flow represents the amount of money today which, if invested at a particular interest rate, will grow to the amount of the future cash flow at that time in the future.
• The process of finding present values is called Discounting and the interest rate used to calculate present values is called the discount rate.
• F = P (1+r)n• P = F / (1+r)n
36

Example 3
• Find the present value of the following cash flow stream given that the interest rate is 10%.
• Solution:
37
Year 0 1 2 3 4
Cash flow 100 200 200 300
37.611)1.1(
300
)1.1(
200
)1.1(
200
)1.1(
1004321
=
+
+
+
+
+
+
+
=P

Net Present Value (NPV)
• Net present value (NPV) is the summation of all PV of cash flows of the project, where expenses are considered negative and incomes are considered positive.
• A project will be considered profitable and acceptable if it gives a positive NPV.
• When comparing projects, the project with the largest (positive) NPV should be selected.
38

Example 4
• The Table below illustrates the net cash flow of two projects over 5 years. Using the NPV, which project would you prefer if the discount rate 10%.
• Project A:
• Project B:
39
Year 1 2 3 4 5
Project A -1000 500 400 200 100
Project B -1000 100 200 400 700
08.134)1.1(
100
)1.1(
200
)1.1(
200
)1.1(
400
)1.1(
5001000
54321=
++
+
+
+
+
+
+
+−=NPV
31.114)1.1(
700
)1.1(
400
)1.1(
200
)1.1(
200
)1.1(
1001000
54321=
++
+
+
+
+
+
+
+−=NPV

Internal Rate of Return (IRR)
• The internal rate of return (IRR) of a capital budgeting project is the discount rate (r) at which the NPV of a project equals zero.
• The IRR decision rule specifies that a project with an IRR greater than the minimum return on capital should be accepted.
• When choosing among alternative projects, the project with the highest IRR should be selected.
40

Example 5
• Calculate the IRR for both projects presented in previous Example, and compare among them using the resulted IRR. Assume the return on capital equals 10%.
• Project A
• IRR = 16.82%• Project B
• IRR = 13.28%
41
54321 )1(
100
)1(
200
)1(
200
)1(
400
)1(
50010000
IRRIRRIRRIRRIRR ++
+
+
+
+
+
+
+−=
54321 )1(
700
)1(
400
)1(
200
)1(
200
)1(
10010000
IRRIRRIRRIRRIRR ++
+
+
+
+
+
+
+−=

Example 6
• Assume the owner suggest two different diagrams for payment. Which one is the best Alternative? (MARR=2% Monthly)
42

NPV (1) > NPV (2) the original scenario better than the owner's suggestion
43

44

Project Monitoring and Control
• Monitoring
▫ Collecting, recording, and reporting information concerning project performance that project manger and others wish to know
• Controlling
▫ Uses data from monitor activity to bring actual performance to planned performance
45

Project Control
• Control – process and activities needed to correct deviations from plan
• Control the constraints
▫ Time (schedule)
▫ Cost (budget, expenses, etc)
▫ Performance (specifications, testing results, etc.)
46

Project Control Cycle
47
PLAN
MONITOR
COMPARE
ACTION
Specifications
Project Schedule
Project budget
Resource planVendor contracts
Record statusReport progress / cost
Actual status against planSchedule / Cost
Correct deviations from planRE-PLAN as necessary

Cost Control
• Cost Control system has two functions:▫ Keep the actual cost within the estimated value
▫ Collecting data for estimating cost for future projects.
• The Actual Cost affects the profit.
48
Direct Cost
Site Over Head
MARK UP
General O.H.
Profit + Risk
Construction Cost
Tender Price
Actual Cost

Cost Control Sequence:
1. Cost estimate
2. Measure and report actual field cost:
a) Work Quantity
b) Work hours
c) Cost rate
3. Comparison between actual versus estimated cost
4. Variance Analysis (Earned Value Analysis)
5. Plan and implement corrective actions
49

Techniques for monitoring and control
• Earned Value Analysis
▫ A way of measuring overall performance (not individual task) is using an aggregate performance measure - Earned Value
50

Earned Value Analysis
• Refer to earned value chart – basis for evaluating cost and performance to date
• If total value of the work accomplished is in balance with the planned (baseline) cost, and actual cost then top mgmt has no particular need for a detailed analysis of individual tasks
• Earned value concept – combines cost reporting & aggregate performance reporting into one comprehensive chart
51

Earned Value Analysis
52

Earned Value Analysis
• Cost Variance = BCWP – ACWP▫ +ve� Cost saving
▫ -ve � Cost overrun
• Cost Performance Index (CPI) = BCWP/ACWP▫ >1 � Cost saving
▫ <1 � Cost overrun
• Expected Final Cost = Total Expected cost/CPI
53

Earned Value Analysis
• Schedule Variance = BCWP – BCWS▫ +ve� Ahead of schedule
▫ -ve � Behind schedule
• Schedule Performance Index (SPI) =BCWP/BCWS▫ >1 � Ahead of schedule
▫ <1 � Behind schedule
• Expected Final Duration = Original Duration / SPI
54

Earned Value Analysis
• Baseline cost to completion – referred to as budget at completion (BAC)
• Actual cost to date – referred to as estimated cost at completion (EAC)
• Identify several variances according to two guidelines▫ A negative variance is ‘bad’▫ Cost and schedule variances are calculated as earned value minus some other measure
55

Example• The cost data for a small construction project are given in the following table; the schedule duration is 20 months the project has been worked on for 15 months.
• Calculate:
▫ BCWS, BCWP, ACWP
▫ Comment on Project Performance
▫ Predict the expected final Cost and Time
56
No. Item Unit QEstimated
cost
Cost report After 15 Months
Quantity Completed Actual Unit CostTarget Actual
1 Excavation m3 600 8 600 600 8.5
2 RC footing m3 500 600 500 450 610
3 RC columns m3 150 650 100 90 645
4 RC slabs m3 120 700 60 65 705

Example
• BCWS=(8×600) + (600×500) + (650×100) + (700×60) =411800
• BCWP= (8×600) + (600×450) + (650×90) + (700×65) =378800
• ACWP= (8.5×600) + (610×450) + (645×90) + (705×65) =383475
57

Example
• Cost Variance = 378,800-383,475=-4,675
• CPI = 378,800/383,475=0.98 (Cost Overrun)
• Expected Final cost = (8*600+600*500+650*150+700*120) /0.98 = 496224.5
• Schedule Variance = 378,800-411,800=-33,000
• SPI = 378,800/411,800=0.92 (behind schedule)
• Expected Final duration = 20 / 0.92 = 21.7 months
58

EXAMPLE
• Assume that operations on a Work Package cost 1,500 to complete. They were originally scheduled to finish today. At this point, we actually spent 1,350. And we estimate that we have completed two thirds (2/3) of the work. What are the cost and schedule variances?
59

EXAMPLE
• CV = BCWP – ACWP = 1500 (2/3) – 1350 = - 350
• SV = BCWP – BCWS = 1500 (2/3) – 1500 = - 500
• CPI = BCWP/ACWP = 1500(2/3)/1350 = 0.74
• SPI = BCWP/BCWS = 1500(2/3)/1500 = 0.67
• Spending higher than budget, and given what we have spent, we are not as far along as we should be (have not completed as much work as we should have)
60