Embed Size (px)
Citation preview
Financial literacy for investors in the securities market in Portugal
Page | 1
Financial literacy for investors in the
securities market in Portugal
REFORM/SC2020/017
DELIVERABLE 3 – Research report on investors and non-investors
knowledge and behaviour towards security investments
March 05, 2021
European Commission
DG REFORM
Funded by the European Union via the Structural Reform Support
Programme and implemented by KPMG and VVA in cooperation with
the European Commission's DG REFORM
DISCLAIMER
The information and views set out in this document are those of the author(s) and do not necessarily reflect the official opinion
of the Commission. The Commission does not guarantee the accuracy of the data included in this document. Neither the
Commission nor any person acting on the Commission’s behalf may be held responsible for the use which may be made of
the information contained therein.
© European Union, 2020. All rights reserved. Certain parts are licensed under conditions to the EU. Reproduction is authorized
provided the source is acknowledged.
Financial literacy for investors in the securities market in Portugal
Page | 2
1 Introduction
This document presents Deliverable 3, the “Research report on investors and non-investors
knowledge and behaviour towards security investments” (further referred to as “research
report”) for the project “Financial literacy for investors in the securities market in Portugal” where
the beneficiary is the Portuguese Securities Market Commission (Comissão do Mercado de
Valores Mobiliários – CMVM). This project is supported by DG REFORM of the European
Commission and is carried out by VVA and KPMG (“Contractor”).
The report provides an overview of the methodology used within Phase 3 of the project to
gather the data relevant for this report, as well as an analysis of the results of the data collection.
This document is structured as follows:
• Chapter 2: Survey design and methodology;
• Chapter 3: Results and investors and non-investors knowledge and behaviour towards
security investments;
• Chapter 4: Conclusions;
• Annex 1: Sample
• Annex 2: Questionnaires; and
• Annex 3: Minutes of meetings on past initiatives
Financial literacy for investors in the securities market in Portugal
Page | 3
2 Survey design and methodology
The aim of this Chapter is to provide a detailed overview of the survey design and approach taken
with regards to understanding the investors and non-investors’ knowledge and behaviour towards
investments in securities in Portugal. The approach was split in three steps:
• Sample design;
• Questionnaire design; and
• Data collection/survey approach.
2.1 Sample design The first step of the survey design and data collection was the development of a stratified sample of
individuals aged 18 and above, representative of the Portuguese population. This sample was
developed based on the most recent census of the Portuguese population.
The most recent available census used for the development of the survey sample was Censos 2011
by the National Institute of Statistics in Portugal (Instituto Nacional de Estatistica1). The first census
was carried out in 1864 and a new census is conducted every 11 years.
In order to develop the sample, based on the total Portuguese population, the sample was built on
two levels.
First, only the population aged 18+ was selected into the main group. This group was then, in the
second level, categorised by the following characteristics:
• Gender;
• Age and age groups (by gender);
• Size of location (e.g. city size); and
• NUTS2 2 and NUTS 3 region and sub-region (including the division for city size, gender and
age as well).
The sample selected was shared with the Client for approval. Looking into Portugal, in 2011 the
population was distributed as follows.
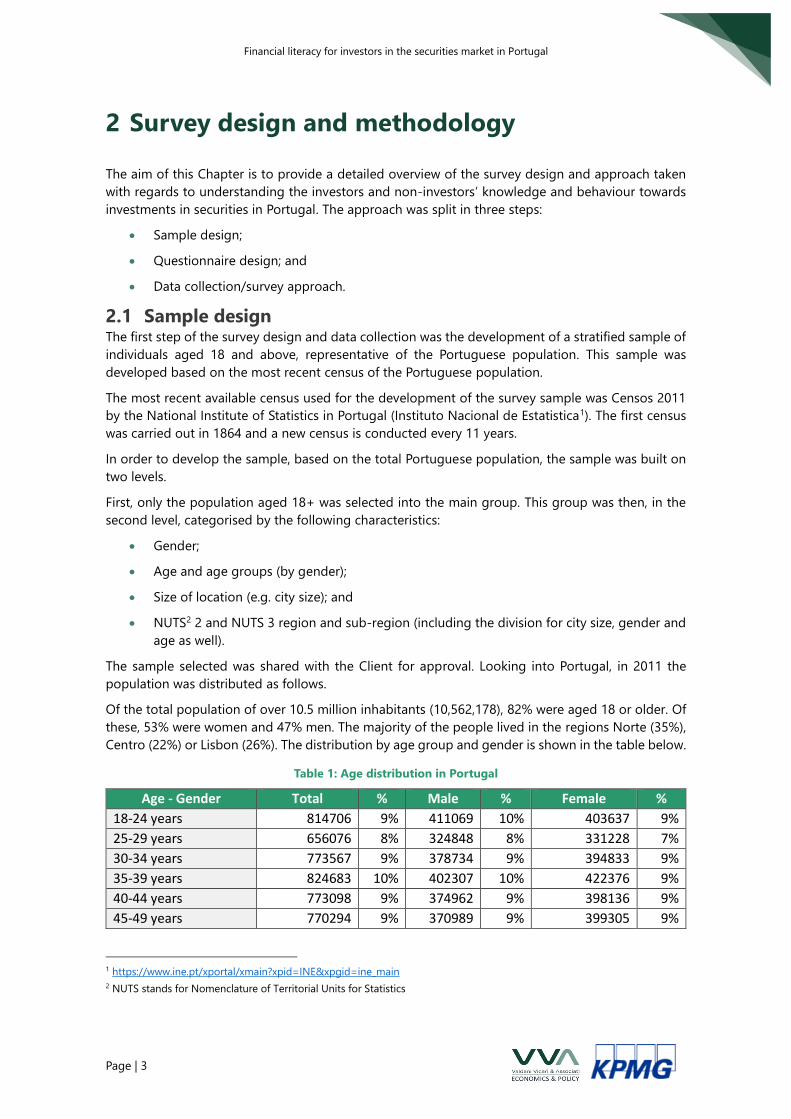
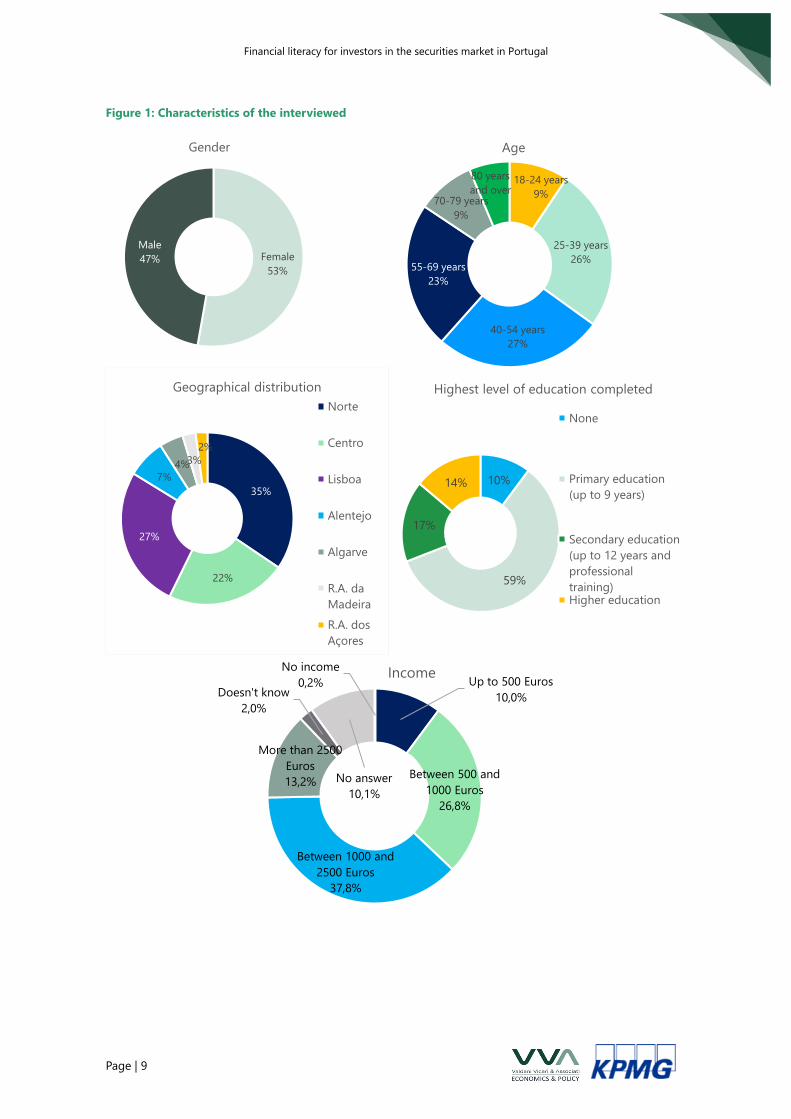
Of the total population of over 10.5 million inhabitants (10,562,178), 82% were aged 18 or older. Of
these, 53% were women and 47% men. The majority of the people lived in the regions Norte (35%),
Centro (22%) or Lisbon (26%). The distribution by age group and gender is shown in the table below.
Table 1: Age distribution in Portugal
Age - Gender Total % Male % Female %
18-24 years 814706 9% 411069 10% 403637 9%
25-29 years 656076 8% 324848 8% 331228 7%
30-34 years 773567 9% 378734 9% 394833 9%
35-39 years 824683 10% 402307 10% 422376 9%
40-44 years 773098 9% 374962 9% 398136 9%
45-49 years 770294 9% 370989 9% 399305 9%
1 https://www.ine.pt/xportal/xmain?xpid=INE&xpgid=ine_main
2 NUTS stands for Nomenclature of Territorial Units for Statistics
Financial literacy for investors in the securities market in Portugal
Page | 4
Age - Gender Total % Male % Female %
50-54 years 722360 8% 346248 9% 376112 8%
55-59 years 677651 8% 322095 8% 355556 8%
60-64 years 634741 7% 298546 7% 336195 7%
65-69 years 551701 6% 253004 6% 298697 7%
70-74 years 496438 6% 220461 5% 275977 6%
75-79 years 429706 5% 180131 4% 249575 5%
80-84 years 297888 3% 113325 3% 184563 4%
85-89 years 164356 2% 55635 1% 108721 2%
90 years or more 69975 1% 19768 0.5% 50207 1%
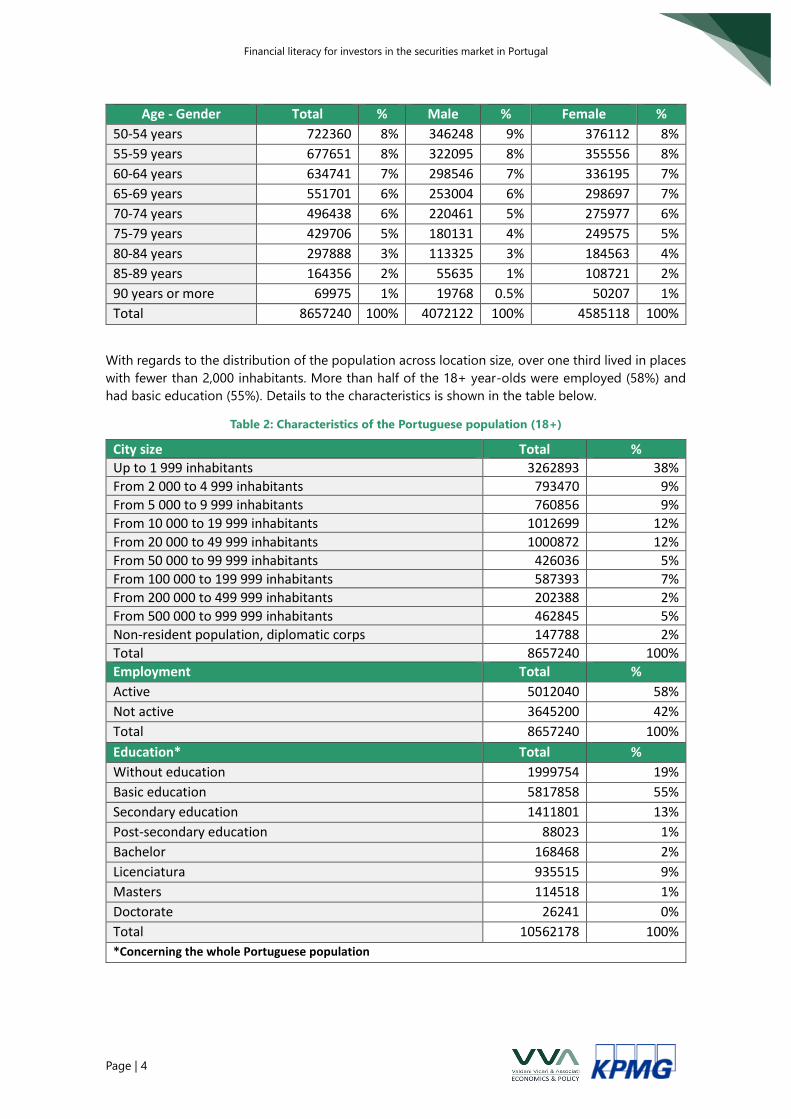
Total 8657240 100% 4072122 100% 4585118 100%
With regards to the distribution of the population across location size, over one third lived in places
with fewer than 2,000 inhabitants. More than half of the 18+ year-olds were employed (58%) and
had basic education (55%). Details to the characteristics is shown in the table below.
Table 2: Characteristics of the Portuguese population (18+)
City size Total %
Up to 1 999 inhabitants 3262893 38%
From 2 000 to 4 999 inhabitants 793470 9%
From 5 000 to 9 999 inhabitants 760856 9%
From 10 000 to 19 999 inhabitants 1012699 12%
From 20 000 to 49 999 inhabitants 1000872 12%
From 50 000 to 99 999 inhabitants 426036 5%
From 100 000 to 199 999 inhabitants 587393 7%
From 200 000 to 499 999 inhabitants 202388 2%
From 500 000 to 999 999 inhabitants 462845 5%
Non-resident population, diplomatic corps 147788 2%
Total 8657240 100%
Employment Total %
Active 5012040 58%
Not active 3645200 42%
Total 8657240 100%
Education* Total %
Without education 1999754 19%
Basic education 5817858 55%
Secondary education 1411801 13%
Post-secondary education 88023 1%
Bachelor 168468 2%
Licenciatura 935515 9%
Masters 114518 1%
Doctorate 26241 0%
Total 10562178 100%
*Concerning the whole Portuguese population
Financial literacy for investors in the securities market in Portugal
Page | 5
These characteristics were applied in the same way in the sample and across the NUTS 2 regions of
Portugal. A detailed sample design is provided in the Annex of this report. The process ensures that
the survey is built on a representative sample.
2.2 Questionnaire design In total, three types of questionnaires were developed, revised and approved: i) Step 1 questionnaire;
ii) Step 2 questionnaire for investors; and iii) Step 2 questionnaire for non-investors.
Once the questionnaire had been approved, they were translated to Portuguese and the Portuguese
version approved by the CMVM. All the questionnaires are provided in Annex 2 of this report.
2.2.1 Step 1 questionnaire development
This questionnaire served the purpose of identifying the characteristics of investors and non-
investors in Portugal as well as identifying participants for the second step, the in-depth survey.
The questionnaire was built in four sections: i) introduction; ii) “about you”; iii) identification
questions; and iv) closing questions.
The introduction presented the interview participant with the overall project goals, the objectives of
the survey and the Step 1 interview. The CMVM was also introduced in this section.
With regards to the “about you” section, this section was the most extensive within the questionnaire,
as it aimed at identifying the characteristics of the interviewee. The first question was to identify
whether the person interviewed made day-to-day financial decisions about their money either
independently or jointly with someone. If not, the interview was ended, as the majority of the
questions for the second step of the survey were targeted at people who made financial decisions.
The remaining questions in this section related to the personal characteristics of the interviewee,
such as where they live, their age group, gender, education level, etc.
The identification section consisted of one long question divided into two sub-questions. This
question aimed at identifying who of the interviewees was a current investor and who was a past
investor.
Finally, the closing questions aimed at identifying the interviewees’ interest in participating in the
second step of the survey, as well as their contact information (i.e. e-mail) and consent for the use
of their personal contact information to reach out to them again.
2.2.2 Step 2 questionnaires development
The second step questionnaire was developed based on two aspects: common questions for
investors and non-investors and a set of questions for each group, and a set of questions to
understand the characteristics of these groups (e.g. financial knowledge, financial and investing
behaviours, etc.).
In order to ensure comparability on a national level with previous studies, as well as to follow
international guidelines, the step 2 questionnaires were developed based on the 2015 survey
questionnaire of CMVM and the OECD financial literacy measurement kit.
The approved questionnaires in English are provided in the Annex of this report.
2.3 Survey approach The overall survey was structured in two steps: i) first step interview of the representative sample;
and ii) second step in-depth survey for financial literacy of investors and non-investors. The total
timeline of the survey fieldwork was from the 05/10/2020 to the 22/01/2021. The survey
Financial literacy for investors in the securities market in Portugal
Page | 6
implementation needed to be extended due to the need to change the procedure to adjust to
measures taken by the Portuguese government to contain the spread of Covid-19.
2.3.1 Step 1: Identification of investors and non-investors’
characteristics in Portugal
The first step consisted of interviewing a representative sample of 10,000 persons of the Portuguese
population (18 years old and higher). The objective of this step was to gather a pool of potential
participants for the second in-depth survey while understanding the share of investors within the
sample. It is important to note that the survey was only conducted with persons that were identified
as “decision makers”, meaning that they manage their finances either on their own or jointly with
another person in the household.
This phase was run from the 05/10/2020 until the week of the 11/12/2020 through CAT3 interviews
reaching fixed line numbers and mobile phones. In order to avoid a bias in the identification and
profiling of the sample, the interview called a fixed line number with the person in the household
who had their birthday next (if 18 years or above), one of the common criteria for random selection
of the population and to avoid that only the persons responding the telephone in the households
answer the survey. Given that landline-telephone penetration in Portugal is at 49%, parts of the
interviews were also conducted by reaching mobile phones. Regarding mobile phone contacts, a
pulsed RDD (random digit dialling) sample was used, meaning that a random list of possible mobile
phone numbers was generated, and the numbers pulsed4.
The telephone interviews were run in Portuguese by native speakers and they were first conducted
in a pilot phase. Once the questionnaire was validated, tested in the pilot phase5 and the approach
adjusted where necessary, the remaining interviews were run with the whole sample. 30 to 35
operators and two room supervisors for control and assistance conducted the CATI. Every number
was only dropped after five tries on different days and times to guarantee the best possible
representativeness and to avoid biases in the results. Quality checks were done by supervisors.
As indicated before, through this first step, we were able to assess investors and non-investors and
their socio-demographic profile by starting from a very large and representative sample and to have
a pool of potential participants for the second step. The results of step 1 are provided in the next
Chapter.
2.3.2 Step 2: In-depth survey on financial literacy and behaviour
The second step of the survey consisted of an in-depth survey with a sample of more than 500
investors based on the results of the first step interviews and a sample of about 1,500 non-investors.6
The final number of survey participants was higher than the minimum target and are presented in
the next Chapter.
The second step survey was initially planned to be run through face-to-face interviews at
participants’ homes, so-called CAPI interviews7. Many of the interviews were run through CAPI,
starting with a pilot the week of the 19/10/2020 and continued where possible until the 22/01/2021.
3 Computer Aided Telephone Interviews
4 Pulsing a number means checking if that number is valid and active.
5 No issues were identified, hence no further revisions had to be made to the questionnaires or the survey design
6 As per the clarification of Annex 1 in document Ares(2020)1411533, this exceeds the minimum required of 400 investors.
7 Computer Assisted Personal Interviews
Financial literacy for investors in the securities market in Portugal
Page | 7
Given the development of the Covid-19 pandemic, changes to this approach had to be made. These
changes were approved by CMVM and DG Reform. The following approaches were used for step 2:
• Face-to-face interviews: Where already scheduled and possible, face-to-face (CAPI) were still
conducted. This was continued in order to ensure a representative sample of people without
internet connectivity, which in general was low for people aged 55 and above, as well as
those living in more sparsely populated areas;
• CAWI survey: Instead of conducting only face-to-face interviews with a pool of the sub-
sample identified through step 1, the participants of the previous step were asked whether
they have internet access and their email address to share an online version of the second
step survey with them. The CAWI survey was introduced in the week of the 26/10/2020 and
ran until the end of the full survey process; and
• CATI: Where neither CAWI nor face-to-face interviews were possible, the second step survey
was implemented through telephone interviews. This change was introduced the week of
the 09/11/2020 and was implemented, where relevant, until the end of the whole survey
procedure. Given the type of questions in the questionnaire, this option was chosen as last
resort alternative to the two other approaches.
The interviewers received a detailed instruction manual and personal briefing (on site or via Skype/
videocall). In addition, 20 pilot interviews were conducted to resolve any unclear wording or phrasing
of the questionnaire and to ensure that it is fully understandable for the respondents.
In order to ensure that the respondents reflected the profiles of investors and non-investors as
identified in the first step, quotas were set. In case the quota of investors was lower than expected
and/or the refusal rate for in-depth interviews during the first CATI step was high, meaning that the
first step survey recruitment did not guarantee 500 interviews with investors, the face-to-face
fieldwork proceeded with additional recruitment. This further recruitment aimed at reaching the
profile or socio-demographic characteristics of investors that was identified during the first step of
the survey.
Financial literacy for investors in the securities market in Portugal
Page | 8
3 Results
This chapter provides a detailed overview of the results of the survey, both with regards to step 1
and step 2. The results shown in this chapter do not comprise all the statistical analyses that were
run and exported into Excel sheets, which was provided separately to this Deliverable to CMVM and
DG REFORM. The raw data in SPSS was also made available while ensuring anonymity and in
accordance with GDPR rules Regulation (EU) General Data Protection Regulation 2016/679. This
chapter focuses on the main findings to understand the key characteristics of financial decision
makers and investors/non-investors in Portugal, their financial understanding, behaviour and
decision-making processes.
3.1 Results of step 1: Identification of investors Within the first step of the survey, a total of 15,173 CATI were conducted with a representative sample
of the Portuguese population. This served to identify the share of investors in Portugal and their
characteristics. Of those interviews, only the respondents who were financial decision makers or at
least co-decision makers were asked further questions. These “financial decision makers” were 9,969
of the total CATI respondents.
The figures and tables below show the distribution of those interviewed in the first step across
various categories.
Financial literacy for investors in the securities market in Portugal
Page | 9
Figure 1: Characteristics of the interviewed
Female
53%
Male
47%
Gender
18-24 years
9%
25-39 years
26%
40-54 years
27%
55-69 years
23%
70-79 years
9%
80 years
and over
Age
35%
22%
27%
7%
4%3%
2%
Geographical distribution
Norte
Centro
Lisboa
Alentejo
Algarve
R.A. da
Madeira
R.A. dos
Açores
10%
59%
17%
14%
Highest level of education completed
None
Primary education
(up to 9 years)
Secondary education
(up to 12 years and
professional
training)Higher education
No income
0,2% Up to 500 Euros
10,0%
Between 500 and
1000 Euros
26,8%
Between 1000 and
2500 Euros
37,8%
More than 2500
Euros
13,2%
Doesn't know
2,0%
No answer
10,1%
Income
Financial literacy for investors in the securities market in Portugal
Page | 10
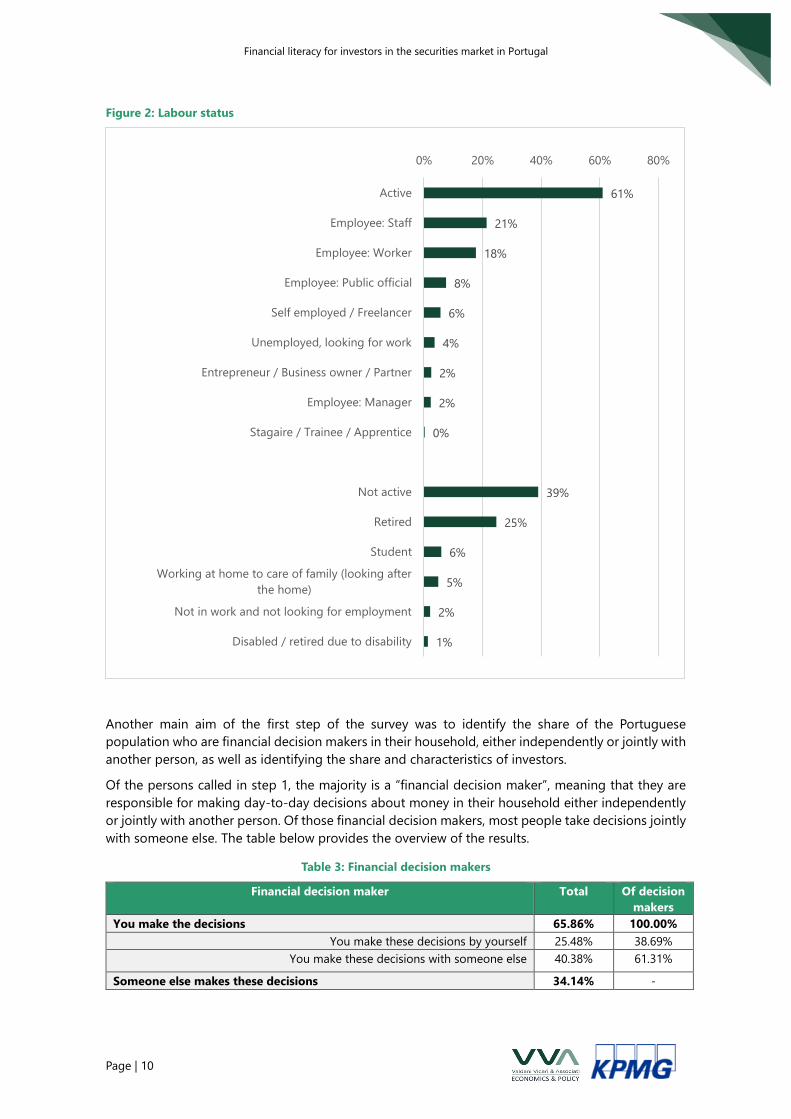
Figure 2: Labour status
Another main aim of the first step of the survey was to identify the share of the Portuguese
population who are financial decision makers in their household, either independently or jointly with
another person, as well as identifying the share and characteristics of investors.
Of the persons called in step 1, the majority is a “financial decision maker”, meaning that they are
responsible for making day-to-day decisions about money in their household either independently
or jointly with another person. Of those financial decision makers, most people take decisions jointly
with someone else. The table below provides the overview of the results.
Table 3: Financial decision makers
Financial decision maker Total Of decision
makers
You make the decisions 65.86% 100.00%
You make these decisions by yourself 25.48% 38.69%
You make these decisions with someone else 40.38% 61.31%
Someone else makes these decisions 34.14% -
61%
21%
18%
8%
6%
4%
2%
2%
0%
39%
25%
6%
5%
2%
1%
0% 20% 40% 60% 80%
Active
Employee: Staff
Employee: Worker
Employee: Public official
Self employed / Freelancer
Unemployed, looking for work
Entrepreneur / Business owner / Partner
Employee: Manager
Stagaire / Trainee / Apprentice
Not active
Retired
Student
Working at home to care of family (looking after
the home)
Not in work and not looking for employment
Disabled / retired due to disability
Financial literacy for investors in the securities market in Portugal
Page | 11
For the aim of this research report, the relevant group of people are those that make financial
decisions, as the second step seeks to understand behaviour and knowledge of those that invest
and those that do not invest, meaning those actively involved in financial decisions. This is why the
following results are related to financial decision makers only.
One of the main questions to identify investors and non-investors was which type of products the
respondent owns. Of all the financial decision makers, 92% own at least one of the products listed,
while 86% held at least one of these products in the past. Respondents were able to choose multiple
products.
Table 4: Share of respondents that own or owned one or more types of financial products
Type of product Share of respondents that
currently hold the product
Share of respondents that held
the product in the past
Investment funds and unit trust (other
than pension)
8.27% 7.91%
Stocks and shares 8.85% 13.21%
Treasury bonds 4.28% 4.49%
Private bonds 1.16% 1.47%
Time deposits 41.32% 45.77%
Demand deposits 87.14% 73.06%
Structured deposits 2.10% 2.45%
Equity securities 4.33% 3.18%
Structured products (except structured
deposits)
0.84% 1.11%
Other derivatives 0.67% 0.86%
Other investment products 1.92% 1.58%
Retirement savings funds (FPR) 12.37% 9.98%
Pension plans or pension funds 14.37% 14.71%
Savings certificates 9.56% 13.71%
Treasury bills 5.99% 5.66%
Do not hold any of the products given to
question as a whole
7.81% 12.74%
Don't know response given to question as
a whole
0.07% 0.40%
No answer to the full question 0.15% 0.51%
Source: CATI, financial decision makers, n=9,969
In line with previous reports, respondents were categorised as “current investor” if he or she owns
one or more of the following products:
• Investment funds and unit trust (other than pension);
• Stocks and shares;
• Treasury bonds;
• Private bonds;
• Equity securities;
• Structured products (except structured deposits);
• Other derivatives;
• Other investment products; and/or
Financial literacy for investors in the securities market in Portugal
Page | 12
• Retirement savings funds (FPR).
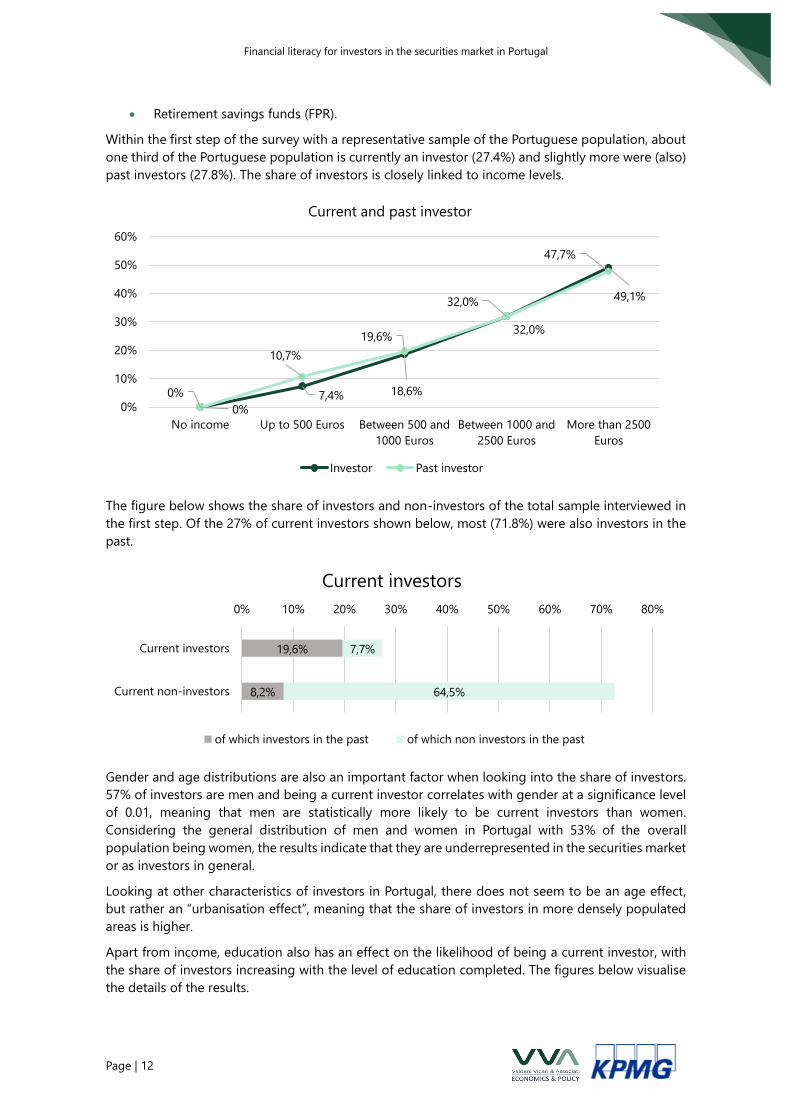
Within the first step of the survey with a representative sample of the Portuguese population, about
one third of the Portuguese population is currently an investor (27.4%) and slightly more were (also)
past investors (27.8%). The share of investors is closely linked to income levels.
The figure below shows the share of investors and non-investors of the total sample interviewed in
the first step. Of the 27% of current investors shown below, most (71.8%) were also investors in the
past.
Gender and age distributions are also an important factor when looking into the share of investors.
57% of investors are men and being a current investor correlates with gender at a significance level
of 0.01, meaning that men are statistically more likely to be current investors than women.
Considering the general distribution of men and women in Portugal with 53% of the overall
population being women, the results indicate that they are underrepresented in the securities market
or as investors in general.
Looking at other characteristics of investors in Portugal, there does not seem to be an age effect,
but rather an “urbanisation effect”, meaning that the share of investors in more densely populated
areas is higher.
Apart from income, education also has an effect on the likelihood of being a current investor, with
the share of investors increasing with the level of education completed. The figures below visualise
the details of the results.
0% 7,4% 18,6%
32,0% 49,1%
0%
10,7%
19,6%32,0%
47,7%
0%
10%
20%
30%
40%
50%
60%
No income Up to 500 Euros Between 500 and
1000 Euros
Between 1000 and
2500 Euros
More than 2500
Euros
Current and past investor
Investor Past investor
19,6%
8,2%
7,7%
64,5%
0% 10% 20% 30% 40% 50% 60% 70% 80%
Current investors
Current non-investors
Current investors
of which investors in the past of which non investors in the past
Financial literacy for investors in the securities market in Portugal
Page | 13
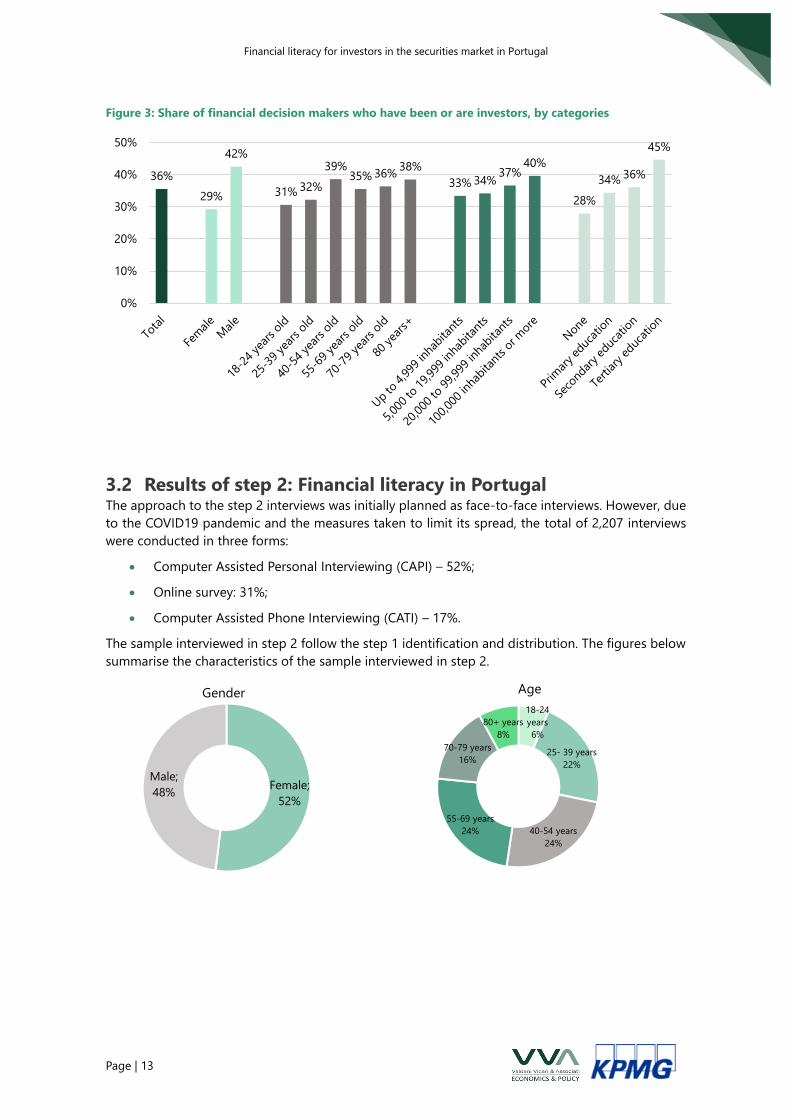
Figure 3: Share of financial decision makers who have been or are investors, by categories
3.2 Results of step 2: Financial literacy in Portugal The approach to the step 2 interviews was initially planned as face-to-face interviews. However, due
to the COVID19 pandemic and the measures taken to limit its spread, the total of 2,207 interviews
were conducted in three forms:
• Computer Assisted Personal Interviewing (CAPI) – 52%;
• Online survey: 31%;
• Computer Assisted Phone Interviewing (CATI) – 17%.
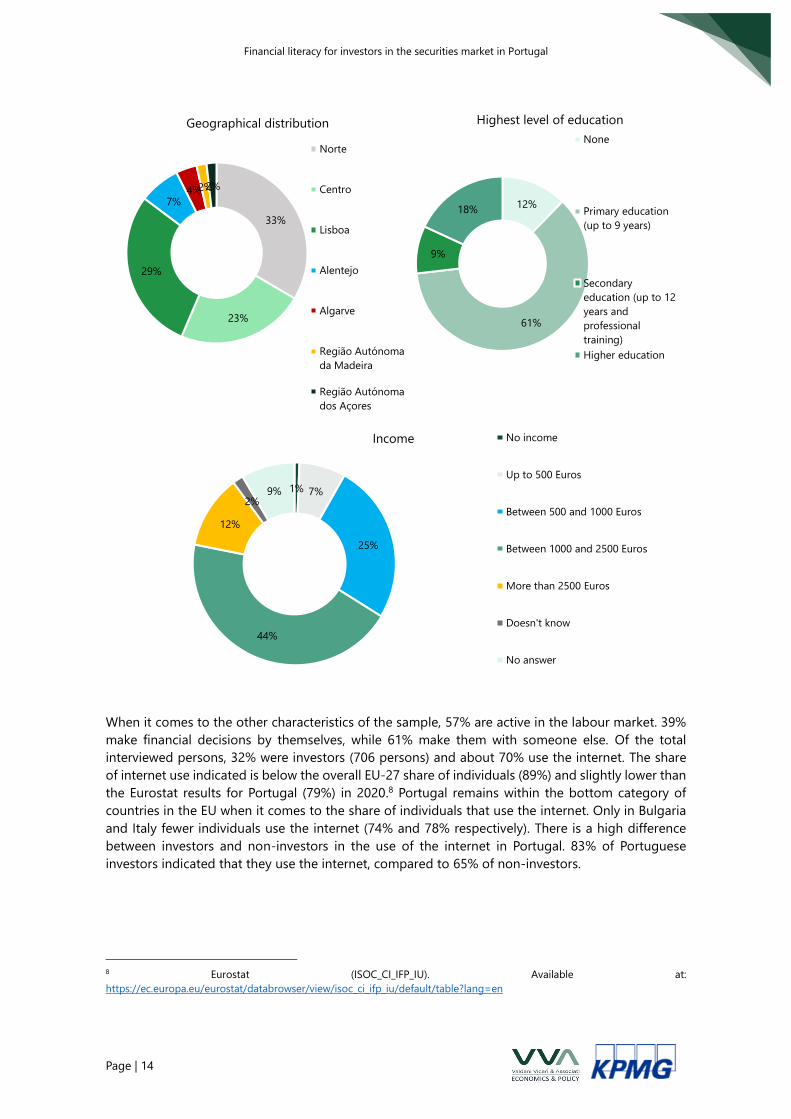
The sample interviewed in step 2 follow the step 1 identification and distribution. The figures below
summarise the characteristics of the sample interviewed in step 2.
36%
29%
42%
31% 32%
39%35% 36%
38%
33% 34%37%
40%
28%
34% 36%
45%
0%
10%
20%
30%
40%
50%
Female;
52%
Male;
48%
Gender
18-24
years
6%
25- 39 years
22%
40-54 years
24%
55-69 years
24%
70-79 years
16%
80+ years
8%
Age
Financial literacy for investors in the securities market in Portugal
Page | 14
When it comes to the other characteristics of the sample, 57% are active in the labour market. 39%
make financial decisions by themselves, while 61% make them with someone else. Of the total
interviewed persons, 32% were investors (706 persons) and about 70% use the internet. The share
of internet use indicated is below the overall EU-27 share of individuals (89%) and slightly lower than
the Eurostat results for Portugal (79%) in 2020.8 Portugal remains within the bottom category of
countries in the EU when it comes to the share of individuals that use the internet. Only in Bulgaria
and Italy fewer individuals use the internet (74% and 78% respectively). There is a high difference
between investors and non-investors in the use of the internet in Portugal. 83% of Portuguese
investors indicated that they use the internet, compared to 65% of non-investors.
8 Eurostat (ISOC_CI_IFP_IU). Available at:
https://ec.europa.eu/eurostat/databrowser/view/isoc_ci_ifp_iu/default/table?lang=en
33%
23%
29%
7%4%2%2%
Geographical distribution
Norte
Centro
Lisboa
Alentejo
Algarve
Região Autónoma
da Madeira
Região Autónoma
dos Açores
12%
61%
9%
18%
Highest level of education
None
Primary education
(up to 9 years)
Secondary
education (up to 12
years and
professional
training)
Higher education
1% 7%
25%
44%
12%
2%9%
Income No income
Up to 500 Euros
Between 500 and 1000 Euros
Between 1000 and 2500 Euros
More than 2500 Euros
Doesn't know
No answer
Financial literacy for investors in the securities market in Portugal
Page | 15
3.2.1 Financial behaviour and attitude
One of the key aspects researched during the second step was related to the persons’ financial
behaviour and attitude.
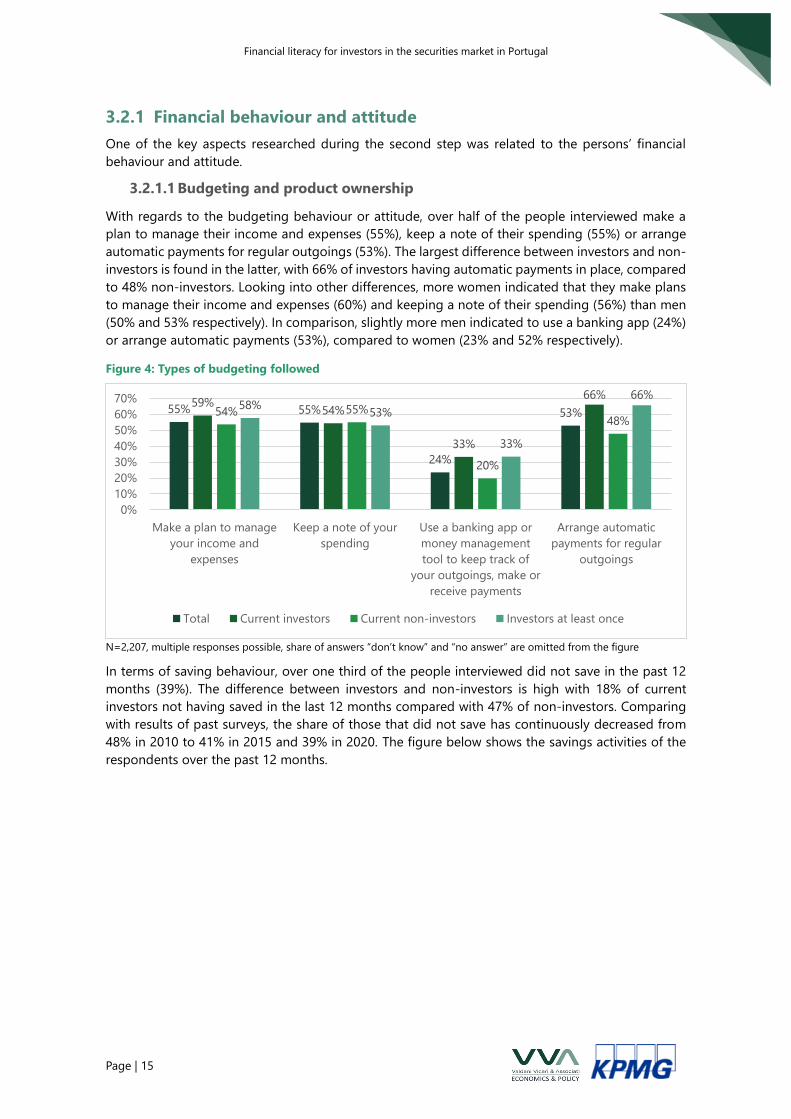
3.2.1.1 Budgeting and product ownership
With regards to the budgeting behaviour or attitude, over half of the people interviewed make a
plan to manage their income and expenses (55%), keep a note of their spending (55%) or arrange
automatic payments for regular outgoings (53%). The largest difference between investors and non-
investors is found in the latter, with 66% of investors having automatic payments in place, compared
to 48% non-investors. Looking into other differences, more women indicated that they make plans
to manage their income and expenses (60%) and keeping a note of their spending (56%) than men
(50% and 53% respectively). In comparison, slightly more men indicated to use a banking app (24%)
or arrange automatic payments (53%), compared to women (23% and 52% respectively).
Figure 4: Types of budgeting followed
N=2,207, multiple responses possible, share of answers “don’t know” and “no answer” are omitted from the figure
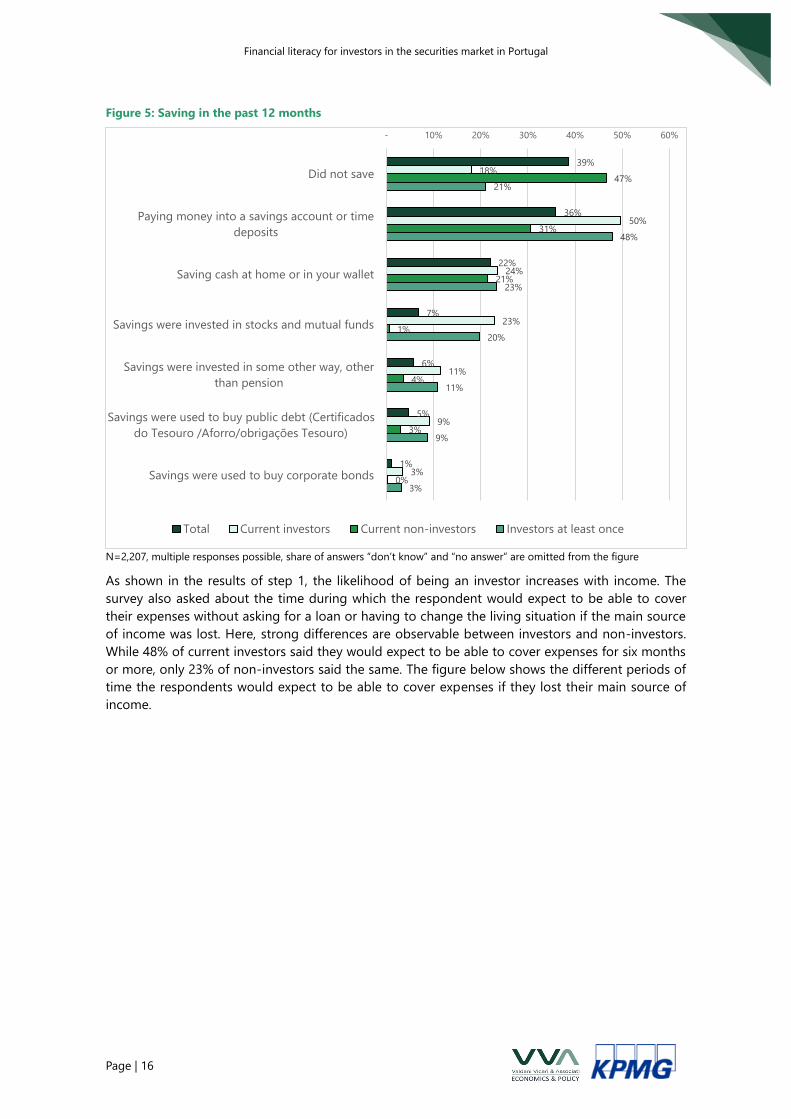
In terms of saving behaviour, over one third of the people interviewed did not save in the past 12
months (39%). The difference between investors and non-investors is high with 18% of current
investors not having saved in the last 12 months compared with 47% of non-investors. Comparing
with results of past surveys, the share of those that did not save has continuously decreased from
48% in 2010 to 41% in 2015 and 39% in 2020. The figure below shows the savings activities of the
respondents over the past 12 months.
55% 55%
24%
53%59%
54%
33%
66%
54% 55%
20%
48%
58%53%
33%
66%
0%
10%
20%
30%
40%
50%
60%
70%
Make a plan to manage
your income and
expenses
Keep a note of your
spending
Use a banking app or
money management
tool to keep track of
your outgoings, make or
receive payments
Arrange automatic
payments for regular
outgoings
Total Current investors Current non-investors Investors at least once
Financial literacy for investors in the securities market in Portugal
Page | 16
Figure 5: Saving in the past 12 months
N=2,207, multiple responses possible, share of answers “don’t know” and “no answer” are omitted from the figure
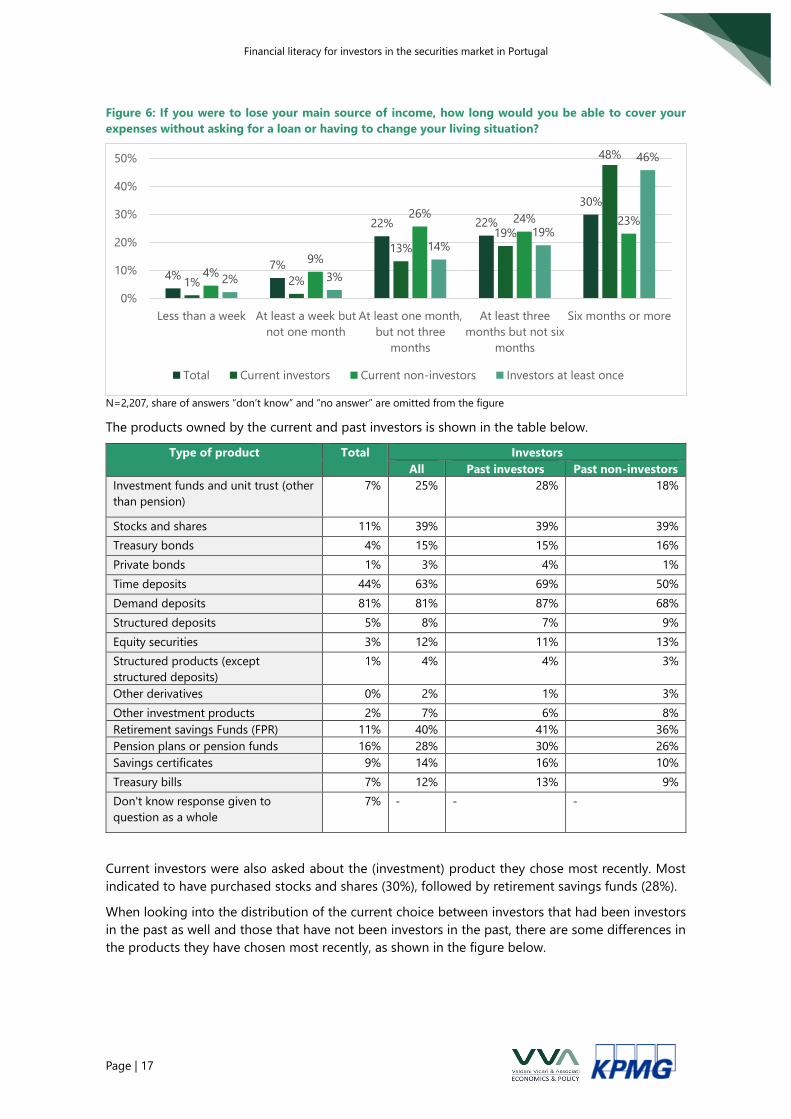
As shown in the results of step 1, the likelihood of being an investor increases with income. The
survey also asked about the time during which the respondent would expect to be able to cover
their expenses without asking for a loan or having to change the living situation if the main source
of income was lost. Here, strong differences are observable between investors and non-investors.
While 48% of current investors said they would expect to be able to cover expenses for six months
or more, only 23% of non-investors said the same. The figure below shows the different periods of
time the respondents would expect to be able to cover expenses if they lost their main source of
income.
39%
36%
22%
7%
6%
5%
1%
18%
50%
24%
23%
11%
9%
3%
47%
31%
21%
1%
4%
3%
0%
21%
48%
23%
20%
11%
9%
3%
- 10% 20% 30% 40% 50% 60%
Did not save
Paying money into a savings account or time
deposits
Saving cash at home or in your wallet
Savings were invested in stocks and mutual funds
Savings were invested in some other way, other
than pension
Savings were used to buy public debt (Certificados
do Tesouro /Aforro/obrigações Tesouro)
Savings were used to buy corporate bonds
Total Current investors Current non-investors Investors at least once
Financial literacy for investors in the securities market in Portugal
Page | 17
Figure 6: If you were to lose your main source of income, how long would you be able to cover your
expenses without asking for a loan or having to change your living situation?
N=2,207, share of answers “don’t know” and “no answer” are omitted from the figure
The products owned by the current and past investors is shown in the table below.
Type of product Total Investors
All Past investors Past non-investors
Investment funds and unit trust (other
than pension)
7% 25% 28% 18%
Stocks and shares 11% 39% 39% 39%
Treasury bonds 4% 15% 15% 16%
Private bonds 1% 3% 4% 1%
Time deposits 44% 63% 69% 50%
Demand deposits 81% 81% 87% 68%
Structured deposits 5% 8% 7% 9%
Equity securities 3% 12% 11% 13%
Structured products (except
structured deposits)
1% 4% 4% 3%
Other derivatives 0% 2% 1% 3%
Other investment products 2% 7% 6% 8%
Retirement savings Funds (FPR) 11% 40% 41% 36%
Pension plans or pension funds 16% 28% 30% 26%
Savings certificates 9% 14% 16% 10%
Treasury bills 7% 12% 13% 9%
Don't know response given to
question as a whole
7% - - -
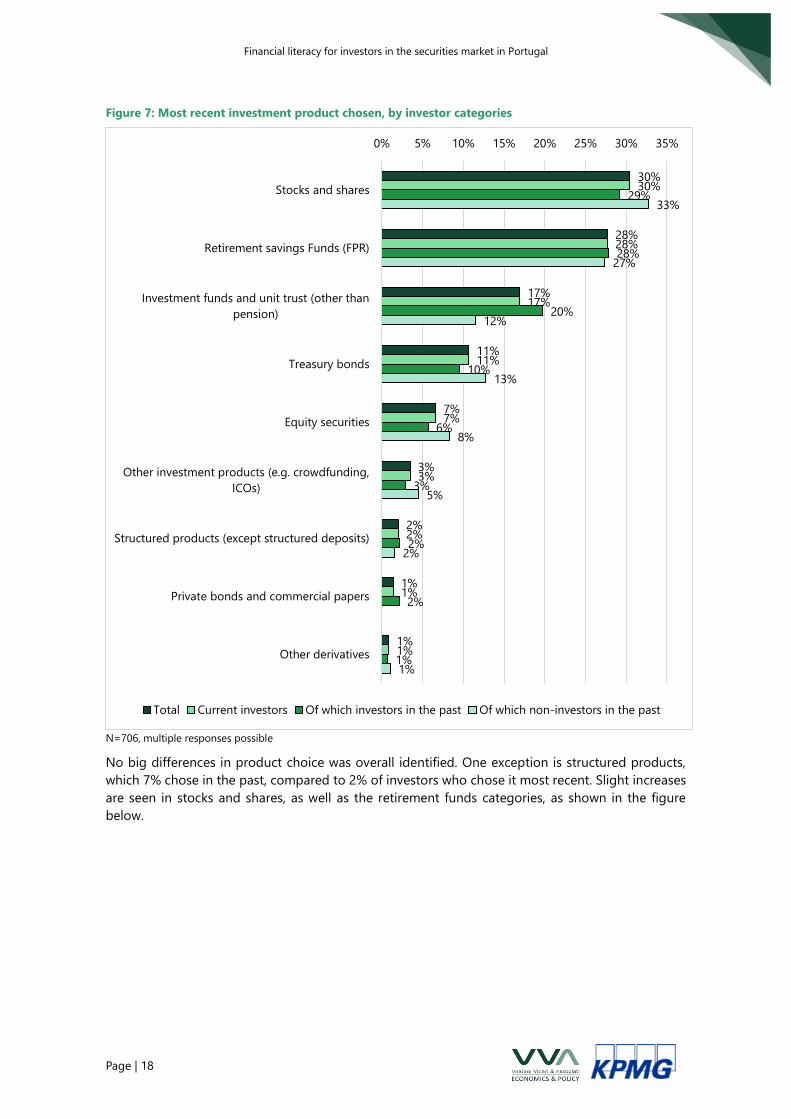
Current investors were also asked about the (investment) product they chose most recently. Most
indicated to have purchased stocks and shares (30%), followed by retirement savings funds (28%).
When looking into the distribution of the current choice between investors that had been investors
in the past as well and those that have not been investors in the past, there are some differences in
the products they have chosen most recently, as shown in the figure below.
4%7%
22% 22%
30%
1% 2%
13%
19%
48%
4%9%
26% 24% 23%
2% 3%
14%
19%
46%
0%
10%
20%
30%
40%
50%
Less than a week At least a week but
not one month
At least one month,
but not three
months
At least three
months but not six
months
Six months or more
Total Current investors Current non-investors Investors at least once
Financial literacy for investors in the securities market in Portugal
Page | 18
Figure 7: Most recent investment product chosen, by investor categories
N=706, multiple responses possible
No big differences in product choice was overall identified. One exception is structured products,
which 7% chose in the past, compared to 2% of investors who chose it most recent. Slight increases
are seen in stocks and shares, as well as the retirement funds categories, as shown in the figure
below.
30%
28%
17%
11%
7%
3%
2%
1%
1%
30%
28%
17%
11%
7%
3%
2%
1%
1%
29%
28%
20%
10%
6%
3%
2%
2%
1%
33%
27%
12%
13%
8%
5%
2%
1%
0% 5% 10% 15% 20% 25% 30% 35%
Stocks and shares
Retirement savings Funds (FPR)
Investment funds and unit trust (other than
pension)
Treasury bonds
Equity securities
Other investment products (e.g. crowdfunding,
ICOs)
Structured products (except structured deposits)
Private bonds and commercial papers
Other derivatives
Total Current investors Of which investors in the past Of which non-investors in the past
Financial literacy for investors in the securities market in Portugal
Page | 19
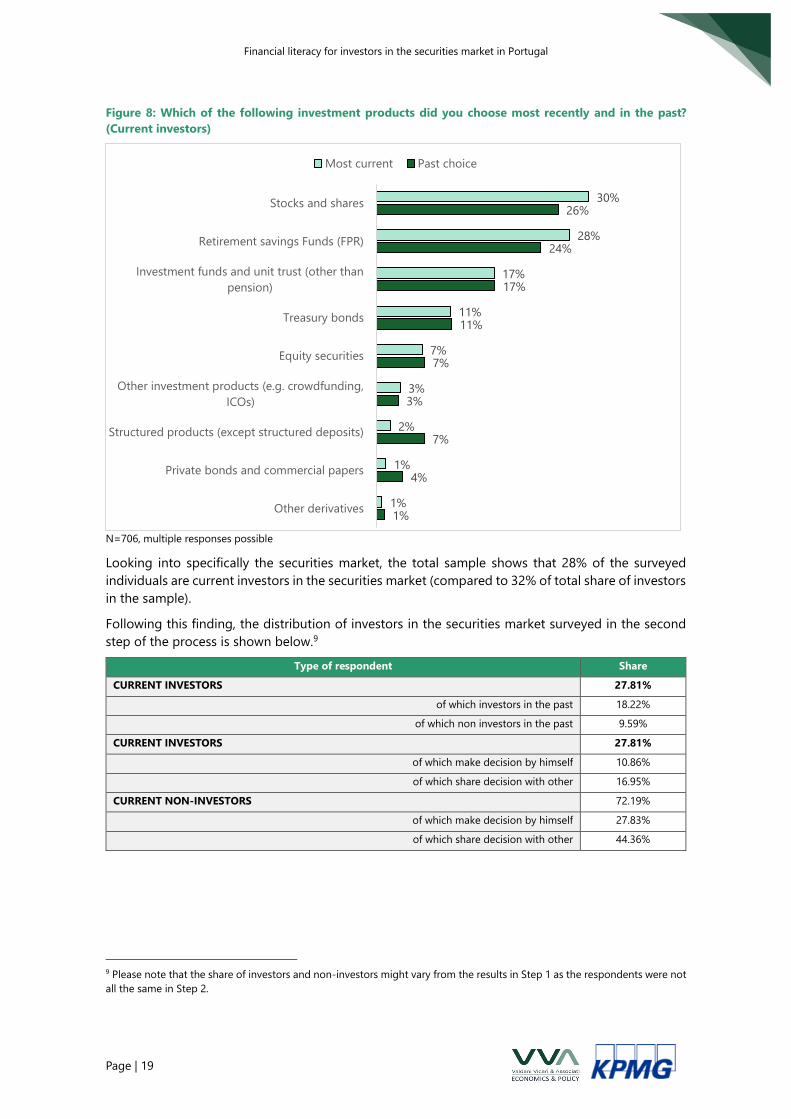
Figure 8: Which of the following investment products did you choose most recently and in the past?
(Current investors)
N=706, multiple responses possible
Looking into specifically the securities market, the total sample shows that 28% of the surveyed
individuals are current investors in the securities market (compared to 32% of total share of investors
in the sample).
Following this finding, the distribution of investors in the securities market surveyed in the second
step of the process is shown below.9
Type of respondent Share
CURRENT INVESTORS 27.81%
of which investors in the past 18.22%
of which non investors in the past 9.59%
CURRENT INVESTORS 27.81%
of which make decision by himself 10.86%
of which share decision with other 16.95%
CURRENT NON-INVESTORS 72.19%
of which make decision by himself 27.83%
of which share decision with other 44.36%
9 Please note that the share of investors and non-investors might vary from the results in Step 1 as the respondents were not
all the same in Step 2.
30%
28%
17%
11%
7%
3%
2%
1%
1%
26%
24%
17%
11%
7%
3%
7%
4%
1%
Stocks and shares
Retirement savings Funds (FPR)
Investment funds and unit trust (other than
pension)
Treasury bonds
Equity securities
Other investment products (e.g. crowdfunding,
ICOs)
Structured products (except structured deposits)
Private bonds and commercial papers
Other derivatives
Most current Past choice

Financial literacy for investors in the securities market in Portugal
Page | 20
3.2.1.2 Information and the sources chosen
One key aspect of choosing products is the sources of information that feed the decision-making
process. Thus, a series of questions were asked to understand which are used and which affect their
decision.
With regards to the source that the respondent felt influenced their decision most, the information
provided by bank staff received most mentions, in particular by current investors (54%), followed by
a recommendation from friends, family or acquaintances (41%). The fewest mentions were related
to personal finance blogs and the product being a counterpart to a credit currently held by the
respondent. The responses are shown in the figure below.
Figure 9: Source of information that influenced the most recent product choice
N=1,928, multiple responses possible, “no answer” omitted from figure
46%
38%
14%
14%
8%
4%
1%
1%
0%
0%
0%
54%
41%
16%
22%
11%
3%
0%
0%
1%
0%
0%
42%
37%
13%
10%
6%
5%
1%
1%
0%
0%
0% 20% 40% 60%
Information provided by bank staff (in person,
online or over the phone)
A recommendation from friends, family or
acquaintances
Specialist product comparison or best-buy
guidance (such as specialist magazine, or a price
comparison website)
A recommendation from an independent financial
advisor
Information from an advert about this specific
product
I decided on my own
Company / company where I work
Mandatory to receive salary
Information / Internet Research
Counterpart to a credit
Personal finance blogs
Total Current investors Current non-investors
Financial literacy for investors in the securities market in Portugal
Page | 21
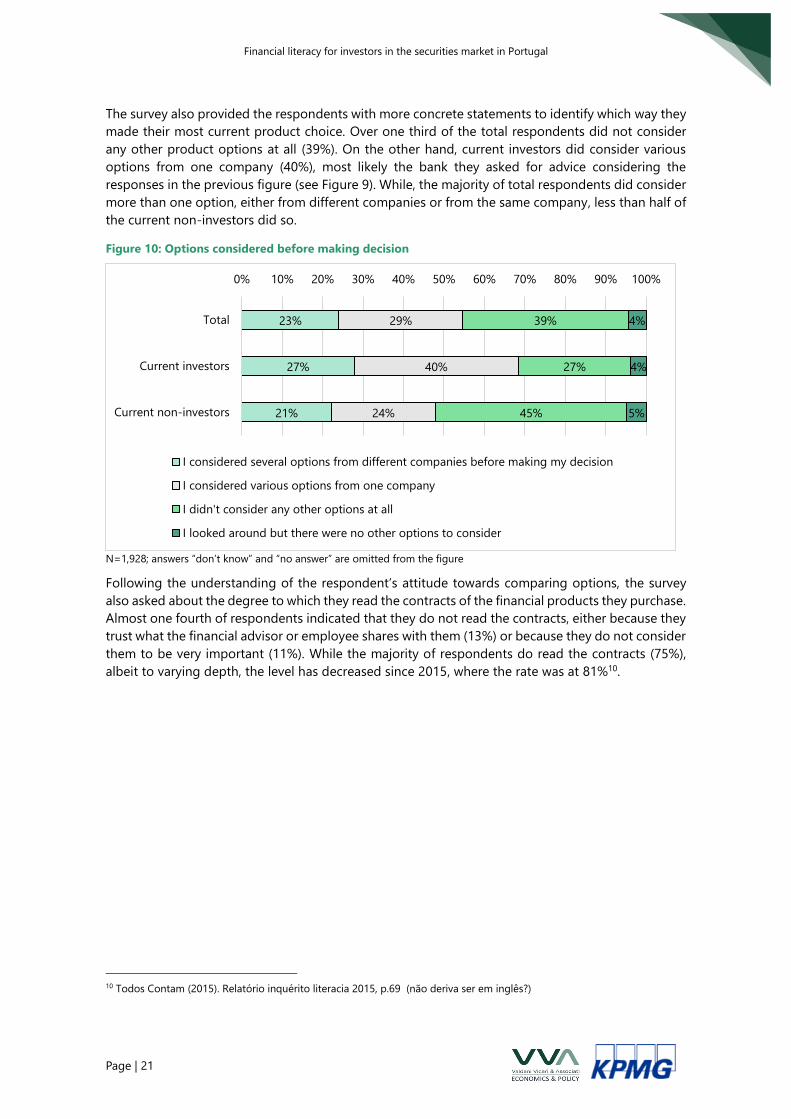
The survey also provided the respondents with more concrete statements to identify which way they
made their most current product choice. Over one third of the total respondents did not consider
any other product options at all (39%). On the other hand, current investors did consider various
options from one company (40%), most likely the bank they asked for advice considering the
responses in the previous figure (see Figure 9). While, the majority of total respondents did consider
more than one option, either from different companies or from the same company, less than half of
the current non-investors did so.
Figure 10: Options considered before making decision
N=1,928; answers “don’t know” and “no answer” are omitted from the figure
Following the understanding of the respondent’s attitude towards comparing options, the survey
also asked about the degree to which they read the contracts of the financial products they purchase.
Almost one fourth of respondents indicated that they do not read the contracts, either because they
trust what the financial advisor or employee shares with them (13%) or because they do not consider
them to be very important (11%). While the majority of respondents do read the contracts (75%),
albeit to varying depth, the level has decreased since 2015, where the rate was at 81%10.
10 Todos Contam (2015). Relatório inquérito literacia 2015, p.69 (não deriva ser em inglês?)
23%
27%
21%
29%
40%
24%
39%
27%
45%
4%
4%
5%
0% 10% 20% 30% 40% 50% 60% 70% 80% 90% 100%
Total
Current investors
Current non-investors
I considered several options from different companies before making my decision
I considered various options from one company
I didn't consider any other options at all
I looked around but there were no other options to consider
Financial literacy for investors in the securities market in Portugal
Page | 22
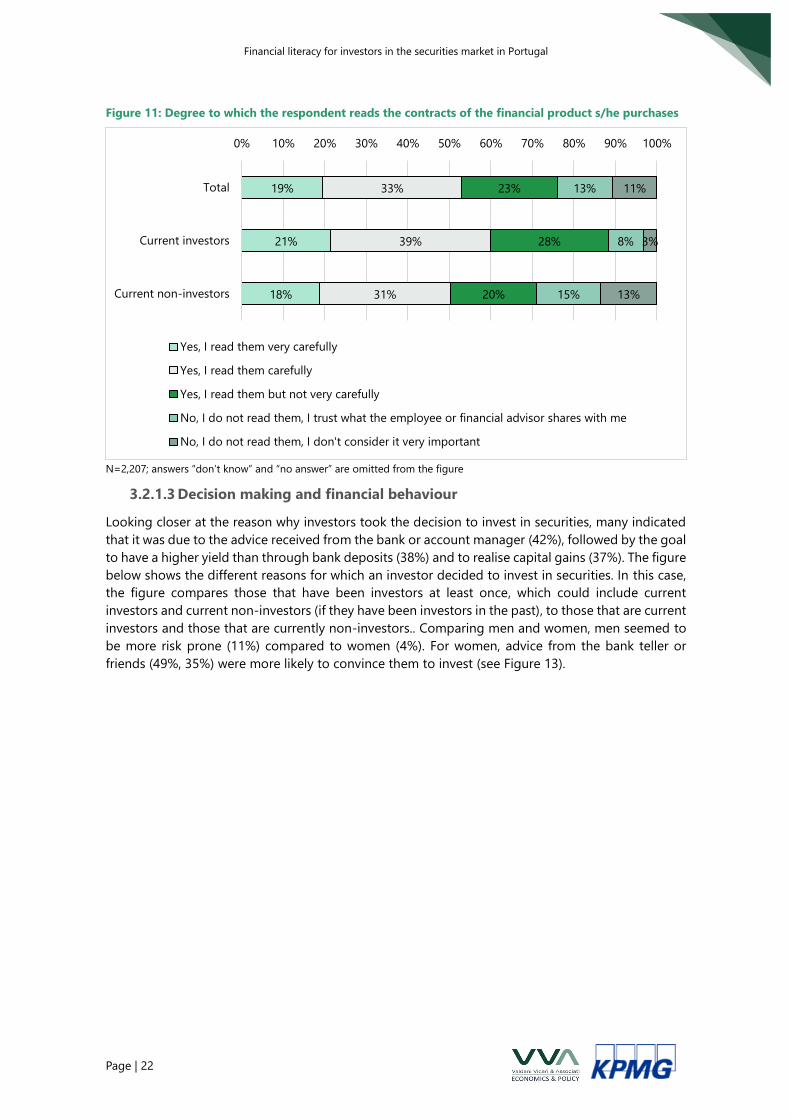
Figure 11: Degree to which the respondent reads the contracts of the financial product s/he purchases
N=2,207; answers “don’t know” and “no answer” are omitted from the figure
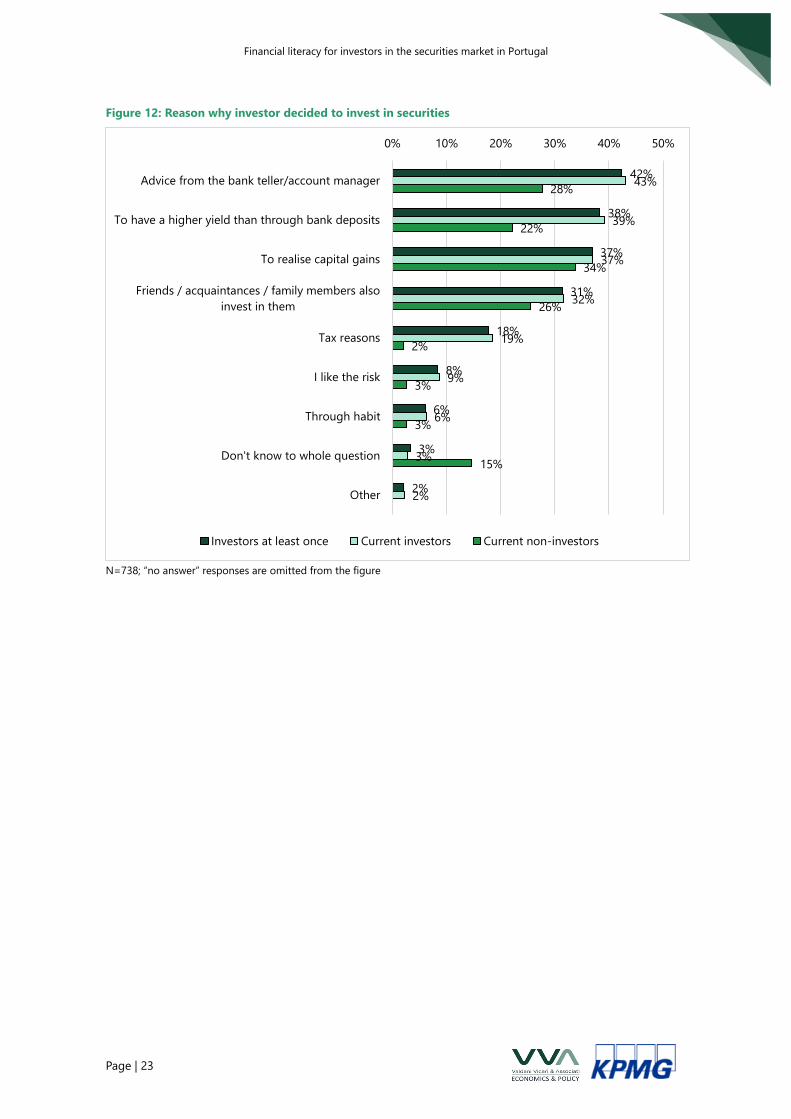
3.2.1.3 Decision making and financial behaviour
Looking closer at the reason why investors took the decision to invest in securities, many indicated
that it was due to the advice received from the bank or account manager (42%), followed by the goal
to have a higher yield than through bank deposits (38%) and to realise capital gains (37%). The figure
below shows the different reasons for which an investor decided to invest in securities. In this case,
the figure compares those that have been investors at least once, which could include current
investors and current non-investors (if they have been investors in the past), to those that are current
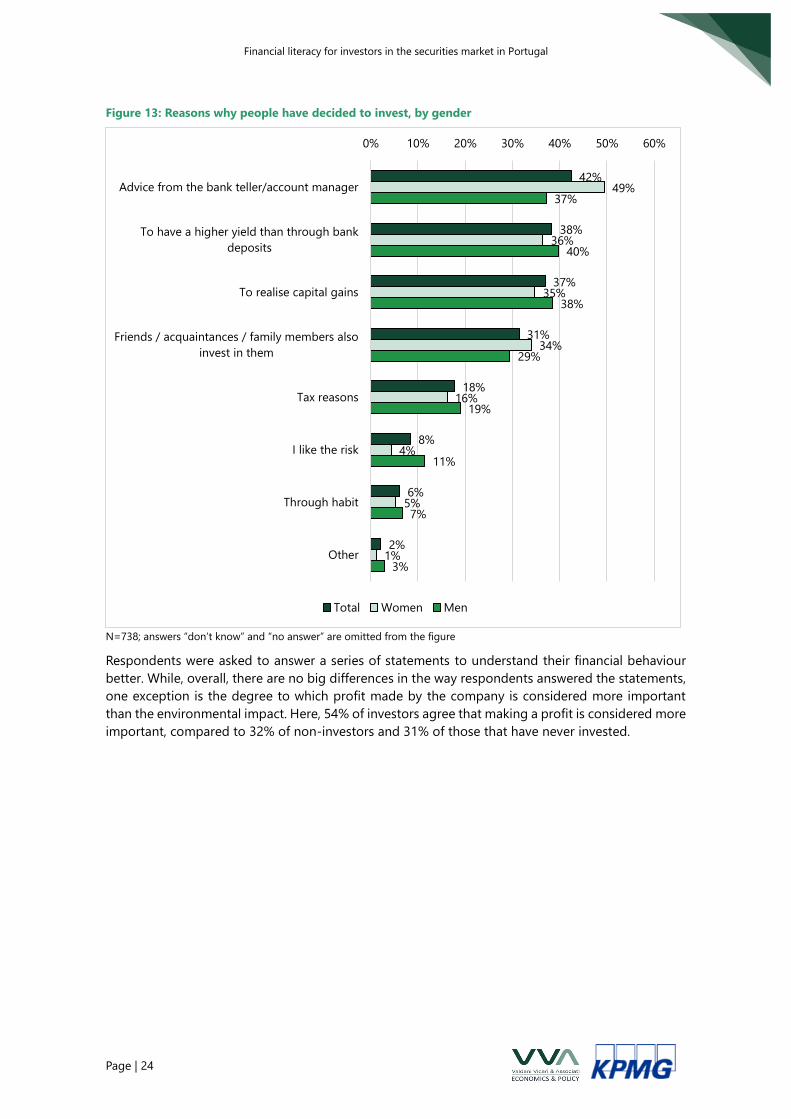
investors and those that are currently non-investors.. Comparing men and women, men seemed to
be more risk prone (11%) compared to women (4%). For women, advice from the bank teller or
friends (49%, 35%) were more likely to convince them to invest (see Figure 13).
19%
21%
18%
33%
39%
31%
23%
28%
20%
13%
8%
15%
11%
3%
13%
0% 10% 20% 30% 40% 50% 60% 70% 80% 90% 100%
Total
Current investors
Current non-investors
Yes, I read them very carefully
Yes, I read them carefully
Yes, I read them but not very carefully
No, I do not read them, I trust what the employee or financial advisor shares with me
No, I do not read them, I don't consider it very important
Financial literacy for investors in the securities market in Portugal
Page | 23
Figure 12: Reason why investor decided to invest in securities
N=738; “no answer” responses are omitted from the figure
42%
38%
37%
31%
18%
8%
6%
3%
2%
43%
39%
37%
32%
19%
9%
6%
3%
2%
28%
22%
34%
26%
2%
3%
3%
15%
0% 10% 20% 30% 40% 50%
Advice from the bank teller/account manager
To have a higher yield than through bank deposits
To realise capital gains
Friends / acquaintances / family members also
invest in them
Tax reasons
I like the risk
Through habit
Don't know to whole question
Other
Investors at least once Current investors Current non-investors
Financial literacy for investors in the securities market in Portugal
Page | 24
Figure 13: Reasons why people have decided to invest, by gender
N=738; answers “don’t know” and “no answer” are omitted from the figure
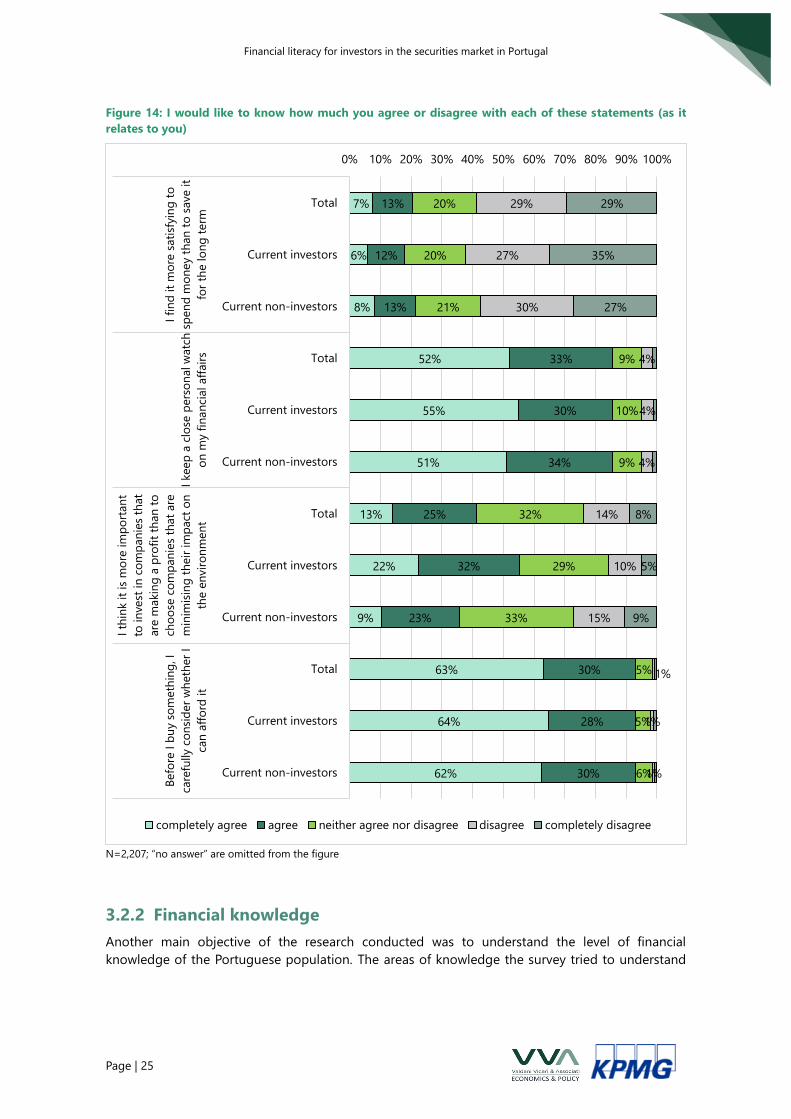
Respondents were asked to answer a series of statements to understand their financial behaviour
better. While, overall, there are no big differences in the way respondents answered the statements,
one exception is the degree to which profit made by the company is considered more important
than the environmental impact. Here, 54% of investors agree that making a profit is considered more
important, compared to 32% of non-investors and 31% of those that have never invested.
42%
38%
37%
31%
18%
8%
6%
2%
49%
36%
35%
34%
16%
4%
5%
1%
37%
40%
38%
29%
19%
11%
7%
3%
0% 10% 20% 30% 40% 50% 60%
Advice from the bank teller/account manager
To have a higher yield than through bank
deposits
To realise capital gains
Friends / acquaintances / family members also
invest in them
Tax reasons
I like the risk
Through habit
Other
Total Women Men
Financial literacy for investors in the securities market in Portugal
Page | 25
Figure 14: I would like to know how much you agree or disagree with each of these statements (as it
relates to you)
N=2,207; “no answer” are omitted from the figure
3.2.2 Financial knowledge
Another main objective of the research conducted was to understand the level of financial
knowledge of the Portuguese population. The areas of knowledge the survey tried to understand
7%
6%
8%
52%
55%
51%
13%
22%
9%
63%
64%
62%
13%
12%
13%
33%
30%
34%
25%
32%
23%
30%
28%
30%
20%
20%
21%
9%
10%
9%
32%
29%
33%
5%
5%
6%
29%
27%
30%
4%
4%
4%
14%
10%
15%
1%
1%
1%
29%
35%
27%
8%
5%
9%
0% 10% 20% 30% 40% 50% 60% 70% 80% 90% 100%
Total
Current investors
Current non-investors
Total
Current investors
Current non-investors
Total
Current investors
Current non-investors
Total
Current investors
Current non-investors
I fi
nd
it
mo
re s
ati
sfyin
g t
o
spen
d m
on
ey t
han
to
save it
for
the lo
ng
term
I keep
a c
lose
pers
on
al w
atc
h
on
my f
inan
cial aff
air
s
I th
ink it
is m
ore
im
po
rtan
t
to in
vest
in
co
mp
an
ies
that
are
makin
g a
pro
fit
than
to
cho
ose
co
mp
an
ies
that
are
min
imis
ing
th
eir
im
pact
on
the e
nvir
on
men
t
Befo
re I b
uy s
om
eth
ing
, I
care
fully c
on
sid
er
wh
eth
er
I
can
aff
ord
it
completely agree agree neither agree nor disagree disagree completely disagree
Financial literacy for investors in the securities market in Portugal
Page | 26
was related to general numerical skills and financial terms (i.e. inflation and interest rate), followed
by knowledge on the securities market and investment.
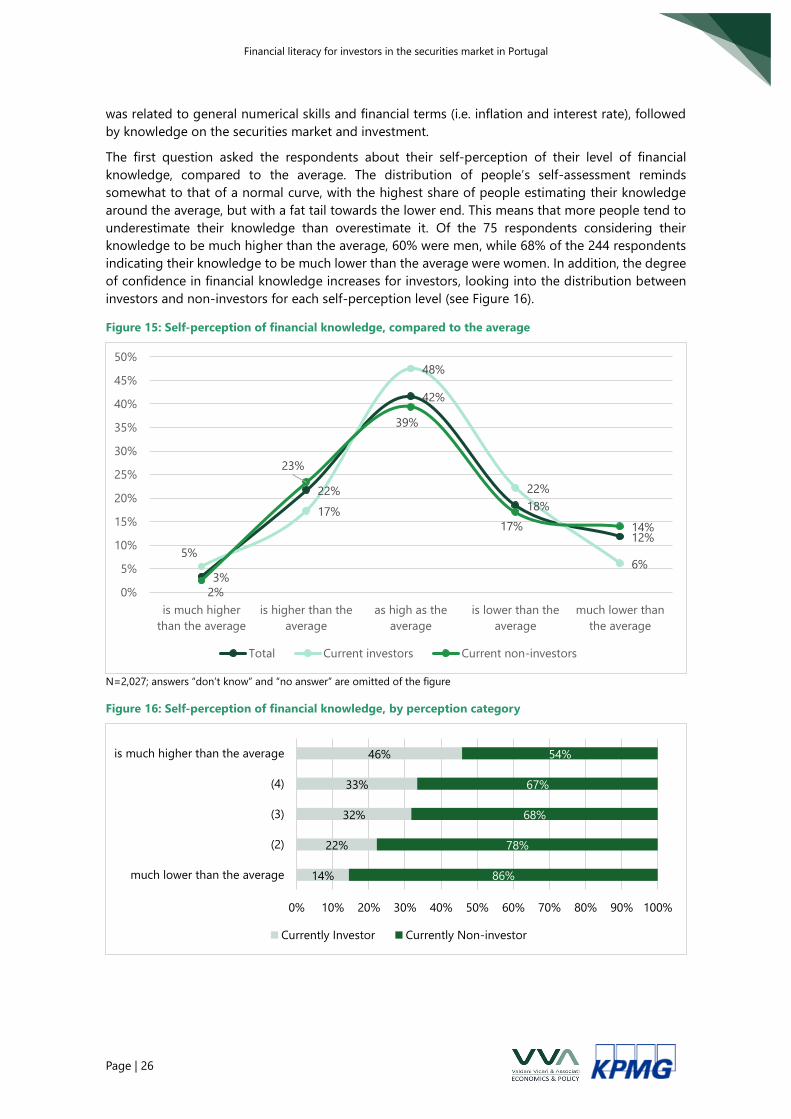
The first question asked the respondents about their self-perception of their level of financial
knowledge, compared to the average. The distribution of people’s self-assessment reminds
somewhat to that of a normal curve, with the highest share of people estimating their knowledge
around the average, but with a fat tail towards the lower end. This means that more people tend to
underestimate their knowledge than overestimate it. Of the 75 respondents considering their
knowledge to be much higher than the average, 60% were men, while 68% of the 244 respondents
indicating their knowledge to be much lower than the average were women. In addition, the degree
of confidence in financial knowledge increases for investors, looking into the distribution between
investors and non-investors for each self-perception level (see Figure 16).
Figure 15: Self-perception of financial knowledge, compared to the average
N=2,027; answers “don’t know” and “no answer” are omitted of the figure
Figure 16: Self-perception of financial knowledge, by perception category
3%
22%
42%
18%
12%
5%
17%
48%
22%
6%
2%
23%
39%
17% 14%
0%
5%
10%
15%
20%
25%
30%
35%
40%
45%
50%
is much higher
than the average
is higher than the
average
as high as the
average
is lower than the
average
much lower than
the average
Total Current investors Current non-investors
14%
22%
32%
33%
46%
86%
78%
68%
67%
54%
0% 10% 20% 30% 40% 50% 60% 70% 80% 90% 100%
much lower than the average
(2)
(3)
(4)
is much higher than the average
Currently Investor Currently Non-investor
Financial literacy for investors in the securities market in Portugal
Page | 27
3.2.2.1 Numerical and basic financial knowledge
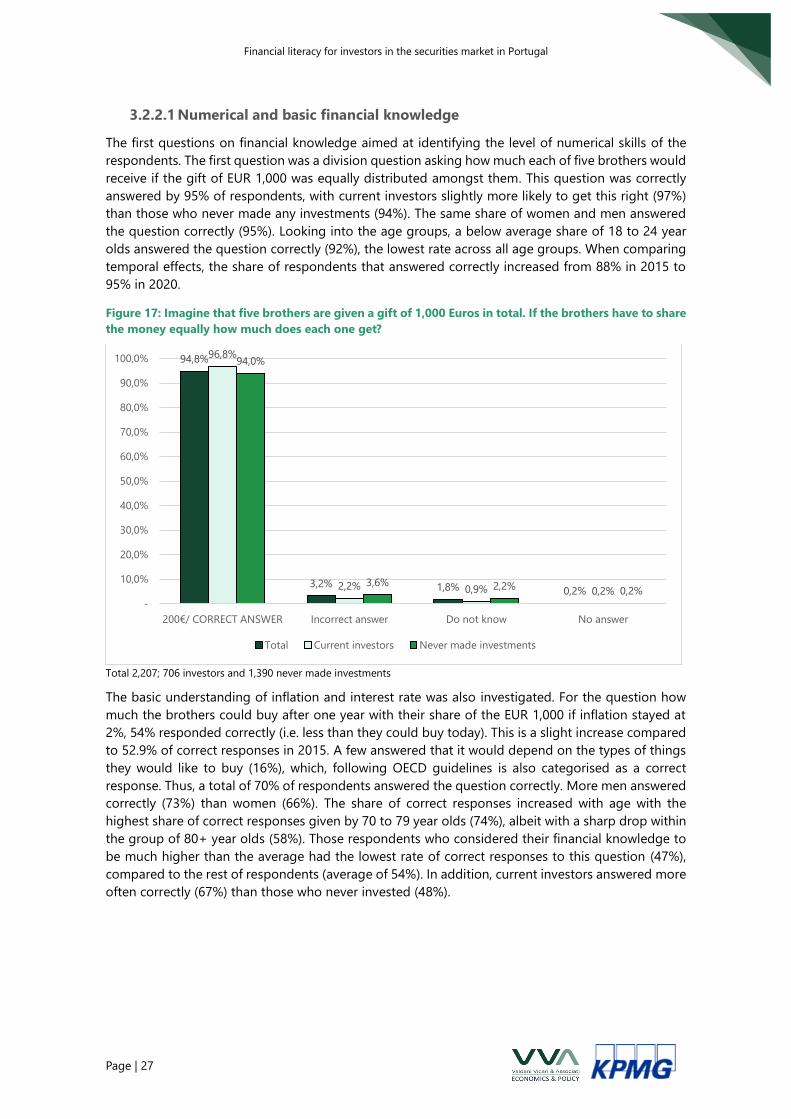
The first questions on financial knowledge aimed at identifying the level of numerical skills of the
respondents. The first question was a division question asking how much each of five brothers would
receive if the gift of EUR 1,000 was equally distributed amongst them. This question was correctly
answered by 95% of respondents, with current investors slightly more likely to get this right (97%)
than those who never made any investments (94%). The same share of women and men answered
the question correctly (95%). Looking into the age groups, a below average share of 18 to 24 year
olds answered the question correctly (92%), the lowest rate across all age groups. When comparing
temporal effects, the share of respondents that answered correctly increased from 88% in 2015 to
95% in 2020.
Figure 17: Imagine that five brothers are given a gift of 1,000 Euros in total. If the brothers have to share
the money equally how much does each one get?
Total 2,207; 706 investors and 1,390 never made investments
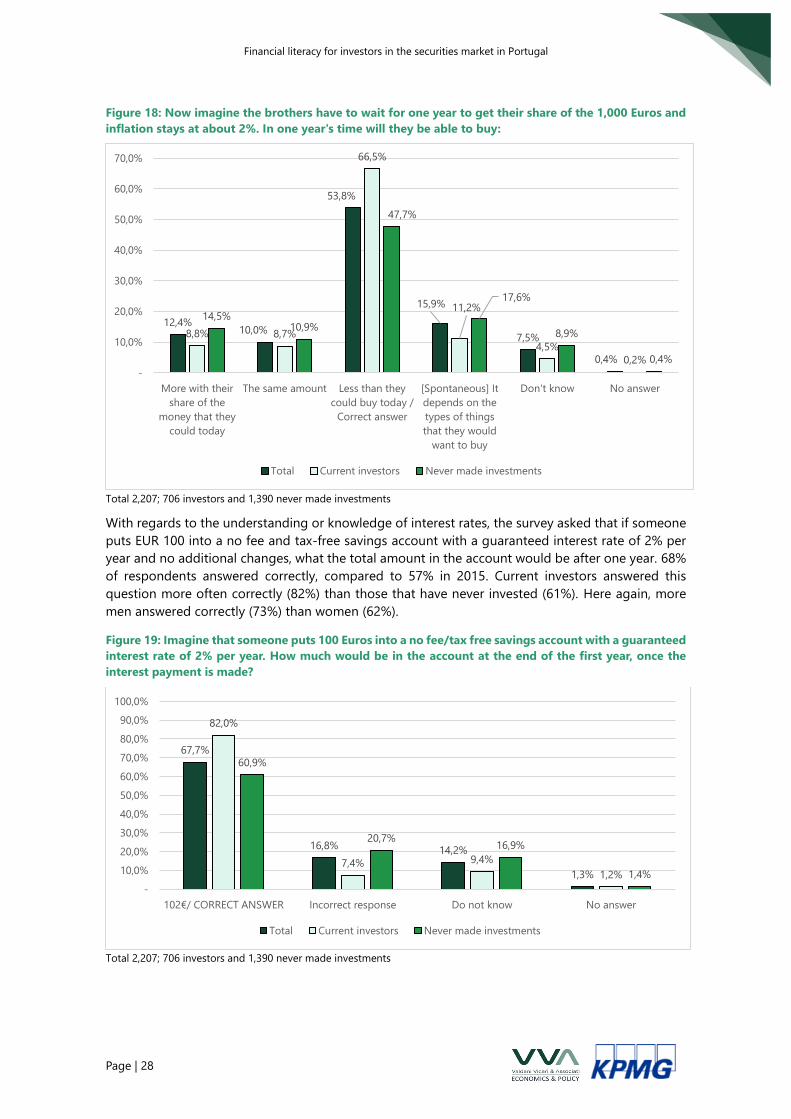
The basic understanding of inflation and interest rate was also investigated. For the question how
much the brothers could buy after one year with their share of the EUR 1,000 if inflation stayed at
2%, 54% responded correctly (i.e. less than they could buy today). This is a slight increase compared
to 52.9% of correct responses in 2015. A few answered that it would depend on the types of things
they would like to buy (16%), which, following OECD guidelines is also categorised as a correct
response. Thus, a total of 70% of respondents answered the question correctly. More men answered
correctly (73%) than women (66%). The share of correct responses increased with age with the
highest share of correct responses given by 70 to 79 year olds (74%), albeit with a sharp drop within
the group of 80+ year olds (58%). Those respondents who considered their financial knowledge to
be much higher than the average had the lowest rate of correct responses to this question (47%),
compared to the rest of respondents (average of 54%). In addition, current investors answered more
often correctly (67%) than those who never invested (48%).
94,8%
3,2% 1,8% 0,2%
96,8%
2,2% 0,9% 0,2%
94,0%
3,6% 2,2% 0,2%
-
10,0%
20,0%
30,0%
40,0%
50,0%
60,0%
70,0%
80,0%
90,0%
100,0%
200€/ CORRECT ANSWER Incorrect answer Do not know No answer
Total Current investors Never made investments
Financial literacy for investors in the securities market in Portugal
Page | 28
Figure 18: Now imagine the brothers have to wait for one year to get their share of the 1,000 Euros and
inflation stays at about 2%. In one year's time will they be able to buy:
Total 2,207; 706 investors and 1,390 never made investments
With regards to the understanding or knowledge of interest rates, the survey asked that if someone
puts EUR 100 into a no fee and tax-free savings account with a guaranteed interest rate of 2% per
year and no additional changes, what the total amount in the account would be after one year. 68%
of respondents answered correctly, compared to 57% in 2015. Current investors answered this
question more often correctly (82%) than those that have never invested (61%). Here again, more
men answered correctly (73%) than women (62%).
Figure 19: Imagine that someone puts 100 Euros into a no fee/tax free savings account with a guaranteed
interest rate of 2% per year. How much would be in the account at the end of the first year, once the
interest payment is made?
Total 2,207; 706 investors and 1,390 never made investments
12,4%10,0%
53,8%
15,9%
7,5%
0,4%
8,8% 8,7%
66,5%
11,2%
4,5%
0,2%
14,5%10,9%
47,7%
17,6%
8,9%
0,4%
-
10,0%
20,0%
30,0%
40,0%
50,0%
60,0%
70,0%
More with their
share of the
money that they
could today
The same amount Less than they
could buy today /
Correct answer
[Spontaneous] It
depends on the
types of things
that they would
want to buy
Don't know No answer
Total Current investors Never made investments
67,7%
16,8% 14,2%
1,3%
82,0%
7,4% 9,4%
1,2%
60,9%
20,7%16,9%
1,4%
-
10,0%
20,0%
30,0%
40,0%
50,0%
60,0%
70,0%
80,0%
90,0%
100,0%
102€/ CORRECT ANSWER Incorrect response Do not know No answer
Total Current investors Never made investments
Financial literacy for investors in the securities market in Portugal
Page | 29
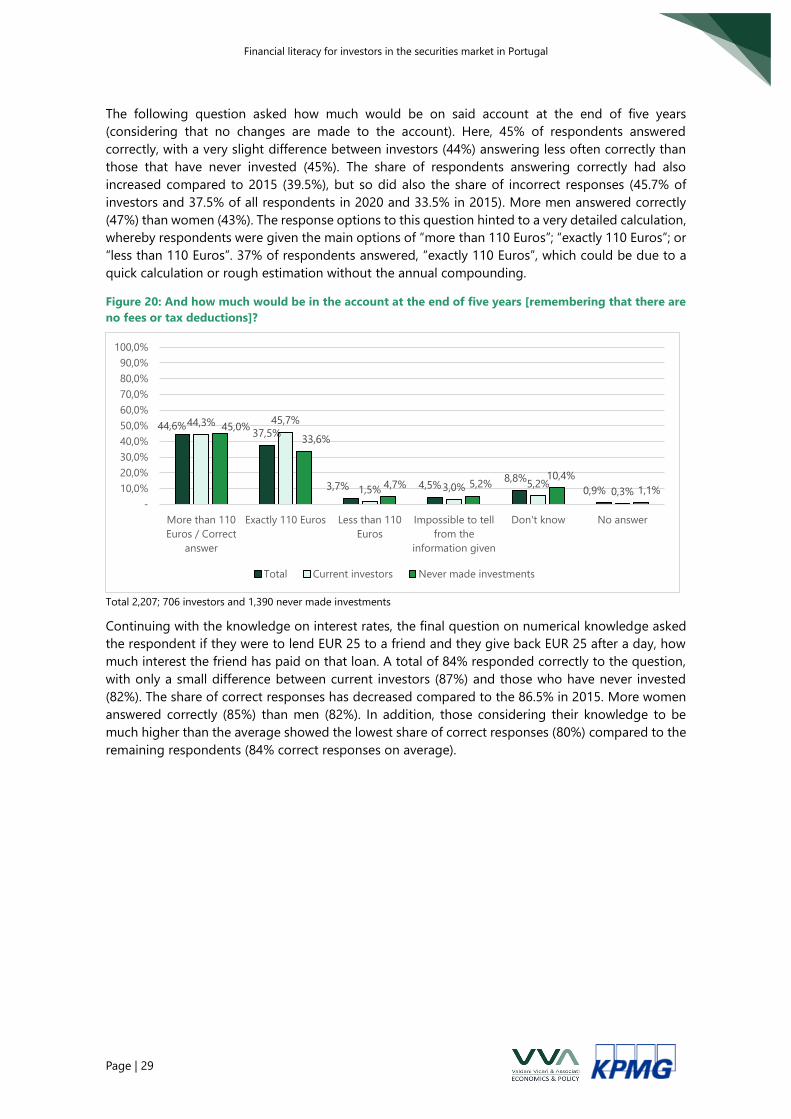
The following question asked how much would be on said account at the end of five years
(considering that no changes are made to the account). Here, 45% of respondents answered
correctly, with a very slight difference between investors (44%) answering less often correctly than
those that have never invested (45%). The share of respondents answering correctly had also
increased compared to 2015 (39.5%), but so did also the share of incorrect responses (45.7% of
investors and 37.5% of all respondents in 2020 and 33.5% in 2015). More men answered correctly
(47%) than women (43%). The response options to this question hinted to a very detailed calculation,
whereby respondents were given the main options of “more than 110 Euros”; “exactly 110 Euros”; or
“less than 110 Euros”. 37% of respondents answered, “exactly 110 Euros”, which could be due to a
quick calculation or rough estimation without the annual compounding.
Figure 20: And how much would be in the account at the end of five years [remembering that there are
no fees or tax deductions]?
Total 2,207; 706 investors and 1,390 never made investments
Continuing with the knowledge on interest rates, the final question on numerical knowledge asked
the respondent if they were to lend EUR 25 to a friend and they give back EUR 25 after a day, how
much interest the friend has paid on that loan. A total of 84% responded correctly to the question,
with only a small difference between current investors (87%) and those who have never invested
(82%). The share of correct responses has decreased compared to the 86.5% in 2015. More women
answered correctly (85%) than men (82%). In addition, those considering their knowledge to be
much higher than the average showed the lowest share of correct responses (80%) compared to the
remaining respondents (84% correct responses on average).
44,6%37,5%
3,7% 4,5%8,8%
0,9%
44,3% 45,7%
1,5% 3,0% 5,2%0,3%
45,0%
33,6%
4,7% 5,2%10,4%
1,1%
-
10,0%
20,0%
30,0%
40,0%
50,0%
60,0%
70,0%
80,0%
90,0%
100,0%
More than 110
Euros / Correct
answer
Exactly 110 Euros Less than 110
Euros
Impossible to tell
from the
information given
Don't know No answer
Total Current investors Never made investments
Financial literacy for investors in the securities market in Portugal
Page | 30
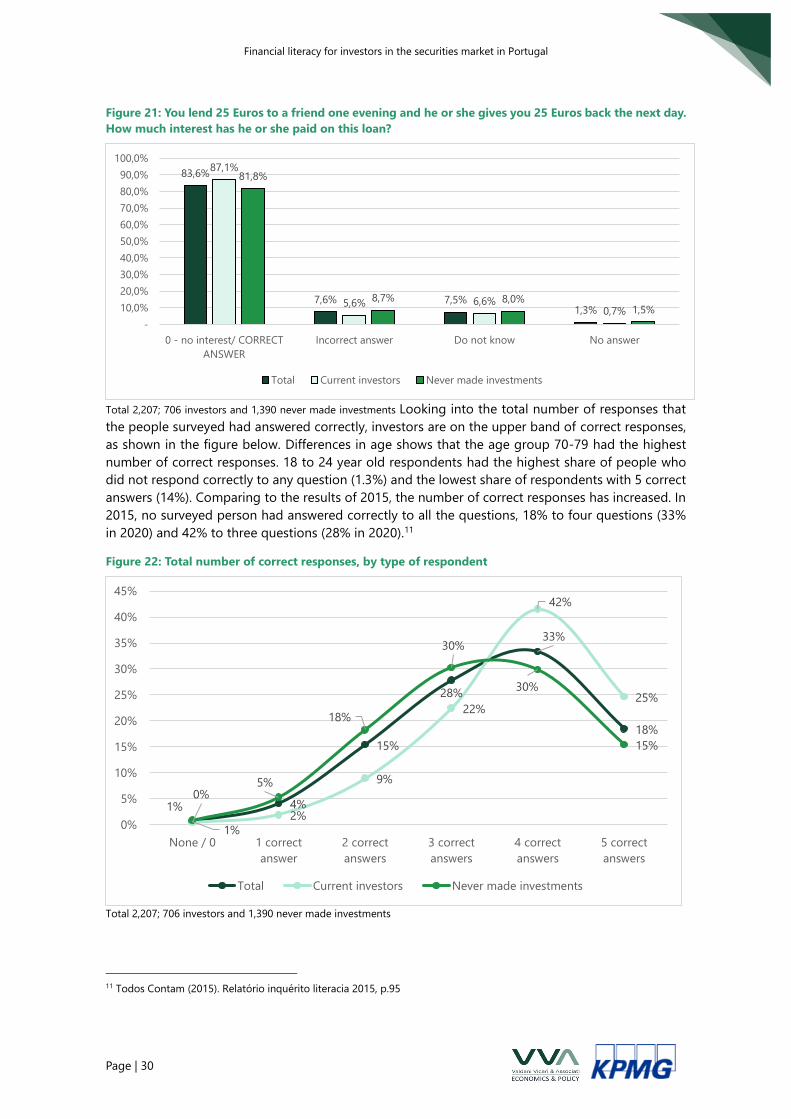
Figure 21: You lend 25 Euros to a friend one evening and he or she gives you 25 Euros back the next day.
How much interest has he or she paid on this loan?
Total 2,207; 706 investors and 1,390 never made investments Looking into the total number of responses that
the people surveyed had answered correctly, investors are on the upper band of correct responses,
as shown in the figure below. Differences in age shows that the age group 70-79 had the highest
number of correct responses. 18 to 24 year old respondents had the highest share of people who
did not respond correctly to any question (1.3%) and the lowest share of respondents with 5 correct
answers (14%). Comparing to the results of 2015, the number of correct responses has increased. In
2015, no surveyed person had answered correctly to all the questions, 18% to four questions (33%
in 2020) and 42% to three questions (28% in 2020).11
Figure 22: Total number of correct responses, by type of respondent
Total 2,207; 706 investors and 1,390 never made investments
11 Todos Contam (2015). Relatório inquérito literacia 2015, p.95
83,6%
7,6% 7,5%1,3%
87,1%
5,6% 6,6%0,7%
81,8%
8,7% 8,0%1,5%
-
10,0%
20,0%
30,0%
40,0%
50,0%
60,0%
70,0%
80,0%
90,0%
100,0%
0 - no interest/ CORRECT
ANSWER
Incorrect answer Do not know No answer
Total Current investors Never made investments
1%
4%
15%
28%
33%
18%
0%
2%
9%
22%
42%
25%
1%
5%
18%
30%
30%
15%
0%
5%
10%
15%
20%
25%
30%
35%
40%
45%
None / 0 1 correct
answer
2 correct
answers
3 correct
answers
4 correct
answers
5 correct
answers
Total Current investors Never made investments
Financial literacy for investors in the securities market in Portugal
Page | 31
3.2.2.2 Knowledge on investing
Next to overall numerical and basic financial knowledge, specific questions related to investment
have been asked as well.
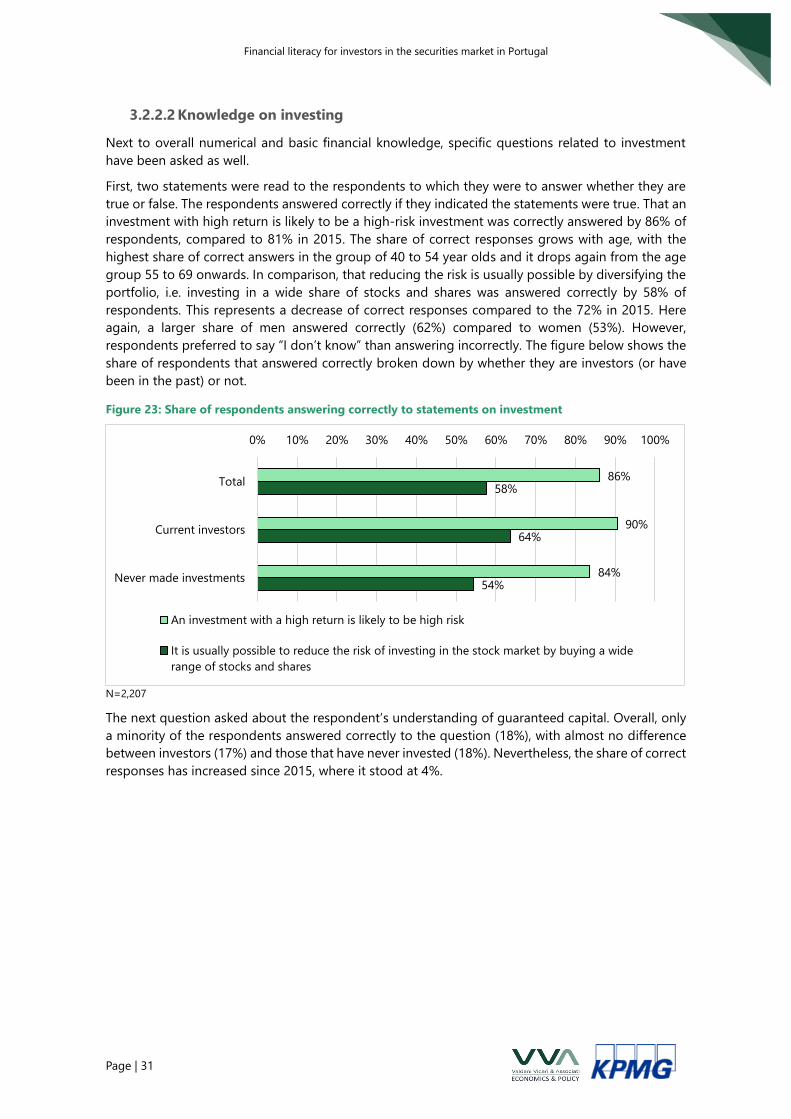
First, two statements were read to the respondents to which they were to answer whether they are
true or false. The respondents answered correctly if they indicated the statements were true. That an
investment with high return is likely to be a high-risk investment was correctly answered by 86% of
respondents, compared to 81% in 2015. The share of correct responses grows with age, with the
highest share of correct answers in the group of 40 to 54 year olds and it drops again from the age
group 55 to 69 onwards. In comparison, that reducing the risk is usually possible by diversifying the
portfolio, i.e. investing in a wide share of stocks and shares was answered correctly by 58% of
respondents. This represents a decrease of correct responses compared to the 72% in 2015. Here
again, a larger share of men answered correctly (62%) compared to women (53%). However,
respondents preferred to say “I don’t know” than answering incorrectly. The figure below shows the
share of respondents that answered correctly broken down by whether they are investors (or have
been in the past) or not.
Figure 23: Share of respondents answering correctly to statements on investment
N=2,207
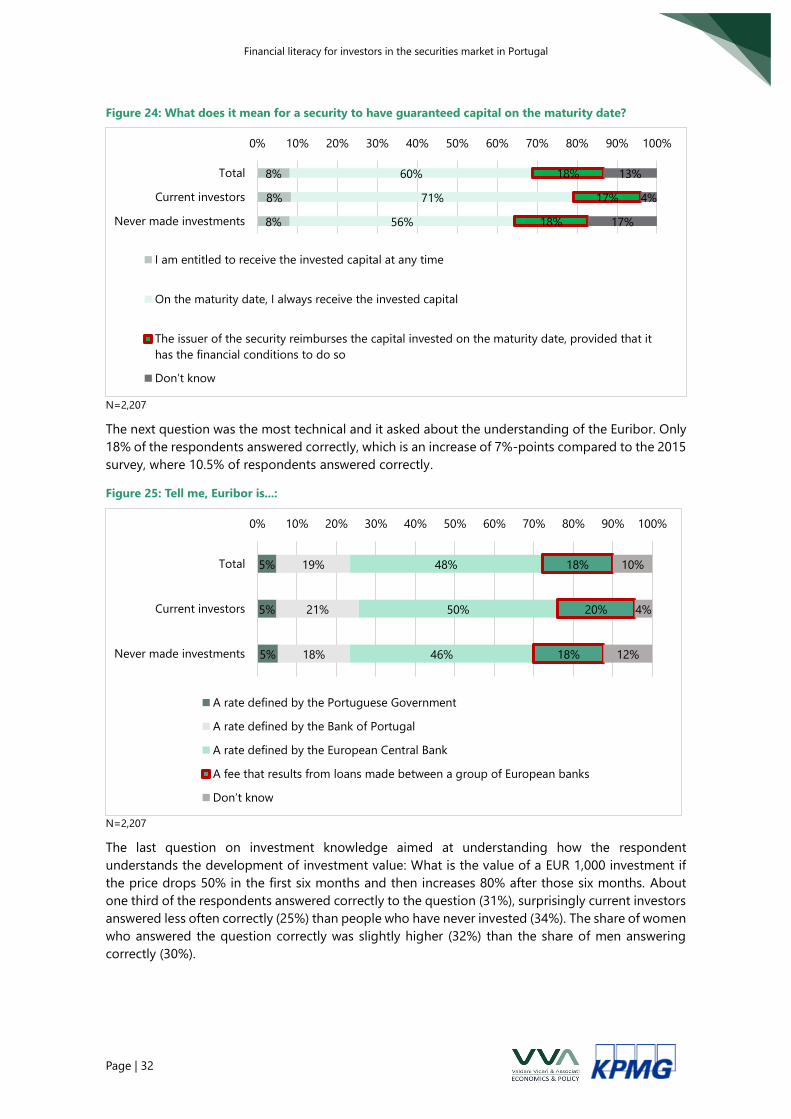
The next question asked about the respondent’s understanding of guaranteed capital. Overall, only
a minority of the respondents answered correctly to the question (18%), with almost no difference
between investors (17%) and those that have never invested (18%). Nevertheless, the share of correct
responses has increased since 2015, where it stood at 4%.
86%
90%
84%
58%
64%
54%
0% 10% 20% 30% 40% 50% 60% 70% 80% 90% 100%
Total
Current investors
Never made investments
An investment with a high return is likely to be high risk
It is usually possible to reduce the risk of investing in the stock market by buying a wide
range of stocks and shares
Financial literacy for investors in the securities market in Portugal
Page | 32
Figure 24: What does it mean for a security to have guaranteed capital on the maturity date?
N=2,207
The next question was the most technical and it asked about the understanding of the Euribor. Only
18% of the respondents answered correctly, which is an increase of 7%-points compared to the 2015
survey, where 10.5% of respondents answered correctly.
Figure 25: Tell me, Euribor is...:
N=2,207
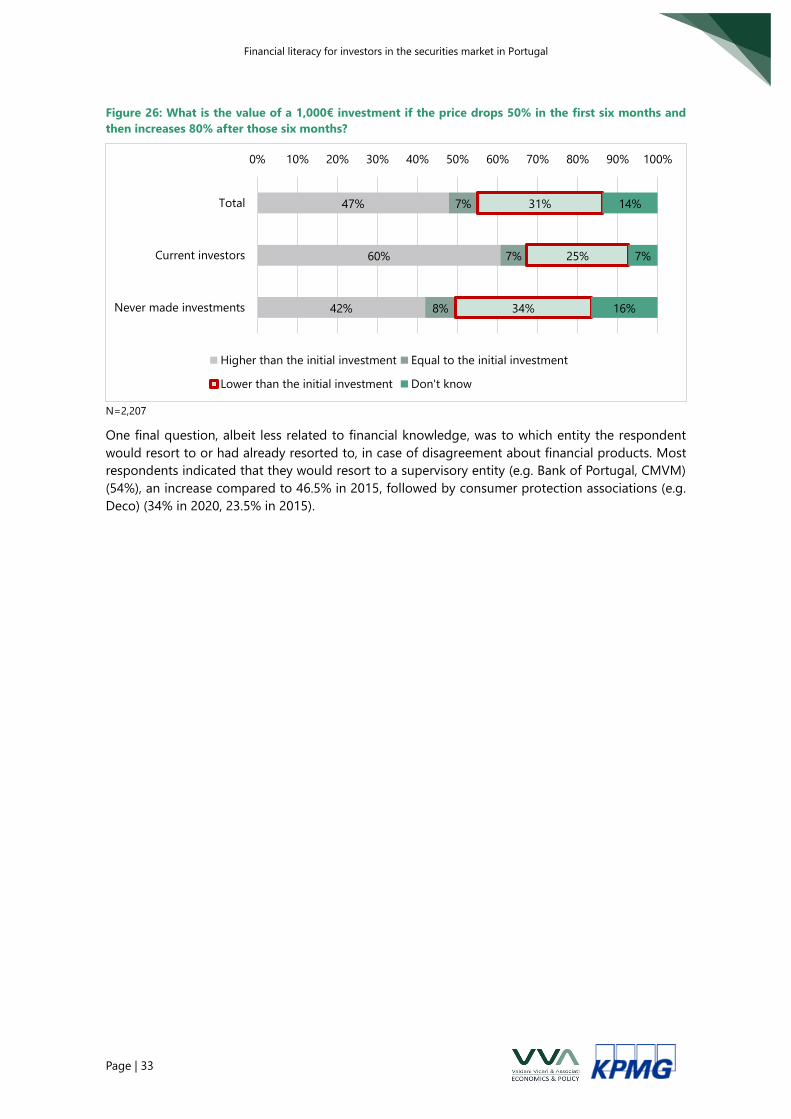
The last question on investment knowledge aimed at understanding how the respondent
understands the development of investment value: What is the value of a EUR 1,000 investment if
the price drops 50% in the first six months and then increases 80% after those six months. About
one third of the respondents answered correctly to the question (31%), surprisingly current investors
answered less often correctly (25%) than people who have never invested (34%). The share of women
who answered the question correctly was slightly higher (32%) than the share of men answering
correctly (30%).
8%
8%
8%
60%
71%
56%
18%
17%
18%
13%
4%
17%
0% 10% 20% 30% 40% 50% 60% 70% 80% 90% 100%
Total
Current investors
Never made investments
I am entitled to receive the invested capital at any time
On the maturity date, I always receive the invested capital
The issuer of the security reimburses the capital invested on the maturity date, provided that it
has the financial conditions to do so
Don’t know
5%
5%
5%
19%
21%
18%
48%
50%
46%
18%
20%
18%
10%
4%
12%
0% 10% 20% 30% 40% 50% 60% 70% 80% 90% 100%
Total
Current investors
Never made investments
A rate defined by the Portuguese Government
A rate defined by the Bank of Portugal
A rate defined by the European Central Bank
A fee that results from loans made between a group of European banks
Don’t know
Financial literacy for investors in the securities market in Portugal
Page | 33
Figure 26: What is the value of a 1,000€ investment if the price drops 50% in the first six months and
then increases 80% after those six months?
N=2,207
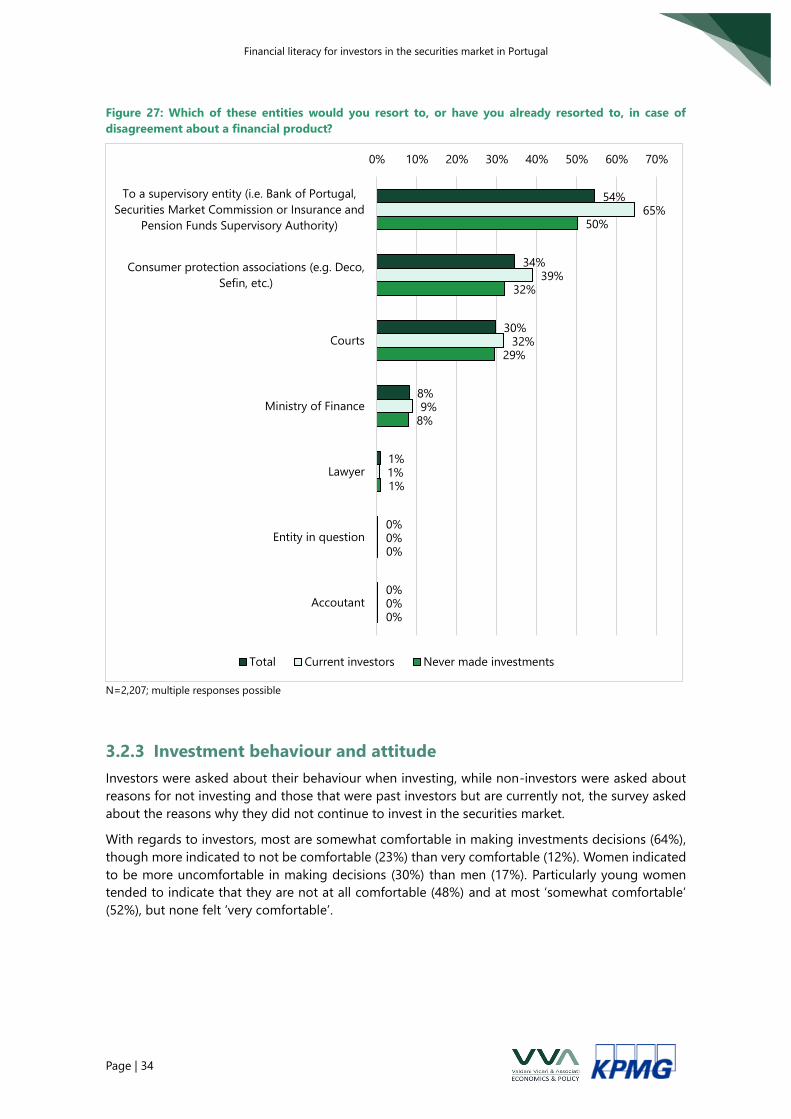
One final question, albeit less related to financial knowledge, was to which entity the respondent
would resort to or had already resorted to, in case of disagreement about financial products. Most
respondents indicated that they would resort to a supervisory entity (e.g. Bank of Portugal, CMVM)
(54%), an increase compared to 46.5% in 2015, followed by consumer protection associations (e.g.
Deco) (34% in 2020, 23.5% in 2015).
47%
60%
42%
7%
7%
8%
31%
25%
34%
14%
7%
16%
0% 10% 20% 30% 40% 50% 60% 70% 80% 90% 100%
Total
Current investors
Never made investments
Higher than the initial investment Equal to the initial investment
Lower than the initial investment Don't know
Financial literacy for investors in the securities market in Portugal
Page | 34
Figure 27: Which of these entities would you resort to, or have you already resorted to, in case of
disagreement about a financial product?
N=2,207; multiple responses possible
3.2.3 Investment behaviour and attitude
Investors were asked about their behaviour when investing, while non-investors were asked about
reasons for not investing and those that were past investors but are currently not, the survey asked
about the reasons why they did not continue to invest in the securities market.
With regards to investors, most are somewhat comfortable in making investments decisions (64%),
though more indicated to not be comfortable (23%) than very comfortable (12%). Women indicated
to be more uncomfortable in making decisions (30%) than men (17%). Particularly young women
tended to indicate that they are not at all comfortable (48%) and at most ‘somewhat comfortable’
(52%), but none felt ‘very comfortable’.
54%
34%
30%
8%
1%
0%
0%
65%
39%
32%
9%
1%
0%
0%
50%
32%
29%
8%
1%
0%
0%
0% 10% 20% 30% 40% 50% 60% 70%
To a supervisory entity (i.e. Bank of Portugal,
Securities Market Commission or Insurance and
Pension Funds Supervisory Authority)
Consumer protection associations (e.g. Deco,
Sefin, etc.)
Courts
Ministry of Finance
Lawyer
Entity in question
Accoutant
Total Current investors Never made investments
Financial literacy for investors in the securities market in Portugal
Page | 35
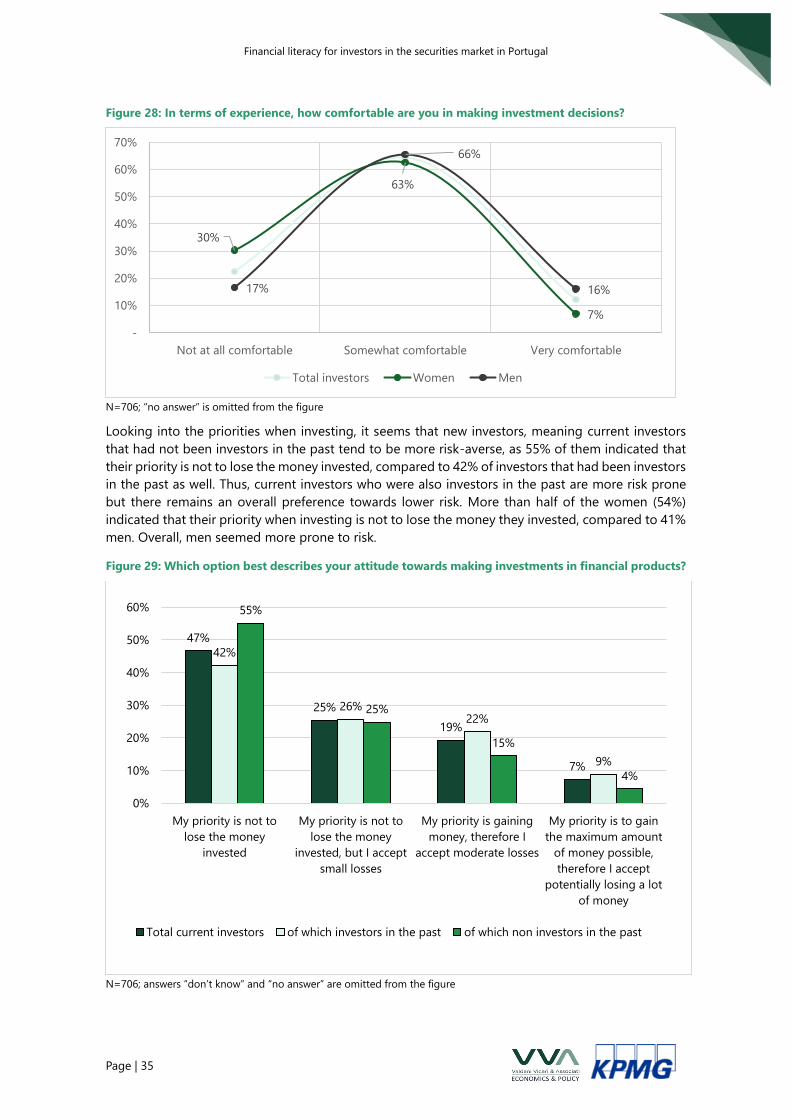
Figure 28: In terms of experience, how comfortable are you in making investment decisions?
N=706; “no answer” is omitted from the figure
Looking into the priorities when investing, it seems that new investors, meaning current investors
that had not been investors in the past tend to be more risk-averse, as 55% of them indicated that
their priority is not to lose the money invested, compared to 42% of investors that had been investors
in the past as well. Thus, current investors who were also investors in the past are more risk prone
but there remains an overall preference towards lower risk. More than half of the women (54%)
indicated that their priority when investing is not to lose the money they invested, compared to 41%
men. Overall, men seemed more prone to risk.
Figure 29: Which option best describes your attitude towards making investments in financial products?
N=706; answers “don’t know” and “no answer” are omitted from the figure
30%
63%
7%
17%
66%
16%
-
10%
20%
30%
40%
50%
60%
70%
Not at all comfortable Somewhat comfortable Very comfortable
Total investors Women Men
47%
25%
19%
7%
42%
26%22%
9%
55%
25%
15%
4%
0%
10%
20%
30%
40%
50%
60%
My priority is not to
lose the money
invested
My priority is not to
lose the money
invested, but I accept
small losses
My priority is gaining
money, therefore I
accept moderate losses
My priority is to gain
the maximum amount
of money possible,
therefore I accept
potentially losing a lot
of money
Total current investors of which investors in the past of which non investors in the past
Financial literacy for investors in the securities market in Portugal
Page | 36
N=706; “don’t know” and “no answer” are omitted from the figure
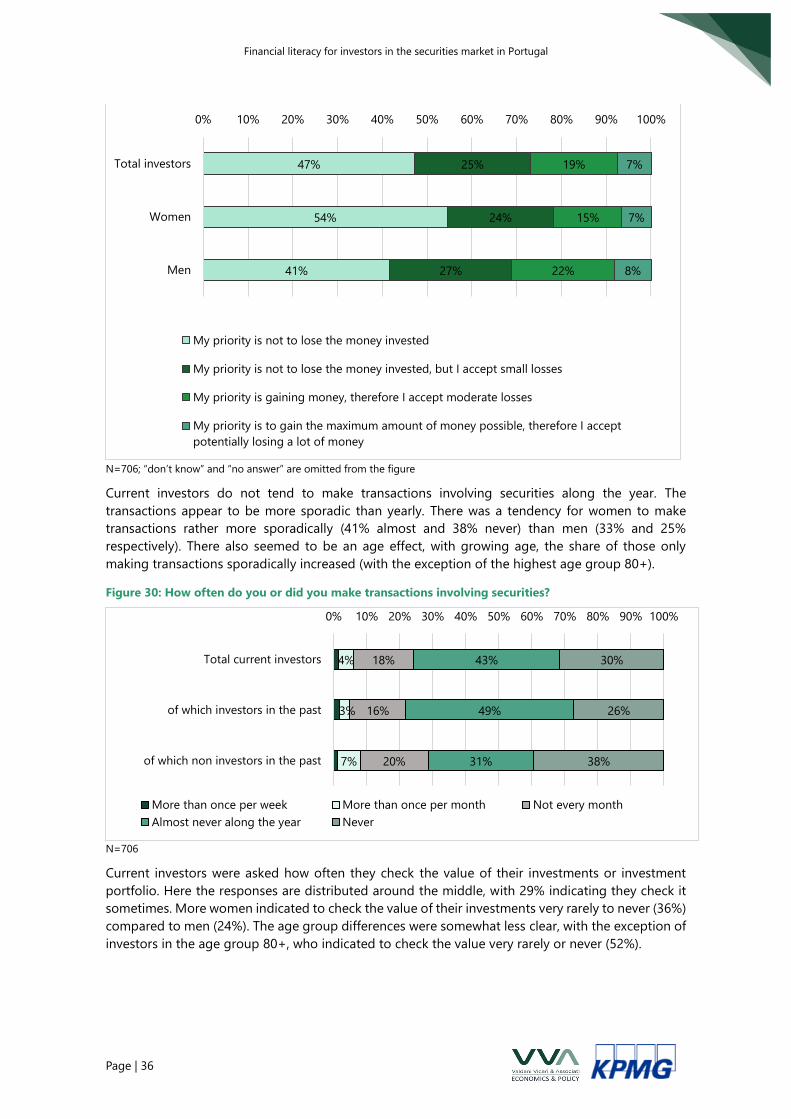
Current investors do not tend to make transactions involving securities along the year. The
transactions appear to be more sporadic than yearly. There was a tendency for women to make
transactions rather more sporadically (41% almost and 38% never) than men (33% and 25%
respectively). There also seemed to be an age effect, with growing age, the share of those only
making transactions sporadically increased (with the exception of the highest age group 80+).
Figure 30: How often do you or did you make transactions involving securities?
N=706
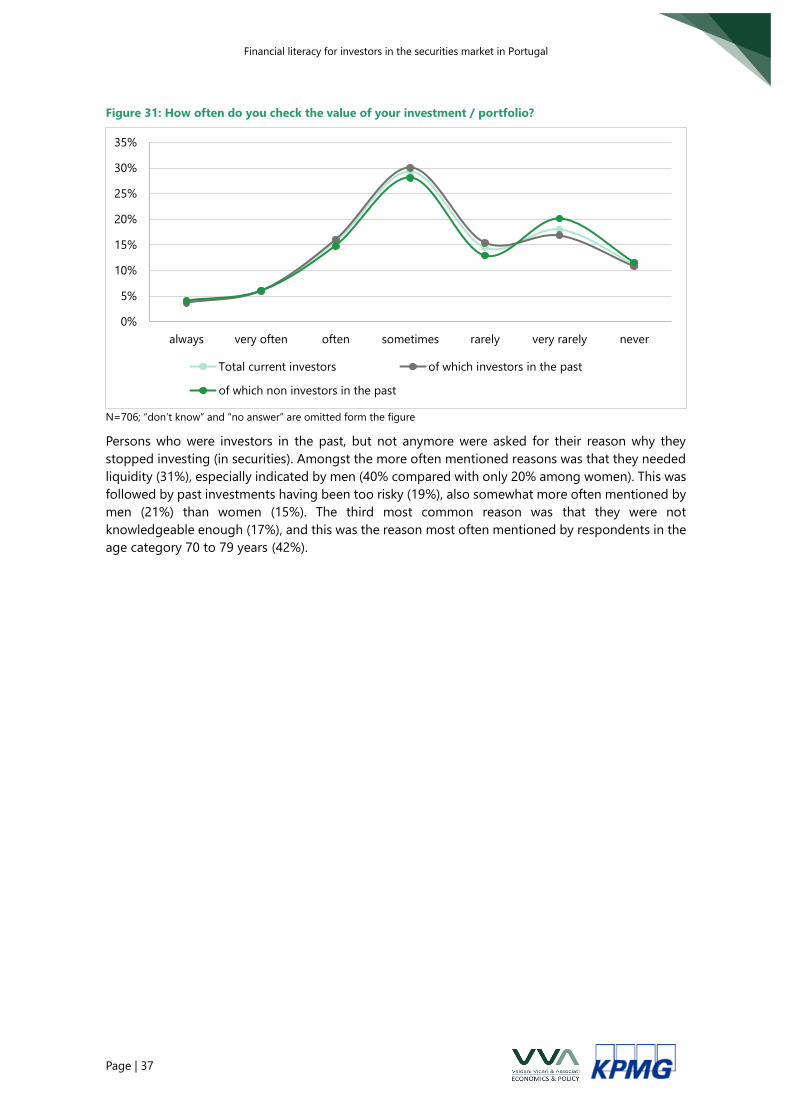
Current investors were asked how often they check the value of their investments or investment
portfolio. Here the responses are distributed around the middle, with 29% indicating they check it
sometimes. More women indicated to check the value of their investments very rarely to never (36%)
compared to men (24%). The age group differences were somewhat less clear, with the exception of
investors in the age group 80+, who indicated to check the value very rarely or never (52%).
47%
54%
41%
25%
24%
27%
19%
15%
22%
7%
7%
8%
0% 10% 20% 30% 40% 50% 60% 70% 80% 90% 100%
Total investors
Women
Men
My priority is not to lose the money invested
My priority is not to lose the money invested, but I accept small losses
My priority is gaining money, therefore I accept moderate losses
My priority is to gain the maximum amount of money possible, therefore I accept
potentially losing a lot of money
4%
3%
7%
18%
16%
20%
43%
49%
31%
30%
26%
38%
0% 10% 20% 30% 40% 50% 60% 70% 80% 90% 100%
Total current investors
of which investors in the past
of which non investors in the past
More than once per week More than once per month Not every month
Almost never along the year Never
Financial literacy for investors in the securities market in Portugal
Page | 37
Figure 31: How often do you check the value of your investment / portfolio?
N=706; “don’t know” and “no answer” are omitted form the figure
Persons who were investors in the past, but not anymore were asked for their reason why they
stopped investing (in securities). Amongst the more often mentioned reasons was that they needed
liquidity (31%), especially indicated by men (40% compared with only 20% among women). This was
followed by past investments having been too risky (19%), also somewhat more often mentioned by
men (21%) than women (15%). The third most common reason was that they were not
knowledgeable enough (17%), and this was the reason most often mentioned by respondents in the
age category 70 to 79 years (42%).
0%
5%
10%
15%
20%
25%
30%
35%
always very often often sometimes rarely very rarely never
Total current investors of which investors in the past
of which non investors in the past
Financial literacy for investors in the securities market in Portugal
Page | 38
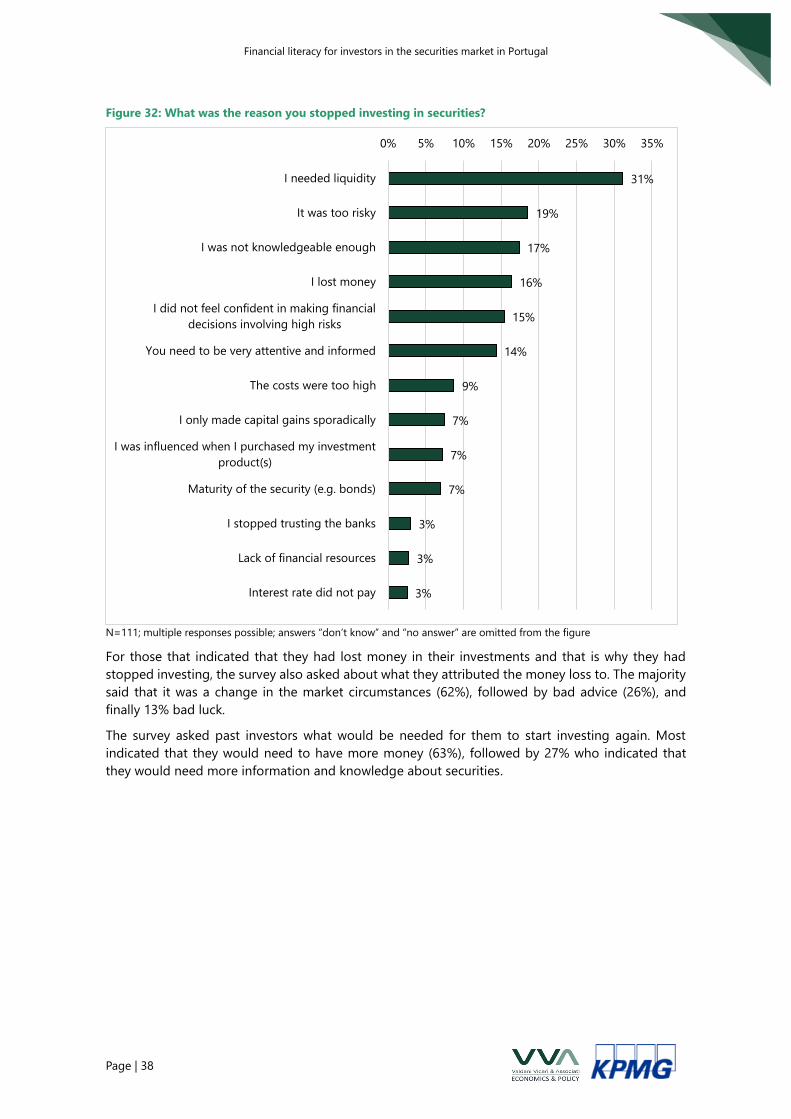
Figure 32: What was the reason you stopped investing in securities?
N=111; multiple responses possible; answers “don’t know” and “no answer” are omitted from the figure
For those that indicated that they had lost money in their investments and that is why they had
stopped investing, the survey also asked about what they attributed the money loss to. The majority
said that it was a change in the market circumstances (62%), followed by bad advice (26%), and
finally 13% bad luck.
The survey asked past investors what would be needed for them to start investing again. Most
indicated that they would need to have more money (63%), followed by 27% who indicated that
they would need more information and knowledge about securities.
31%
19%
17%
16%
15%
14%
9%
7%
7%
7%
3%
3%
3%
0% 5% 10% 15% 20% 25% 30% 35%
I needed liquidity
It was too risky
I was not knowledgeable enough
I lost money
I did not feel confident in making financial
decisions involving high risks
You need to be very attentive and informed
The costs were too high
I only made capital gains sporadically
I was influenced when I purchased my investment
product(s)
Maturity of the security (e.g. bonds)
I stopped trusting the banks
Lack of financial resources
Interest rate did not pay
Financial literacy for investors in the securities market in Portugal
Page | 39
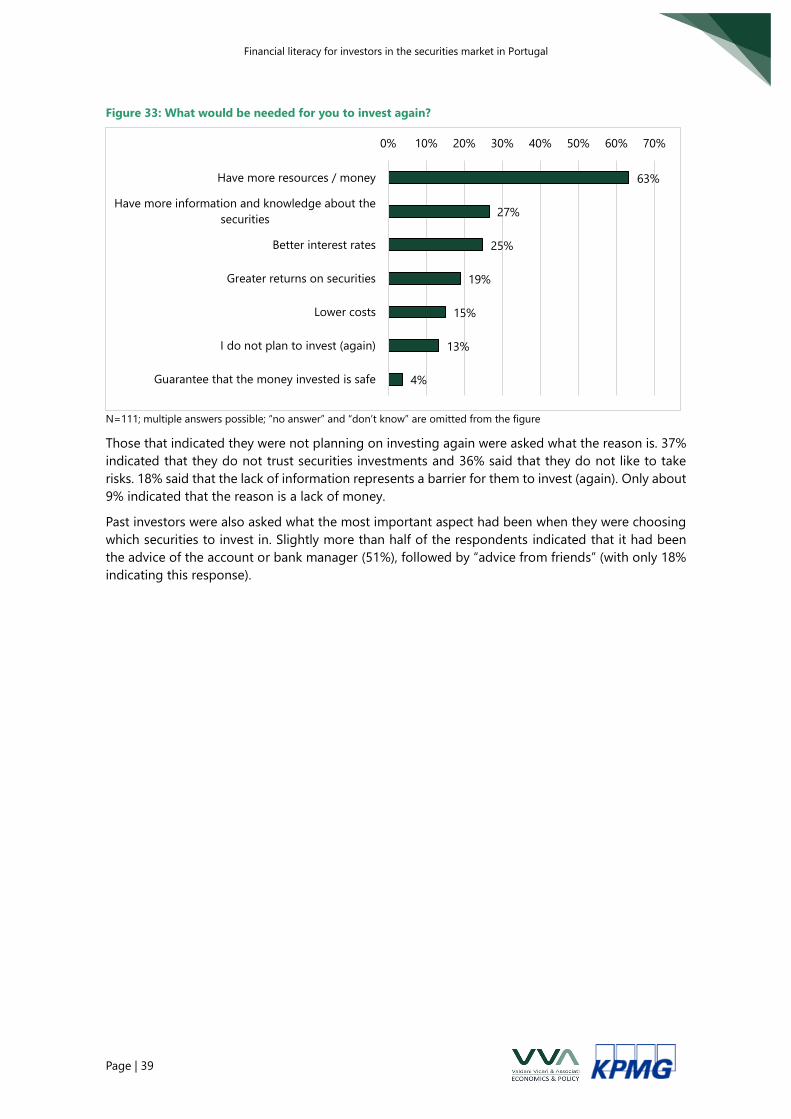
Figure 33: What would be needed for you to invest again?
N=111; multiple answers possible; “no answer” and “don’t know” are omitted from the figure
Those that indicated they were not planning on investing again were asked what the reason is. 37%
indicated that they do not trust securities investments and 36% said that they do not like to take
risks. 18% said that the lack of information represents a barrier for them to invest (again). Only about
9% indicated that the reason is a lack of money.
Past investors were also asked what the most important aspect had been when they were choosing
which securities to invest in. Slightly more than half of the respondents indicated that it had been
the advice of the account or bank manager (51%), followed by “advice from friends” (with only 18%
indicating this response).
63%
27%
25%
19%
15%
13%
4%
0% 10% 20% 30% 40% 50% 60% 70%
Have more resources / money
Have more information and knowledge about the
securities
Better interest rates
Greater returns on securities
Lower costs
I do not plan to invest (again)
Guarantee that the money invested is safe
Financial literacy for investors in the securities market in Portugal
Page | 40
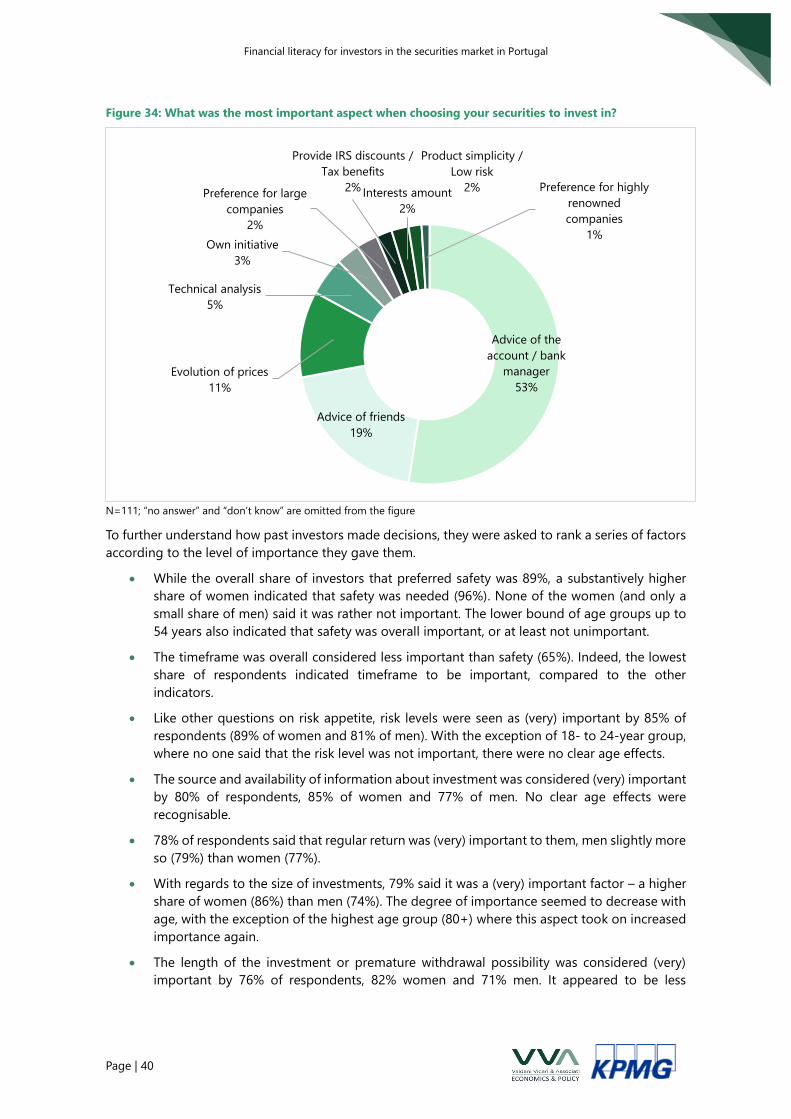
Figure 34: What was the most important aspect when choosing your securities to invest in?
N=111; “no answer” and “don’t know” are omitted from the figure
To further understand how past investors made decisions, they were asked to rank a series of factors
according to the level of importance they gave them.
• While the overall share of investors that preferred safety was 89%, a substantively higher
share of women indicated that safety was needed (96%). None of the women (and only a
small share of men) said it was rather not important. The lower bound of age groups up to
54 years also indicated that safety was overall important, or at least not unimportant.
• The timeframe was overall considered less important than safety (65%). Indeed, the lowest
share of respondents indicated timeframe to be important, compared to the other
indicators.
• Like other questions on risk appetite, risk levels were seen as (very) important by 85% of
respondents (89% of women and 81% of men). With the exception of 18- to 24-year group,
where no one said that the risk level was not important, there were no clear age effects.
• The source and availability of information about investment was considered (very) important
by 80% of respondents, 85% of women and 77% of men. No clear age effects were
recognisable.
• 78% of respondents said that regular return was (very) important to them, men slightly more
so (79%) than women (77%).
• With regards to the size of investments, 79% said it was a (very) important factor – a higher
share of women (86%) than men (74%). The degree of importance seemed to decrease with
age, with the exception of the highest age group (80+) where this aspect took on increased
importance again.
• The length of the investment or premature withdrawal possibility was considered (very)
important by 76% of respondents, 82% women and 71% men. It appeared to be less
Advice of the
account / bank
manager
53%
Advice of friends
19%
Evolution of prices
11%
Technical analysis
5%
Own initiative
3%
Preference for large
companies
2%
Provide IRS discounts /
Tax benefits
2% Interests amount
2%
Product simplicity /
Low risk
2% Preference for highly
renowned
companies
1%
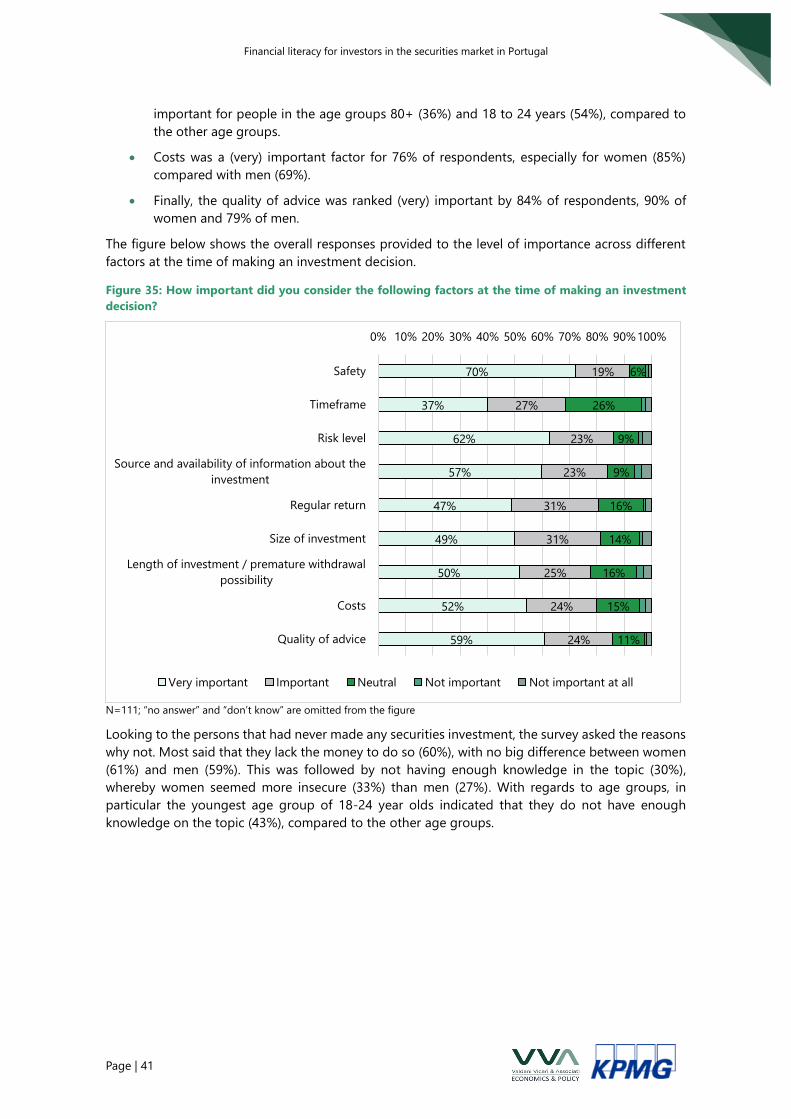
Financial literacy for investors in the securities market in Portugal
Page | 41
important for people in the age groups 80+ (36%) and 18 to 24 years (54%), compared to
the other age groups.
• Costs was a (very) important factor for 76% of respondents, especially for women (85%)
compared with men (69%).
• Finally, the quality of advice was ranked (very) important by 84% of respondents, 90% of
women and 79% of men.
The figure below shows the overall responses provided to the level of importance across different
factors at the time of making an investment decision.
Figure 35: How important did you consider the following factors at the time of making an investment
decision?
N=111; “no answer” and “don’t know” are omitted from the figure
Looking to the persons that had never made any securities investment, the survey asked the reasons
why not. Most said that they lack the money to do so (60%), with no big difference between women
(61%) and men (59%). This was followed by not having enough knowledge in the topic (30%),
whereby women seemed more insecure (33%) than men (27%). With regards to age groups, in
particular the youngest age group of 18-24 year olds indicated that they do not have enough
knowledge on the topic (43%), compared to the other age groups.
70%
37%
62%
57%
47%
49%
50%
52%
59%
19%
27%
23%
23%
31%
31%
25%
24%
24%
6%
26%
9%
9%
16%
14%
16%
15%
11%
0% 10% 20% 30% 40% 50% 60% 70% 80% 90%100%
Safety
Timeframe
Risk level
Source and availability of information about the
investment
Regular return
Size of investment
Length of investment / premature withdrawal
possibility
Costs
Quality of advice
Very important Important Neutral Not important Not important at all
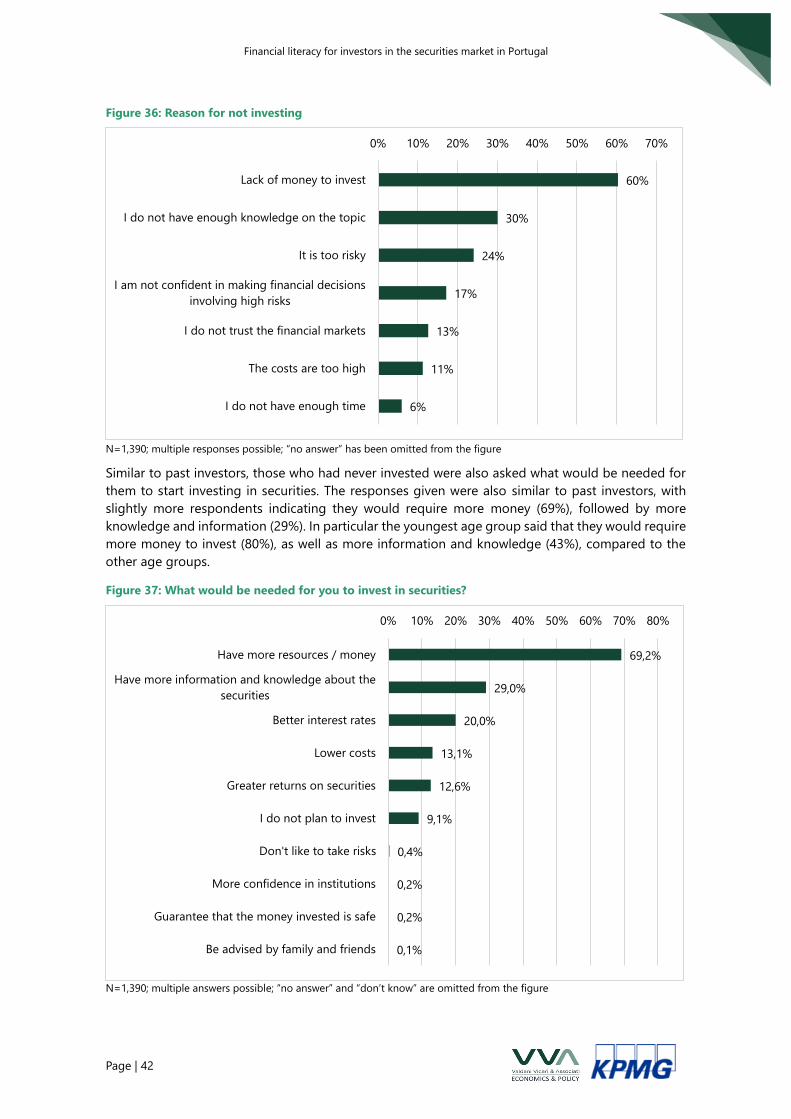
Financial literacy for investors in the securities market in Portugal
Page | 42
Figure 36: Reason for not investing
N=1,390; multiple responses possible; “no answer” has been omitted from the figure
Similar to past investors, those who had never invested were also asked what would be needed for
them to start investing in securities. The responses given were also similar to past investors, with
slightly more respondents indicating they would require more money (69%), followed by more
knowledge and information (29%). In particular the youngest age group said that they would require
more money to invest (80%), as well as more information and knowledge (43%), compared to the
other age groups.
Figure 37: What would be needed for you to invest in securities?
N=1,390; multiple answers possible; “no answer” and “don’t know” are omitted from the figure
60%
30%
24%
17%
13%
11%
6%
0% 10% 20% 30% 40% 50% 60% 70%
Lack of money to invest
I do not have enough knowledge on the topic
It is too risky
I am not confident in making financial decisions
involving high risks
I do not trust the financial markets
The costs are too high
I do not have enough time
69,2%
29,0%
20,0%
13,1%
12,6%
9,1%
0,4%
0,2%
0,2%
0,1%
0% 10% 20% 30% 40% 50% 60% 70% 80%
Have more resources / money
Have more information and knowledge about the
securities
Better interest rates
Lower costs
Greater returns on securities
I do not plan to invest
Don't like to take risks
More confidence in institutions
Guarantee that the money invested is safe
Be advised by family and friends
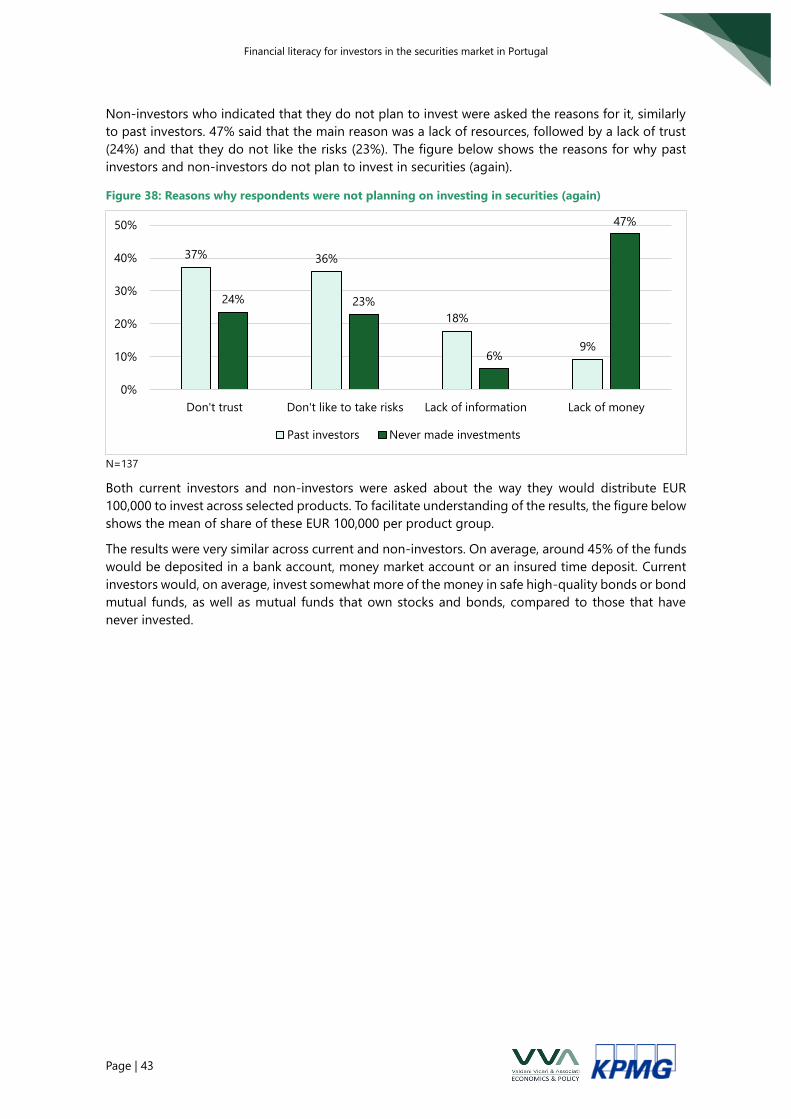
Financial literacy for investors in the securities market in Portugal
Page | 43
Non-investors who indicated that they do not plan to invest were asked the reasons for it, similarly
to past investors. 47% said that the main reason was a lack of resources, followed by a lack of trust
(24%) and that they do not like the risks (23%). The figure below shows the reasons for why past
investors and non-investors do not plan to invest in securities (again).
Figure 38: Reasons why respondents were not planning on investing in securities (again)
N=137
Both current investors and non-investors were asked about the way they would distribute EUR
100,000 to invest across selected products. To facilitate understanding of the results, the figure below
shows the mean of share of these EUR 100,000 per product group.
The results were very similar across current and non-investors. On average, around 45% of the funds
would be deposited in a bank account, money market account or an insured time deposit. Current
investors would, on average, invest somewhat more of the money in safe high-quality bonds or bond
mutual funds, as well as mutual funds that own stocks and bonds, compared to those that have
never invested.
37% 36%
18%
9%
24% 23%
6%
47%
0%
10%
20%
30%
40%
50%
Don't trust Don't like to take risks Lack of information Lack of money
Past investors Never made investments
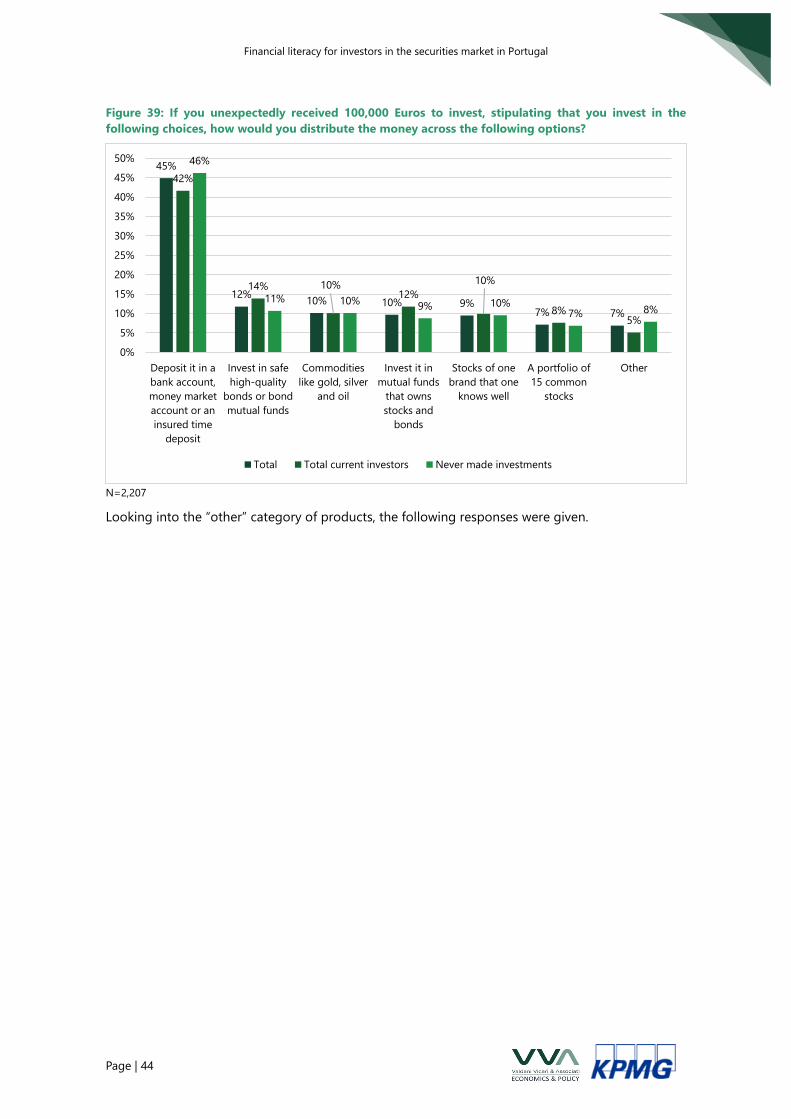
Financial literacy for investors in the securities market in Portugal
Page | 44
Figure 39: If you unexpectedly received 100,000 Euros to invest, stipulating that you invest in the
following choices, how would you distribute the money across the following options?
N=2,207
Looking into the “other” category of products, the following responses were given.
45%
12%10% 10% 9%
7% 7%
42%
14% 10%12%
10%
8%5%
46%
11% 10%9% 10%
7% 8%
0%
5%
10%
15%
20%
25%
30%
35%
40%
45%
50%
Deposit it in a
bank account,
money market
account or an
insured time
deposit
Invest in safe
high-quality
bonds or bond
mutual funds
Commodities
like gold, silver
and oil
Invest it in
mutual funds
that owns
stocks and
bonds
Stocks of one
brand that one
knows well
A portfolio of
15 common
stocks
Other
Total Total current investors Never made investments
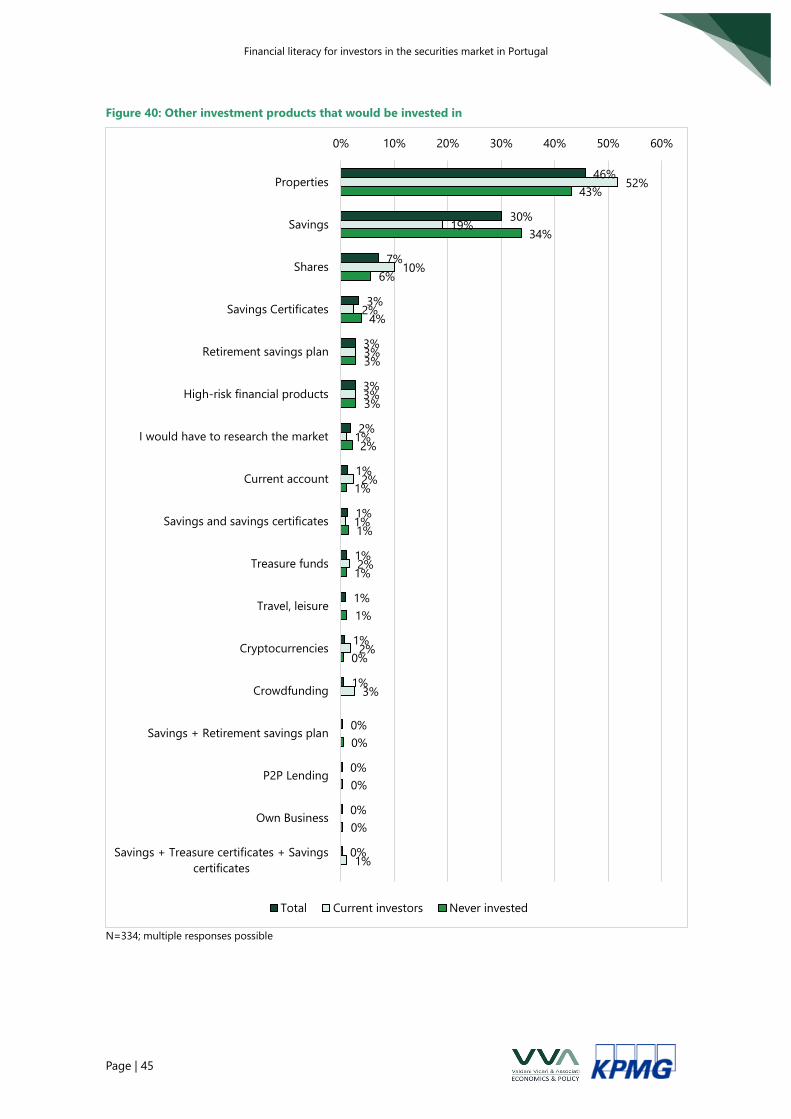
Financial literacy for investors in the securities market in Portugal
Page | 45
Figure 40: Other investment products that would be invested in
N=334; multiple responses possible
46%
30%
7%
3%
3%
3%
2%
1%
1%
1%
1%
1%
1%
0%
0%
0%
0%
52%
19%
10%
2%
3%
3%
1%
2%
1%
2%
2%
3%
1%
43%
34%
6%
4%
3%
3%
2%
1%
1%
1%
1%
0%
0%
0%
0%
0% 10% 20% 30% 40% 50% 60%
Properties
Savings
Shares
Savings Certificates
Retirement savings plan
High-risk financial products
I would have to research the market
Current account
Savings and savings certificates
Treasure funds
Travel, leisure
Cryptocurrencies
Crowdfunding
Savings + Retirement savings plan
P2P Lending
Own Business
Savings + Treasure certificates + Savings
certificates
Total Current investors Never invested
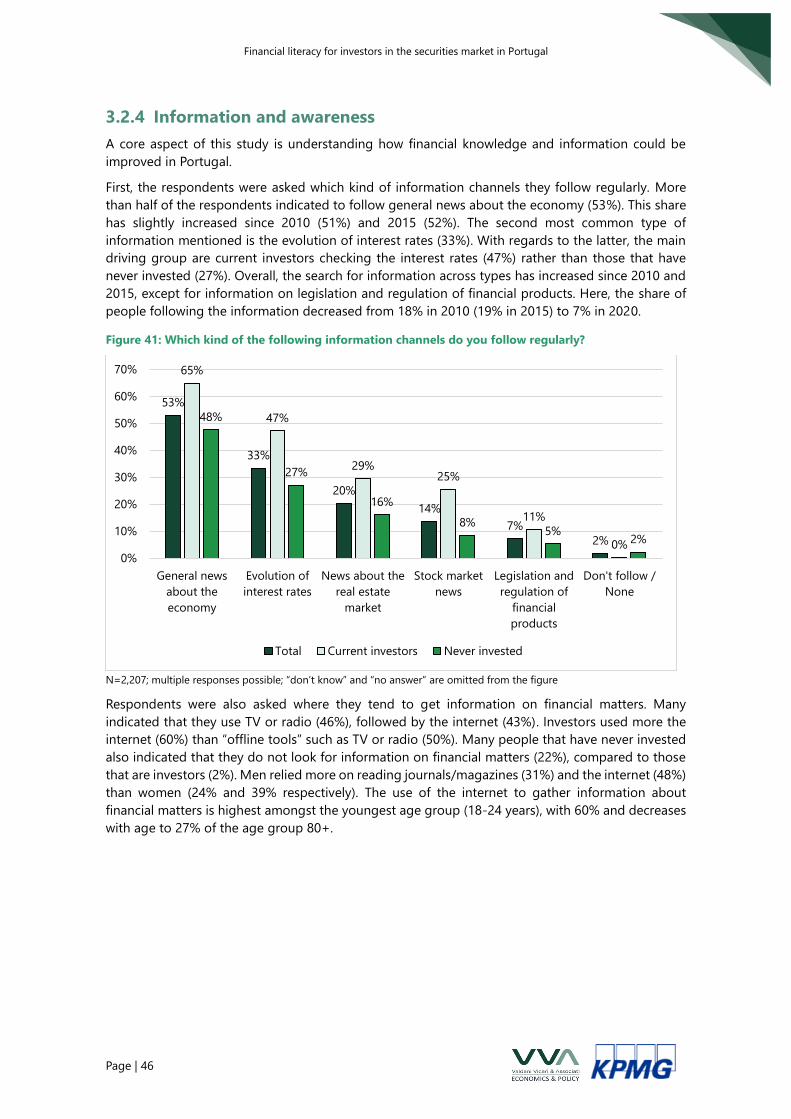
Financial literacy for investors in the securities market in Portugal
Page | 46
3.2.4 Information and awareness
A core aspect of this study is understanding how financial knowledge and information could be
improved in Portugal.
First, the respondents were asked which kind of information channels they follow regularly. More
than half of the respondents indicated to follow general news about the economy (53%). This share
has slightly increased since 2010 (51%) and 2015 (52%). The second most common type of
information mentioned is the evolution of interest rates (33%). With regards to the latter, the main
driving group are current investors checking the interest rates (47%) rather than those that have
never invested (27%). Overall, the search for information across types has increased since 2010 and
2015, except for information on legislation and regulation of financial products. Here, the share of
people following the information decreased from 18% in 2010 (19% in 2015) to 7% in 2020.
Figure 41: Which kind of the following information channels do you follow regularly?
N=2,207; multiple responses possible; “don’t know” and “no answer” are omitted from the figure
Respondents were also asked where they tend to get information on financial matters. Many
indicated that they use TV or radio (46%), followed by the internet (43%). Investors used more the
internet (60%) than “offline tools” such as TV or radio (50%). Many people that have never invested
also indicated that they do not look for information on financial matters (22%), compared to those
that are investors (2%). Men relied more on reading journals/magazines (31%) and the internet (48%)
than women (24% and 39% respectively). The use of the internet to gather information about
financial matters is highest amongst the youngest age group (18-24 years), with 60% and decreases
with age to 27% of the age group 80+.
53%
33%
20%
14%
7%
2%
65%
47%
29%25%
11%
0%
48%
27%
16%
8%5%
2%
0%
10%
20%
30%
40%
50%
60%
70%
General news
about the
economy
Evolution of
interest rates
News about the
real estate
market
Stock market
news
Legislation and
regulation of
financial
products
Don't follow /
None
Total Current investors Never invested
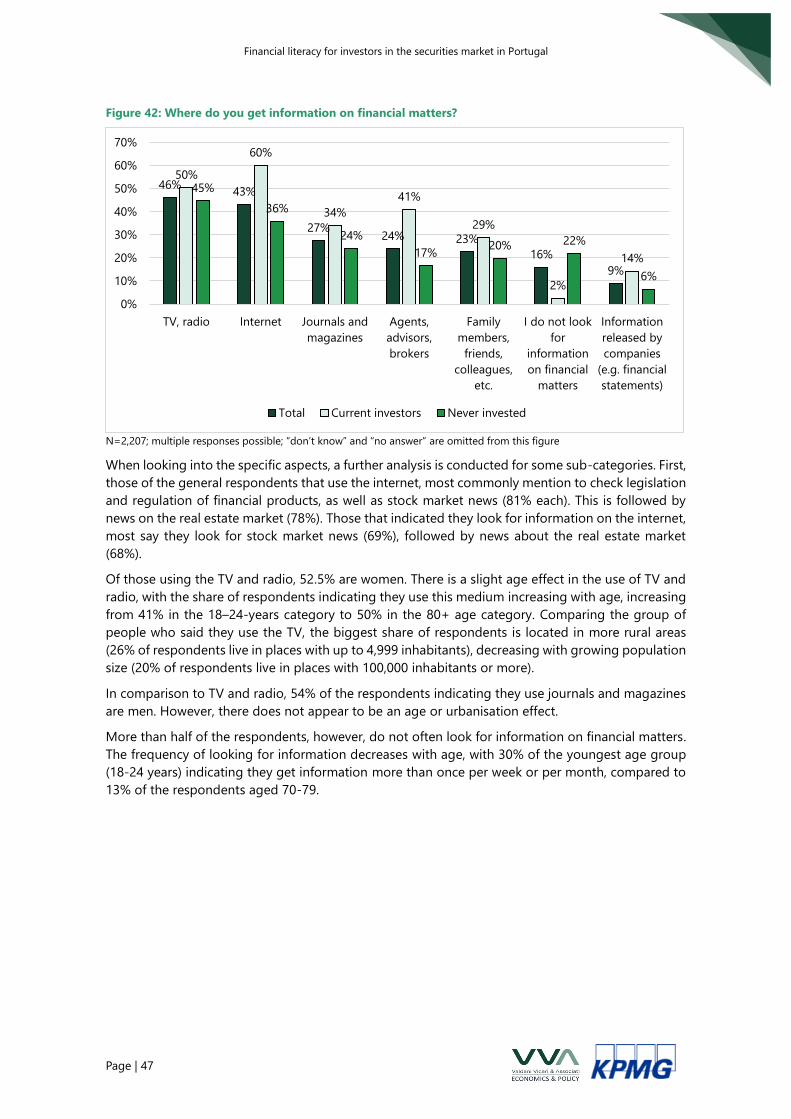
Financial literacy for investors in the securities market in Portugal
Page | 47
Figure 42: Where do you get information on financial matters?
N=2,207; multiple responses possible; “don’t know” and “no answer” are omitted from this figure
When looking into the specific aspects, a further analysis is conducted for some sub-categories. First,
those of the general respondents that use the internet, most commonly mention to check legislation
and regulation of financial products, as well as stock market news (81% each). This is followed by
news on the real estate market (78%). Those that indicated they look for information on the internet,
most say they look for stock market news (69%), followed by news about the real estate market
(68%).
Of those using the TV and radio, 52.5% are women. There is a slight age effect in the use of TV and
radio, with the share of respondents indicating they use this medium increasing with age, increasing
from 41% in the 18–24-years category to 50% in the 80+ age category. Comparing the group of
people who said they use the TV, the biggest share of respondents is located in more rural areas
(26% of respondents live in places with up to 4,999 inhabitants), decreasing with growing population
size (20% of respondents live in places with 100,000 inhabitants or more).
In comparison to TV and radio, 54% of the respondents indicating they use journals and magazines
are men. However, there does not appear to be an age or urbanisation effect.
More than half of the respondents, however, do not often look for information on financial matters.
The frequency of looking for information decreases with age, with 30% of the youngest age group
(18-24 years) indicating they get information more than once per week or per month, compared to
13% of the respondents aged 70-79.
46%43%
27%24% 23%
16%
9%
50%
60%
34%
41%
29%
2%
14%
45%
36%
24%
17%20% 22%
6%
0%
10%
20%
30%
40%
50%
60%
70%
TV, radio Internet Journals and
magazines
Agents,
advisors,
brokers
Family
members,
friends,
colleagues,
etc.
I do not look
for
information
on financial
matters
Information
released by
companies
(e.g. financial
statements)
Total Current investors Never invested
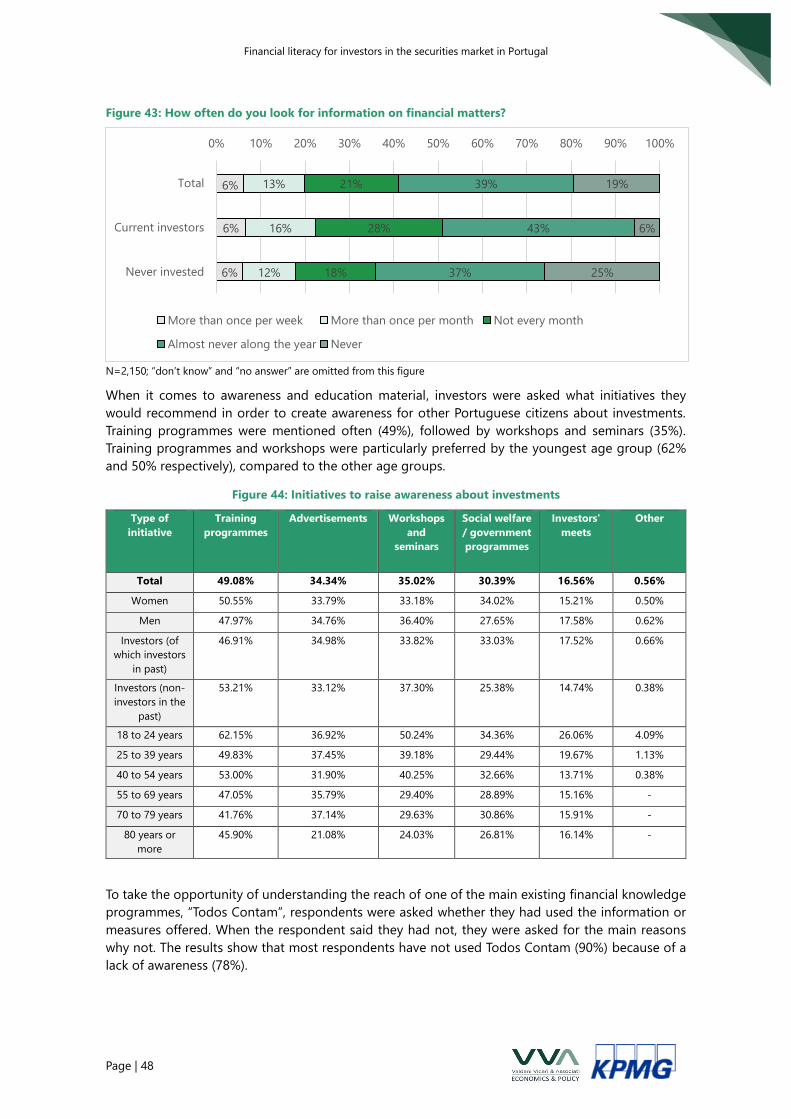
Financial literacy for investors in the securities market in Portugal
Page | 48
Figure 43: How often do you look for information on financial matters?
N=2,150; “don’t know” and “no answer” are omitted from this figure
When it comes to awareness and education material, investors were asked what initiatives they
would recommend in order to create awareness for other Portuguese citizens about investments.
Training programmes were mentioned often (49%), followed by workshops and seminars (35%).
Training programmes and workshops were particularly preferred by the youngest age group (62%
and 50% respectively), compared to the other age groups.
Figure 44: Initiatives to raise awareness about investments
Type of
initiative
Training
programmes
Advertisements Workshops
and
seminars
Social welfare
/ government
programmes
Investors'
meets
Other
Total 49.08% 34.34% 35.02% 30.39% 16.56% 0.56%
Women 50.55% 33.79% 33.18% 34.02% 15.21% 0.50%
Men 47.97% 34.76% 36.40% 27.65% 17.58% 0.62%
Investors (of
which investors
in past)
46.91% 34.98% 33.82% 33.03% 17.52% 0.66%
Investors (non-
investors in the
past)
53.21% 33.12% 37.30% 25.38% 14.74% 0.38%
18 to 24 years 62.15% 36.92% 50.24% 34.36% 26.06% 4.09%
25 to 39 years 49.83% 37.45% 39.18% 29.44% 19.67% 1.13%
40 to 54 years 53.00% 31.90% 40.25% 32.66% 13.71% 0.38%
55 to 69 years 47.05% 35.79% 29.40% 28.89% 15.16% -
70 to 79 years 41.76% 37.14% 29.63% 30.86% 15.91% -
80 years or
more
45.90% 21.08% 24.03% 26.81% 16.14% -
To take the opportunity of understanding the reach of one of the main existing financial knowledge
programmes, “Todos Contam”, respondents were asked whether they had used the information or
measures offered. When the respondent said they had not, they were asked for the main reasons
why not. The results show that most respondents have not used Todos Contam (90%) because of a
lack of awareness (78%).
6%
6%
6%
13%
16%
12%
21%
28%
18%
39%
43%
37%
19%
6%
25%
0% 10% 20% 30% 40% 50% 60% 70% 80% 90% 100%
Total
Current investors
Never invested
More than once per week More than once per month Not every month
Almost never along the year Never
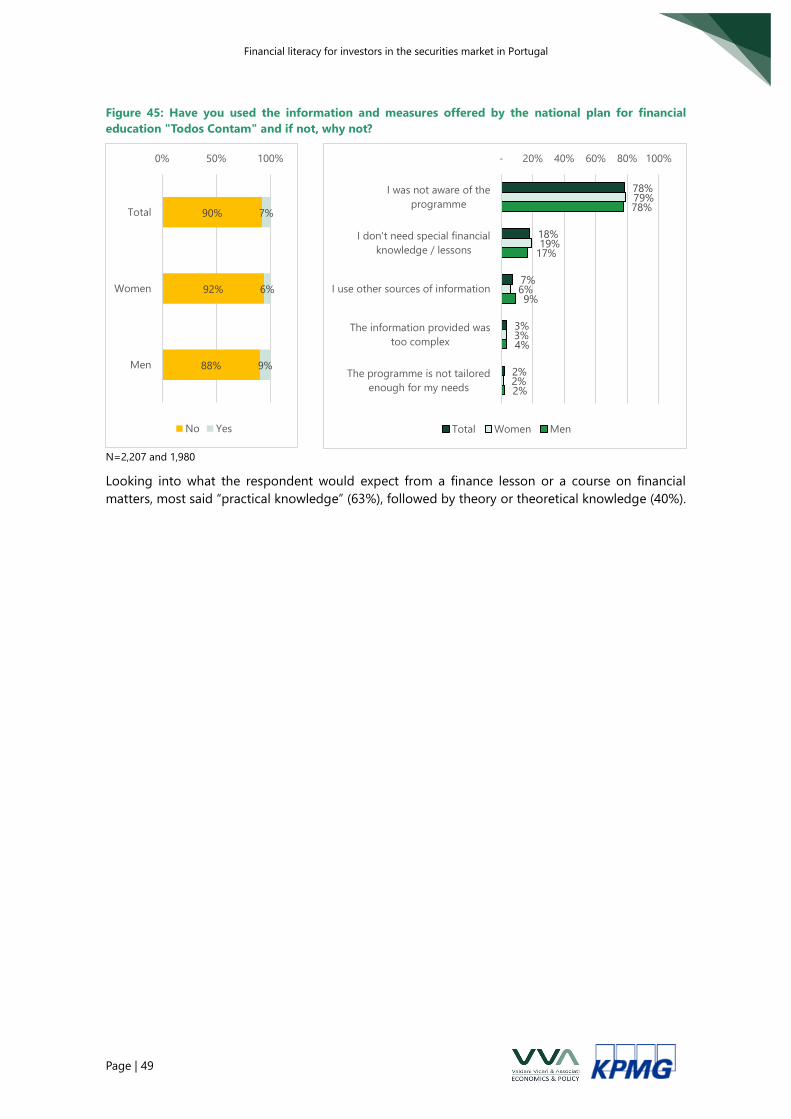
Financial literacy for investors in the securities market in Portugal
Page | 49
Figure 45: Have you used the information and measures offered by the national plan for financial
education "Todos Contam" and if not, why not?
N=2,207 and 1,980
Looking into what the respondent would expect from a finance lesson or a course on financial
matters, most said “practical knowledge” (63%), followed by theory or theoretical knowledge (40%).
90%
92%
88%
7%
6%
9%
0% 50% 100%
Total
Women
Men
No Yes
78%
18%
7%
3%
2%
79%
19%
6%
3%
2%
78%
17%
9%
4%
2%
- 20% 40% 60% 80% 100%
I was not aware of the
programme
I don't need special financial
knowledge / lessons
I use other sources of information
The information provided was
too complex
The programme is not tailored
enough for my needs
Total Women Men
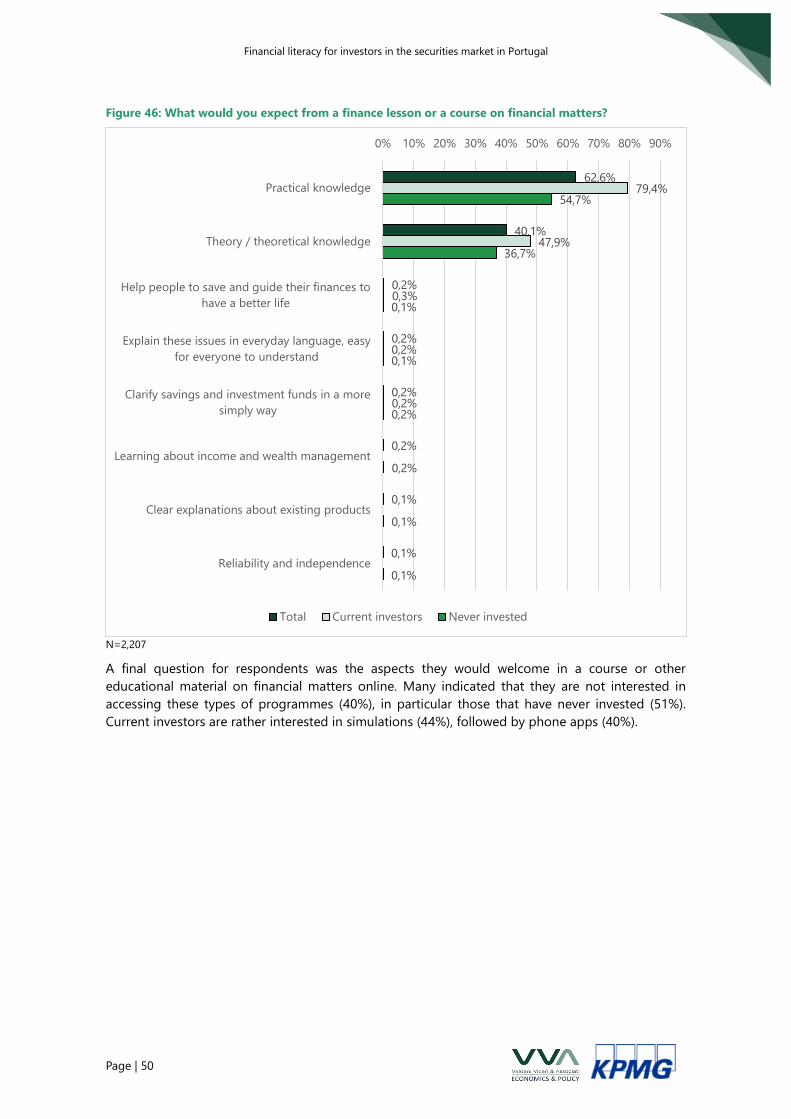
Financial literacy for investors in the securities market in Portugal
Page | 50
Figure 46: What would you expect from a finance lesson or a course on financial matters?
N=2,207
A final question for respondents was the aspects they would welcome in a course or other
educational material on financial matters online. Many indicated that they are not interested in
accessing these types of programmes (40%), in particular those that have never invested (51%).
Current investors are rather interested in simulations (44%), followed by phone apps (40%).
62,6%
40,1%
0,2%
0,2%
0,2%
0,2%
0,1%
0,1%
79,4%
47,9%
0,3%
0,2%
0,2%
54,7%
36,7%
0,1%
0,1%
0,2%
0,2%
0,1%
0,1%
0% 10% 20% 30% 40% 50% 60% 70% 80% 90%
Practical knowledge
Theory / theoretical knowledge
Help people to save and guide their finances to
have a better life
Explain these issues in everyday language, easy
for everyone to understand
Clarify savings and investment funds in a more
simply way
Learning about income and wealth management
Clear explanations about existing products
Reliability and independence
Total Current investors Never invested
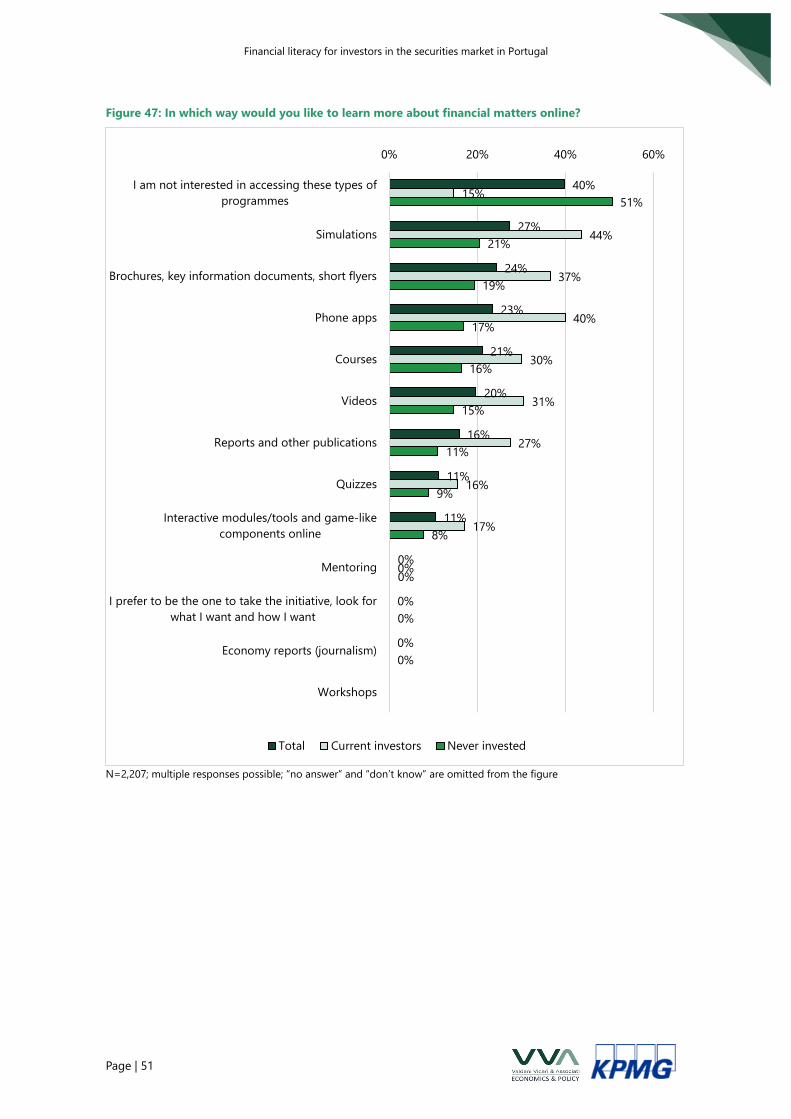
Financial literacy for investors in the securities market in Portugal
Page | 51
Figure 47: In which way would you like to learn more about financial matters online?
N=2,207; multiple responses possible; “no answer” and “don’t know” are omitted from the figure
40%
27%
24%
23%
21%
20%
16%
11%
11%
0%
0%
0%
15%
44%
37%
40%
30%
31%
27%
16%
17%
0%
51%
21%
19%
17%
16%
15%
11%
9%
8%
0%
0%
0%
0% 20% 40% 60%
I am not interested in accessing these types of
programmes
Simulations
Brochures, key information documents, short flyers
Phone apps
Courses
Videos
Reports and other publications
Quizzes
Interactive modules/tools and game-like
components online
Mentoring
I prefer to be the one to take the initiative, look for
what I want and how I want
Economy reports (journalism)
Workshops
Total Current investors Never invested
Financial literacy for investors in the securities market in Portugal
Page | 52
4 Conclusion
This report has presented the results of a representative survey of the Portuguese population to
understand the share of investors among them, their characteristics, financial and investment
behaviour, as well as preferences towards receiving financial information or education.
From a methodological point of view, the main approach followed was:
• Sample design: The sample was based on the 2011 Census of Portugal;
• Step 1 of the survey: A representative sample of 15,173 Portuguese citizens were interviewed
through Computer Assisted Telephone Interviews (CATI), to identify the share of investors
amongst the population and their characteristics; and
• Step 2 of the survey: A representative sample of 2,207 Portuguese citizens were surveyed in-
depth on aspects related to financial behaviour, their financial knowledge; investment
behaviour and information sources.
The results of the survey are summarised in this Research Report, with a focus on the most important
aspects. Detailed results in form of statistical tables are appended to this report in separate
documents, including Excel and SPSS files. The main conclusions are shown below.
The Portuguese population
• Gender: 53% women, 47% men
• Share of investors: About 30% of the Portuguese adult population are investors
• Connectivity: About 70% of Portuguese use the internet
Characteristics of investors in Portugal
• Investors live in urban places: the share of investors was higher in more densely populated
areas in Portugal
• Women are underrepresented amongst investors: Another key outcome that indicates a
need for improvement is the gender distribution among investors. Women are
underrepresented as investors and an additional effort could be made to achieve a better
gender balance in investment behaviour. An underlying factor for female under-
representation among investors could be a lower level of risk appetite among women, or a
lower level of confidence in their knowledge – with one perhaps reinforcing the other. Given
that in comparison to men, fewer women answered financial literacy questions correctly,
however, this could mean that they tend to assess their level of knowledge more realistically,
rather than having low confidence in general. Nevertheless, targeted material or potential
mentoring programmes could be an option to address this issue. Other aspects that could
be covered is that women tend to trust people to their proximity more with decision-making
and information, including bank staff or family and friends. They also trade less frequently
than men and check the value of their portfolio less often.
• Investors have a higher level of education: the share of investors increased with the level of
education completed.
• Investors are found in the higher income brackets: When comparing the income groups, the
higher the income the higher share of respondents that are investors.
• Investors are more connected: 83% of investors use the internet, compared to 65% of non-
investors.
Financial literacy for investors in the securities market in Portugal
Page | 53
Financial situation and behaviour
• More and more Portuguese indicate that they save money: comparing to past financial
literacy survey results, the share of those that did not save decreased continuously from 48%
in 2010 to 41% in 2015 and 38% in 2020. When comparing with the overall EU and the
savings rate, however, according to Eurostat the annual household savings rate in the EU-
27 was 11.96% in 201912 having increased for the past years, with a peak to 24.6% in the
beginning of 2020 and a sharp drop to 16.1% in the third quarter. In comparison to the EU-
27, the savings rate in Portugal was at 7% in 2019, remaining a lower rate than the highest
share of 9.36% in 2013. This suggests that while more Portuguese might be saving, the
amount saved is lower than the EU average, though remained somewhat stable since its
drop after 2013.
• Investors show a higher financial resilience: If they would lose their main source of income,
48% of investors said they could cover expenses for a longer time (six months or more),
compared to 23% of non-investors. This could be related to the income effect and investing
shown above.
• Financial purchase decisions are mainly influenced by third persons: When asked what the
main source of information was that influenced the purchase of the last financial product
bought, 46% said it was bank staff, followed by friends and family (38%). Especially investors
trusted those sources (54% bank staff and 41% friends and family). Awareness of the
existence and importance of independent information sources could be raised to balance
the source of information used. Furthermore, 42% of investors indicated that the reason that
they invested in the securities market was due to the advice received by the bank or account
manager.
• Decisions are based on few comparisons of options: Over one third of respondents indicated
that they had not consider any other (product) option before purchase (39%). More investors
(40%) considered various options within one company. Of these investors that considered
various options, 64% indicated bank staff as source of product choice.
• While the majority of people read contracts before purchasing the product, a remaining
substantive share of respondents do not read them and the share of those who do has
decreased: Back in 2015, 81% of the survey respondents said they read the contracts when
closing a contract, in 2020 this rate had decreased to 75%. Many of those who did not read
contracts indicated that this is either because they trust what the financial advisor or
employee shares with them (13%) or because they do not consider them to be very
important (11%).
• There is often a focus on profit over other aspects: Looking at a series of statements, 54%
of investors preferred investing in a company that is making a profit rather than those that
are minimising their impact on the environment. This share is comparably higher than that
of non-investors (32%) and those that have never invested (31%). Considering the
developments on sustainable finance, as well as the growing importance of the green
transition, awareness on the environmental impact could be raised within the programme.
Financial knowledge
• General findings - Financial knowledge is increasing over time: Overall, there is an
improvement in financial knowledge since the last survey in 2015, including the general
numerical questions and investment knowledge. A few differences persisted between those
12 https://ec.europa.eu/eurostat/databrowser/view/nasa_10_ki/default/table?lang=en
Financial literacy for investors in the securities market in Portugal
Page | 54
that were investors and those that had never invested. Here again, women answered to
fewer questions correctly than men. These results suggest that investors have a higher
understanding of financial matters, which could be because they are more exposed to the
financial market as well as general economic news and information.
• Numerical knowledge: This part aimed at assessing the level of numerical skills of the
respondents. The question was answered correctly by almost all respondents and very few
differences were spotted between investors and those who never invested or between men
and women. Therefore, no further recommendations for the programme are put forward in
this regard, as numerical skills would be better addressed on a general education level,
rather than within a financial literacy programme.
• Understanding of inflation and interest rate(s): A few questions were posed to understand
the level of knowledge of respondents with regards to inflation and interest rates.
o When it comes to the understanding of inflation’s effect on affordability, more than
half of the respondents answered correctly. In particular investors understood the
relationship between spending and interest rates (67%) than people who have never
invested (48%). A higher share of men answered correctly (73%) than women (66%).
o When it comes to calculating the effect of interest rates in a savings account, a
significant share of respondents calculated the amount correctly (68%). Here again,
investors gave the right answer more often (82%) than those who had never
invested (61) and men answered more often correctly (73%) than women (62%).
o When it comes to the question on compounded interest in a savings account (the
amount in the account after a few years with an annual interest rate), less than half
of the respondents estimated the amount correctly (45%). In this case, investors
answered more often wrong than right and slightly less often correctly than those
who had never invested. The difference of correct responses between men (47%)
and women (43%) was lower in this case than compared to the other questions on
interest rates. This question received one of the lowest correct response rates, topics
of compounded interest rates could therefore be covered in a financial literacy
programme.
o Looking at the interest rates on a ‘loan’, or rather the lack of an interest rate on
money lent to a friend, most respondents answered correctly (84%). The difference
between investors (87%) and those who never invested (82%) was lower than for
other questions. In contrast to the other questions in this category, more women
answered correctly (85%) than men (82%).
• Another question related to financial knowledge was whether the respondent knew what
Euribor was. Not many respondents knew the answer (18%), though the share of correct
answers had increased from 10.5% in 2015.
• Knowledge on risk and investing: A few questions were asked to the survey participants with
regards to their knowledge of risks in investments.
o Most respondents (86%) knew that investments with a higher return tend to be of
high risk. While the difference between investors and those who never invested was
small (6%-age point difference), the share of men who answered correctly (62%)
was higher than that of women (53%).
o The share of respondents that correctly answered that diversification can reduce the
level of risk was lower than in the previous question, albeit above half of the
Financial literacy for investors in the securities market in Portugal
Page | 55
respondents gave the right answer (58%). Here, more investors answered correctly
(64%) than those who never invested (54%).
o When it comes to understanding risk, or rather the impossibility to completely
reduce a residual risk in investments, a question on the respondents’ understanding
of guaranteed capital was asked. Only a minority of respondents answered this
question correctly (18%), with very little difference between investors and those who
have never invested (18%). While the knowledge increased since 2015 (4% correct
responses), there is still a low understanding of residual risk. This could be addressed
within a financial literacy programme. Nevertheless, aspects with regards to risk
could be addressed in a way that it acknowledges the overall higher level of risk-
aversion of the Portuguese population.
• Another question about investment was targeted to understand the level of knowledge of
investment value following a price drop and an increase. Only one third of the respondents
answered correctly to the question “What is the value of a 1,000€ investment if the price
drops 50% in the first six months and then increases 80% after those six months?”. Even a
lower share of investors answered correctly (25%) than wrongly (60%).
Investment behaviour
• Investors tend to check the value of their investment sometimes: 29% said they would check
it sometimes, while women rather checked it very rarely to never (36%), compared to men
(24%). Most 80+ year old respondents check the value of their investors rarely to almost
never (52%).
• Past investors that had lost money see the reason in the markets: 62% of those that had lost
money said that it was due to a change in the market, followed by bad advice (26%) or bad
luck (13%).
• Over one third of non-investors that had been investors in the past indicate that the reason
for them not investing in securities is that they do not trust securities investments (37%) and
do not like to take risks (36%), about one third does not have enough knowledge on the
topic (30%).
• The main need for those that never invested to start investing would be higher amount of
resources (69%), especially younger people (80%), followed by requiring more knowledge
(43%).
• The non-investors that do not want to invest name a lack of resources as main reason (47%),
followed by a lack of trust (24%) and risk aversion (23%).
Information and (financial) knowledge sources
Awareness of entities that persons can reach out to in case of conflicts or issues regarding
investments has increased since 2015, with 54% of respondents indicating they would resort to a
supervisory entity in case of issues in 2020, compared to 47% in 2015. Another aspect that resulted
from the survey was that many investors look at general news about the economy (65%) than
specialised stock market news (25%). Awareness on more specialised information and news could
be raised.
While showing a lower share of correct responses, non-investors did not seem to be very interested
in receiving more information, financial education or training programmes. Thus, particular financial
or investment knowledge efforts could be concentrated on investors, while the efforts for non-
investors could focus rather on awareness about investing in general. Given the low risk appetite
Financial literacy for investors in the securities market in Portugal
Page | 56
among the Portuguese population, targeted information could further present the variety of
products and the relationship between risk and reward.
Finally, awareness of the programme Todos Contam was also very low amongst the general
Portuguese population. Thus, further visibility efforts are needed to ensure such programmes can
achieve maximum impact. On the other hand, financial knowledge training, if concentrated on
investors, could take the form of simulations and phone apps, which seemed to be the preferred
tools among the respondents. Finally, following the knowledge questions, these tools could also
focus on aspects related to value development of investments and interest rates.
Main takeaways for a financial literacy programme
These results or main conclusions listed above serve at guiding the next part of the project on
supporting the development of a draft financial literacy programme for investors and non-investors.
Among the key recommendations or takeaways for such a draft programme are the ones listed
below. These are intended as key guidance points rather than detailed actions recommended, which
are covered in Deliverable 4 – Draft Programme Report of this project.
• The programme could target the improvement of knowledge of the securities markets, such
as through updating and adapting existing education material on financial market, targeting
the improving of financial literacy levels. The aspect of risk appears to be an important factor
for the Portuguese population. Acknowledging the general level of risk-aversion while
improving the understanding of opportunities through diversification and other benefits of
investing could be included in a programme.
• The programme could target to increase the general awareness and behaviour of the
securities market as opportunity for conscious savings opportunity, but also covering
aspects like sustainable finance. increasing awareness of investment as a conscious savings
opportunity.
• Specific actions or aspects could be covered for different target groups, beyond the efforts
provided to address the general population with a financial literacy programme on
investment. This could, for instance, include to create a special focus area for women and
younger age groups.
• The programme could be tied in (stronger) cooperation with other organisations, both on
national level but also other institutions such as universities. Dissemination of existing
financial information could be improved, considering for example the low level of awareness
of the programme “Todos Contam”.

Financial literacy for investors in the securities market in Portugal
Page | 57
ANNEX 1 Sample design
Sample%20design_f
inal.xlsx
Financial literacy for investors in the securities market in Portugal
Page | 58
ANNEX 2 Questionnaires
1. Step 1 questionnaires
English Portuguese
PORTUGALSECURITI
ES_Financial%20literacy%20questionnaire_step%2
PORTUGALSECURITI
ES_Financial%20literacy%20questionnaire_step%2
2. Step 2 questionnaires
English Portuguese
Investors Non-investors Investors Non-investors
PORTUGALSECURITI
ES_Financial%20literacy%20questionnaires_step%
PORTUGALSECURITI
ES_Financial%20literacy%20questionnaires_step%
PORTUGALSECURITI
ES_Financial%20literacy%20questionnaires_step%
PORTUGALSECURITI
ES_Financial%20literacy%20questionnaires_step%
Financial literacy for investors in the securities market in Portugal
Page | 59
ANNEX 3 Minutes of interviews and meetings for Phase 2
Financial Literacy Meeting with the National Council of Financial Supervisors (CNSF)
September 10, 2020
Stakeholders:
• CMVM - Comissão do Mercado de Valores Mobiliários.
1. Implemented Initiatives / actions
1.1 What initiatives did you participate in?
- Report on the Financial Literacy Survey of the Portuguese population;
- Online Investor Profile Survey;
- Protocols with Universities;
- Investor Area Portal;
- Portal "Todos Contam";
- Open Day na Banca;
- Training session for students;
- World Investor Week;
- Financial Education Week;
- Global Money Week;
- Promoting financial education in schools (including training course for teachers);
- Financial training for micro, small and medium-sized companies;
- Financial training in terms of attitudes and behaviors;
- Financial literacy of football players;
- Northern Region Financial Training;
- Financial Education Seniors;
- Financial training of IEFP trainers.
1.2 How do you characterize (not exhaustively) the implementation of the initiatives in the
following indicators: i) target group, ii) timeframe, iii) material/methodology, iv)
impact/efficacy, v) messages, vi) internal resources usage and vii) channels
available/used?
Results presented on tables on Chapter 2.3 of the Assessment Report.
Financial literacy for investors in the securities market in Portugal
Page | 60
1.3 How do you evaluate (not exhaustively) the implementation of the initiatives in the
following indicators: : i) target group correctness, ii) timeframe correctness, iii)
material/methodology adequacy, iv) impact/efficacy qualitative level, v) exhaustiveness
of the messages, vi) efficiency of internal resources usage, and vii) adequacy of channels
available/used?
Results presented on tables on Chapter 2.4 of the Assessment Report.
1.4 What changes for upcoming editions do you think would improve the initiatives?
(i) Consider using social networks (Facebook and LinkedIn) and multimedia channels (e.g.
TV, webinars, conferences and podcasts), for dissemination of conclusions/ results;
(ii) Evaluate the regulatory needs according to financial literacy results (e.g. review
regulatory description of products not understood by the population), as well as a better
communication of concepts and products characteristics;
(iii) Define a plan to broaden the scope of involved Universities (e.g. Law and Social Sciences
as a first group, Engineering and Technology as a second group);
(iv) Characterize the partnership with Universities for the next financial literacy programme
(calendar, methodology and use of materials);
(v) Reformulate the investor area portal to be more accessible and oriented to improvement
points identified in the survey;
(vi) Adapt the content shown by "Todos Contam" portal to the viewer (e.g. create a box to
the viewer so that s/he can identify him/herself as a working adult, student, etc.);
(vii) Extend the World Investor Week participants to corporate associations and to
companies interested in meeting possible investors (e.g. startups and fintechs);
(viii) Consider using multimedia channels to live stream and promote the events (e.g. TV,
webinars, conferences and podcasts), and dissemination in social networks (Facebook
and LinkedIn); and
(ix) Create systems for evaluating initiatives, in order to analyze their effectiveness.
2. Planned and unsuccessful initiatives / actions
2.1 Taking into account the indicators mentioned above, what assessment was made in
terms of applicability / feasibility for the unsuccessful initiatives?
No survey or evaluation work was carried out on unsuccessful initiatives.
2.2 What different approaches could have been applied?
Creation of mechanisms for evaluation and feedback of initiatives, in order to be able to
improve them in future editions.
Financial literacy for investors in the securities market in Portugal
Page | 61
3. Other types of initiatives / actions
3.1 Taking into account the initiatives carried out to date, what other types of initiatives
could have added value? Areas not yet reached by previous initiatives?
The participation of entities belonging to CNSF, Banco de Portugal and ASF, should continue
to address a role in the national financial education plan. Entities such as APB, APS and
Euronext may see a more participatory role, since these entities have appropriate
mechanisms to reach target audiences for the dissemination of financial literacy issues
among the Portuguese population and can create new contents and educational materials.
The Universities are another stakeholder that can have more relevance in the future by
leveraging data provided by other stakeholders to develop relevant research about financial
literacy that can be then used to better target the educational initiatives.
3.2 Do you have considered new partnerships with different stakeholders that could add
value?
Entities such as APB, APS and Euronext may see a more participatory role, since these entities
have appropriate mechanisms to reach target audiences for the dissemination of financial
literacy issues among the Portuguese population and can create new contents and
educational materials, considering an efficient allocation of costs and people, in order to
promote efficient initiatives for the promotion of financial literacy, ensuring supervision and
quality control. Additionally, these entities should have systems for evaluating its track and
outcomes, since some entities, such as the Associations (APB, APS and APFIPP), lack control
over the efficiency of the initiatives due their small human resources’ scale. The Universities
are another stakeholder that can have more relevance in the future by leveraging data
provided by other stakeholders to develop relevant research about financial literacy that can
be then used to better target the educational initiatives.
Financial literacy for investors in the securities market in Portugal
Page | 62
Self-Evaluation Meeting with CMVM
September 23, 2020
Stakeholders:
• CMVM - Comissão do Mercado de Valores Mobiliários.
1. Project presentation
1.1 Introduction and Objectives
1.2 Project Framework
2. Initiatives presentation
2.1 Illustration of initiatives and respective characterization
- Report on the Financial Literacy Survey of the Portuguese population;
- Online Investor Profile Survey;
- Protocols with Universities;
- Investor Area Portal;
- Portal "Todos Contam";
- Open Day na Banca;
- Training session for students;
- World Investor Week;
- Financial Education Week;
- Global Money Week;
- Promoting financial education in schools (including training course for teachers);
- Financial training for micro, small and medium-sized companies;
- Financial training in terms of attitudes and behaviors;
- Financial literacy of football players;
- Northern Region Financial Training;
- Financial Education Seniors;
- Financial training of IEFP trainers
Characterization presented on tables on Chapter 2.3 of the Assessment Report.
3. Presentation and possible adjustment of evaluation scales
Financial literacy for investors in the securities market in Portugal
Page | 63
3.1 Presentation of the scale proposal, prepared by KPMG
Following the identification and characterization (along seven dimensions) of the initiatives
taken to date, this chapter presents an assessment framework, using a three-point scale:
• Very suitable;
• Suitable; and
• Unsuitable.
3.2 Discussion and possible adjustment of the evaluation scale
Results presented on tables on Chapter 2.4 of the Assessment Report.
4. Execution of the assessment (in coordination with CMVM)
4.1 Evaluation of each initiative raised, taking into account the scale presented
In coordination with the CMVM, an evaluation of previous financial literacy initiatives was
carried out to identify recommendations to improve the initiatives’ efficiency and enhancing
their future development.
The participation of entities belonging to CNSF, Banco de Portugal and ASF, should continue
to be active and relevant in future financial literacy projects since they play a leading role in
the national financial education plan.
The self-assessment identified several opportunities for improvement and enhancement of the
CMVM’s resources and the stakeholders involved. The key areas for improvement are:
(i) Better dissemination of the initiatives;
(ii) Better preparation of the materials used; and
(iii) Greater adaptation to the target audience.
Financial literacy for investors in the securities market in Portugal
Page | 64
Financial Literacy Meeting with Financial Services Industry Associations
September 15, 2020
Stakeholders:
• CMVM - Comissão do Mercado de Valores Mobiliários;
• APB - Associação Portuguesa de Bancos;
• APS - Associação Portuguesa de Seguradores.
1. Project presentation
1.1 Introduction and Objectives
1.2 Project Framework
2. Implemented Initiatives / actions
2.1 What initiatives did you participate in?
- World Investor Week;
- European Money Week;
- Open Day na Banca;
- Promoting financial education in schools.
2.2 How do you characterize (not exhaustively) the implementation of the initiatives in the
following indicators: i) target group, ii) timeframe, iii) material/methodology, iv)
impact/efficacy, v) messages, vi) internal resources usage and vii) channels
available/used?
Results presented on Chapter 2.3 of the Assessment Report.
2.3 How do you evaluate (not exhaustively) the implementation of the initiatives in the
following indicators: : i) target group correctness, ii) timeframe correctness, iii)
material/methodology adequacy, iv) impact/efficacy qualitative level, v) exhaustiveness
of the messages, vi) efficiency of internal resources usage, and vii) adequacy of channels
available/used?
Results presented on Chapter 2.4 of the Assessment Report.
2.4 What changes for upcoming editions do you think would improve the initiatives?
- Conduct impact studies of the initiatives in order to understand what improvements can
be made.
- Conduct more sessions in online and digital formats (in the context of Covid-19 pandemic).
- Develop trainings for students that include more citizenship issues, for example opening
bank accounts, conducting the IRS, etc.
Financial literacy for investors in the securities market in Portugal
Page | 65
- Include more topics on insurance products and work on insurance simplification of technical
language, namely regarding the retirement protection and risk analysis.
3. Planned and unsuccessful initiatives / actions
3.1 Taking into account the indicators mentioned above, what assessment was made in
terms of applicability / feasibility for the unsuccessful initiatives?
No survey or evaluation work was carried out on unsuccessful initiatives.
3.2 What different approaches could have been applied?
No survey or evaluation work was carried out on unsuccessful initiatives.
4. Other types of initiatives / actions
4.1 Taking into account the initiatives carried out to date, what other types of initiatives
could have added value? Areas not yet reached by previous initiatives?
In the case of the Word Investor Week initiative, the target group could be more efficient if
broaden to more public, including corporate association and FinTech’s and the sessions
should be more adapted to the target audiences, with well-defined themes and invited
guests in order to make the initiative more exhaustive but at the same time more efficient,
regarding internal resources usage. The same applies for the channels used, where including
more channels, other than the website and social media could improve the adherence to the
events, conferences and workshops scheduled, resulting as well in more promotion. Finally,
the impact/ efficacy could get more adequate if the scope gets broaden to the public sectors
and other entities.
In the case of the Open Day na Banca initiative, the target group could be more efficient if
broaden to include more public from the general population.
4.2 Do you have considered new partnerships with different stakeholders that could add
value?
- Enhance more work with schools and universities, considering the financial literacy
program as mandatory included in the curriculum plan essential.
- Enhance articulation with other associations in the area in order to standardize the
program and increase the link between associations.
Financial Literacy Meeting with Financial Services Industry Associations
September 23, 2020
Stakeholders:
• CMVM - Comissão do Mercado de Valores Mobiliários;
• APFIPP - Associação Portuguesa de Fundos de Investimento, Pensões e Patrimónios;.
Financial literacy for investors in the securities market in Portugal
Page | 66
1. Project presentation
1.1 Introduction and Objectives
1.2 Project Framework
2. Implemented Initiatives / actions
2.1 What initiatives did you participate in?
- Training session for students;
- World Investor Week;
- Financial Education Week.
2.2 How do you characterize (not exhaustively) the implementation of the initiatives in the
following indicators: i) target group, ii) timeframe, iii) material/methodology, iv)
impact/efficacy, v) messages, vi) internal resources usage and vii) channels
available/used?
Results presented on tables on Chapter 2.3 of the Assessment Report.
2.3 How do you evaluate (not exhaustively) the implementation of the initiatives in the
following indicators: : i) target group correctness, ii) timeframe correctness, iii)
material/methodology adequacy, iv) impact/efficacy qualitative level, v) exhaustiveness
of the messages, vi) efficiency of internal resources usage, and vii) adequacy of channels
available/used?
Results presented on tables on Chapter 2.4 of the Assessment Report.
2.4 What changes for upcoming editions do you think would improve the initiatives?
- Increase the production of content (including digital).
- Conduct impact studies of the initiatives, in order to understand what improvements can be
made.
- Carry out evaluations of the initiatives and obtain more feedback, in order to improve them.
3. Planned and unsuccessful initiatives / actions
3.1 Taking into account the indicators mentioned above, what assessment was made in
terms of applicability / feasibility for the unsuccessful initiatives?
No survey or evaluation work was carried out on unsuccessful initiatives.
3.2 What different approaches could have been applied?

Financial literacy for investors in the securities market in Portugal
Page | 67
No survey or evaluation work was carried out on unsuccessful initiatives.
4. Other types of initiatives / actions
4.1 Taking into account the initiatives carried out to date, what other types of initiatives
could have added value? Areas not yet reached by previous initiatives?
In the case of the Word Investor Week initiative, the target group could be more efficient if
broaden to more public and sessions should be more adapted to the target audiences, with
well-defined themes and invited guests in order to make the initiative more exhaustive but at
the same time more efficient, regarding internal resources usage.
4.2 Do you have considered new partnerships with different stakeholders that could add
value?
Nothing indicated.
Financial literacy for investors in the securities market in Portugal
Page | 68
Financial Literacy Meeting with Securities Market Stakeholders
September 22, 2020
Stakeholders:
• CMVM - Comissão do Mercado de Valores Mobiliários;
• Euronext Lisbon.
1. Project presentation
1.1 Introduction and Objectives
1.2 Project Framework
2. Implemented Initiatives / actions
2.1 What initiatives did you participate in?
- World Investor Week;
- Global Money Week;
- Financial Education Week.
2.2 How do you characterize (not exhaustively) the implementation of the initiatives in the
following indicators: i) target group, ii) timeframe, iii) material/methodology, iv)
impact/efficacy, v) messages, vi) internal resources usage and vii) channels
available/used?
Results presented on Chapter 2.3 of the Assessment Report.
2.3 How do you evaluate (not exhaustively) the implementation of the initiatives in the
following indicators: : i) target group correctness, ii) timeframe correctness, iii)
material/methodology adequacy, iv) impact/efficacy qualitative level, v) exhaustiveness
of the messages, vi) efficiency of internal resources usage, and vii) adequacy of channels
available/used?
Results presented on Chapter 2.4 of the Assessment Report.
2.4 What changes for upcoming editions do you think would improve the initiatives?
- Improve content posted on LinkedIn, including making it available in Portuguese;
- Rethinking the initiative promoted with family-owned companies (family-share).
3. Planned and unsuccessful initiatives / actions
Financial literacy for investors in the securities market in Portugal
Page | 69
3.1 Taking into account the indicators mentioned above, what assessment was made in
terms of applicability / feasibility for the unsuccessful initiatives?
Every year, evaluations are made of the initiatives carried out.
3.2 What different approaches could have been applied?
- Difficulty reaching individual investors.
- Promote more sessions with journalists in order to increase the dissemination of financial
literacy topics.
4. Other types of initiatives / actions
4.1 Taking into account the initiatives carried out to date, what other types of initiatives
could have added value? Areas not yet reached by previous initiatives?
In the case of the Word Investor Week initiative, the target group could be more efficient if
broaden to more public and sessions should be more adapted to the target audiences, with
well-defined themes and invited guests in order to make the initiative more exhaustive but at
the same time more efficient, regarding internal resources usage.
The Global Money Week initiative is also worth of being mentioned since it could benefit from
improving its channels and increasing the promotion of its events, conferences and workshops.
4.2 Do you have considered new partnerships with different stakeholders that could add
value?
Nothing indicated.
Financial literacy for investors in the securities market in Portugal
Page | 70
Financial Literacy Meeting with Public Educational Stakeholders
September 15, 2020
Stakeholders:
• CMVM - Comissão do Mercado de Valores Mobiliários;
• Ministry of Education.
1. Project presentation
1.1 Introduction and Objectives
1.2 Project Framework
2. Implemented Initiatives / actions
2.1 What initiatives did you participate in?
- Promoting financial education in schools (including training course for teachers);
- World Investor Week;
- Others (to be consulted at the Assessment Report).
2.2 How do you characterize (not exhaustively) the implementation of the initiatives in the
following indicators: i) target group, ii) timeframe, iii) material/methodology, iv)
impact/efficacy, v) messages, vi) internal resources usage and vii) channels
available/used?
Results presented on Chapter 2.3 of the Assessment Report.
2.3 How do you evaluate (not exhaustively) the implementation of the initiatives in the
following indicators: : i) target group correctness, ii) timeframe correctness, iii)
material/methodology adequacy, iv) impact/efficacy qualitative level, v) exhaustiveness
of the messages, vi) efficiency of internal resources usage, and vii) adequacy of channels
available/used?
Results presented on Chapter 2.4 of the Assessment Report.
2.4 What changes for upcoming editions do you think would improve the initiatives?
- Extend initiatives to more schools, more students and more teachers;
- Extend scope of action to areas other than the ones related with economics and
management.
- Leverage initiatives with online and more digital capabilities.
3. Planned and unsuccessful initiatives / actions

Financial literacy for investors in the securities market in Portugal
Page | 71
3.1 Taking into account the indicators mentioned above, what assessment was made in
terms of applicability / feasibility for the unsuccessful initiatives?
No survey or evaluation work was carried out on unsuccessful initiatives.
3.2 What different approaches could have been applied?
No survey or evaluation work was carried out on unsuccessful initiatives.
4. Other types of initiatives / actions
4.1 Taking into account the initiatives carried out to date, what other types of initiatives
could have added value? Areas not yet reached by previous initiatives?
In the case of the Word Investor Week initiative, the target group could be more efficient if
broaden to more public and sessions should be more adapted to the target audiences, with
well-defined themes and invited guests in order to make the initiative more exhaustive but at
the same time more efficient, regarding internal resources usage. Finally, the impact/ efficacy
could get more adequate if the scope gets broaden to the public sectors and other entities.
Additionally, it can be concluded that the target group/ methodology used could be
broadened and include other areas of expertise (Law, Engineering, Technology or Sociology,
…), as well as high school students, other than just students in the fields of Economics and
Management.
4.2 Do you have considered new partnerships with different stakeholders that could add
value?
Increase and enhance agreements with Universities, in order to increase the dissemination of
financial literacy issues among students.
Financial literacy for investors in the securities market in Portugal
Page | 72
Financial Literacy Meeting with Public Educational Stakeholders
September 15, 2020
Stakeholders:
• CMVM - Comissão do Mercado de Valores Mobiliários;
• OPP - Ordem dos Psicólogos Portugueses;
1. Project presentation
1.1 Introduction and Objectives
1.2 Project Framework
2. Implemented Initiatives / actions
2.1 What initiatives did you participate in?
- Financial training in terms of attitudes and behaviors;
- Financial Education Week.
2.2 How do you characterize (not exhaustively) the implementation of the initiatives in the
following indicators: i) target group, ii) timeframe, iii) material/methodology, iv)
impact/efficacy, v) messages, vi) internal resources usage and vii) channels
available/used?
Results presented on Chapter 2.3 of the Assessment Report.
2.3 How do you evaluate (not exhaustively) the implementation of the initiatives in the
following indicators: : i) target group correctness, ii) timeframe correctness, iii)
material/methodology adequacy, iv) impact/efficacy qualitative level, v) exhaustiveness
of the messages, vi) efficiency of internal resources usage, and vii) adequacy of channels
available/used?
Results presented on Chapter 2.4 of the Assessment Report.
2.4 What changes for upcoming editions do you think would improve the initiatives?
- Increase the production of content (including digital).
- Create a more detailed plan of the initiatives and specific activities to be carried out by the
OPP.
- Conduct impact studies of the initiatives in order to understand what improvements can be
made.
- Carry out evaluations of the initiatives and obtain more feedback, in order to improve them.
3. Planned and unsuccessful initiatives / actions
Financial literacy for investors in the securities market in Portugal
Page | 73
3.1 Taking into account the indicators mentioned above, what assessment was made in
terms of applicability / feasibility for the unsuccessful initiatives?
No survey or evaluation work was carried out on unsuccessful initiatives.
3.2 What different approaches could have been applied?
- Implement training actions in schools and for the older population.
- Develop and implement actions to help people to handle anxiety caused by financial
problems.
4. Other types of initiatives / actions
4.1 Taking into account the initiatives carried out to date, what other types of initiatives
could have added value? Areas not yet reached by previous initiatives?
- Implement training actions in schools and for the older population.
- Actions to analyze and influence informed decision-taking on consumption behaviors.
4.2 Do you have considered new partnerships with different stakeholders that could add
value?
Nothing indicated.
Financial literacy for investors in the securities market in Portugal
Page | 74
Financial Literacy Meeting with Public Educational Stakeholders
September 16, 2020
Stakeholders:
• CMVM - Comissão do Mercado de Valores Mobiliários;
• Universities (FEP, ISEG, Universidade de Aveiro, Universidade Católica do Porto – Economia
e Direito);
1. Project presentation
1.1 Introduction and Objectives
1.2 Project Framework
2. Implemented Initiatives / actions
2.1 What initiatives did you participate in?
- Protocols with Universities;
- World Investor Week;
2.2 How do you characterize (not exhaustively) the implementation of the initiatives in the
following indicators: i) target group, ii) timeframe, iii) material/methodology, iv)
impact/efficacy, v) messages, vi) internal resources usage and vii) channels
available/used?
Results presented on Chapter 2.3 of the Assessment Report.
2.3 How do you evaluate (not exhaustively) the implementation of the initiatives in the
following indicators: : i) target group correctness, ii) timeframe correctness, iii)
material/methodology adequacy, iv) impact/efficacy qualitative level, v) exhaustiveness
of the messages, vi) efficiency of internal resources usage, and vii) adequacy of channels
available/used?
Results presented on Chapter 2.4 of the Assessment Report.
2.4 What changes for upcoming editions do you think would improve the initiatives?
- Greater data sharing with Universities to carry out research exercises that could be helpful
for initiatives definition to improve financial literacy.
- Improve the analysis of the difference between the acts/ consumer habits and the
knowledge of the population regarding financial products.
- Analyze the criteria behind the major financial decisions of the population.
Financial literacy for investors in the securities market in Portugal
Page | 75
3. Planned and unsuccessful initiatives / actions
3.1 Taking into account the indicators mentioned above, what assessment was made in
terms of applicability / feasibility for the unsuccessful initiatives?
No survey or evaluation work was carried out on unsuccessful initiatives.
3.2 What different approaches could have been applied?
No survey or evaluation work was carried out on unsuccessful initiatives.
4. Other types of initiatives / actions
4.1 Taking into account the initiatives carried out to date, what other types of initiatives
could have added value? Areas not yet reached by previous initiatives?
In the case of the Word Investor Week initiative, the target group could be more efficient if
broaden to more public and sessions should be more adapted to the target audiences, with
well-defined themes and invited guests in order to make the initiative more exhaustive but at
the same time more efficient, regarding internal resources usage. Finally, the impact/ efficacy
could get more adequate if the scope gets broaden to the public sectors and other entities.
In the case of the Protocols with Universities initiative, there is still a space for improvement,
more precisely when it comes to the target group, the timeframe, the material/methodology,
the impact/efficiency and the channels used.
Evaluating each dimension individually, it can be concluded that the target group/
methodology used could be broadened and include other areas of expertise (Law,
Engineering, Technology or Sociology, …), as well as high school students, other than just
University students in the fields of Economics and Management. The expansion of the target
audience, together with a more defined calendar for the activities planned in the Protocols
with Universities and an effort to gather more data to provide to the Universities to pursue
relevant analysis, could provide further improvements in this type of initiatives.
4.2 Do you have considered new partnerships with different stakeholders that could add
value?
Ministry of Employment, Solidarity and Social Security, as well as other financial literacy
associations, are expected to disseminate more data and information so that Universities can
work and develop investigations.
Financial literacy for investors in the securities market in Portugal
Page | 76
Financial Literacy Meeting with Stakeholders in Business Development and Innovation
September 16, 2020
Stakeholders:
• CMVM - Comissão do Mercado de Valores Mobiliários;
• CCDR-N - Comissão de Coordenação e Desenvolvimento Regional do Norte.
1. Project presentation
1.1 Introduction and Objectives
1.2 Project Framework
2. Implemented Initiatives / actions
2.1 What initiatives did you participate in? How was the expected results versus the
achieved results, in initiatives like (examples):
- Northern Region Financial Training;
2.2 How do you characterize (not exhaustively) the implementation of the initiatives in the
following indicators: i) target group, ii) timeframe, iii) material/methodology, iv)
impact/efficacy, v) messages, vi) internal resources usage and vii) channels
available/used?
Results presented on Chapter 2.3 of the Assessment Report.
2.3 How do you evaluate (not exhaustively) the implementation of the initiatives in the
following indicators: : i) target group correctness, ii) timeframe correctness, iii)
material/methodology adequacy, iv) impact/efficacy qualitative level, v) exhaustiveness
of the messages, vi) efficiency of internal resources usage, and vii) adequacy of channels
available/used?
Results presented on Chapter 2.4 of the Assessment Report.
2.4 What changes for upcoming editions do you think would improve the initiatives?
- Better training of trainers for municipalities, since they were always in need of more
information and training.
- Create content more targeted and adapted to the target audience, since many educated
audiences have low academic qualifications.
- Creation of mechanisms for evaluation and feedback of initiatives in order to be able to
improve them in future editions.
Financial literacy for investors in the securities market in Portugal
Page | 77
3. Planned and unsuccessful initiatives / actions
3.1 Taking into account the indicators mentioned above, what assessment was made in
terms of applicability / feasibility for the unsuccessful initiatives?
No survey or evaluation work was carried out on unsuccessful initiatives.
3.2 What different approaches could have been applied?
Creation of mechanisms for evaluation and feedback of initiatives, in order to be able to
improve them in future editions.
4. Other types of initiatives / actions
4.1 Taking into account the initiatives carried out to date, what other types of initiatives
could have added value? Areas not yet reached by previous initiatives?
In the case of the Northern Region Financial Training initiative, it foresees the usage of external
resources. The external resources usage impacts CMVM’s control over outcomes, reducing
their overall monitoring levels. Therefore, in order to achieve the initiative’s objectives and
expected outcomes, it might be necessary to increase the participation of internal resources
in the quality evaluation and control of the outcomes of the initiatives, assuring that they are
fitted to the CMVM objectives of promoting financial education in vocational training and the
adoption of appropriate financial attitudes
4.2 Do you have considered new partnerships with different stakeholders that could add
value?
Greater coordination with the PNFF in order to provide more resources (trainers and
materials) for the initiatives developed in the northern region of the country.
Financial literacy for investors in the securities market in Portugal
Page | 78
Financial Literacy Meeting with Stakeholders in Business Development and Innovation
September 18, 2020
Stakeholders:
• CMVM - Comissão do Mercado de Valores Mobiliários;
• IAPMEI - Agência para a Competitividade e Inovação;
• IEFP - Instituto do Emprego e Formação Profissional.
1. Project presentation
1.1 Introduction and Objectives
1.2 Project Framework
2. Implemented Initiatives / actions
2.1 What initiatives did you participate in?
- Financial training for micro, small and medium-sized companies;
- World Investor Week;
- Financial Training for IEFP trainers.
2.2 How do you characterize (not exhaustively) the implementation of the initiatives in the
following indicators: i) target group, ii) timeframe, iii) material/methodology, iv)
impact/efficacy, v) messages, vi) internal resources usage and vii) channels
available/used?
Results presented on Chapter 2.3 of the Assessment Report.
2.3 How do you evaluate (not exhaustively) the implementation of the initiatives in the
following indicators: : i) target group correctness, ii) timeframe correctness, iii)
material/methodology adequacy, iv) impact/efficacy qualitative level, v) exhaustiveness
of the messages, vi) efficiency of internal resources usage, and vii) adequacy of channels
available/used?
Results presented on Chapter 2.4 of the Assessment Report.
2.4 What changes for upcoming editions do you think would improve the initiatives?
- Enhance the mechanisms of analysis of the financial situation for greater dissemination of
financial literacy issues, as well as providing training actions (IAPMEI);
- Strengthen digital mechanisms for the promotion and implementation of initiatives;
- Extend trainers' numbers in order to have more sessions;
Financial literacy for investors in the securities market in Portugal
Page | 79
- Content more targeted and adapted to the target audience, adapting the content for each
company;
- Limit, as much as possible and aligned with specific health circumstances, the online training
sessions since it is not efficient for financial topics where the trainer must be analyzing the
students’ reaction to the materials;
- Creation of mechanisms for evaluation and feedback of initiatives, in order to be able to
improve them in future editions.
3. Planned and unsuccessful initiatives / actions
3.1 Taking into account the indicators mentioned above, what assessment was made in
terms of applicability / feasibility for the unsuccessful initiatives?
No survey or evaluation work was carried out on unsuccessful initiatives.
3.2 What different approaches could have been applied?
Creation of mechanisms for evaluation and feedback of initiatives, in order to be able to
improve them in future editions.
4. Other types of initiatives / actions
4.1 Taking into account the initiatives carried out to date, what other types of initiatives
could have added value? Areas not yet reached by previous initiatives?
In the case of the Financial Training for micro, small and medium-sized companies initiative,
focusing the information on each target group’s needs and making sure tools have a larger
applicability to the initiative purposes, is the solution to increase the impact/ efficacy and
consequently improve the dimension suitability.
When it comes to the financial training of IEFP trainers’ initiative, it foresees the usage of
external resources. The external resources usage impacts CMVM’s control over outcomes,
reducing their overall monitoring levels. Therefore, in order to achieve the initiative’s objectives
and expected outcomes, it might be necessary to increase the participation of internal
resources in the quality evaluation and control of the outcomes of the initiatives, assuring that
they are fitted to the CMVM objectives of promoting financial education in vocational training
and the adoption of appropriate financial attitudes.
It is also important to mention, regarding the financial training of IEFP trainers’ initiative, that
the impact might be affected by the levelled hierarchy in the PNFF which can jeopardise the
process of reviewing the changes in the program. Additionally, it might be necessary to adjust
the structure and the complexity of the concepts used to be more adapted and directed to the
audience needs.
4.2 Do you have considered new partnerships with different stakeholders that could add
value?
Not mentioned.