Embed Size (px)
Citation preview
CONVERTIBLE SECURITIES Structures, Valuation, Market Environment, and Asset Allocation
By John P. Calamos, Sr.Founder, Chairman and Global CIO, Calamos Investmentswith contributions from Eli Pars, CFA, Co-CIO, Senior Co-Portfolio Manager
NOT FDIC INSURED | MAY LOSE VALUE | NO BANK GUARANTEE
1. Introduction to Convertible Securities What is a convertible bond? What is a convertible preferred stock? What is a mandatory convertible? What are exchangeable convertible bonds and exchangeable convertible preferred stocks? Where do convertible securities fit within the capital structure? What is a synthetic convertible?
2. Factors Driving Convertible Issuance Why do companies issue convertibles? What macro factors drive convertible issuance?
3. A History of the Convertible Market When did companies first issue convertible bonds? What were some of the key trends in the convertible market in the twentieth century? How has the convertible market evolved in the twenty-first century?
4. Valuing a Convertible Bond What is the investment value? What is the investment premium? What is the conversion price? What is the conversion ratio? What is the conversion value? What is the conversion premium? What is the relationship between conversion value and investment value? What are the different types of convertible call provisions? What antidilution protections do convertible bonds carry?
5. Performance of Convertibles in Various Environments How have convertibles historically performed versus equities and corporate bonds? How have convertibles performed in up and down markets? How has the performance of investment-grade and speculative-grade convertibles differed over time?
6. Characteristics of the Global Convertible Market How large is the global convertible market? What is the regional composition of the global convertible market? What are the credit characteristics of the convertible market? How frequently have there been defaults in the U.S. convertible bond market?
7. Convertibles and Asset Allocation In what ways can convertibles be used within asset allocations? Why do convertibles require active management? How should convertibles be managed within a core/strategic allocation? How can convertibles be incorporated as tactical allocations? What are the potential limitations of a convertible allocation invested exclusively in investment-grade credits?
3
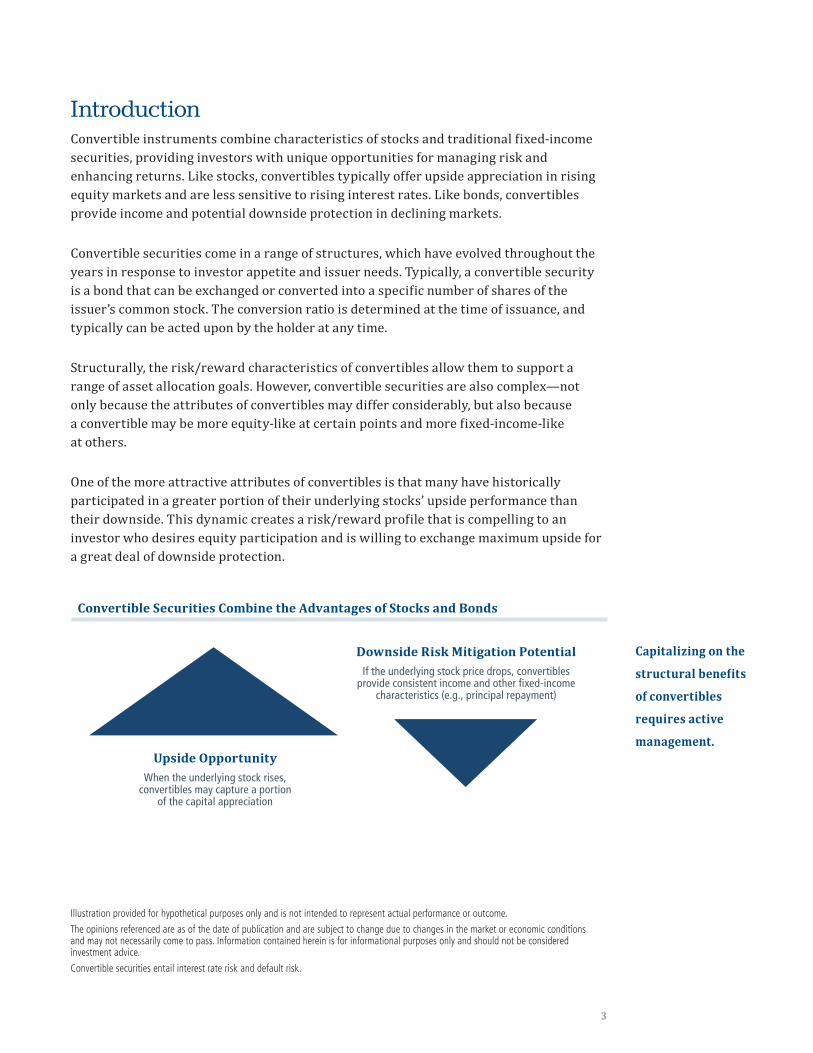
IntroductionConvertible instruments combine characteristics of stocks and traditional fixed-income securities, providing investors with unique opportunities for managing risk and enhancing returns. Like stocks, convertibles typically offer upside appreciation in rising equity markets and are less sensitive to rising interest rates. Like bonds, convertibles provide income and potential downside protection in declining markets.
Convertible securities come in a range of structures, which have evolved throughout the years in response to investor appetite and issuer needs. Typically, a convertible security is a bond that can be exchanged or converted into a specific number of shares of the issuer’s common stock. The conversion ratio is determined at the time of issuance, and typically can be acted upon by the holder at any time.
Structurally, the risk/reward characteristics of convertibles allow them to support a range of asset allocation goals. However, convertible securities are also complex—not only because the attributes of convertibles may differ considerably, but also because a convertible may be more equity-like at certain points and more fixed-income-like at others.
One of the more attractive attributes of convertibles is that many have historically participated in a greater portion of their underlying stocks’ upside performance than their downside. This dynamic creates a risk/reward profile that is compelling to an investor who desires equity participation and is willing to exchange maximum upside for a great deal of downside protection.
Illustration provided for hypothetical purposes only and is not intended to represent actual performance or outcome.
The opinions referenced are as of the date of publication and are subject to change due to changes in the market or economic conditions and may not necessarily come to pass. Information contained herein is for informational purposes only and should not be considered investment advice.
Convertible securities entail interest rate risk and default risk.
Upside OpportunityWhen the underlying stock rises,
convertibles may capture a portion of the capital appreciation
Downside Risk Mitigation PotentialIf the underlying stock price drops, convertibles
provide consistent income and other fixed-income characteristics (e.g., principal repayment)
Convertible Securities Combine the Advantages of Stocks and Bonds
Capitalizing on the
structural benefits
of convertibles
requires active
management.
4 CONVERTIBLE SECURITIES: STRUCTURES, VALUATION, MARKET ENVIRONMENT, AND ASSET ALLOCATION
1. Introduction to Convertible Securities
What is a convertible bond? A convertible bond is a regular corporate bond that has the added feature of being convertible into a fixed number of shares of common stock. Convertible bonds are debt instruments because they pay interest and have a fixed maturity date.
The issuing company guarantees to pay the specified coupon interest, usually semiannually, and the par value, usually $1,000 per bond, upon maturity. Currently, the typical convertible bond has a maturity of five years. Historically, maturities were longer (most often, 10 years). In the 1990s we saw issuers begin to adopt the shorter maturity structure with increasing frequency, a trend that gathered steam in the 2000s. The shorter maturity allows issuers to provide a lower coupon. Conversion terms and conditions are defined by the issuing corporation at issuance, and may vary significantly among issues.
Like non-convertible bonds, a corporation’s failure to pay interest or principal when due results in the first step toward company bankruptcy. Therefore convertible bonds share with non-convertible bonds the feature that bond investors consider most precious: principal protection.
However, the conversion feature completely changes the investment characteristics of the convertible bond versus non-convertible debt. Because of the conversion feature, the convertible is sensitive to the movements of its underlying equity. This equity sensitivity provides the opportunity for the convertible to participate in the movements of the stock price—either upward or downward. Ideally, of course these moves are upward. In exchange for this convertible “equity-kicker,” convertible securities typically yield 300 to 400 basis points less than the issuer’s comparable non-convertible bond.
What is a convertible preferred stock? Convertible preferred stock, like non-convertible preferred stock, is a class of the corporation’s capital stock. Convertible preferred stocks have characteristics very similar to those of convertible bonds. The holder of a convertible preferred stock has the right to convert to a specified number of shares of the underlying common stock at any time. The relationship between changes in the stock price and the convertible price is the same for both convertible bonds and convertible preferred stocks. The convertible preferred stock has a specified dividend rate that is declared by the board of directors, usually quarterly. After the call protection expires, the company has the option of redeeming the issue at the stated par value or call price. Although the convertible preferred stock does not have a maturity date, it does grant the preference on earnings over that of the common stockholder. Also, preferred stocks are usually cumulative—the convertible preferred dividend will accumulate in arrears should the corporation be unable to make the payment.
5
Convertible preferred shareholders often have the added protection of participating on the board of directors should any interest payments be missed. Warren Buffet’s use of convertible preferreds has allowed him to be active in the management of various companies when they have experienced financial distress.
While convertible preferred stock remains an important part of the convertible market, the size of this segment of the market has diminished, due to investor preference for shorter-dated structures and the greater downside protection afforded by convertible bonds.
What is a mandatory convertible? Mandatory convertibles have enhanced equity characteristics. The first mandatory convertibles were issued in 1991 and have continued to represent a meaningful segment of the convertible market. Mandatory issuance has fluctuated as a percent of overall issuance, was particularly robust during certain years of the 2000s, and dipped during the financial crisis, as investors were less interested in these more equity-sensitive issues. Mandatory issuance has been more robust in recent years, supported in part by companies that have chosen the mandatory structure to raise capital for M&A activities. Mandatory convertibles will automatically be converted to stock at a specific time, unlike normal convertible securities, which the holder has the right to convert at any time. The holder of a typical convertible may also choose never to convert but to retain the fixed-income vehicle, whether as a bond or a preferred stock. This provides downside protection for the investor if the stock does not perform as expected. Securities with a mandatory conversion do not have this important feature and therefore have the same downside risk as the underlying common stock except for the yield advantage. Therefore, the yield advantage could in itself be an important reason for the investor to purchase the security.
Companies may choose to issue mandatory convertibles because ratings agencies view these as equities. In contrast, when a company issues a convertible bond, the ratings agencies treat the issuance as debt on the company’s balance sheet.
What are exchangeable convertible bonds and exchangeable convertible preferred stocks?Exchangeable convertible bonds are those that are issued by one company but convertible into the stock of another company. Exchangeable securities may be an attractive option for corporations that have acquired a large block of another company’s stock and those with spin-offs. The market for these securities is larger outside the U.S., where we are more likely to see corporations owning other companies, and instances of companies holding pieces of each other. Exchangeable convertible bonds may entail more complexities, requiring added research.
Exchangeable convertible preferred stock provides a company with the flexibility to exchange into convertible bonds. The company may issue the preferreds when it would not be able to take on more debt without jeopardizing its credit rating.
6 CONVERTIBLE SECURITIES: STRUCTURES, VALUATION, MARKET ENVIRONMENT, AND ASSET ALLOCATION
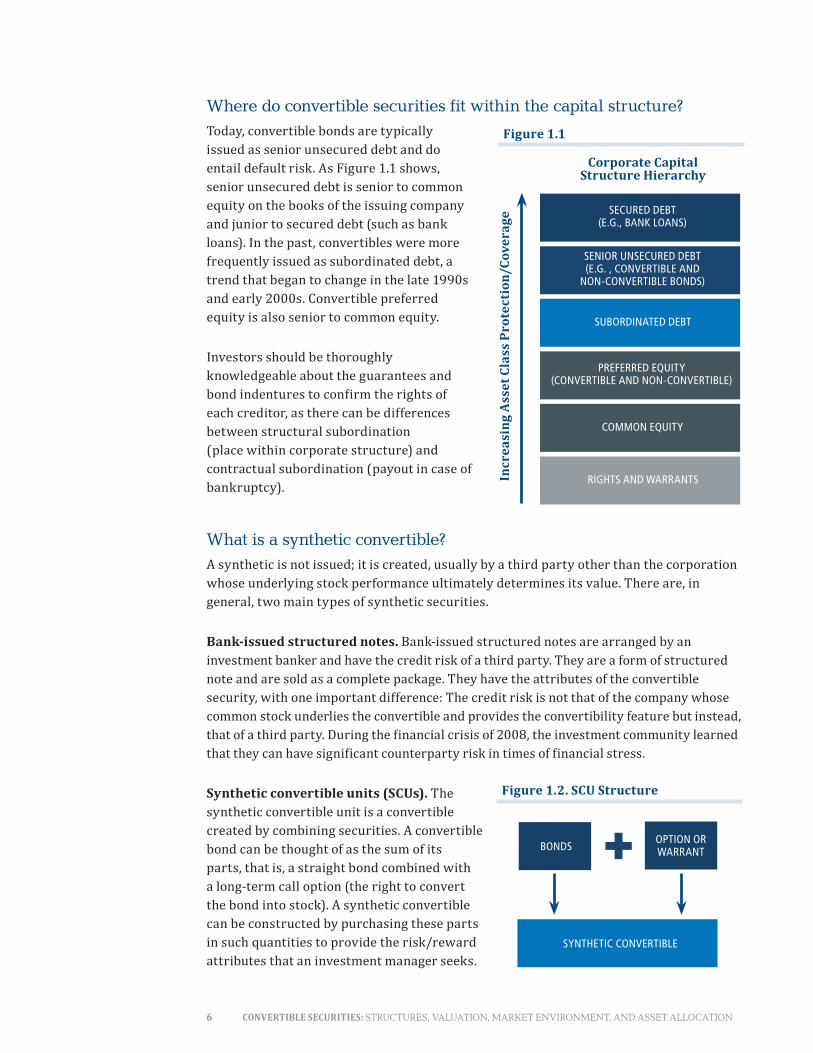
Where do convertible securities fit within the capital structure?Today, convertible bonds are typically issued as senior unsecured debt and do entail default risk. As Figure 1.1 shows, senior unsecured debt is senior to common equity on the books of the issuing company and junior to secured debt (such as bank loans). In the past, convertibles were more frequently issued as subordinated debt, a trend that began to change in the late 1990s and early 2000s. Convertible preferred equity is also senior to common equity.
Investors should be thoroughly knowledgeable about the guarantees and bond indentures to confirm the rights of each creditor, as there can be differences between structural subordination (place within corporate structure) and contractual subordination (payout in case of bankruptcy).
What is a synthetic convertible? A synthetic is not issued; it is created, usually by a third party other than the corporation whose underlying stock performance ultimately determines its value. There are, in general, two main types of synthetic securities.
Bank-issued structured notes. Bank-issued structured notes are arranged by an investment banker and have the credit risk of a third party. They are a form of structured note and are sold as a complete package. They have the attributes of the convertible security, with one important difference: The credit risk is not that of the company whose common stock underlies the convertible and provides the convertibility feature but instead, that of a third party. During the financial crisis of 2008, the investment community learned that they can have significant counterparty risk in times of financial stress.
Synthetic convertible units (SCUs). The synthetic convertible unit is a convertible created by combining securities. A convertible bond can be thought of as the sum of its parts, that is, a straight bond combined with a long-term call option (the right to convert the bond into stock). A synthetic convertible can be constructed by purchasing these parts in such quantities to provide the risk/reward attributes that an investment manager seeks.
Corporate Capital Structure Hierarchy
Incr
easi
ng A
sset
Cla
ss P
rote
ctio
n/Co
vera
ge
SECURED DEBT (E.G., BANK LOANS)
SENIOR UNSECURED DEBT (E.G. , CONVERTIBLE AND
NON-CONVERTIBLE BONDS)
SUBORDINATED DEBT
PREFERRED EQUITY (CONVERTIBLE AND NON-CONVERTIBLE)
COMMON EQUITY
RIGHTS AND WARRANTS
Figure 1.1
BONDSOPTION OR WARRANT
SYNTHETIC CONVERTIBLE
Figure 1.2. SCU Structure
7
This allows the manager to synthetically create a convertible security for a company that may not have any convertible or even non-convertible debt outstanding. The bond component could be a credit instrument of any kind, including a Treasury bond, sovereign debt or a straight corporate bond. The synthetic convertible is created when this credit instrument is combined with a long-term call option such as long-term equity anticipation securities (LEAPS) or warrants.
Although SCUs may provide a number of advantages, including opportunities for customization, diversification, and potential yield enhancement, they are quite complicated to use and are not a likely choice for an individual investor who might not have the financial background necessary to construct a synthetic, and more importantly, monitor it closely. They are more appropriate for professional money managers who use them within a portfolio. They are most effectively used as risk-control adjuncts to a larger portfolio rather than as single investments.
2. Factors Driving Convertible Issuance
Why do companies issue convertibles? Companies issue convertibles for a variety of reasons. Convertibles are typically offered with a lower coupon than comparable non-convertible debt, so a company would be paying out less in interest payments. Companies may also favor convertible bonds because the call feature provides a ready means of shifting debt to equity. For companies that require capital to maintain their growth agenda, convertibles offer a means to control the debt/equity ratio. As the stock price increases, convertibles are called, thus converting debt to equity and cleaning up the balance sheet. Another convertible can then be issued to satisfy the need for additional capital.
Announcing any type of financing may often cause a decline in the stock price. However, the announcement of a convertible offering typically influences the stock price less than other alternatives, adding another benefit to companies considering issuance. Also, convertible debt often alleviates the negative impact of adding a large additional supply of common stock to the market at the same time.
Convertible financing is particularly attractive for growth companies, which are known for their appetite for capital. Even if income is rising, many growth companies have negative cash flows because the investments required to finance sales growth typically exceed current net operating cash flows. For such companies, it is crucial to their stock price that they have access to capital.
Moreover, issuers typically bring convertibles to market quickly by going directly to institutional investors, and this disintermediation may provide a strong incentive versus other forms of financing with lengthier IPO windows.
8 CONVERTIBLE SECURITIES: STRUCTURES, VALUATION, MARKET ENVIRONMENT, AND ASSET ALLOCATION
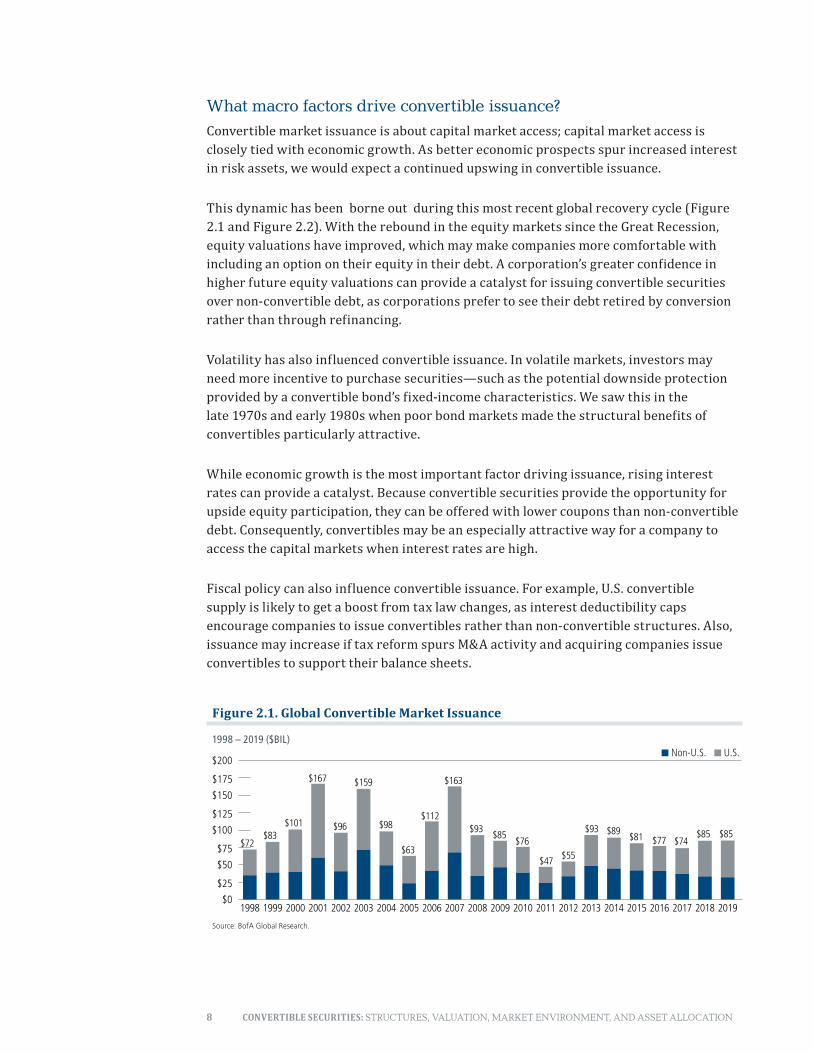
What macro factors drive convertible issuance?Convertible market issuance is about capital market access; capital market access is closely tied with economic growth. As better economic prospects spur increased interest in risk assets, we would expect a continued upswing in convertible issuance.
This dynamic has been borne out during this most recent global recovery cycle (Figure 2.1 and Figure 2.2). With the rebound in the equity markets since the Great Recession, equity valuations have improved, which may make companies more comfortable with including an option on their equity in their debt. A corporation’s greater confidence in higher future equity valuations can provide a catalyst for issuing convertible securities over non-convertible debt, as corporations prefer to see their debt retired by conversion rather than through refinancing.
Volatility has also influenced convertible issuance. In volatile markets, investors may need more incentive to purchase securities—such as the potential downside protection provided by a convertible bond’s fixed-income characteristics. We saw this in the late 1970s and early 1980s when poor bond markets made the structural benefits of convertibles particularly attractive.
While economic growth is the most important factor driving issuance, rising interest rates can provide a catalyst. Because convertible securities provide the opportunity for upside equity participation, they can be offered with lower coupons than non-convertible debt. Consequently, convertibles may be an especially attractive way for a company to access the capital markets when interest rates are high.
Fiscal policy can also influence convertible issuance. For example, U.S. convertible supply is likely to get a boost from tax law changes, as interest deductibility caps encourage companies to issue convertibles rather than non-convertible structures. Also, issuance may increase if tax reform spurs M&A activity and acquiring companies issue convertibles to support their balance sheets.
Figure 2.1. Global Convertible Market Issuance
1998 – 2019 ($BIL)
$0
$25
$50
$75
$100
$125
$150
$175
$200
2019201820172016201520142013201220112010200920082007200620052004200320022001200019991998
Non-U.S. U.S.
$72$83
$101
$167
$96
$159
$98
$63
$112
$163
$93$85
$76
$47 $55
$93 $89$81 $77 $74
$85 $85
Source: BofA Global Research.
9
3. A History of the Convertible Market
When did companies first issue convertible bonds? The first convertibles were issued in the nineteenth century, when the United States was what we would now classify as an emerging market. Gaining access to capital in a rapidly growing country often proved challenging. The convertible clause was first added to mortgage bonds to entice investors to finance the building of railroads. Soon, other companies were also participating in the asset class, including those involved in steel manufacturing, distilling, steam pumps, gas pumps, the telephone and the telegraph.
What were some of the key trends in the convertible market in the twentieth century? By the 1950s, many growth companies had begun issuing convertibles. Although interest rates were relatively low in this favorable economic environment, the “equity kicker” allowed companies to sell these fixed-income securities with lower yields. In the bull market of the 1960s, many companies issued convertibles, as mergers-and-acquisitions became the means to create the megaconglomerates of the time. Many small- and mid-sized companies also issued convertibles as the economy expanded.
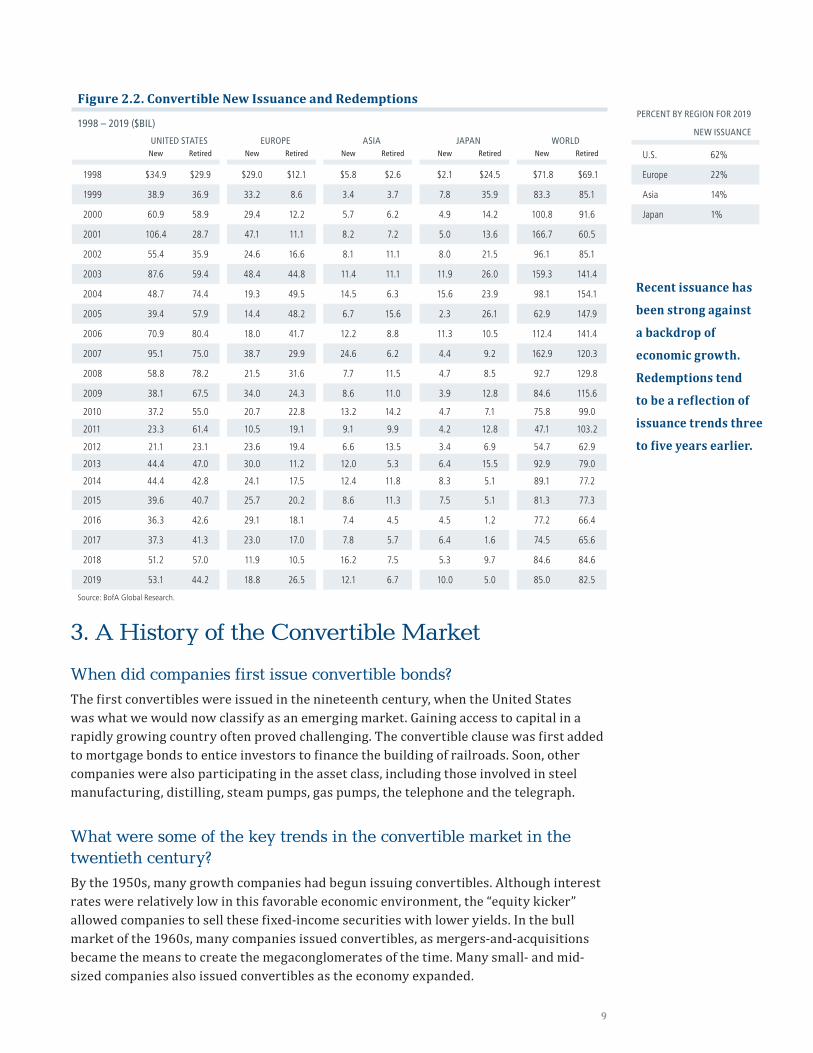
UNITED STATES EUROPE ASIA JAPAN WORLDNew Retired New Retired New Retired New Retired New Retired
1998 $34.9 $29.9 $29.0 $12.1 $5.8 $2.6 $2.1 $24.5 $71.8 $69.1
1999 38.9 36.9 33.2 8.6 3.4 3.7 7.8 35.9 83.3 85.1
2000 60.9 58.9 29.4 12.2 5.7 6.2 4.9 14.2 100.8 91.6
2001 106.4 28.7 47.1 11.1 8.2 7.2 5.0 13.6 166.7 60.5
2002 55.4 35.9 24.6 16.6 8.1 11.1 8.0 21.5 96.1 85.1
2003 87.6 59.4 48.4 44.8 11.4 11.1 11.9 26.0 159.3 141.4
2004 48.7 74.4 19.3 49.5 14.5 6.3 15.6 23.9 98.1 154.1
2005 39.4 57.9 14.4 48.2 6.7 15.6 2.3 26.1 62.9 147.9
2006 70.9 80.4 18.0 41.7 12.2 8.8 11.3 10.5 112.4 141.4
2007 95.1 75.0 38.7 29.9 24.6 6.2 4.4 9.2 162.9 120.3
2008 58.8 78.2 21.5 31.6 7.7 11.5 4.7 8.5 92.7 129.8
2009 38.1 67.5 34.0 24.3 8.6 11.0 3.9 12.8 84.6 115.6
2010 37.2 55.0 20.7 22.8 13.2 14.2 4.7 7.1 75.8 99.0
2011 23.3 61.4 10.5 19.1 9.1 9.9 4.2 12.8 47.1 103.2
2012 21.1 23.1 23.6 19.4 6.6 13.5 3.4 6.9 54.7 62.9
2013 44.4 47.0 30.0 11.2 12.0 5.3 6.4 15.5 92.9 79.0
2014 44.4 42.8 24.1 17.5 12.4 11.8 8.3 5.1 89.1 77.2
2015 39.6 40.7 25.7 20.2 8.6 11.3 7.5 5.1 81.3 77.3
2016 36.3 42.6 29.1 18.1 7.4 4.5 4.5 1.2 77.2 66.4
2017 37.3 41.3 23.0 17.0 7.8 5.7 6.4 1.6 74.5 65.6
2018 51.2 57.0 11.9 10.5 16.2 7.5 5.3 9.7 84.6 84.6
2019 53.1 44.2 18.8 26.5 12.1 6.7 10.0 5.0 85.0 82.5
Source: BofA Global Research.
Figure 2.2. Convertible New Issuance and Redemptions
1998 – 2019 ($BIL)
Recent issuance has
been strong against
a backdrop of
economic growth.
Redemptions tend
to be a reflection of
issuance trends three
to five years earlier.
PERCENT BY REGION FOR 2019
NEW ISSUANCE
U.S. 62%
Europe 22%
Asia 14%
Japan 1%
10 CONVERTIBLE SECURITIES: STRUCTURES, VALUATION, MARKET ENVIRONMENT, AND ASSET ALLOCATION
The 1980s saw the United States in the midst of one of the greatest periods of corporate creation and corporate restructuring. There were large increases in all types of debt financing, including convertibles. Household-name growth companies financed much of their dramatic growth by issuing convertible bonds; for many of these companies, the convertibles were issued at a time when their ratings were below investment grade. However, in the mid-1980s, large investment-grade companies also turned to the convertible market. Interest rates were high at the time, and investors believed that equity prices were undervalued. Since convertible debt can be issued at rates that are slightly lower than those of regular corporate debt, issuing convertible securities allowed companies to lower their fixed-income costs.
The private placement market also expanded markedly during the 1980s. Previously, private placement convertibles had been used extensively in the venture capital market with small issues that were not very liquid. The introduction of Rule 144a in 1990 created the institutional private placement market. 144a private placements can be brought to market quickly without the voluminous disclosure that a public offering requires. These companies are typically already well known to the institutional buyers, so underwriting costs can be significantly reduced through the use of 144a private placements.
In the 1990s, Wall Street innovation adapted the classic convertible bond, producing new types of securities with acronyms such as MIPS, DECS, ELKS, PERCS, and PRIDES. These securities also expanded the size of the convertible market, and provided investors with additional opportunities to select more tailored securities.
By the 1990s, the convertible market had become a truly global asset class (see Figure 6.1). As we discussed in Section 2, convertible issuance is fueled by economic expansion. During the 1980s and 1990s, one of the most important trends in the global convertible market was the growth of the Japanese convertible market. Against a backdrop of robust economic growth and strong equity market performance, Japan became the largest issuer of convertibles. A number of European countries also had advanced convertible markets, including the United Kingdom, France, Australia, Canada, Sweden and Switzerland. The attributes of each of these markets varied, based on investor and issuer preferences, as well as regulatory considerations.
How has the convertible market evolved in the twenty-first century?The convertible market has continued to evolve in response to a range of factors, including investor demand, issuer needs, and market influences. More recently, the 2000s saw contingent convertible bonds rise in popularity. These “cocos” were convertible into common stock after the stock price had risen to a level wherein the bond was well into the money, providing companies with a mechanism to issue convertibles and manage the dilution in earnings per share.
11
In recent years, we have also seen an increase in contingent convertible bonds, particularly within the European financial sector. These are also called “cocos,” but differ significantly from the cocos of the 2000s. Banks issue cocos to address regulatory requirements for capital reserves. However, should the issuer come under financial distress, this newer breed of coco converts into equity or may even be completely wiped out. As a result, this newer breed of coco lacks the downside protection associated with a traditional convertible security.
Securities with variable conversion ratios represent another innovation in the convertible market. A corporation will issue a convertible and pair it with additional warrants with the same strike price as the conversion price. These extra warrants allow the corporation to issue the bond at a higher premium.
From a regional standpoint, today’s convertible market provides investors with a breadth of choices (Figure 2.2). We are also encouraged by trends in emerging markets, particularly emerging Asia and believe emerging markets will play an increasingly important role in the evolution of the global convertible market. (In Section 6, we discuss the composition of the global convertible market at greater length.)
4. Valuing a Convertible BondThe convertible bond has three main parts: its value as a straight bond, called the investment value; its value as a stock, called the conversion value; and the theoretical fair value. The investor must dissect the convertible security to understand the valuation process. The three factors are interdependent, and each must be considered for a proper valuation of a convertible security. In this section, we begin the process of evaluating convertibles by dissecting the convertible bond into its various parts.
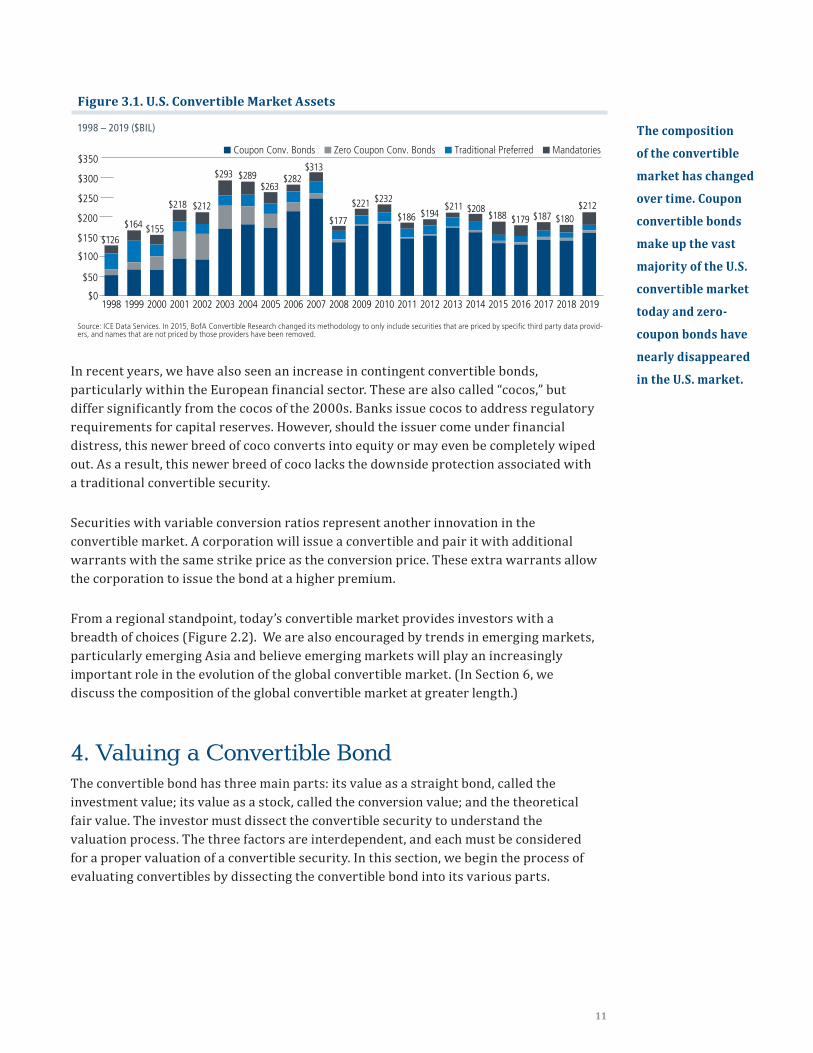
The composition
of the convertible
market has changed
over time. Coupon
convertible bonds
make up the vast
majority of the U.S.
convertible market
today and zero-
coupon bonds have
nearly disappeared
in the U.S. market.
Figure 3.1. U.S. Convertible Market Assets
1998 – 2019 ($BIL)
Source: ICE Data Services. In 2015, BofA Convertible Research changed its methodology to only include securities that are priced by specific third party data provid-ers, and names that are not priced by those providers have been removed.
$0
$50
$100
$150
$200
$250
$300
$350
2019201820172016201520142013201220112010200920082007200620052004200320022001200019991998
Coupon Conv. Bonds Zero Coupon Conv. Bonds
$126
$164 $155
$218 $212
$293 $289$263
$282$313
$177
$221 $232
$186 $194$211 $208
$188
Traditional Preferred Mandatories
$179 $187 $180$212
12 CONVERTIBLE SECURITIES: STRUCTURES, VALUATION, MARKET ENVIRONMENT, AND ASSET ALLOCATION
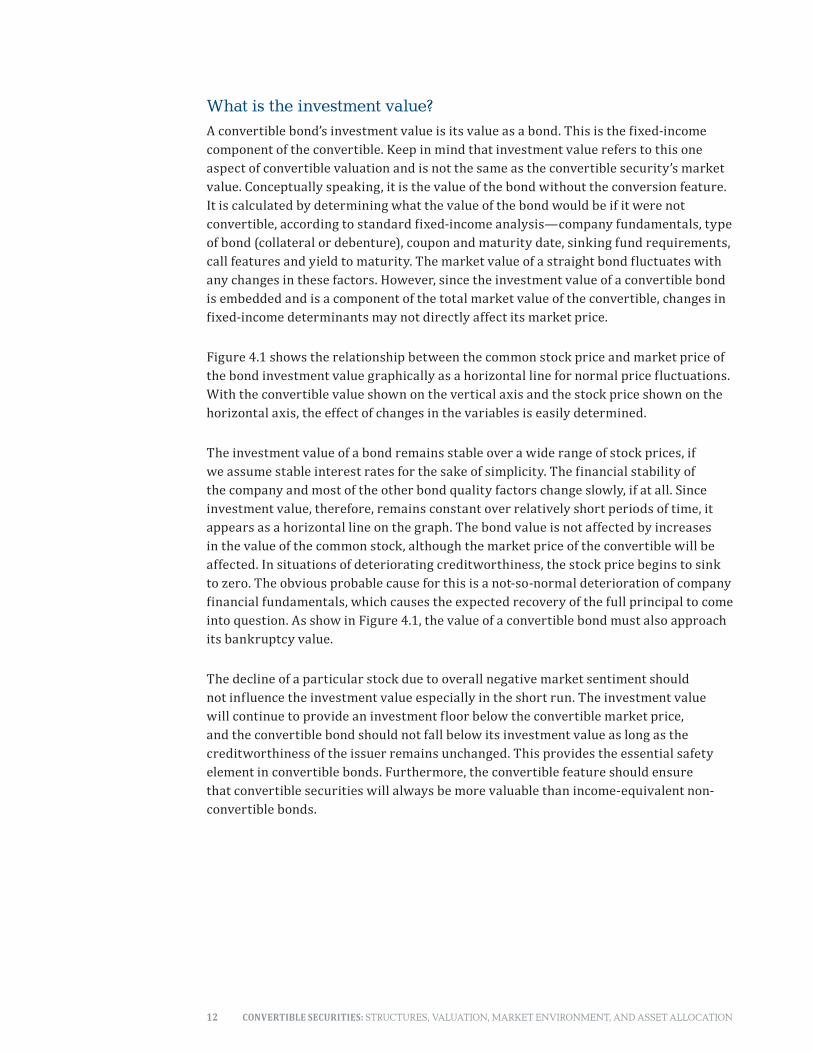
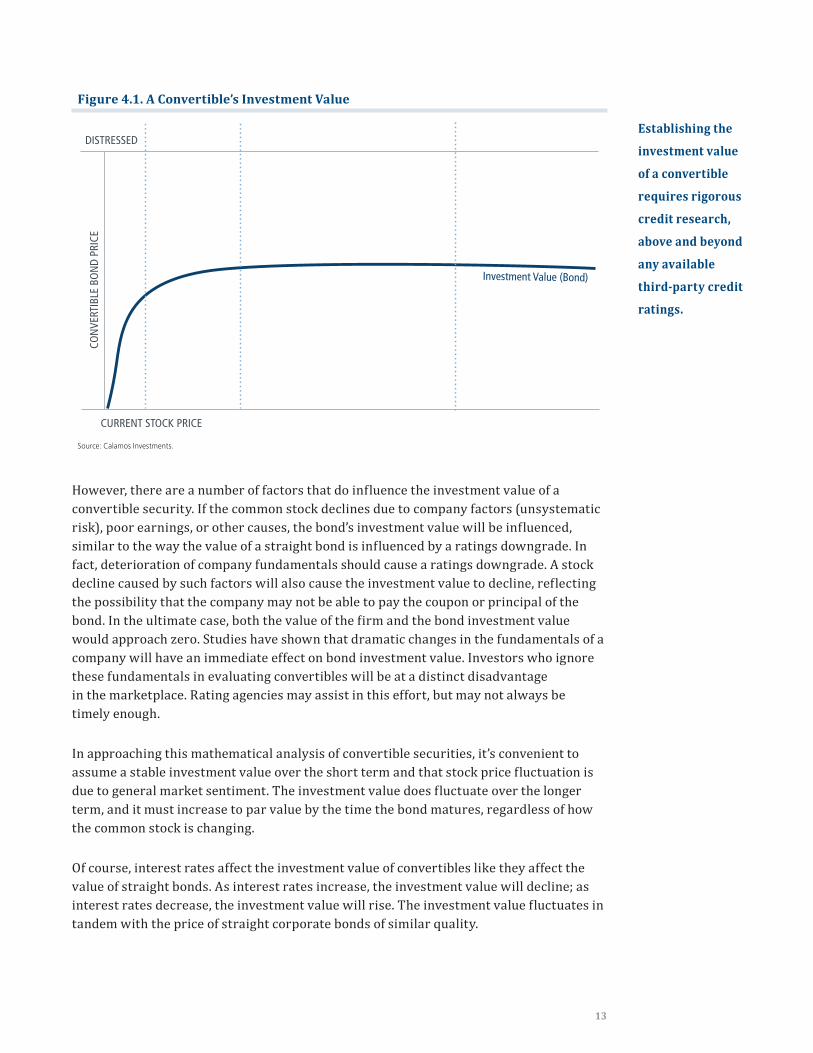
What is the investment value? A convertible bond’s investment value is its value as a bond. This is the fixed-income component of the convertible. Keep in mind that investment value refers to this one aspect of convertible valuation and is not the same as the convertible security’s market value. Conceptually speaking, it is the value of the bond without the conversion feature. It is calculated by determining what the value of the bond would be if it were not convertible, according to standard fixed-income analysis—company fundamentals, type of bond (collateral or debenture), coupon and maturity date, sinking fund requirements, call features and yield to maturity. The market value of a straight bond fluctuates with any changes in these factors. However, since the investment value of a convertible bond is embedded and is a component of the total market value of the convertible, changes in fixed-income determinants may not directly affect its market price.
Figure 4.1 shows the relationship between the common stock price and market price of the bond investment value graphically as a horizontal line for normal price fluctuations. With the convertible value shown on the vertical axis and the stock price shown on the horizontal axis, the effect of changes in the variables is easily determined.
The investment value of a bond remains stable over a wide range of stock prices, if we assume stable interest rates for the sake of simplicity. The financial stability of the company and most of the other bond quality factors change slowly, if at all. Since investment value, therefore, remains constant over relatively short periods of time, it appears as a horizontal line on the graph. The bond value is not affected by increases in the value of the common stock, although the market price of the convertible will be affected. In situations of deteriorating creditworthiness, the stock price begins to sink to zero. The obvious probable cause for this is a not-so-normal deterioration of company financial fundamentals, which causes the expected recovery of the full principal to come into question. As show in Figure 4.1, the value of a convertible bond must also approach its bankruptcy value.
The decline of a particular stock due to overall negative market sentiment should not influence the investment value especially in the short run. The investment value will continue to provide an investment floor below the convertible market price, and the convertible bond should not fall below its investment value as long as the creditworthiness of the issuer remains unchanged. This provides the essential safety element in convertible bonds. Furthermore, the convertible feature should ensure that convertible securities will always be more valuable than income-equivalent non-convertible bonds.
13
However, there are a number of factors that do influence the investment value of a convertible security. If the common stock declines due to company factors (unsystematic risk), poor earnings, or other causes, the bond’s investment value will be influenced, similar to the way the value of a straight bond is influenced by a ratings downgrade. In fact, deterioration of company fundamentals should cause a ratings downgrade. A stock decline caused by such factors will also cause the investment value to decline, reflecting the possibility that the company may not be able to pay the coupon or principal of the bond. In the ultimate case, both the value of the firm and the bond investment value would approach zero. Studies have shown that dramatic changes in the fundamentals of a company will have an immediate effect on bond investment value. Investors who ignore these fundamentals in evaluating convertibles will be at a distinct disadvantage in the marketplace. Rating agencies may assist in this effort, but may not always be timely enough.
In approaching this mathematical analysis of convertible securities, it’s convenient to assume a stable investment value over the short term and that stock price fluctuation is due to general market sentiment. The investment value does fluctuate over the longer term, and it must increase to par value by the time the bond matures, regardless of how the common stock is changing.
Of course, interest rates affect the investment value of convertibles like they affect the value of straight bonds. As interest rates increase, the investment value will decline; as interest rates decrease, the investment value will rise. The investment value fluctuates in tandem with the price of straight corporate bonds of similar quality.
Figure 4.1. A Convertible’s Investment Value
Source: Calamos Investments.
CON
VERT
IBLE
BO
ND
PRIC
E
CURRENT STOCK PRICE
Conversion Value (Stock) Investment Value (Bond)
Convertible Fair Value Price Track
CON
VERT
IBLE
BO
ND
PRIC
E
CURRENT STOCK PRICE
Conversion Value (Stock) Investment Value (Bond)
DISTRESSED
CON
VERT
IBLE
BO
ND
PRIC
E
CURRENT STOCK PRICE
Investment Value (Bond)
DISTRESSED
DISTRESSED
Establishing the
investment value
of a convertible
requires rigorous
credit research,
above and beyond
any available
third-party credit
ratings.
14 CONVERTIBLE SECURITIES: STRUCTURES, VALUATION, MARKET ENVIRONMENT, AND ASSET ALLOCATION
However, due to the unique nature of convertibles, a change in the investment value of the convertible bond may not necessarily mean a change in the market price. The investment value may fluctuate, but the market price of the convertible bond remains relatively stable because changes in interest rates are just one of many factors that may be affecting the market price at any given moment. A bond that is trading close to its investment value will be relatively more affected by changes in interest rates than one that is trading close to its conversion value and well above its investment value. If the underlying stock is increasing in value as interest rates are rising, the convertible bond will be driven by its equity component rather than by its fixed-income component and will increase in value.
It is important to recognize that the investment value of a convertible bond at issuance is rarely near par. The convertible bond is not discounted at its coupon rate, but rather must be discounted at a rate appropriate for the issuing company’s non-convertible debt. For example, if the company has issued a convertible with a 2% coupon and its non-convertible debt is at 5%, then the investment value of the convertible will be discounted at 5%. On a five-year bond, the investment value will be $868.72 for a bond with a $1,000 par value.
Arriving at a proper estimate of the investment floor is critically important in evaluating a convertible bond; it constitutes the minimum value below which the convertible bond should not fall, regardless of common stock fluctuations, and influences all other calculations in the mathematical analysis of convertibles. Because investment value is the hinge on which all other calculations depend, it’s important to understand how the various factors affect it.
What is the investment premium? The convertible bond’s investment premium is the difference between the convertible’s market price and its investment value, expressed as a percentage. An important measure of the basic value of the convertible is its premium over investment value. At this point, we determine the convertible’s market value by calculating the difference between the convertible’s market price and its investment value, expressed as a percentage. This value is important because it indicates the level of downside risk and can be monitored as market prices change. For example, in the case of a bond with a par value of $1,000 and an investment value of $868.72, the investment premium is ([$1,000-$868.72]/$868.72), which is equal to 15.1%.
The higher the investment premium, the more sensitive the market price of the convertible is to a decline in the underlying common stock. A high market price relative to investment value is caused by increases in the value of the underlying stock such that the convertible’s market value depends on the value of the stock. There is less downside protection because the stock would have to decrease in value by a significant amount before the market price of the convertible would approach the investment value and offer protection.
Delta is a measure
of a convertible
security’s sensitivity
to its underlying
equity, with higher
deltas indicating
greater sensitivity.
15
Similarly, when the investment premium is small, a small decrease in the value of the underlying stock would result in the market price reaching the investment value. At that time, the investment value floor provides downside protection. Furthermore, when the investment premium is small, the convertible is more interest rate sensitive rather than equity sensitive and will typically be vulnerable to changes in market interest rates.
What is the conversion price? The convertible’s conversion price is the effective price for conversion into the stock with the bond at par. At the time of issue, the offering prospectus indicates the common-stock price equivalent to the value of the bond at par. This price in turn determines the number of shares of stock into which each bond at par can be converted; this is the conversion ratio.
Confusion often arises among investors because the conversion price is specified in the bond documents, but the conversion ratio is not; it must be calculated. The conversion price is meaningful only when the bond is at par, and it can be calculated by dividing the par value by the conversion price. For example, if the common stock price at which the bond can be converted is $50, then each convertible bond represents 20 shares of stock (par value of $1,000 divided by stated conversion price of $50 = 20).
Investors often focus on the conversion price when they should be paying more attention to the conversion ratio. From the moment the bond is brought to market, it trades either above or below par value, depending on the market forces. Since the conversion rate remains the same whether the bond is at par or not, it is the more important number for investors.
What is the conversion ratio? The conversion ratio determines the number of shares of common stock a convertible bondholder would receive if the bond were converted into stock. The conversion ratio is set at the issuance of the security and is typically protected against dilution. It may well specify partial shares (i.e., 21.3 shares).
The conversion ratio is usually adjusted for stock splits and stock dividends. The initial conversion ratio in our example was 20 shares of stock per each convertible bond. The conversion ratio would be adjusted to 22 following a 10% stock dividend. Prior to 2003, convertible bondholders were rarely protected against normal cash dividends. Today, they are generally protected against normal cash dividends as well as special dividends and spin offs. (We discuss this in greater length on page 21.)
Par Value
Conversion PriceConversion Ratio
16 CONVERTIBLE SECURITIES: STRUCTURES, VALUATION, MARKET ENVIRONMENT, AND ASSET ALLOCATION
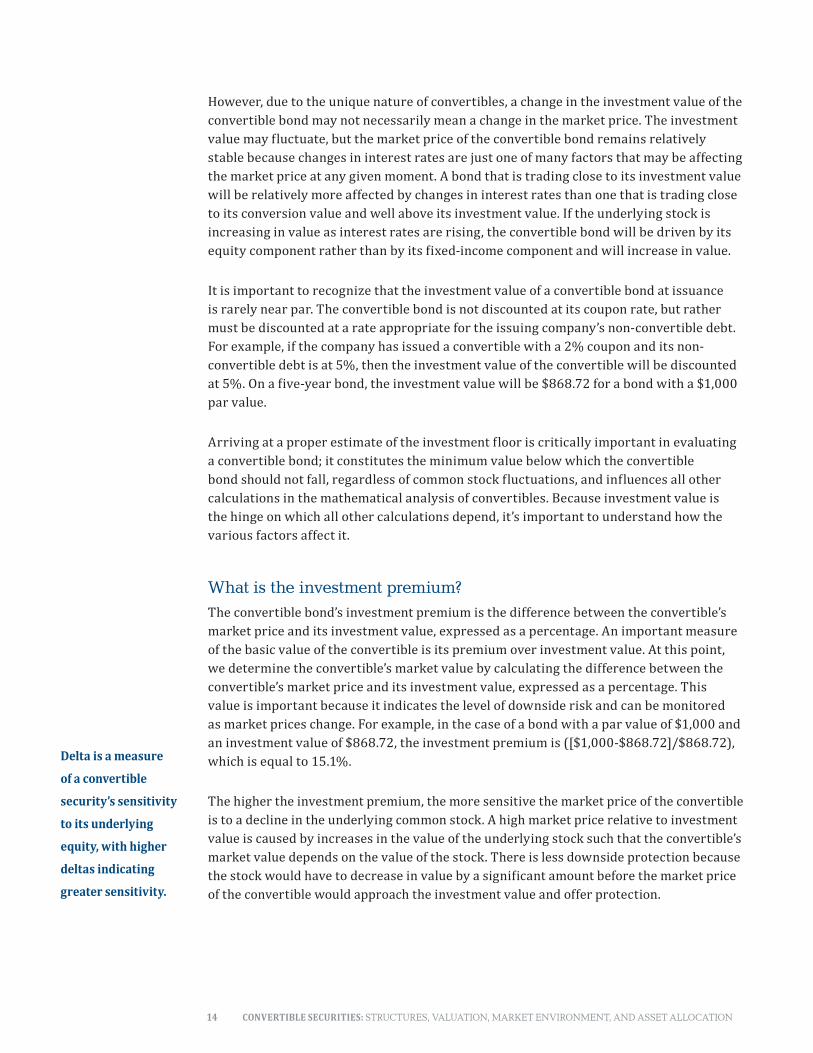
What is the conversion value? Conversion value represents the equity portion of the convertible bond. It is what the convertible bond would be worth if it were converted into common stock at current market prices. In Figure 4.2, the diagonal line indicates the conversion value. For any stock price, the conversion value is found by multiplying the given stock price times the stated number of common shares received per bond. For example, if a bond can be converted into 20 shares of stock and the stock currently sells at $42 per share, the conversion value of the convertible bond is $840. As we have said previously, the number of shares each bond can be converted into is the conversion ratio and is set at the time the bond is issued.
Like bond investment value, conversion value is a minimum value or price at which the security is expected to sell. If the market price fell below the conversion value, specialists and market makers would quickly take advantage of the situation; the arbitrageur would buy the bond and simultaneously sell an equivalent number of shares of the underlying common stock. The difference between these two values would be a risk-free profit to the arbitrageur. Because of this, conversion value, like investment value, becomes a minimum value, below which the convertible’s market price should not fall.
Figure 4.2. A Convertible’s Equity Value
Source: Calamos Investments.
CON
VERT
IBLE
BO
ND
PRIC
E
CURRENT STOCK PRICE
Conversion Value (Stock) Investment Value (Bond)
Convertible Fair Value Price Track
CON
VERT
IBLE
BO
ND
PRIC
E
CURRENT STOCK PRICE
Conversion Value (Stock) Investment Value (Bond)
DISTRESSED
CON
VERT
IBLE
BO
ND
PRIC
E
CURRENT STOCK PRICE
Investment Value (Bond)
DISTRESSED
DISTRESSED
Equity analysis is
the lynchpin for
determining
conversion value.
17
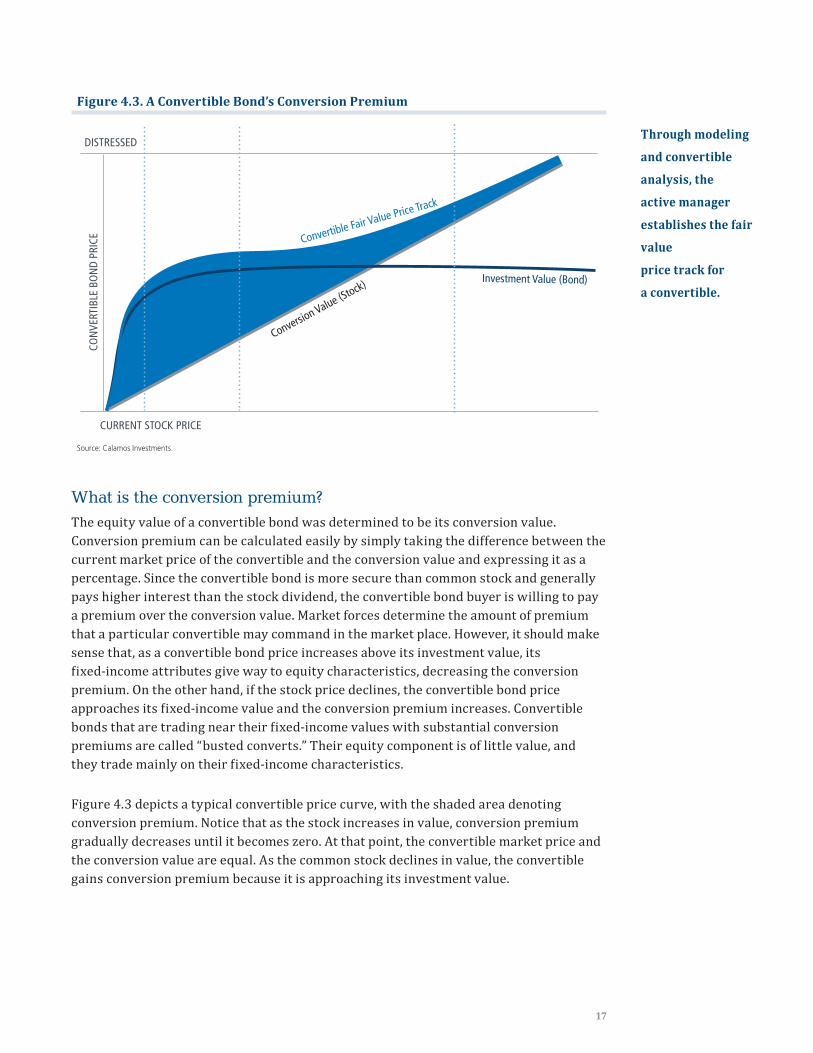
What is the conversion premium? The equity value of a convertible bond was determined to be its conversion value. Conversion premium can be calculated easily by simply taking the difference between the current market price of the convertible and the conversion value and expressing it as a percentage. Since the convertible bond is more secure than common stock and generally pays higher interest than the stock dividend, the convertible bond buyer is willing to pay a premium over the conversion value. Market forces determine the amount of premium that a particular convertible may command in the market place. However, it should make sense that, as a convertible bond price increases above its investment value, its fixed-income attributes give way to equity characteristics, decreasing the conversion premium. On the other hand, if the stock price declines, the convertible bond price approaches its fixed-income value and the conversion premium increases. Convertible bonds that are trading near their fixed-income values with substantial conversion premiums are called “busted converts.” Their equity component is of little value, and they trade mainly on their fixed-income characteristics.
Figure 4.3 depicts a typical convertible price curve, with the shaded area denoting conversion premium. Notice that as the stock increases in value, conversion premium gradually decreases until it becomes zero. At that point, the convertible market price and the conversion value are equal. As the common stock declines in value, the convertible gains conversion premium because it is approaching its investment value.
Figure 4.3. A Convertible Bond’s Conversion Premium
Source: Calamos Investments.
CON
VERT
IBLE
BO
ND
PRIC
E
CURRENT STOCK PRICE
Conversion Value (Stock) Investment Value (Bond)
Convertible Fair Value Price Track
CON
VERT
IBLE
BO
ND
PRIC
E
CURRENT STOCK PRICE
Conversion Value (Stock) Investment Value (Bond)
DISTRESSED
CON
VERT
IBLE
BO
ND
PRIC
E
CURRENT STOCK PRICE
Investment Value (Bond)
DISTRESSED
DISTRESSEDThrough modeling
and convertible
analysis, the
active manager
establishes the fair
value
price track for
a convertible.
18 CONVERTIBLE SECURITIES: STRUCTURES, VALUATION, MARKET ENVIRONMENT, AND ASSET ALLOCATION
From another perspective, the market value of the convertible should always be higher than either the conversion value or the investment value. If we were to hypothesize a convertible with a market value that exactly equaled its investment value, the investment premium would have a value of zero and the convertible would be trading as if it were a straight non-convertible bond. However, a convertible security has an implicit option, and as long as there is time remaining before the option expires—thereby providing the holder with equity potential—the option will have some value in itself.
The convertible price curve can be either an estimate of how much conversion premium a particular convertible security would command at various stock prices or a historical depiction of how a convertible has actually traded as the common stock has fluctuated over time. It is an extremely important consideration in evaluating convertible securities because it determines the upside potential versus the downside risk. Detailed mathematical formulae are needed to estimate the convertible price curve accurately. It is inadequate to rely on simple historical price relationships to properly analyze the fairness of the conversion premium level.
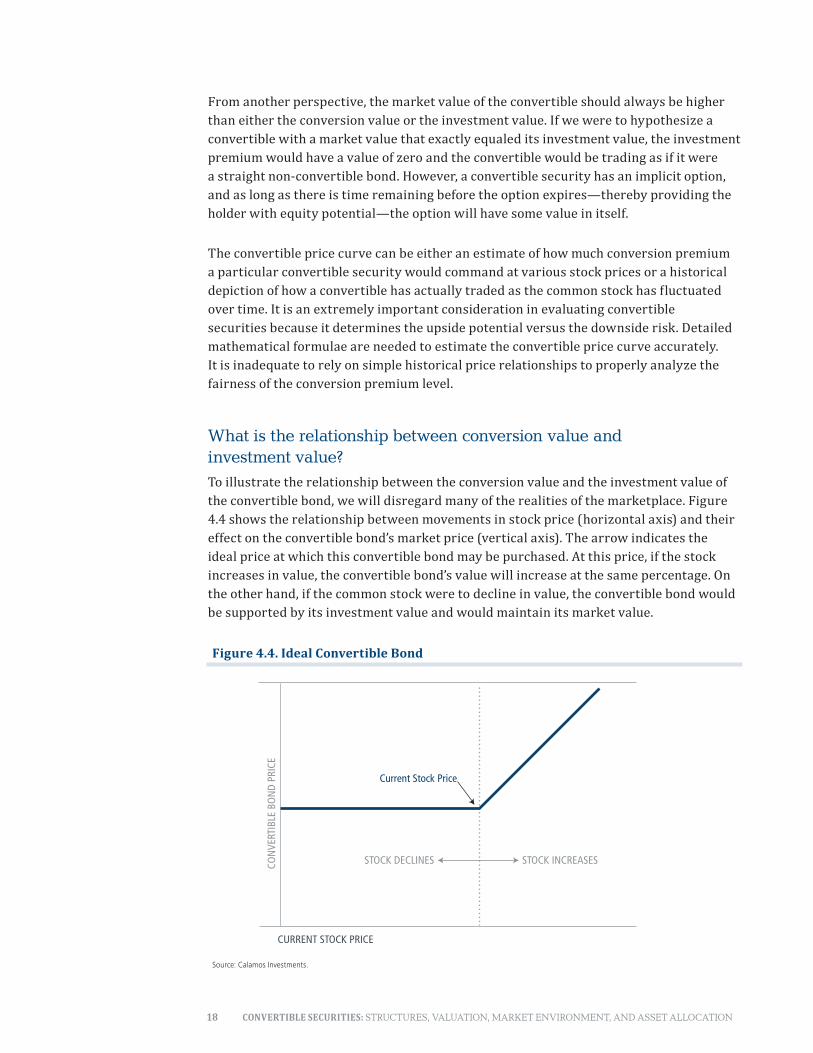
What is the relationship between conversion value and investment value? To illustrate the relationship between the conversion value and the investment value of the convertible bond, we will disregard many of the realities of the marketplace. Figure 4.4 shows the relationship between movements in stock price (horizontal axis) and their effect on the convertible bond’s market price (vertical axis). The arrow indicates the ideal price at which this convertible bond may be purchased. At this price, if the stock increases in value, the convertible bond’s value will increase at the same percentage. On the other hand, if the common stock were to decline in value, the convertible bond would be supported by its investment value and would maintain its market value.
Figure 4.4. Ideal Convertible Bond
Source: Calamos Investments.
STOCK DECLINES STOCK INCREASESCON
VERT
IBLE
BO
ND
PRIC
E
CURRENT STOCK PRICE
Current Stock Price
19
In this simplified example, when the convertible bond is priced at this ideal point, it is obviously a superior buy because it offers the same upside potential as the common stock with none of the downside risk. The real world, of course, will not allow investors such easy profit opportunities. In the financial marketplace there exists a trade-off between the safety of the bond investment value and the opportunity of the conversion value. How much an investor is willing to pay for that trade-off creates a premium above conversion value, as well as a premium above investment value, and it becomes the most complicated aspect of convertible investing. A measure of that value is the convertible security’s conversion premium.
There are two basic scenarios for holding a convertible bond. First, if the company stock does well, the convertible increases in value—and can increase greatly in value as a bond without equity conversion. Many investors who are new to convertibles don’t realize that it is not necessary to convert to the underlying common stock to realize a profit. The market price of a convertible varies with changes in the stock price, and the bond can be sold at any time. The increased value of the stock will be reflected in the market price of the convertible. Of course, the bondholder also has the option to convert the bond into stock, although that is not necessary. Conversion occurs only at the request of the holder.
Second, if the stock does not do well, the bondholder retains the bond and collects the coupon interest (which is almost always higher than the stock dividend), and par value is repaid at maturity. When the stock stays flat or falls, the bondholder still retains the investment value of the bond, which constitutes a floor value for the security; theoretically, in an adverse equity market, the bond would not decline in price as much as the underlying stock because of this investment value. Furthermore, if interest rates rise, the bond principal is protected to some extent by the convertibility feature.
Although simple in principle, convertibles can be complex to manage. The dual nature of convertibles—that is, they have characteristics of both stocks and bonds—is part of what makes them so difficult to analyze, and the evaluation process must take both parts into consideration. However, their dual nature is also what makes them so attractive as an investment.
The investor can calculate the value of both the bond and the equity portions of the convertible security, but that still doesn’t tell the entire story. The final piece of the evaluation might be the hardest: pricing the security itself. The investor must determine the bond’s theoretical fair value or normal expected price, the value at which it is fairly valued in the marketplace, taking into consideration both its bond and its equity value, as well as its call terms, volatility, and the term structure of interest rates. This theoretical fair value is then compared to the market price to determine profit opportunity and market advantage. The convertible can be over- or underpriced relative to the stock.
20 CONVERTIBLE SECURITIES: STRUCTURES, VALUATION, MARKET ENVIRONMENT, AND ASSET ALLOCATION
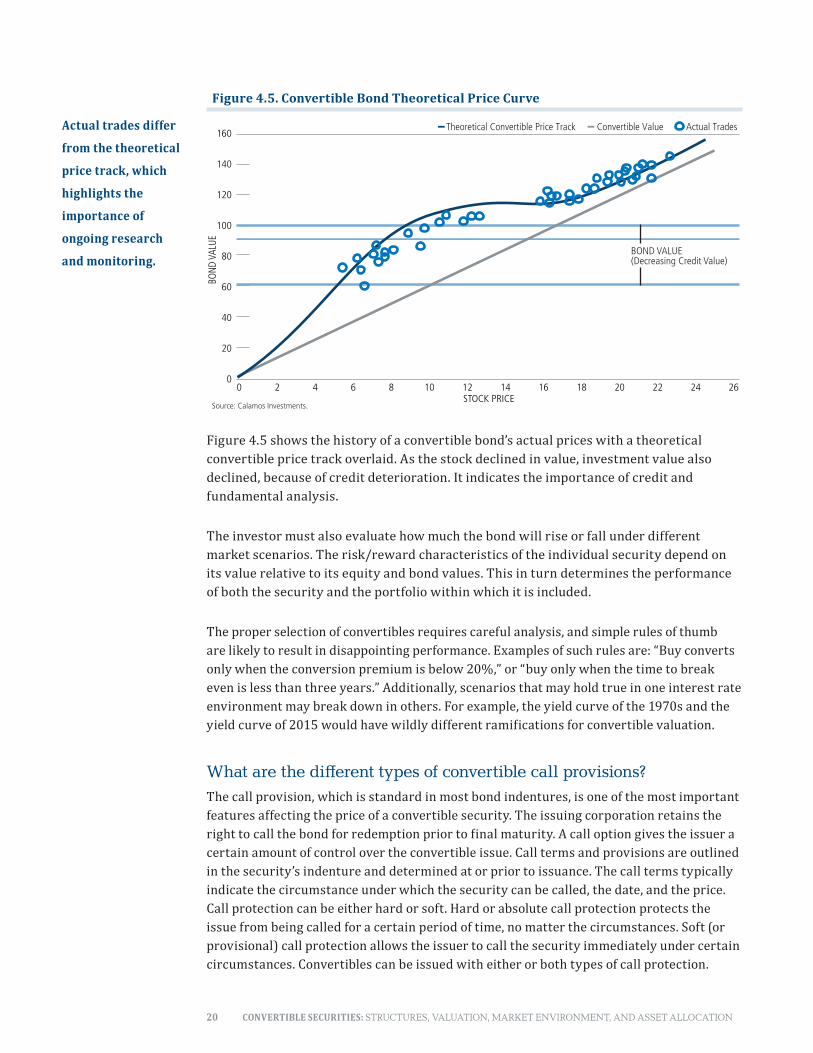
Figure 4.5 shows the history of a convertible bond’s actual prices with a theoretical convertible price track overlaid. As the stock declined in value, investment value also declined, because of credit deterioration. It indicates the importance of credit and fundamental analysis.
The investor must also evaluate how much the bond will rise or fall under different market scenarios. The risk/reward characteristics of the individual security depend on its value relative to its equity and bond values. This in turn determines the performance of both the security and the portfolio within which it is included.
The proper selection of convertibles requires careful analysis, and simple rules of thumb are likely to result in disappointing performance. Examples of such rules are: “Buy converts only when the conversion premium is below 20%,” or “buy only when the time to break even is less than three years.” Additionally, scenarios that may hold true in one interest rate environment may break down in others. For example, the yield curve of the 1970s and the yield curve of 2015 would have wildly different ramifications for convertible valuation.
What are the different types of convertible call provisions? The call provision, which is standard in most bond indentures, is one of the most important features affecting the price of a convertible security. The issuing corporation retains the right to call the bond for redemption prior to final maturity. A call option gives the issuer a certain amount of control over the convertible issue. Call terms and provisions are outlined in the security’s indenture and determined at or prior to issuance. The call terms typically indicate the circumstance under which the security can be called, the date, and the price. Call protection can be either hard or soft. Hard or absolute call protection protects the issue from being called for a certain period of time, no matter the circumstances. Soft (or provisional) call protection allows the issuer to call the security immediately under certain circumstances. Convertibles can be issued with either or both types of call protection.
Figure 4.5. Convertible Bond Theoretical Price Curve
160
140
120
100
80
60
40
20
00 2 4 6 8 10 12 14 16 18 20 22 24 26
BOND
VAL
UE
STOCK PRICE
Theoretical Convertible Price Track Convertible Value Actual Trades
BOND VALUE(Decreasing Credit Value)
Source: Calamos Investments.
Actual trades differ
from the theoretical
price track, which
highlights the
importance of
ongoing research
and monitoring.
21
When interest rates decline, issuers like to have the flexibility to be able to call an issue if they think they can refinance it more cheaply. This is true in general for all corporate bond issues. Convertible issuers have another reason for wanting a call option: calling an issue forces bondholders to convert debt into equity, which can reduce debt levels and have a beneficial effect on the balance sheet.
While a corporation’s preference is for the shortest possible call protection, giving it the maximum amount of control over the convertible bond, it is just the opposite for investors. Call protection acts to increase the value of the warrant feature of the convertible bond since it allows a longer period of time for the stock to increase in value and for the bondholder to convert the bond to the stock at a profit. While waiting for the stock to increase in value, convertibles typically provide more income than the stock. Without call protection, this income stream could be called away at any time, making the convertible much less attractive. Provisional call protection helps ensure that the investor will receive a certain level of capital gain before the issue can be called.
Before 1970, most convertibles did not have call protection. However, the tide turned when a leading technology company issued a convertible in 1970 and called the issue before it paid a single interest payment. Institutional investors were furious. Although the convertible had increased in value due to the sharp increase in the value of the common stock, many felt that the 20% premium they paid at the time of issue entitled them to at least a few interest payments. This case and others brought enough pressure on underwriters to demand call protection.
Soft call protection was introduced in 1982. This variation provided that the bond could not be called unless the underlying stock increased to a certain level for 20 or 30 consecutive trading days. This level is typically defined as 140% to 150% above the conversion price. The underlying common stock would have to increase somewhere between 60% and 100% before the call could be effected.
A variation of soft call protection, the soft call with a make-whole provision, emerged in the late 1990s and has evolved since. Such an issue becomes callable when the common stock meets a certain price, but the issuer pays a make-whole premium, such as the present value of the remaining coupons or some other compensation.
What antidilution protections do convertible bonds carry?An antidilution clause protects the convertible security holder by allowing the conversion ratio to be raised or lowered in certain situations. Historically, convertibles typically have provided protection against stock splits by proportionately adjusting the conversion ratio for the amount of a stock dividend. If a convertible had a conversion ratio of 30 shares per bond prior to a two-for-one spilt, the conversion ratio would become 60 shares per bond after the spilt. In cases of stock takeovers, convertible bond holders also have long received antidilution protection, albeit to varying degrees.
22 CONVERTIBLE SECURITIES: STRUCTURES, VALUATION, MARKET ENVIRONMENT, AND ASSET ALLOCATION
Antidilution protections have strengthened in recent decades. While convertible bondholders have long been protected against dilution resulting from stock splits and stock takeovers, it was not until relatively recently that convertible bondholders were protected from the dilutions resulting from cash dividends or cash takeovers. These enhanced protections were driven largely by one company. In 2003, a casino issued a cash dividend shortly after bringing a convertible to market, and the resulting dilution caused an uproar among the arbitrage investors who held the convertible. In the wake of this action, market participants basically forced underwriters to add protections in cases of cash dividends. Dividend protection protects the bondholder in case the issuer raises or initiates a dividend after issuing the convertible. If this happens, the issuer increases the conversion ratio to offset the increase in the dividend. This adjustment then happens for any subsequent dividends at the higher rate.
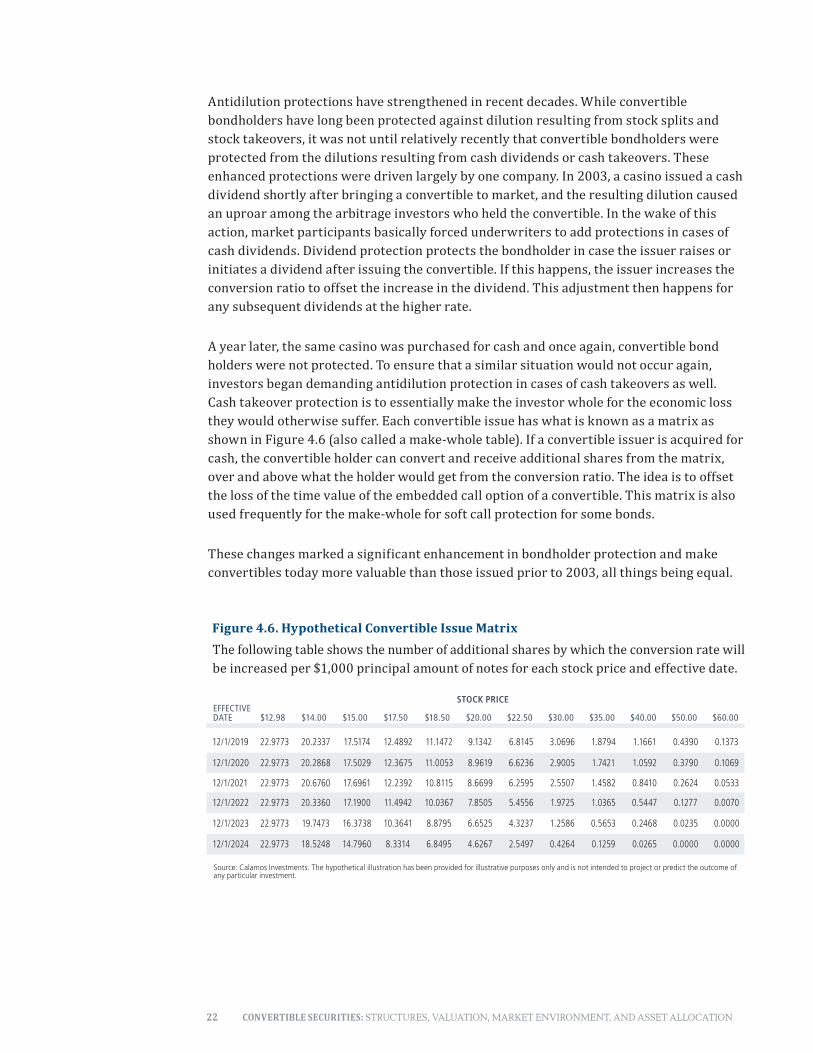
A year later, the same casino was purchased for cash and once again, convertible bond holders were not protected. To ensure that a similar situation would not occur again, investors began demanding antidilution protection in cases of cash takeovers as well. Cash takeover protection is to essentially make the investor whole for the economic loss they would otherwise suffer. Each convertible issue has what is known as a matrix as shown in Figure 4.6 (also called a make-whole table). If a convertible issuer is acquired for cash, the convertible holder can convert and receive additional shares from the matrix, over and above what the holder would get from the conversion ratio. The idea is to offset the loss of the time value of the embedded call option of a convertible. This matrix is also used frequently for the make-whole for soft call protection for some bonds.
These changes marked a significant enhancement in bondholder protection and make convertibles today more valuable than those issued prior to 2003, all things being equal.
Figure 4.6. Hypothetical Convertible Issue MatrixThe following table shows the number of additional shares by which the conversion rate will be increased per $1,000 principal amount of notes for each stock price and effective date.
STOCK PRICE
Source: Calamos Investments. The hypothetical illustration has been provided for illustrative purposes only and is not intended to project or predict the outcome of any particular investment.
EFFECTIVE DATE
$12.98
$14.00
$15.00
$17.50
$18.50
$20.00
$22.50
$30.00
$35.00
$40.00
$50.00
$60.00
12/1/2019 22.9773 20.2337 17.5174 12.4892 11.1472 9.1342 6.8145 3.0696 1.8794 1.1661 0.4390 0.1373
12/1/2020 22.9773 20.2868 17.5029 12.3675 11.0053 8.9619 6.6236 2.9005 1.7421 1.0592 0.3790 0.1069
12/1/2021 22.9773 20.6760 17.6961 12.2392 10.8115 8.6699 6.2595 2.5507 1.4582 0.8410 0.2624 0.0533
12/1/2022 22.9773 20.3360 17.1900 11.4942 10.0367 7.8505 5.4556 1.9725 1.0365 0.5447 0.1277 0.0070
12/1/2023 22.9773 19.7473 16.3738 10.3641 8.8795 6.6525 4.3237 1.2586 0.5653 0.2468 0.0235 0.0000
12/1/2024 22.9773 18.5248 14.7960 8.3314 6.8495 4.6267 2.5497 0.4264 0.1259 0.0265 0.0000 0.0000
23
ANNUAL RETURN
STANDARD DEVIATION
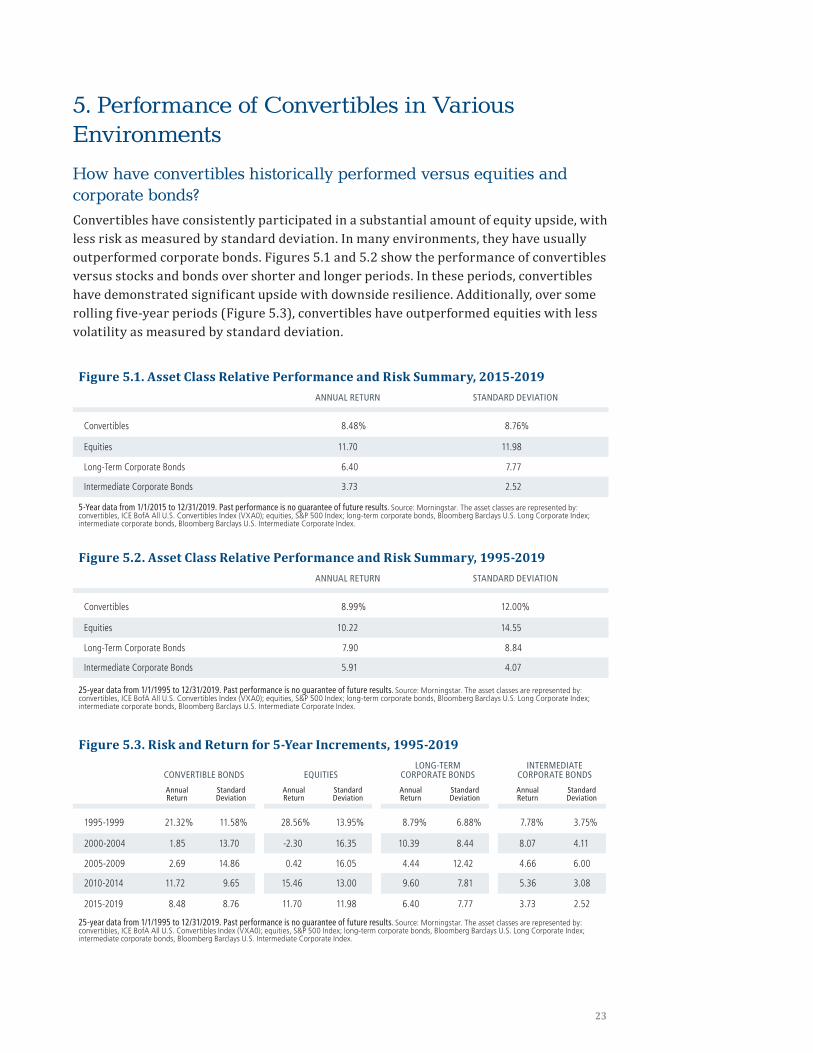
Convertibles 8.48% 8.76%
Equities 11.70 11.98
Long-Term Corporate Bonds 6.40 7.77
Intermediate Corporate Bonds 3.73 2.52
Figure 5.1. Asset Class Relative Performance and Risk Summary, 2015-2019
5-Year data from 1/1/2015 to 12/31/2019. Past performance is no guarantee of future results. Source: Morningstar. The asset classes are represented by: convertibles, ICE BofA All U.S. Convertibles Index (VXA0); equities, S&P 500 Index; long-term corporate bonds, Bloomberg Barclays U.S. Long Corporate Index; intermediate corporate bonds, Bloomberg Barclays U.S. Intermediate Corporate Index.
ANNUAL RETURN
STANDARD DEVIATION
Convertibles 8.99% 12.00%
Equities 10.22 14.55
Long-Term Corporate Bonds 7.90 8.84
Intermediate Corporate Bonds 5.91 4.07
Figure 5.2. Asset Class Relative Performance and Risk Summary, 1995-2019
25-year data from 1/1/1995 to 12/31/2019. Past performance is no guarantee of future results. Source: Morningstar. The asset classes are represented by: convertibles, ICE BofA All U.S. Convertibles Index (VXA0); equities, S&P 500 Index; long-term corporate bonds, Bloomberg Barclays U.S. Long Corporate Index; intermediate corporate bonds, Bloomberg Barclays U.S. Intermediate Corporate Index.
CONVERTIBLE BONDS
EQUITIES
LONG-TERM
CORPORATE BONDS
INTERMEDIATE
CORPORATE BONDS
Annual Return
Standard Deviation
Annual Return
Standard Deviation
Annual Return
Standard Deviation
Annual Return
Standard Deviation
1995-1999 21.32% 11.58% 28.56% 13.95% 8.79% 6.88% 7.78% 3.75%
2000-2004 1.85 13.70 -2.30 16.35 10.39 8.44 8.07 4.11
2005-2009 2.69 14.86 0.42 16.05 4.44 12.42 4.66 6.00
2010-2014 11.72 9.65 15.46 13.00 9.60 7.81 5.36 3.08
2015-2019 8.48 8.76 11.70 11.98 6.40 7.77 3.73 2.52
Figure 5.3. Risk and Return for 5-Year Increments, 1995-2019
25-year data from 1/1/1995 to 12/31/2019. Past performance is no guarantee of future results. Source: Morningstar. The asset classes are represented by: convertibles, ICE BofA All U.S. Convertibles Index (VXA0); equities, S&P 500 Index; long-term corporate bonds, Bloomberg Barclays U.S. Long Corporate Index; intermediate corporate bonds, Bloomberg Barclays U.S. Intermediate Corporate Index.
5. Performance of Convertibles in Various Environments
How have convertibles historically performed versus equities and corporate bonds? Convertibles have consistently participated in a substantial amount of equity upside, with less risk as measured by standard deviation. In many environments, they have usually outperformed corporate bonds. Figures 5.1 and 5.2 show the performance of convertibles versus stocks and bonds over shorter and longer periods. In these periods, convertibles have demonstrated significant upside with downside resilience. Additionally, over some rolling five-year periods (Figure 5.3), convertibles have outperformed equities with less volatility as measured by standard deviation.
24 CONVERTIBLE SECURITIES: STRUCTURES, VALUATION, MARKET ENVIRONMENT, AND ASSET ALLOCATION
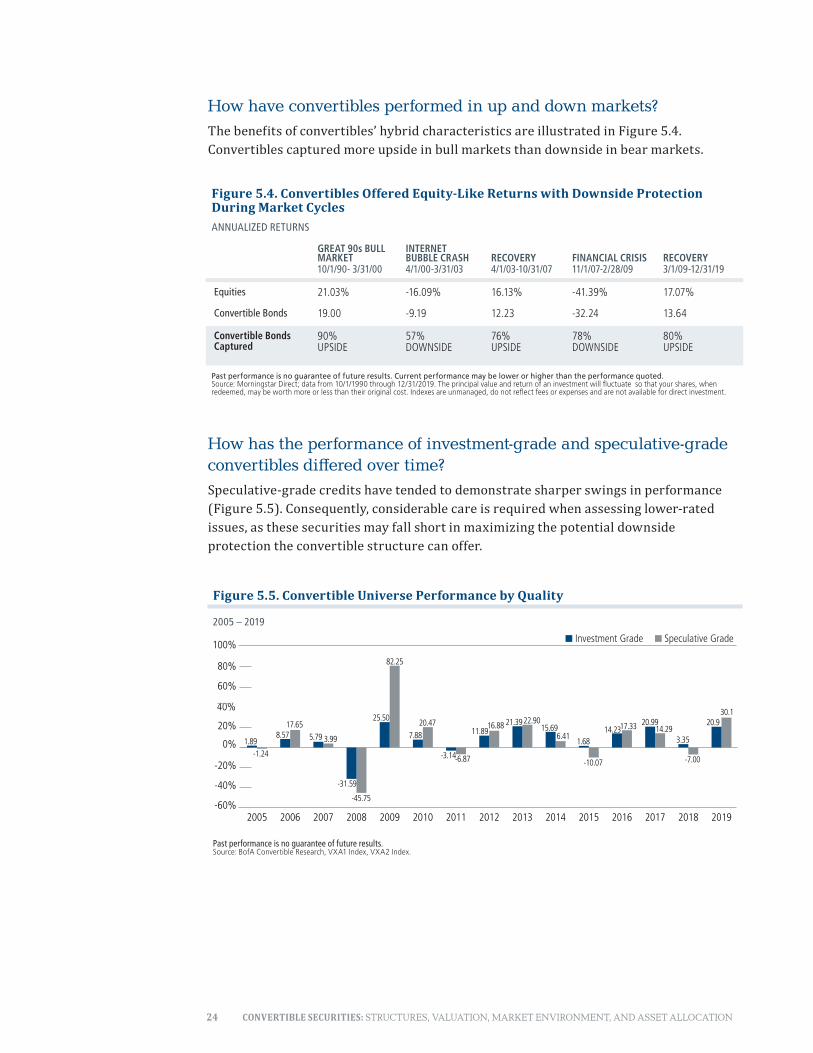
How have convertibles performed in up and down markets? The benefits of convertibles’ hybrid characteristics are illustrated in Figure 5.4. Convertibles captured more upside in bull markets than downside in bear markets.
How has the performance of investment-grade and speculative-grade convertibles differed over time?Speculative-grade credits have tended to demonstrate sharper swings in performance (Figure 5.5). Consequently, considerable care is required when assessing lower-rated issues, as these securities may fall short in maximizing the potential downside protection the convertible structure can offer.
Figure 5.5. Convertible Universe Performance by Quality
2005 – 2019
-60%
-40%
-20%
0%
20%
40%
60%
80%
100%
201920182017201620152014201320122011201020092008200720062005
1.68
-10.07
15.696.41
21.3922.9011.89
16.88
-3.14-6.87
7.88
20.4725.50
82.25
-31.59
-45.75
5.79 3.998.5717.65
1.89-1.24
20.930.1
Investment Grade Speculative Grade
14.2317.33 20.9914.29
3.35
-7.00
Past performance is no guarantee of future results. Source: BofA Convertible Research, VXA1 Index, VXA2 Index.
Figure 5.4. Convertibles Offered Equity-Like Returns with Downside Protection During Market CyclesANNUALIZED RETURNS
GREAT 90s BULL MARKET 10/1/90- 3/31/00
INTERNET BUBBLE CRASH 4/1/00-3/31/03
RECOVERY 4/1/03-10/31/07
FINANCIAL CRISIS 11/1/07-2/28/09
RECOVERY 3/1/09-12/31/19
Equities 21.03% -16.09% 16.13% -41.39% 17.07%
Convertible Bonds 19.00 -9.19 12.23 -32.24 13.64
Convertible Bonds Captured
90% UPSIDE
57% DOWNSIDE
76% UPSIDE
78% DOWNSIDE
80% UPSIDE
Past performance is no guarantee of future results. Current performance may be lower or higher than the performance quoted. Source: Morningstar Direct; data from 10/1/1990 through 12/31/2019. The principal value and return of an investment will fluctuate so that your shares, when redeemed, may be worth more or less than their original cost. Indexes are unmanaged, do not reflect fees or expenses and are not available for direct investment.
25
6. Characteristics of the Global Convertible Market
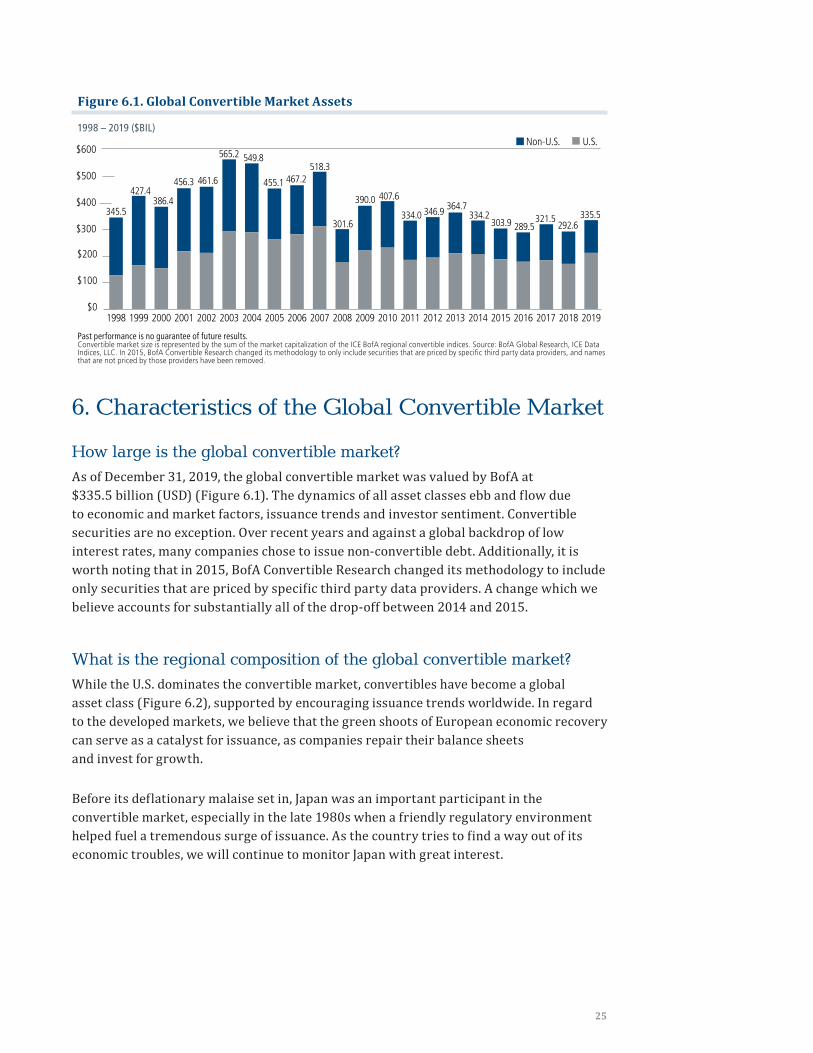
How large is the global convertible market? As of December 31, 2019, the global convertible market was valued by BofA at $335.5 billion (USD) (Figure 6.1). The dynamics of all asset classes ebb and flow due to economic and market factors, issuance trends and investor sentiment. Convertible securities are no exception. Over recent years and against a global backdrop of low interest rates, many companies chose to issue non-convertible debt. Additionally, it is worth noting that in 2015, BofA Convertible Research changed its methodology to include only securities that are priced by specific third party data providers. A change which we believe accounts for substantially all of the drop-off between 2014 and 2015.
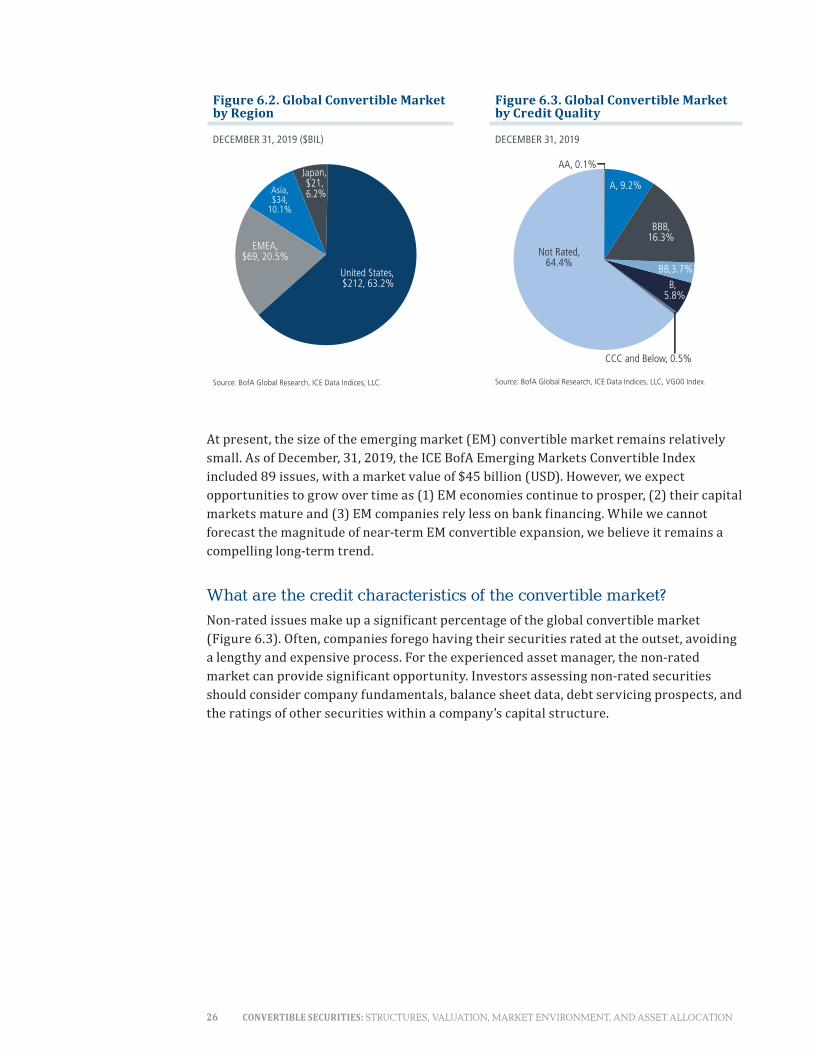
What is the regional composition of the global convertible market?While the U.S. dominates the convertible market, convertibles have become a global asset class (Figure 6.2), supported by encouraging issuance trends worldwide. In regard to the developed markets, we believe that the green shoots of European economic recovery can serve as a catalyst for issuance, as companies repair their balance sheets and invest for growth.
Before its deflationary malaise set in, Japan was an important participant in the convertible market, especially in the late 1980s when a friendly regulatory environment helped fuel a tremendous surge of issuance. As the country tries to find a way out of its economic troubles, we will continue to monitor Japan with great interest.
Figure 6.1. Global Convertible Market Assets
1998 – 2019 ($BIL)
$0
$100
$200
$300
$400
$500
$600
2019201820172016201520142013201220112010200920082007200620052004200320022001200019991998
345.5
427.4386.4
456.3 461.6
565.2 549.8
455.1 467.2518.3
301.6
390.0 407.6
334.0 346.9 364.7334.2
303.9 289.5321.5
Non-U.S. U.S.
292.6335.5
Past performance is no guarantee of future results. Convertible market size is represented by the sum of the market capitalization of the ICE BofA regional convertible indices. Source: BofA Global Research, ICE Data Indices, LLC. In 2015, BofA Convertible Research changed its methodology to only include securities that are priced by specific third party data providers, and names that are not priced by those providers have been removed.
26 CONVERTIBLE SECURITIES: STRUCTURES, VALUATION, MARKET ENVIRONMENT, AND ASSET ALLOCATION
At present, the size of the emerging market (EM) convertible market remains relatively small. As of December, 31, 2019, the ICE BofA Emerging Markets Convertible Index included 89 issues, with a market value of $45 billion (USD). However, we expect opportunities to grow over time as (1) EM economies continue to prosper, (2) their capital markets mature and (3) EM companies rely less on bank financing. While we cannot forecast the magnitude of near-term EM convertible expansion, we believe it remains a compelling long-term trend.
What are the credit characteristics of the convertible market? Non-rated issues make up a significant percentage of the global convertible market (Figure 6.3). Often, companies forego having their securities rated at the outset, avoiding a lengthy and expensive process. For the experienced asset manager, the non-rated market can provide significant opportunity. Investors assessing non-rated securities should consider company fundamentals, balance sheet data, debt servicing prospects, and the ratings of other securities within a company’s capital structure.
Figure 6.2. Global Convertible Market by Region
DECEMBER 31, 2019 ($BIL)
Source: BofA Global Research, ICE Data Indices, LLC.
United States, $212, 63.2%
EMEA,$69, 20.5%
Asia,$34,
10.1%
Japan,$21, 6.2%
Figure 6.3. Global Convertible Market by Credit Quality
DECEMBER 31, 2019
Source: BofA Global Research, ICE Data Indices, LLC, VG00 Index.
BBB,16.3%
B,5.8%
A, 9.2%
BB,3.7%
Not Rated,64.4%
AA, 0.1%
CCC and Below, 0.5%
27
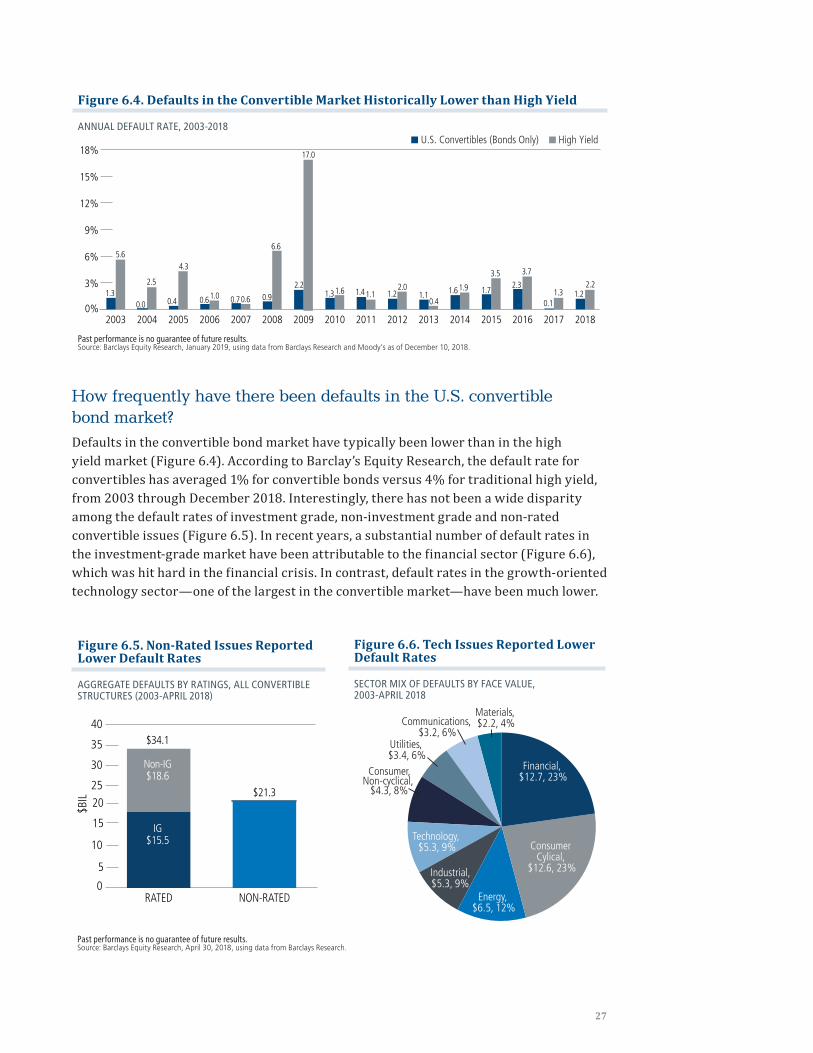
How frequently have there been defaults in the U.S. convertible bond market? Defaults in the convertible bond market have typically been lower than in the high yield market (Figure 6.4). According to Barclay’s Equity Research, the default rate for convertibles has averaged 1% for convertible bonds versus 4% for traditional high yield, from 2003 through December 2018. Interestingly, there has not been a wide disparity among the default rates of investment grade, non-investment grade and non-rated convertible issues (Figure 6.5). In recent years, a substantial number of default rates in the investment-grade market have been attributable to the financial sector (Figure 6.6), which was hit hard in the financial crisis. In contrast, default rates in the growth-oriented technology sector—one of the largest in the convertible market—have been much lower.
Figure 6.4. Defaults in the Convertible Market Historically Lower than High Yield
ANNUAL DEFAULT RATE, 2003-2018
0%
3%
6%
9%
12%
15%
18%
2018201720162015201420132012201120102009200820072006200520042003
1.3
5.6
0.0
2.5
U.S. Convertibles (Bonds Only) High Yield
0.4
4.3
0.61.0 0.70.6 0.9
6.6
2.2
17.0
1.31.6 1.41.1 1.22.0
1.10.4
1.61.9 1.7
3.52.3
3.7
0.11.3 1.2
2.2
Past performance is no guarantee of future results. Source: Barclays Equity Research, January 2019, using data from Barclays Research and Moody’s as of December 10, 2018.
Figure 6.6. Tech Issues Reported Lower Default Rates
SECTOR MIX OF DEFAULTS BY FACE VALUE, 2003-APRIL 2018
Financial, $12.7, 23%
Consumer Cylical,
$12.6, 23%
Energy, $6.5, 12%
Industrial, $5.3, 9%
Technology, $5.3, 9%
Utilities, $3.4, 6%
Communications, $3.2, 6%
Materials, $2.2, 4%
Consumer,Non-cyclical,
$4.3, 8%
Figure 6.5. Non-Rated Issues Reported Lower Default Rates
AGGREGATE DEFAULTS BY RATINGS, ALL CONVERTIBLE STRUCTURES (2003-APRIL 2018)
0
5
10
15
20
25
30
35
40
NON-RATEDRATED
Non-IG$18.6
$34.1
$BIL $21.3
IG$15.5
Past performance is no guarantee of future results. Source: Barclays Equity Research, April 30, 2018, using data from Barclays Research.
28 CONVERTIBLE SECURITIES: STRUCTURES, VALUATION, MARKET ENVIRONMENT, AND ASSET ALLOCATION
7. Convertibles and Asset Allocation
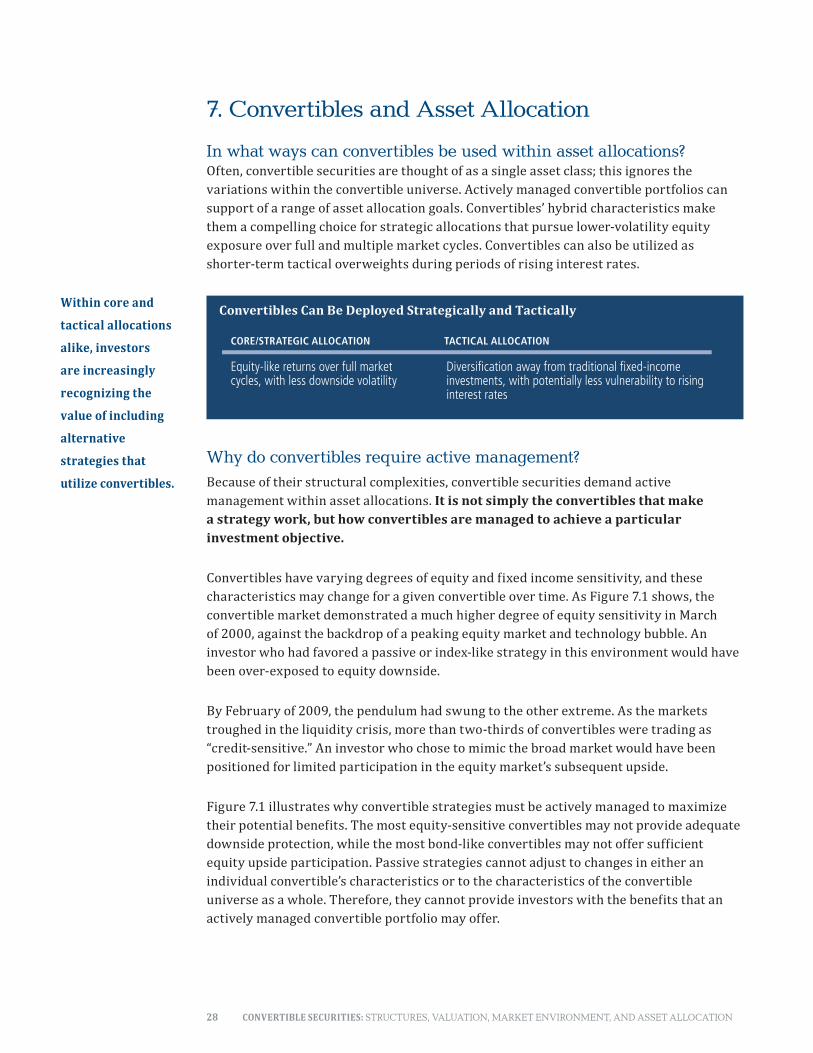
In what ways can convertibles be used within asset allocations?Often, convertible securities are thought of as a single asset class; this ignores the variations within the convertible universe. Actively managed convertible portfolios can support of a range of asset allocation goals. Convertibles’ hybrid characteristics make them a compelling choice for strategic allocations that pursue lower-volatility equity exposure over full and multiple market cycles. Convertibles can also be utilized as shorter-term tactical overweights during periods of rising interest rates.
Why do convertibles require active management?Because of their structural complexities, convertible securities demand active management within asset allocations. It is not simply the convertibles that make a strategy work, but how convertibles are managed to achieve a particular investment objective.
Convertibles have varying degrees of equity and fixed income sensitivity, and these characteristics may change for a given convertible over time. As Figure 7.1 shows, the convertible market demonstrated a much higher degree of equity sensitivity in March of 2000, against the backdrop of a peaking equity market and technology bubble. An investor who had favored a passive or index-like strategy in this environment would have been over-exposed to equity downside.
By February of 2009, the pendulum had swung to the other extreme. As the markets troughed in the liquidity crisis, more than two-thirds of convertibles were trading as “credit-sensitive.” An investor who chose to mimic the broad market would have been positioned for limited participation in the equity market’s subsequent upside.
Figure 7.1 illustrates why convertible strategies must be actively managed to maximize their potential benefits. The most equity-sensitive convertibles may not provide adequate downside protection, while the most bond-like convertibles may not offer sufficient equity upside participation. Passive strategies cannot adjust to changes in either an individual convertible’s characteristics or to the characteristics of the convertible universe as a whole. Therefore, they cannot provide investors with the benefits that an actively managed convertible portfolio may offer.
CORE/STRATEGIC ALLOCATION
TACTICAL ALLOCATION
Equity-like returns over full market cycles, with less downside volatility
Diversification away from traditional fixed-income investments, with potentially less vulnerability to rising interest rates
Convertibles Can Be Deployed Strategically and TacticallyWithin core and
tactical allocations
alike, investors
are increasingly
recognizing the
value of including
alternative
strategies that
utilize convertibles.
29
How should convertibles be managed within a core/strategic allocation? Core or strategic allocations are those investors hold through full and multiple market cycles. Within a core allocation, convertibles can provide a solution for investors who wish to participate in longer-term equity market upside but are concerned about shorter-term downside equity volatility. In volatile markets, the bond value provides a floor, and through coupon income, investors are “paid to wait” for the markets to turn.
Within a core convertible strategy, great care must be taken to monitor the upside and downside exposures within the portfolio—both of individual securities as well as of the portfolio as a whole. Active management should focus on identifying convertibles that offer balanced attributes—that is, a blend of credit and equity sensitivities. Within a strategic allocation, the most equity-sensitive convertibles may prove too vulnerable to downward movements in the stock market over the long term, while the most credit sensitive issues may not provide appropriate opportunity for upside participation.
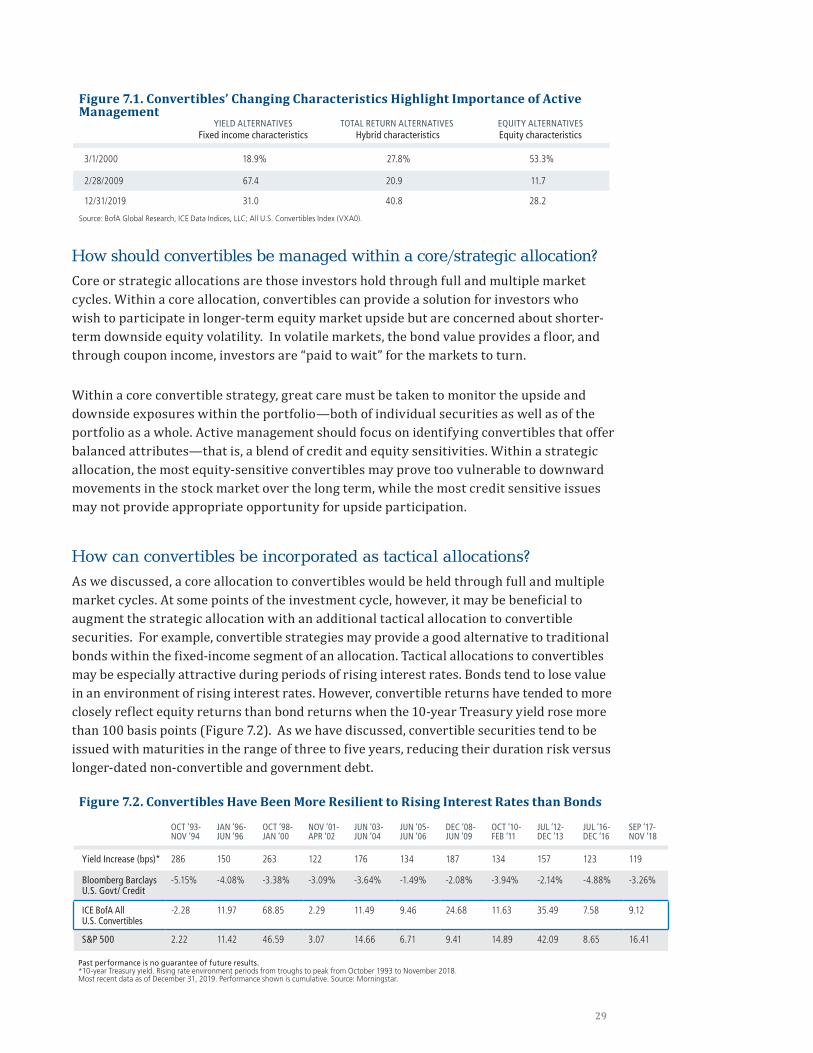
How can convertibles be incorporated as tactical allocations? As we discussed, a core allocation to convertibles would be held through full and multiple market cycles. At some points of the investment cycle, however, it may be beneficial to augment the strategic allocation with an additional tactical allocation to convertible securities. For example, convertible strategies may provide a good alternative to traditional bonds within the fixed-income segment of an allocation. Tactical allocations to convertibles may be especially attractive during periods of rising interest rates. Bonds tend to lose value in an environment of rising interest rates. However, convertible returns have tended to more closely reflect equity returns than bond returns when the 10-year Treasury yield rose more than 100 basis points (Figure 7.2). As we have discussed, convertible securities tend to be issued with maturities in the range of three to five years, reducing their duration risk versus longer-dated non-convertible and government debt.
YIELD ALTERNATIVES
Fixed income characteristics
TOTAL RETURN ALTERNATIVES
Hybrid characteristics
EQUITY ALTERNATIVES Equity characteristics
3/1/2000 18.9% 27.8% 53.3%
2/28/2009 67.4 20.9 11.7
12/31/2019 31.0 40.8 28.2
Figure 7.1. Convertibles’ Changing Characteristics Highlight Importance of Active Management
Source: BofA Global Research, ICE Data Indices, LLC; All U.S. Convertibles Index (VXA0).
Figure 7.2. Convertibles Have Been More Resilient to Rising Interest Rates than Bonds
OCT ‘93-NOV ‘94
JAN ‘96-JUN ‘96
OCT ‘98-JAN ‘00
NOV ‘01-APR ‘02
JUN ‘03-JUN ‘04
JUN ‘05-JUN ‘06
DEC ‘08-JUN ‘09
OCT ‘10-FEB ‘11
JUL ‘12- DEC ‘13
JUL ‘16- DEC ‘16
SEP ‘17-NOV ‘18
Yield Increase (bps)* 286 150 263 122 176 134 187 134 157 123 119
Bloomberg Barclays U.S. Govt/ Credit
-5.15% -4.08% -3.38% -3.09% -3.64% -1.49% -2.08% -3.94% -2.14% -4.88% -3.26%
ICE BofA All U.S. Convertibles
-2.28 11.97 68.85 2.29 11.49 9.46 24.68 11.63 35.49 7.58 9.12
S&P 500 2.22 11.42 46.59 3.07 14.66 6.71 9.41 14.89 42.09 8.65 16.41
Past performance is no guarantee of future results. *10-year Treasury yield. Rising rate environment periods from troughs to peak from October 1993 to November 2018. Most recent data as of December 31, 2019. Performance shown is cumulative. Source: Morningstar.
30 CONVERTIBLE SECURITIES: STRUCTURES, VALUATION, MARKET ENVIRONMENT, AND ASSET ALLOCATION
While convertibles are influenced to a degree by interest-rate fluctuations, they also are affected by the price movements of their underlying stocks, a factor that historically has helped soften the negative effect of rising interest rates. In general, the more a convertible’s price is determined by the value of its underlying equity, the greater its tendency not to be influenced by changing interest rates.
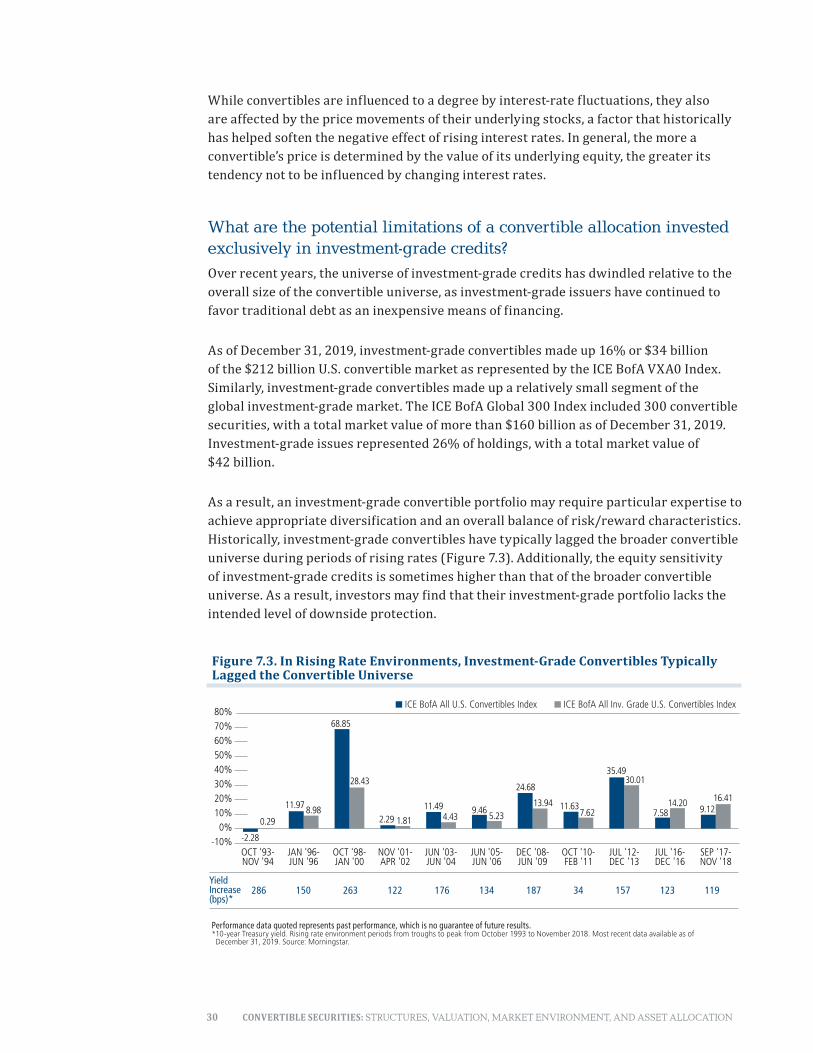
What are the potential limitations of a convertible allocation invested exclusively in investment-grade credits? Over recent years, the universe of investment-grade credits has dwindled relative to the overall size of the convertible universe, as investment-grade issuers have continued to favor traditional debt as an inexpensive means of financing.
As of December 31, 2019, investment-grade convertibles made up 16% or $34 billion of the $212 billion U.S. convertible market as represented by the ICE BofA VXA0 Index. Similarly, investment-grade convertibles made up a relatively small segment of the global investment-grade market. The ICE BofA Global 300 Index included 300 convertible securities, with a total market value of more than $160 billion as of December 31, 2019. Investment-grade issues represented 26% of holdings, with a total market value of $42 billion.
As a result, an investment-grade convertible portfolio may require particular expertise to achieve appropriate diversification and an overall balance of risk/reward characteristics. Historically, investment-grade convertibles have typically lagged the broader convertible universe during periods of rising rates (Figure 7.3). Additionally, the equity sensitivity of investment-grade credits is sometimes higher than that of the broader convertible universe. As a result, investors may find that their investment-grade portfolio lacks the intended level of downside protection.
Figure 7.3. In Rising Rate Environments, Investment-Grade Convertibles Typically Lagged the Convertible Universe
-10%0%
10%20%30%40%50%60%70%80%
SEP '17-NOV '18
JUL '16-DEC '16
JUL '12-DEC '13
OCT '10-FEB '11
DEC '08-JUN '09
JUN '05-JUN '06
JUN '03-JUN '04
NOV '01-APR '02
OCT '98-JAN '00
JAN '96-JUN '96
OCT '93-NOV '94
ICE BofA All U.S. Convertibles Index ICE BofA All Inv. Grade U.S. Convertibles Index
11.97 8.98
68.85
28.43
2.29 1.81
11.494.43
9.465.23
24.68
11.6313.947.62
35.4930.01
Yield Increase(bps)*
286 150 263 122 176 134 187 34 157 123 119
7.5814.20
-2.28
0.299.12
16.41
Performance data quoted represents past performance, which is no guarantee of future results. *10-year Treasury yield. Rising rate environment periods from troughs to peak from October 1993 to November 2018. Most recent data available as of December 31, 2019. Source: Morningstar.
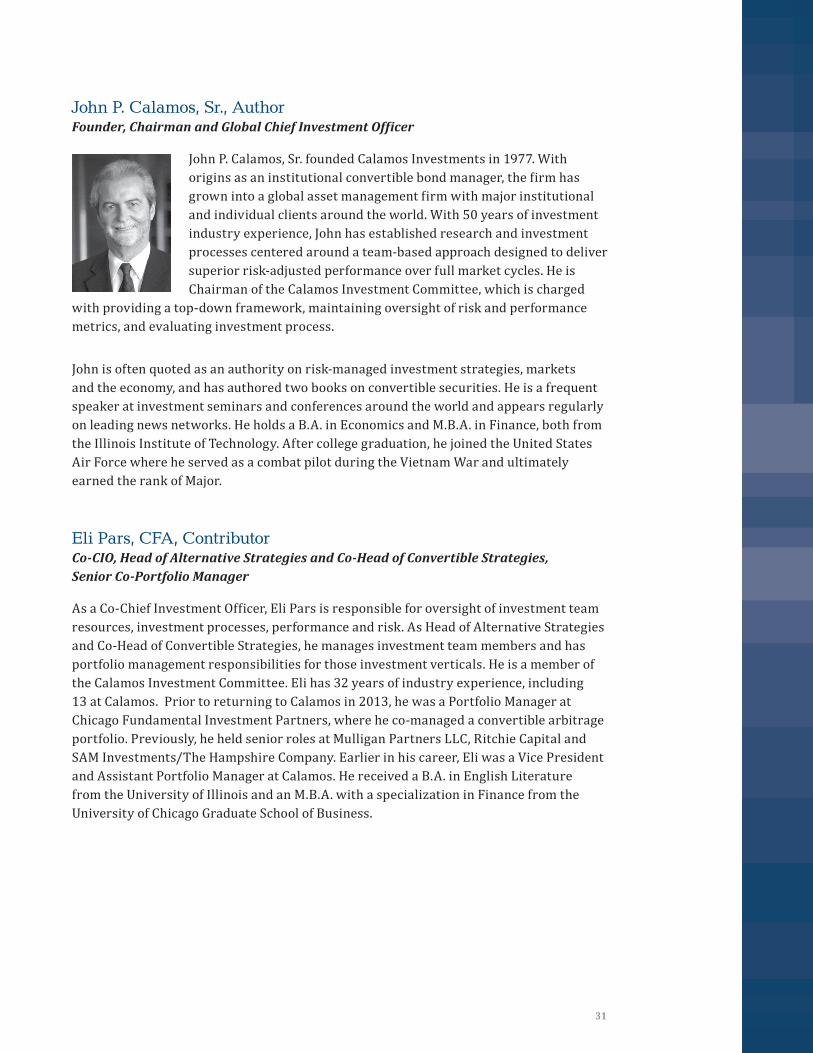
31
John P. Calamos, Sr., AuthorFounder, Chairman and Global Chief Investment Officer
John P. Calamos, Sr. founded Calamos Investments in 1977. With origins as an institutional convertible bond manager, the firm has grown into a global asset management firm with major institutional and individual clients around the world. With 50 years of investment industry experience, John has established research and investment processes centered around a team-based approach designed to deliver superior risk-adjusted performance over full market cycles. He is Chairman of the Calamos Investment Committee, which is charged
with providing a top-down framework, maintaining oversight of risk and performance metrics, and evaluating investment process.
John is often quoted as an authority on risk-managed investment strategies, markets and the economy, and has authored two books on convertible securities. He is a frequent speaker at investment seminars and conferences around the world and appears regularly on leading news networks. He holds a B.A. in Economics and M.B.A. in Finance, both from the Illinois Institute of Technology. After college graduation, he joined the United States Air Force where he served as a combat pilot during the Vietnam War and ultimately earned the rank of Major.
Eli Pars, CFA, ContributorCo-CIO, Head of Alternative Strategies and Co-Head of Convertible Strategies, Senior Co-Portfolio Manager
As a Co-Chief Investment Officer, Eli Pars is responsible for oversight of investment team resources, investment processes, performance and risk. As Head of Alternative Strategies and Co-Head of Convertible Strategies, he manages investment team members and has portfolio management responsibilities for those investment verticals. He is a member of the Calamos Investment Committee. Eli has 32 years of industry experience, including 13 at Calamos. Prior to returning to Calamos in 2013, he was a Portfolio Manager at Chicago Fundamental Investment Partners, where he co-managed a convertible arbitrage portfolio. Previously, he held senior roles at Mulligan Partners LLC, Ritchie Capital and SAM Investments/The Hampshire Company. Earlier in his career, Eli was a Vice President and Assistant Portfolio Manager at Calamos. He received a B.A. in English Literature from the University of Illinois and an M.B.A. with a specialization in Finance from the University of Chicago Graduate School of Business.

32 CONVERTIBLE SECURITIES: STRUCTURES, VALUATION, MARKET ENVIRONMENT, AND ASSET ALLOCATION
CVTBRO 18080 0220O C
Calamos Investments LLC 2020 Calamos Court | Naperville, IL 60563-2787 800.582.6959 | www.calamos.com | [email protected]
© 2020 Calamos Investments LLC. All Rights Reserved. Calamos® and Calamos Investments® are registered trademarks of Calamos Investments LLC.
Disclosures and Additional Information
Diversification and asset allocation do not guarantee against a loss. This material is distributed for informational purposes only. The information contained herein is based on internal research derived from various sources and does not purport to be statements of all material facts relating to the information mentioned, and while not guaranteed as to the accuracy or completeness, has been obtained from sources we believe to be reliable.
Opinions, estimates, forecasts, and statements of financial market trends that are based on current market conditions constitute our judgment and are subject to change without notice. The views and strategies described may not be suitable for all investors. References to specific securities, asset classes and financial markets are for illustrative purposes only and are not intended to be, and should not be interpreted as, recommendations.
Outside the U.S., this presentation is directed only at professional/sophisticated investors and it is for their exclusive use and information. This document should not be shown to or given to retail investors. Investments in overseas markets pose special risks, including currency fluctuation and political risks, and greater volatility than typically associated with U.S. investments. These risks are generally intensified for investments in emerging markets.
Indexes are unmanaged, do not entail fees or expenses and are not available for direct investment. Unless otherwise noted, index returns reflect the reinvestment of income dividends and capital gains, if any, but do not reflect fees, brokerage commissions or other expenses of investing. Investors may not make direct investments into any index.
The S&P 500 Index is considered generally representative of the U.S. equity market. The ICE BofA VXA0 Index is considered generally representative of the U.S. convertible market. The ICE BofA Global 300 Index includes 300 convertible securities and is considered generally representative of the global convertible market. The ICE BofA VXA1 is considered generally representative of the U.S. investment-grade convertible market. The ICE BofA VXA2 is considered generally representative of the U.S. non-investment-grade convertible market. The Credit Suisse U.S. High Yield Index is an unmanaged index of high yield debt securities. The Bloomberg Barclays U.S. Government/ Credit Index comprises long-term government and investment-grade corporate debt securities and is generally considered representative of the performance of the broad U.S. bond market. The Bloomberg Barclays Long U.S. Corporate Index measures the performance of U.S. corporate bonds that have a maturity of greater than or equal to 10 years. The Bloomberg Barclays Intermediate U.S. Corporate Index measures the performance of U.S. corporate bonds that have a maturity of greater than or equal to 1 year and less than 10 years. Both the Bloomberg Barclays Long U.S. Corporate Index and the Bloomberg Barclays Intermediate U.S. Corporate Index indexes are components of the Bloomberg Barclays U.S. Corporate Index, a broad-based benchmark that measures the investment-grade, U.S. dollar-denominated, fixed-rate, taxable corporate bond market. Standard deviation is a measure of historical volatility, with higher values indicating increased volatility. MIPS is an acronym for monthly income preferred stock; DECS, dividend enhanced common stock; ELKS, equity linked securities; PERCS, preferred equity redemption cumulative securities; PRIDES, preferred redemption increased dividend equity securities.
The price of equity securities may rise or fall because of changes in the broad market or changes in a company’s financial condition, sometimes rapidly or unpredictably. These price movements may result from factors affecting individual companies, sectors or industries.
Convertible securities entail interest rate risk and default risk.
Fixed-income securities are subject to interest rate risk. If rates increase, the value of fixed-income investments generally declines.