Embed Size (px)
Citation preview


Financial Highlights*
H.J. Heinz Company and Subsidiaries 2010 2009(Dollars in thousands, except per share amounts) (52 Weeks) (52 Weeks)
Sales(1) $10,494,983 $10,011,331Operating income(1) 1,559,228 1,502,446Income from continuing operations, net of tax(1)(2) 914,489 929,511
Per common share amounts: Income from continuing operations(1) (2) - diluted $ 2.87 $ 2.91 Cash dividends $ 1.68 $ 1.66Cash from operations $ 1,262,197 $ 1,166,882 Capital expenditures 277,642 292,121Proceeds from disposals of property, plant and equipment 96,493 5,407Depreciation and amortization(1) 299,050 274,107Property, plant and equipment, net 2,091,796 1,978,302Cash and cash equivalents $ 483,253 $ 373,145Cash conversion cycle (days) 47 55Total debt 4,618,172 5,141,824H.J. Heinz Company Shareholders’ equity 1,891,345 1,219,938Average common shares outstanding - diluted (in thousands) 318,113 318,063Return on average invested capital (“ROIC”) 18.7%(3) 18.4%Debt/invested capital 70.9% 80.8%
See Management’s Discussion and Analysis for details.(1) Continuing operations(2) Amounts are attributable to H.J. Heinz Company Shareholders (3) Excludes 90 basis point impact of losses from discontinued operations
(1) Amounts are continuing operations, FY06 EPS excludes special items(2) Operating Free Cash Flow is cash from operations less capital expenditures net of proceeds from disposal of PP&E (3) After discretionary pension funding of $475 million in FY10(4) CAGR = Compound Annual Growth Rate (5) Volume plus price
*Please refer to the non-GAAP Performance Ratios at the end of this Annual Report for reconciliations of non-GAAP amounts.
EPS(1)
FY06 FY10
CAGR(4) of 8.6%
$2.06
$2.87
OPERATING FREE CASH FLOW(2) — $MM
$4.6 Billion Over Last 5 Years
FY06 FY10
$864
$1,081(3)
SALES(1) — $MM
Average Organic(5)
Growth 4.5%
FY06 FY10
$8,470
$10,495
About the Cover
Heinz® Ketchup was introduced in 1876 by Henry John Heinz, a packaged foods pioneer who was dedicated to quality, wholesome nutrition and innovation. The cover of this report illustrates Heinz Ketchup packaging innovations and the years they were introduced, including the original glass bottle, the ketchup packet, the plastic bottle, the top-down bottle and Dip & Squeeze™, a great new way to enjoy the thick, rich taste of Heinz Ketchup. Today, we sell about 650 million bottles of Heinz Ketchup and 11 billion packets each year across six continents, making our iconic brand The World’s Favorite Ketchup®.

Dear Fellow Shareholder:I am proud to report that Heinz delivered record sales of
$10.5 billion, as well as record gross profit of $3.8 billion
and record operating free cash flow of almost $1.1 billion
in Fiscal 2010. Our excellent results reflected increased
innovation and marketing behind our leading brands
and dynamic growth in Emerging Markets, where new
middle-class consumers are discovering the premium
quality, taste, nutrition, convenience and value of our
branded foods.
Importantly, Heinz excelled amidst a credit crisis and the
worst recession in decades, confirming the quality of
our businesses and brands and the capabilities of our
people. Heinz achieved virtually all of its financial
targets for the year despite weak economies in the
U.S. and Europe.
In the fiscal year ended April 28, 2010, your Company:
• Grew sales by 4.8%, led by double-digit sales growth
in Emerging Markets and solid growth in our
Top 15 brands.
• Delivered strong earnings per share of $2.87 from
continuing operations, exceeding the top end of our
revised range of $2.82 to $2.85 after raising our outlook
twice during the year.
• Reported net income of $914.5 million from continuing
operations and total Company net income of $864.9
million (including discontinued operations).
Importantly, the Company’s success in generating
consistently strong operating free cash flow ($4.6
billion over the last five years) enabled us to raise the
annualized common stock dividend for Fiscal 2011
by 12 cents, to $1.80 per share. The dividend has grown
almost 67% over the last seven years since being
adjusted to reflect the Del Monte spinoff in Fiscal 2003.
In that time span, Heinz has returned more than
$3 billion to our shareholders through dividend payments.
In Fiscal 2010, Heinz also produced a top-tier return
on invested capital of 18.7%(1), one of the best in the
Company’s history. Moreover, our gross profit margin
improved by 50 basis points on higher productivity
and pricing. Finally, Heinz has now delivered a total
shareholder return of almost 50% over the past five
years, significantly outperforming the S&P 500.
1
FY07
$1.20
FY05FY04
$1.40
FY08
$1.14$1.08
FY06
$1.52
FY09
$1.66
FY10
$1.68
$1.80
FY11E
CAGR of 7.6%
Annual Dividend Per Share
(1) Excludes 90 basis point impact of losses from discontinued operations
HEinz aCHiEvED
viRtually all oF its
FinanCial taRGEts
FoR tHE yEaR DEspitE
wEAk ECOnOMIES In
tHE u.s. anD EuRopE.
William R. JohnsonChairman, President and Chief Executive Officer

Right StrategyHeinz achieved success in a challenging global
environment through superb execution of our long-
established strategy, which is built around four
key pillars:
• Grow the Core portfolio
• accelerate Growth in Emerging Markets
• strengthen and leverage Global scale
• Make talent an advantage.
Growing the Core PortfolioHeinz once again rose to the challenge of growing our
core portfolio. The Company’s Top 15 brands, while
generating around 70% of sales, grew 5.7% behind
significant increases in innovation and marketing. Sales
of Heinz® ketchup grew around the world, strengthening
its position as the number-one brand in seven of the
world’s top 10 ketchup markets, including the United
states. across Europe, Ketchup grew a robust 7.2%,
led by excellent results in Russia, the world’s second-
largest ketchup market. U.S. Foodservice reported higher
operating profit, reflecting our success in simplifying
the business, although sales declined as a result of the
recession’s impact on consumer dining and restaurant
traffic. Overall, the Company’s sales grew in each of our
core categories—ketchup and Sauces, Meals and Snacks
and Infant/nutrition—and Heinz delivered organic sales
growth (volume plus price) in every quarter of
Fiscal 2010. we have now delivered twenty consecutive
quarters of organic sales growth.
InnovationInnovation is a Heinz hallmark and a key to unlocking
growth in our core brands. a great example is Dip &
Squeeze™ ketchup, the new dual-function foodservice
package that we announced in February 2010. Dip &
Squeeze gives consumers two ways to enjoy Heinz
ketchup—you can peel back the lid for easy dipping
or tear off the tip to squeeze it out. This revolutionary
package holds three times as much ketchup as a
traditional packet. It will be available to U.S. consumers
later this year.
2 2010 H.J. Heinz Company Annual Report
Emerging Markets have become Heinz’s most powerful growth engine and are on track to deliver at least 20% of the Company’s
sales by 2013, more than double their contribution of five years ago.
Fiscal 2010 Results
Reported sales $10.5 billion
organic sales Growth(1) +2.1%
Op. Free Cash Flow(2) $1,081 million
after-tax RoiC(3) 18.7%
(1) Volume plus price(2) Cash from operations less capital expenditures net of
proceeds from disposals of PP&E(3) Excludes 90 basis point impact of losses from discontinued operations
Emerging Markets % of Company Sales
FY10 FY13E
15%
20% Increase ofMore Than 60%
Continuing Operations
FY06 FY10
$269
$438
Marketing Investment — $MM

3
Dip & squeeze is just one example from the Company’s
full innovation pipeline. In the U.S., we launched
Ore-Ida® sweet potato Fries; t.G.i. Friday’s® mini-
cheeseburger sliders; and breakfast entrees and sliders
from Smart Ones® to enhance and expand the brand’s
positioning as a 24/7 weight management solution.
Around the world, we
introduced Reduced sugar & salt snap pots Heinz
Beanz® in the U.k.; Plasmon® Vegetable Pouches for
infants in Italy; Mr. Jussie® Milky beverages for children
in indonesia; Golden Circle® lol® fizzy fruit juices and
Raw fruit and vegetable beverages in australia; and
new varieties of Complan® and Glucon D® nutritional
beverages in India.
The Company’s focus on
innovation extends to new
products that give consumers
appealing choices for their lifestyle
and dietary preferences, such as
Simply Heinz™, a new variety of
Heinz ketchup in the U.S. made
with sugar. Reflecting our legacy
of making foods that are better for
you, we are reducing sodium in U.S.
ketchup by 15% while maintaining the
same great taste that consumers expect
from Heinz ketchup.
Marketing InvestmentsInnovation is one key to growing our core portfolio;
maintaining a high level of marketing investment is
another. During the year, the Company increased
marketing investments by nearly 26% to sustain
profitable growth over both the short and long term.
In the U.k., we launched It Has to be Heinz, a campaign
to enhance our leadership in categories such as
soups and beans. In the U.S., our Consumer Value
Program supported Heinz ketchup, Ore-Ida, Smart
Ones, Classico® and t.G.i. Friday’s through increased
advertising, coupons and promotions. Heinz has
increased marketing by more than 60% since 2006 to
protect and build our great brand equities.
Accelerating Growth in Emerging Markets
For the year, Emerging Markets generated 30% of
the Company’s total sales growth and 15% of total
sales. The robust growth was led by higher sales
of Complan and Glucon D nutritional beverages in
India, ABC® products in Indonesia and significant
growth in Heinz ketchup and infant nutrition
products in Russia. Emerging Markets have become
Heinz’s most powerful growth engine and are on
track to deliver at least 20% of the Company’s sales
by 2013, more than double
their contribution of five
years ago. we believe these
markets could account for
25% of our total sales by
2016 and as much as 35%
to 40% in the long term.
Heinz is well-positioned
in Emerging Markets
like China, India,
indonesia, latin america and Russia,
where we have the brands, the
leadership, the marketing expertise
and the manufacturing and distribution
infrastructure necessary to deliver
growth as the ranks of new middle-
class consumers continue to expand.
To accelerate growth even more, Heinz continues
to look for bolt-on acquisitions in Emerging
Markets while exploring new markets like the
Philippines, Turkey, Vietnam and Brazil.
Infant/nutrition represents a particularly compelling
opportunity in Emerging Markets. Our infant nutrition
businesses are a centerpiece of our Emerging Markets
strategy and we have great expectations for our

4 2010 H.J. Heinz Company Annual Report
Fiscal 2011 launches of Heinz infant formula
in China and Russia and Complan nutri-Gro™
toddler milk in India.
Leveraging Global ScaleHeinz is focused on driving top-line growth
and margins through higher productivity and
vigilant cost management. we invested in
productivity initiatives in Fiscal 2010 to improve
margins. Our goal is to deliver more than $1 billion in
cost savings over the next five years through global
supply chain initiatives designed to achieve economies
of scale and reduce costs by leveraging people, process
and technology. One of our key productivity enablers is
Project keystone, an ongoing initiative to harmonize our
global processes and systems.
Making Talent an AdvantageHeinz has one of the best multinational management
teams in the packaged foods industry. All of us can be
very proud of this capable team, which has delivered
strong results over the last five years. To maintain our
competitive advantage, we are expanding our global
leadership development and training programs to
prepare, attract and retain the best talent in our industry.
Heinz Stands for QualityAs Heinz focuses on growing globally, we continue to
stay true to our focus on quality, a Heinz hallmark since
1869. For the tenth year in a row, Heinz ranked first
in customer satisfaction among food manufacturing
companies in the American Customer Satisfaction
Index™. Heinz has earned the number-one ranking
by doing what we do uncommonly well—producing
premium food products that deliver consistently high
quality and value.
Helping People and the PlanetDelivering sustainable growth
for our shareholders is not
just about sales and profit.
Heinz is also dedicated to the
sustainable health of people and
the planet. During the year, we
reported significant reductions
in greenhouse gas emissions, solid waste, energy usage
and water consumption under a global sustainability
initiative that is on track to deliver reductions of 20%
or more in each category by 2015. we also
promoted sustainable agricultural practices
through our HeinzSeed program, which
supplies the natural hybrid tomato seeds that
farmers use in more than 30 countries to grow
the wholesome, vine-ripened tomatoes that
give Heinz ketchup its thick, rich taste. we also
expanded our non-profit campaign to combat
life-threatening iron-deficiency anemia in
infants and children. The campaign distributes packets
of vitamin and mineral powders that are sprinkled on
foods like rice to ensure that children in developing
countries receive essential nutrients. Film star and
humanitarian lucy liu became the first spokesperson
for the Heinz Micronutrient Campaign, conducting
numerous media interviews to raise public awareness
for the program, which has helped 3 million children in
15 developing nations and is expanding to Africa and
Mexico for the first time.
Outlook for Fiscal 2011Despite the global recession and foreign currency
fluctuations, your Company is aiming for another year
of strong growth on a constant currency* continuing
operations basis in Fiscal 2011, with:
• sales growth of 3% to 4%
• operating income growth of 7% to 10%
• Eps growth of 7% to 10%
• Reported operating free cash flow of more than
$1 billion.
since more than 60% of our sales are generated outside
the U.S., we anticipate that foreign currency translation
will impact our reported results. However, this will
not change our local market strategy or deter us from
continuing to build a strong, well-positioned Company all
of us can be proud of.
on behalf of the Board of Directors, senior management
and our 30,000 dedicated employees, I want to thank
you for investing in Heinz, a trusted, high-performing
global food company that delivered winning results in
Fiscal 2010 for consumers, our valued trade partners and
our shareholders.
William R. JohnsonChairman, President and Chief Executive Officer
*please refer to the non-Gaap performance Ratios at the end of this annual Report for a definition of constant currency.

SECURITIES AND EXCHANGE COMMISSIONWashington, D.C. 20549
FORM 10-K¥ ANNUAL REPORT PURSUANT TO SECTION 13 OR 15(d) OF THE SECURITIES
EXCHANGE ACT OF 1934For the fiscal year ended April 28, 2010
orn TRANSITION REPORT PURSUANT TO SECTION 13 OR 15(d) OF THE SECURITIES
EXCHANGE ACT OF 1934For the transition period from to
Commission File Number 1-3385
H. J. HEINZ COMPANY(Exact name of registrant as specified in its charter)
PENNSYLVANIA 25-0542520(State of Incorporation) (I.R.S. Employer Identification No.)
One PPG Place 15222Pittsburgh, Pennsylvania (Zip Code)
(Address of principal executive offices)
412-456-5700(Registrant’s telephone number)
SECURITIES REGISTERED PURSUANT TO SECTION 12(b) OF THE ACT:Title of each class Name of each exchange on which registered
Common Stock, par value $.25 per share The New York Stock Exchange
Third Cumulative Preferred Stock,$1.70 First Series, par value $10 per share The New York Stock Exchange
SECURITIES REGISTERED PURSUANT TO SECTION 12(g) OF THE ACT:None.
Indicate by check mark if the registrant is a well-known seasoned issuer, as defined in Rule 405 of the SecuritiesAct. Yes ¥ No n
Indicate by check mark if the registrant is not required to file reports pursuant to Section 13 or Section 15(d) of theAct. Yes n No ¥
Indicate by check mark whether the Registrant (1) has filed all reports required to be filed by Section 13 or 15(d) of theSecurities Exchange Act of 1934 during the preceding 12 months (or for such shorter period that the Registrant was required to filesuch reports), and (2) has been subject to such filing requirements for the past 90 days. Yes ¥ No n
Indicate by check mark whether the Registrant has submitted electronically and posted on its corporate Web site, if any, everyInteractive Data File required to be submitted and posted pursuant to Rule 405 of Regulation S-T during the preceding 12 months(or for such shorter period that the registrant was required to submit and post such files). Yes ¥ No n
Indicate by check mark if disclosure of delinquent filers pursuant to Item 405 of Regulation S-K is not contained herein, andwill not be contained, to the best of the Registrant’s knowledge, in definitive proxy or information statements incorporated byreference in Part III of this Form 10-K or any amendment to this Form 10-K. ¥
Indicate by check mark whether the registrant is a large accelerated filer, an accelerated filer, a non-accelerated filer, or asmaller reporting company. See the definitions of “large accelerated filer,” “accelerated filer” and “smaller reporting company” inRule 12b-2 of the Exchange Act. (Check one):Large accelerated filer ¥ Accelerated filer n Non-accelerated filer n
(Do not check if a smaller reporting company)Smaller reporting company n
Indicate by check mark whether the registrant is a shell company (as defined in Rule 12b-2 of the Exchange Act). Yes n No ¥
As of October 28, 2009 the aggregate market value of the Registrant’s voting stock held by non-affiliates of the Registrant wasapproximately $12.4 billion.
The number of shares of the Registrant’s Common Stock, par value $.25 per share, outstanding as of May 31, 2010, was318,060,499 shares.
DOCUMENTS INCORPORATED BY REFERENCEPortions of the Registrant’s Proxy Statement for the Annual Meeting of Shareholders to be held on August 31, 2010, which will
be filed with the Securities and Exchange Commission within 120 days after the end of the Registrant’s fiscal year ended April 28,2010, are incorporated into Part III, Items 10, 11, 12, 13, and 14.

[THIS PAGE INTENTIONALLY LEFT BLANK]

PART I
Item 1. Business.
H. J. Heinz Company was incorporated in Pennsylvania on July 27, 1900. In 1905, it succeeded tothe business of a partnership operating under the same name which had developed from a foodbusiness founded in 1869 in Sharpsburg, Pennsylvania by Henry J. Heinz. H. J. Heinz Company andits subsidiaries (collectively, the “Company”) manufacture and market an extensive line of foodproducts throughout the world. The Company’s principal products include ketchup, condiments andsauces, frozen food, soups, beans and pasta meals, infant nutrition and other food products.
The Company’s products are manufactured and packaged to provide safe, wholesome foods forconsumers, as well as foodservice and institutional customers. Many products are prepared fromrecipes developed in the Company’s research laboratories and experimental kitchens. Ingredientsare carefully selected, inspected and passed on to modern factory kitchens where they are processed,after which the intermediate product is filled automatically into containers of glass, metal, plastic,paper or fiberboard, which are then sealed. Products are prepared by sterilization, blending,fermentation, pasteurization, homogenization, chilling, freezing, pickling, drying, freeze drying,baking or extruding, then labeled and cased for market. Quality assurance procedures are designedfor each product and process and applied for quality and compliance with applicable laws.
The Company manufactures (and contracts for the manufacture of) its products from a widevariety of raw foods. Pre-season contracts are made with farmers for certain raw materials such as aportion of the Company’s requirements of tomatoes, cucumbers, potatoes, onions and some otherfruits and vegetables. Ingredients, such as dairy products, meat, sugar and other sweeteners,including high fructose corn syrup, spices, flour and fruits and vegetables, are purchased fromapproved suppliers.
The following table lists the number of the Company’s principal food processing factories andmajor trademarks by region:
Owned Leased Major Owned and Licensed TrademarksFactories
North America 20 4 Heinz, Classico, Quality Chef Foods, Jack Daniel’s*, Catelli*,Wyler’s, Heinz Bell ’Orto, Bella Rossa, Chef Francisco, Dianne’s,Ore-Ida, Tater Tots, Bagel Bites, Weight Watchers* Smart Ones,Boston Market*, Poppers, T.G.I. Friday’s*, Delimex, Truesoups,Alden Merrell, Escalon, PPI, Todd’s, Nancy’s, Lea & Perrins,Renee’s Gourmet, HP, Diana, Bravo, Arthur’s Fresh
Europe 21 — Heinz, Orlando, Karvan Cevitam, Brinta, Roosvicee, Venz,Weight Watchers*, Farley’s, Farex, Sonnen Bassermann,Plasmon, Nipiol, Dieterba, Bi-Aglut, Aproten, Pudliszki,Ross, Honig, De Ruijter, Aunt Bessie*, Mum’s Own,Moya Semya, Picador, Derevenskoye, Mechta Hoziajki, Lea &Perrins, HP, Amoy*, Daddies, Squeezme!, Wyko, Benedicta
Asia/Pacific 20 2 Heinz, Tom Piper, Wattie’s, ABC, Chef, Craig’s, Bruno, Winna,Hellaby, Hamper, Farley’s, Greenseas, Gourmet, Nurture,LongFong, Ore-Ida, SinSin, Lea & Perrins, HP, Star-Kist,Classico, Weight Watchers*, Cottee’s*, Rose’s*, Complan,Glucon D, Nycil, Golden Circle, La Bonne Cuisine, OriginalJuice Co., The Good Taste Company
Rest of World 6 2 Heinz, Wellington’s, Today, Mama’s, John West, Farley’s,Complan, HP, Lea & Perrins, Classico, Banquete, Wattie’s
67 8 * Used under license
2

The Company also owns or leases office space, warehouses, distribution centers and research andother facilities throughout the world. The Company’s food processing factories and principal prop-erties are in good condition and are satisfactory for the purposes for which they are being utilized.
The Company has developed or participated in the development of certain of its equipment,manufacturing processes and packaging, and maintains patents and has applied for patents for someof those developments. The Company regards these patents and patent applications as important butdoes not consider any one or group of them to be materially important to its business as a whole.
Although crops constituting some of the Company’s raw food ingredients are harvested on aseasonal basis, most of the Company’s products are produced throughout the year. Seasonal factorsinherent in the business have always influenced the quarterly sales, operating income and cash flowsof the Company. Consequently, comparisons between quarters have always been more meaningfulwhen made between the same quarters of prior years.
The products of the Company are sold under highly competitive conditions, with many large andsmall competitors. The Company regards its principal competition to be other manufacturers ofprepared foods, including branded retail products, foodservice products and private label products,that compete with the Company for consumer preference, distribution, shelf space and merchan-dising support. Product quality and consumer value are important areas of competition.
The Company’s products are sold through its own sales organizations and through independentbrokers, agents and distributors to chain, wholesale, cooperative and independent grocery accounts,convenience stores, bakeries, pharmacies, mass merchants, club stores, foodservice distributors andinstitutions, including hotels, restaurants, hospitals, health-care facilities, and certain governmentagencies. For Fiscal 2010, one customer, Wal-Mart Stores Inc., represented approximately 11% of theCompany’s sales. We closely monitor the credit risk associated with our customers and to date havenot experienced material losses.
Compliance with the provisions of national, state and local environmental laws and regulationshas not had a material effect upon the capital expenditures, earnings or competitive position of theCompany. The Company’s estimated capital expenditures for environmental control facilities for theremainder of Fiscal 2011 and the succeeding fiscal year are not material and are not expected tomaterially affect the earnings, cash flows or competitive position of the Company.
The Company’s factories are subject to inspections by various governmental agencies in theU.S. and other countries where the Company does business, including the United States Departmentof Agriculture, and the Occupational Health and Safety Administration, and its products mustcomply with the applicable laws, including food and drug laws, such as the Federal Food andCosmetic Act of 1938, as amended, and the Federal Fair Packaging or Labeling Act of 1966, asamended, of the jurisdictions in which they are manufactured and marketed.
The Company employed, on a full-time basis as of April 28, 2010, approximately 29,600 peoplearound the world.
Segment information is set forth in this report on pages 81 through 84 in Note 15, “SegmentInformation” in Item 8—“Financial Statements and Supplementary Data.”
Income from international operations is subject to fluctuation in currency values, export andimport restrictions, foreign ownership restrictions, economic controls and other factors. From time totime, exchange restrictions imposed by various countries have restricted the transfer of fundsbetween countries and between the Company and its subsidiaries. To date, such exchange restric-tions have not had a material adverse effect on the Company’s operations.
The Company’s annual report on Form 10-K, quarterly reports on Form 10-Q, current reports onForm 8-K, and amendments to those reports filed or furnished pursuant to section 13(a) or 15(d) of theExchange Act are available free of charge on the Company’s website at www.heinz.com, as soon as
3

reasonably practicable after filed or furnished to the Securities and Exchange Commission (“SEC”).Our reports filed with the SEC are also made available on its website at www.sec.gov.
Executive Officers of the Registrant
The following is a list of the names and ages of all of the executive officers of H. J. Heinz Companyindicating all positions and offices held by each such person and each such person’s principaloccupations or employment during the past five years. All the executive officers have been electedto serve until the next annual election of officers, until their successors are elected, or until theirearlier resignation or removal. The next annual election of officers is scheduled to occur on August 31,2010.
NameAge (as of
August 31, 2010)
Positions and Offices Held with the Company andPrincipal Occupations or
Employment During Past Five Years
William R. Johnson . . . . . . . . . . . . . . . . 61 Chairman, President, and ChiefExecutive Officer since September 2000.
Karen Alber . . . . . . . . . . . . . . . . . . . . . . 46 Senior Vice President, Chief InformationOfficer and Global Program ManagementOfficer since May 2010; Vice Presidentand Chief Information Officer fromOctober 2005 to May 2010.
Theodore N. Bobby . . . . . . . . . . . . . . . . 59 Executive Vice President and GeneralCounsel since January 2007; SeniorVice President and General Counselfrom April 2005 to January 2007;Acting General Counsel from January2005 to April 2005; Vice President—Legal Affairs from September 1999 toJanuary 2005.
Steve Clark . . . . . . . . . . . . . . . . . . . . . . 42 Vice President—Chief People Officersince October 2005; Director of HumanResources and Administration for Asiafrom January 2005 to October 2005;Director of Human Resources fromAugust 2004 to January 2005; SeniorManager Global Leadership andDevelopment from January 2004 toAugust 2004.
Edward J. McMenamin . . . . . . . . . . . . . 53 Senior Vice President—Finance andCorporate Controller since August2004; Vice President Finance fromJune 2001 to August 2004.
4

NameAge (as of
August 31, 2010)
Positions and Offices Held with the Company andPrincipal Occupations or
Employment During Past Five Years
Michael D. Milone . . . . . . . . . . . . . . . . . 54 Executive Vice President—Heinz Rest ofWorld, and Global Enterprise RiskManagement and GlobalInfant/Nutrition since May 2010;Senior Vice President—Heinz Rest ofWorld, Enterprise Risk Managementand Global Infant/Nutrition from June2008 to April 2010; Senior VicePresident—Heinz Pacific, Rest ofWorld and Enterprise RiskManagement from May 2006 to June2008; Senior Vice President—PresidentRest of World and Asia from May 2005 toMay 2006; Senior Vice President—President Rest of World fromDecember 2003 to May 2005.
David C. Moran . . . . . . . . . . . . . . . . . . . 52 Executive Vice President and Presidentand Chief Executive Officer of HeinzEurope since July 2009; ExecutiveVice President & Chief ExecutiveOfficer and President of Heinz NorthAmerica from May 2007 to July 2009;Executive Vice President & ChiefExecutive Officer and President ofHeinz North America ConsumerProducts from November 2005 to May2007; Senior Vice President—PresidentHeinz North America ConsumerProducts from May 2005 to November2005; President North AmericaConsumer Products from January 2003to May 2005.
Michael Mullen . . . . . . . . . . . . . . . . . . . 41 Vice President—Corporate andGovernment Affairs since February2009; Director Global Corporate Affairsfrom May 2006 to February 2009;European Corporate Affairs Directorfrom November 2004 to May 2006;General Manager European CorporateAffairs from May 2002 to November 2004.
C. Scott O’Hara . . . . . . . . . . . . . . . . . . . 49 Executive Vice President and Presidentand Chief Executive Officer of HeinzNorth America since July 2009;Executive Vice President—President andChief Executive Officer Heinz Europe fromMay 2006 to July 2009; Executive VicePresident—Asia Pacific/Rest of Worldfrom January 2006 to May 2006; SeniorVice President Europe—The GilletteCompany from October 2004 to January2006; General Manager U.K. and NL—TheGillette Company from June 2001 toOctober 2004.
5

NameAge (as of
August 31, 2010)
Positions and Offices Held with the Company andPrincipal Occupations or
Employment During Past Five Years
Bob Ostryniec . . . . . . . . . . . . . . . . . . . . 49 Senior Vice President and Chief SupplyChain Officer since February 2010;Chief Supply Chain Officer fromJanuary 2009 to February 2010; GlobalSupply Chain Officer from April 2008 toJanuary 2009; Chief Supply ChainOfficer from June 2005 to April 2008;Group Vice President ConsumerProducts—Product Supply from July2003 to June 2006.
Christopher J. Warmoth . . . . . . . . . . . . 51 Executive Vice President—Heinz AsiaPacific since June 2008; Senior VicePresident—Heinz Asia from May 2006to June 2008; Deputy President HeinzEurope from December 2003 to April2006.
Arthur B. Winkleblack . . . . . . . . . . . . . 53 Executive Vice President and ChiefFinancial Officer since January 2002.
Item 1A. Risk Factors
In addition to the factors discussed elsewhere in this Report, the following risks and uncer-tainties could materially and adversely affect the Company’s business, financial condition, andresults of operations. Additional risks and uncertainties that are not presently known to theCompany or are currently deemed by the Company to be immaterial also may impair the Company’sbusiness operations and financial condition.
Competitive product and pricing pressures in the food industry and the financialcondition of customers and suppliers could adversely affect the Company’s ability togain or maintain market share and/or profitability.
The Company operates in the highly competitive food industry, competing with other companiesthat have varying abilities to withstand changing market conditions. Any significant change in theCompany’s relationship with a major customer, including changes in product prices, sales volume, orcontractual terms may impact financial results. Such changes may result because the Company’scompetitors may have substantial financial, marketing, and other resources that may change thecompetitive environment. Private label brands sold by retail customers, which are typically sold atlower prices, are a source of competition for certain of our product lines. Such competition could causethe Company to reduce prices and/or increase capital, marketing, and other expenditures, or couldresult in the loss of category share. Such changes could have a material adverse impact on theCompany’s net income. As the retail grocery trade continues to consolidate, the larger retail cus-tomers of the Company could seek to use their positions to improve their profitability through lowerpricing and increased promotional programs. If the Company is unable to use its scale, marketingexpertise, product innovation, and category leadership positions to respond to these changes, or isunable to increase its prices, its profitability and volume growth could be impacted in a materiallyadverse way. The success of our business depends, in part, upon the financial strength and viability ofour suppliers and customers. The financial condition of those suppliers and customers is affected inlarge part by conditions and events that are beyond our control. A significant deterioration of theirfinancial condition could adversely affect our financial results.
6

The Company’s performance may be adversely affected by economic and politicalconditions in the U.S. and in various other nations where it does business.
The Company’s performance has been in the past and may continue in the future to be impactedby economic and political conditions in the United States and in other nations. Such conditions andfactors include changes in applicable laws and regulations, including changes in food and drug laws,accounting standards and critical accounting estimates, taxation requirements and environmentallaws. Other factors impacting our operations in the U.S., Venezuela and other international locationswhere the Company does business include export and import restrictions, currency exchange rates,currency devaluation, recessionary conditions, foreign ownership restrictions, nationalization, theimpact of hyperinflationary environments, and terrorist acts and political unrest. Such factors ineither domestic or foreign jurisdictions could materially and adversely affect our financial results.
Our operating results may be adversely affected by the current sovereign debt crisis inEurope and related global economic conditions.
The current Greek debt crisis and related European financial restructuring efforts may causethe value of the European currencies, including the Euro, to further deteriorate, thus reducing thepurchasing power of European customers. In addition, the European crisis is contributing to insta-bility in global credit markets. The world has recently experienced a global macroeconomic down-turn, and if global economic and market conditions, or economic conditions in Europe, theUnited States or other key markets, remain uncertain, persist, or deteriorate further, consumerpurchasing power and demand for Company products could decline, and we may experience materialadverse impacts on our business, operating results, and financial condition.
Increases in the cost and restrictions on the availability of raw materials couldadversely affect our financial results.
The Company sources raw materials including agricultural commodities such as tomatoes,cucumbers, potatoes, onions, other fruits and vegetables, dairy products, meat, sugar and othersweeteners, including high fructose corn syrup, spices, and flour, as well as packaging materials suchas glass, plastic, metal, paper, fiberboard, and other materials in order to manufacture products. Theavailability or cost of such commodities may fluctuate widely due to government policy and regu-lation, crop failures or shortages due to plant disease or insect and other pest infestation, weatherconditions, increased demand for biofuels, or other unforeseen circumstances. Additionally, the costof raw materials and finished products may fluctuate due to movements in cross-currency trans-action rates. To the extent that any of the foregoing or other unknown factors increase the prices ofsuch commodities or materials and the Company is unable to increase its prices or adequately hedgeagainst such changes in a manner that offsets such changes, the results of its operations could bematerially and adversely affected. Similarly, if supplier arrangements and relationships result inincreased and unforeseen expenses, the Company’s financial results could be materially andadversely impacted.
Disruption of our supply chain could adversely affect our business.
Damage or disruption to our manufacturing or distribution capabilities due to weather, naturaldisaster, fire, terrorism, pandemic, strikes, the financial and/or operational instability of key sup-pliers, distributors, warehousing and transportation providers, or brokers, or other reasons couldimpair our ability to manufacture or sell our products. To the extent the Company is unable to, orcannot financially mitigate the likelihood or potential impact of such events, or to effectively managesuch events if they occur, particularly when a product is sourced from a single location, there could bea materially adverse affect on our business and results of operations, and additional resources couldbe required to restore our supply chain.
7

Higher energy costs and other factors affecting the cost of producing, transporting,and distributing the Company’s products could adversely affect our financial results.
Rising fuel and energy costs may have a significant impact on the cost of operations, includingthe manufacture, transportation, and distribution of products. Fuel costs may fluctuate due to anumber of factors outside the control of the Company, including government policy and regulationand weather conditions. Additionally, the Company may be unable to maintain favorable arrange-ments with respect to the costs of procuring raw materials, packaging, services, and transportingproducts, which could result in increased expenses and negatively affect operations. If the Companyis unable to hedge against such increases or raise the prices of its products to offset the changes, itsresults of operations could be materially and adversely affected.
The results of the Company could be adversely impacted as a result of increasedpension, labor, and people-related expenses.
Inflationary pressures and any shortages in the labor market could increase labor costs, whichcould have a material adverse effect on the Company’s consolidated operating results or financialcondition. The Company’s labor costs include the cost of providing employee benefits in the U.S. andforeign jurisdictions, including pension, health and welfare, and severance benefits. Any declines inmarket returns could adversely impact the funding of pension plans, the assets of which are investedin a diversified portfolio of equity and fixed income securities and other investments. Additionally,the annual costs of benefits vary with increased costs of health care and the outcome of collectively-bargained wage and benefit agreements.
The impact of various food safety issues, environmental, legal, tax, and otherregulations and related developments could adversely affect the Company’s sales andprofitability.
The Company is subject to numerous food safety and other laws and regulations regarding themanufacturing, marketing, and distribution of food products. These regulations govern matters suchas ingredients, advertising, taxation, relations with distributors and retailers, health and safetymatters, and environmental concerns. The ineffectiveness of the Company’s planning and policieswith respect to these matters, and the need to comply with new or revised laws or regulations withregard to licensing requirements, trade and pricing practices, environmental permitting, or otherfood or safety matters, or new interpretations or enforcement of existing laws and regulations, as wellas any related litigation, may have a material adverse effect on the Company’s sales and profitability.Influenza or other pandemics could disrupt production of the Company’s products, reduce demand forcertain of the Company’s products, or disrupt the marketplace in the foodservice or retail environ-ment with consequent material adverse effect on the Company’s results of operations.
The need for and effect of product recalls could have an adverse impact on theCompany’s business.
If any of the Company’s products become misbranded or adulterated, the Company may need toconduct a product recall. The scope of such a recall could result in significant costs incurred as a resultof the recall, potential destruction of inventory, and lost sales. Should consumption of any productcause injury, the Company may be liable for monetary damages as a result of a judgment against it. Asignificant product recall or product liability case could cause a loss of consumer confidence in theCompany’s food products and could have a material adverse effect on the value of its brands andresults of operations.
8

The failure of new product or packaging introductions to gain trade and consumeracceptance and changes in consumer preferences could adversely affect our sales.
The success of the Company is dependent upon anticipating and reacting to changes in consumerpreferences, including health and wellness. There are inherent marketplace risks associated withnew product or packaging introductions, including uncertainties about trade and consumer accep-tance. Moreover, success is dependent upon the Company’s ability to identify and respond toconsumer trends through innovation. The Company may be required to increase expenditures fornew product development. The Company may not be successful in developing new products orimproving existing products, or its new products may not achieve consumer acceptance, each ofwhich could materially and negatively impact sales.
The failure to successfully integrate acquisitions and joint ventures into our existingoperations or the failure to gain applicable regulatory approval for such transactionsor divestitures could adversely affect our financial results.
The Company’s ability to efficiently integrate acquisitions and joint ventures into its existingoperations also affects the financial success of such transactions. The Company may seek to expandits business through acquisitions and joint ventures, and may divest underperforming or non-corebusinesses. The Company’s success depends, in part, upon its ability to identify such acquisition, jointventure, and divestiture opportunities and to negotiate favorable contractual terms. Activities insuch areas are regulated by numerous antitrust and competition laws in the U. S., the EuropeanUnion, and other jurisdictions, and the Company may be required to obtain the approval of acqui-sition and joint venture transactions by competition authorities, as well as satisfy other legalrequirements. The failure to obtain such approvals could materially and adversely affect our results.
The Company’s operations face significant foreign currency exchange rate exposure,which could negatively impact its operating results.
The Company holds assets and incurs liabilities, earns revenue, and pays expenses in a variety ofcurrencies other than the U.S. dollar, primarily the British Pound, Euro, Australian dollar, Canadiandollar, and New Zealand dollar. The Company’s consolidated financial statements are presented inU.S. dollars, and therefore the Company must translate its assets, liabilities, revenue, and expensesinto U.S. dollars for external reporting purposes. Increases or decreases in the value of the U.S. dollarrelative to other currencies may materially and negatively affect the value of these items in theCompany’s consolidated financial statements, even if their value has not changed in their originalcurrency. In addition, the impact of fluctuations in foreign currency exchange rates on transactioncosts ( i.e., the impact of foreign currency movements on particular transactions such as raw materialsourcing), most notably in the U.K., could materially and adversely affect our results.
The Company could incur more debt, which could have an adverse impact on ourbusiness.
The Company may incur additional indebtedness in the future to fund acquisitions, repurchaseshares, or fund other activities for general business purposes, which could result in a downwardchange in credit rating. The Company’s ability to make payments on and refinance its indebtednessand fund planned capital expenditures depends upon its ability to generate cash in the future. Thecost of incurring additional debt could increase in the event of possible downgrades in the Company’scredit rating.
The failure to implement our growth plans could adversely affect the Company’sability to increase net income and generate cash.
The success of the Company could be impacted by its inability to continue to execute on itsgrowth plans regarding product innovation, implementing cost-cutting measures, improving supply
9

chain efficiency, enhancing processes and systems, including information technology systems, on aglobal basis, and growing market share and volume. The failure to fully implement the plans, in atimely manner or within our cost estimates, could materially and adversely affect the Company’sability to increase net income. Additionally, the Company’s ability to pay cash dividends will dependupon its ability to generate cash and profits, which, to a certain extent, is subject to economic,financial, competitive, and other factors beyond the Company’s control.
CAUTIONARY STATEMENT RELEVANT TO FORWARD-LOOKING INFORMATION
Statements about future growth, profitability, costs, expectations, plans, or objectives includedin this report, including in management’s discussion and analysis, and the financial statements andfootnotes, are forward-looking statements based on management’s estimates, assumptions, andprojections. These forward-looking statements are subject to risks, uncertainties, assumptionsand other important factors, many of which may be beyond the Company’s control and could causeactual results to differ materially from those expressed or implied in this report and the financialstatements and footnotes. Uncertainties contained in such statements include, but are not limited to:
• sales, earnings, and volume growth,
• general economic, political, and industry conditions, including those that could impact con-sumer spending,
• competitive conditions, which affect, among other things, customer preferences and thepricing of products, production, and energy costs,
• competition from lower-priced private label brands,
• increases in the cost and restrictions on the availability of raw materials including agricul-tural commodities and packaging materials, the ability to increase product prices in response,and the impact on profitability,
• the ability to identify and anticipate and respond through innovation to consumer trends,
• the need for product recalls,
• the ability to maintain favorable supplier and customer relationships, and the financialviability of those suppliers and customers,
• currency valuations and devaluations and interest rate fluctuations,
• changes in credit ratings, leverage, and economic conditions, and the impact of these factors onour cost of borrowing and access to capital markets,
• our ability to effectuate our strategy, which includes our continued evaluation of potentialacquisition opportunities, including strategic acquisitions, joint ventures, divestitures andother initiatives, including our ability to identify, finance and complete these initiatives, andour ability to realize anticipated benefits from them,
• the ability to successfully complete cost reduction programs and increase productivity,
• the ability to effectively integrate acquired businesses,
• new products, packaging innovations, and product mix,
• the effectiveness of advertising, marketing, and promotional programs,
• supply chain efficiency,
• cash flow initiatives,
• risks inherent in litigation, including tax litigation,
10

• the ability to further penetrate and grow and the risk of doing business in internationalmarkets, including our emerging markets, economic or political instability in those marketsand the performance of business in hyperinflationary environments, such as Venezuela, andthe uncertain global macroeconomic environment and sovereign debt issues, particularly inEurope,
• changes in estimates in critical accounting judgments and changes in laws and regulations,including tax laws,
• the success of tax planning strategies,
• the possibility of increased pension expense and contributions and other people-related costs,
• the potential adverse impact of natural disasters, such as flooding and crop failures,
• the ability to implement new information systems and potential disruptions due to failures ininformation technology systems,
• with regard to dividends, dividends must be declared by the Board of Directors and will besubject to certain legal requirements being met at the time of declaration, as well as ourBoard’s view of our anticipated cash needs, and
• other factors as described in “Risk Factors” above.
The forward-looking statements are and will be based on management’s then current views andassumptions regarding future events and speak only as of their dates. The Company undertakes noobligation to publicly update or revise any forward-looking statements, whether as a result of newinformation, future events or otherwise, except as required by the securities laws.
Item 1B. Unresolved Staff Comments.
Nothing to report under this item.
Item 2. Properties.
See table in Item 1.
Item 3. Legal Proceedings.
Nothing to report under this item.
Item 4. (Removed and Reserved).
11

PART II
Item 5. Market for Registrant’s Common Equity, Related Stockholder Matters andIssuer Purchases of Equity Securities.
Information relating to the Company’s common stock is set forth in this report on pages 35through 36 under the caption “Stock Market Information” in Item 7—“Management’s Discussion andAnalysis of Financial Condition and Results of Operations,” and on pages 85 through 86 in Note 16,“Quarterly Results” in Item 8—“Financial Statements and Supplementary Data.”
The Board of Directors authorized a share repurchase program on May 31, 2006 for a maximumof 25 million shares. The Company did not repurchase any shares of its common stock during thefourth quarter of Fiscal 2010. As of April 28, 2010, the maximum number of shares that may yet bepurchased under the 2006 program is 6,716,192.
12

Item 6. Selected Financial Data.
The following table presents selected consolidated financial data for the Company and itssubsidiaries for each of the five fiscal years 2006 through 2010. All amounts are in thousands exceptper share data.
April 28,2010
(52 Weeks)
April 29,2009
(52 Weeks)
April 30,2008
(52 Weeks)
May 2,2007
(52 Weeks)
May 3,2006
(53 Weeks)
Fiscal Year Ended
Sales(1) . . . . . . . . . . . . . . . . . . . . $10,494,983 $10,011,331 $ 9,885,556 $ 8,800,071 $8,469,968Interest expense(1) . . . . . . . . . . . . 295,711 339,635 364,808 333,037 316,274Income from continuing
operations(1)(4) . . . . . . . . . . . . . 931,940 944,400 858,176 794,398 435,192Income from continuing
operations per shareattributable to H.J. HeinzCompany commonshareholders—diluted(1)(5) . . . . 2.87 2.91 2.62 2.34 1.25
Income from continuingoperations per shareattributable to H.J. HeinzCompany commonshareholders—basic(1)(5) . . . . . 2.89 2.95 2.65 2.37 1.26
Short-term debt and currentportion of long-term debt(2) . . . 59,020 65,638 452,708 468,243 54,969
Long-term debt, exclusive ofcurrent portion(2) . . . . . . . . . . . 4,559,152 5,076,186 4,730,946 4,413,641 4,357,013
Total assets(3) . . . . . . . . . . . . . . . 10,075,711 9,664,184 10,565,043 10,033,026 9,737,767Cash dividends per common
share. . . . . . . . . . . . . . . . . . . . . 1.68 1.66 1.52 1.40 1.20
(1) Amounts exclude the operating results related to the Company’s private label frozen dessertsbusiness in the U.K. as well as the Kabobs and Appetizers And, Inc. businesses in the U.S., whichwere divested in Fiscal 2010 and have been presented as discontinued operations. Amounts alsoexclude the operating results related to the Company’s European seafood and Tegel» poultrybusinesses which were divested in Fiscal 2006 and have been presented as discontinuedoperations.
(2) Long-term debt, exclusive of current portion, includes $207.1 million, $251.5 million,$198.3 million, $71.0 million, and ($1.4) million of hedge accounting adjustments associatedwith interest rate swaps at April 28, 2010, April 29, 2009, April 30, 2008, May 2, 2007, and May 3,2006, respectively. H.J. Heinz Finance Company’s (“HFC”) mandatorily redeemable preferredshares of $350 million in Fiscals 2010 and 2009 and $325 million in Fiscals 2008-2006 areclassified as long-term debt.
(3) Fiscals 2010-2007 reflect the adoption of new accounting guidance for defined benefit pension andother postretirement plans.
(4) Amounts have been restated to reflect the adoption in Fiscal 2010 of new accounting guidance onnoncontrolling interests. Such guidance changed the accounting and reporting for minorityinterests. As such, income from continuing operations includes $17.5 million, $14.9 million,$11.6 million, $14.3 million, and $5.7 million of income attributable to noncontrolling interestsfor the fiscal years ended April 28, 2010, April 29, 2009, April 30, 2008, May 2, 2007, and May 3,2006, respectively.
(5) Amounts have been restated to reflect the adoption in Fiscal 2010 of new accounting guidance fordetermining whether instruments granted in share-based payment awards that contain non-
13

forfeitable rights to dividends or dividend equivalents (either paid or unpaid) are participatingsecurities and shall be included in the computation of earnings per share pursuant to the two-class method. As a result of adopting this guidance, both basic and diluted earnings per sharefrom continuing operations was reduced by $0.01 in Fiscals 2010, 2009 and 2007, by $0.02 inFiscal 2008 and had a less than $0.01 impact in Fiscal 2006.
Fiscal 2010 results from continuing operations include expenses of $37.7 million pretax($27.8 million after tax) for upfront productivity charges and a gain of $15.0 million pretax($11.1 million after tax) on a property disposal in the Netherlands. The upfront productivity chargesinclude costs associated with targeted workforce reductions and asset write-offs, that were part of acorporation-wide initiative to improve productivity. The asset write-offs related to two factoryclosures and the exit of a formula business in the U.K. See “Discontinued Operations and OtherDisposals” in Item 7, “Management’s Discussion and Analysis of Financial Condition and Results ofOperations” on pages 16 through 17 for further explanation of the property disposal in theNetherlands.
As a result of the Company’s strategic transformation, the Fiscal 2006 results from continuingoperations include expenses of $124.3 million pretax ($80.1 million after tax) for targeted workforcereductions consistent with the Company’s goals to streamline its businesses and expenses of$22.0 million pretax ($16.3 million after tax) for strategic review costs related to the potentialdivestiture of several businesses. Also, $206.5 million pretax ($153.9 million after tax) was recordedfor net losses on non-core businesses and product lines which were sold in Fiscal 2006, and assetimpairment charges on non-core businesses and product lines which were sold in Fiscal 2007. Alsoduring Fiscal 2006, the Company reversed valuation allowances of $27.3 million primarily related toThe Hain Celestial Group, Inc. (“Hain”). In addition, results include $24.4 million of tax expenserelating to the impact of the American Jobs Creation Act.
14

Item 7. Management’s Discussion and Analysis of Financial Condition and Results ofOperations.
Executive Overview- Fiscal 2010
The H.J. Heinz Company has been a pioneer in the food industry for over 140 years and possessesone of the world’s best and most recognizable brands—Heinz». The Company has a global portfolio ofleading brands focused in three core categories, Ketchup and Sauces, Meals and Snacks, and Infant/Nutrition.
In Fiscal 2010, the Company reported diluted earnings per share from continuing operations of$2.87, compared to $2.91 in the prior year. During Fiscal 2009, key foreign currencies declinedprecipitously versus the U.S. dollar. Given that over 60% of the Company’s sales and the majorityof its net income are generated outside of the U.S., foreign currency movements have a significantimpact on the Company’s financial results. However, in Fiscal 2009, forward contracts were put in placeto largely mitigate the unfavorable translation impact on profit associated with movements in keyforeign currencies. In the first half of Fiscal 2010, foreign currencies remained unfavorable but began torebound in the second half of the fiscal year. Overall, currency movements had a $0.29 unfavorableimpact on the change in EPS from continuing operations in Fiscal 2010 versus 2009, after taking intoaccount the net effect of current and prior year currency translation contracts, as well as foreigncurrency movements on translation and transactions involving inventory sourcing in the U.K.
EPS from continuing operations for the year reflects 4.8% growth in sales, a 50 basis pointimprovement in the gross profit margin and a 25.7% increase in marketing investments. Full yearsales benefited from combined volume and pricing gains of 2.1%, led by the emerging markets and ourtop 15 brands, most notably the Heinz», Complan» and ABC» brands. Emerging markets generated30% of the Company’s reported sales growth and 15% of total Company sales. Also driving the salesgrowth was increased consumer marketing investments and new product development. Acquisitionsand foreign exchange translation rates had a favorable impact on sales. The gross profit marginincreased as a result of productivity improvements and higher net pricing, partially offset by highercommodity input costs including the impact of transaction-related currency cross-rates in the U.K. InFiscal 2010, the Company incurred $28 million in after-tax charges for targeted workforce reductionsand non-cash asset write-offs that were part of a corporate-wide initiative to improve productivity,partially offset by an $11 million after-tax gain related to a property sale in the Netherlands. TheCompany’s Fiscal 2010 EPS from continuing operations results also reflect reduced net interestexpense. Prior year EPS from continuing operations benefited from $107 million in currency gainswhich had an insignificant impact to the current year. The Company generated record cash flow fromoperating activities of $1.26 billion, a $95 million increase from the prior year.
Management believes these Fiscal 2010 results are indicative of the effectiveness of theCompany’s business plan, which is focused on the following four strategic pillars:
• Grow the Core Portfolio
• Accelerate Growth in Emerging Markets
• Strengthen and Leverage Global Scale
• Make Talent an Advantage
The recent global recession has dramatically affected consumer confidence, behavior, spending andultimately food consumption patterns. The Company has adapted its strategies to address the currentglobal economic environment and believes these strategies have enabled Heinz to drive growth, deliverimproved performance and sustain momentum. The Company has concentrated on the following:
• Investing behind core brands, proven ideas and growth through innovation;
• Focusing investments in marketing and research and development toward delivering value toconsumers;
15

• Continuing its focus on emerging markets where economic growth remains well above theglobal average;
• Increasing margins through productivity initiatives, reductions in discretionary spending andtight management of fixed costs; and
• Increasing cash flow through reductions in average inventory levels and management ofcapital spending.
The Company remains confident in its underlying business fundamentals and plans to continueto apply these strategies in Fiscal 2011. Movements in foreign currency exchange rates are expectedto impact Fiscal 2011 reported results.
Discontinued Operations and Other Disposals
During the third quarter of Fiscal 2010, the Company completed the sale of its Appetizers And,Inc. frozen hors d’oeuvres business which was previously reported within the U.S. Foodservicesegment, resulting in a $14.5 million pre-tax ($10.4 million after-tax) loss. Also during the thirdquarter, the Company completed the sale of its private label frozen desserts business in the U.K.,resulting in a $31.4 million pre-tax ($23.6 million after-tax) loss. During the second quarter of Fiscal2010, the Company completed the sale of its Kabobs frozen hors d’oeuvres business which waspreviously reported within the U.S. Foodservice segment, resulting in a $15.0 million pre-tax($10.9 million after-tax) loss. The losses on each of these transactions have been recorded indiscontinued operations.
In accordance with accounting principles generally accepted in the United States of America, theoperating results related to these businesses have been included in discontinued operations in theCompany’s consolidated statements of income for all periods presented. The following table presentssummarized operating results for these discontinued operations:
April 28,2010 FY
2010
April 29,2009 FY
2009
April 30,2008 FY
2008
Fiscal Year Ended
(Millions of Dollars)
Sales . . . . . . . . . . . . . . . . . . . . . . . . . . . . . . . . . . . . . . . . . . . $63.0 $136.8 $185.2Net after-tax losses . . . . . . . . . . . . . . . . . . . . . . . . . . . . . . . . $ (4.7) $ (6.4) $ (1.7)Tax benefit/(provision) on losses . . . . . . . . . . . . . . . . . . . . . . $ 2.0 $ 2.4 $ (0.3)
On March 31, 2010, the Company received cash proceeds of $95 million from the government ofthe Netherlands for property the government acquired through eminent domain proceedings. Thetransaction includes the purchase by the government of the Company’s factory located in Nijmegen,which produces soups, pasta and cereals. The cash proceeds are intended to compensate the Com-pany for costs, both capital and expense, the Company will incur over the next three years to exit thecurrent factory location and construct certain new facilities. Note, the Company will likely incur coststo rebuild an R&D facility in the Netherlands, costs to transfer a cereal line to another factorylocation, employee costs for severance and other costs directly related to the closure and relocation ofthe existing facilities. The Company also entered into a three-year leaseback on the Nijmegen factory.The Company will continue to operate in the leased factory over the next three years while com-mencing to execute its plans for closure and relocation of the operations. The Company has accountedfor the proceeds on a cost recovery basis. In doing so, the Company has made its estimates of cost, bothof a capital and expense nature, to be incurred and recovered and to which proceeds from thetransaction will be applied. Of the proceeds received, $81 million has been deferred based onmanagement’s total estimated future costs to be recovered and incurred and has been recorded inother non-current liabilities, other accrued liabilities and accumulated depreciation in the Compa-ny’s consolidated balance sheet as of April 28, 2010. Proceeds of $15 million represent the excess ofproceeds received over estimated costs to be recovered and incurred which has been recorded as a
16

reduction of cost of products sold in the consolidated statement of income for the year ended April 28,2010. In the future, the deferred amounts will be recognized as the related costs are incurred and ifestimated costs differ from amounts actually incurred there could be adjustments that will bereflected in earnings.
Results of Continuing Operations
The Company’s revenues are generated via the sale of products in the following categories:
April 28,2010
(52 Weeks)
April 29,2009
(52 Weeks)
April 30,2008
(52 Weeks)
Fiscal Year Ended
(Dollars in thousands)
Ketchup and sauces . . . . . . . . . . . . . . . . . . . . . $ 4,446,911 $ 4,251,583 $4,081,864Meals and snacks . . . . . . . . . . . . . . . . . . . . . . . 4,289,977 4,225,127 4,336,475Infant/Nutrition . . . . . . . . . . . . . . . . . . . . . . . . 1,157,982 1,105,313 1,089,544Other . . . . . . . . . . . . . . . . . . . . . . . . . . . . . . . . 600,113 429,308 377,673
Total . . . . . . . . . . . . . . . . . . . . . . . . . . . . . . . . . $10,494,983 $10,011,331 $9,885,556
Fiscal Year Ended April 28, 2010 compared to Fiscal Year Ended April 29, 2009
Sales for Fiscal 2010 increased $484 million, or 4.8%, to $10.49 billion. Net pricing increasedsales by 3.4%, largely due to the carryover impact of broad-based price increases taken in Fiscal 2009to help offset increased commodity costs. Volume decreased 1.3%, as favorable volume in emergingmarkets was more than offset by declines in the U.S. and Australian businesses. Volume wasimpacted by aggressive competitor promotional activity and softness in some of the Company’sproduct categories, as well as reduced foot traffic in U.S. restaurants this year. Emerging marketscontinued to be an important growth driver, with combined volume and pricing gains of 15.3%. Inaddition, the Company’s top 15 brands performed well, with combined volume and pricing gains of3.4%, led by the Heinz», Complan» and ABC» brands. Acquisitions, net of divestitures, increasedsales by 2.2%. Foreign exchange translation rates increased sales by 0.5% compared to the prior year.
Gross profit increased $225 million, or 6.3%, to $3.79 billion, and the gross profit marginincreased to 36.2% from 35.7%. The improvement in gross margin reflects higher net pricing andproductivity improvements, partially offset by higher commodity costs including transaction cur-rency costs. Acquisitions had a favorable impact on gross profit dollars but reduced overall grossprofit margin. In addition, gross profit was unfavorably impacted by lower volume and $24 million ofcharges for a corporation-wide initiative to improve productivity, partially offset by a $15 million gainrelated to property sold in the Netherlands as discussed previously.
Selling, general and administrative expenses (“SG&A”) increased $168 million, or 8.1%, to$2.24 billion, and increased as a percentage of sales to 21.3% from 20.6%. The increase reflects theimpact from additional marketing investments, acquisitions, inflation in Latin America, and higherpension and incentive compensation expenses. In addition, SG&A was impacted by $14 millionrelated to targeted workforce reductions in the current year and a gain in the prior year on the sale ofa small portion control business in the U.S. These increases were partially offset by improvements inselling and distribution expenses (“S&D”), reflecting productivity improvements and lower fuel costs.
Operating income increased $57 million, or 3.8%, to $1.56 billion, reflecting the items above.
Net interest expense decreased $25 million, to $251 million, reflecting a $44 million decrease ininterest expense and a $19 million decrease in interest income. The decreases in interest income andinterest expense are primarily due to lower average interest rates.
Other expenses, net, increased $111 million primarily due to a $105 million decrease in currencygains, and $9 million of charges recognized in connection with the August 2009 dealer remarketable
17

securities (“DRS”) exchange transaction (see below in “Liquidity and Financial Position” for furtherexplanation of this transaction). The decrease in currency gains reflects prior year gains of$107 million related to forward contracts that were put in place to help mitigate the unfavorableimpact of translation associated with key foreign currencies for Fiscal 2009.
The effective tax rate for Fiscal 2010 was 27.8% compared to 28.4% for the prior year. The currentyear effective tax rate was lower than the prior year primarily due to tax efficient financing of theCompany’s operations, partially offset by higher taxes on repatriation of earnings.
Income from continuing operations attributable to H. J. Heinz Company was $914 millioncompared to $930 million in the prior year, a decrease of 1.6%. The decrease reflects the prior yearcurrency gains discussed above, which were $66 million after-tax ($0.21 per share), and $28 million inafter-tax charges ($0.09 per share) in Fiscal 2010 for targeted workforce reductions and non-cashasset write-offs, partially offset by higher operating income, reduced net interest expense, a lowereffective tax rate and an $11 million after-tax gain related to property sold in the Netherlands.Diluted earnings per share from continuing operations was $2.87 in Fiscal 2010 compared to $2.91 inthe prior year, down 1.4%. EPS movements were unfavorably impacted by $0.29, or $90 million of netincome, from currency fluctuations, after taking into account the net effect of current and prior yearcurrency translation contracts, as well as foreign currency movements on translation and U.K.transaction costs.
The impact of fluctuating translation exchange rates in Fiscal 2010 has had a relativelyconsistent impact on all components of operating income on the consolidated statement of income.The impact of cross currency sourcing of inventory reduced gross profit and operating income but didnot affect sales.
FISCAL YEAR 2010 OPERATING RESULTS BY BUSINESS SEGMENT
North American Consumer Products
Sales of the North American Consumer Products segment increased $56 million, or 1.8%, to$3.19 billion. Net prices grew 1.9% reflecting the carryover impact of price increases taken across themajority of the product portfolio throughout Fiscal 2009, partially offset by increased promotionalspending in the current year, particularly on Smart Ones» frozen entrees and Heinz» ketchup.Volume decreased 1.5%, reflecting declines in frozen meals and desserts due to category softness,competitor promotional activity and the impact of price increases. Volume declines were also noted inOre-Ida» frozen potatoes, Classico» pasta sauces and frozen snacks. These volume declines werepartially offset by increases in TGI Friday’s» Skillet Meals due to new product introductions andincreased trade promotions and marketing as well as growth in Heinz» ketchup. The acquisition ofArthur’s Fresh Company, a small chilled smoothies business in Canada, at the beginning of the thirdquarter of this year increased sales 0.2%. Favorable Canadian exchange translation rates increasedsales 1.3%.
Gross profit increased $80 million, or 6.3%, to $1.34 billion, and the gross profit margin increasedto 41.9% from 40.1%. The higher gross margin reflects productivity improvements and the carryoverimpact of price increases, partially offset by increased commodity costs. The favorable impact offoreign exchange on gross profit was more than offset by unfavorable volume. Operating incomeincreased $47 million, or 6.4%, to $771 million, reflecting the improvement in gross profit andreduced S&D, partially offset by increased marketing investment, pension costs and incentivecompensation expense. The improvement in S&D was a result of productivity projects, tight costcontrol and lower fuel costs.
18

Europe
Heinz Europe sales increased $4 million, or 0.1%, to $3.33 billion. Unfavorable foreign exchangetranslation rates decreased sales by 1.9%. Net pricing increased 2.4%, driven by the carryover impactof price increases taken in Fiscal 2009, partially offset by increased promotions, particularly in theU.K. and Continental Europe. Volume decreased 0.9%, principally due to decreases in France fromthe rationalization of low-margin sauces, and increased competitor promotional activity on frozenproducts in the U.K. Volume for infant nutrition products in the U.K. and Italy also declined, alongwith decreases in Heinz» pasta meals as a result of reduced promotional activities. Lower volume inItaly reflects the overall category decline in that country. Volume improvements were posted on soupsin the U.K. and Germany as well as Heinz» ketchup across Europe, particularly in Russia where bothketchup, sauces and infant feeding products are growing at double digit rates. Acquisitions, net ofdivestitures, increased sales 0.5%, largely due to the acquisition of the Bénédicta» sauce business inFrance in the second quarter of Fiscal 2009.
Gross profit decreased $9 million, or 0.7%, to $1.25 billion, and the gross profit margin decreasedto 37.4% from 37.7%. The decline in gross profit is largely due to unfavorable foreign exchangetranslation rates and increased commodity costs, including the cross currency rate movements in theBritish pound versus the euro and U.S. dollar. These declines were partially mitigated by higherpricing and productivity improvements. Operating income decreased $17 million, or 2.9%, to$554 million, due to unfavorable foreign currency translation and transaction impacts, as well asincreased marketing and higher incentive compensation expense, partially offset by reduced S&D.
Asia/Pacific
Heinz Asia/Pacific sales increased $380 million, or 23.3%, to $2.01 billion. Acquisitions increasedsales 12.6% due to the prior year acquisitions of Golden Circle Limited, a health-oriented fruit andjuice business in Australia, and La Bonne Cuisine, a chilled dip business in New Zealand. Pricingincreased 2.0%, reflecting current and prior year increases on ABC» products in Indonesia as well asthe carryover impact of prior year price increases and reduced promotions in New Zealand. Theseincreases were partially offset by reduced net pricing on Long Fong» frozen products in China due toincreased promotional spending. Volume increased 1.0%, as significant growth in Complan» andGlucon D» nutritional beverages in India and ABC» products in Indonesia was more than offset bygeneral softness in both Australia and New Zealand, which have been impacted by competitiveactivity and reduced market demand associated with higher prices. Favorable exchange translationrates increased sales by 7.8%.
Gross profit increased $83 million, or 15.6%, to $612 million, and the gross profit margin declinedto 30.5% from 32.5%. The $83 million increase in gross profit was due to higher volume and pricing,productivity improvements and favorable foreign exchange translation rates. These increases werepartially offset by increased commodity costs, which include the impact of cross-currency rates oninventory costs. Acquisitions had a favorable impact on gross profit dollars but reduced overall grossprofit margin. Operating income increased by $13 million, or 7.0%, to $195 million, as the increase ingross profit was partially offset by increased SG&A related to acquisitions, the impact of foreignexchange translation rates and increased marketing investments.
U.S. Foodservice
Sales of the U.S. Foodservice segment decreased $21 million, or 1.5%, to $1.43 billion. Pricingincreased sales 4.4%, largely due to prior year price increases taken across the portfolio. Volumedecreased by 5.5%, due to industry-wide declines in U.S. restaurant traffic and sales, targeted SKUreductions, the unfavorable impact from price increases and increased competitive activity. Prioryear divestitures reduced sales 0.4%.
Gross profit increased $49 million, or 13.8%, to $402 million, and the gross profit marginincreased to 28.1% from 24.3%, as cumulative price increases helped return margins for this business
19

closer to their historical levels. In the current year, gross profit benefited from pricing and produc-tivity improvements as well as commodity cost favorability which more than offset unfavorablevolume. Operating income increased $21 million, or 16.4%, to $151 million, which is primarily due togross profit improvements and reduced S&D reflecting productivity projects, tight cost control andlower fuel costs. These improvements were partially offset by increased marketing expense andhigher general and administrative expenses (“G&A”) resulting from increased pension and incentivecompensation costs and a prior year gain on the sale of a small, non-core portion control business.
Rest of World
Sales for Rest of World increased $65 million, or 14.0%, to $533 million. Higher pricing increasedsales by 23.1%, largely due to current and prior year price increases in Latin America taken tomitigate the impact of raw material and labor inflation. Volume increased 2.3% reflecting increasesin Latin America and the Middle East. Acquisitions increased sales 0.8% due to the prior yearacquisition of Papillon, a small chilled products business in South Africa. Foreign exchange trans-lation rates decreased sales 12.2%, largely due to the devaluation of the Venezuelan bolivar fuerte(“VEF”) late in the third quarter of this fiscal year (See the “Venezuela- Foreign Currency andInflation” section below for further explanation).
Gross profit increased $37 million, or 23.1%, to $199 million, due mainly to increased pricing,partially offset by increased commodity costs and the impact of the VEF devaluation. Operatingincome increased $17 million, or 32.2% to $69 million, as the increase in gross profit was partiallyoffset by increased marketing and higher S&D and G&A expenses reflecting growth-related invest-ments and inflation in Latin America.
Fiscal Year Ended April 29, 2009 compared to Fiscal Year Ended April 30, 2008
Sales for Fiscal 2009 increased $126 million, or 1.3%, to $10.01 billion. Net pricing increasedsales by 7.1%, as price increases were taken across the Company’s portfolio to help compensate forincreases in commodity costs. Volume decreased 1.1%, as a net volume improvement in emergingmarkets was more than offset by declines in the U.S., Australian and New Zealand businesses, whichwere impacted by the recessionary economic environment. Volume also declined on frozen productsin the U.K. Acquisitions, net of divestitures, increased sales by 1.9%. Foreign exchange translationrates reduced sales by 6.6%, reflecting the impact of a strengthening U.S. dollar on sales generated ininternational markets.
Sales of the Company’s top 15 brands grew 2.1% from Fiscal 2008, as combined volume andpricing gains exceeded the 6.3% unfavorable impact of foreign exchange translation rates on sales.Excluding the impact of foreign exchange, the top 15 brands grew by 8.4%, led by strong growth inHeinz», Ore-Ida», Classico», Pudliszki» and ABC» branded products. In addition, global ketchupsales increased 3.2% despite a 5.9% unfavorable impact from foreign exchange, resulting in a 9.1%increase excluding the impact of currency translation. Emerging markets continued to be animportant growth driver, with sales up 8.8%. Excluding a 7% impact from unfavorable foreignexchange, emerging markets’ sales grew 15.8%.
Gross profit decreased $83 million, or 2.3%, to $3.57 billion, as higher net pricing and thefavorable impact of acquisitions was more than offset by a $238 million unfavorable impact fromforeign exchange translation rates as well as higher commodity costs, including transaction currencycosts in the U.K., and lower volume. The gross profit margin decreased to 35.7% from 36.9%, aspricing and productivity improvements were more than offset by increased commodity costs, whichincludes the impact of cross currency sourcing of ingredients, most notably in the U.K.
SG&A decreased $15 million, or 0.7%, to $2.07 billion, and improved as a percentage of sales to20.6% from 21.1%. The $15 million decrease in SG&A is due to a $115 million impact from foreignexchange translation rates, decreased marketing expense, a life insurance settlement benefitreceived in the Fiscal 2009 and a gain on the sale of a small portion control business in the U.S. These
20

decreases were partially offset by increased spending on global task force initiatives, includingsystem capability improvements, the SG&A from acquisitions and inflation in Latin America.
Operating income decreased $68 million, or 4.3%, to $1.5 billion, reflecting the items above,particularly a $123 million (7.8%) unfavorable impact from foreign exchange translation rates, andhigher commodity costs.
Net interest expense decreased $48 million, to $275 million, reflecting a $25 million decrease ininterest expense and a $23 million increase in interest income. Interest expense benefited from loweraverage interest rates in Fiscal 2009, which more than offset a higher coupon on the DRS which wereremarketed on December 1, 2008. The improvement in interest income is due to a $20 millionmark-to-market gain in Fiscal 2009 on a total rate of return swap which was entered into inconjunction with the Company’s DRS on December 1, 2008.
Other income/(expense), net, improved by $109 million, to $93 million of income compared to($16) million of expense in Fiscal 2008, as a $113 million increase in currency gains was partiallyoffset by an insignificant gain recognized on the sale of our business in Zimbabwe in Fiscal 2008. Thecurrency gains resulted primarily from forward contracts that were put in place to help mitigate theunfavorable translation impact on profit associated with movements in key foreign currencies forFiscal 2009.
The effective tax rate for Fiscal 2009 was 28.4% compared to 30.3% for Fiscal 2008. The Fiscal2009 tax rate was lower than Fiscal 2008 primarily due to reduced repatriation costs partially offsetby decreased benefits from the revaluation of tax basis of foreign assets.
Income from continuing operations attributable to H. J. Heinz Company was $930 millioncompared to $847 million in Fiscal 2008, an increase of 9.8%, due to increased currency gains,reduced net interest expense and a lower effective tax rate, partially offset by lower operating incomereflecting unfavorable foreign currency movements. Diluted earnings per share was $2.91 in theFiscal 2009, an increase of 11.1%, compared to $2.62 in the Fiscal 2008. Earnings per share alsobenefited from a 1.1% reduction in fully diluted shares outstanding.
The translation impact of fluctuating exchange rates in Fiscal 2009 has had a relativelyconsistent impact on all components of operating income on the consolidated statement of income.The impact of cross currency sourcing of ingredients, most notably in the U.K., reduced gross profitand operating income but did not affect sales.
FISCAL YEAR 2009 OPERATING RESULTS BY BUSINESS SEGMENT
North American Consumer Products
Sales of the North American Consumer Products segment increased $124 million, or 4.1%, to$3.14 billion. Net prices grew 6.8% reflecting price increases taken across the majority of the productportfolio during Fiscal 2009 to help offset higher commodity costs. Volume decreased 0.4%, asincreases in Ore-Ida» frozen potatoes, Heinz» ketchup and new TGI Friday’s» Skillet Meals weremore than offset by declines in Delimex» frozen products and Smart Ones» frozen meals and desserts.The Ore-Ida» growth was driven by new products such as Steam n’ MashTM in addition to the timing ofprice increases. The Heinz» ketchup improvement was largely due to increased consumption. TheSmart Ones volume decline resulted from softness in the category, aggressive competitive promotionsand the timing of price increases taken in the fourth quarter of Fiscal 2008, partially offset by newbreakfast product offerings in Fiscal 2009. Lower sales of Delimex» frozen meals and snacks was dueto a supply interruption in the first half of Fiscal 2009. Unfavorable Canadian exchange translationrates decreased sales 2.3%.
Gross profit increased $38 million, or 3.1%, to $1.26 billion, due primarily to increased pricingpartially offset by unfavorable foreign exchange translation rates. The gross profit margin decreased
21

to 40.1% from 40.5%, as increased pricing and productivity improvements only partially offsetincreased commodity costs. Operating income increased $46 million, or 6.8%, to $725 million, largelyreflecting the increase in gross profit and decreased marketing expense.
Europe
Heinz Europe sales decreased $89 million, or 2.6%, to $3.33 billion. Net pricing increased 7.1%,driven by Heinz» ketchup, beans and soup, broad-based increases in our Russian market, frozenproducts in the U.K. and Italian infant nutrition products. Volume decreased 0.5%, primarily due todeclines on frozen products as a result of competitor promotions and the exit of lower margin productsand customers. Volume was also unfavorably impacted by decreases in Heinz» soup and pasta mealsin the U.K, and reduced volume in Russia. These declines were partially offset by new productintroductions in the U.K. and Continental Europe. Acquisitions, net of divestitures, increased sales2.6%, primarily due to the acquisition of the Bénédicta» sauce business in France during the secondquarter of Fiscal 2009 and the Wyko» sauce business in the Netherlands at the end of Fiscal 2008.Unfavorable foreign exchange translation rates decreased sales by 11.8%.
Gross profit decreased $110 million, or 8.0%, to $1.26 billion, and the gross profit margindecreased to 37.7% from 40.0% as unfavorable foreign exchange translation rates, cross currency ratemovements in the British Pound versus the Euro and U.S. dollar, increased commodity costs andhigher manufacturing costs in the frozen food plants were only partially offset by improved pricingand the favorable impact from acquisitions. Operating income decreased $75 million, or 11.6%, to$571 million, as pricing gains were more than offset by unfavorable translation, increased commoditycosts, a portion of which was due to the transaction foreign currency impacts discussed above,increased S&D, a portion of which was from acquisitions, and higher G&A reflecting investments intask forces and systems.
Asia/Pacific
Heinz Asia/Pacific sales increased $28 million, or 1.7%, to $1.63 billion. Pricing increased 6.1%,due to increases on sardines, sauces and syrup in Indonesia, nutritional beverages in India andpricing gains across the product portfolios in Australia and New Zealand. This pricing partially offsetincreased commodity costs. Volume decreased 1.4%, as significant improvements on nutritionalbeverage sales in India, frozen foods in Japan and ABC» products in Indonesia were more than offsetby declines in convenience meals in Australia and New Zealand and Long Fong» frozen products inChina. Acquisitions increased sales 6.8% due to the third quarter Fiscal 2009 acquisitions of GoldenCircle Limited and La Bonne Cuisine. Unfavorable foreign exchange translation rates decreasedsales by 9.8%.
Gross profit increased $3 million, or 0.6%, to $530 million, while the gross profit margin declinedto 32.5% from 32.9%. The $3 million improvement in gross profit was due to increased pricing andacquisitions, which offset increased commodity costs, unfavorable foreign exchange translation ratesand reduced volume, particularly in our Long Fong business as we revised our distribution systemand streamlined our product offerings. Operating income decreased by $12 million, or 6.4%, to$182 million, as the increase in gross profit and decreased marketing expense was more than offset byincreased S&D and G&A, a portion of which was due to acquisitions.
U.S. Foodservice
Sales of the U.S. Foodservice segment decreased $37 million, or 2.5%, to $1.45 billion. Pricingincreased sales 3.7%, largely due to increases on Heinz» ketchup, portion control condiments, frozensoups and tomato products. Volume decreased by 5.3%, reflecting reduced restaurant foot traffic, theexit of numerous lower margin products and customers, as well as increased competition on our non-branded products. Divestitures reduced sales 0.9%.
22

Gross profit decreased $44 million, or 11.1%, to $353 million, and the gross profit margindecreased to 24.3% from 26.7%, due to lower volume, higher commodity and manufacturing costs andFiscal 2008 gains on commodity derivative contracts, partially offset by higher pricing. Operatingincome decreased $34 million, or 20.7%, to $129 million, which was primarily due to the decline ingross profit, partially offset by reduced G&A reflecting a gain in Fiscal 2009 on the sale of a small,non-core portion control business.
Rest of World
Sales for Rest of World increased $100 million, or 27.3%, to $468 million. Volume increased 4.6%driven by increases in Latin America and the Middle East. Higher pricing increased sales by 27.6%,largely due to inflation in Latin America and commodity-related price increases in South Africa andthe Middle East. Acquisitions increased sales 0.2% due to the fourth quarter Fiscal 2009 acquisitionof Papillon, a small chilled products business in South Africa. Foreign exchange translation ratesdecreased sales 5.2%.
Gross profit increased $28 million, or 21.4%, to $161 million, due mainly to increased pricing andhigher volume, partially offset by increased commodity costs and unfavorable foreign currencymovements. Operating income increased $7 million, or 15.2% to $52 million due to the increase ingross profit partially offset by wage inflation in Latin America.
Liquidity and Financial Position
For Fiscal 2010, cash provided by operating activities was a record $1.26 billion compared to$1.17 billion in the prior year. The improvement in Fiscal 2010 versus Fiscal 2009 was generateddespite significant contributions to our pension plans, and was primarily due to favorable movementsin working capital and reduced tax payments. Additionally, $84 million of cash was received in thecurrent year in connection with an accounts receivable securitization program (see additionalexplanations below), and the Company also received $48 million of cash from the termination ofa total rate of return swap. In the prior year, the Company received $106 million of cash from thesettlement and maturity of foreign currency contracts that were put in place to help mitigate theimpact of translation associated with key foreign currencies (see Note 12, “Derivative FinancialInstruments and Hedging Activities” in Item 8-“Financial Statements and Supplementary Data” foradditional information). The Company’s cash conversion cycle improved 8 days, to 47 days in Fiscal2010. There was a 6 day improvement in inventories as a result of the Company’s efforts to reduceinventory levels. Receivables accounted for 5 days of the improvement, 4 days of which is a result ofthe accounts receivable securitization program. Accounts payable partially offset these improve-ments, with a 3 day decrease, a portion of which reflects inventory reductions and the resultingdecrease in the amounts due to suppliers.
During Fiscal 2010, the Company made $540 million of contributions to the pension planscompared to $134 million in the prior year. Of this $540 million of payments, $475 million werediscretionary contributions that were made to help offset the impact of adverse conditions in theglobal equity and bond markets in Fiscal 2009. Contributions for Fiscal 2011 are expected to be lessthan $50 million; however, actual contributions may be affected by pension asset and liabilityvaluations during the year.
During the first quarter of Fiscal 2010, the Company entered into a three-year $175 millionaccounts receivable securitization program. Under the terms of the agreement, the Company sells, ona revolving basis, its U.S. receivables to a wholly-owned, bankruptcy-remote-subsidiary. This sub-sidiary then sells all of the rights, title and interest in these receivables to an unaffiliated entity. Afterthe sale, the Company, as servicer of the assets, collects the receivables on behalf of the unaffiliatedentity. The amount of receivables sold through this program as of April 28, 2010 was $84 million.
Cash provided by investing activities totaled $13 million compared to using $761 million of cashlast year. In the current year, proceeds from divestitures provided cash of $19 million which primarily
23

related to the sale of our Kabobs and Appetizers And, Inc. frozen hors d’oeuvres foodservice busi-nesses in the U.S. and our private label frozen desserts business in the U.K. Cash paid for acquisitionsin the current year totaled $11 million and primarily related to Arthur’s Fresh Company, a smallchilled smoothies business in Canada. In the prior year, cash paid for acquisitions, net of divestitures,required $281 million which primarily related to the acquisitions of the Golden Circle Limited fruitand juice business in Australia, the La Bonne Cuisine chilled dip business in New Zealand, theBénédicta» sauce business in France and Papillon, a small chilled products business in South Africa,partially offset by the sale of a small domestic portion control foodservice business. Capital expen-ditures totaled $278 million (2.6% of sales) in Fiscal 2010 compared to $292 million (2.9% of sales) inthe prior year, which is in-line with historic levels. The Company expects capital spending as apercentage of sales to be approximately 3% in Fiscal 2011. Proceeds from disposals of property, plantand equipment were $96 million in Fiscal 2010 compared to $5 million in the prior year reflectingproceeds received in the fourth quarter of this year related to property sold in the Netherlands asdiscussed previously. The current year decrease in restricted cash represents collateral that wasreleased in connection with the termination of a total rate of return swap in August 2009. The prioryear requirement of $193 million for restricted cash represents the posting of this collateral.
Cash used for financing activities in the current year totaled $1.15 billion compared to$516 million last year.
• Proceeds from long-term debt were $447 million in the current year largely reflecting the July2009 issuance of $250 million of 7.125% notes due 2039 by H. J. Heinz Finance Company(“HFC”), a subsidiary of Heinz. These notes are fully, unconditionally and irrevocably guar-anteed by the Company. The proceeds from the notes were used for payment of the cashcomponent of the exchange transaction discussed below as well as various expenses relating tothe exchange, and for general corporate purposes. In addition, the Company received cashproceeds of $167 million related to a 15 billion Japanese yen denominated credit agreementthat was entered into during the second quarter of Fiscal 2010.
• Payments on long-term debt were $630 million in the current year primarily reflecting cashpayments on the DRS exchange transaction discussed below and the payoff of ourA$281 million Australian denominated borrowings which matured on December 16, 2009.
• Proceeds from long-term debt were $853 million in the prior year. The prior year proceedsrepresent the sale of $500 million 5.35% Notes due 2013 as well as the sale of $350 million or3,500 shares of HFC Series B Preferred Stock. The proceeds from both of these prior yeartransactions were used for general corporate purposes, including the repayment of commer-cial paper and other indebtedness incurred to redeem HFC’s Series A Preferred Stock. As aresult, payments on long-term debt were $427 million in the prior year.
• Net payments on commercial paper and short-term debt were $427 million this year comparedto $484 million in the prior year.
• Cash proceeds from option exercises provided $67 million of cash in the current year, and theCompany had no treasury stock purchases in the current year. Cash proceeds from optionexercises, net of treasury stock purchases, were $83 million in the prior year.
• Dividend payments totaled $534 million this year, compared to $525 million for the sameperiod last year, reflecting a 1.2% increase in the annualized dividend per common share to$1.68.
• Acquisition of subsidiary shares from noncontrolling interests of $62 million relates to thepurchase of the remaining 49% interest in Cairo Food Industries, S.A.E., an Egyptian sub-sidiary of the Company that manufactures ketchup, condiments and sauces.
On August 6, 2009, HFC issued $681 million of 7.125% notes due 2039 (of the same series as thenotes issued in July 2009), and paid $218 million of cash, in exchange for $681 million of its
24

outstanding 15.590% DRS due December 1, 2020. In addition, HFC terminated a portion of theremarketing option by paying the remarketing agent a cash payment of $89 million. The exchangetransaction was accounted for as a modification of debt. Accordingly, cash payments used in theexchange, including the payment to the remarketing agent, have been accounted for as a reduction inthe book value of the debt, and will be amortized to interest expense under the effective yield method.Additionally, the Company terminated its $175 million notional total rate of return swap in August2009 in connection with the DRS exchange transaction. See Note 12, “Derivative Financial Instru-ments and Hedging Activities” in Item 8-“Financial Statements and Supplementary Data” foradditional information.
On May 27, 2010, the Company announced that its Board of Directors approved a 7.1% increasein the quarterly dividend on common stock from 42.0 cents to 45.0 cents, an annual indicative rate of$1.80 per share for Fiscal 2011, effective with the July 2010 dividend payment. Fiscal 2011 dividendpayments are expected to be approximately $575 million.
At April 28, 2010, the Company had total debt of $4.62 billion (including $207 million relating tohedge accounting adjustments) and cash and cash equivalents of $483 million. Total debt balancessince prior year end declined $524 million as a result of the items discussed above. The reported cashas of April 28, 2010 was negatively impacted by approximately $56 million due to the currencydevaluation in Venezuela (see “Venezuela- Foreign Currency and Inflation” section below for addi-tional discussion). Access to U.S. dollars in Venezuela at the official (government established)exchange rate is limited and subject to approval by a currency control board in Venezuela.
At April 28, 2010, the Company had $1.7 billion of credit agreements, $1.2 billion of whichexpires in April 2012 and $500 million which expires in April 2013. The credit agreement that expiresin 2013 replaced the $600 million credit agreement that expired in April 2010. These credit agree-ments support the Company’s commercial paper borrowings. As a result, the commercial paperborrowings are classified as long-term debt based upon the Company’s intent and ability to refinancethese borrowings on a long-term basis. The credit agreements have identical covenants which includea leverage ratio covenant in addition to customary covenants. The Company was in compliance withall of its covenants as of April 28, 2010 and April 29, 2009. In addition, the Company has $489 millionof foreign lines of credit available at April 28, 2010.
After-tax return on invested capital (“ROIC”) is calculated by taking net income attributable toH.J. Heinz Company, plus net interest expense net of tax, divided by average invested capital.Average invested capital is a five-point quarterly average of debt plus total H.J. Heinz Companyshareholders’ equity less cash and cash equivalents, short-term investments, restricted cash, and thehedge accounting adjustments. ROIC was 17.8% in Fiscal 2010, 18.4% in Fiscal 2009, and 16.8% inFiscal 2008. Fiscal 2010 ROIC was negatively impacted by 0.9% for the losses on discontinuedoperations. ROIC in Fiscal 2009 was favorably impacted by 1.1% due to the $107 million gain onforeign currency forward contracts discussed earlier. The remaining increase in Fiscal 2010 ROICcompared to Fiscal 2009 is largely due to reduced debt levels and effective management of the assetbase. The increase in ROIC in Fiscal 2009 versus 2008 was largely due to higher net incomeattributable to H.J. Heinz Company and decreased average H.J. Heinz Company shareholders’equity reflecting foreign currency translation adjustments, share repurchases and effective man-agement of the asset base.
The Company will continue to monitor the credit markets to determine the appropriate mix oflong-term debt and short-term debt going forward. The Company believes that its strong operatingcash flow, existing cash balances, together with the credit facilities and other available capitalmarket financing, will be adequate to meet the Company’s cash requirements for operations,including capital spending, debt maturities, acquisitions, share repurchases and dividends to share-holders. While the Company is confident that its needs can be financed, there can be no assurancethat increased volatility and disruption in the global capital and credit markets will not impair itsability to access these markets on commercially acceptable terms.
25

As of April 28, 2010, the Company’s long-term debt ratings at Moody’s, Standard & Poor’s andFitch Rating have remained consistent at Baa2, BBB and BBB, respectively.
Contractual Obligations and Other Commitments
Contractual Obligations
The Company is obligated to make future payments under various contracts such as debtagreements, lease agreements and unconditional purchase obligations. In addition, the Company haspurchase obligations for materials, supplies, services and property, plant and equipment as part ofthe ordinary conduct of business. A few of these obligations are long-term and are based on minimumpurchase requirements. Certain purchase obligations contain variable pricing components, and, as aresult, actual cash payments are expected to fluctuate based on changes in these variable compo-nents. Due to the proprietary nature of some of the Company’s materials and processes, certainsupply contracts contain penalty provisions for early terminations. The Company does not believethat a material amount of penalties is reasonably likely to be incurred under these contracts basedupon historical experience and current expectations.
The following table represents the contractual obligations of the Company as of April 28, 2010.
2011 2012-2013 2014-20152016
Forward Total
Fiscal Year
(Amounts in thousands)
Long Term Debt(1) . . . . $ 334,511 $2,147,033 $1,078,602 $3,278,618 $ 6,838,764Capital Lease
Obligations . . . . . . . . 24,068 74,884 12,801 23,841 135,594Operating Leases . . . . . 78,745 131,765 90,113 151,919 452,542Purchase Obligations . . 1,355,379 1,359,806 545,546 66,277 3,327,008Other Long Term
Liabilities Recordedon the BalanceSheet . . . . . . . . . . . . . 46,377 133,026 105,795 150,191 435,389
Total . . . . . . . . . . . . . . . $1,839,080 $3,846,514 $1,832,857 $3,670,846 $11,189,297
(1) Amounts include expected cash payments for interest on fixed rate long-term debt. Due to theuncertainty of forecasting expected variable rate interest payments, those amounts are notincluded in the table.
Other long-term liabilities primarily consist of certain specific incentive compensation arrange-ments and pension and postretirement benefit commitments. The following long-term liabilitiesincluded on the consolidated balance sheet are excluded from the table above: income taxes andinsurance accruals. The Company is unable to estimate the timing of the payments for these items.
At April 28, 2010, the total amount of gross unrecognized tax benefits for uncertain tax positions,including an accrual of related interest and penalties along with positions only impacting the timingof tax benefits, was approximately $73 million. The timing of payments will depend on the progress ofexaminations with tax authorities. The Company does not expect a significant tax payment related tothese obligations within the next year. The Company is unable to make a reasonably reliable estimateas to when cash settlements with taxing authorities may occur.
Off-Balance Sheet Arrangements and Other Commitments
The Company does not have guarantees or other off-balance sheet financing arrangements thatwe believe are reasonably likely to have a current or future effect on our financial condition, changesin financial condition, revenue or expenses, results of operations, liquidity, capital expenditures or
26

capital resources. In addition, the Company does not have any related party transactions thatmaterially affect the results of operations, cash flow or financial condition.
As of April 28, 2010, the Company was a party to two operating leases for buildings andequipment. The Company has guaranteed supplemental payment obligations of approximately$130 million at the termination of these leases. The Company believes, based on current factsand circumstances, that any payment pursuant to these guarantees is remote.
The Company acted as servicer for $84 million of U.S. trade receivables sold through an accountsreceivable securitization program that are not recognized on the balance sheet as of April 28, 2010. Inaddition, the Company acted as servicer for approximately $126 million and $71 million of tradereceivables which were sold to unrelated third parties without recourse as of April 28, 2010 andApril 29, 2009, respectively.
No significant credit guarantees existed between the Company and third parties as of April 28,2010.
Market Risk Factors
The Company is exposed to market risks from adverse changes in foreign exchange rates,interest rates, commodity prices and production costs. As a policy, the Company does not engage inspeculative or leveraged transactions, nor does the Company hold or issue financial instruments fortrading purposes.
Foreign Exchange Rate Sensitivity: The Company’s cash flow and earnings are subject tofluctuations due to exchange rate variation. Foreign currency risk exists by nature of the Company’sglobal operations. The Company manufactures and sells its products on six continents around theworld, and hence foreign currency risk is diversified.
The Company may attempt to limit its exposure to changing foreign exchange rates through bothoperational and financial market actions. These actions may include entering into forward contracts,option contracts, or cross currency swaps to hedge existing exposures, firm commitments andforecasted transactions. The instruments are used to reduce risk by essentially creating offsettingcurrency exposures.
The following table presents information related to foreign currency contracts held by theCompany:
April 28, 2010 April 29, 2009 April 28, 2010 April 29, 2009Aggregate Notional Amount Net Unrealized Gains/(Losses)
(Dollars in millions)
Purpose of Hedge:Intercompany cash flows . . . . . . $ 726 $ 683 $ (5) $16Forecasted purchases of raw
materials and finished goodsand foreign currencydenominated obligations . . . . 814 468 (17) 20
Forecasted sales and foreigncurrency denominatedassets . . . . . . . . . . . . . . . . . . . 98 96 22 —
$1,638 $1,247 $ — $36
As of April 28, 2010, the Company’s foreign currency contracts mature within four years.Contracts that meet qualifying criteria are accounted for as either foreign currency cash flow hedges,fair value hedges or net investment hedges of foreign operations. Any gains and losses related tocontracts that do not qualify for hedge accounting are recorded in current period earnings in otherincome and expense.
27

Substantially all of the Company’s foreign business units’ financial instruments are denomi-nated in their respective functional currencies. Accordingly, exposure to exchange risk on foreigncurrency financial instruments is not material. (See Note 12, “Derivative Financial Instruments andHedging Activities” in Item 8—“Financial Statements and Supplementary Data.”)
Interest Rate Sensitivity: The Company is exposed to changes in interest rates primarily as aresult of its borrowing and investing activities used to maintain liquidity and fund business oper-ations. The nature and amount of the Company’s long-term and short-term debt can be expected tovary as a result of future business requirements, market conditions and other factors. The Company’sdebt obligations totaled $4.62 billion (including $207 million relating to hedge accounting adjust-ments) and $5.14 billion (including $251 million relating to hedge accounting adjustments) atApril 28, 2010 and April 29, 2009, respectively. The Company’s debt obligations are summarizedin Note 7, “Debt and Financing Arrangements” in Item 8—“Financial Statements and Supplemen-tary Data.”
In order to manage interest rate exposure, the Company utilizes interest rate swaps to convertfixed-rate debt to floating. These derivatives are primarily accounted for as fair value hedges.Accordingly, changes in the fair value of these derivatives, along with changes in the fair value ofthe hedged debt obligations that are attributable to the hedged risk, are recognized in current periodearnings. Based on the amount of fixed-rate debt converted to floating as of April 28, 2010, a varianceof 1/8% in the related interest rate would cause annual interest expense related to this debt to changeby approximately $2 million. The following table presents additional information related to interestrate contracts designated as fair value hedges by the Company:
April 28, 2010 April 29, 2009(Dollars in millions)
Pay floating swaps—notional amount . . . . . . . . . . . . . . . . . . . $1,516 $1,516Net unrealized gains . . . . . . . . . . . . . . . . . . . . . . . . . . . . . . . . $ 109 $ 151Weighted average maturity (years) . . . . . . . . . . . . . . . . . . . . . 3 4Weighted average receive rate . . . . . . . . . . . . . . . . . . . . . . . . . 6.30% 6.31%Weighted average pay rate . . . . . . . . . . . . . . . . . . . . . . . . . . . 1.47% 3.67%
During Fiscal 2010, the Company terminated its $175 million notional total rate of return swapthat was being used as an economic hedge to reduce a portion of the interest cost related to theCompany’s DRS. The unwinding of the total rate of return swap was completed in conjunction withthe exchange of $681 million of DRS discussed in Note 7, “Debt and Financing Arrangements” inItem 8-“Financial Statements and Supplementary Data.” Upon termination of the swap, the Com-pany received net cash proceeds of $48 million, in addition to the release of the $193 million ofrestricted cash collateral that the Company was required to maintain with the counterparty for theterm of the swap. Prior to termination, the swap was being accounted for on a full mark-to-marketbasis through earnings, as a component of interest income. The Company recorded a benefit ininterest income of $28 million for the year ended April 28, 2010, and $28 million for the year endedApril 29, 2009, representing changes in the fair value of the swap and interest earned on thearrangement, net of transaction fees. Net unrealized gains related to this swap totaled $20 million asof April 29, 2009.
The Company had outstanding cross-currency interest rate swaps with a total notional amountof $160 million as of April 28, 2010, which were designated as cash flow hedges of the future paymentsof loan principal and interest associated with certain foreign denominated variable rate debtobligations. Net unrealized losses related to these swaps totaled $12 million as of April 28, 2010.These contracts are scheduled to mature in Fiscal 2013.
Effect of Hypothetical 10% Fluctuation in Market Prices: As of April 28, 2010, thepotential gain or loss in the fair value of the Company’s outstanding foreign currency contracts,
28

interest rate contracts and cross-currency interest rate swaps assuming a hypothetical 10% fluctu-ation in currency and swap rates would be approximately:
Fair Value Effect(Dollars in millions)
Foreign currency contracts . . . . . . . . . . . . . . . . . . . . . . . . . . . . . . . . . . . $116Interest rate swap contracts . . . . . . . . . . . . . . . . . . . . . . . . . . . . . . . . . . $ 7Cross-currency interest rate swaps . . . . . . . . . . . . . . . . . . . . . . . . . . . . . $ 17
However, it should be noted that any change in the fair value of the contracts, real orhypothetical, would be significantly offset by an inverse change in the value of the underlyinghedged items. In relation to currency contracts, this hypothetical calculation assumes that eachexchange rate would change in the same direction relative to the U.S. dollar.
Venezuela- Foreign Currency and Inflation
Foreign Currency
The local currency in Venezuela is the VEF. A currency control board exists in Venezuela that isresponsible for foreign exchange procedures, including approval of requests for exchanges of VEF forU.S. dollars at the official (government established) exchange rate. Our business in Venezuela hashistorically been successful in obtaining U.S. dollars at the official exchange rate for imports ofingredients, packaging, manufacturing equipment, and other necessary inputs, and for dividendremittances, albeit on a delay. While an unregulated parallel market exists for exchanging VEF forU.S dollars through securities transactions, our Venezuelan subsidiary has no recent history ofentering into such exchange transactions.
The Company uses the official exchange rate to translate the financial statements of itsVenezuelan subsidiary, since we expect to obtain U.S. dollars at the official rate for future dividendremittances. The official exchange rate in Venezuela had been fixed at 2.15 VEF to 1 U.S. dollar forseveral years, despite significant inflation. On January 8, 2010, the Venezuelan governmentannounced the devaluation of its currency relative to the U.S. dollar. The official exchange ratefor imported goods classified as essential, such as food and medicine, changed from 2.15 to 2.60, whilepayments for other non-essential goods moved to an exchange rate of 4.30. The majority, if not all, ofour imported products in Venezuela are expected to fall into the essential classification and qualifyfor the 2.60 rate. However, our Venezuelan subsidiary’s financial statements are translated using the4.30 rate, as this is the rate expected to be applicable to dividend repatriations.
During Fiscal 2010, the Company recorded a $62 million currency translation loss as a result ofthe currency devaluation, which has been reflected as a component of accumulated other compre-hensive loss within unrealized translation adjustment. The net asset position of our Venezuelansubsidiary has also been reduced as a result of the devaluation to approximately $81 million atApril 28, 2010. While our future operating results in Venezuela will be negatively impacted by thecurrency devaluation, we plan to take actions to help mitigate these effects. Accordingly, we do notexpect the devaluation to have a material impact on our operating results going forward.
Highly Inflationary Economy
An economy is considered highly inflationary under U.S. GAAP if the cumulative inflation ratefor a three-year period meets or exceeds 100 percent. Based on the blended National Consumer PriceIndex, the Venezuelan economy exceeded the three-year cumulative inflation rate of 100 percentduring the third quarter of Fiscal 2010. As a result, the financial statements of our Venezuelansubsidiary have been consolidated and reported under highly inflationary accounting rules begin-ning on January 28, 2010, the first day of our fiscal fourth quarter. Under highly inflationaryaccounting, the financial statements of our Venezuelan subsidiary are remeasured into the Compa-ny’s reporting currency (U.S. dollars) and exchange gains and losses from the remeasurement of
29

monetary assets and liabilities are reflected in current earnings, rather than accumulated othercomprehensive loss on the balance sheet, until such time as the economy is no longer consideredhighly inflationary.
The impact of applying highly inflationary accounting for Venezuela on our consolidatedfinancial statements is dependent upon movements in the applicable exchange rates (at this time,the official rate) between the local currency and the U.S. dollar and the amount of monetary assetsand liabilities included in our subsidiary’s balance sheet. At April 28, 2010, the U.S. dollar value ofmonetary assets, net of monetary liabilities, which would be subject to an earnings impact fromexchange rate movements for our Venezuelan subsidiary under highly inflationary accounting was$42 million.
Recently Issued Accounting Standards
On September 15, 2009, the FASB Accounting Standards Codification (the “Codification”)became the single source of authoritative generally accepted accounting principles in theUnited States of America. The Codification changed the referencing of financial standards butdid not change or alter existing U.S. GAAP. The Codification became effective for the Company in thesecond quarter of Fiscal 2010.
Business Combinations and Consolidation
On April 30, 2009, the Company adopted new accounting guidance on business combinations andnoncontrolling interests in consolidated financial statements. The guidance on business combina-tions impacts the accounting for any business combinations completed after April 29, 2009. Thenature and extent of the impact will depend upon the terms and conditions of any such transaction.The guidance on noncontrolling interests changes the accounting and reporting for minority inter-ests, which have been recharacterized as noncontrolling interests and classified as a component ofequity. Prior period financial statements and disclosures for existing minority interests have beenrestated in accordance with this guidance. All other requirements of this guidance will be appliedprospectively. The adoption of the guidance on noncontrolling interests did not have a materialimpact on the Company’s financial statements.
In June 2009, the FASB issued an amendment to the accounting and disclosure requirements fortransfers of financial assets. This amendment removes the concept of a qualifying special-purposeentity and requires that a transferor recognize and initially measure at fair value all assets obtainedand liabilities incurred as a result of a transfer of financial assets accounted for as a sale. Thisamendment also requires additional disclosures about any transfers of financial assets and atransferor’s continuing involvement with transferred financial assets. This amendment is effectivefor fiscal years beginning after November 15, 2009, and interim periods within those fiscal years. TheCompany will adopt this amendment on April 29, 2010, the first day of Fiscal 2011, and this adoptionis not expected to have a material impact on the Company’s financial statements.
In June 2009, the FASB issued an amendment to the accounting and disclosure requirements forvariable interest entities. This amendment changes how a reporting entity determines when anentity that is insufficiently capitalized or is not controlled through voting (or similar rights) should beconsolidated. The determination of whether a reporting entity is required to consolidate anotherentity is based on, among other things, the purpose and design of the other entity and the reportingentity’s ability to direct the activities of the other entity that most significantly impact its economicperformance. The amendment also requires additional disclosures about a reporting entity’s involve-ment with variable interest entities and any significant changes in risk exposure due to thatinvolvement. A reporting entity will be required to disclose how its involvement with a variableinterest entity affects the reporting entity’s financial statements. This amendment is effective forfiscal years beginning after November 15, 2009, and interim periods within those fiscal years. The
30

Company will adopt this amendment on April 29, 2010, the first day of Fiscal 2011, and this adoptionis not expected to have a material impact on the Company’s financial statements.
Fair Value
On April 30, 2009, the Company adopted new accounting guidance on fair value measurementsfor its non-financial assets and liabilities that are recognized at fair value on a non-recurring basis,including long-lived assets, goodwill, other intangible assets and exit liabilities. This guidancedefines fair value, establishes a framework for measuring fair value under generally acceptedaccounting principles, and expands disclosures about fair value measurements. This guidanceapplies whenever other accounting guidance requires or permits assets or liabilities to be measuredat fair value, but does not expand the use of fair value to new accounting transactions. The adoption ofthis guidance did not have a material impact on the Company’s financial statements. See Note 10,“Fair Value Measurements” in Item 8—“Financial Statements and Supplementary Data”, for addi-tional information.
Postretirement Benefit Plans and Equity Compensation
On April 30, 2009, the Company adopted accounting guidance for determining whether instru-ments granted in share-based payment transactions are participating securities. This guidancestates that unvested share-based payment awards that contain non-forfeitable rights to dividends ordividend equivalents (whether paid or unpaid) are participating securities and shall be included inthe computation of earnings per share pursuant to the two-class method. As a result of adopting thisguidance, the Company has retrospectively adjusted its earnings per share data for prior periods. Theadoption had no impact on net income and a $0.01, $0.01, and $0.02 unfavorable impact on basic anddiluted earnings per share from continuing operations for Fiscal 2010, 2009 and 2008, respectively.See Note 13, “Income Per Common Share” in Item 8-“Financial Statements and SupplementaryData” for additional information.
In December 2008, the FASB issued new accounting guidance on employers’ disclosures aboutpostretirement benefit plan assets. This new guidance requires enhanced disclosures about planassets in an employer’s defined benefit pension or other postretirement plan. Companies are requiredto disclose information about how investment allocation decisions are made, the fair value of eachmajor category of plan assets, the basis used to determine the overall expected long-term rate ofreturn on assets assumption, a description of the inputs and valuation techniques used to develop fairvalue measurements of plan assets, and significant concentrations of credit risk. This guidance iseffective for fiscal years ending after December 15, 2009. The Company adopted this guidance in thefourth quarter of Fiscal 2010. As this guidance only requires enhanced disclosures, its adoption didnot impact the Company’s financial position, results of operations, or cash flows. See Note 11,“Pension and Other Postretirement Benefit Plans” in Item 8—“Financial Statements and Supple-mentary Data” for additional information.
Foreign Currency
In May 2010, the FASB issued Accounting Standards Update No. 2010-19, “Foreign CurrencyIssues: Multiple Foreign Currency Exchange Rates.” The guidance provides clarification of account-ing treatment when reported balances in an entity’s financial statements differ from their underlyingU.S. dollar denominated values due to different rates being used for remeasurement and translation.The guidance indicates that upon adopting highly inflationary accounting for Venezuela, since theU.S. dollar is now the functional currency of a Venezuelan subsidiary, there should no longer be anydifferences between the amounts reported for financial reporting purposes and the amount of anyunderlying U.S. dollar denominated value held by the subsidiary. Therefore, any differences betweenthese should either be recognized in the income statement or as a cumulative translation adjustment,if the difference was previously recognized as a cumulative translation adjustment. As discussedabove, the Company began applying highly inflationary accounting for its Venezuelan subsidiary on
31

the first day of its Fiscal 2010 fourth quarter, however, such guidance had no impact on theCompany’s financial statements.
Discussion of Significant Accounting Estimates
In the ordinary course of business, the Company has made a number of estimates and assump-tions relating to the reporting of results of operations and financial condition in the preparation of itsfinancial statements in conformity with accounting principles generally accepted in the United Statesof America. Actual results could differ significantly from those estimates under different assump-tions and conditions. The Company believes that the following discussion addresses its most criticalaccounting policies, which are those that are most important to the portrayal of the Company’sfinancial condition and results and require management’s most difficult, subjective and complexjudgments, often as a result of the need to make estimates about the effect of matters that areinherently uncertain.
Marketing Costs—Trade promotions are an important component of the sales and marketing ofthe Company’s products and are critical to the support of the business. Trade promotion costs includeamounts paid to retailers to offer temporary price reductions for the sale of the Company’s products toconsumers, amounts paid to obtain favorable display positions in retailers’ stores, and amounts paidto customers for shelf space in retail stores. Accruals for trade promotions are initially recorded at thetime of sale of product to the customer based on an estimate of the expected levels of performance ofthe trade promotion, which is dependent upon factors such as historical trends with similarpromotions, expectations regarding customer participation, and sales and payment trends withsimilar previously offered programs. Our original estimated costs of trade promotions may change inthe future as a result of changes in customer participation, particularly for new programs and forprograms related to the introduction of new products. We perform monthly evaluations of ouroutstanding trade promotions, making adjustments where appropriate to reflect changes in esti-mates. Settlement of these liabilities typically occurs in subsequent periods primarily through anauthorization process for deductions taken by a customer from amounts otherwise due to theCompany. As a result, the ultimate cost of a trade promotion program is dependent on the relativesuccess of the events and the actions and level of deductions taken by the Company’s customers foramounts they consider due to them. Final determination of the permissible deductions may takeextended periods of time and could have a significant impact on the Company’s results of operationsdepending on how actual results of the programs compare to original estimates.
We offer coupons to consumers in the normal course of our business. Expenses associated withthis activity, which we refer to as coupon redemption costs, are accrued in the period in which thecoupons are offered. The initial estimates made for each coupon offering are based upon historicalredemption experience rates for similar products or coupon amounts. We perform monthly evalu-ations of outstanding coupon accruals that compare actual redemption rates to the original esti-mates. We review the assumptions used in the valuation of the estimates and determine anappropriate accrual amount. Adjustments to our initial accrual may be required if actual redemptionrates vary from estimated redemption rates.
Investments and Long-lived Assets, including Property, Plant and Equipment—Investments andlong-lived assets are recorded at their respective cost basis on the date of acquisition. Buildings,equipment and leasehold improvements are depreciated on a straight-line basis over the estimateduseful life of such assets. The Company reviews investments and long-lived assets, includingintangibles with finite useful lives, and property, plant and equipment, whenever circumstanceschange such that the indicated recorded value of an asset may not be recoverable or has suffered another-than-temporary impairment. Factors that may affect recoverability include changes inplanned use of equipment or software, the closing of facilities and changes in the underlying financialstrength of investments. The estimate of current value requires significant management judgmentand requires assumptions that can include: future volume trends and revenue and expense growthrates developed in connection with the Company’s internal projections and annual operating plans,
32

and in addition, external factors such as changes in macroeconomic trends. As each is management’sbest estimate on then available information, resulting estimates may differ from actual cash flowsand estimated fair values.
Goodwill and Indefinite-Lived Intangibles—Carrying values of goodwill and intangible assetswith indefinite lives are reviewed for impairment at least annually, or when circumstances indicatethat a possible impairment may exist. Indicators such as unexpected adverse economic factors,unanticipated technological change or competitive activities, decline in expected cash flows, slowergrowth rates, loss of key personnel, and acts by governments and courts, may signal that an asset hasbecome impaired.
All goodwill is assigned to reporting units, which are primarily one level below our operatingsegments. Goodwill is assigned to the reporting unit that benefits from the cash flows arising fromeach business combination. We perform our impairment tests of goodwill at the reporting unit level.The Company has 17 reporting units globally that have assigned goodwill and are thus required to betested for impairment.
The Company’s measure of impairment for both goodwill and intangible assets with indefinitelives is based on a discounted cash flow model as management believes forecasted cash flows are thebest indicator of fair value. A number of significant assumptions and estimates are involved in theapplication of the discounted cash flow model, including future volume trends, revenue and expensegrowth rates, terminal growth rates, weighted-average cost of capital, tax rates, capital spending andworking capital changes. The assumptions used in the models were determined utilizing historicaldata, current and anticipated market conditions, product category growth rates, management plans,and market comparables. Most of these assumptions vary significantly among the reporting units,but generally, higher assumed growth rates were utilized in emerging markets when compared todeveloped markets. For each reporting unit and indefinite-lived intangible asset, we used a market-participant, risk-adjusted-weighted-average cost of capital to discount the projected cash flows ofthose operations or assets. Such discount rates ranged from 6-17% in Fiscal 2010. Managementbelieves the assumptions used for the impairment evaluation are consistent with those that would beutilized by market participants performing similar valuations of our reporting units. We validatedour fair values for reasonableness by comparing the sum of the fair values for all of our reportingunits, including those with no assigned goodwill, to our market capitalization and a reasonablecontrol premium.
During the fourth quarter of Fiscal 2010, the Company completed its annual review of goodwilland indefinite-lived intangible assets. No impairments were identified during the Company’s annualassessment of goodwill and indefinite-lived intangible assets. The fair values of each reporting unitsignificantly exceeded their carrying values, with the exception of two reporting units, in which therewas only a minor excess. The goodwill associated with these two reporting units is not material as ofApril 28, 2010.
Retirement Benefits—The Company sponsors pension and other retirement plans in variousforms covering substantially all employees who meet eligibility requirements. Several actuarial andother factors that attempt to anticipate future events are used in calculating the expense andobligations related to the plans. These factors include assumptions about the discount rate, expectedreturn on plan assets, turnover rates and rate of future compensation increases as determined by theCompany, within certain guidelines. In addition, the Company uses best estimate assumptions,provided by actuarial consultants, for withdrawal and mortality rates to estimate benefit expense.The financial and actuarial assumptions used by the Company may differ materially from actualresults due to changing market and economic conditions, higher or lower withdrawal rates or longeror shorter life spans of participants. These differences may result in a significant impact to theamount of pension expense recorded by the Company.
The Company recognized pension expense related to defined benefit programs of $25 million,$6 million, and $7 million for fiscal years 2010, 2009, and 2008, respectively, which reflected expected
33

return on plan assets of $211 million, $208 million, and $227 million, respectively. The Companycontributed $540 million to its pension plans in Fiscal 2010 compared to $134 million in Fiscal 2009and $58 million in Fiscal 2008. The Company expects to contribute less than $50 million to its pensionplans in Fiscal 2011.
One of the significant assumptions for pension plan accounting is the expected rate of return onpension plan assets. Over time, the expected rate of return on assets should approximate actual long-term returns. In developing the expected rate of return, the Company considers average real historicreturns on asset classes, the investment mix of plan assets, investment manager performance andprojected future returns of asset classes developed by respected advisors. When calculating theexpected return on plan assets, the Company primarily uses a market-related-value of assets thatspreads asset gains and losses (difference between actual return and expected return) uniformly over3 years. The weighted average expected rate of return on plan assets used to calculate annualexpense was 8.1% for the year end April 28, 2010 and 8.2% for the years ended April 29, 2009 andApril 30, 2008. For purposes of calculating Fiscal 2011 expense, the weighted average rate of returnwill be approximately 8.2%.
Another significant assumption used to value benefit plans is the discount rate. The discountrate assumptions used to value pension and postretirement benefit obligations reflect the ratesavailable on high quality fixed income investments available (in each country where the Companyoperates a benefit plan) as of the measurement date. The Company uses bond yields of appropriateduration for each country by matching it with the duration of plan liabilities. The weighted averagediscount rate used to measure the projected benefit obligation for the year ending April 28, 2010decreased to 5.6% from 6.5% as of April 29, 2009.
Deferred gains and losses result from actual experience different from expected financial andactuarial assumptions. The pension plans currently have a deferred loss amount of $1.09 billion atApril 28, 2010. Deferred gains and losses are amortized through the actuarial calculation into annualexpense over the estimated average remaining service period of plan participants, which is currently10 years. However, if all or almost all of a plan’s participants are inactive, deferred gains and lossesare amortized through the actuarial calculation into annual expense over the estimated averageremaining life expectancy of the inactive participants.
The Company also provides certain postretirement health care benefits. The postretirementhealth care benefit expense and obligation are determined using the Company’s assumptionsregarding health care cost trend rates. The health care trend rates are developed based on historicalcost data, the near-term outlook on health care trends and the likely long-term trends. The postre-tirement health care benefit obligation at April 28, 2010 as determined using an average initialhealth care trend rate of 7.1% which gradually decreases to an average ultimate rate of 4.8% in6 years. A one percentage point increase in the assumed health care cost trend rate would increasethe service and interest cost components of annual expense by $2 million and increase the benefitobligation by $16 million. A one percentage point decrease in the assumed health care cost trend rateswould decrease the service and interest cost by $2 million and decrease the benefit obligation by$15 million.
The Patient Protection and Affordable Care Act (PPACA) was signed into law on March 23, 2010,and on March 30, 2010, the Health Care and Education Reconciliation Act of 2010 (HCERA) wassigned into law, which amends certain aspects of the PPACA. Among other things, the PPACAreduces the tax benefits available to an employer that receives the Medicare Part D subsidy. As aresult of the PPACA, the Company was required to recognize in Fiscal 2010 tax expense of $4 million(approximately $0.01 per share) related to reduced deductibility in future periods of the postretire-ment prescription drug coverage. The PPACA and HCERA (collectively referred to as the Act) willhave both immediate and long-term ramifications for many employers that provide retiree healthbenefits.
34

Sensitivity of Assumptions
If we assumed a 100 basis point change in the following rates, the Company’s Fiscal 2010projected benefit obligation and expense would increase (decrease) by the following amounts (inmillions):
Increase Decrease100 Basis Point
Pension benefitsDiscount rate used in determining projected benefit obligation . . . . . . $(295) $352Discount rate used in determining net pension expense . . . . . . . . . . . . $ (29) $ 27Long-term rate of return on assets used in determining net pension
expense . . . . . . . . . . . . . . . . . . . . . . . . . . . . . . . . . . . . . . . . . . . . . . . . $ (26) $ 26Other benefitsDiscount rate used in determining projected benefit obligation . . . . . . $ (13) $ 16Discount rate used in determining net benefit expense . . . . . . . . . . . . . $ (1) $ 1
Income Taxes—The Company computes its annual tax rate based on the statutory tax rates andtax planning opportunities available to it in the various jurisdictions in which it earns income.Significant judgment is required in determining the Company’s annual tax rate and in evaluatinguncertainty in its tax positions. The Company recognizes a benefit for tax positions that it believeswill more likely than not be sustained upon examination. The amount of benefit recognized is thelargest amount of benefit that the Company believes has more than a 50% probability of beingrealized upon settlement. The Company regularly monitors its tax positions and adjusts the amountof recognized tax benefit based on its evaluation of information that has become available since theend of its last financial reporting period. The annual tax rate includes the impact of these changes inrecognized tax benefits. When adjusting the amount of recognized tax benefits the Company does notconsider information that has become available after the balance sheet date, but does disclose theeffects of new information whenever those effects would be material to the Company’s financialstatements. The difference between the amount of benefit taken or expected to be taken in a taxreturn and the amount of benefit recognized for financial reporting represents unrecognized taxbenefits. These unrecognized tax benefits are presented in the balance sheet principally withinaccrued income taxes.
The Company records valuation allowances to reduce deferred tax assets to the amount that ismore likely than not to be realized. When assessing the need for valuation allowances, the Companyconsiders future taxable income and ongoing prudent and feasible tax planning strategies. Should achange in circumstances lead to a change in judgment about the realizability of deferred tax assets infuture years, the Company would adjust related valuation allowances in the period that the change incircumstances occurs, along with a corresponding increase or charge to income.
Input Costs
In general, the effects of cost inflation may be experienced by the Company in future periods.During Fiscals 2009 and 2010, the Company experienced wide-spread inflationary increases incommodity input costs. Price increases and continued productivity improvements have helped tooffset these cost increases. While recently there has been a general decline in commodity inflation,some key input costs remain above historic levels. Productivity improvements are expected to helpmitigate such costs.
Stock Market Information
H. J. Heinz Company common stock is traded principally on The New York Stock Exchangeunder the symbol HNZ. The number of shareholders of record of the Company’s common stock as of
35

May 31, 2010 approximated 35,400. The closing price of the common stock on The New York StockExchange composite listing on April 28, 2010 was $45.76.
Stock price information for common stock by quarter follows:
High LowStock Price Range
2010First . . . . . . . . . . . . . . . . . . . . . . . . . . . . . . . . . . . . . . . . . . . . . . . . . . . . . $38.85 $34.03Second . . . . . . . . . . . . . . . . . . . . . . . . . . . . . . . . . . . . . . . . . . . . . . . . . . . 41.60 37.30Third . . . . . . . . . . . . . . . . . . . . . . . . . . . . . . . . . . . . . . . . . . . . . . . . . . . . 43.75 39.69Fourth . . . . . . . . . . . . . . . . . . . . . . . . . . . . . . . . . . . . . . . . . . . . . . . . . . . 47.84 42.672009First . . . . . . . . . . . . . . . . . . . . . . . . . . . . . . . . . . . . . . . . . . . . . . . . . . . . . $51.44 $46.35Second . . . . . . . . . . . . . . . . . . . . . . . . . . . . . . . . . . . . . . . . . . . . . . . . . . . 53.00 38.43Third . . . . . . . . . . . . . . . . . . . . . . . . . . . . . . . . . . . . . . . . . . . . . . . . . . . . 45.83 34.52Fourth . . . . . . . . . . . . . . . . . . . . . . . . . . . . . . . . . . . . . . . . . . . . . . . . . . . 38.34 30.51
Item 7A. Quantitative and Qualitative Disclosures About Market Risk.
This information is set forth in this report in Item 7—“Management’s Discussion and Analysis ofFinancial Condition and Results of Operations” on pages 27 through 29.
36

Item 8. Financial Statements and Supplementary Data.
TABLE OF CONTENTS
Report of Management on Internal Control over Financial Reporting . . . . . . . . . . . . . . . . . . . . 38Report of Independent Registered Public Accounting Firm . . . . . . . . . . . . . . . . . . . . . . . . . . . . 39Consolidated Statements of Income . . . . . . . . . . . . . . . . . . . . . . . . . . . . . . . . . . . . . . . . . . . . . . 40Consolidated Balance Sheets . . . . . . . . . . . . . . . . . . . . . . . . . . . . . . . . . . . . . . . . . . . . . . . . . . . . 41Consolidated Statements of Equity . . . . . . . . . . . . . . . . . . . . . . . . . . . . . . . . . . . . . . . . . . . . . . . 43Consolidated Statements of Cash Flows . . . . . . . . . . . . . . . . . . . . . . . . . . . . . . . . . . . . . . . . . . . 45Notes to Consolidated Financial Statements . . . . . . . . . . . . . . . . . . . . . . . . . . . . . . . . . . . . . . . 46
37

Report of Management on Internal Control over Financial Reporting
Management is responsible for establishing and maintaining adequate internal control overfinancial reporting for the Company. Internal control over financial reporting refers to the processdesigned by, or under the supervision of, our Chief Executive Officer and Chief Financial Officer, andeffected by our Board of Directors, management and other personnel, to provide reasonable assur-ance regarding the reliability of financial reporting and the preparation of financial statements forexternal purposes in accordance with generally accepted accounting principles in the United Statesof America, and includes those policies and procedures that:
(1) Pertain to the maintenance of records that, in reasonable detail, accurately and fairly reflectthe transactions and dispositions of the assets of the Company;
(2) Provide reasonable assurance that transactions are recorded as necessary to permit prep-aration of financial statements in accordance with generally accepted accounting principles;
(3) Provide reasonable assurance that receipts and expenditures of the Company are beingmade only in accordance with authorizations of management and directors of the Company; and
(4) Provide reasonable assurance regarding prevention or timely detection of unauthorizedacquisition, use or disposition of the Company’s assets that could have a material effect on thefinancial statements.
Because of its inherent limitations, internal control over financial reporting may not prevent ordetect misstatements. Also, projections of any evaluation of effectiveness to future periods are subjectto the risk that controls may become inadequate because of changes in conditions, or that the degreeof compliance with the policies or procedures may deteriorate.
Management has used the framework set forth in the report entitled “Internal Control—IntegratedFramework” published by the Committee of Sponsoring Organizations of the Treadway Commissionto evaluate the effectiveness of the Company’s internal control over financial reporting, as requiredby Section 404 of the Sarbanes-Oxley Act. Management has concluded that the Company’s internalcontrol over financial reporting was effective as of the end of the most recent fiscal year.PricewaterhouseCoopers LLP, an independent registered public accounting firm, audited the effec-tiveness of the Company’s internal control over financial reporting as of April 28, 2010, as stated intheir report which appears herein.
/s/ William R. JohnsonChairman, President andChief Executive Officer
/s/ Arthur B. WinkleblackExecutive Vice President andChief Financial Officer
June 17, 2010
38

Report of Independent Registered Public Accounting Firm
To the Board of Directors and Shareholders ofH. J. Heinz Company:
In our opinion, the consolidated financial statements listed in the index appearing under Item 15(a)(1)present fairly, in all material respects, the financial position of H. J. Heinz Company and its subsidiariesat April 28, 2010 and April 29, 2009, and the results of their operations and their cash flows for each ofthe three years in the period ended April 28, 2010 in conformity with accounting principles generallyaccepted in the United States of America. In addition, in our opinion, the financial statement schedulelisted in the index appearing under Item 15(a)(2) presents fairly, in all material respects, the informationset forth therein when read in conjunction with the related consolidated financial statements. Also inour opinion, the Company maintained, in all material respects, effective internal control over financialreporting as of April 28, 2010, based on criteria established in Internal Control—Integrated Frameworkissued by the Committee of Sponsoring Organizations of the Treadway Commission (COSO). TheCompany’s management is responsible for these financial statements and financial statement schedule,for maintaining effective internal control over financial reporting and for its assessment of the effec-tiveness of internal control over financial reporting, included in the Report of Management on InternalControl over Financial Reporting appearing under Item 8. Our responsibility is to express opinions onthese financial statements, on the financial statement schedule, and on the Company’s internal controlover financial reporting based on our integrated audits. We conducted our audits in accordance with thestandards of the Public Company Accounting Oversight Board (United States). Those standards requirethat we plan and perform the audits to obtain reasonable assurance about whether the financialstatements are free of material misstatement and whether effective internal control over financialreporting was maintained in all material respects. Our audits of the financial statements includedexamining, on a test basis, evidence supporting the amounts and disclosures in the financial statements,assessing the accounting principles used and significant estimates made by management, and evalu-ating the overall financial statement presentation. Our audit of internal control over financial reportingincluded obtaining an understanding of internal control over financial reporting, assessing the risk thata material weakness exists, and testing and evaluating the design and operating effectiveness ofinternal control based on the assessed risk. Our audits also included performing such other proceduresas we considered necessary in the circumstances. We believe that our audits provide a reasonable basisfor our opinions.
As discussed in Note 2 to the accompanying consolidated financial statements, effective April 30, 2009,the Company changed its accounting and reporting for noncontrolling interests, business combinations,and earnings per share.
A company’s internal control over financial reporting is a process designed to provide reasonableassurance regarding the reliability of financial reporting and the preparation of financial statementsfor external purposes in accordance with generally accepted accounting principles. A company’s internalcontrol over financial reporting includes those policies and procedures that (i) pertain to the mainte-nance of records that, in reasonable detail, accurately and fairly reflect the transactions and dispositionsof the assets of the company; (ii) provide reasonable assurance that transactions are recorded asnecessary to permit preparation of financial statements in accordance with generally accepted account-ing principles, and that receipts and expenditures of the company are being made only in accordancewith authorizations of management and directors of the company; and (iii) provide reasonable assuranceregarding prevention or timely detection of unauthorized acquisition, use, or disposition of the compa-ny’s assets that could have a material effect on the financial statements.
Because of its inherent limitations, internal control over financial reporting may not prevent or detectmisstatements. Also, projections of any evaluation of effectiveness to future periods are subject to therisk that controls may become inadequate because of changes in conditions, or that the degree ofcompliance with the policies or procedures may deteriorate.
/s/ PRICEWATERHOUSECOOPERS LLP
Pittsburgh, PennsylvaniaJune 17, 2010
39

H. J. Heinz Company and Subsidiaries
Consolidated Statements of Income
April 28, 2010(52 Weeks)
April 29, 2009(52 Weeks)
April 30, 2008(52 Weeks)
Fiscal Year Ended
(In thousands, except per share amounts)
Sales . . . . . . . . . . . . . . . . . . . . . . . . . . . . . . . . . . . . . . . $10,494,983 $10,011,331 $9,885,556Cost of products sold . . . . . . . . . . . . . . . . . . . . . . . . . . . 6,700,677 6,442,075 6,233,420Gross profit . . . . . . . . . . . . . . . . . . . . . . . . . . . . . . . . . . 3,794,306 3,569,256 3,652,136Selling, general and administrative expenses . . . . . . . 2,235,078 2,066,810 2,081,801Operating income . . . . . . . . . . . . . . . . . . . . . . . . . . . . . 1,559,228 1,502,446 1,570,335Interest income . . . . . . . . . . . . . . . . . . . . . . . . . . . . . . . 45,137 64,150 41,519Interest expense . . . . . . . . . . . . . . . . . . . . . . . . . . . . . . 295,711 339,635 364,808Other (expense)/income, net . . . . . . . . . . . . . . . . . . . . . (18,200) 92,922 (16,283)Income from continuing operations before income
taxes . . . . . . . . . . . . . . . . . . . . . . . . . . . . . . . . . . . . . 1,290,454 1,319,883 1,230,763Provision for income taxes . . . . . . . . . . . . . . . . . . . . . . 358,514 375,483 372,587Income from continuing operations . . . . . . . . . . . . . . . 931,940 944,400 858,176Loss from discontinued operations, net of tax . . . . . . . (49,597) (6,439) (1,698)Net income . . . . . . . . . . . . . . . . . . . . . . . . . . . . . . . . . . 882,343 937,961 856,478Less: Net income attributable to the noncontrolling
interest . . . . . . . . . . . . . . . . . . . . . . . . . . . . . . . . . . . 17,451 14,889 11,553Net income attributable to H. J. Heinz Company . . . . $ 864,892 $ 923,072 $ 844,925
Income/(loss) per common share:Diluted
Continuing operations attributable to H. J. HeinzCompany common shareholders . . . . . . . . . . . . . . $ 2.87 $ 2.91 $ 2.62
Discontinued operations attributable to H. J. HeinzCompany common shareholders . . . . . . . . . . . . . . (0.16) (0.02) (0.01)Net income attributable to H. J. Heinz Company
common shareholders . . . . . . . . . . . . . . . . . . . . . $ 2.71 $ 2.89 $ 2.61
Average common shares outstanding—diluted . . . . . 318,113 318,063 321,717
BasicContinuing operations attributable to H. J. Heinz
Company common shareholders . . . . . . . . . . . . . . $ 2.89 $ 2.95 $ 2.65Discontinued operations attributable to H. J. Heinz
Company common shareholders . . . . . . . . . . . . . . (0.16) (0.02) (0.01)Net income attributable to H. J. Heinz Company
common shareholders . . . . . . . . . . . . . . . . . . . . . $ 2.73 $ 2.93 $ 2.65
Average common shares outstanding—basic . . . . . . 315,948 313,747 317,019
Cash dividends per share . . . . . . . . . . . . . . . . . . . . . . . $ 1.68 $ 1.66 $ 1.52
Amounts attributable to H. J. Heinz Companycommon shareholders:Income from continuing operations, net of tax . . . . . $ 914,489 $ 929,511 $ 846,623Loss from discontinued operations, net of tax . . . . . (49,597) (6,439) (1,698)
Net income . . . . . . . . . . . . . . . . . . . . . . . . . . . . . . . $ 864,892 $ 923,072 $ 844,925
(Per share amounts may not add due to rounding)See Notes to Consolidated Financial Statements
40

H. J. Heinz Company and Subsidiaries
Consolidated Balance Sheets
April 28,2010
April 29,2009
(In thousands)
AssetsCurrent assets:
Cash and cash equivalents . . . . . . . . . . . . . . . . . . . . . . . . . . . . . . . . . $ 483,253 $ 373,145Trade receivables (net of allowances: 2010—$10,196 and
2009—$10,233) . . . . . . . . . . . . . . . . . . . . . . . . . . . . . . . . . . . . . . . . 794,845 881,164Other receivables (net of allowances: 2010—$268 and
2009—$1,162) . . . . . . . . . . . . . . . . . . . . . . . . . . . . . . . . . . . . . . . . . 250,493 290,633Inventories:
Finished goods and work-in-process . . . . . . . . . . . . . . . . . . . . . . . . 979,543 973,983Packaging material and ingredients . . . . . . . . . . . . . . . . . . . . . . . . 269,584 263,630
Total inventories . . . . . . . . . . . . . . . . . . . . . . . . . . . . . . . . . . . . . 1,249,127 1,237,613Prepaid expenses . . . . . . . . . . . . . . . . . . . . . . . . . . . . . . . . . . . . . . . . 130,819 125,765Other current assets . . . . . . . . . . . . . . . . . . . . . . . . . . . . . . . . . . . . . . 142,588 36,701
Total current assets . . . . . . . . . . . . . . . . . . . . . . . . . . . . . . . . . . . 3,051,125 2,945,021
Property, plant and equipment:Land . . . . . . . . . . . . . . . . . . . . . . . . . . . . . . . . . . . . . . . . . . . . . . . . 77,248 76,193Buildings and leasehold improvements . . . . . . . . . . . . . . . . . . . . . 842,346 775,217Equipment, furniture and other . . . . . . . . . . . . . . . . . . . . . . . . . . . 3,546,046 3,258,152
4,465,640 4,109,562Less accumulated depreciation. . . . . . . . . . . . . . . . . . . . . . . . . . . . . . 2,373,844 2,131,260
Total property, plant and equipment, net . . . . . . . . . . . . . . . . . . 2,091,796 1,978,302
Other non-current assets:Goodwill . . . . . . . . . . . . . . . . . . . . . . . . . . . . . . . . . . . . . . . . . . . . . . . 2,770,918 2,687,788Trademarks, net . . . . . . . . . . . . . . . . . . . . . . . . . . . . . . . . . . . . . . . . . 895,138 889,815Other intangibles, net. . . . . . . . . . . . . . . . . . . . . . . . . . . . . . . . . . . . . 402,576 405,351Long-term restricted cash. . . . . . . . . . . . . . . . . . . . . . . . . . . . . . . . . . — 192,736Other non-current assets . . . . . . . . . . . . . . . . . . . . . . . . . . . . . . . . . . 864,158 565,171
Total other non-current assets. . . . . . . . . . . . . . . . . . . . . . . . . . . 4,932,790 4,740,861
Total assets . . . . . . . . . . . . . . . . . . . . . . . . . . . . . . . . . . . . . . . . . $10,075,711 $9,664,184
See Notes to Consolidated Financial Statements
41

H. J. Heinz Company and Subsidiaries
Consolidated Balance Sheets
April 28,2010
April 29,2009(2)
(In thousands)
Liabilities and EquityCurrent liabilities:
Short-term debt . . . . . . . . . . . . . . . . . . . . . . . . . . . . . . . . . . . . . . . . . $ 43,853 $ 61,297Portion of long-term debt due within one year. . . . . . . . . . . . . . . . . . 15,167 4,341Trade payables . . . . . . . . . . . . . . . . . . . . . . . . . . . . . . . . . . . . . . . . . . 1,007,517 955,430Other payables . . . . . . . . . . . . . . . . . . . . . . . . . . . . . . . . . . . . . . . . . . 121,997 157,877Salaries and wages . . . . . . . . . . . . . . . . . . . . . . . . . . . . . . . . . . . . . . . 118,161 91,283Accrued marketing . . . . . . . . . . . . . . . . . . . . . . . . . . . . . . . . . . . . . . . 288,579 233,316Other accrued liabilities . . . . . . . . . . . . . . . . . . . . . . . . . . . . . . . . . . . 549,492 485,406Income taxes . . . . . . . . . . . . . . . . . . . . . . . . . . . . . . . . . . . . . . . . . . . . 30,593 73,896
Total current liabilities . . . . . . . . . . . . . . . . . . . . . . . . . . . . . . . . . . 2,175,359 2,062,846
Long-term debt and other non-current liabilities:Long-term debt . . . . . . . . . . . . . . . . . . . . . . . . . . . . . . . . . . . . . . . . . . 4,559,152 5,076,186Deferred income taxes . . . . . . . . . . . . . . . . . . . . . . . . . . . . . . . . . . . . 665,089 345,749Non-pension post-retirement benefits . . . . . . . . . . . . . . . . . . . . . . . . 216,423 214,786Other non-current liabilities. . . . . . . . . . . . . . . . . . . . . . . . . . . . . . . . 511,192 685,512
Total long-term debt and other non-current liabilities . . . . . . . . . . 5,951,856 6,322,233
Equity:Capital stock:
Third cumulative preferred, $1.70 first series, $10 par value(1) . . 70 70Common stock, 431,096 shares issued, $0.25 par value . . . . . . . . . 107,774 107,774
107,844 107,844Additional capital . . . . . . . . . . . . . . . . . . . . . . . . . . . . . . . . . . . . . . . . 657,596 737,917Retained earnings . . . . . . . . . . . . . . . . . . . . . . . . . . . . . . . . . . . . . . . . 6,856,033 6,525,719
7,621,473 7,371,480Less:Treasury shares, at cost (113,404 shares at April 28, 2010 and
116,237 shares at April 29, 2009) . . . . . . . . . . . . . . . . . . . . . . . . . . 4,750,547 4,881,842Accumulated other comprehensive loss . . . . . . . . . . . . . . . . . . . . . . . 979,581 1,269,700
Total H.J. Heinz Company shareholders’ equity. . . . . . . . . . . . . . . 1,891,345 1,219,938Noncontrolling interest(2). . . . . . . . . . . . . . . . . . . . . . . . . . . . . . . . . . 57,151 59,167
Total equity . . . . . . . . . . . . . . . . . . . . . . . . . . . . . . . . . . . . . . . . . . . 1,948,496 1,279,105
Total liabilities and equity . . . . . . . . . . . . . . . . . . . . . . . . . . . . . . . $10,075,711 $9,664,184
(1) The preferred stock outstanding is convertible at a rate of one share of preferred stock into 15 shares of common stock. TheCompany can redeem the stock at $28.50 per share. As of April 28, 2010, there were authorized, but unissued, 2,200 sharesof third cumulative preferred stock for which the series had not been designated.
(2) Noncontrolling (minority) interest has been reclassified and presented as a component of equity as a result of the adoptionof new accounting guidance (see Note 2).
See Notes to Consolidated Financial Statements
42

H. J. Heinz Company and Subsidiaries
Consolidated Statements of Equity
Shares Dollars Shares Dollars Shares DollarsApril 28, 2010 April 29, 2009 April 30, 2008
(Amounts in thousands, expect per share amounts)
PREFERRED STOCKBalance at beginning of year . . . . . . . . . . . . . . . . . . . . . . 7 $ 70 7 $ 72 8 $ 77
Conversion of preferred into common stock . . . . . . . . . . . — — — (2) (1) (5)
Balance at end of year . . . . . . . . . . . . . . . . . . . . . . . . . . 7 70 7 70 7 72
Authorized shares- April 28, 2010. . . . . . . . . . . . . . . . . . . 7
COMMON STOCKBalance at beginning of year . . . . . . . . . . . . . . . . . . . . . . 431,096 107,774 431,096 107,774 431,096 107,774
Balance at end of year . . . . . . . . . . . . . . . . . . . . . . . . . . 431,096 107,774 431,096 107,774 431,096 107,774
Authorized shares- April 28, 2010. . . . . . . . . . . . . . . . . . . 600,000
ADDITIONAL CAPITALBalance at beginning of year . . . . . . . . . . . . . . . . . . . . . . 737,917 617,811 580,606
Conversion of preferred into common stock . . . . . . . . . . . (29) (95) (219)Stock options exercised, net of shares tendered for
payment . . . . . . . . . . . . . . . . . . . . . . . . . . . . . . . . (21,717)(4) 98,736(4) 20,920(4)Stock option expense . . . . . . . . . . . . . . . . . . . . . . . . . . 7,897 9,405 8,919Restricted stock unit activity . . . . . . . . . . . . . . . . . . . . (9,698) (538) 4,961Initial adoption of accounting guidance for uncertainty in
income taxes . . . . . . . . . . . . . . . . . . . . . . . . . . . . . — — (1,719)Tax settlement(1) . . . . . . . . . . . . . . . . . . . . . . . . . . . . — 8,537 —Purchase of subsidiary shares from noncontrolling
interests(2) . . . . . . . . . . . . . . . . . . . . . . . . . . . . . . (54,209) — —Other, net(3) . . . . . . . . . . . . . . . . . . . . . . . . . . . . . . . (2,565) 4,061 4,343
Balance at end of year . . . . . . . . . . . . . . . . . . . . . . . . . . 657,596 737,917 617,811
RETAINED EARNINGSBalance at beginning of year . . . . . . . . . . . . . . . . . . . . . . 6,525,719 6,129,008 5,778,617
Net income attributable to H.J. Heinz Company . . . . . . . . 864,892 923,072 844,925Cash dividends:
Preferred (per share $1.70 per share in 2010, 2009 and2008) . . . . . . . . . . . . . . . . . . . . . . . . . . . . . . . . . (9) (12) (12)
Common (per share $1.68, $1.66, and $1.52 in 2010, 2009and 2008, respectively) . . . . . . . . . . . . . . . . . . . . . (533,543) (525,281) (485,234)
Initial adoption of accounting guidance for uncertainty inincome taxes . . . . . . . . . . . . . . . . . . . . . . . . . . . . . — — (9,288)
Other(5) . . . . . . . . . . . . . . . . . . . . . . . . . . . . . . . . . . (1,026) (1,068) —
Balance at end of year . . . . . . . . . . . . . . . . . . . . . . . . . . 6,856,033 6,525,719 6,129,008
TREASURY STOCKBalance at beginning of year . . . . . . . . . . . . . . . . . . . . . . (116,237) (4,881,842) (119,628) (4,905,755) (109,317) (4,406,126)
Shares reacquired . . . . . . . . . . . . . . . . . . . . . . . . . . . — — (3,650) (181,431) (13,054) (580,707)Conversion of preferred into common stock . . . . . . . . . . . 1 29 3 97 8 224Stock options exercised, net of shares tendered for
payment . . . . . . . . . . . . . . . . . . . . . . . . . . . . . . . . 2,038 94,315 6,179 178,559 2,116 62,486Restricted stock unit activity . . . . . . . . . . . . . . . . . . . . 470 21,864 485 15,026 289 8,591Other, net(3) . . . . . . . . . . . . . . . . . . . . . . . . . . . . . . . 324 15,087 374 11,662 330 9,777
Balance at end of year . . . . . . . . . . . . . . . . . . . . . . . . . . (113,404) $(4,750,547) (116,237) $(4,881,842) (119,628) $(4,905,755)(1) See Note No. 6 for further details.(2) See Note No. 4 for further details.(3) Includes activity of the Global Stock Purchase Plan.(4) Includes income tax benefit resulting from exercised stock options.(5) Includes adoption of the measurement date provisions of accounting guidance for defined benefit pension and other postretirement plans and
unpaid dividend equivalents on restricted stock units.(6) Comprised of unrealized translation adjustment of $(221,611), pension and post-retirement benefits net prior service cost of $(7,833) and net
losses of $(749,815), and deferred net losses on derivative financial instruments of $1,876 .
See Notes to Consolidated Financial Statements
43

H. J. Heinz Company and Subsidiaries
Consolidated Statements of Equity
Shares Dollars Shares Dollars Shares DollarsApril 28, 2010 April 29, 2009 April 30, 2008
(Amounts in thousands, expect per share amounts)OTHER COMPREHENSIVE (LOSS)/INCOMEBalance at beginning of year . . . . . . . . . . . . . . . $(1,269,700) $ (61,090) $ (219,265)
Net pension and post-retirement benefitgains/(losses) . . . . . . . . . . . . . . . . . . . . . . . 78,871 (301,347) (155,989)
Reclassification of net pension and post-retirement benefit losses to net income . . . . . 38,903 24,744 27,787
Unrealized translation adjustments . . . . . . . . . 193,600 (944,439) 281,090Net change in fair value of cash flow hedges . . (32,488) 33,204 16,273Net hedging losses/(gains) reclassified into
earnings . . . . . . . . . . . . . . . . . . . . . . . . . . 13,431 (20,772) (10,986)Purchase of subsidiary shares from
noncontrolling interests(2) . . . . . . . . . . . . . . (2,198) — —
Balance at end of year. . . . . . . . . . . . . . . . . . . . (979,581)(6) (1,269,700) (61,090)
TOTAL H.J. HEINZ COMPANYSHAREHOLDERS’ EQUITY . . . . . . . . . . . . 1,891,345 1,219,938 1,887,820
NONCONTROLLING INTERESTBalance at beginning of year . . . . . . . . . . . . . . . 59,167 65,727 98,309
Net income attributable to the noncontrollinginterest . . . . . . . . . . . . . . . . . . . . . . . . . . . 17,451 14,889 11,553
Other comprehensive income, net of tax:Net pension and post-retirement benefit
losses . . . . . . . . . . . . . . . . . . . . . . . . . . . (1,266) (464) —Unrealized translation adjustments . . . . . . . 8,411 (8,110) (1,727)Net change in fair value of cash flow
hedges . . . . . . . . . . . . . . . . . . . . . . . . . . (788) 131 —Net hedging losses/(gains) reclassified into
earnings . . . . . . . . . . . . . . . . . . . . . . . . . 254 (56) —Dispositions of minority-owned entities . . . . . — — (20,062)Purchase of subsidiary shares from
noncontrolling interests(2) . . . . . . . . . . . . (5,467) — (10,284)Dividends paid to noncontrolling interest . . . (20,611) (12,950) (12,062)
Balance at end of year. . . . . . . . . . . . . . . . . . . . 57,151 59,167 65,727
TOTAL EQUITY . . . . . . . . . . . . . . . . . . . . . . . $ 1,948,496 $ 1,279,105 $1,953,547
COMPREHENSIVE INCOMENet income . . . . . . . . . . . . . . . . . . . . . . . . . . $ 882,343 $ 937,961 $ 856,478Other comprehensive income, net of tax:
Net pension and post-retirement benefitgains/(losses) . . . . . . . . . . . . . . . . . . . . . . 77,605 (301,811) (155,989)
Reclassification of net pension and post-retirement benefit losses to net income . . . 38,903 24,744 27,787
Unrealized translation adjustments . . . . . . . 202,011 (952,549) 279,363Net change in fair value of cash flow
hedges . . . . . . . . . . . . . . . . . . . . . . . . . . (33,276) 33,335 16,273Net hedging losses/(gains) reclassified into
earnings . . . . . . . . . . . . . . . . . . . . . . . . . 13,685 (20,828) (10,986)
Total comprehensive income/(loss) . . . . . . . . . . 1,181,271 (279,148) 1,012,926Comprehensive income attributable to the
noncontrolling interest . . . . . . . . . . . . . . . . (24,062) (6,390) (9,826)
Comprehensive income/(loss) attributable toH.J. Heinz Company . . . . . . . . . . . . . . . . . . $ 1,157,209 $ (285,538) $1,003,100
Note: See Footnote explanations on Page 43
See Notes to Consolidated Financial Statements
44

H. J. Heinz Company and Subsidiaries
Consolidated Statements of Cash Flows
April 28,2010
(52 Weeks)
April 29,2009
(52 Weeks)
April 30,2008
(52 Weeks)
Fiscal Year Ended
(Dollars in thousands)
Operating activities:Net income . . . . . . . . . . . . . . . . . . . . . . . . . . . . . . . . . . . . . . . . . $ 882,343 $ 937,961 $ 856,478Adjustments to reconcile net income to cash provided by
operating activities:Depreciation . . . . . . . . . . . . . . . . . . . . . . . . . . . . . . . . . . . . . . 254,528 241,294 250,826Amortization . . . . . . . . . . . . . . . . . . . . . . . . . . . . . . . . . . . . . . 48,308 40,081 38,071Deferred tax provision . . . . . . . . . . . . . . . . . . . . . . . . . . . . . . . 220,528 108,950 18,543Net losses/(gains) on disposals . . . . . . . . . . . . . . . . . . . . . . . . . 44,860 (6,445) (15,706)Pension contributions . . . . . . . . . . . . . . . . . . . . . . . . . . . . . . . (539,939) (133,714) (58,061)Other items, net . . . . . . . . . . . . . . . . . . . . . . . . . . . . . . . . . . . 90,938 (85,029) 68,851Changes in current assets and liabilities, excluding effects of
acquisitions and divestitures:Receivable securitization facility. . . . . . . . . . . . . . . . . . . . . . 84,200 — —Receivables . . . . . . . . . . . . . . . . . . . . . . . . . . . . . . . . . . . . . 37,187 (10,866) (55,832)Inventories. . . . . . . . . . . . . . . . . . . . . . . . . . . . . . . . . . . . . . 48,537 50,731 (133,600)Prepaid expenses and other current assets . . . . . . . . . . . . . . 2,113 996 5,748Accounts payable . . . . . . . . . . . . . . . . . . . . . . . . . . . . . . . . . (2,805) (62,934) 89,160Accrued liabilities . . . . . . . . . . . . . . . . . . . . . . . . . . . . . . . . 96,533 24,641 28,259Income taxes . . . . . . . . . . . . . . . . . . . . . . . . . . . . . . . . . . . . (5,134) 61,216 95,566
Cash provided by operating activities . . . . . . . . . . . . . . . . 1,262,197 1,166,882 1,188,303
Investing activities:Capital expenditures. . . . . . . . . . . . . . . . . . . . . . . . . . . . . . . . . . (277,642) (292,121) (301,588)Proceeds from disposals of property, plant and equipment . . . . . . 96,493 5,407 8,531Acquisitions, net of cash acquired . . . . . . . . . . . . . . . . . . . . . . . . (11,428) (293,898) (151,604)Proceeds from divestitures . . . . . . . . . . . . . . . . . . . . . . . . . . . . . 18,637 13,351 63,481Change in restricted cash . . . . . . . . . . . . . . . . . . . . . . . . . . . . . . 192,736 (192,736) —Termination of net investment hedges. . . . . . . . . . . . . . . . . . . . . — — (93,153)Other items, net . . . . . . . . . . . . . . . . . . . . . . . . . . . . . . . . . . . . . (5,353) (1,197) (79,894)
Cash provided by/(used for) investing activities . . . . . . . . 13,443 (761,194) (554,227)
Financing activities:Payments on long-term debt . . . . . . . . . . . . . . . . . . . . . . . . . . . . (630,394) (427,417) (368,214)Proceeds from long-term debt . . . . . . . . . . . . . . . . . . . . . . . . . . . 447,056 853,051 —Net (payments on)/proceeds from commercial paper and short-
term debt . . . . . . . . . . . . . . . . . . . . . . . . . . . . . . . . . . . . . . . . (427,232) (483,666) 483,730Dividends . . . . . . . . . . . . . . . . . . . . . . . . . . . . . . . . . . . . . . . . . . (533,552) (525,293) (485,246)Purchases of treasury stock . . . . . . . . . . . . . . . . . . . . . . . . . . . . — (181,431) (580,707)Exercise of stock options . . . . . . . . . . . . . . . . . . . . . . . . . . . . . . . 67,369 264,898 78,596Acquisition of subsidiary shares from noncontrolling interests. . . (62,064) — —Termination of interest rate swaps . . . . . . . . . . . . . . . . . . . . . . . — — 103,522Other items, net . . . . . . . . . . . . . . . . . . . . . . . . . . . . . . . . . . . . . (9,099) (16,478) 10,224
Cash used for financing activities . . . . . . . . . . . . . . . . . . . (1,147,916) (516,336) (758,095)
Effect of exchange rate changes on cash and cash equivalents . . . . (17,616) (133,894) 88,810
Net increase/(decrease) in cash and cash equivalents . . . . . . . . . . . 110,108 (244,542) (35,209)Cash and cash equivalents at beginning of year . . . . . . . . . . . . . . . 373,145 617,687 652,896
Cash and cash equivalents at end of year . . . . . . . . . . . . . . . . . . . . $ 483,253 $ 373,145 $ 617,687
See Notes to Consolidated Financial Statements
45
.

H. J. Heinz Company and Subsidiaries
Notes to Consolidated Financial Statements
1. Significant Accounting Policies
Fiscal Year:
H. J. Heinz Company (the “Company”) operates on a 52-week or 53-week fiscal year ending theWednesday nearest April 30. However, certain foreign subsidiaries have earlier closing dates tofacilitate timely reporting. Fiscal years, for the financial statements included herein, ended April 28,2010, April 29, 2009, and April 30, 2008.
Principles of Consolidation:
The consolidated financial statements include the accounts of the Company and entities in whichthe Company maintains a controlling financial interest. Control is generally determined based on themajority ownership of an entity’s voting interests. In certain situations, control is based on partic-ipation in the majority of an entity’s economic risks and rewards. Investments in certain companiesover which the Company exerts significant influence, but does not control the financial and operatingdecisions, are accounted for as equity method investments. All intercompany accounts and trans-actions are eliminated. Certain prior year amounts have been reclassified to conform with the Fiscal2010 presentation.
Use of Estimates:
The preparation of financial statements, in conformity with accounting principles generallyaccepted in the United States of America, requires management to make estimates and assumptionsthat affect the reported amounts of assets and liabilities, the disclosure of contingent assets andliabilities at the date of the financial statements, and the reported amounts of revenues and expensesduring the reporting period. Actual results could differ from these estimates.
Translation of Foreign Currencies:
For all significant foreign operations, the functional currency is the local currency. Assets andliabilities of these operations are translated at the exchange rate in effect at each year-end. Incomestatement accounts are translated at the average rate of exchange prevailing during the year.Translation adjustments arising from the use of differing exchange rates from period to period areincluded as a component of other comprehensive income/(loss) within shareholders’ equity. Gains andlosses from foreign currency transactions are included in net income for the period.
Highly Inflationary Accounting:
The Company applies highly inflationary accounting if the cumulative inflation rate in aneconomy for a three-year period meets or exceeds 100 percent. Under highly inflationary accounting,the financial statements of a subsidiary are remeasured into the Company’s reporting currency(U.S. dollars) and exchange gains and losses from the remeasurement of monetary assets andliabilities are reflected in current earnings, rather than accumulated other comprehensive loss onthe balance sheet, until such time as the economy is no longer considered highly inflationary. SeeNote 19 for additional information.
Cash Equivalents:
Cash equivalents are defined as highly liquid investments with original maturities of 90 days orless.
46

Inventories:
Inventories are stated at the lower of cost or market. Cost is determined principally under theaverage cost method.
Property, Plant and Equipment:
Land, buildings and equipment are recorded at cost. For financial reporting purposes, depre-ciation is provided on the straight-line method over the estimated useful lives of the assets, whichgenerally have the following ranges: buildings—40 years or less, machinery and equipment—15 years or less, computer software—3 to 7 years, and leasehold improvements—over the life ofthe lease, not to exceed 15 years. Accelerated depreciation methods are generally used for income taxpurposes. Expenditures for new facilities and improvements that substantially extend the capacityor useful life of an asset are capitalized. Ordinary repairs and maintenance are expensed as incurred.When property is retired or otherwise disposed, the cost and related accumulated depreciation areremoved from the accounts and any related gains or losses are included in income. The Companyreviews property, plant and equipment, whenever circumstances change such that the indicatedrecorded value of an asset may not be recoverable. Factors that may affect recoverability includechanges in planned use of equipment or software, and the closing of facilities. The Company’simpairment review is based on an undiscounted cash flow analysis at the lowest level for whichidentifiable cash flows exist and are largely independent. When the carrying value of the assetexceeds the future undiscounted cash flows, an impairment is indicated and the asset is written downto its fair value.
Goodwill and Intangibles:
Intangible assets with finite useful lives are amortized on a straight-line basis over the estimatedperiods benefited, and are reviewed when appropriate for possible impairment, similar to property,plant and equipment. Goodwill and intangible assets with indefinite useful lives are not amortized.The carrying values of goodwill and other intangible assets with indefinite useful lives are tested atleast annually for impairment, or when circumstances indicate that a possible impairment may exist.The annual impairment tests are performed as of the last day of the third quarter of each fiscal year.All goodwill is assigned to reporting units, which are primarily one level below our operatingsegments. We perform our impairment tests of goodwill at the reporting unit level. The Company’smeasure of impairment for both goodwill and intangible assets with indefinite lives is based on adiscounted cash flow model, using a market participant approach, that requires significant judgmentand requires assumptions about future volume trends, revenue and expense growth rates, terminalgrowth rates, discount rates, tax rates, working capital changes and macroeconomic factors.
Revenue Recognition:
The Company recognizes revenue when title, ownership and risk of loss pass to the customer.This primarily occurs upon delivery of the product to the customer. For the most part, customers donot have the right to return products unless damaged or defective. Revenue is recorded, net of salesincentives, and includes shipping and handling charges billed to customers. Shipping and handlingcosts are primarily classified as part of selling, general and administrative expenses.
Marketing Costs:
The Company promotes its products with advertising, consumer incentives and trade promo-tions. Such programs include, but are not limited to, discounts, coupons, rebates, in-store displayincentives and volume-based incentives. Advertising costs are expensed as incurred. Consumer
47
H. J. Heinz Company and Subsidiaries
Notes to Consolidated Financial Statements — (Continued)

incentive and trade promotion activities are primarily recorded as a reduction of revenue or as acomponent of cost of products sold based on amounts estimated as being due to customers andconsumers at the end of a period, based principally on historical utilization and redemption rates.Accruals for trade promotions are initially recorded at the time of sale of product to the customerbased on an estimate of the expected levels of performance of the trade promotion, which is dependentupon factors such as historical trends with similar promotions, expectations regarding customerparticipation, and sales and payment trends with similar previously offered programs. We performmonthly evaluations of our outstanding trade promotions, making adjustments where appropriate toreflect changes in estimates. Settlement of these liabilities typically occurs in subsequent periodsprimarily through an authorization process for deductions taken by a customer from amountsotherwise due to the Company. Expenses associated with coupons, which we refer to as couponredemption costs, are accrued in the period in which the coupons are offered. The initial estimatesmade for each coupon offering are based upon historical redemption experience rates for similarproducts or coupon amounts. We perform monthly evaluations of outstanding coupon accruals thatcompare actual redemption rates to the original estimates. For interim reporting purposes, adver-tising, consumer incentive and product placement expenses are charged to operations as a percent-age of volume, based on estimated volume and related expense for the full year.
Income Taxes:
Deferred income taxes result primarily from temporary differences between financial and taxreporting. If it is more likely than not that some portion or all of a deferred tax asset will not berealized, a valuation allowance is recognized. When assessing the need for valuation allowances, theCompany considers future taxable income and ongoing prudent and feasible tax planning strategies.Should a change in circumstances lead to a change in judgment about the realizability of deferred taxassets in future years, the Company would adjust related valuation allowances in the period that thechange in circumstances occurs, along with a corresponding increase or charge to income.
The Company has not provided for possible U.S. taxes on the undistributed earnings of foreignsubsidiaries that are considered to be reinvested indefinitely. Calculation of the unrecognizeddeferred tax liability for temporary differences related to these earnings is not practicable.
Stock-Based Employee Compensation Plans:
The Company recognizes the cost of all stock-based awards to employees, including grants ofemployee stock options, on a straight-line basis over their respective requisite service periods(generally equal to an award’s vesting period). A stock-based award is considered vested for expenseattribution purposes when the employee’s retention of the award is no longer contingent on providingsubsequent service. Accordingly, the Company recognizes compensation cost immediately for awardsgranted to retirement-eligible individuals or over the period from the grant date to the dateretirement eligibility is achieved, if less than the stated vesting period. The vesting approach useddoes not affect the overall amount of compensation expense recognized, but could accelerate therecognition of expense. The Company follows its previous vesting approach for the remaining portionof those outstanding awards that were unvested and granted prior to May 4, 2006, and accordingly,will recognize expense from the grant date to the earlier of the actual date of retirement or the vestingdate. Judgment is required in estimating the amount of stock-based awards expected to be forfeitedprior to vesting. If actual forfeitures differ significantly from these estimates, stock-based compen-sation expense could be materially impacted.
Compensation cost related to all stock-based awards is determined using the grant date fairvalue. Determining the fair value of employee stock options at the grant date requires judgment in
48
H. J. Heinz Company and Subsidiaries
Notes to Consolidated Financial Statements — (Continued)

estimating the expected term that the stock options will be outstanding prior to exercise as well as thevolatility and dividends over the expected term. Compensation cost for restricted stock units isdetermined based on the fair value of the Company’s stock at the grant date. The Company appliesthe modified-prospective transition method for stock options granted on or prior to, but not vested asof, May 3, 2006. Compensation cost related to these stock options is determined using the grant datefair value originally estimated and disclosed in a pro-forma manner in prior period financialstatements in accordance with the original provisions of the Financial Accounting Standards Board’s(“FASB’s”) guidance for stock compensation.
All stock-based compensation expense is recognized as a component of general and adminis-trative expenses in the Consolidated Statements of Income.
Financial Instruments:
The Company’s financial instruments consist primarily of cash and cash equivalents, receiv-ables, accounts payable, short-term and long-term debt, swaps, forward contracts, and optioncontracts. The carrying values for the Company’s financial instruments approximate fair value.As a policy, the Company does not engage in speculative or leveraged transactions, nor does theCompany hold or issue financial instruments for trading purposes.
The Company uses derivative financial instruments for the purpose of hedging currency, debtand interest rate exposures, which exist as part of ongoing business operations. The Company carriesderivative instruments on the balance sheet at fair value, determined using observable market data.Derivatives with scheduled maturities of less than one year are included in other receivables or otherpayables, based on the instrument’s fair value. Derivatives with scheduled maturities beyond oneyear are classified between current and long-term based on the timing of anticipated future cashflows. The current portion of these instruments is included in other receivables or other payables andthe long-term portion is presented as a component of other non-current assets or other non-currentliabilities, based on the instrument’s fair value.
The accounting for changes in the fair value of a derivative instrument depends on whether ithas been designated and qualifies as part of a hedging relationship and, if so, the reason for holding it.Gains and losses on fair value hedges are recognized in current period earnings in the same line itemas the underlying hedged item. The effective portion of gains and losses on cash flow hedges aredeferred as a component of accumulated other comprehensive loss and are recognized in earnings atthe time the hedged item affects earnings, in the same line item as the underlying hedged item.Hedge ineffectiveness related to cash flow hedges is reported in current period earnings within otherincome and expense. The income statement classification of gains and losses related to derivativecontracts that do not qualify for hedge accounting is determined based on the underlying intent of thecontracts. Cash flows related to the settlement of derivative instruments designated as net invest-ment hedges of foreign operations are classified in the consolidated statements of cash flows withininvesting activities. Cash flows related to the termination of derivative instruments designated asfair value hedges of fixed rate debt obligations are classified in the consolidated statements of cashflows within financing activities. All other cash flows related to derivative instruments are generallyclassified in the consolidated statements of cash flows within operating activities.
2. Recently Issued Accounting Standards
On September 15, 2009, the FASB Accounting Standards Codification (the “Codification”)became the single source of authoritative generally accepted accounting principles in the UnitedStates of America. The Codification changed the referencing of financial standards but did not
49
H. J. Heinz Company and Subsidiaries
Notes to Consolidated Financial Statements — (Continued)

change or alter existing U.S. GAAP. The Codification became effective for the Company in the secondquarter of Fiscal 2010.
Business Combinations and Consolidation
On April 30, 2009, the Company adopted new accounting guidance on business combinations andnoncontrolling interests in consolidated financial statements. The guidance on business combina-tions impacts the accounting for any business combinations completed after April 29, 2009. Thenature and extent of the impact will depend upon the terms and conditions of any such transaction.The guidance on noncontrolling interests changes the accounting and reporting for minority inter-ests, which have been recharacterized as noncontrolling interests and classified as a component ofequity. Prior period financial statements and disclosures for existing minority interests have beenrestated in accordance with this guidance. All other requirements of this guidance will be appliedprospectively. The adoption of the guidance on noncontrolling interests did not have a materialimpact on the Company’s financial statements.
In June 2009, the FASB issued an amendment to the accounting and disclosure requirements fortransfers of financial assets. This amendment removes the concept of a qualifying special-purposeentity and requires that a transferor recognize and initially measure at fair value all assets obtainedand liabilities incurred as a result of a transfer of financial assets accounted for as a sale. Thisamendment also requires additional disclosures about any transfers of financial assets and atransferor’s continuing involvement with transferred financial assets. This amendment is effectivefor fiscal years beginning after November 15, 2009, and interim periods within those fiscal years. TheCompany will adopt this amendment on April 29, 2010, the first day of Fiscal 2011, and this adoptionis not expected to have a material impact on the Company’s financial statements.
In June 2009, the FASB issued an amendment to the accounting and disclosure requirements forvariable interest entities. This amendment changes how a reporting entity determines when anentity that is insufficiently capitalized or is not controlled through voting (or similar rights) should beconsolidated. The determination of whether a reporting entity is required to consolidate anotherentity is based on, among other things, the purpose and design of the other entity and the reportingentity’s ability to direct the activities of the other entity that most significantly impact its economicperformance. The amendment also requires additional disclosures about a reporting entity’s involve-ment with variable interest entities and any significant changes in risk exposure due to thatinvolvement. A reporting entity will be required to disclose how its involvement with a variableinterest entity affects the reporting entity’s financial statements. This amendment is effective forfiscal years beginning after November 15, 2009, and interim periods within those fiscal years. TheCompany will adopt this amendment on April 29, 2010, the first day of Fiscal 2011, and this adoptionis not expected to have a material impact on the Company’s financial statements.
Fair Value
On April 30, 2009, the Company adopted new accounting guidance on fair value measurementsfor its non-financial assets and liabilities that are recognized at fair value on a non-recurring basis,including long-lived assets, goodwill, other intangible assets and exit liabilities. This guidancedefines fair value, establishes a framework for measuring fair value under generally acceptedaccounting principles, and expands disclosures about fair value measurements. This guidanceapplies whenever other accounting guidance requires or permits assets or liabilities to be measuredat fair value, but does not expand the use of fair value to new accounting transactions. The adoption ofthis guidance did not have a material impact on the Company’s financial statements. See Note 10 foradditional information.
50
H. J. Heinz Company and Subsidiaries
Notes to Consolidated Financial Statements — (Continued)

Postretirement Benefit Plans and Equity Compensation
On April 30, 2009, the Company adopted accounting guidance for determining whether instru-ments granted in share-based payment transactions are participating securities. This guidancestates that unvested share-based payment awards that contain non-forfeitable rights to dividends ordividend equivalents (whether paid or unpaid) are participating securities and shall be included inthe computation of earnings per share pursuant to the two-class method. As a result of adopting thisguidance, the Company has retrospectively adjusted its earnings per share data for prior periods. Theadoption had no impact on net income and a $0.01, $0.01, and $0.02 unfavorable impact on basic anddiluted earnings per share from continuing operations for Fiscal 2010, 2009 and 2008, respectively.See Note 13 for additional information.
In December 2008, the FASB issued new accounting guidance on employers’ disclosures aboutpostretirement benefit plan assets. This new guidance requires enhanced disclosures about planassets in an employer’s defined benefit pension or other postretirement plan. Companies are requiredto disclose information about how investment allocation decisions are made, the fair value of eachmajor category of plan assets, the basis used to determine the overall expected long-term rate ofreturn on assets assumption, a description of the inputs and valuation techniques used to develop fairvalue measurements of plan assets, and significant concentrations of credit risk. This guidance iseffective for fiscal years ending after December 15, 2009. The Company adopted this guidance in thefourth quarter of Fiscal 2010. As this guidance only requires enhanced disclosures, its adoption didnot impact the Company’s financial position, results of operations, or cash flows. See Note 11 foradditional information.
Foreign Currency
In May 2010, the FASB issued Accounting Standards Update No. 2010-19, “Foreign CurrencyIssues: Multiple Foreign Currency Exchange Rates.” The guidance provides clarification of account-ing treatment when reported balances in an entity’s financial statements differ from their underlyingU.S. dollar denominated values due to different rates being used for remeasurement and translation.The guidance indicates that upon adopting highly inflationary accounting for Venezuela, since theU.S. dollar is now the functional currency of a Venezuelan subsidiary, there should no longer be anydifferences between the amounts reported for financial reporting purposes and the amount of anyunderlying U.S. dollar denominated value held by the subsidiary. Therefore, any differences betweenthese should either be recognized in the income statement or as a cumulative translation adjustment,if the difference was previously recognized as a cumulative translation adjustment. As discussed inNote 19, the Company began applying highly inflationary accounting for its Venezuelan subsidiaryon the first day of its Fiscal 2010 fourth quarter, however, such guidance had no impact on theCompany’s financial statements.
3. Discontinued Operations and Other Disposals
During the third quarter of Fiscal 2010, the Company completed the sale of its Appetizers And,Inc. frozen hors d’oeuvres business which was previously reported within the U.S. Foodservicesegment, resulting in a $14.5 million pre-tax ($10.4 million after-tax) loss. Also during the thirdquarter, the Company completed the sale of its private label frozen desserts business in the U.K.,resulting in a $31.4 million pre-tax ($23.6 million after-tax) loss. During the second quarter of Fiscal2010, the Company completed the sale of its Kabobs frozen hors d’oeuvres business which waspreviously reported within the U.S. Foodservice segment, resulting in a $15.0 million pre-tax($10.9 million after-tax) loss. The losses on each of these transactions have been recorded indiscontinued operations.
51
H. J. Heinz Company and Subsidiaries
Notes to Consolidated Financial Statements — (Continued)

In accordance with accounting principles generally accepted in the United States of America, theoperating results related to these businesses have been included in discontinued operations in theCompany’s consolidated statements of income for all periods presented. The following table presentssummarized operating results for these discontinued operations:
April 28, 2010FY 2010
April 29, 2009FY 2009
April 30, 2008FY 2008
Fiscal Year Ended
(Millions of Dollars)
Sales . . . . . . . . . . . . . . . . . . . . . . . . . . . . . . . . . $63.0 $136.8 $185.2Net after-tax losses . . . . . . . . . . . . . . . . . . . . . . $ (4.7) $ (6.4) $ (1.7)Tax benefit on losses. . . . . . . . . . . . . . . . . . . . . $ 2.0 $ 2.4 $ 0.3
On March 31, 2010, the Company received cash proceeds of $94.6 million from the government ofthe Netherlands for property the government acquired through eminent domain proceedings. Thetransaction includes the purchase by the government of the Company’s factory located in Nijmegen,which produces soups, pasta and cereals. The cash proceeds are intended to compensate the Com-pany for costs, both capital and expense, the Company will incur over the next three years to exit thecurrent factory location and construct certain new facilities. Note, the Company will likely incur coststo rebuild an R&D facility in the Netherlands, costs to transfer a cereal line to another factorylocation, employee costs for severance and other costs directly related to the closure and relocation ofthe existing facilities. The Company also entered into a three-year leaseback on the Nijmegen factory.The Company will continue to operate in the leased factory over the next three years while com-mencing to execute its plans for closure and relocation of the operations. The Company has accountedfor the proceeds on a cost recovery basis. In doing so, the Company has made its estimates of cost, bothof a capital and expense nature, to be incurred and recovered and to which proceeds from thetransaction will be applied. Of the proceeds received, $81.2 million has been deferred based onmanagement’s total estimated future costs to be recovered and incurred and recorded in other non-current liabilities, other accrued liabilities and accumulated depreciation in the Company’s consol-idated balance sheet as of April 28, 2010. Proceeds of $15.0 million represent the excess of proceedsreceived over estimated costs to be recovered and incurred which has been recorded as a reduction ofcost of products sold in the consolidated statement of income for the year ended April 28, 2010. In thefuture, the deferred amounts will be recognized as the related costs are incurred and if estimatedcosts differ from what are actually incurred there could be adjustments that will be reflected inearnings.
4. Acquisitions
During the third quarter of Fiscal 2010, the Company acquired Arthur’s Fresh Company, achilled smoothies business in Canada for approximately $11 million in cash as well as an insignif-icant amount of contingent consideration which is scheduled to be paid in Fiscal 2013. The Companyalso made payments during Fiscal 2010 related to acquisitions completed in prior fiscal years, none ofwhich were significant.
During the second quarter of Fiscal 2009, the Company acquired Bénédicta, a sauce business inFrance for approximately $116 million. During the third quarter of Fiscal 2009, the Companyacquired Golden Circle Limited, a fruit and juice business in Australia for approximately$211 million, including the assumption of $68 million of debt that was immediately refinanced bythe Company. Additionally, the Company acquired La Bonne Cuisine, a chilled dip business inNew Zealand for approximately $28 million in the third quarter of Fiscal 2009. During the fourthquarter of Fiscal 2009, the Company acquired Papillon, a South African producer of chilled products
52
H. J. Heinz Company and Subsidiaries
Notes to Consolidated Financial Statements — (Continued)

for approximately $6 million. The Company also made payments during Fiscal 2009 related toacquisitions completed in prior fiscal years, none of which were significant.
During the first quarter of Fiscal 2008, the Company acquired the license to the Cottee’s» andRose’s» premium branded jams, jellies and toppings business in Australia and New Zealand forapproximately $58 million. During the second quarter of Fiscal 2008, the Company acquired theremaining interest in its Shanghai LongFong Foods business for approximately $18 million in cash aswell as deferred consideration. The amount and timing of the deferred payment has not yet beendetermined, but is not expected to be significant. During the fourth quarter of Fiscal 2008, theCompany acquired the Wyko» sauce business in the Netherlands for approximately $66 million. TheCompany also made payments during Fiscal 2008 related to acquisitions completed in prior fiscalyears, none of which were significant.
All of the above-mentioned acquisitions have been accounted for as business combinations and,accordingly, the respective purchase prices have been allocated to the respective assets and liabilitiesbased upon their estimated fair values as of the acquisition date. Operating results of the businessesacquired have been included in the consolidated statements of income from the respective acquisitiondates forward. Pro forma results of the Company, assuming all of the acquisitions had occurred at thebeginning of each period presented, would not be materially different from the results reported.There are no significant contingent payments, options or commitments associated with any of theacquisitions.
During Fiscal 2010, the Company acquired the remaining 49% interest in Cairo Food Industries,S.A.E, an Egyptian subsidiary of the Company that manufactures ketchup, condiments and sauces,for $62.1 million. The purchase has been accounted for primarily as a reduction in additional capitaland noncontrolling interest on the consolidated statements of equity. Prior to the transaction, theCompany was the owner of 51% of the business.
53
H. J. Heinz Company and Subsidiaries
Notes to Consolidated Financial Statements — (Continued)

5. Goodwill and Other Intangible Assets
Changes in the carrying amount of goodwill for the fiscal year ended April 28, 2010, by reportablesegment, are as follows:
NorthAmericanConsumerProducts Europe
Asia/Pacific
U.S.Foodservice
Restof
World Total(Thousands of dollars)
Balance at April 30, 2008 . .Goodwill . . . . . . . . . . . . . . $1,096,288 $1,395,461 $285,156 $262,823 $ 42,394 $3,082,122Accumulated impairment
losses . . . . . . . . . . . . . . — (54,533) (2,737) — (27,390) (84,660)
1,096,288 1,340,928 282,419 262,823 15,004 2,997,462Acquisitions . . . . . . . . . . . . . — 36,983 18,238 — 394 55,615Purchase accounting
adjustments . . . . . . . . . . . — (868) (1,574) — — (2,442)Disposals . . . . . . . . . . . . . . . — — — (2,300) — (2,300)Translation adjustments . . . (21,447) (286,045) (50,861) — (2,194) (360,547)
Balance at April 29, 2009 . .Goodwill . . . . . . . . . . . . . . 1,074,841 1,145,531 250,959 260,523 40,594 2,772,448Accumulated impairment
losses . . . . . . . . . . . . . . — (54,533) (2,737) — (27,390) (84,660)
1,074,841 1,090,998 248,222 260,523 13,204 2,687,788Acquisitions . . . . . . . . . . . . . 6,378 — — — — 6,378Purchase accounting
adjustments . . . . . . . . . . . — (895) (3,030) — — (3,925)Disposals . . . . . . . . . . . . . . . — (483) — (2,849) — (3,332)Translation adjustments . . . 21,672 17,124 44,233 — 980 84,009
Balance at April 28, 2010 . .Goodwill . . . . . . . . . . . . . . 1,102,891 1,161,277 292,162 257,674 41,574 2,855,578Accumulated impairment
losses . . . . . . . . . . . . . . — (54,533) (2,737) — (27,390) (84,660)
$1,102,891 $1,106,744 $289,425 $257,674 $ 14,184 $2,770,918
During the fourth quarter of Fiscal 2010, the Company completed its annual review of goodwilland indefinite-lived intangible assets. No impairments were identified during the Company’s annualassessment of goodwill and indefinite-lived intangible assets.
During the third quarter of Fiscal 2010, the Company recorded a preliminary purchase priceallocation related to the Arthur’s Fresh acquisition, which is expected to be finalized upon completionof valuation procedures. Also during the third quarter of Fiscal 2010, the Company finalized thepurchase price allocation for the Golden Circle acquisition resulting primarily in adjustmentsbetween goodwill, other intangibles and income taxes. All of the purchase accounting adjustmentsreflected in the above table relate to acquisitions completed prior to April 30, 2009, the first day ofFiscal 2010.
54
H. J. Heinz Company and Subsidiaries
Notes to Consolidated Financial Statements — (Continued)

During Fiscal 2010, the Company divested its Kabobs and Appetizers And, Inc. frozen horsd’oeuvres businesses within the U.S. Foodservice segment, and completed the sale of its private labelfrozen desserts business in the U.K. These sale transactions resulted in disposals of goodwill,trademarks and other intangible assets. See Note 3 for additional information.
Trademarks and other intangible assets at April 28, 2010 and April 29, 2009, subject toamortization expense, are as follows:
Gross Accum Amort Net Gross Accum Amort NetApril 28, 2010 April 29, 2009
(Thousands of dollars)
Trademarks . . . . . . . . . . . . $267,435 $ (73,500) $193,935 $272,710 $ (71,138) $201,572Licenses . . . . . . . . . . . . . . . 208,186 (152,509) 55,677 208,186 (146,789) 61,397Recipes/processes . . . . . . . . 78,080 (26,714) 51,366 72,988 (22,231) 50,757Customer-related assets . . . 180,302 (43,316) 136,986 179,657 (38,702) 140,955Other . . . . . . . . . . . . . . . . . 66,807 (54,157) 12,650 68,128 (55,091) 13,037
$800,810 $(350,196) $450,614 $801,669 $(333,951) $467,718
Amortization expense for trademarks and other intangible assets was $28.2 million, $28.2 mil-lion and $25.3 million for the fiscal years ended April 28, 2010, April 29, 2009 and April 30, 2008,respectively. Based upon the amortizable intangible assets recorded on the balance sheet as ofApril 28, 2010, amortization expense for each of the next five fiscal years is estimated to beapproximately $28 million.
Intangible assets not subject to amortization at April 28, 2010 totaled $847.1 million and consistedof $701.2 million of trademarks, $113.8 million of recipes/processes, and $32.1 million of licenses.Intangible assets not subject to amortization at April 29, 2009 totaled $827.4 million and consisted of$688.2 million of trademarks, $111.6 million of recipes/processes, and $27.6 million of licenses.
6. Income Taxes
The following table summarizes the (benefit)/provision for U.S. federal, state and foreign taxeson income from continuing operations.
2010 2009 2008(Dollars in thousands)
Current:U.S. federal . . . . . . . . . . . . . . . . . . . . . . . . . . . . . . . . $ (24,446) $ 73,490 $ 79,310State . . . . . . . . . . . . . . . . . . . . . . . . . . . . . . . . . . . . . (809) 1,855 15,218Foreign . . . . . . . . . . . . . . . . . . . . . . . . . . . . . . . . . . . 163,241 192,765 260,977
137,986 268,110 355,505
Deferred:U.S. federal . . . . . . . . . . . . . . . . . . . . . . . . . . . . . . . . 165,141 73,130 14,072State . . . . . . . . . . . . . . . . . . . . . . . . . . . . . . . . . . . . . 8,141 8,230 1,823Foreign . . . . . . . . . . . . . . . . . . . . . . . . . . . . . . . . . . . 47,246 26,013 1,187
220,528 107,373 17,082
Provision for income taxes . . . . . . . . . . . . . . . . . . . . $358,514 $375,483 $372,587
Tax benefits related to stock options and other equity instruments recorded directly to additionalcapital totaled $9.3 million in Fiscal 2010, $17.6 million in Fiscal 2009 and $6.2 million in Fiscal 2008.
55
H. J. Heinz Company and Subsidiaries
Notes to Consolidated Financial Statements — (Continued)

The components of income from continuing operations before income taxes consist of the following:2010 2009 2008
(Dollars in thousands)
Domestic. . . . . . . . . . . . . . . . . . . . . . . . . . . . . . . . $ 499,059 $ 534,217 $ 257,330Foreign . . . . . . . . . . . . . . . . . . . . . . . . . . . . . . . . . 791,395 785,666 973,433
From continuing operations . . . . . . . . . . . . . . . . . $1,290,454 $1,319,883 $1,230,763
The differences between the U.S. federal statutory tax rate and the Company’s consolidatedeffective tax rate on continuing operations are as follows:
2010 2009 2008
U.S. federal statutory tax rate. . . . . . . . . . . . . . . . . . . . . . . . . . . . . . . 35.0% 35.0% 35.0%Tax on income of foreign subsidiaries . . . . . . . . . . . . . . . . . . . . . . . . . (3.5) (4.1) (4.9)State income taxes (net of federal benefit) . . . . . . . . . . . . . . . . . . . . . 0.3 0.6 0.6Earnings repatriation . . . . . . . . . . . . . . . . . . . . . . . . . . . . . . . . . . . . . 1.2 0.4 3.2Tax free interest . . . . . . . . . . . . . . . . . . . . . . . . . . . . . . . . . . . . . . . . . (4.6) (2.5) (1.2)Effects of revaluation of tax basis of foreign assets . . . . . . . . . . . . . . (0.5) (0.7) (2.4)Other . . . . . . . . . . . . . . . . . . . . . . . . . . . . . . . . . . . . . . . . . . . . . . . . . . (0.1) (0.3) —
Effective tax rate . . . . . . . . . . . . . . . . . . . . . . . . . . . . . . . . . . . . . . . . . 27.8% 28.4% 30.3%
The decrease in the effective tax rate in Fiscal 2010 is primarily the result of tax efficientfinancing of the Company’s operations, partially offset by higher taxes on repatriation of earnings.The decrease in the effective tax rate in Fiscal 2009 was primarily the result of reduced repatriationcosts partially offset by decreased benefits from the revaluation of tax basis of foreign assets. Theeffective tax rate in Fiscal 2008 was impacted by higher earnings repatriation costs which werepartially offset by increased benefits from the revaluation of the tax basis of foreign assets.
The following table and note summarize deferred tax (assets) and deferred tax liabilities as ofApril 28, 2010 and April 29, 2009.
2010 2009(Dollars in thousands)
Depreciation/amortization . . . . . . . . . . . . . . . . . . . . . . . . . . . . . . $ 754,353 $ 643,538Benefit plans . . . . . . . . . . . . . . . . . . . . . . . . . . . . . . . . . . . . . . . . 38,718 1,854Deferred income . . . . . . . . . . . . . . . . . . . . . . . . . . . . . . . . . . . . . . 66,920 84,939Financing costs . . . . . . . . . . . . . . . . . . . . . . . . . . . . . . . . . . . . . . 118,512 —Other . . . . . . . . . . . . . . . . . . . . . . . . . . . . . . . . . . . . . . . . . . . . . . 102,663 90,640
Deferred tax liabilities . . . . . . . . . . . . . . . . . . . . . . . . . . . . . . 1,081,166 820,971
Operating loss carryforwards and carrybacks . . . . . . . . . . . . . . . (159,519) (87,923)Benefit plans . . . . . . . . . . . . . . . . . . . . . . . . . . . . . . . . . . . . . . . . (178,363) (295,254)Depreciation/amortization . . . . . . . . . . . . . . . . . . . . . . . . . . . . . . (74,925) (53,461)Tax credit carryforwards . . . . . . . . . . . . . . . . . . . . . . . . . . . . . . . (62,284) (34,721)Deferred income . . . . . . . . . . . . . . . . . . . . . . . . . . . . . . . . . . . . . . (36,373) (44,308)Other . . . . . . . . . . . . . . . . . . . . . . . . . . . . . . . . . . . . . . . . . . . . . . (123,681) (91,851)
Deferred tax assets . . . . . . . . . . . . . . . . . . . . . . . . . . . . . . . . . . (635,145) (607,518)
Valuation allowance . . . . . . . . . . . . . . . . . . . . . . . . . . . . . . . . . . . 62,519 59,072
Net deferred tax liabilities . . . . . . . . . . . . . . . . . . . . . . . . . . . $ 508,540 $ 272,525
56
H. J. Heinz Company and Subsidiaries
Notes to Consolidated Financial Statements — (Continued)

The Company also has foreign deferred tax assets and valuation allowances of $119.2 million,each related to statutory increases in the capital tax bases of certain internally generated intangibleassets for which the probability of realization is remote.
The Company records valuation allowances to reduce deferred tax assets to the amount that ismore likely than not to be realized. When assessing the need for valuation allowances, the Companyconsiders future taxable income and ongoing prudent and feasible tax planning strategies. Should achange in circumstances lead to a change in judgment about the realizability of deferred tax assets infuture years, the Company would adjust related valuation allowances in the period that the change incircumstances occurs, along with a corresponding increase or charge to income.
The resolution of tax reserves and changes in valuation allowances could be material to theCompany’s results of operations for any period, but is not expected to be material to the Company’sfinancial position.
At the end of Fiscal 2010, foreign operating loss carryforwards totaled $312.7 million. Of thatamount, $193.2 million expire between 2011 and 2020; the other $119.5 million do not expire.Deferred tax assets of $47.4 million have been recorded for foreign tax credit carryforwards. Thesecredit carryforwards expire between 2015 and 2020. Deferred tax assets of $13.1 million have beenrecorded for state operating loss carryforwards. These losses expire between 2011 and 2030.
The net change in the Fiscal 2010 valuation allowance shown above is an increase of $3.4 million.The increase was primarily due to the recording of additional valuation allowance for foreign losscarryforwards that are not expected to be utilized prior to their expiration date, partially offset by areduction in unrealizable net state deferred tax assets. The net change in the Fiscal 2009 valuationallowance was an increase of $7.1 million. The increase was primarily due to the recording ofadditional valuation allowance for foreign loss carryforwards and state deferred tax assets that werenot expected to be utilized prior to their expiration date. The net change in the Fiscal 2008 valuationallowance was an increase of $7.0 million. The increase was primarily due to the recording ofadditional valuation allowance for state deferred tax assets that were not expected to be utilized priorto their expiration date.
A reconciliation of the beginning and ending amount of gross unrecognized tax benefits is as follows:2010 2009 2008
(Dollars in millions)
Balance at the beginning of the fiscal year . . . . . . . . . . . . . . . $ 86.6 $129.1 $183.7Increases for tax positions of prior years . . . . . . . . . . . . . . . . . 3.7 11.3 10.6Decreases for tax positions of prior years. . . . . . . . . . . . . . . . . (35.4) (59.5) (31.0)Increases based on tax positions related to the current year. . 10.4 15.0 9.9Decreases due to settlements with taxing authorities . . . . . . . (0.8) (0.8) (41.0)Decreases due to lapse of statute of limitations . . . . . . . . . . . . (7.4) (8.5) (3.1)
Balance at the end of the fiscal year . . . . . . . . . . . . . . . . . . . . $ 57.1 $ 86.6 $129.1
The amount of unrecognized tax benefits that, if recognized, would impact the effective tax ratewas $38.2 million and $51.9 million, on April 28, 2010 and April 29, 2009, respectively.
The Company classifies interest and penalties on tax uncertainties as a component of theprovision for income taxes. For Fiscal 2010, the total amount of gross interest and penalty expenseincluded in the provision for income taxes was $2.0 million and $0.3 million, respectively. For Fiscal2009, the total amount of gross interest and penalty expense included in the provision for incometaxes was $2.8 million and $0.4 million, respectively. For Fiscal 2008, the total amount of gross
57
H. J. Heinz Company and Subsidiaries
Notes to Consolidated Financial Statements — (Continued)

interest and penalty expense included in the provision for income taxes was $10.7 million and$0.6 million, respectively. The total amount of interest and penalties accrued as of April 28, 2010 was$17.3 million and $1.2 million, respectively. The corresponding amounts of accrued interest andpenalties at April 29, 2009 were $22.5 million and $2.2 million, respectively.
It is reasonably possible that the amount of unrecognized tax benefits will decrease by as muchas $16.2 million in the next 12 months primarily due to the expiration of statutes in various foreignjurisdictions along with the progression of state and foreign audits in process.
During Fiscal 2009, the Company effectively settled its appeal filed October 15, 2007 of a U.S.Court of Federal Claims decision regarding a refund claim resulting from a Fiscal 1995 transaction.The effective settlement resulted in a $42.7 million decrease in the amount of unrecognized taxbenefits, $8.5 million of which was recorded as a credit to additional capital and was received as arefund of tax during Fiscal 2009.
The provision for income taxes consists of provisions for federal, state and foreign income taxes.The Company operates in an international environment with significant operations in variouslocations outside the U.S. Accordingly, the consolidated income tax rate is a composite rate reflectingthe earnings in various locations and the applicable tax rates. In the normal course of business theCompany is subject to examination by taxing authorities throughout the world, including such majorjurisdictions as Australia, Canada, Italy, the United Kingdom and the United States. The Companyhas substantially concluded all national income tax matters for years through Fiscal 2007 for theU.S. and the United Kingdom, and through Fiscal 2005 for Australia, Canada and Italy.
Undistributed earnings of foreign subsidiaries considered to be indefinitely reinvested or whichmay be remitted tax free in certain situations, amounted to $3.7 billion at April 28, 2010.
7. Debt and Financing Arrangements
Short-term debt consisted of bank debt and other borrowings of $43.9 million and $61.3 millionas of April 28, 2010 and April 29, 2009, respectively. The weighted average interest rate was 4.7% and6.7% for Fiscal 2010 and Fiscal 2009, respectively.
On June 12, 2009, the Company entered into a three-year $175 million accounts receivablesecuritization program. Under the terms of the agreement, the Company sells, on a revolving basis,its U.S. receivables to a wholly-owned, bankruptcy-remote-subsidiary. This subsidiary then sells allof the rights, title and interest in these receivables to an unaffiliated entity. After the sale, theCompany, as servicer of the assets, collects the receivables on behalf of the unaffiliated entity. Theamount of receivables sold through this program as of April 28, 2010 was $84.2 million. The proceedsfrom this securitization program are recognized on the statements of cash flows as a component ofoperating activities.
On July 29, 2009, H. J. Heinz Finance Company (“HFC”), a subsidiary of Heinz, issued$250 million of 7.125% notes due 2039. The notes are fully, unconditionally and irrevocably guar-anteed by the Company. The proceeds from the notes were used for payment of the cash component ofthe exchange transaction discussed below as well as various expenses relating to the exchange, andfor general corporate purposes.
As of April 29, 2009, the Company had $800 million of remarketable securities due December 2020.On August 6, 2009, HFC issued $681 million of 7.125% notes due 2039 (of the same series as the notesissued in July 2009), and paid $217.5 million of cash, in exchange for $681 million of its outstanding15.590% dealer remarketable securities due December 1, 2020. In addition, HFC terminated a portionof the remarketing option by paying the remarketing agent a cash payment of $89.0 million. The
58
H. J. Heinz Company and Subsidiaries
Notes to Consolidated Financial Statements — (Continued)

exchange transaction was accounted for as a modification of debt. Accordingly, cash payments used inthe exchange, including the payment to the remarketing agent, have been accounted for as a reductionin the book value of the debt, and will be amortized to interest expense under the effective yield method.Additionally, the Company terminated its $175 million notional total rate of return swap in August2009 in connection with the dealer remarketable securities exchange transaction. See Note 12 foradditional information. The next remarketing on the remaining remarketable securities ($119 million)is scheduled for December 1, 2011. If the remaining securities are not remarketed, then the Company isrequired to repurchase all of the remaining securities at 100% of the principal amount plus accruedinterest. If the Company purchases or otherwise acquires the remaining securities from the holders,the Company is required to pay to the holder of the remaining remarketing option the optionsettlement amount. This value fluctuates based on market conditions.
During the second quarter of Fiscal 2010, the Company entered into a three-year 15 billionJapanese yen denominated credit agreement. The proceeds were swapped to U.S. dollar 167.3 millionand the interest rate was fixed at 4.084%. See Note 12 for additional information.
During the third quarter of Fiscal 2010, the Company paid off its A$281 million Australiandenominated borrowings ($257 million), which matured on December 16, 2009.
At April 28, 2010, the Company had $1.7 billion of credit agreements, $1.2 billion of whichexpires in April 2012 and $500 million which expires in April 2013. The credit agreement that expiresin 2013 replaced the $600 million credit agreement that expired in April 2010. These credit agree-ments support the Company’s commercial paper borrowings. As a result, the commercial paperborrowings are classified as long-term debt based upon the Company’s intent and ability to refinancethese borrowings on a long-term basis. The credit agreements have identical covenants which includea leverage ratio covenant in addition to customary covenants. The Company was in compliance withall of its covenants as of April 28, 2010 and April 29, 2009. In addition, the Company has$488.6 million of foreign lines of credit available at April 28, 2010.
59
H. J. Heinz Company and Subsidiaries
Notes to Consolidated Financial Statements — (Continued)

Long-term debt was comprised of the following as of April 28, 2010 and April 29, 2009:2010 2009
(Dollars in thousands)
Commercial Paper (variable rate) . . . . . . . . . . . . . . . . . . . . . . . . . $ 232,829 $ 639,9587.125% U.S. Dollar Notes due August 2039 . . . . . . . . . . . . . . . . . 624,531 —8.0% Heinz Finance Preferred Stock due July 2013 . . . . . . . . . . . 350,000 350,0005.35% U.S. Dollar Notes due July 2013. . . . . . . . . . . . . . . . . . . . . 499,888 499,8536.625% U.S. Dollar Notes due July 2011 . . . . . . . . . . . . . . . . . . . . 749,878 749,7736.00% U.S. Dollar Notes due March 2012 . . . . . . . . . . . . . . . . . . . 599,187 598,744U.S. Dollar Remarketable Securities due December 2020 . . . . . . 119,000 800,0006.375% U.S. Dollar Debentures due July 2028 . . . . . . . . . . . . . . . 230,619 230,3606.25% British Pound Notes due February 2030 . . . . . . . . . . . . . . 188,928 183,4406.75% U.S. Dollar Notes due March 2032 . . . . . . . . . . . . . . . . . . . 440,942 440,867Japanese Yen Credit Agreement due October 2012 (variable
rate) . . . . . . . . . . . . . . . . . . . . . . . . . . . . . . . . . . . . . . . . . . . . . . 159,524 —Australian Dollar Credit Agreement (variable rate) . . . . . . . . . . . — 204,287Canadian Dollar Credit Agreement (variable rate) . . . . . . . . . . . — 39,917Other U.S. Dollar due May 2010—November 2034 (1.04—7.90)% . . 110,339 55,609Other Non-U.S. Dollar due May 2010—March 2022
(7.00—11.00)% . . . . . . . . . . . . . . . . . . . . . . . . . . . . . . . . . . . . . . 61,558 36,244
4,367,223 4,829,052Hedge Accounting Adjustments (See Note 12) . . . . . . . . . . . . . . . 207,096 251,475Less portion due within one year . . . . . . . . . . . . . . . . . . . . . . . . . (15,167) (4,341)
Total long-term debt . . . . . . . . . . . . . . . . . . . . . . . . . . . . . . . . . . . $4,559,152 $5,076,186
Weighted-average interest rate on long-term debt, including theimpact of applicable interest rate swaps . . . . . . . . . . . . . . . . . . 4.45% 5.31%
During Fiscal 2009, the Company completed the sale of $500 million 5.35% Notes due 2013. Also,during Fiscal 2009, the Company’s HFC subsidiary completed the sale of $350 million or 3,500 sharesof its Series B Preferred Stock. The proceeds from both transactions were used for general corporatepurposes, including the repayment of commercial paper and other indebtedness incurred to redeemHFC’s Series A Preferred Stock.
HFC’s 3,500 mandatorily redeemable preferred shares are classified as long-term debt. Eachshare of preferred stock is entitled to annual cash dividends at a rate of 8% or $8,000 per share. OnJuly 15, 2013, each share will be redeemed for $100,000 in cash for a total redemption price of$350 million.
Annual maturities of long-term debt during the next five fiscal years are $15.2 million in 2011,$1,401.8 million in 2012, $446.6 million in 2013 (includes the commercial paper in the table above),$872.8 million in 2014 and $1.9 million in 2015.
60
H. J. Heinz Company and Subsidiaries
Notes to Consolidated Financial Statements — (Continued)

8. Supplemental Cash Flows Information
2010 2009 2008(Dollars in thousands)
Cash Paid During the Year For:Interest . . . . . . . . . . . . . . . . . . . . . . . . . . . . . . . . . . . . . $305,332 $310,047 $360,698
Income taxes . . . . . . . . . . . . . . . . . . . . . . . . . . . . . . . . . $138,953 $203,298 $261,283
Details of Acquisitions:Fair value of assets . . . . . . . . . . . . . . . . . . . . . . . . . . . . $ 16,072 $478,440 $165,093Liabilities(1) . . . . . . . . . . . . . . . . . . . . . . . . . . . . . . . . . 4,644 181,093 13,489
Cash paid . . . . . . . . . . . . . . . . . . . . . . . . . . . . . . . . . . . 11,428 297,347 151,604Less cash acquired . . . . . . . . . . . . . . . . . . . . . . . . . . . . — 3,449 —
Net cash paid for acquisitions . . . . . . . . . . . . . . . . . . . $ 11,428 $293,898 $151,604
(1) Includes obligations to sellers of $11.5 million in 2008.
During the second quarter of Fiscal 2010, HFC issued $681 million of 30 year notes and paid$217.5 million of cash in exchange for $681 million of its outstanding dealer remarketable securities.The $681 million of notes exchanged was a non-cash transaction and has been excluded from theconsolidated statement of cash flows for the year ended April 28, 2010. See Note 7 for additionalinformation.
The Company recognized $41.8 million of property, plant and equipment and debt in Fiscal 2010related to contractual arrangements that contain a lease. These non-cash transactions have beenexcluded from the consolidated statement of cash flows for the year ended April 28, 2010.
9. Employees’ Stock Incentive Plans and Management Incentive Plans
As of April 28, 2010, the Company had outstanding stock option awards, restricted stock unitsand restricted stock awards issued pursuant to various shareholder-approved plans and a share-holder-authorized employee stock purchase plan. The compensation cost related to these plansrecognized in general and administrative expenses, and the related tax benefit was $33.4 million and$10.3 million for the fiscal year ended April 28, 2010, $37.9 million and $12.8 million for the fiscalyear ended April 29, 2009, and $31.7 million and $11.1 million for the fiscal year ended April 30, 2008,respectively.
The Company has two plans from which it can issue equity based awards, the Fiscal Year 2003Stock Incentive Plan (the “2003 Plan”), which was approved by shareholders on September 12, 2002,and the 2000 Stock Option Plan (the “2000 Plan”), which was approved by shareholders onSeptember 12, 2000. The Company’s primary means for issuing equity-based awards is the 2003Plan. Pursuant to the 2003 Plan, the Management Development & Compensation Committee isauthorized to grant a maximum of 9.4 million shares for issuance as restricted stock units orrestricted stock. Any available shares may be issued as stock options. The maximum number ofshares that may be granted under this plan is 18.9 million shares. Shares issued under these plansare sourced from available treasury shares.
61
H. J. Heinz Company and Subsidiaries
Notes to Consolidated Financial Statements — (Continued)

Stock Options:
Stock options generally vest over a period of one to four years after the date of grant. Awardsgranted between Fiscal 2004 and Fiscal 2006 generally had a maximum term of ten years. Beginningin Fiscal 2006, awards have a maximum term of seven years.
In accordance with their respective plans, stock option awards are forfeited if a holder volun-tarily terminates employment prior to the vesting date. The Company estimates forfeitures based onan analysis of historical trends updated as discrete new information becomes available and will be re-evaluated on an annual basis. Compensation cost in any period is at least equal to the grant-date fairvalue of the vested portion of an award on that date.
The Company presents all benefits of tax deductions resulting from the exercise of stock-basedcompensation as operating cash flows in the consolidated statements of cash flows, except the benefitof tax deductions in excess of the compensation cost recognized for those options (“excess taxbenefits”) which are classified as financing cash flows. For the fiscal year ended April 28, 2010,$6.9 million of cash tax benefits was reported as an operating cash inflow and $2.4 million of excesstax benefits as a financing cash inflow. For the fiscal year ended April 29, 2009, $9.5 million of cashtax benefits was reported as an operating cash inflow and $4.8 million of excess tax benefits as afinancing cash inflow. For the fiscal year ended April 30, 2008, $2.7 million of cash tax benefits wasreported as an operating cash inflow and $1.7 million of excess tax benefits as a financing cash inflow.
As of April 28, 2010, 2,653 shares remained available for issuance under the 2000 Plan. Duringthe fiscal year ended April 28, 2010, 8,715 shares were forfeited and returned to the plan. During thefiscal year ended April 28, 2010, 34,143 shares were issued from the 2000 Plan.
A summary of the Company’s 2003 Plan at April 28, 2010 is as follows:2003 Plan
(Amounts inthousands)
Number of shares authorized . . . . . . . . . . . . . . . . . . . . . . . . . . . . . . . . . . . . . . 18,869Number of stock option shares granted . . . . . . . . . . . . . . . . . . . . . . . . . . . . . . . (6,620)Number of stock option shares cancelled/forfeited and returned to the plan . . 181Number of restricted stock units and restricted stock issued . . . . . . . . . . . . . . (4,143)
Shares available for grant as stock options . . . . . . . . . . . . . . . . . . . . . . . . . . . . 8,287
During Fiscal 2010, the Company granted 1,768,226 option awards to employees sourced fromthe 2000 and 2003 Plans. The weighted average fair value per share of the options granted during thefiscal years ended April 28, 2010, April 29, 2009 and April 30, 2008 as computed using theBlack-Scholes pricing model was $4.71, $5.75, and $6.25, respectively. The weighted averageassumptions used to estimate these fair values are as follows:
April 28,2010
April 29,2009
April 30,2008
Fiscal Year Ended
Dividend yield . . . . . . . . . . . . . . . . . . . . . . . . . . . . . . . . . . . . 4.3% 3.3% 3.3%Expected volatility . . . . . . . . . . . . . . . . . . . . . . . . . . . . . . . . . 20.2% 14.9% 15.8%Expected term (years) . . . . . . . . . . . . . . . . . . . . . . . . . . . . . . 5.5 5.5 5.0Risk-free interest rate . . . . . . . . . . . . . . . . . . . . . . . . . . . . . . 2.7% 3.1% 4.3%
The dividend yield assumption is based on the current fiscal year dividend payouts. The expectedvolatility of the Company’s common stock at the date of grant is estimated based on a historic daily
62
H. J. Heinz Company and Subsidiaries
Notes to Consolidated Financial Statements — (Continued)

volatility rate over a period equal to the average life of an option. The weighted average expected lifeof options is based on consideration of historical exercise patterns adjusted for changes in thecontractual term and exercise periods of current awards. The risk-free interest rate is based on theU.S. Treasury (constant maturity) rate in effect at the date of grant for periods corresponding withthe expected term of the options.
A summary of the Company’s stock option activity and related information is as follows:
Number ofOptions
WeightedAverage
Exercise Price(per share)
AggregateIntrinsic Value
(Amounts in thousands, except per share data)
Options outstanding at May 2, 2007 . . . . . . . . . . . . . . . . . 24,797 $40.39 $1,001,600Options granted . . . . . . . . . . . . . . . . . . . . . . . . . . . . . . . . . 1,352 45.54 61,579Options exercised . . . . . . . . . . . . . . . . . . . . . . . . . . . . . . . . (2,116) 37.31 (78,960)Options cancelled/forfeited and returned to the plan. . . . . (1,899) 51.32 (97,461)
Options outstanding at April 30, 2008 . . . . . . . . . . . . . . . . 22,134 40.06 886,758Options granted . . . . . . . . . . . . . . . . . . . . . . . . . . . . . . . . . 1,551 50.91 78,978Options exercised . . . . . . . . . . . . . . . . . . . . . . . . . . . . . . . . (6,684) 42.35 (283,064)Options cancelled/forfeited and returned to the plan. . . . . (2,901) 47.77 (138,601)
Options outstanding at April 29, 2009 . . . . . . . . . . . . . . . . 14,100 38.59 544,071Options granted . . . . . . . . . . . . . . . . . . . . . . . . . . . . . . . . . 1,768 39.12 69,166Options exercised . . . . . . . . . . . . . . . . . . . . . . . . . . . . . . . . (2,921) 35.46 (103,558)Options cancelled/forfeited and returned to the plan. . . . . (26) 40.44 (1,068)
Options outstanding at April 28, 2010 . . . . . . . . . . . . . . . . 12,921 $39.36 $ 508,611
Options vested and exercisable at April 30, 2008 . . . . . . . 19,249 $39.77 $ 765,552Options vested and exercisable at April 29, 2009 . . . . . . . 10,933 $36.18 $ 395,558Options vested and exercisable at April 28, 2010 . . . . . . . 9,300 $37.59 $ 349,600
The following summarizes information about shares under option in the respective exercise priceranges at April 28, 2010:
Range of ExercisePrice Per Share
NumberOutstanding
Weighted-Average
RemainingLife
(Years)
Weighted-Average
RemainingExercise Price
Per ShareNumber
Exercisable
Weighted-Average
RemainingLife
(Years)
Weighted-Average
Exercise Price
Options Outstanding Options Exercisable
(Options in thousands)
$29.18-$35.38. . . . . . . . . . . . 3,837 2.4 $33.50 3,828 2.4 $33.50$35.39-$42.42. . . . . . . . . . . . 6,243 3.5 38.76 4,253 2.4 38.48$42.43-$51.25. . . . . . . . . . . . 2,841 4.8 48.59 1,219 4.6 47.32
12,921 3.5 $39.36 9,300 2.7 $37.59
The Company received proceeds of $67.4 million, $264.9 million, and $78.6 million from theexercise of stock options during the fiscal years ended April 28, 2010, April 29, 2009 and April 30,2008, respectively. The tax benefit recognized as a result of stock option exercises was $9.3 million,$14.3 million and $4.4 million for the fiscal years ended April 28, 2010, April 29, 2009 and April 30,2008, respectively.
63
H. J. Heinz Company and Subsidiaries
Notes to Consolidated Financial Statements — (Continued)

A summary of the status of the Company’s unvested stock options is as follows:
Number ofOptions
WeightedAverage
Grant DateFair Value(per share)
(Amounts in thousands,except per share data)
Unvested options at April 29, 2009 . . . . . . . . . . . . . . . . . . . . . . . . . 3,167 $6.10Options granted . . . . . . . . . . . . . . . . . . . . . . . . . . . . . . . . . . . . . . . . 1,768 4.71Options vested . . . . . . . . . . . . . . . . . . . . . . . . . . . . . . . . . . . . . . . . . (1,314) 6.27
Unvested options at April 28, 2010 . . . . . . . . . . . . . . . . . . . . . . . . . 3,621 $5.36
Unrecognized compensation cost related to unvested option awards under the 2000 and 2003Plans totaled $8.1 million and $7.6 million as of April 28, 2010 and April 29, 2009, respectively. Thiscost is expected to be recognized over a weighted average period of 1.6 years.
Restricted Stock Units and Restricted Shares:
The 2003 Plan authorizes up to 9.4 million shares for issuance as restricted stock units (“RSUs”)or restricted stock with vesting periods from the first to the fifth anniversary of the grant date as setforth in the award agreements. Upon vesting, the RSUs are converted into shares of the Company’sstock on a one-for-one basis and issued to employees, subject to any deferral elections made by arecipient or required by the plan. Restricted stock is reserved in the recipients’ name at the grant dateand issued upon vesting. The Company is entitled to an income tax deduction in an amount equal tothe taxable income reported by the holder upon vesting of the award. RSUs generally vest over aperiod of one to four years after the date of grant.
Total compensation expense relating to RSUs and restricted stock was $24.8 million, $26.6 mil-lion and $21.1 million for the fiscal years ended April 28, 2010, April 29, 2009 and April 30, 2008,respectively. Unrecognized compensation cost in connection with RSU and restricted stock grantstotaled $29.8 million, $31.8 million and $35.7 million at April 28, 2010, April 29, 2009 and April 30,2008, respectively. The cost is expected to be recognized over a weighted-average period of 1.8 years.
A summary of the Company’s RSU and restricted stock awards at April 28, 2010 is as follows:2003 Plan
(Amounts in thousands)
Number of shares authorized . . . . . . . . . . . . . . . . . . . . . . . . . . . . . . . 9,440Number of shares reserved for issuance. . . . . . . . . . . . . . . . . . . . . . . (5,276)Number of shares forfeited and returned to the plan . . . . . . . . . . . . 1,133
Shares available for grant . . . . . . . . . . . . . . . . . . . . . . . . . . . . . . . . . 5,297
64
H. J. Heinz Company and Subsidiaries
Notes to Consolidated Financial Statements — (Continued)

A summary of the activity of unvested RSU and restricted stock awards and related informationis as follows:
Number of Units
WeightedAverage
Grant DateFair Value(Per Share)
(Amounts in thousands,except per share data)
Unvested units and stock at May 2, 2007 . . . . . . . . . . . . . . . . . 2,025 $36.57Units and stock granted . . . . . . . . . . . . . . . . . . . . . . . . . . . . . . . 715 46.00Units and stock vested . . . . . . . . . . . . . . . . . . . . . . . . . . . . . . . . (579) 35.94Units and stock cancelled/forfeited and returned to the plan . . (74) 38.92
Unvested units and stock at April 30, 2008. . . . . . . . . . . . . . . . 2,087 39.88Units and stock granted . . . . . . . . . . . . . . . . . . . . . . . . . . . . . . . 577 49.69Units and stock vested . . . . . . . . . . . . . . . . . . . . . . . . . . . . . . . . (910) 37.91Units and stock cancelled/forfeited and returned to the plan . . (32) 46.52
Unvested units and stock at April 29, 2009. . . . . . . . . . . . . . . . 1,722 44.08Units and stock granted . . . . . . . . . . . . . . . . . . . . . . . . . . . . . . . 628 39.55Units and stock vested . . . . . . . . . . . . . . . . . . . . . . . . . . . . . . . . (834) 40.59Units and stock cancelled/forfeited and returned to the plan . . (20) 44.12
Unvested units and stock at April 28, 2010. . . . . . . . . . . . . . . . 1,496 $44.13
Upon share option exercise or vesting of restricted stock and RSUs, the Company uses availabletreasury shares and maintains a repurchase program that anticipates exercises and vesting ofawards so that shares are available for issuance. The Company records forfeitures of restricted stockas treasury share repurchases. The Company did not repurchase any shares during Fiscal 2010.
Global Stock Purchase Plan:
The Company has a shareholder-approved employee global stock purchase plan (the “GSPP”)that permits substantially all employees to purchase shares of the Company’s common stock at adiscounted price through payroll deductions at the end of two six-month offering periods. Currently,the offering periods are February 16 to August 15 and August 16 to February 15. From the February2006 to February 2009 offering periods, the purchase price of the option was equal to 85% of the fairmarket value of the Company’s common stock on the last day of the offering period. Commencing withthe August 2009 offering period, the purchase price of the option is equal to 95% of the fair marketvalue of the Company’s common stock on the last day of the offering period. The number of sharesavailable for issuance under the GSPP is a total of five million shares. During the two offering periodsfrom February 16, 2009 to February 15, 2010, employees purchased 280,006 shares under the plan.During the two offering periods from February 16, 2008 to February 15, 2009, employees purchased315,597 shares under the plan.
Annual Incentive Bonus:
The Company’s management incentive plans cover officers and other key employees. Partici-pants may elect to be paid on a current or deferred basis. The aggregate amount of all awards may notexceed certain limits in any year. Compensation under the management incentive plans was
65
H. J. Heinz Company and Subsidiaries
Notes to Consolidated Financial Statements — (Continued)

approximately $49 million, $38 million and $45 million in fiscal years 2010, 2009 and 2008,respectively.
Long-Term Performance Program:
In Fiscal 2010, the Company granted performance awards as permitted in the Fiscal Year 2003Stock Incentive Plan, subject to the achievement of certain performance goals. These performanceawards are tied to the Company’s relative Total Shareholder Return (“Relative TSR”) Ranking withinthe defined Long-term Performance Program (“LTPP”) peer group and the 2-year average after-taxReturn on Invested Capital (“ROIC”) metrics. The Relative TSR metric is based on the two-yearcumulative return to shareholders from the change in stock price and dividends paid between thestarting and ending dates. The starting value was based on the average of each LTPP peer groupcompany stock price for the 60 trading days prior to and including April 30, 2009. The ending valuewill be based on the average stock price for the 60 trading days prior to and including the close of theFiscal 2011 year end, plus dividends paid over the 2 year performance period. The Company alsogranted performance awards in Fiscal 2009 under the 2009-2010 LTPP and in Fiscal 2008 under the2008-2009 LTPP. The compensation cost related to LTPP awards recognized in general and admin-istrative expenses (“G&A”) was $20.7 million, and the related tax benefit was $7.0 million for thefiscal year ended April 28, 2010. The compensation cost related to these plans, recognized in G&A was$17.4 million, and the related tax benefit was $5.9 million for the fiscal year ended April 29, 2009. Thecompensation cost related to these plans, recognized in G&A was $23.8 million, and the related taxbenefit was $8.1 million for the fiscal year ended April 30, 2008.
10. Fair Value Measurements
Fair value is defined as the price that would be received to sell an asset or paid to transfer aliability in an orderly transaction between market participants at the measurement date. The fairvalue hierarchy consists of three levels to prioritize the inputs used in valuations, as defined below:
Level 1: Observable inputs that reflect unadjusted quoted prices for identical assets or liabilitiesin active markets.
Level 2: Inputs other than quoted prices included within Level 1 that are observable for the assetor liability, either directly or indirectly.
Level 3: Unobservable inputs for the asset or liability.
As of April 28, 2010, the fair values of the Company’s assets and liabilities measured on arecurring basis are categorized as follows:
Level 1 Level 2 Level 3 Total(Thousands of Dollars)
Assets:Derivatives(a) . . . . . . . . . . . . . . . . . . . . . . . . . . . $— $133,773 $— $133,773
Total assets at fair value . . . . . . . . . . . . . . . . . . . $— $133,773 $— $133,773
Liabilities:Derivatives(a) . . . . . . . . . . . . . . . . . . . . . . . . . . . $— $ 36,036 $— $ 36,036
Total liabilities at fair value . . . . . . . . . . . . . . . . $— $ 36,036 $— $ 36,036
66
H. J. Heinz Company and Subsidiaries
Notes to Consolidated Financial Statements — (Continued)

As of April 29, 2009, the fair values of the Company’s assets and liabilities measured on arecurring basis were categorized as follows:
Level 1 Level 2 Level 3 Total(Thousands of Dollars)
Assets:Derivatives(a) . . . . . . . . . . . . . . . . . . . . . . . . . . . $— $219,845 $— $219,845
Total assets at fair value . . . . . . . . . . . . . . . . . . . $— $219,845 $— $219,845
Liabilities:Derivatives(a) . . . . . . . . . . . . . . . . . . . . . . . . . . . $— $ 12,847 $— $ 12,847
Total liabilities at fair value . . . . . . . . . . . . . . . . $— $ 12,847 $— $ 12,847
(a) Foreign currency derivative contracts are valued based on observable market spot and forwardrates, and are classified within Level 2 of the fair value hierarchy. Interest rate swaps are valuedbased on observable market swap rates, and are classified within Level 2 of the fair valuehierarchy. Cross-currency interest rate swaps are valued based on observable market spot andswap rates, and are classified within Level 2 of the fair value hierarchy. The Company’s total rateof return swap was terminated in the second quarter of Fiscal 2010. As of April 29, 2009, the totalrate of return swap was valued based on observable market swap rates and the Company’s creditspread, and was classified within Level 2 of the fair value hierarchy. There have been no transfersbetween Levels 1 and 2 in Fiscals 2010 and 2009.
The Company recognized $12.6 million of non-cash asset write-offs during Fiscal 2010 related totwo factory closures and the exit of a formula business in the U.K. These charges reduced theCompany’s carrying value in the assets to net realizable value. The fair value of the assets wasdetermined based on unobservable inputs.
As of April 28, 2010, the aggregate fair value of the Company’s debt obligations, based on marketquotes, approximated the recorded value, with the exception of the 7.125% notes issued as part of thedealer remarketable securities exchange transaction. The book value of these notes has been reducedas a result of the cash payments made in connection with the exchange. See Note 7. As of April 29,2009, the aggregate fair value of the Company’s debt obligations, based on market quotes, approx-imated the recorded value.
11. Pension and Other Postretirement Benefit Plans
Pension Plans:
The Company maintains retirement plans for the majority of its employees. Current definedbenefit plans are provided primarily for domestic union and foreign employees. Defined contributionplans are provided for the majority of its domestic non-union hourly and salaried employees as well ascertain employees in foreign locations.
Other Postretirement Benefit Plans:
The Company and certain of its subsidiaries provide health care and life insurance benefits forretired employees and their eligible dependents. Certain of the Company’s U.S. and Canadianemployees may become eligible for such benefits. The Company currently does not fund these benefitarrangements until claims occur and may modify plan provisions or terminate plans at its discretion.
67
H. J. Heinz Company and Subsidiaries
Notes to Consolidated Financial Statements — (Continued)

Measurement Date:
On May 1, 2008, the Company adopted the measurement date provisions of the FASB’s account-ing guidance on Compensation-Retirement Benefits which requires plan assets and obligations to bemeasured as of the date of the year-end financial statements. Prior to adoption, the Company used anApril 30 measurement date for its domestic plans, and a March 31 measurement date for its foreignplans. The Company now uses the last day of its fiscal year as the measurement date for all of itsdefined benefit plans and other postretirement benefit plans.
Obligations and Funded Status:
The following table sets forth the changes in benefit obligation, plan assets and funded status ofthe Company’s principal defined benefit plans and other postretirement benefit plans at April 28,2010 and April 29, 2009.
2010 2009 2010 2009Pension Benefits Other Retiree Benefits
(Dollars in thousands)
Change in Benefit Obligation:Benefit obligation at the beginning of the year . . . $2,230,102 $2,843,175 $ 234,175 $ 276,598Service cost . . . . . . . . . . . . . . . . . . . . . . . . . . . . . . 30,486 33,321 5,999 6,501Interest cost . . . . . . . . . . . . . . . . . . . . . . . . . . . . . 149,640 143,601 15,093 15,357Participants’ contributions . . . . . . . . . . . . . . . . . . 2,674 7,961 905 833Amendments. . . . . . . . . . . . . . . . . . . . . . . . . . . . . 5,807 376 (21,115) —Actuarial loss/(gain) . . . . . . . . . . . . . . . . . . . . . . . 238,168 (133,203) 9,672 (37,836)Divestitures . . . . . . . . . . . . . . . . . . . . . . . . . . . . . (413) (19,248) — —Settlement . . . . . . . . . . . . . . . . . . . . . . . . . . . . . . (4,663) (8,710) — —Curtailment . . . . . . . . . . . . . . . . . . . . . . . . . . . . . (3,959) — — —Benefits paid. . . . . . . . . . . . . . . . . . . . . . . . . . . . . (156,807) (149,063) (18,395) (18,596)Effect of eliminating early measurement date . . . . — 14,145 — 455Exchange/other . . . . . . . . . . . . . . . . . . . . . . . . . . . 94,949 (502,253) 8,963 (9,137)
Benefit obligation at the end of the year. . . . . . . $2,585,984 $2,230,102 $ 235,297 $ 234,175
Change in Plan Assets:Fair value of plan assets at the beginning of the
year . . . . . . . . . . . . . . . . . . . . . . . . . . . . . . . . . . $1,874,702 $2,793,123 $ — $ —Actual return/(loss) on plan assets. . . . . . . . . . . . . 561,997 (411,560) — —Divestitures . . . . . . . . . . . . . . . . . . . . . . . . . . . . . (413) (19,248) — —Settlement . . . . . . . . . . . . . . . . . . . . . . . . . . . . . . (4,663) (8,710) — —Employer contribution. . . . . . . . . . . . . . . . . . . . . . 539,939 133,714 17,490 17,763Participants’ contributions . . . . . . . . . . . . . . . . . . 2,674 7,961 905 833Effect of eliminating early measurement date . . . . — 15,856 — —Benefits paid. . . . . . . . . . . . . . . . . . . . . . . . . . . . . (156,807) (149,063) (18,395) (18,596)Exchange . . . . . . . . . . . . . . . . . . . . . . . . . . . . . . . 52,542 (487,371) — —
Fair value of plan assets at the end of theyear . . . . . . . . . . . . . . . . . . . . . . . . . . . . . . . . 2,869,971 1,874,702 — —
Funded status . . . . . . . . . . . . . . . . . . . . . . . . . . . . . $ 283,987 $ (355,400) $(235,297) $(234,175)
68
H. J. Heinz Company and Subsidiaries
Notes to Consolidated Financial Statements — (Continued)

Amounts recognized in the consolidated balance sheets consist of the following:
2010 2009 2010 2009Pension Benefits Other Retiree Benefits
(Dollars in thousands)
Other non-current assets . . . . . . . . . . . $ 424,554 $ 37,324 $ — $ —Other accrued liabilities . . . . . . . . . . . . (12,842) (22,521) (18,874) (19,389)Other non-current liabilities . . . . . . . . (127,725) (370,203) (216,423) (214,786)
Net amount recognized . . . . . . . . . . . $ 283,987 $(355,400) $(235,297) $(234,175)
Certain of the Company’s pension plans have projected benefit obligations in excess of the fairvalue of plan assets. For these plans, the projected benefit obligations and the fair value of plan assetsat April 28, 2010 were $160.9 million and $20.3 million, respectively. For pension plans havingprojected benefit obligations in excess of the fair value of plan assets at April 29, 2009, the projectedbenefit obligations and the fair value of plan assets were $1,862.7 million and $1,469.9 million,respectively.
The accumulated benefit obligation for all defined benefit pension plans was $2,414.3 million atApril 28, 2010 and $2,092.1 million at April 29, 2009.
Certain of the Company’s pension plans have accumulated benefit obligations in excess of thefair value of plan assets. For these plans, the accumulated benefit obligations, projected benefitobligations and the fair value of plan assets at April 28, 2010 were $137.0 million, $160.9 million and$20.3 million, respectively. For pension plans having accumulated benefit obligations in excess of thefair value of plan assets at April 29, 2009, the accumulated benefit obligations, projected benefitobligations and the fair value of plan assets were $1,066.9 million, $1,112.9 million and $784.0 mil-lion, respectively.
69
H. J. Heinz Company and Subsidiaries
Notes to Consolidated Financial Statements — (Continued)

Components of Net Periodic Benefit Cost and Defined Contribution Plan Expense:
Total pension cost of the Company’s principal pension plans and postretirement plans consistedof the following:
2010 2009 2008 2010 2009 2008
Pension Benefits Other Retiree Benefits
(Dollars in thousands)
Components of defined benefit netperiodic benefit cost:Service cost . . . . . . . . . . . . . . . . . . $ 30,486 $ 33,321 $ 39,832 $ 5,999 $ 6,501 $ 6,451Interest cost . . . . . . . . . . . . . . . . . 149,640 143,601 152,073 15,093 15,357 15,626Expected return on assets . . . . . . (211,408) (207,774) (227,373) — — —Amortization of:
Prior service cost/(credit). . . . . . 2,173 3,182 (1,403) (3,796) (3,812) (4,770)Net actuarial loss . . . . . . . . . . . 53,882 33,206 44,121 540 3,681 4,579
Loss due to curtailment,settlement and specialtermination benefits . . . . . . . . . 612 635 — — — —
Net periodic benefit cost . . . . . . . . . 25,385 6,171 7,250 17,836 21,727 21,886Defined contribution plans. . . . . . . . 47,356 36,404 34,027 — — —
Total cost . . . . . . . . . . . . . . . . . . . . . 72,741 42,575 41,277 17,836 21,727 21,886
Less periodic benefit cost associatedwith discontinued operations . . . . 618 1,376 1,717 — — —
Periodic benefit cost associated withcontinuing operations . . . . . . . . . . $ 72,123 $ 41,199 $ 39,560 $17,836 $21,727 $21,886
Accumulated Other Comprehensive Income:
Amounts recognized in accumulated other comprehensive loss, before tax, consist of thefollowing:
2010 2009 2010 2009Pension Benefits Other Retiree Benefits
(Dollars in thousands)
Net actuarial loss . . . . . . . . . . . . . . . . . . $1,085,471 $1,258,535 $ 17,206 $ 8,074Prior service cost/(credit) . . . . . . . . . . . . 30,683 24,859 (21,780) (4,461)
Net amount recognized . . . . . . . . . . . . $1,116,154 $1,283,394 $ (4,574) $ 3,613
The change in other comprehensive loss related to pension benefit gains/(losses) arising duringthe period was $106.6 million and ($484.4 million) at April 28, 2010 and April 29, 2009, respectively.The change in other comprehensive loss related to the reclassification of pension benefit losses to netincome was $60.6 million and $37.0 million at April 28, 2010 and April 29, 2009, respectively.
The change in other comprehensive loss related to postretirement benefit gains arising duringthe period is $11.4 million and $37.9 million at April 28, 2010 and at April 29, 2009, respectively. Thechange in other comprehensive loss related to the reclassification of postretirement benefit gains tonet income is $3.2 million and $0.1 million at April 28, 2010 and at April 29, 2009, respectively.
70
H. J. Heinz Company and Subsidiaries
Notes to Consolidated Financial Statements — (Continued)

Amounts in accumulated other comprehensive loss (income) expected to be recognized ascomponents of net periodic benefit costs/(credits) in the following fiscal year are as follows:
2010 2009 2010 2009Pension Benefits Other Retiree Benefits
(Dollars in thousands)
Net actuarial loss . . . . . . . . . . . . . . . . . . . . . . . . $76,963 $51,183 $ 1,604 $ 540Prior service cost/(credit) . . . . . . . . . . . . . . . . . . 2,373 2,013 (5,155) (3,822)
Net amount recognized . . . . . . . . . . . . . . . . . . $79,336 $53,196 $(3,551) $(3,282)
Assumptions:
The weighted-average rates used for the fiscal years ended April 28, 2010 and April 29, 2009 indetermining the projected benefit obligations for defined benefit pension plans and the accumulatedpostretirement benefit obligation for other postretirement plans were as follows:
2010 2009 2010 2009
PensionBenefits
Other RetireeBenefits
Discount rate . . . . . . . . . . . . . . . . . . . . . . . . . . . . . . . . . . . . . . . 5.6% 6.5% 5.5% 6.4%Compensation increase rate. . . . . . . . . . . . . . . . . . . . . . . . . . . . 4.0% 4.3% — —
The weighted-average rates used for the fiscal years ended April 28, 2010, April 29, 2009 andApril 30, 2008 in determining the defined benefit plans’ net pension costs and net postretirementbenefit costs were as follows:
2010 2009 2008 2010 2009 2008Pension Benefits Other Retiree Benefits
Expected rate of return . . . . . . . . . . . . . . . . . . . . 8.1% 8.2% 8.2% — — —Discount rate . . . . . . . . . . . . . . . . . . . . . . . . . . . . 6.5% 6.1% 5.5% 6.4% 5.9% 5.9%Compensation increase rate . . . . . . . . . . . . . . . . 4.3% 4.5% 5.0% — — —
The Company’s expected rate of return is determined based on a methodology that considersinvestment real returns for certain asset classes over historic periods of various durations, inconjunction with the long-term outlook for inflation (i.e. “building block” approach). This method-ology is applied to the actual asset allocation, which is in line with the investment policy guidelinesfor each plan. The Company also considers long-term rates of return for each asset class based onprojections from consultants and investment advisors regarding the expectations of future invest-ment performance of capital markets.
The weighted-average assumed annual composite rate of increase in the per capita cost ofcompany-provided health care benefits begins at 7.1% for 2011, gradually decreases to 4.8% by 2016and remains at that level thereafter. Assumed health care cost trend rates have a significant effect onthe amounts reported for postretirement medical benefits. A one-percentage-point change inassumed health care cost trend rates would have the following effects:
1% Increase 1% Decrease(Dollars in thousands)
Effect on total service and interest cost components . . . . . . . . . . $ 1,844 $ 1,652Effect on postretirement benefit obligations . . . . . . . . . . . . . . . . . $16,436 $14,962
71
H. J. Heinz Company and Subsidiaries
Notes to Consolidated Financial Statements — (Continued)
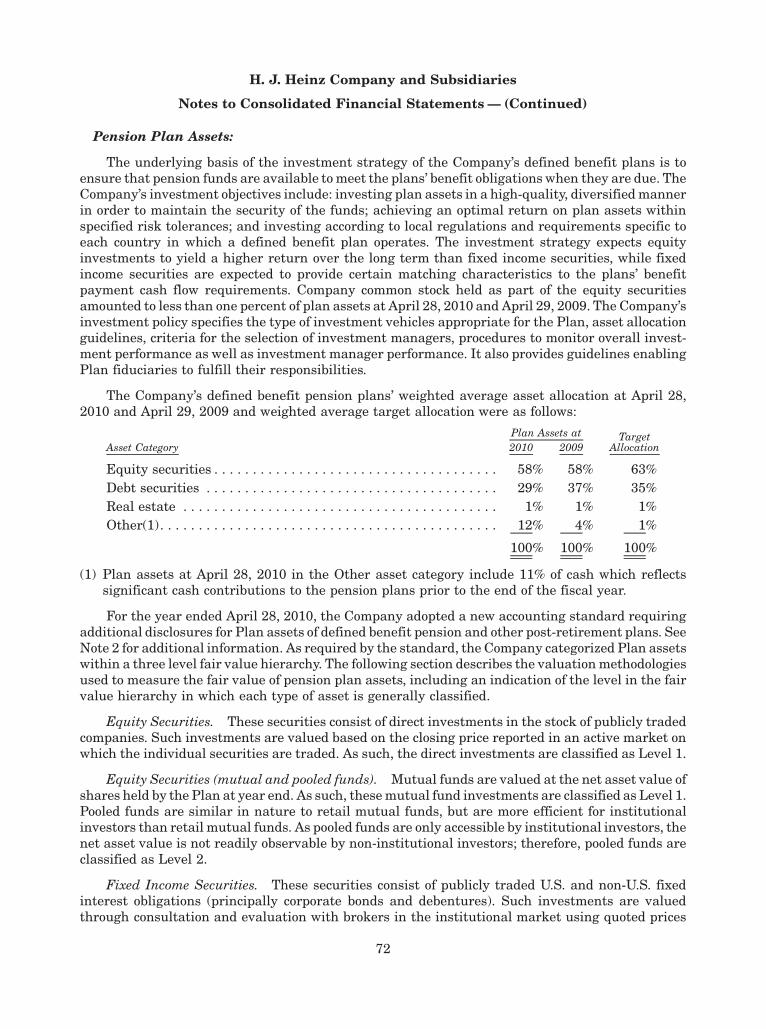
Pension Plan Assets:
The underlying basis of the investment strategy of the Company’s defined benefit plans is toensure that pension funds are available to meet the plans’ benefit obligations when they are due. TheCompany’s investment objectives include: investing plan assets in a high-quality, diversified mannerin order to maintain the security of the funds; achieving an optimal return on plan assets withinspecified risk tolerances; and investing according to local regulations and requirements specific toeach country in which a defined benefit plan operates. The investment strategy expects equityinvestments to yield a higher return over the long term than fixed income securities, while fixedincome securities are expected to provide certain matching characteristics to the plans’ benefitpayment cash flow requirements. Company common stock held as part of the equity securitiesamounted to less than one percent of plan assets at April 28, 2010 and April 29, 2009. The Company’sinvestment policy specifies the type of investment vehicles appropriate for the Plan, asset allocationguidelines, criteria for the selection of investment managers, procedures to monitor overall invest-ment performance as well as investment manager performance. It also provides guidelines enablingPlan fiduciaries to fulfill their responsibilities.
The Company’s defined benefit pension plans’ weighted average asset allocation at April 28,2010 and April 29, 2009 and weighted average target allocation were as follows:
Asset Category 2010 2009Target
AllocationPlan Assets at
Equity securities . . . . . . . . . . . . . . . . . . . . . . . . . . . . . . . . . . . . . 58% 58% 63%Debt securities . . . . . . . . . . . . . . . . . . . . . . . . . . . . . . . . . . . . . . 29% 37% 35%Real estate . . . . . . . . . . . . . . . . . . . . . . . . . . . . . . . . . . . . . . . . . 1% 1% 1%Other(1). . . . . . . . . . . . . . . . . . . . . . . . . . . . . . . . . . . . . . . . . . . . 12% 4% 1%
100% 100% 100%
(1) Plan assets at April 28, 2010 in the Other asset category include 11% of cash which reflectssignificant cash contributions to the pension plans prior to the end of the fiscal year.
For the year ended April 28, 2010, the Company adopted a new accounting standard requiringadditional disclosures for Plan assets of defined benefit pension and other post-retirement plans. SeeNote 2 for additional information. As required by the standard, the Company categorized Plan assetswithin a three level fair value hierarchy. The following section describes the valuation methodologiesused to measure the fair value of pension plan assets, including an indication of the level in the fairvalue hierarchy in which each type of asset is generally classified.
Equity Securities. These securities consist of direct investments in the stock of publicly tradedcompanies. Such investments are valued based on the closing price reported in an active market onwhich the individual securities are traded. As such, the direct investments are classified as Level 1.
Equity Securities (mutual and pooled funds). Mutual funds are valued at the net asset value ofshares held by the Plan at year end. As such, these mutual fund investments are classified as Level 1.Pooled funds are similar in nature to retail mutual funds, but are more efficient for institutionalinvestors than retail mutual funds. As pooled funds are only accessible by institutional investors, thenet asset value is not readily observable by non-institutional investors; therefore, pooled funds areclassified as Level 2.
Fixed Income Securities. These securities consist of publicly traded U.S. and non-U.S. fixedinterest obligations (principally corporate bonds and debentures). Such investments are valuedthrough consultation and evaluation with brokers in the institutional market using quoted prices
72
H. J. Heinz Company and Subsidiaries
Notes to Consolidated Financial Statements — (Continued)

and other observable market data. As such, a portion of these securities are included in Levels 1, 2and 3.
Other Investments. Primarily consist of real estate, private equity holdings and interest rateswaps. Direct investments of real estate and private equity are valued by investment managers basedon the most recent financial information available, which typically represents significant observabledata. As such, these investments are generally classified as Level 3. The fair value of interest rateswaps is determined through use of observable market swap rates and are classified as Level 2.
Cash and Cash Equivalents. This consists of direct cash holdings and institutional short-terminvestment vehicles. Direct cash holdings are valued based on cost, which approximates fair valueand are classified as Level 1. Institutional short-term investment vehicles are valued daily and areclassified as Level 2.
Asset Category Level 1 Level 2 Level 3 Total(Dollars in thousands)
Equity Securities . . . . . . . . . . . . . . . . $ 894,684 $ — $ — $ 894,684Equity Securities (mutual and pooled
funds) . . . . . . . . . . . . . . . . . . . . . . . 122,753 641,727 — 764,480Fixed Income Securities . . . . . . . . . . . 49,951 785,924 8,646 844,521Other Investments . . . . . . . . . . . . . . . — 7,491 35,569 43,060Cash and Cash Equivalents . . . . . . . . 14,260 308,966 — 323,226
Total . . . . . . . . . . . . . . . . . . . . . . . . . . $1,081,648 $1,744,108 $44,215 $2,869,971
Level 3 Gains and Losses:
Changes in the fair value of the Plan’s Level 3 assets are summarized as follows:
Fair ValueApril 29,
2009 Acquisitions DispositionsRealized
Gain/(Loss)UnrealizedGain/(Loss)
FairValue
April 28,2010
(Dollars in thousands)
Fixed Income Securities . . . . . $ 8,873 $ — $(1,500) $ 246 $1,027 $ 8,646Other Investments . . . . . . . . . 38,306 3,362 (2,658) (2,627) (814) 35,569
Total . . . . . . . . . . . . . . . . . . . . $47,179 $3,362 $(4,158) $(2,381) $ 213 $44,215
Cash Flows:
The Company contributed $540 million to the defined benefit plans in Fiscal 2010, of which$475 million was discretionary. The Company funds its U.S. defined benefit plans in accordance withIRS regulations, while foreign defined benefit plans are funded in accordance with local laws andregulations in each respective country. Discretionary contributions to the pension funds may also bemade by the Company from time to time. Defined benefit plan contributions for the next fiscal yearare expected to be less than $50 million; however, actual contributions may be affected by pensionasset and liability valuations during the year.
The Company paid $17.5 million for benefits in the postretirement medical plans in Fiscal 2010.The Company makes payments on claims as they occur during the fiscal year. Payments for the nextfiscal year are expected to be approximately $19 million. The medical subsidy received in Fiscal 2010was $1.2 million. Estimated future medical subsidy receipts are approximately $1.0 million for 2011,$0.4 million for 2012, $0.5 million annually from 2013 through 2015 and $3.2 million for the period
73
H. J. Heinz Company and Subsidiaries
Notes to Consolidated Financial Statements — (Continued)

from 2016 through 2020. The Patient Protection and Affordable Care Act (PPACA) was signed intolaw on March 23, 2010, and on March 30, 2010, the Health Care and Education Reconciliation Act of2010 (HCERA) was signed into law, which amends certain aspects of the PPACA. Among otherthings, the PPACA reduces the tax benefits available to an employer that receives the MedicarePart D subsidy. As a result of the PPACA, the Company was required to recognize in Fiscal 2010 taxexpense of $3.9 million (approximately $0.01 per share) related to the reduced deductibility in futureperiods of the postretirement prescription drug coverage. The PPACA and HCERA (collectivelyreferred to as the Act) will have both immediate and long-term ramifications for many employers thatprovide retiree health benefits.
Benefit payments expected in future years are as follows:
PensionBenefits
OtherRetireeBenefits
(Dollars in thousands)
2011 . . . . . . . . . . . . . . . . . . . . . . . . . . . . . . . . . . . . . . . . . . . . . . . . . $169,321 $ 18,8742012 . . . . . . . . . . . . . . . . . . . . . . . . . . . . . . . . . . . . . . . . . . . . . . . . . $188,125 $ 19,6532013 . . . . . . . . . . . . . . . . . . . . . . . . . . . . . . . . . . . . . . . . . . . . . . . . . $176,865 $ 19,8522014 . . . . . . . . . . . . . . . . . . . . . . . . . . . . . . . . . . . . . . . . . . . . . . . . . $180,775 $ 20,2472015 . . . . . . . . . . . . . . . . . . . . . . . . . . . . . . . . . . . . . . . . . . . . . . . . . $177,358 $ 20,449Years 2016-2020 . . . . . . . . . . . . . . . . . . . . . . . . . . . . . . . . . . . . . . . . $940,332 $105,712
12. Derivative Financial Instruments and Hedging Activities
The Company operates internationally, with manufacturing and sales facilities in variouslocations around the world, and utilizes certain derivative financial instruments to manage itsforeign currency, debt and interest rate exposures. At April 28, 2010, the Company had outstandingcurrency exchange, interest rate, and cross-currency interest rate derivative contracts with notionalamounts of $1.64 billion, $1.52 billion and $160 million, respectively. At April 29, 2009, the Companyhad outstanding currency exchange, interest rate, and total rate of return derivative contracts withnotional amounts of $1.25 billion, $1.52 billion and $175 million, respectively. The fair value ofderivative financial instruments was a net asset of $97.7 million and $207.0 million at April 28, 2010and April 29, 2009, respectively.
74
H. J. Heinz Company and Subsidiaries
Notes to Consolidated Financial Statements — (Continued)
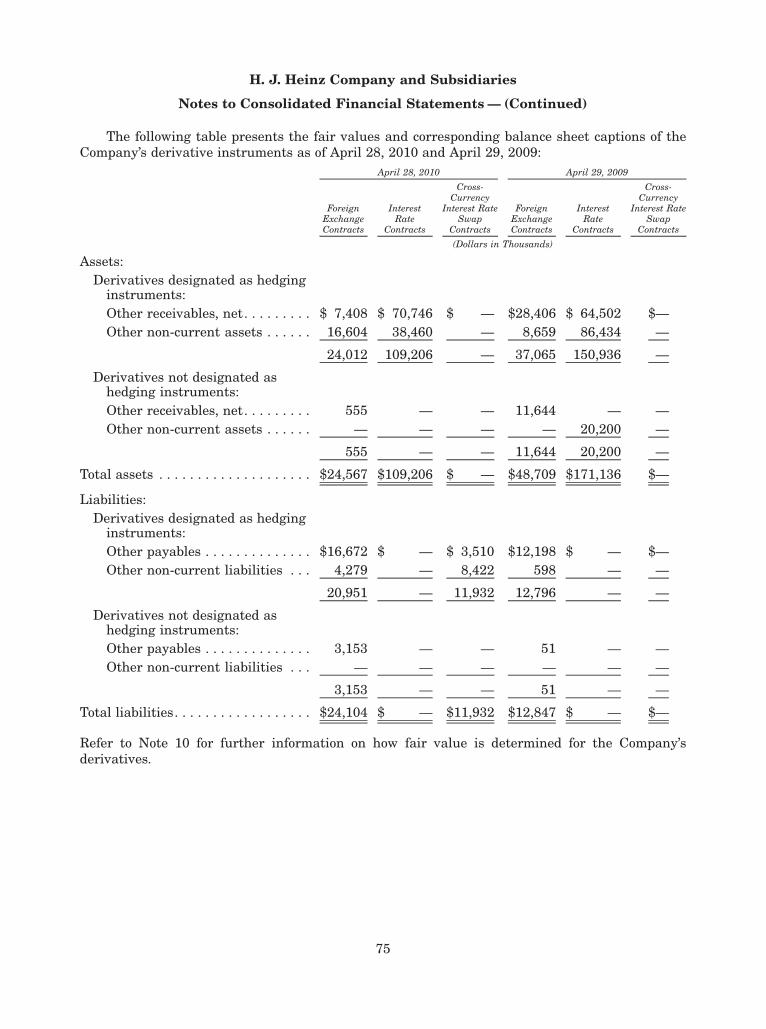
The following table presents the fair values and corresponding balance sheet captions of theCompany’s derivative instruments as of April 28, 2010 and April 29, 2009:
ForeignExchangeContracts
InterestRate
Contracts
Cross-Currency
Interest RateSwap
Contracts
ForeignExchangeContracts
InterestRate
Contracts
Cross-Currency
Interest RateSwap
Contracts
April 28, 2010 April 29, 2009
(Dollars in Thousands)
Assets:Derivatives designated as hedging
instruments:Other receivables, net. . . . . . . . . $ 7,408 $ 70,746 $ — $28,406 $ 64,502 $—Other non-current assets . . . . . . 16,604 38,460 — 8,659 86,434 —
24,012 109,206 — 37,065 150,936 —
Derivatives not designated ashedging instruments:Other receivables, net. . . . . . . . . 555 — — 11,644 — —Other non-current assets . . . . . . — — — — 20,200 —
555 — — 11,644 20,200 —
Total assets . . . . . . . . . . . . . . . . . . . . $24,567 $109,206 $ — $48,709 $171,136 $—
Liabilities:Derivatives designated as hedging
instruments:Other payables . . . . . . . . . . . . . . $16,672 $ — $ 3,510 $12,198 $ — $—Other non-current liabilities . . . 4,279 — 8,422 598 — —
20,951 — 11,932 12,796 — —
Derivatives not designated ashedging instruments:Other payables . . . . . . . . . . . . . . 3,153 — — 51 — —Other non-current liabilities . . . — — — — — —
3,153 — — 51 — —
Total liabilities. . . . . . . . . . . . . . . . . . $24,104 $ — $11,932 $12,847 $ — $—
Refer to Note 10 for further information on how fair value is determined for the Company’sderivatives.
75
H. J. Heinz Company and Subsidiaries
Notes to Consolidated Financial Statements — (Continued)

The following table presents the pre-tax effect of derivative instruments on the statement ofincome for the fiscal year ended April 28, 2010:
Foreign ExchangeContracts
Interest RateContracts
Cross-CurrencyInterest Rate
Swap Contracts
April 28, 2010Fiscal Year Ended
(Dollars in Thousands)
Cash flow hedges:Net losses recognized in other comprehensive loss
(effective portion) . . . . . . . . . . . . . . . . . . . . . . . . $(38,422) $ — $(13,692)
Net gains/(losses) reclassified from othercomprehensive loss into earnings (effectiveportion):Sales . . . . . . . . . . . . . . . . . . . . . . . . . . . . . . . . . . $ 1,141 $ — $ —Cost of products sold . . . . . . . . . . . . . . . . . . . . . . (5,104) — —Selling, general and administrative expenses . . 108 — —Other expense, net . . . . . . . . . . . . . . . . . . . . . . . (11,574) — (7,819)Interest expense . . . . . . . . . . . . . . . . . . . . . . . . . 20 — (1,867)
(15,409) — (9,686)
Fair value hedges:Net losses recognized in other expense, net. . . . . . — (41,730) —
Derivatives not designated as hedging instruments:Net losses recognized in other expense, net. . . . . . (59) — —Net gains recognized in interest income . . . . . . . . — 30,469 —
(59) 30,469 —
Total amount recognized in statement of income . . . $(15,468) $(11,261) $ (9,686)
76
H. J. Heinz Company and Subsidiaries
Notes to Consolidated Financial Statements — (Continued)

The following table presents the pre-tax effect of derivative instruments on the statement ofincome for the fiscal year ended April 29, 2009:
Foreign ExchangeContracts
Interest RateContracts
Cross-CurrencyInterest Rate
Swap Contracts
April 29, 2009Fiscal Year Ended
(Dollars in Thousands)
Cash flow hedges:Net gains recognized in other comprehensive loss
(effective portion) . . . . . . . . . . . . . . . . . . . . . . . . $ 42,617 $ — $—
Net gains/(losses) reclassified from othercomprehensive loss into earnings (effectiveportion):Sales . . . . . . . . . . . . . . . . . . . . . . . . . . . . . . . . . . $ (6,809) $ — $—Cost of products sold . . . . . . . . . . . . . . . . . . . . . . 45,836 — —Selling, general and administrative expenses . . 1,896 — —Other expense, net . . . . . . . . . . . . . . . . . . . . . . . (15,777) — —Interest expense . . . . . . . . . . . . . . . . . . . . . . . . . 1,112 — —
26,258 — —
Fair value hedges:Net gains recognized in other income, net . . . . . . . — 57,976 —
Derivatives not designated as hedging instruments:Net gains/(losses) recognized in other
income/(expense), net . . . . . . . . . . . . . . . . . . . . . 65,135 (110) —Net gains recognized in interest income . . . . . . . . — 20,200 —
65,135 20,090 —
Total amount recognized in statement of income . . . $ 91,393 $78,066 $—
Foreign Currency Hedging:
The Company uses forward contracts and to a lesser extent, option contracts to mitigate itsforeign currency exchange rate exposure due to forecasted purchases of raw materials and sales offinished goods, and future settlement of foreign currency denominated assets and liabilities. TheCompany’s principal foreign currency exposures include the Australian dollar, British pound ster-ling, Canadian dollar, euro, and the New Zealand dollar. Derivatives used to hedge forecastedtransactions and specific cash flows associated with foreign currency denominated financial assetsand liabilities that meet the criteria for hedge accounting are designated as cash flow hedges.Consequently, the effective portion of gains and losses is deferred as a component of accumulatedother comprehensive loss and is recognized in earnings at the time the hedged item affects earnings,in the same line item as the underlying hedged item.
The Company has used certain foreign currency debt instruments as net investment hedges offoreign operations. Losses of $32.3 million (net of income taxes of $20.4 million) and $6.9 million (netof income taxes of $4.4 million), which represented effective hedges of net investments, were reported
77
H. J. Heinz Company and Subsidiaries
Notes to Consolidated Financial Statements — (Continued)

as a component of accumulated other comprehensive loss within unrealized translation adjustmentfor the fiscal years ended April 28, 2010 and April 29, 2009, respectively.
Prior to Fiscal 2008, the Company had outstanding cross currency swaps which were designatedas net investment hedges of foreign operations. During Fiscal 2008, the Company made cashpayments to the counterparties totaling $74.5 million as a result of contract maturities and$93.2 million as a result of early termination of contracts. The Company assessed hedge effectivenessfor these contracts based on changes in fair value attributable to changes in spot prices. A net loss of$95.8 million ($72.0 million after-tax) which represented effective hedges of net investments, wasreported as a component of accumulated other comprehensive loss within unrealized translationadjustment for Fiscal 2008. A gain of $3.6 million, which represented the changes in fair valueexcluded from the assessment of hedge effectiveness, was included in current period earnings as acomponent of interest expense for Fiscal 2008. The early termination of the net investment hedgesdescribed above and the interest rate swaps described below were completed in conjunction with thereorganizations of the Company’s foreign operations and interest swap portfolio.
Interest Rate Hedging:
The Company uses interest rate swaps to manage debt and interest rate exposures. TheCompany is exposed to interest rate volatility with regard to existing and future issuances of fixedand floating rate debt. Primary exposures include U.S. Treasury rates, LIBOR, and commercial paperrates in the United States. Derivatives used to hedge risk associated with changes in the fair value ofcertain fixed-rate debt obligations are primarily designated as fair value hedges. Consequently,changes in the fair value of these derivatives, along with changes in the fair value of the hedged debtobligations that are attributable to the hedged risk, are recognized in current period earnings.During Fiscal 2008, the Company terminated certain interest rate swaps that were previouslydesignated as fair value hedges of fixed debt obligations. The notional amount of these interest ratecontracts totaled $612.0 million and the Company received a total of $103.5 million of cash from thetermination of these contracts. The $103.5 million gain is being amortized to reduce interest expenseover the remaining term of the corresponding debt obligations (average of 20 years remaining).
The Company had outstanding cross-currency interest rate swaps with a total notional amountof $159.5 million as of April 28, 2010, which were designated as cash flow hedges of the futurepayments of loan principal and interest associated with certain foreign denominated variable ratedebt obligations. These contracts are scheduled to mature in Fiscal 2013.
Hedge accounting adjustments related to debt obligations totaled $207.1 million and $251.5 mil-lion as of April 28, 2010 and April 29, 2009, respectively. See Note 7 for further information.
Deferred Hedging Gains and Losses:
As of April 28, 2010, the Company is hedging forecasted transactions for periods not exceeding4 years. During the next 12 months, the Company expects $6.0 million of net deferred losses reportedin accumulated other comprehensive loss to be reclassified to earnings, assuming market ratesremain constant through contract maturities. Hedge ineffectiveness related to cash flow hedges,which is reported in current period earnings as other income/(expense), net, was not significant forthe years ended April 28, 2010, April 29, 2009 and April 30, 2008. The Company excludes the timevalue component of option contracts from the assessment of hedge effectiveness. Amounts reclas-sified to earnings because the hedged transaction was no longer expected to occur were not signif-icant for the years ended April 28, 2010, April 29, 2009 and April 30, 2008.
78
H. J. Heinz Company and Subsidiaries
Notes to Consolidated Financial Statements — (Continued)

Other Activities:
The Company enters into certain derivative contracts in accordance with its risk managementstrategy that do not meet the criteria for hedge accounting but which have the economic impact oflargely mitigating foreign currency or interest rate exposures. The Company maintained foreigncurrency forward contracts with a total notional amount of $284.5 million and $349.1 million that didnot meet the criteria for hedge accounting as of April 28, 2010 and April 29, 2009, respectively. Theseforward contracts are accounted for on a full mark-to-market basis through current earnings, withgains and losses recorded as a component of other income/(expense), net. Net unrealized (losses)/gains related to outstanding contracts totaled $(2.6) million and $11.6 million as of April 28, 2010 andApril 29, 2009, respectively. These contracts are scheduled to mature within one year.
Forward contracts that were put in place to help mitigate the unfavorable impact of translationassociated with key foreign currencies resulted in (losses)/gains of $(2.5) million and $107.3 millionfor the years ended April 28, 2010 and April 29, 2009, respectively. During Fiscal 2010 and 2009, theCompany also (paid)/received $(1.7) million and $106.3 million of cash related to these forwardcontracts, respectively.
During Fiscal 2010, the Company terminated its $175 million notional total rate of return swapthat was being used as an economic hedge to reduce a portion of the interest cost related to theCompany’s remarketable securities. The unwinding of the total rate of return swap was completed inconjunction with the exchange of $681 million of dealer remarketable securities discussed in Note 7.Upon termination of the swap, the Company received net cash proceeds of $47.6 million, in additionto the release of the $192.7 million of restricted cash collateral that the Company was required tomaintain with the counterparty for the term of the swap. Prior to termination, the swap was beingaccounted for on a full mark-to-market basis through earnings, as a component of interest income.The Company recorded a benefit in interest income of $28.3 million for the year ended April 28, 2010,and $28.1 million for the year ended April 29, 2009, representing changes in the fair value of the swapand interest earned on the arrangement, net of transaction fees. Net unrealized gains related to thisswap totaled $20.2 million as of April 29, 2009.
Concentration of Credit Risk:
Counterparties to currency exchange and interest rate derivatives consist of major internationalfinancial institutions. The Company continually monitors its positions and the credit ratings of thecounterparties involved and, by policy, limits the amount of credit exposure to any one party. Whilethe Company may be exposed to potential losses due to the credit risk of non-performance by thesecounterparties, losses are not anticipated. During Fiscal 2010, one customer represented approx-imately 11% of the Company’s sales. The Company closely monitors the credit risk associated with itscounterparties and customers and to date has not experienced material losses.
79
H. J. Heinz Company and Subsidiaries
Notes to Consolidated Financial Statements — (Continued)

13. Income Per Common Share
The following are reconciliations of income from continuing operations to income from continu-ing operations applicable to common stock and the number of common shares outstanding used tocalculate basic EPS to those shares used to calculate diluted EPS:
April 28,2010
(52 Weeks)
April 29,2009
(52 Weeks)
April 30,2008
(52 Weeks)
Fiscal Year Ended
(Amounts in thousands)
Income from continuing operations attributable toH.J. Heinz Company . . . . . . . . . . . . . . . . . . . . . . . . . $914,489 $929,511 $846,623
Allocation to participating securities (See Note 2) . . . . 2,153 4,121 5,165Preferred dividends . . . . . . . . . . . . . . . . . . . . . . . . . . . 9 12 12
Income from continuing operations applicable tocommon stock . . . . . . . . . . . . . . . . . . . . . . . . . . . . . . $912,327 $925,378 $841,446
Average common shares outstanding-basic . . . . . . . . . 315,948 313,747 317,019Effect of dilutive securities:
Convertible preferred stock. . . . . . . . . . . . . . . . . . . . 105 106 109Stock options, restricted stock and the global stock
purchase plan . . . . . . . . . . . . . . . . . . . . . . . . . . . . 2,060 4,210 4,589
Average common shares outstanding-diluted. . . . . . . . 318,113 318,063 321,717
Diluted earnings per share is based upon the average shares of common stock and dilutivecommon stock equivalents outstanding during the periods presented. Common stock equivalentsarising from dilutive stock options, restricted common stock units, and the global stock purchase planare computed using the treasury stock method.
Options to purchase an aggregate of 4.4 million, 3.7 million and 6.1 million shares of commonstock as of April 28, 2010, April 29, 2009 and April 30, 2008, respectively, were not included in thecomputation of diluted earnings per share because inclusion of these options would be anti-dilutive.These options expire at various points in time through 2017.
80
H. J. Heinz Company and Subsidiaries
Notes to Consolidated Financial Statements — (Continued)

14. Other Comprehensive Income
The tax (expense)/benefit associated with each component of other comprehensive income are asfollows:
H. J. HeinzCompany
NoncontrollingInterest Total
(Amounts in thousands)
April 28, 2010Net pension and post-retirement benefit losses. . $ (39,186) $351 $ (38,835)Reclassification of net pension and post-
retirement benefit losses to net income . . . . . . $ 18,468 $ — $ 18,468Unrealized translation adjustments . . . . . . . . . . $ 20,491 $ — $ 20,491Net change in fair value of cash flow hedges . . . $ 13,713 $260 $ 13,973Net hedging gains/losses reclassified into
earnings . . . . . . . . . . . . . . . . . . . . . . . . . . . . . . $ 7,885 $ 83 $ 7,968April 29, 2009
Net pension and post-retirement benefit losses. . $138,862 $139 $139,001Reclassification of net pension and post-
retirement benefit losses to net income . . . . . . $ 12,273 $ — $ 12,273Unrealized translation adjustments . . . . . . . . . . $ 14,004 $ — $ 14,004Net change in fair value of cash flow hedges . . . $ (9,413) $ (51) $ (9,464)Net hedging gains/losses reclassified into
earnings . . . . . . . . . . . . . . . . . . . . . . . . . . . . . . $ (5,486) $ (22) $ (5,508)April 30, 2008
Net pension and post-retirement benefit losses. . $ 75,407 $ — $ 75,407Reclassification of net pension and post-
retirement benefit losses to net income . . . . . . $ 14,159 $ — $ 14,159Unrealized translation adjustments . . . . . . . . . . $ (25,823) $ — $ (25,823)Net change in fair value of cash flow hedges . . . $ (7,527) $ — $ (7,527)Net hedging gains/losses reclassified into
earnings. . . . . . . . . . . . . . . . . . . . . . . . . . . . . . . $ (7,287) $ — $ (7,287)
15. Segment Information
The Company’s segments are primarily organized by geographical area. The composition ofsegments and measure of segment profitability are consistent with that used by the Company’smanagement.
Descriptions of the Company’s reportable segments are as follows:
• North American Consumer Products—This segment primarily manufactures, marketsand sells ketchup, condiments, sauces, pasta meals, and frozen potatoes, entrees, snacks, andappetizers to the grocery channels in the United States of America and includes our Canadianbusiness.
• Europe—This segment includes the Company’s operations in Europe, including EasternEurope and Russia, and sells products in all of the Company’s categories.
81
H. J. Heinz Company and Subsidiaries
Notes to Consolidated Financial Statements — (Continued)

• Asia/Pacific—This segment includes the Company’s operations in Australia, New Zealand,India, Japan, China, South Korea, Indonesia, and Singapore. This segment’s operationsinclude products in all of the Company’s categories.
• U.S. Foodservice—This segment primarily manufactures, markets and sells branded andcustomized products to commercial and non-commercial food outlets and distributors in theUnited States of America including ketchup, condiments, sauces, frozen soups and desserts.
• Rest of World—This segment includes the Company’s operations in Africa, Latin America,and the Middle East that sell products in all of the Company’s categories.
The Company’s management evaluates performance based on several factors including netsales, operating income and the use of capital resources. Inter-segment revenues, items below theoperating income line of the consolidated statements of income, and certain costs associated with thecorporation-wide productivity initiatives are not presented by segment, since they are not reflected inthe measure of segment profitability reviewed by the Company’s management.
82
H. J. Heinz Company and Subsidiaries
Notes to Consolidated Financial Statements — (Continued)

The following table presents information about the Company’s reportable segments:
April 28,2010
(52 Weeks)
April 29,2009
(52 Weeks)
April 30,2008
(52 Weeks)
April 28,2010
(52 Weeks)
April 29,2009
(52 Weeks)
April 30,2008
(52 Weeks)
Fiscal Year Ended
(Dollars in thousands)Net External Sales Operating Income (Loss)
North AmericanConsumer Products . . $ 3,192,219 $ 3,135,994 $ 3,011,513 $ 771,497 $ 724,763 $ 678,388
Europe . . . . . . . . . . . . . 3,332,619 3,329,043 3,418,249 554,300 571,111 646,340Asia/Pacific . . . . . . . . . . 2,007,252 1,627,443 1,599,860 195,261 182,472 194,900U.S. Foodservice . . . . . . 1,429,511 1,450,894 1,488,225 150,628 129,358 163,032Rest of World . . . . . . . . 533,382 467,957 367,709 69,219 52,348 45,437Non-Operating(a) . . . . . — — — (158,989) (157,606) (157,762)Upfront productivity
charges(d) . . . . . . . . . — — — (37,665) — —Gain on property
disposal in theNetherlands(e) . . . . . — — — 14,977 — —
Consolidated Totals . . . $10,494,983 $10,011,331 $ 9,885,556 $1,559,228 $1,502,446 $1,570,335
Depreciation and Amortization Expenses Capital Expenditures(b)
Total North America . . $ 122,774 $ 122,241 $ 118,893 $ 88,841 $ 87,912 $ 121,937Europe . . . . . . . . . . . . . 105,684 101,899 111,455 74,095 91,898 119,425Asia/Pacific . . . . . . . . . . 46,976 35,969 35,410 46,105 39,263 36,404Rest of World . . . . . . . . 6,638 5,728 5,690 11,785 15,574 10,064Non-Operating(a) . . . . . 16,978 8,270 10,019 56,816 57,474 13,758
Consolidated Totals . . . $ 299,050 $ 274,107 $ 281,467 $ 277,642 $ 292,121 $ 301,588
Identifiable Assets
Total North America . . $ 3,532,477 $ 3,605,670 $ 3,719,819Europe . . . . . . . . . . . . . 3,815,179 3,602,753 4,731,760Asia/Pacific . . . . . . . . . . 1,869,591 1,505,895 1,433,467Rest of World . . . . . . . . 276,902 292,266 235,625Non-Operating(c) . . . . . 581,562 657,600 444,372
Consolidated Totals . . . $10,075,711 $ 9,664,184 $10,565,043
(a) Includes corporate overhead, intercompany eliminations and charges not directly attributable tooperating segments.
(b) Excludes property, plant and equipment obtained through acquisitions.
(c) Includes identifiable assets not directly attributable to operating segments.
(d) Includes costs associated with targeted workforce reductions and asset write-offs, that were partof a corporation-wide initiative to improve productivity. The asset write-offs related to two factoryclosures and the exit of a formula business in the U.K. The amount included in other accruedliabilities related to these initiatives totaled $5.8 million at April 28, 2010.
(e) Includes payments received from the government in the Netherlands net of estimated costs toexit the facility. See Note 3 for additional explanation.
83
H. J. Heinz Company and Subsidiaries
Notes to Consolidated Financial Statements — (Continued)

The Company’s revenues are generated via the sale of products in the following categories:
April 28,2010
(52 Weeks)
April 29,2009
(52 Weeks)
April 30,2008
(52 Weeks)
Fiscal Year Ended
(Dollars in thousands)
Ketchup and Sauces. . . . . . . . . . . . . . . . . . . . . . . . . . . . $ 4,446,911 $ 4,251,583 $4,081,864Meals and Snacks . . . . . . . . . . . . . . . . . . . . . . . . . . . . . 4,289,977 4,225,127 4,336,475Infant/Nutrition . . . . . . . . . . . . . . . . . . . . . . . . . . . . . . . 1,157,982 1,105,313 1,089,544Other . . . . . . . . . . . . . . . . . . . . . . . . . . . . . . . . . . . . . . . 600,113 429,308 377,673
Total . . . . . . . . . . . . . . . . . . . . . . . . . . . . . . . . . . . . . . . . $10,494,983 $10,011,331 $9,885,556
The Company has significant sales and long-lived assets in the following geographic areas. Salesare based on the location in which the sale originated. Long-lived assets include property, plant andequipment, goodwill, trademarks and other intangibles, net of related depreciation and amortization.
April 28,2010
(52 Weeks)
April 29,2009
(52 Weeks)
April 30,2008
(52 Weeks)April 28,
2010April 29,
2009April 30,
2008
Net External Sales Long-Lived Assets
Fiscal Year Ended
(Dollars in thousands)
United States . . . . . . $ 3,993,692 $ 4,018,973 $3,900,151 $2,403,078 $2,402,798 $2,393,732United Kingdom . . . . 1,519,278 1,534,392 1,729,937 1,151,660 1,166,085 1,582,088Other . . . . . . . . . . . . . 4,982,013 4,457,966 4,255,468 2,605,690 2,392,373 2,540,414Total . . . . . . . . . . . . . $10,494,983 $10,011,331 $9,885,556 $6,160,428 $5,961,256 $6,516,234
84
H. J. Heinz Company and Subsidiaries
Notes to Consolidated Financial Statements — (Continued)

16. Quarterly Results
First(13 Weeks)
Second(13 Weeks)
Third(13 Weeks)
Fourth(13 Weeks)
Total(52 Weeks)
2010
(Unaudited)(Dollars in thousands, except per share amounts)
Sales(1) . . . . . . . . . . . . . . . . . . . . $2,441,686 $2,646,785 $2,681,702 $2,724,810 $10,494,983Gross profit(1) . . . . . . . . . . . . . . 872,303 953,255 1,005,266 963,482 3,794,306Income from continuing
operations attributable to H.J.Heinz Company commonshareholders, net of tax(1) . . . 214,724 243,076 264,115 192,574 914,489
Net income attributable to H.J.Heinz Company . . . . . . . . . . . 212,564 231,435 228,527 192,366 864,892
Per Share Amounts:Net income from continuing
operations—diluted(1) . . . . . . $ 0.68 $ 0.76 $ 0.83 $ 0.60 $ 2.87Net income from continuing
operations—basic(1) . . . . . . . . 0.68 0.77 0.83 0.61 2.89Cash dividends . . . . . . . . . . . . . . 0.42 0.42 0.42 0.42 1.68Cash provided by operating
activities . . . . . . . . . . . . . . . . . $ 168,868 $ 340,008 $ 493,246 $ 260,075 $ 1,262,197Cash (used for)/provided by
investing activities . . . . . . . . . (46,501) 149,547 (57,668)(3) (31,935) 13,443Cash provided by/(used for)
financing activities . . . . . . . . . 32,912 (634,205) (264,260)(3) (282,363) (1,147,916)
First(13 Weeks)
Second(13 Weeks)
Third(13 Weeks)
Fourth(13 Weeks)
Total(52 Weeks)
2009
(Unaudited)(Dollars in thousands, except per share amounts)
Sales(1) . . . . . . . . . . . . . . . . . . . . . $2,542,909 $2,572,943 $2,379,711 $2,515,768 $10,011,331Gross profit(1) . . . . . . . . . . . . . . . . 929,138 913,684 850,714 875,720 3,569,256Income from continuing
operations attributable to H.J.Heinz Company commonshareholders, net of tax(1) . . . . . 230,140 276,918 243,550 178,903 929,511
Net income attributable to H.J.Heinz Company . . . . . . . . . . . . . 228,964 276,710 242,263 175,135 923,072
Per Share Amounts:Net income from continuing
operations—diluted(1)(2) . . . . . . $ 0.72 $ 0.87 $ 0.76 $ 0.56 $ 2.91Net income from continuing
operations—basic(1)(2). . . . . . . . 0.73 0.88 0.77 0.57 2.95Cash dividends . . . . . . . . . . . . . . . 0.415 0.415 0.415 0.415 1.66Cash (used for)/provided by
operating activities . . . . . . . . . . $ (13,935) $ 227,502 $ 292,350 $ 660,965 $ 1,166,882Cash used for investing
activities . . . . . . . . . . . . . . . . . . (35,437) (196,952) (418,508) (110,297) (761,194)Cash (used for)/provided by
financing activities. . . . . . . . . . . (13,357) 462,718 (87,874) (877,823) (516,336)
85
H. J. Heinz Company and Subsidiaries
Notes to Consolidated Financial Statements — (Continued)

(1) Amounts have been restated for the disposals of the private label frozen desserts business in theU.K. as well as the Kabobs and Appetizers And, Inc. businesses in the U.S., which were allreported in discontinued operations in Fiscal 2010.
(2) Amounts have been restated to reflect the adoption in Fiscal 2010 of new accounting guidance fordetermining whether instruments granted in share-based payment awards that contain non-forfeitable rights to dividends or dividend equivalents (either paid or unpaid) are participatingsecurities and shall be included in the computation of earnings per share pursuant to the two-class method. As a result, of adopting this guidance, both basic and diluted earnings per sharefrom continuing operations was reduced by $0.01 in Fiscals 2010 and 2009, with less than a $0.01impact on each quarterly period in these two fiscal years.
(3) Cash (used for)/provided by investing activities and cash provided by/(used for) financingactivities were revised for the third quarter of Fiscal 2010 to adjust the classification of paymentsto acquire the remaining 49% interest in Cairo Food Industries, S.A.E. The revised amountsreflect the payments as cash used for financing activities.
Continuing operations for the first quarter of Fiscal 2010 includes charges of $15.7 million pre-tax ($11.6 million after-tax) associated with targeted workforce reductions and asset write-offsrelated to a factory closure. Continuing operations for the fourth quarter of Fiscal 2010 includescharges of $21.9 million pre-tax ($16.2 million after-tax) associated with targeted workforce reduc-tions and asset write-offs related to two factory closures and the exit of a formula business in the U.K.These Fiscal 2010 charges were part of a corporation-wide initiative to improve productivity. Inaddition, continuing operations for the fourth quarter of Fiscal 2010 includes a gain of $15.0 millionpre-tax ($11.1 million after-tax) on a property disposal in the Netherlands.
17. Commitments and Contingencies
Legal Matters:
Certain suits and claims have been filed against the Company and have not been finally adju-dicated. In the opinion of management, based upon the information that it presently possesses, thefinal conclusion and determination of these suits and claims would not be expected to have a materialadverse effect on the Company’s consolidated financial position, results of operations or liquidity.
Lease Commitments:
Operating lease rentals for warehouse, production and office facilities and equipment amountedto approximately $119.1 million in 2010, $113.4 million in 2009 and $106.4 million in 2008. Futurelease payments for non-cancellable operating leases as of April 28, 2010 totaled $452.5 million (2011-$78.7 million, 2012-$70.6 million, 2013-$61.2 million, 2014-$50.8 million, 2015-$39.3 million andthereafter-$151.9 million).
As of April 28, 2010, the Company was a party to two operating leases for buildings andequipment, one of which also includes land. The Company has guaranteed supplemental paymentobligations of approximately $130 million at the termination of these leases. The Company believes,based on current facts and circumstances, that any payment pursuant to these guarantees is remote.No significant credit guarantees existed between the Company and third parties as of April 28, 2010.
18. Advertising Costs
Advertising expenses (including production and communication costs) for fiscal years 2010, 2009and 2008 were $375.8 million, $303.1 million and $338.7 million, respectively. For fiscal years 2010,2009 and 2008, $108.9 million, $105.3 million and $118.9 million, respectively, were recorded as a
86
H. J. Heinz Company and Subsidiaries
Notes to Consolidated Financial Statements — (Continued)

reduction of revenue and $266.9 million, $197.8 million and $219.8 million, respectively, wererecorded as a component of selling, general and administrative expenses.
19. Venezuela- Foreign Currency and Inflation
Foreign Currency
The local currency in Venezuela is the VEF. A currency control board exists in Venezuela that isresponsible for foreign exchange procedures, including approval of requests for exchanges of VEF forU.S. dollars at the official (government established) exchange rate. Our business in Venezuela hashistorically been successful in obtaining U.S. dollars at the official exchange rate for imports ofingredients, packaging, manufacturing equipment, and other necessary inputs, and for dividendremittances, albeit on a delay. While an unregulated parallel market exists for exchanging VEF forU.S dollars through securities transactions, our Venezuelan subsidiary has no recent history ofentering into such exchange transactions.
The Company uses the official exchange rate to translate the financial statements of itsVenezuelan subsidiary, since we expect to obtain U.S. dollars at the official rate for future dividendremittances. The official exchange rate in Venezuela had been fixed at 2.15 VEF to 1 U.S. dollar forseveral years, despite significant inflation. On January 8, 2010, the Venezuelan governmentannounced the devaluation of its currency relative to the U.S. dollar. The official exchange ratefor imported goods classified as essential, such as food and medicine, changed from 2.15 to 2.60, whilepayments for other non-essential goods moved to an exchange rate of 4.30. The majority, if not all, ofour imported products in Venezuela are expected to fall into the essential classification and qualifyfor the 2.60 rate. However, our Venezuelan subsidiary’s financial statements are translated using the4.30 rate, as this is the rate expected to be applicable to dividend repatriations.
During Fiscal 2010, the Company recorded a $61.7 million currency translation loss as a result ofthe currency devaluation, which has been reflected as a component of accumulated other compre-hensive loss within unrealized translation adjustment. The net asset position of our Venezuelansubsidiary has also been reduced as a result of the devaluation to approximately $81 million atApril 28, 2010.
Highly Inflationary Economy
An economy is considered highly inflationary under U.S. GAAP if the cumulative inflation rate for athree-year period meets or exceeds 100 percent. Based on the blended National Consumer Price Index,the Venezuelan economy exceeded the three-year cumulative inflation rate of 100 percent during thethird quarter of Fiscal 2010. As a result, the financial statements of our Venezuelan subsidiary havebeen consolidated and reported under highly inflationary accounting rules beginning on January 28,2010, the first day of our fiscal fourth quarter. Under highly inflationary accounting, the financialstatements of our Venezuelan subsidiary are remeasured into the Company’s reporting currency(U.S. dollars) and exchange gains and losses from the remeasurement of monetary assets and liabilitiesare reflected in current earnings, rather than accumulated other comprehensive loss on the balancesheet, until such time as the economy is no longer considered highly inflationary.
The impact of applying highly inflationary accounting for Venezuela on our consolidated financialstatements is dependent upon movements in the applicable exchange rates (at this time, the officialrate) between the local currency and the U.S. dollar and the amount of monetary assets and liabilitiesincluded in our subsidiary’s balance sheet. At April 28, 2010, the U.S. dollar value of monetary assets,net of monetary liabilities, which would be subject to an earnings impact from exchange rate movementsfor our Venezuelan subsidiary under highly inflationary accounting was $42.2 million.
87
H. J. Heinz Company and Subsidiaries
Notes to Consolidated Financial Statements — (Continued)

Item 9. Changes in and Disagreements with Accountants on Accounting and FinancialDisclosure.
There is nothing to be reported under this item.
Item 9A. Controls and Procedures.
(a) Evaluation of Disclosure Controls and Procedures
The Company’s management, with the participation of the Company’s Chief Executive Officerand Chief Financial Officer, evaluated the effectiveness of the Company’s disclosure controls andprocedures as of the end of the period covered by this report. Based on that evaluation, the ChiefExecutive Officer and Chief Financial Officer concluded that the Company’s disclosure controls andprocedures, as of the end of the period covered by this report, were effective and provided reasonableassurance that the information required to be disclosed by the Company in reports filed under theSecurities Exchange Act of 1934 is (i) recorded, processed, summarized and reported within the timeperiods specified in the SEC’s rules and forms, and (ii) accumulated and communicated to ourmanagement, including the Chief Executive Officer and Chief Financial Officer, as appropriate toallow timely decisions regarding required disclosure. See also “Report of Management on InternalControl over Financial Reporting.”
(b) Management’s Report on Internal Control Over Financial Reporting.
Our management’s report on Internal Control Over Financial Reporting is set forth in Item 8 andincorporated herein by reference.
PricewaterhouseCoopers LLP, an independent registered public accounting firm, audited theeffectiveness of the Company’s internal control over financial reporting as of April 28, 2010, as statedin their report as set forth in Item 8.
(c) Changes in Internal Control over Financial Reporting
No change in the Company’s internal control over financial reporting occurred during theCompany’s most recent fiscal quarter that has materially affected, or is reasonably likely to mate-rially affect, the Company’s internal control over financial reporting.
Item 9B. Other Information.
There is nothing to be reported under this item.
88

PART III
Item 10. Directors, Executive Officers and Corporate Governance.
Information relating to the Directors of the Company is set forth under the captions “Election ofDirectors” and “Additional Information—Section 16 Beneficial Ownership Reporting Compliance” inthe Company’s definitive Proxy Statement in connection with its Annual Meeting of Shareholders tobe held August 31, 2010. Information regarding the Audit Committee members and the auditcommittee financial expert is set forth under the captions “Report of the Audit Committee” and“Relationship with Independent Registered Public Accounting Firm” in the Company’s definitiveProxy Statement in connection with its Annual Meeting of Shareholders to be held on August 31,2010. Information relating to the executive officers of the Company is set forth under the caption“Executive Officers of the Registrant” in Part I of this report, and such information is incorporatedherein by reference. The Company’s Global Code of Conduct, which is applicable to all employees,including the principal executive officer, the principal financial officer, and the principal accountingofficer, as well as the charters for the Company’s Audit, Management Development & Compensation,Corporate Governance, and Corporate Social Responsibility Committees, as well as periodic andcurrent reports filed with the SEC are available on the Company’s website, www.heinz.com, and areavailable in print to any shareholder upon request. Such specified information is incorporated hereinby reference.
Item 11. Executive Compensation.
Information relating to executive and director compensation is set forth under the captions“Compensation Discussion and Analysis,” “Director Compensation Table,” and “Compensation Com-mittee Report” in the Company’s definitive Proxy Statement in connection with its Annual Meeting ofShareholders to be held on August 31, 2010. Such information is incorporated herein by reference.
Item 12. Security Ownership of Certain Beneficial Owners and Management andRelated Stockholder Matters.
Information relating to the ownership of equity securities of the Company by certain beneficialowners and management is set forth under the captions “Security Ownership of Certain PrincipalShareholders” and “Security Ownership of Management” in the Company’s definitive Proxy State-ment in connection with its Annual Meeting of Shareholders to be held August 31, 2010. Suchinformation is incorporated herein by reference.
The number of shares to be issued upon exercise and the number of shares remaining availablefor future issuance under the Company’s equity compensation plans at April 28, 2010 were as follows:
Equity Compensation Plan Information
Number of securities tobe issued upon exerciseof outstanding options,
warrants and rights
Weighted-averageexercise price of
outstanding options,warrants and rights
Number of securitiesremaining availablefor future issuance
under equitycompensation Plans(excluding securities
reflected in column (a))
(a) (b) (c)
Equity compensation plansapproved by stockholders . . . . . . . 15,038,771 $39.70 8,290,340
Equity compensation plans notapproved by stockholders(1) . . . . . 21,232 N/A(2) N/A
Total . . . . . . . . . . . . . . . . . . . . . . . . . 15,060,003 $39.70 8,290,340
89

(1) The Executive Deferred Compensation Plan, as amended and restated effective January 1, 2005and the Deferred Compensation Plan for Non-Employee Directors as amended and restatedeffective January 1, 2005, permit full-time salaried personnel based in the U.S. who have beenidentified as key employees and non-employee directors, to defer all or part of his or her cashcompensation into either a cash account that accrues interest, or into a Heinz stock account. Theelection to defer is irrevocable. The Management Development & Compensation Committee ofthe Board of Directors administers the Plan. All amounts are payable at the times and in theamounts elected by the executives at the time of the deferral. The deferral period shall be at leastone year and shall be no greater than the date of retirement or other termination, whichever isearlier. Amounts deferred into cash accounts are payable in cash, and all amounts deferred intothe Heinz stock account are payable in Heinz Common Stock. Compensation deferred into theHeinz stock account appreciates or depreciates according to the fair market value of HeinzCommon Stock.
(2) The grants made under the Restricted Stock Plan, the Executive Deferred Compensation Planand the Deferred Compensation Plan for Non-Employee Directors are restricted or reservedshares of Common Stock, and therefore there is no exercise price.
Item 13. Certain Relationships and Related Transactions, and DirectorIndependence.
Information relating to the Company’s policy on related person transactions and certain rela-tionships with a beneficial shareholder is set forth under the caption “Related Person Transactions”in the Company’s definitive Proxy Statement in connection with its Annual Meeting of Shareholdersto be held on August 31, 2010. Such information is incorporated herein by reference.
Information relating to director independence is set forth under the caption “Director Indepen-dence Standards” in the Company’s definitive Proxy Statement in connection with its AnnualMeeting of Shareholders to be held on August 31, 2010. Such information is incorporated hereinby reference.
Item 14. Principal Accountant Fees and Services.
Information relating to the principal auditor’s fees and services is set forth under the caption“Relationship With Independent Registered Public Accounting Firm” in the Company’s definitiveProxy Statement in connection with its Annual Meeting of Shareholders to be held on August 31,2010. Such information is incorporated herein by reference.
90

PART IV
Item 15. Exhibits and Financial Statement Schedules.
(a)(1) The following financial statements and reports are filed as part of this report underItem 8—“Financial Statements and Supplementary Data”:
Consolidated Balance Sheets as of April 28, 2010 and April 29, 2009Consolidated Statements of Income for the fiscal years ended April 28, 2010,April 29, 2009 and April 30, 2008Consolidated Statements of Equity for the fiscal years ended April 28, 2010,April 29, 2009 and April 30, 2008Consolidated Statements of Cash Flows for the fiscal years ended April 28, 2010,April 29, 2009 and April 30, 2008Notes to Consolidated Financial StatementsReport of Independent Registered Public Accounting Firm ofPricewaterhouseCoopers LLP dated June 17, 2010, on the Company’s consolidatedfinancial statements and financial statement schedule filed as a part hereof for thefiscal years ended April 28, 2010, April 29, 2009 and April 30, 2008
(2) The following report and schedule is filed herewith as a part hereof:Schedule II (Valuation and Qualifying Accounts and Reserves) for the three fiscalyears ended April 28, 2010, April 29, 2009 and April 30, 2008All other schedules are omitted because they are not applicable or the requiredinformation is included herein or is shown in the consolidated financial statementsor notes thereto filed as part of this report incorporated herein by reference.
(3) Exhibits required to be filed by Item 601 of Regulation S-K are listed below. Documentsnot designated as being incorporated herein by reference are filed herewith. Theparagraph numbers correspond to the exhibit numbers designated in Item 601 ofRegulation S-K.3(i) Third Amended and Restated Articles of Incorporation of H. J. Heinz Company
dated August 21, 2008, are incorporated herein by reference to Exhibit 3(i) of theCompany’s Quarterly Report on Form 10-Q for the quarterly period ended July 30,2008.
3(ii) The Company’s By-Laws, as amended effective August 12, 2009, are incorporatedherein by reference to Exhibit 3(ii) of the Company’s Quarterly Report onForm 10-Q for the period ended July 29, 2009.
4. Except as set forth below, there are no instruments with respect to long-termunregistered debt of the Company that involve indebtedness or securitiesauthorized thereunder in amounts that exceed 10 percent of the total assets of theCompany on a consolidated basis. The Company agrees to furnish a copy of anyinstrument or agreement defining the rights of holders of long-term debt of theCompany upon request of the Securities and Exchange Commission.(a) The Indenture among the Company, H. J. Heinz Finance Company, and
Bank One, National Association dated as of July 6, 2001 relating to theH. J. Heinz Finance Company’s $750,000,000 6.625% Guaranteed Notes due2011, $700,000,000 6.00% Guaranteed Notes due 2012, $550,000,000 6.75%Guaranteed Notes due 2032 and $250,000,000 7.125% Guaranteed Notes due2039 is incorporated herein by reference to Exhibit 4 of the Company’sAnnual Report on Form 10-K for the fiscal year ended May 1, 2002.
(b) Three-Year Credit Agreement dated April 29, 2009 among H. J. HeinzCompany, H. J. Heinz Finance Company, the Banks listed on the signaturepages thereto and JPMorgan Chase Bank, N.A. as Administrative Agent isincorporated by reference to Exhibit 10.1 of the Company’s Current Reporton Form 8-K dated April 29, 2009.
91

(c) Indenture among H. J. Heinz Company and Union Bank of California, N.A.dated as of July 15, 2008 relating to the Company’s $500,000,0005.35% Notes due 2013 is incorporated herein by reference to Exhibit 4(d) ofthe Company’s Annual Report on Form 10-K for the period ended April 29,2009.
10(a) Management contracts and compensatory plans:(i) 1986 Deferred Compensation Program for H. J. Heinz Company
and affiliated companies, as amended and restated in its entiretyeffective January 1, 2005, is incorporated herein by reference toExhibit 10(a)(xi) to the Company’s Annual Report on Form 10-Q forthe period ended July 30, 2008.
(ii) H. J. Heinz Company 1994 Stock Option Plan, as amended andrestated effective August 13, 2008, is incorporated herein byreference to Exhibit 10(a)(vi) to the Company’s Quarterly Report onForm 10-Q for the period ended July 30, 2008.
(iii) H. J. Heinz Company Supplemental Executive Retirement Plan, asamended and restated effective November 12, 2008, is incorporatedherein by reference to Exhibit 10(a)(ii) to the Company’s QuarterlyReport on Form 10-Q for the period ended October 29, 2008.
(iv) H. J. Heinz Company Executive Deferred Compensation Plan, asamended and restated effective January 1, 2005, is incorporatedherein by reference to Exhibit 10(a)(xii) of the Company’s QuarterlyReport on Form 10-Q for the period ended July 30, 2008.
(v) H. J. Heinz Company Stock Compensation Plan for Non-EmployeeDirectors is incorporated herein by reference to Appendix A to theCompany’s Proxy Statement dated August 3, 1995.
(vi) H. J. Heinz Company 1996 Stock Option Plan, as amended andrestated effective August 13, 2008, is incorporated herein byreference to Exhibit 10(a)(vii) to the Company’s Quarterly Reporton Form 10-Q for the period ended July 30, 2008.
(vii) H. J. Heinz Company Deferred Compensation Plan for Directors isincorporated herein by reference to Exhibit 10(a)(xiii) to theCompany’s Annual Report on Form 10-K for the fiscal year endedApril 29, 1998.
(viii) H. J. Heinz Company 2000 Stock Option Plan, as amended andrestated effective August 13, 2008, is incorporated herein byreference to Exhibit 10(a)(viii) to the Company’s Quarterly Reporton Form 10-Q for the period ended July 30, 2008.
(ix) H. J. Heinz Company Executive Estate Life Insurance Program isincorporated herein by reference to Exhibit 10(a)(xv) to theCompany’s Annual Report on Form 10-K for the fiscal year endedMay 1, 2002.
(x) H. J. Heinz Company Senior Executive Incentive CompensationPlan, as amended and restated effective January 1, 2008, isincorporated herein by reference to Exhibit 10(a)(xiii) to theCompany’s Quarterly Report on Form 10-Q for the period endingJuly 30, 2008.
(xi) Deferred Compensation Plan for Non-Employee Directors ofH. J. Heinz Company, as amended and restated effective January 1,2005, is incorporated herein by reference to Exhibit 10(a)(x) to theCompany’s Quarterly Report on Form 10-Q for the quarterly periodended July 30, 2008.
92

(xii) Form of Stock Option Award and Agreement for U.S. Employees isincorporated herein by reference to Exhibit 10(a) to the Company’sQuarterly Report on Form 10-Q for the quarterly period endedJanuary 26, 2005.
(xiii) Form of Stock Option Award and Agreement for U.S. EmployeesBased in the U.K. on International Assignment is incorporatedherein by reference to Exhibit 10(a) to the Company’s QuarterlyReport on Form 10-Q for the quarterly period ended January 26,2005.
(xiv) Named Executive Officer and Director Compensation(xv) Form of Fiscal Year 2006 Restricted Stock Unit Award and
Agreement for U.S. Employees is incorporated herein by referenceto the Company’s Annual Report on Form 10-K for the fiscal yearended April 27, 2005.
(xvi) Form of Fiscal Year 2006 Restricted Stock Unit Award andAgreement for non-U.S. Based Employees is incorporated herein byreference to the Company’s Annual Report on Form 10-K for thefiscal year ended April 27, 2005.
(xvii) Form of Revised Severance Protection Agreement is incorporatedherein by reference to Exhibit 10(a)(i) to the Company’s QuarterlyReport on Form 10-Q for the period ended October 29, 2008.
(xviii) Form of Fiscal Year 2007 Restricted Stock Unit Award andAgreement is incorporated herein by reference to the Company’sQuarterly Report on Form 10-Q for the quarterly period endedNovember 1, 2006.
(xix) Form of Fiscal Year 2008 Stock Option Award and Agreement (U.S.Employees) is incorporated herein by reference to the Company’sQuarterly Report on Form 10-Q for the quarterly period endedAugust 1, 2007.
(xx) Form of Stock Option Award and Agreement is incorporated hereinby reference to the Company’s Quarterly Report on Form 10-Q forthe quarterly period ended August 1, 2007.
(xxi) Form of Restricted Stock Unit Award and Agreement isincorporated herein by reference to the Company’s QuarterlyReport on Form 10-Q for the quarterly period ended August 1,2007.
(xxii) Form of Revised Fiscal Year 2008 Restricted Stock Unit Award andAgreement is incorporated herein by reference to the Company’sQuarterly Report on Form 10-Q for the quarterly period endedAugust 1, 2007.
(xxiii) Form of Restricted Stock Award and Agreement (U.S. EmployeesRetention) is incorporated herein by reference to the Company’sQuarterly Report on Form 10-Q for the quarterly period endedAugust 1, 2007.
(xxiv) Third Amended and Restated Fiscal Year 2003 Stock Incentive Planis incorporated herein by reference to Exhibit 10(a)(ix) to theCompany’s Quarterly Report on Form 10-Q for the quarterly periodended July 30, 2008.
(xxv) Third Amended and Restated Global Stock Purchase Plan isincorporated herein by reference to Exhibit 10(a)(xiv) to theCompany’s Quarterly Report on Form 10-Q for the quarterly periodended July 30, 2008.
93

(xxvi) Time Sharing Agreement dated as of September 14, 2007, betweenH. J. Heinz Company and William R. Johnson is incorporatedherein by reference to Exhibit 10.1 of the Company’s Form 8-Kdated September 14, 2007.
(xxvii) H. J. Heinz Company Annual Incentive Plan, as amended andrestated effective January 1, 2008, is incorporated herein byreference to Exhibit 10(a)(xv) to the Company’s Quarterly Reporton Form 10-Q for the quarterly period ended July 30, 2008.
(xxviii) Form of Stock Option Award and Agreement for U.K. Employees onInternational Assignment is incorporated herein by reference toExhibit 10(a)(xvii) to the Company’s Quarterly Report onForm 10-Q for the quarterly period ended July 30, 2008.
(xxix) Form of Fiscal Year 2008 Restricted Stock Unit Award andAgreement (U.S. Employees—Retention) is incorporated herein byreference to Exhibit 10(a)(xxx) to the Company’s Annual Report onForm 10-K for the period ended April 29, 2009.
(xxx) Form of Fiscal Year 2009 Restricted Stock Unit Award andAgreement (U.S. Employees) is incorporated herein by reference toExhibit 10(a)(i) to the Company’s Quarterly Report on Form 10-Qfor the quarterly period ended July 30, 2008.
(xxxi) Form of Fiscal Year 2009 Long-Term Performance Program AwardAgreement (U.S. Employees) is incorporated herein by reference toExhibit 10(a)(iii) to the Company’s Quarterly Report on Form 10-Qfor the quarterly period ended July 30, 2008.
(xxxii) Form of Fiscal Year 2009 Long-Term Performance Program AwardAgreement (Non-U.S. Employees) is incorporated herein byreference to Exhibit 10(a)(iv) to the Company’s Quarterly Report onForm 10-Q for the quarterly period ended July 30, 2008.
(xxxiii) Form of Fiscal Year 2010-11 Long-Term Performance ProgramAward Agreement (U.S. Employees) is incorporated herein byreference to Exhibit 10(a)(xxxiv) to the Company’s Annual Reporton Form 10-K for the period ended April 29, 2009.
(xxxiv) Form of Fiscal Year 2010 Restricted Stock Unit Award andAgreement (U.S. Employees) is incorporated herein by reference toExhibit 10(a)(i) to the Company’s Quarterly Report on Form 10-Qfor the quarterly period ended July 29, 2009.
(xxxv) Form of Fiscal Year 2010 Restricted Stock Unit Award andAgreement (Non-U.S. Employees) is incorporated herein byreference to Exhibit 10(a)(ii) to the Company’s Quarterly Report onForm 10-Q for the quarterly period ended July 29, 2009.
(xxxvi) Form of Fiscal Year 2010 Restricted Stock Unit Award andAgreement (U.S. Employees—Time Based Vesting) is incorporatedherein by reference to Exhibit 10(a)(i) to the Company’s QuarterlyReport on Form 10-Q for the quarterly period ended October 28,2009.
(xxxvii) Form of Fiscal Year 2010-11 Long-Term Performance ProgramAward Agreement (Non-U.S. Employees) is incorporated herein byreference to the Exhibit 10(a)(xxxv) to the Company’s AnnualReport on Form 10-K for the period ended April 29, 2009.
12. Computation of Ratios of Earnings to Fixed Charges.21. Subsidiaries of the Registrant.23. Consent of PricewaterhouseCoopers LLP.
94

24. Powers-of-attorney of the Company’s directors.31(a) Rule 13a-14(a)/15d-14(a) Certification by William R. Johnson.31(b) Rule 13a-14(a)/15d-14(a) Certification by Arthur B. Winkleblack.32(a) Certification by the Chief Executive Officer Relating to the Annual Report
Containing Financial Statements.32(b) Certification by the Chief Financial Officer Relating to the Annual Report
Containing Financial Statements.101.INS XBRL Instance Document*101.SCH XBRL Schema Document*101.CAL XBRL Calculation Linkbase Document*101.LAB XBRL Labels Linkbase Document*101.PRE XBRL Presentation Linkbase Document*101.DEF XBRL Definition Linkbase Document*
Copies of the exhibits listed above will be furnished upon request to holders or beneficial holders ofany class of the Company’s stock, subject to payment in advance of the cost of reproducing theexhibits requested.* In accordance with Regulation S-T, the XBRL-related information in Exhibit 101 to this Annual
Report on Form 10-K shall be deemed to be “furnished” and not “filed”.
95

SIGNATURES
Pursuant to the requirements of Section 13 or 15(d) of the Securities Exchange Act of 1934, theRegistrant has duly caused this Report to be signed on its behalf by the undersigned, thereunto dulyauthorized, on June 17, 2010.
H. J. HEINZ COMPANY(Registrant)
By: /s/ ARTHUR B. WINKLEBLACK. . . . . . . . . . . . . . . . . . . . . . . . . . . . . . . . . . . . . . . .Arthur B. Winkleblack
Executive Vice President and Chief Financial Officer
Pursuant to the requirements of the Securities Exchange Act of 1934, this Report has beensigned below by the following persons on behalf of the Registrant and in the capacities indicated, onJune 17, 2010.
Signature Capacity
/s/ WILLIAM R. JOHNSON. . . . . . . . . . . . . . . . . . . . . . . . . . . . . . . . . . .William R. Johnson
Chairman, President andChief Executive Officer(Principal Executive Officer)
/s/ ARTHUR B. WINKLEBLACK. . . . . . . . . . . . . . . . . . . . . . . . . . . . . . . . . . .Arthur B. Winkleblack
Executive Vice President andChief Financial Officer(Principal Financial Officer)
/s/ EDWARD J. MCMENAMIN. . . . . . . . . . . . . . . . . . . . . . . . . . . . . . . . . . .Edward J. McMenamin
Senior Vice President-Finance andCorporate Controller(Principal Accounting Officer)
William R. JohnsonCharles E. BunchLeonard S. Coleman, Jr.John G. DrosdickEdith E. HolidayCandace KendleDean R. O’HareNelson PeltzDennis H. ReilleyLynn C. SwannThomas J. UsherMichael F. Weinstein
DirectorDirectorDirectorDirectorDirectorDirectorDirectorDirectorDirectorDirectorDirectorDirector
By: /s/ ARTHUR B. WINKLEBLACK. . . . . . . . . . . . . . . . . . . . . . . . . . . . . . .Arthur B. Winkleblack
Attorney-in-Fact
SIGNATURES
Pursuant to the requirements of Section 13 or 15(d) of the Securities Exchange Act of 1934, theRegistrant has duly caused this Report to be signed on its behalf by the undersigned, thereunto dulyauthorized, on June 17, 2010.
H. J. HEINZ COMPANY(Registrant)
By: /s/ ARTHUR B. WINKLEBLACK. . . . . . . . . . . . . . . . . . . . . . . . . . . . . . . . . . . . . . . .Arthur B. Winkleblack
Executive Vice President and Chief Financial Officer
Pursuant to the requirements of the Securities Exchange Act of 1934, this Report has beensigned below by the following persons on behalf of the Registrant and in the capacities indicated, onJune 17, 2010.
Signature Capacity
/s/ WILLIAM R. JOHNSON. . . . . . . . . . . . . . . . . . . . . . . . . . . . . . . . . . .William R. Johnson
Chairman, President andChief Executive Officer(Principal Executive Officer)
/s/ ARTHUR B. WINKLEBLACK. . . . . . . . . . . . . . . . . . . . . . . . . . . . . . . . . . .Arthur B. Winkleblack
Executive Vice President andChief Financial Officer(Principal Financial Officer)
/s/ EDWARD J. MCMENAMIN. . . . . . . . . . . . . . . . . . . . . . . . . . . . . . . . . . .Edward J. McMenamin
Senior Vice President-Finance andCorporate Controller(Principal Accounting Officer)
William R. JohnsonCharles E. BunchLeonard S. Coleman, Jr.John G. DrosdickEdith E. HolidayCandace KendleDean R. O’HareNelson PeltzDennis H. ReilleyLynn C. SwannThomas J. UsherMichael F. Weinstein
DirectorDirectorDirectorDirectorDirectorDirectorDirectorDirectorDirectorDirectorDirector
���������������������������������������������������������������������Director
By: /s/ ARTHUR B. WINKLEBLACK. . . . . . . . . . . . . . . . . . . . . . . . . . . . . . .Arthur B. Winkleblack
Attorney-in-Fact
96
Exhibit 31(a)
I, William R. Johnson, certify that:
1. I have reviewed this annual report on Form 10-K of H. J. Heinz Company;
2. Based on my knowledge, this report does not contain any untrue statement of a material factor omit to state a material fact necessary to make the statements made, in light of the circumstancesunder which such statements were made, not misleading with respect to the period covered by thisreport;
3. Based on my knowledge, the financial statements, and other financial information included inthis report, fairly present in all material respects the financial condition, results of operations andcash flows of the registrant as of, and for, the periods presented in this report;
4. The registrant’s other certifying officer and I are responsible for establishing and maintainingdisclosure controls and procedures (as defined in Exchange Act Rules 13a-15(e) and 15d-15(e)) andinternal control over financial reporting (as defined in Exchange Act Rules 13a-15(f) and 15d-15(f))for the registrant and have:
a) Designed such disclosure controls and procedures, or caused such disclosure controls andprocedures to be designed under our supervision, to ensure that material information relating tothe registrant, including its consolidated subsidiaries, is made known to us by others withinthose entities, particularly during the period in which this report is being prepared;
b) Designed such internal control over financial reporting, or caused such internal controlover financial reporting to be designed under our supervision, to provide reasonable assuranceregarding the reliability of financial reporting and the preparation of financial statements forexternal purposes in accordance with generally accepted accounting principles;
c) Evaluated the effectiveness of the registrant’s disclosure controls and procedures andpresented in this report our conclusions about the effectiveness of the disclosure controls andprocedures, as of the end of the period covered by this report based on such evaluation; and
d) Disclosed in this report any change in the registrant’s internal control over financialreporting that occurred during the registrant’s fourth fiscal quarter that has materially affected,or is reasonably likely to materially affect, the registrant’s internal control over financialreporting; and
5. The registrant’s other certifying officer and I have disclosed, based on our most recentevaluation of internal control over financial reporting, to the registrant’s auditors and the auditcommittee of the registrant’s board of directors (or persons fulfilling the equivalent functions):
a) All significant deficiencies and material weaknesses in the design or operation of internalcontrol over financial reporting which are reasonably likely to adversely affect the registrant’sability to record, process, summarize, and report financial information; and
b) Any fraud, whether or not material, that involves management or other employees whohave a significant role in the registrant’s internal control over financial reporting.
Date: June 17, 2010
By: /s/ WILLIAM R. JOHNSON
Name: William R. JohnsonTitle: Chairman, President and
Chief Executive Officer
A-1

Exhibit 31(b)
I, Arthur B. Winkleblack, certify that:
1. I have reviewed this annual report on Form 10-K of H. J. Heinz Company;
2. Based on my knowledge, this report does not contain any untrue statement of a material factor omit to state a material fact necessary to make the statements made, in light of the circumstancesunder which such statements were made, not misleading with respect to the period covered by thisreport;
3. Based on my knowledge, the financial statements, and other financial information included inthis report, fairly present in all material respects the financial condition, results of operations andcash flows of the registrant as of, and for, the periods presented in this report;
4. The registrant’s other certifying officer and I are responsible for establishing and maintainingdisclosure controls and procedures (as defined in Exchange Act Rules 13a-15(e) and 15d-15(e)) andinternal control over financial reporting (as defined in Exchange Act Rules 13a-15(f) and 15d-15(f) forthe registrant and have:
a) Designed such disclosure controls and procedures, or caused such disclosure controls andprocedures to be designed under our supervision, to ensure that material information relating tothe registrant, including its consolidated subsidiaries, is made known to us by others withinthose entities, particularly during the period in which this report is being prepared;
b) Designed such internal control over financial reporting, or caused such internal controlover financial reporting to be designed under our supervision, to provide reasonable assuranceregarding the reliability of financial reporting and the preparation of financial statements forexternal purposes in accordance with generally accepted accounting principles;
c) Evaluated the effectiveness of the registrant’s disclosure controls and procedures andpresented in this report our conclusions about the effectiveness of the disclosure controls andprocedures, as of the end of the period covered by this report based on such evaluation; and
d) Disclosed in this report any change in the registrant’s internal control over financialreporting that occurred during the registrant’s fourth fiscal quarter that has materially affected,or is reasonably likely to materially affect, the registrant’s internal control over financialreporting; and
5. The registrant’s other certifying officer and I have disclosed, based on our most recentevaluation of such internal control over financial reporting, to the registrant’s auditors and theaudit committee of the registrant’s board of directors (or persons fulfilling the equivalent functions):
a) All significant deficiencies and material weaknesses in the design or operation of internalcontrol over financial reporting which are reasonably likely to adversely affect the registrant’sability to record, process, summarize, and report financial information; and
b) Any fraud, whether or not material, that involves management or other employees whohave a significant role in the registrant’s internal control over financial reporting.
Date: June 17, 2010
By: /s/ ARTHUR B. WINKLEBLACK
Name: Arthur B. WinkleblackTitle: Executive Vice President and
Chief Financial Officer
A-2

Exhibit 32(a)
Certification by the Chief Executive Officer Relating tothe Annual Report Containing Financial Statements
I, William R. Johnson, Chairman, President and Chief Executive Officer, of H. J. Heinz Company,a Pennsylvania corporation (the “Company”), hereby certify that, to my knowledge:
1. The Company’s annual report on Form 10-K for the fiscal year ended April 28, 2010 (the“Form 10-K”) fully complies with the requirements of Section 13(a) or 15(d) of the SecuritiesExchange Act of 1934, as amended; and
2. The information contained in the Form 10-K fairly presents, in all material respects, thefinancial condition and results of operations of the Company.
Date: June 17, 2010
By: /s/ WILLIAM R. JOHNSON
Name: William R. JohnsonTitle: Chairman, President and
Chief Executive Officer
A-3

Exhibit 32(b)
Certification by the Chief Financial Officer Relating tothe Annual Report Containing Financial Statements
I, Arthur B. Winkleblack, Executive Vice President and Chief Financial Officer of H. J. HeinzCompany, a Pennsylvania corporation (the “Company”), hereby certify that, to my knowledge:
1. The Company’s annual report on Form 10-K for the fiscal year ended April 28, 2010 (the“Form 10-K”) fully complies with the requirements of Section 13(a) or 15(d) of the SecuritiesExchange Act of 1934, as amended; and
2. The information contained in the Form 10-K fairly presents, in all material respects, thefinancial condition and results of operations of the Company.
Date: June 17, 2010
By: /s/ ARTHUR B. WINKLEBLACK
Name: Arthur B. WinkleblackTitle: Executive Vice President and
Chief Financial Officer
A-4

DIRECTORS*H. J. Heinz Company
DirectorsWilliam R. Johnson
Chairman, President andChief Executive OfficerDirector since 1993. (1)
Charles E. BunchChairman andChief Executive Officer,PPG Industries, Inc.Pittsburgh, Pennsylvania.Director since 2003. (1,2,4)
Leonard S. Coleman, Jr.Former President of the NationalLeague of Professional BaseballClubs;Middletown, NJ.Director since 1998. (1,3,5)
John G. DrosdickFormer Chairman, President andChief Executive Officer,Sunoco, Inc.Philadelphia, Pennsylvania.Director since 2005. (4,5)
Edith E. HolidayAttorney and Director,Various Corporations.Director since 1994. (2,5)
Candace KendleChairman and Chief ExecutiveOfficer,Kendle International Inc.,Cincinnati, Ohio.Director since 1998. (3,4)
Dean R. O’HareFormer Chairman and ChiefExecutive Officer,The Chubb Corporation,Warren, New Jersey.Director since 2000. (1,2,4,5)
Nelson PeltzChief Executive Officer andfounding partner of TrianFund Management, L.P.New York, NYDirector since 2006. (3,5)
Dennis H. ReilleyFormer Chairman CovidienFormer Chairman andChief Executive Officer, PraxairDanbury, Connecticut.Director since 2005. (2,3)
Lynn C. SwannPresident, Swann, Inc.Managing Director, Diamond EdgeCapital Partners, LLC in NewYork.Pittsburgh, Pennsylvania.Director since 2003. (3,5)
Thomas J. UsherChairman of Marathon Oil Com-pany and Retired Chairman ofUnited States Steel Corporation,Pittsburgh, Pennsylvania.Director since 2000. (1,2,3,5)
Michael F. WeinsteinChairman and Co-founder, INOV8Beverage Co., L.L.C.Rye, New YorkDirector since 2006. (2,4)
Committees of the Board
(1) Executive Committee(2) Management Development and
Compensation Committee(3) Corporate Governance
Committee(4) Audit Committee(5) Corporate Social Responsibility
Committee
* As of June 2010
A-5

PERFORMANCE GRAPH
The following graph compares the cumulative total shareholder return on the Company’sCommon Stock over the five preceding fiscal years with the cumulative total shareholder returnon the Standard & Poor’s 500 Packaged Foods and Meats Index and the return on the Standard &Poor’s 500 Index, assuming an investment of $100 in each at their closing prices on April 27, 2005 andreinvestment of dividends.
201020092008200720062005
DO
LL
AR
S
H. J. HEINZ COMPANY
S&P 500 PACKAGED FOODSAND MEATS INDEX
0
50
100
150
250
200S&P 500
2005 2006 2007 2008 2009 2010
H.J. HEINZ COMPANY 100.00 117.48 135.03 140.79 105.86 147.75
S&P 500 100.00 115.28 134.33 126.88 82.14 114.37
S&P 500 PACKAGED FOODS ANDMEATS INDEX 100.00 97.63 118.30 116.12 90.95 127.47
A-6

FIVE-YEAR SUMMARY OF OPERATIONS AND OTHER RELATED DATA
H. J. Heinz Company and Subsidiaries
(Dollars in thousands, except pershare amounts) 2010 2009 2008 2007 2006(2)
SUMMARY OF OPERATIONS:Sales(1) . . . . . . . . . . . . . . . . . . . . . $ 10,494,983 $ 10,011,331 $ 9,885,556 $ 8,800,071 $ 8,469,968Cost of products sold(1). . . . . . . . . . $ 6,700,677 $ 6,442,075 $ 6,233,420 $ 5,452,836 $ 5,418,588Interest expense(1) . . . . . . . . . . . . . $ 295,711 $ 339,635 $ 364,808 $ 333,037 $ 316,274Provision for income taxes(1) . . . . . $ 358,514 $ 375,483 $ 372,587 $ 325,991 $ 243,500Income from continuing
operations(1)(3) . . . . . . . . . . . . . . $ 931,940 $ 944,400 $ 858,176 $ 794,398 $ 435,192Income from continuing operations
per share attributable toH.J. Heinz Company commonshareholders—diluted(1)(4) . . . . . $ 2.87 $ 2.91 $ 2.62 $ 2.34 $ 1.25
Income from continuing operationsper Share attributable to H.J.Heinz Company commonshareholders—basic(1)(4) . . . . . . . $ 2.89 $ 2.95 $ 2.65 $ 2.37 $ 1.26
OTHER RELATED DATA:Dividends paid:
Common . . . . . . . . . . . . . . . . . . . $ 533,543 $ 525,281 $ 485,234 $ 461,224 $ 408,137per share . . . . . . . . . . . . . . . . . $ 1.68 $ 1.66 $ 1.52 $ 1.40 $ 1.20
Preferred . . . . . . . . . . . . . . . . . . $ 9 $ 12 $ 12 $ 13 $ 14Average common shares . . . . . . . . . 318,113,131 318,062,977 321,717,238 332,468,171 342,120,989outstanding—diluted . . . . . . . . . . .Average common shares
outstanding—basic . . . . . . . . . . . 315,947,737 313,747,318 317,019,072 328,624,527 339,102,332Number of employees . . . . . . . . . . . 29,600 32,400 32,500 33,000 36,000Capital expenditures . . . . . . . . . . . $ 277,642 $ 292,121 $ 301,588 $ 244,562 $ 230,577Depreciation and amortization(1) . . $ 299,050 $ 274,107 $ 281,467 $ 258,848 $ 241,775Total assets . . . . . . . . . . . . . . . . . . $ 10,075,711 $ 9,664,184 $ 10,565,043 $ 10,033,026 $ 9,737,767Total debt . . . . . . . . . . . . . . . . . . . $ 4,618,172 $ 5,141,824 $ 5,183,654 $ 4,881,884 $ 4,411,982Total H.J. Heinz Company
shareholders’ equity . . . . . . . . . . $ 1,891,345 $ 1,219,938 $ 1,887,820 $ 1,841,683 $ 2,048,823Return on average invested
capital(5) . . . . . . . . . . . . . . . . . . 17.8% 18.4% 16.8% 15.8% 13.1%Book value per common share . . . . . $ 5.95 $ 3.87 $ 6.06 $ 5.72 $ 6.19Price range of common stock:High . . . . . . . . . . . . . . . . . . . . . . . $ 47.84 $ 53.00 $ 48.75 $ 48.73 $ 42.79Low . . . . . . . . . . . . . . . . . . . . . . . . $ 34.03 $ 30.51 $ 41.37 $ 39.62 $ 33.42
(1) Amounts exclude operating results related to the Company’s private label frozen desserts business in the U.K. as well asthe Kabobs and Appetizers And, Inc. businesses in the U.S., which were divested in Fiscal 2010 and have been presented indiscontinued operations.
(2) Fiscal year consisted of 53 weeks.
(3) Amounts have been restated to reflect the adoption in Fiscal 2010 of new accounting guidance on noncontrolling interests.Such guidance changed the accounting and reporting for minority interests. As such, income from continuing operationsincludes $17.5 million, $14.9 million, $11.6 million, $14.3 million, and $5.7 million of income attributable to noncontrollinginterests for the fiscal years ended April 28, 2010, April 29, 2009, April 30, 2008, May 2, 2007, and May 3, 2006,respectively.
(4) Amounts have been restated to reflect the adoption in Fiscal 2010 of new accounting guidance for determining whetherinstruments granted in share-based payment awards that contain non-forfeitable rights to dividends or dividend equiv-alents (either paid or unpaid) are participating securities and shall be included in the computation of earnings per sharepursuant to the two-class method.
(5) Fiscal 2010 return on average invested capital includes a 90 basis point unfavorable impact of losses from discontinuedoperations.
A-7

The 2010 results include expenses of $37.7 million pretax ($27.8 million after tax) for upfront productivity charges and again of $15.0 million pretax ($11.1 million after tax) on a property disposal in the Netherlands.
There were no special items in Fiscals 2009, 2008 or 2007.
The 2006 results include $124.3 million pre-tax ($80.1 million after tax) for targeted workforce reductions consistent withthe Company’s goals to streamline its businesses and $22.0 million pre-tax ($16.3 million after tax) for strategic review costsrelated to the potential divestiture of several businesses. Also, $206.5 million pre-tax ($153.9 million after tax) was recorded fornet losses on non-core businesses and product lines which were sold and asset impairment charges on non-core businesses andproduct lines anticipated to be sold in Fiscal 2007. Also during 2006, the Company reversed valuation allowances of$27.3 million primarily related to the Hain Celestial Group, Inc. (“Hain”). In addition, results include $24.4 million of taxexpense relating to the impact of the American Jobs Creation Act.
A-8

H. J. Heinz Company and SubsidiariesNon-GAAP Performance Ratios
The Company reports its financial results in accordance with accounting principles generallyaccepted in the United States of America (“GAAP”).However, management believes that certain non-GAAP performance measures and ratios, used in managing the business, may provide users of thisfinancial information with additional meaningful comparisons between current results and resultsin prior periods. Non-GAAP financial measures should be viewed in addition to, and not as analternative for, the Company’s reported results prepared in accordance with GAAP. The followingprovides the calculation of the non-GAAP performance ratios discussed in the Company’s Fiscal 2010Annual Report.
Constant Currency
Constant currency results presented in this Annual Report represent the reported amountadjusted for translation (the effect of changes in average foreign exchange rates between the periodpresented and prior year weighted average rates).
Results Excluding Special Items
The following reconciles Fiscal 2006 reported diluted earnings per share to diluted earnings pershare excluding special items:
2006
Earnings per share from continuing operations attributable to H.J. HeinzCompany-Reported . . . . . . . . . . . . . . . . . . . . . . . . . . . . . . . . . . . . . . . . . . . . . . . . . . . . . . . $1.25Separation, downsizing and integration . . . . . . . . . . . . . . . . . . . . . . . . . . . . . . . . . . . . . . . 0.28Net loss on disposals & impairments . . . . . . . . . . . . . . . . . . . . . . . . . . . . . . . . . . . . . . . . . 0.14Asset impairment charges for cost and equity investments . . . . . . . . . . . . . . . . . . . . . . . . 0.31American jobs creation act . . . . . . . . . . . . . . . . . . . . . . . . . . . . . . . . . . . . . . . . . . . . . . . . . 0.07
Earnings per share from continuing operations attributable to H.J. Heinz Companyexcluding special items . . . . . . . . . . . . . . . . . . . . . . . . . . . . . . . . . . . . . . . . . . . . . . . . . . . . $2.06
Operating Free Cash Flow
Operating free cash flow is defined as cash from operations less capital expenditures net ofproceeds from disposal of PP&E.
Total Company 2006 2007 2008 2009 2010(Amounts in millions)
Cash provided by operating activities . . . $1,075.0 $1,062.3 $1,188.3 $1,166.9 $1,262.2Capital expenditures . . . . . . . . . . . . . . . . (230.6) (244.6) (301.6) (292.1) $ (277.6)Proceeds from disposals of property,
plant and equipment . . . . . . . . . . . . . . 19.4 60.7 8.5 5.4 $ 96.5
Operating Free Cash Flow . . . . . . . . . . $ 863.8 $ 878.4 $ 895.2 $ 880.2 $1,081.0
A-9

Organic Sales Growth
Organic sales growth is a non-GAAP measure that excludes the impact of foreign currencyexchange rates and acquisitions/divestitures.
2006 2007 2008 Q109 Q209 Q309 Q409 2009 Q110 Q210 Q310 Q410 2010
Total Heinz (Continuing Operations):Volume . . . . . . . . . . . . . . . . . . . . . . . 3.9% 0.8% 3.9% 5.4% (0.9)% (6.2)% (1.9)% (1.1)% (3.9)% (3.8)% 1.2% 1.6% (1.3)%Price . . . . . . . . . . . . . . . . . . . . . . . . . (0.1)% 2.2% 3.5% 5.3% 7.2% 8.1% 7.6% 7.1% 6.0% 4.6% 1.8% 1.0% 3.4%Acquisition . . . . . . . . . . . . . . . . . . . . . 5.0% 1.3% 0.7% 0.7% 1.2% 2.5% 3.4% 2.0% 3.1% 3.1% 2.9% 0.3% 2.3%Divestiture . . . . . . . . . . . . . . . . . . . . . (1.2)% (3.1)% (0.8)% 0.0% (0.2)% (0.1)% (0.2)% (0.1)% (0.2)% 0.0% 0.0% 0.0% (0.1)%Exchange . . . . . . . . . . . . . . . . . . . . . . (1.4)% 2.8% 5.2% 4.1% (3.2)% (11.3)% (13.9)% (6.6)% (9.0)% (1.0)% 6.9% 5.5% 0.5%
Total Change in Net Sales . . . . . . . . . . 6.1% 3.9% 12.3% 15.5% 4.0% (7.1)% (5.0)% 1.3% (4.0)% 2.9% 12.7% 8.3% 4.8%
Total Organic Growth. . . . . . . . . . . . . 3.8% 3.0% 7.4% 10.7% 6.3% 1.9% 5.7% 6.0% 2.1% 0.8% 3.0% 2.6% 2.1%
(Totals may not add due to rounding)
A-10

CORPORATE DATA
Heinz: H. J. Heinz Company is one of the world’s leadingmarketers of branded foods to retail and foodservicechannels. Heinz has number-one or number-two brandedbusinesses in more than 50 world markets.
Among the Company’s famous brands are Heinz, Ore-Ida, Smart Ones, Classico, Wyler’s, Delimex, Bagel Bites,Lea & Perrins, HP, Wattie’s, Farley’s, Plasmon, BioDie-terba, Greenseas, Golden Circle, Orlando, ABC, Honig, DeRuijter, and Pudliszki. Heinz also uses the famous brandsWeight Watchers, Boston Market, T.G.I. Friday’s, JackDaniel’s, Amoy, Cottee’s and Rose’s under license.
Heinz provides employment for approximately29,600 people full time, plus thousands of others on apart-time basis and during seasonal peaks.
Annual Meeting The annual meeting of the Company’sshareholders will be held at 9 a.m. on August 31, 2010, inPittsburgh at The Westin Convention Center Hotel. Themeeting will be Webcast live at www.heinz.com.
Copies of This Publication and Others Mentioned inThis Report are available without charge from the Cor-porate Affairs Department at the Heinz World Headquar-ters address or by calling (412) 456-6000.
Form 10-K The Company submits an annual report to theSecurities and Exchange Commission on Form 10-K.Copies of this Form 10-K and exhibits are available with-out charge from the Corporate Affairs Department.
Investor Information Securities analysts and investorsseeking additional information about the Companyshould contact Margaret Nollen, Senior Vice President-Investor Relations, at (412) 456-1048.
Media Information Journalists seeking additional infor-mation about the Company should contact MichaelMullen, Vice President of Corporate and GovernmentAffairs, at (412) 456-5751.
Equal Employment Opportunity It is the continuingpolicy of H. J. Heinz Company to afford full equal employ-ment opportunity to qualified employees and applicantsregardless of their race, color, religion, sex, sexual orien-tation, gender identity or expression, national origin,ancestry, age, marital status, disability, medical condi-tion, military or veteran status, citizenship status, or anyother protected characteristic (or classification) in con-formity with all applicable federal, state and local lawsand regulations. This policy is founded not only upon theCompany’s belief that all employees and applicants havethe inherent right to work in an environment free fromdiscrimination or harassment but also upon the convic-tions that such discrimination or harassment interfereswith employee work performance and productivity. TheCompany has affirmative action programs in place at alldomestic locations to ensure equal opportunity for everyemployee.
The H. J. Heinz Company Equal Opportunity Review isavailable from the Corporate Affairs Department.
Environmental Policy H. J. Heinz Company is committedto protecting the environment. Each affiliate has estab-lished programs to review its environmental impact, tosafeguard the environment and to train employees.
The H. J. Heinz Company Environmental, Health &Safety Report is available from the Corporate AffairsDepartment and is accessible on www.heinz.com.
Corporate Data Transfer Agent, Registrar and Disburs-ing Agent (for inquiries and changes in shareholderaccounts or to arrange for the direct deposit of dividends):Wells Fargo Shareowner Services, 161 N. ConcordExchange, South St. Paul, MN 55075-1139.(800) 253-3399 (within U.S.A.) or (651) 450-4064 orwww.wellsfargo.com/shareownerservices.
Auditors: PricewaterhouseCoopers LLP, 600 GrantStreet, Pittsburgh, Pennsylvania 15219
Stock Listings:New York Stock Exchange, Inc.Ticker Symbols: Common-HNZ; Third CumulativePreferred-HNZ PRThe Annual Written Affirmation and the Annual CEOAffirmation were submitted on August 28, 2009.
TDD Services Wells Fargo Shareowner Services can beaccessed through telecommunications devices for thehearing impaired by dialing (651) 450-4144.
H. J. Heinz CompanyP.O. Box 57Pittsburgh, Pennsylvania 15230-0057(412) 456-5700www.heinz.com
Weight Watchers on foods and beverages is the registered trademark of WWFoods, LLC. Weight Watchers for services and POINTS are the registeredtrademarks of Weight Watchers International, Inc. Boston Market is a registeredtrademark of Boston Market Corporation. T.G.I. Friday’s is a trademark of TGIFriday’s of Minnesota, Inc. Jack Daniel’s is the registered trademark of JackDaniel’s Properties, Inc. Amoy is a trademark of Danone Asia Pte Limited.Cottee’s and Rose’s are registered trademarks of Cadbury Enterprises Pte Ltd.
K This entire report is printed on recycled paper.
A-11

Executive Management
Office of the ChairmanWilliam R. Johnson Chairman, President & Chief Executive Officer
Karen Alber Senior Vice President, Chief Information Officer & Global Program Management Officer
Ted Bobby Executive Vice President & General Counsel
Steve Clark Vice President & Chief People Officer
Mike Milone Executive Vice President, Rest of World, Global Enterprise Risk Management & Global Infant/Nutrition
David Moran Executive Vice President, President & Chief Executive Officer, Heinz Europe
Michael Mullen Vice President, Corporate & Government Affairs
Scott O’Hara Executive Vice President, President & Chief Executive Officer, Heinz North America
Robert Ostryniec Senior Vice President & Chief Supply Chain Officer
Chris Warmoth Executive Vice President, Heinz Asia/Pacific
Art Winkleblack Executive Vice President & Chief Financial Officer
Presidents’ CouncilStefano Clini President, Global Infant/Nutrition
Nigel Comer Regional Chief Executive Officer—New Zealand, Japan, Korea & Papua New Guinea
Suzanne Douglas Managing Director, Heinz Australia
Brendan Foley President, U.S. Foodservice
Vadim Fomichev Managing Director, Heinz Russia
Andy Keatings Vice President & Chief Quality Officer
John Kraus Vice President, Corporate Governance, Compliance & Ethics
Peter Luik President & Chief Executive Officer, Heinz Canada
Ed McMenamin Senior Vice President, Finance & Corporate Controller
Dan Milich Vice President & Chief Strategy Officer
Christophe Muller Chief Supply Chain Officer, Heinz Europe, Africa & Middle East
Meg Nollen Senior Vice President, Investor Relations
Diane Owen Senior Vice President, Corporate Audit
Nilesh Patel Regional Chief Executive Officer, Heinz ASEAN
Fernando Pocaterra Area Director, Latin America & Caribbean
Mike Pretty Vice President Global Ketchup, Health & Wellness and Marketing Development
Mitchell A. Ring Senior Vice President, Business Development
Chris Stockwell Vice President & Chief Procurement Officer
Nellaiappan Thiruambalam Chairman & Managing Director, Heinz India
Roel van Neerbos President, Heinz Continental Europe
Peter Widdows Regional Chief Executive Officer, Heinz Australia & China
Dave Woodward President, Heinz UK & Ireland

H.J. Heinz Company
P.O. Box 57
Pittsburgh, PA 15230-0057
412-456-5700
www.heinz.com
67402


![hnZ-ym-`-ymk Ub-d-IvS-dpsS Ipdn¸v · - 1 - hnZ-ym-`-ymk Ub-d-IvS-dpsS Ipdn¸v tIc-f-¯nsâ kmaq-ln-Ihpw kmwkvIm-cn-I-hp-amb s]mXp hnImkw temI-¯nsâ {i² t\Sn-¡-gn-ªn-«p-−v](https://img.dokumen.tips/doc/110x75/5f085efe7e708231d421adb4/hnz-ym-ymk-ub-d-ivs-dpss-ipdnv-1-hnz-ym-ymk-ub-d-ivs-dpss-ipdnv-tic-f-ns.jpg)