Embed Size (px)
Citation preview
Financial Financial StatementStatement AnalysisAnalysis
Section 6.Section 6.Section 6.Section 6.Section 6.Section 6.
Profitability and illiquidity Risk AnalysisProfitability and illiquidity Risk Analysis
Margin AnalysisMargin AnalysisReturn Analysis: ROIC (or ROCE) and the Operating P rofitabilityReturn Analysis: ROIC (or ROCE) and the Operating P rofitabilityReturn Analysis: ROE and the Financial Profitabilit y Return Analysis: ROE and the Financial Profitabilit y
Section 6.Section 6.
Profitability and illiquidity Risk AnalysisProfitability and illiquidity Risk Analysis
Margin AnalysisMargin AnalysisReturn Analysis: ROIC (or ROCE) and the Operating P rofitabilityReturn Analysis: ROIC (or ROCE) and the Operating P rofitabilityReturn Analysis: ROE and the Financial Profitabilit y Return Analysis: ROE and the Financial Profitabilit y
Fahmi Ben Abdelkader ©
Return Analysis: ROE and the Financial Profitabilit y Return Analysis: ROE and the Financial Profitabilit y Illiquidity risk: short and longIlliquidity risk: short and long--term ratiosterm ratiosReturn Analysis: ROE and the Financial Profitabilit y Return Analysis: ROE and the Financial Profitabilit y Illiquidity risk: short and longIlliquidity risk: short and long--term ratiosterm ratios
5/25/2017 10:44 AM 1
Students version
Learning objectives
� Understand the structure of the profitability analysis
� Prepare a common-size analysis as well as a trend analysis � Prepare a common-size analysis as well as a trend analysis
� Define, calculate and interpret key financial ratios such as profit margin, return on invested capital, and Asset turnover
� Identify the limitations in using return on invested capital
� Understand the importance of trends and levels in key financial ratios
� Recognize that benchmarking is typically based on a comparison with the
Fahmi Ben Abdelkader © Financial Statement Analysis5/25/2017 10:44 AM 2
� Recognize that benchmarking is typically based on a comparison with the required rate of return or competitors
� Understand the impact of financial leverage on profitability
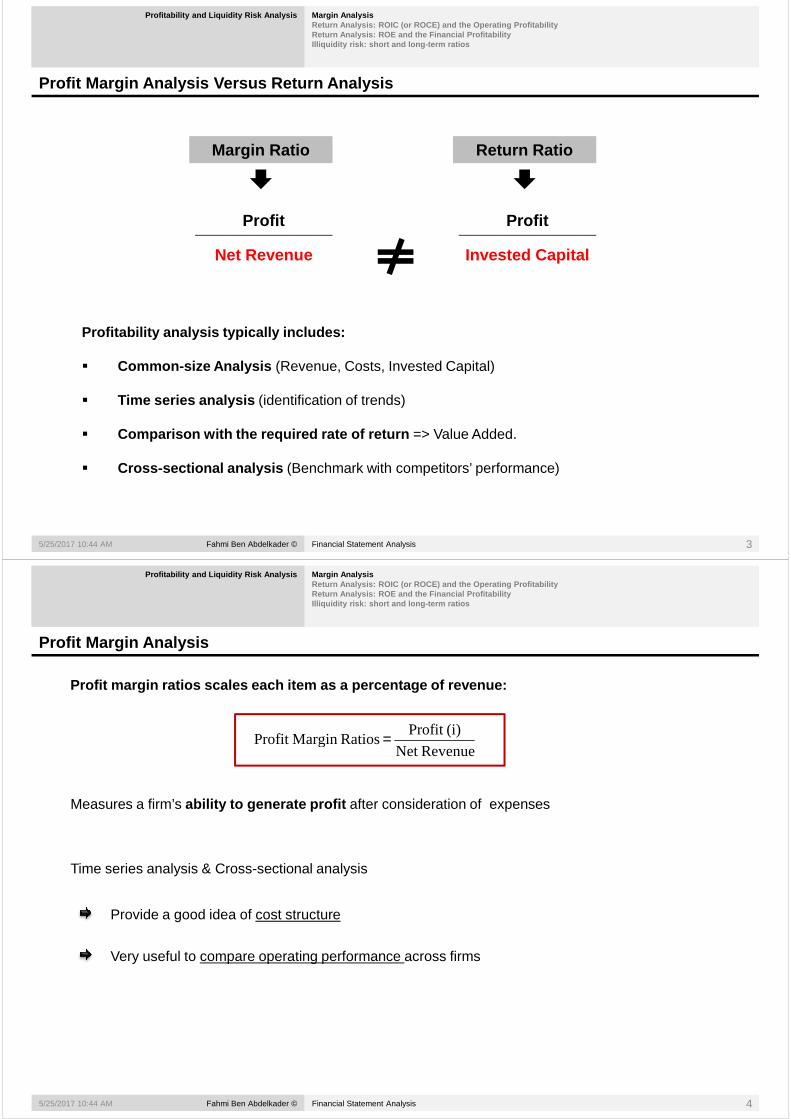
Profit Margin Analysis Versus Return Analysis
Profitability and Liquidity Risk Analysis Margin Ana lysisReturn Analysis: ROIC (or ROCE) and the Operating P rofitabilityReturn Analysis: ROE and the Financial Profitabilit y Illiquidity risk: short and long-term ratios
Margin Ratio Return Ratio
Profit
Net Revenue
Profit
Invested Capital
Profitability analysis typically includes:
� Common -size Analysis (Revenue, Costs, Invested Capital)
Fahmi Ben Abdelkader © Financial Statement Analysis5/25/2017 10:44 AM 3
� Common -size Analysis (Revenue, Costs, Invested Capital)
� Time series analysis (identification of trends)
� Comparison with the required rate of return => Value Added.
� Cross-sectional analysis (Benchmark with competitors’ performance)
Profit Margin Analysis
Profitability and Liquidity Risk Analysis Margin Ana lysisReturn Analysis: ROIC (or ROCE) and the Operating P rofitabilityReturn Analysis: ROE and the Financial Profitabilit y Illiquidity risk: short and long-term ratios
Profit margin ratios scales each item as a percenta ge of revenue:
RevenueNet
(i)Profit RatiosMargin Profit =
RevenueNet RatiosMargin Profit
Measures a firm’s ability to generate profit after consideration of expenses
Provide a good idea of cost structure
Time series analysis & Cross-sectional analysis
Fahmi Ben Abdelkader © Financial Statement Analysis5/25/2017 10:44 AM 4
Very useful to compare operating performance across firms

Profit Margin Analysis
Profitability and Liquidity Risk Analysis Margin Ana lysisReturn Analysis: ROIC (or ROCE) and the Operating P rofitabilityReturn Analysis: ROE and the Financial Profitabilit y Illiquidity risk: short and long-term ratios
Common-Size analysis of JIT’s revenue and operating expenses
Profit & expenses % of Net Revenue Year 2 Year 1
Net Revenue 100% 100%Net Revenue 100% 100%
Cost of sales 48,0% 46,0%
Gross Margin 52,0% 54,0%
Operating expenses 45,8% 49,2%
EBITDA Margin or Operating Margin 6,2% 4,8%
Depreciation & amortization 0,6% 0,6%
EBIT Margin 5,6% 4,2%
Net financial expenses 4,0% 2,6%
Pretax Income 1,6% 1,6%
Fahmi Ben Abdelkader © Financial Statement Analysis5/25/2017 10:44 AM 5
Pretax Income 1,6% 1,6%
- Corporate income tax 0,5% 0,5%
Net Profit Margin 1,1% 1,1%
NOPAT (Net Operating Profit After Tax) 4% 3%
Profit Margin Analysis Across Competitors
Profitability and Liquidity Risk Analysis Margin Ana lysisReturn Analysis: ROIC (or ROCE) and the Operating P rofitabilityReturn Analysis: ROE and the Financial Profitabilit y Illiquidity risk: short and long-term ratios
Example: EBIT Margin for four U.S. Airlines
Fahmi Ben Abdelkader © Financial Statement Analysis5/25/2017 10:44 AM 6
Profit Margin Analysis and the OPERATING LEVERAGE
Profitability and Liquidity Risk Analysis Margin Ana lysisReturn Analysis: ROIC (or ROCE) and the Operating P rofitabilityReturn Analysis: ROE and the Financial Profitabilit y Illiquidity risk: short and long-term ratios
• Operating leverage is the relative proportion of fixed versus variable costs
• The operating leverage effect refers to the capacity of the company to boost its revenues thanks to an increase in fixed expenses;
For ex. advertising campaign (Marketing), recruit highly specialized staff (R&D), hiring staff for receivables collection (administration), etc.
• A higher proportion of fixed costs increases the se nsitivity of the firm’s
Fahmi Ben Abdelkader © Financial Statement Analysis5/25/2017 10:44 AM 7
• A higher proportion of fixed costs increases the se nsitivity of the firm’s cash flows to market risk
– The firm’s beta will be higher– A higher cost of capital should be assigned
Profit Margin Analysis and Corporate Strategy
Profitability and Liquidity Risk Analysis Margin Ana lysisReturn Analysis: ROIC (or ROCE) and the Operating P rofitabilityReturn Analysis: ROE and the Financial Profitabilit y Illiquidity risk: short and long-term ratios
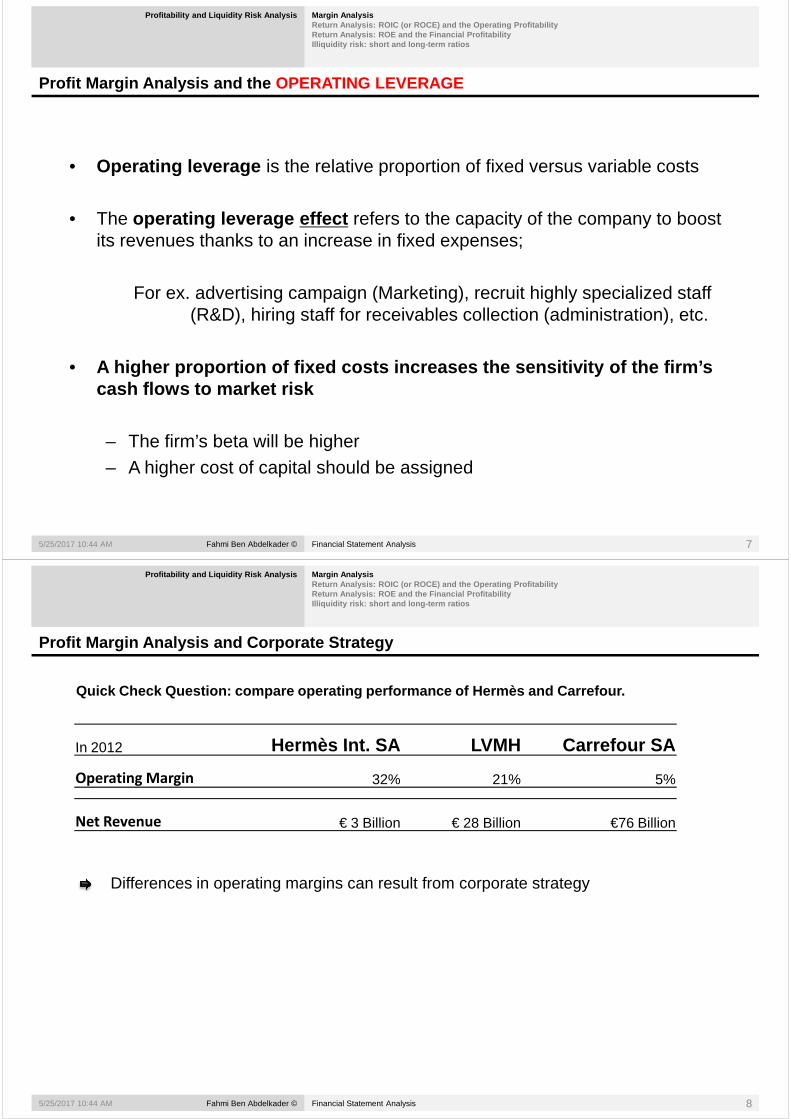
Quick Check Question: compare operating performance of Hermès and Carrefour.
In 2012 Hermès Int. SA LVMH Carrefour SAIn 2012 Hermès Int. SA LVMH Carrefour SA
Operating Margin 32% 21% 5%
Differences in operating margins can result from corporate strategy
Net Revenue € 3 Billion € 28 Billion €76 Billion
Fahmi Ben Abdelkader © Financial Statement Analysis5/25/2017 10:44 AM 8
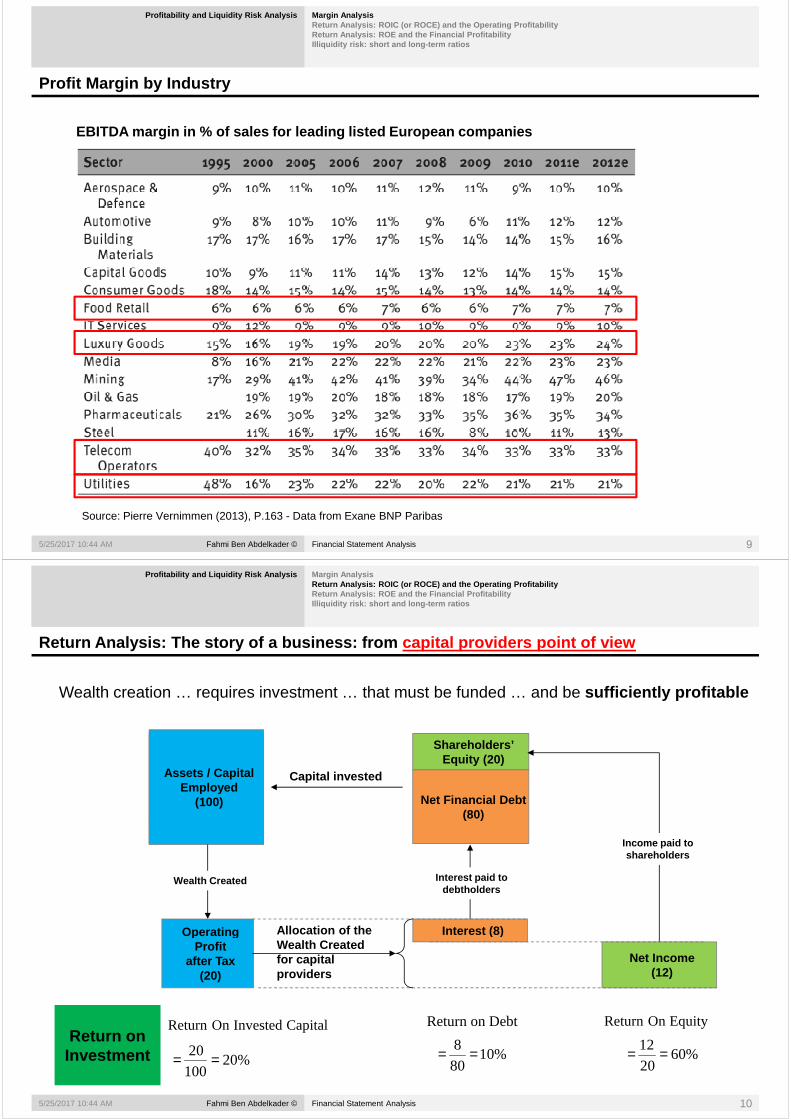
Profit Margin by Industry
Profitability and Liquidity Risk Analysis Margin Ana lysisReturn Analysis: ROIC (or ROCE) and the Operating P rofitabilityReturn Analysis: ROE and the Financial Profitabilit y Illiquidity risk: short and long-term ratios
EBITDA margin in % of sales for leading listed Euro pean companies
Fahmi Ben Abdelkader © Financial Statement Analysis5/25/2017 10:44 AM 9
Source: Pierre Vernimmen (2013), P.163 - Data from Exane BNP Paribas
Return Analysis: The story of a business: from capital providers point of view
Profitability and Liquidity Risk Analysis Margin AnalysisReturn Analysis: ROIC (or ROCE) and the Operating P rofitabilityReturn Analysis: ROE and the Financial Profitabilit y Illiquidity risk: short and long-term ratios
Wealth creation … requires investment … that must be funded … and be sufficiently profitable
Shareholders’
Fixed Assets
Shareholders’ Equity (20)
Net Financial Debt(80)
Working Capital
Capital invested Assets / Capital Employed
(100)
Interest (8) Operating
Wealth Created Interest paid to debtholders
Income paid to shareholders
Allocation of the
Fahmi Ben Abdelkader © Financial Statement Analysis5/25/2017 10:44 AM 10
Interest (8)
Net Income(12)
Operating Profit
after Tax (20)
%20100
20 == %6020
12 ==%1080
8 ==
Capital InvestedOn Return Debton Return EquityOn Return
Allocation of the Wealth Created for capital providers
Return on Investment
Return Analysis: The story of a business: from the company point of view
Profitability and Liquidity Risk Analysis Margin AnalysisReturn Analysis: ROIC (or ROCE) and the Operating P rofitabilityReturn Analysis: ROE and the Financial Profitabilit y Illiquidity risk: short and long-term ratios
Wealth creation … requires investment … that must be funded … and be sufficiently profitable
Shareholders’
Fixed Assets
Shareholders’ Equity (20)
Net Financial Debt(80)
Working Capital
Capital invested Assets / Capital Employed
(100)
Interest (8) Operating
Wealth Created Interest paid to debtholders
Income paid to shareholders
Allocation of the
Fahmi Ben Abdelkader © Financial Statement Analysis5/25/2017 10:44 AM 11
Interest (8)
Net Income(12)
Operating Profit
after Tax (20)
Allocation of the Wealth Created for capital providers
%20100
20 == %6020
12 ==%1080
8 ==
(WACC) Capital ofCost Debt ofCost Equity ofCost Cost of Capital
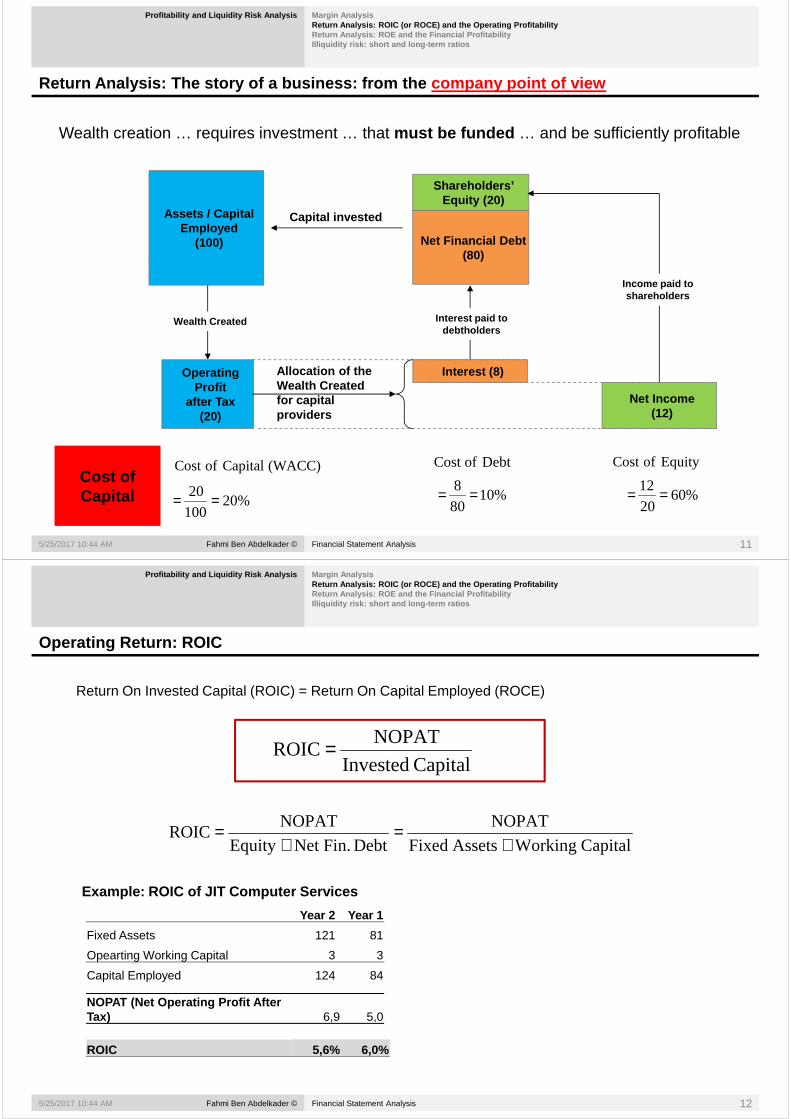
Operating Return: ROIC
Profitability and Liquidity Risk Analysis Margin AnalysisReturn Analysis: ROIC (or ROCE) and the Operating P rofitabilityReturn Analysis: ROE and the Financial Profitabilit y Illiquidity risk: short and long-term ratios
Return On Invested Capital (ROIC) = Return On Capital Employed (ROCE)
NOPATROIC =
Capital InvestedROIC =
Capital Working Assets Fixed
NOPAT
Debt Fin.Net Equity
NOPATROIC
+=
+=
Year 2 Year 1
Fixed Assets 121 81
Example: ROIC of JIT Computer Services
Fahmi Ben Abdelkader © Financial Statement Analysis5/25/2017 10:44 AM 12
Fixed Assets 121 81
Opearting Working Capital 3 3
Capital Employed 124 84
NOPAT (Net Operating Profit After Tax) 6,9 5,0
ROIC 5,6% 6,0%
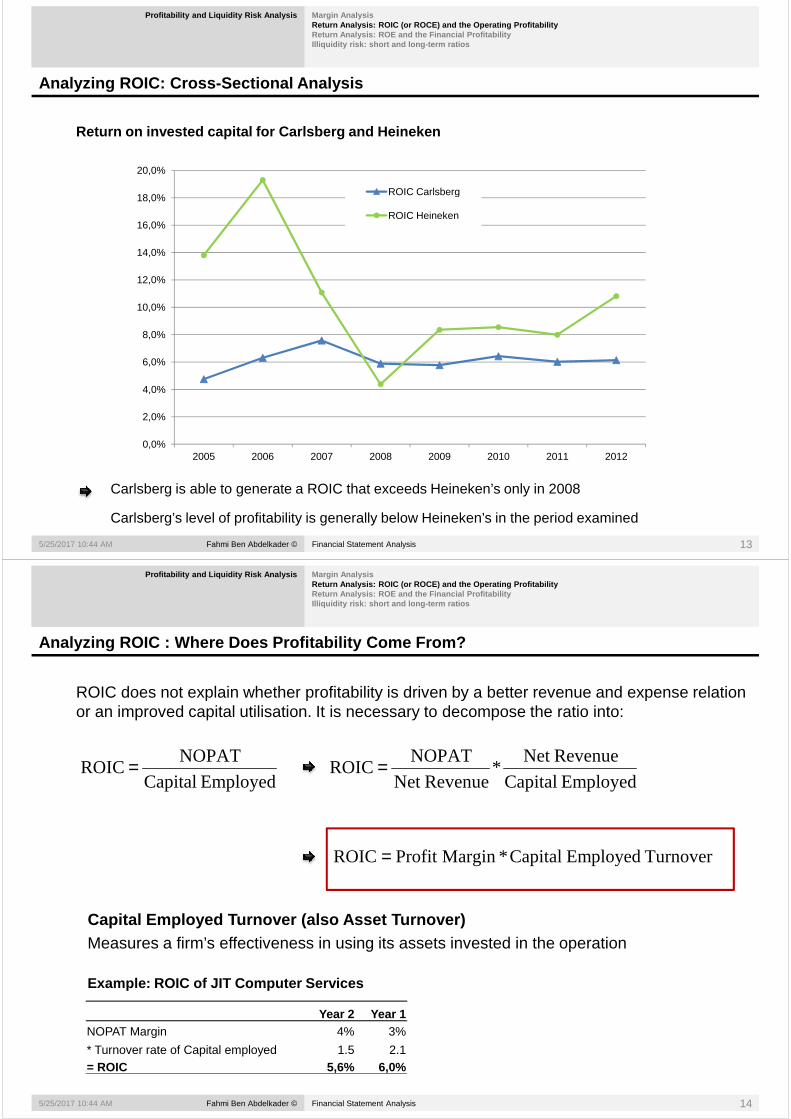
Analyzing ROIC: Cross-Sectional Analysis
Profitability and Liquidity Risk Analysis Margin AnalysisReturn Analysis: ROIC (or ROCE) and the Operating P rofitabilityReturn Analysis: ROE and the Financial Profitabilit y Illiquidity risk: short and long-term ratios
Return on invested capital for Carlsberg and Heinek en
20,0%
ROIC Carlsberg
6,0%
8,0%
10,0%
12,0%
14,0%
16,0%
18,0%ROIC Carlsberg
ROIC Heineken
Fahmi Ben Abdelkader © Financial Statement Analysis5/25/2017 10:44 AM 13
Carlsberg is able to generate a ROIC that exceeds Heineken’s only in 2008
Carlsberg’s level of profitability is generally below Heineken’s in the period examined
0,0%
2,0%
4,0%
2005 2006 2007 2008 2009 2010 2011 2012
Analyzing ROIC : Where Does Profitability Come From ?
Profitability and Liquidity Risk Analysis Margin AnalysisReturn Analysis: ROIC (or ROCE) and the Operating P rofitabilityReturn Analysis: ROE and the Financial Profitabilit y Illiquidity risk: short and long-term ratios
ROIC does not explain whether profitability is driven by a better revenue and expense relation or an improved capital utilisation. It is necessary to decompose the ratio into:
NOPAT RevenueNet NOPAT
Employed Capital
NOPATROIC =
Employed Capital
RevenueNet *
RevenueNet
NOPATROIC =
Turnover Employed Capital*MarginProfit ROIC =
Capital Employed Turnover (also Asset Turnover)
Fahmi Ben Abdelkader © Financial Statement Analysis5/25/2017 10:44 AM 14
Measures a firm’s effectiveness in using its assets invested in the operation
Year 2 Year 1NOPAT Margin 4% 3%
* Turnover rate of Capital employed 1.5 2.1= ROIC 5,6% 6,0%
Example: ROIC of JIT Computer Services
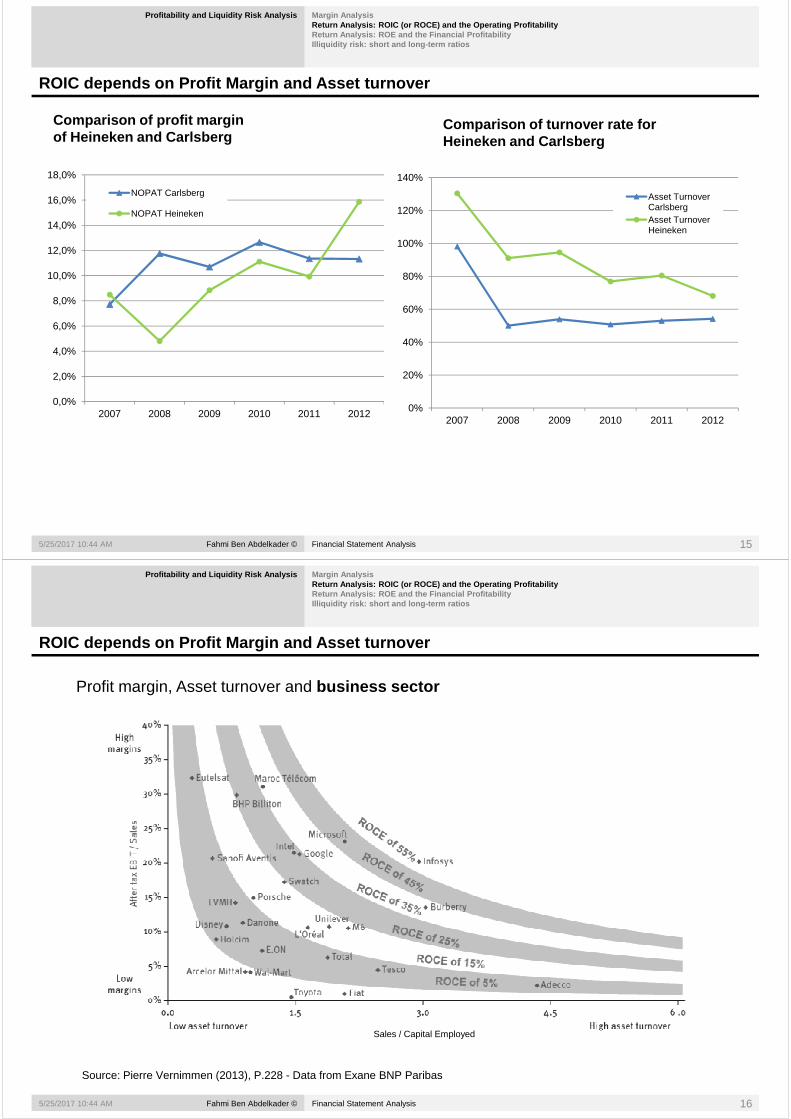
ROIC depends on Profit Margin and Asset turnover
Profitability and Liquidity Risk Analysis Margin AnalysisReturn Analysis: ROIC (or ROCE) and the Operating P rofitabilityReturn Analysis: ROE and the Financial Profitabilit y Illiquidity risk: short and long-term ratios
Comparison of profit margin of Heineken and Carlsberg
Comparison of turnover rate for Heineken and Carlsberg
18,0%
NOPAT Carlsberg
140%
4,0%
6,0%
8,0%
10,0%
12,0%
14,0%
16,0%NOPAT Carlsberg
NOPAT Heineken
20%
40%
60%
80%
100%
120%Asset Turnover CarlsbergAsset Turnover Heineken
Fahmi Ben Abdelkader © Financial Statement Analysis5/25/2017 10:44 AM 15
0,0%
2,0%
2007 2008 2009 2010 2011 2012 0%
20%
2007 2008 2009 2010 2011 2012
ROIC depends on Profit Margin and Asset turnover
Profitability and Liquidity Risk Analysis Margin AnalysisReturn Analysis: ROIC (or ROCE) and the Operating P rofitabilityReturn Analysis: ROE and the Financial Profitabilit y Illiquidity risk: short and long-term ratios
Profit margin, Asset turnover and business sector
Fahmi Ben Abdelkader © Financial Statement Analysis5/25/2017 10:44 AM 16
Sales / Capital Employed
Source: Pierre Vernimmen (2013), P.228 - Data from Exane BNP Paribas
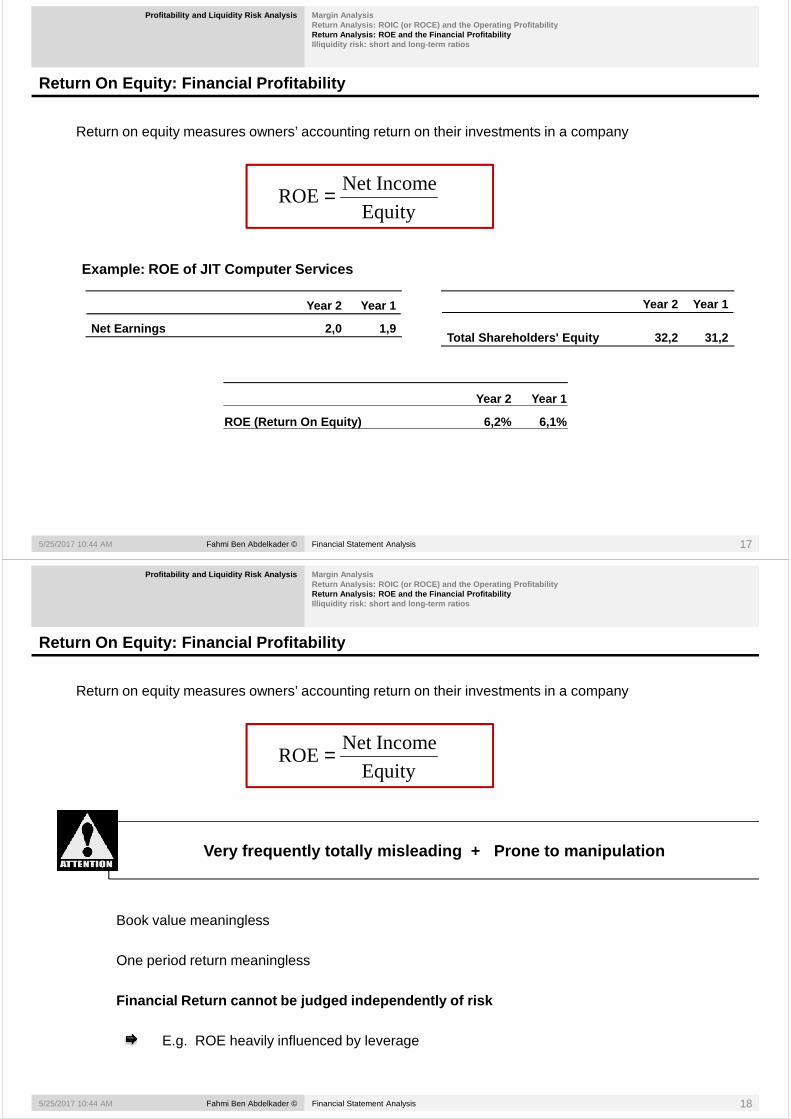
Return On Equity: Financial Profitability
Profitability and Liquidity Risk Analysis Margin AnalysisReturn Analysis: ROIC (or ROCE) and the Operating P rofitabilityReturn Analysis: ROE and the Financial Profitabilit y Illiquidity risk: short and long-term ratios
Return on equity measures owners’ accounting return on their investments in a company
IncomeNet ROE =
Equity
IncomeNet ROE =
Year 2 Year 1
Net Earnings 2,0 1,9
Year 2 Year 1
Total Shareholders' Equity 32,2 31,2
Example: ROE of JIT Computer Services
Fahmi Ben Abdelkader © Financial Statement Analysis5/25/2017 10:44 AM 17
Year 2 Year 1
ROE (Return On Equity) 6,2% 6,1%
Return On Equity: Financial Profitability
Profitability and Liquidity Risk Analysis Margin AnalysisReturn Analysis: ROIC (or ROCE) and the Operating P rofitabilityReturn Analysis: ROE and the Financial Profitabilit y Illiquidity risk: short and long-term ratios
Return on equity measures owners’ accounting return on their investments in a company
IncomeNet ROE =
Equity
IncomeNet ROE =
Very frequently totally misleading + Prone to ma nipulation
Book value meaningless
Fahmi Ben Abdelkader © Financial Statement Analysis5/25/2017 10:44 AM 18
One period return meaningless
Financial Return cannot be judged independently of risk
E.g. ROE heavily influenced by leverage
Factors impacting ROE
Profitability and Liquidity Risk Analysis Margin AnalysisReturn Analysis: ROIC (or ROCE) and the Operating P rofitabilityReturn Analysis: ROE and the Financial Profitabilit y Illiquidity risk: short and long-term ratios
Allocation of the Wealth Created
Shareholders’ Equity (20)
Fixed Assets
Equity (20)
Net Financial Debt(80)
Working Capital
Capital invested inCapital Employed(100)
Interest Expense Net IncomeOperating
Profit
Wealth Created Interest paid to debtholders
Income paid to shareholders
Fahmi Ben Abdelkader © Financial Statement Analysis5/25/2017 10:44 AM 19
Interest Expense (8)
Net Income(12)
Profit after Tax
(20)
%20100
20Capital InvestedOn Return == %60
20
12EquityOn Return ==%10
80
8Debt ofCost ==
Operating Return (ROIC) Owners’ Return………………..
Return On Equity: The impact of financing on profit ability
Profitability and Liquidity Risk Analysis Margin AnalysisReturn Analysis: ROIC (or ROCE) and the Operating P rofitabilityReturn Analysis: ROE and the Financial Profitabilit y Illiquidity risk: short and long-term ratios
The following factors affect the level and trend in ROE:
• Operating profitability • Net borrowing interest rate after tax • Net borrowing interest rate after tax • Financial leverage.
This can be shown by a relationship, which will always apply:
( )Equity
Debt Fin.Net *Debt ofCost Net - ROICROICROE +=
Effect LeverageROICROE +=
Fahmi Ben Abdelkader © Financial Statement Analysis5/25/2017 10:44 AM 20
Equity
Debt Fin.Net
rate)Tax -(1*expenses Fin.Net Debt ofCost Net =
Return On Equity: The impact of financing on profit ability
Profitability and Liquidity Risk Analysis Margin AnalysisReturn Analysis: ROIC (or ROCE) and the Operating P rofitabilityReturn Analysis: ROE and the Financial Profitabilit y Illiquidity risk: short and long-term ratios
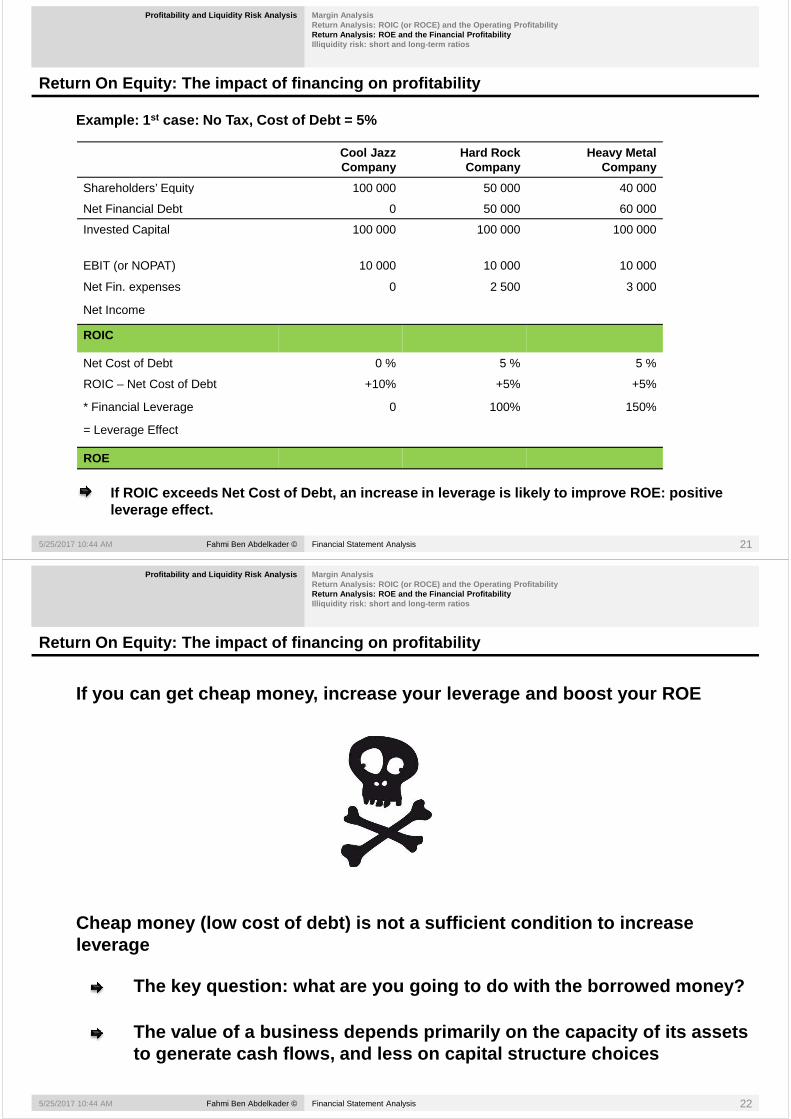
Example: 1 st case: No Tax, Cost of Debt = 5%
Cool Jazz Company
Hard Rock Company
Heavy Metal Company
Shareholders’ Equity 100 000 50 000 40 000Shareholders’ Equity 100 000 50 000 40 000
Net Financial Debt 0 50 000 60 000
Invested Capital 100 000 100 000 100 000
EBIT (or NOPAT) 10 000 10 000 10 000
Net Fin. expenses 0 2 500 3 000
Net Income
ROIC
Net Cost of Debt 0 % 5 % 5 %
Fahmi Ben Abdelkader © Financial Statement Analysis5/25/2017 10:44 AM 21
ROIC – Net Cost of Debt +10% +5% +5%
* Financial Leverage 0 100% 150%
= Leverage Effect
ROE
If ROIC exceeds Net Cost of Debt, an increase in le verage is likely to improve ROE: positive leverage effect.
Return On Equity: The impact of financing on profit ability
Profitability and Liquidity Risk Analysis Margin AnalysisReturn Analysis: ROIC (or ROCE) and the Operating P rofitabilityReturn Analysis: ROE and the Financial Profitabilit y Illiquidity risk: short and long-term ratios
If you can get cheap money, increase your leverage and boost your ROE
Cheap money (low cost of debt) is not a sufficient condition to increase
Fahmi Ben Abdelkader © Financial Statement Analysis5/25/2017 10:44 AM 22
Cheap money (low cost of debt) is not a sufficient condition to increase leverage
The key question: what are you going to do with the borrowed money?
The value of a business depends primarily on the ca pacity of its assets to generate cash flows, and less on capital structu re choices
Return On Equity: The impact of financing on profit ability
Profitability and Liquidity Risk Analysis Margin AnalysisReturn Analysis: ROIC (or ROCE) and the Operating P rofitabilityReturn Analysis: ROE and the Financial Profitabilit y Illiquidity risk: short and long-term ratios
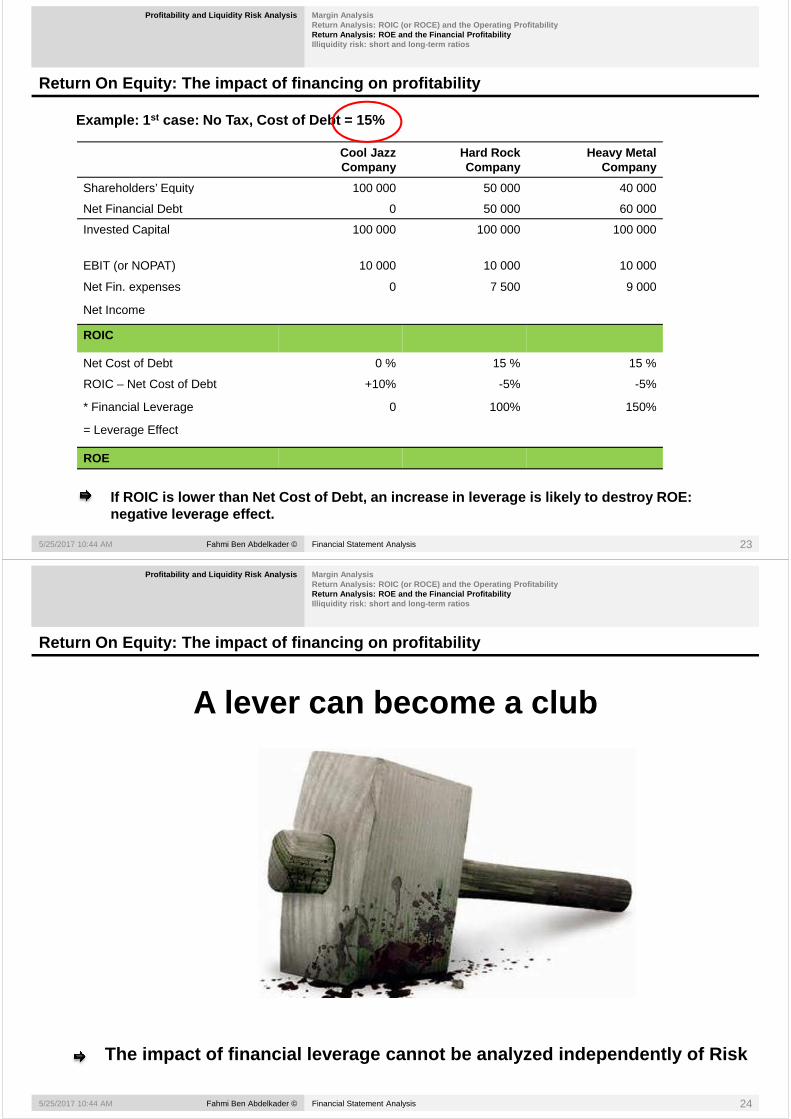
Example: 1 st case: No Tax, Cost of Debt = 15%
Cool Jazz Company
Hard Rock Company
Heavy Metal Company
Shareholders’ Equity 100 000 50 000 40 000Shareholders’ Equity 100 000 50 000 40 000
Net Financial Debt 0 50 000 60 000
Invested Capital 100 000 100 000 100 000
EBIT (or NOPAT) 10 000 10 000 10 000
Net Fin. expenses 0 7 500 9 000
Net Income
ROIC
Net Cost of Debt 0 % 15 % 15 %
Fahmi Ben Abdelkader © Financial Statement Analysis5/25/2017 10:44 AM 23
ROIC – Net Cost of Debt +10% -5% -5%
* Financial Leverage 0 100% 150%
= Leverage Effect
ROE
If ROIC is lower than Net Cost of Debt, an increase in leverage is likely to destroy ROE: negative leverage effect.
Return On Equity: The impact of financing on profit ability
Profitability and Liquidity Risk Analysis Margin AnalysisReturn Analysis: ROIC (or ROCE) and the Operating P rofitabilityReturn Analysis: ROE and the Financial Profitabilit y Illiquidity risk: short and long-term ratios
A lever can become a club
Fahmi Ben Abdelkader © Financial Statement Analysis5/25/2017 10:44 AM 24
The impact of financial leverage cannot be analyzed independently of Risk
Profitability and Liquidity Risk Analysis Margin AnalysisReturn Analysis: ROIC (or ROCE) and the Operating P rofitabilityReturn Analysis: ROE and the Financial Profitabilit y Illiquidity risk: short and long-term ratios
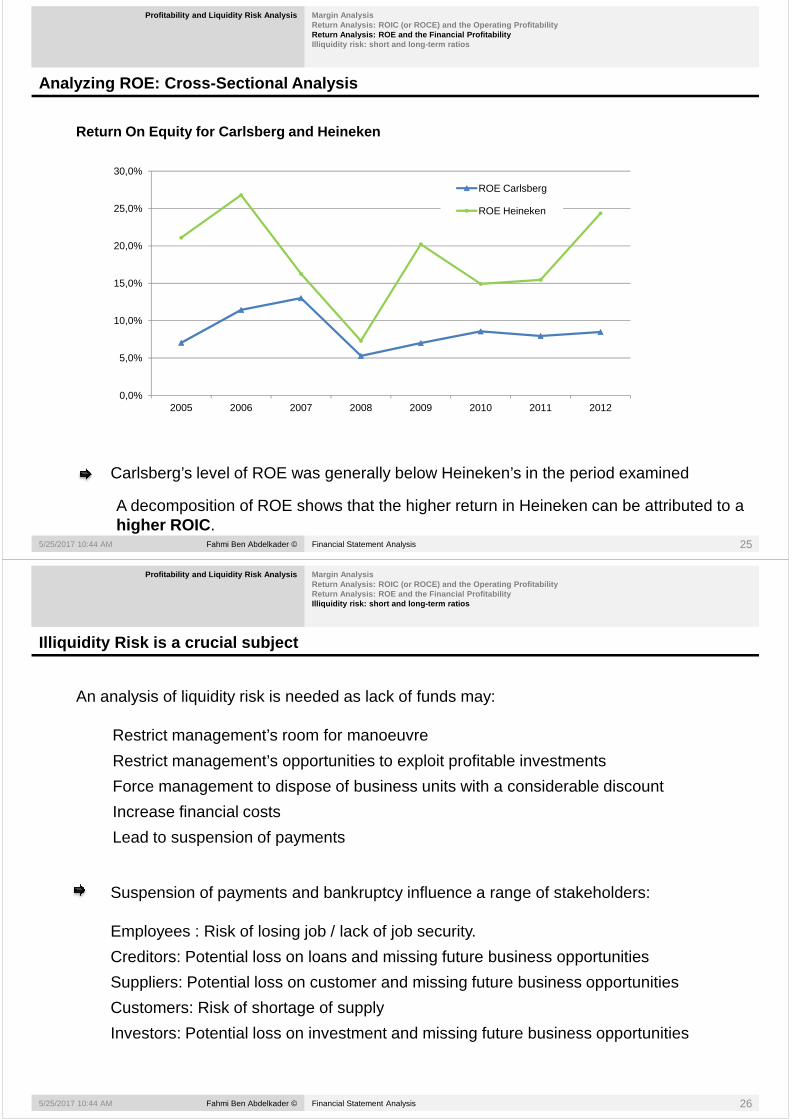
Analyzing ROE: Cross-Sectional Analysis
Return On Equity for Carlsberg and Heineken
30,0%
ROE Carlsberg
5,0%
10,0%
15,0%
20,0%
25,0%
ROE Carlsberg
ROE Heineken
Fahmi Ben Abdelkader © Financial Statement Analysis5/25/2017 10:44 AM 25
Carlsberg’s level of ROE was generally below Heineken’s in the period examined
A decomposition of ROE shows that the higher return in Heineken can be attributed to a higher ROIC .
0,0%2005 2006 2007 2008 2009 2010 2011 2012
Illiquidity Risk is a crucial subject
Profitability and Liquidity Risk Analysis Margin AnalysisReturn Analysis: ROIC (or ROCE) and the Operating P rofitabilityReturn Analysis: ROE and the Financial Profitabilit y Illiquidity risk: short and long-term ratios
An analysis of liquidity risk is needed as lack of funds may:
Restrict management’s room for manoeuvre
Restrict management’s opportunities to exploit profitable investments
Force management to dispose of business units with a considerable discount
Increase financial costs
Lead to suspension of payments
Suspension of payments and bankruptcy influence a range of stakeholders:
Employees : Risk of losing job / lack of job security.
Fahmi Ben Abdelkader © Financial Statement Analysis
Employees : Risk of losing job / lack of job security.
Creditors: Potential loss on loans and missing future business opportunities
Suppliers: Potential loss on customer and missing future business opportunities
Customers: Risk of shortage of supply
Investors: Potential loss on investment and missing future business opportunities
5/25/2017 10:44 AM 26
Measuring Short-term illiquidity risk
Profitability and Liquidity Risk Analysis Margin AnalysisReturn Analysis: ROIC (or ROCE) and the Operating P rofitabilityReturn Analysis: ROE and the Financial Profitabilit y Illiquidity risk: short and long-term ratios
Short-term liquidity is defined as a firm’s ability to pay all short term obligations
What is the likelihood that current assets cover current liabilities in the event of liquidation?
sLiabilitieCurrent
AssetsCurrent RatioCurrent =
sLiabilitieCurrent
sInventorie -AssetsCurrent RatioQuick =
sinvestment STsequivalentCash &Cash RatioCash
+=
Fahmi Ben Abdelkader © Financial Statement Analysis
sLiabilitieCurrent
sinvestment STsequivalentCash &Cash RatioCash
+=
sLiabilitieCurrent
Operations from FlowCash RatioDebt ST toCFO =
The larger the ratio, the greater the likelihood that the sale of current assets are able to cover current liabilities
5/25/2017 10:44 AM 27
Measuring Short-term illiquidity risk
Profitability and Liquidity Risk Analysis Margin AnalysisReturn Analysis: ROIC (or ROCE) and the Operating P rofitabilityReturn Analysis: ROE and the Financial Profitabilit y Illiquidity risk: short and long-term ratios
The cash burn rate is one of the most conservative financial ratios used to measure short-term liquidity risk and is typically only used on companies with negative earnings.
The ratio measures how long a company is able to fund projected costs without any further cash contribution The ratio measures how long a company is able to fund projected costs without any further cash contribution from shareholders or creditors.
EBIT
sinvestment STsequivalentCash &Cash RatioBurn Cash
+=
The cash burn rate is typically used in businesses which do not yet have a proper level of earnings.
Fahmi Ben Abdelkader © Financial Statement Analysis
earnings.
Start-up companies, biotech companies and similar types of businesses are characterized by significant investments (cash outlays) and little or no earnings.
5/25/2017 10:44 AM 28
Measuring Long-term Illiquidity Risk (or Solvency R isk)
Profitability and Liquidity Risk Analysis Margin AnalysisReturn Analysis: ROIC (or ROCE) and the Operating P rofitabilityReturn Analysis: ROE and the Financial Profitabilit y Illiquidity risk: short and long-term ratios
Long-term liquidity risk is defined as a firm’s ability to pay all long term obligations
Equity
Debt Fin.Net Leverage Financial =
Generally, a high financial leverage and a low
sLiabilitie TotalEquity
EquityRatioSolvency
+=
Expenses FinancialNet
EBITRatio CoverageInterest =
Expenses FinancialNet
Operations from FlowCash (Cash) Ratio CoverageInterest =
Equity Generally, a high financial leverage and a low solvency ratio indicate high long-term liquidity ri sk
How many times operating profit covers net financial expenses?
Fahmi Ben Abdelkader © Financial Statement Analysis
EBITDA
Debt Fin.Net EBITDA Debt to =
Operations from FlowCash
Debt Fin.Net CFO Debt to =
5/25/2017 10:44 AM 29
Time that would be needed to pay off all debt, ignoring the factors of interest, taxes, depreciation and amortization.
Measuring Long-term Illiquidity Risk (or Solvency R isk)
Profitability and Liquidity Risk Analysis Margin AnalysisReturn Analysis: ROIC (or ROCE) and the Operating P rofitabilityReturn Analysis: ROE and the Financial Profitabilit y Illiquidity risk: short and long-term ratios
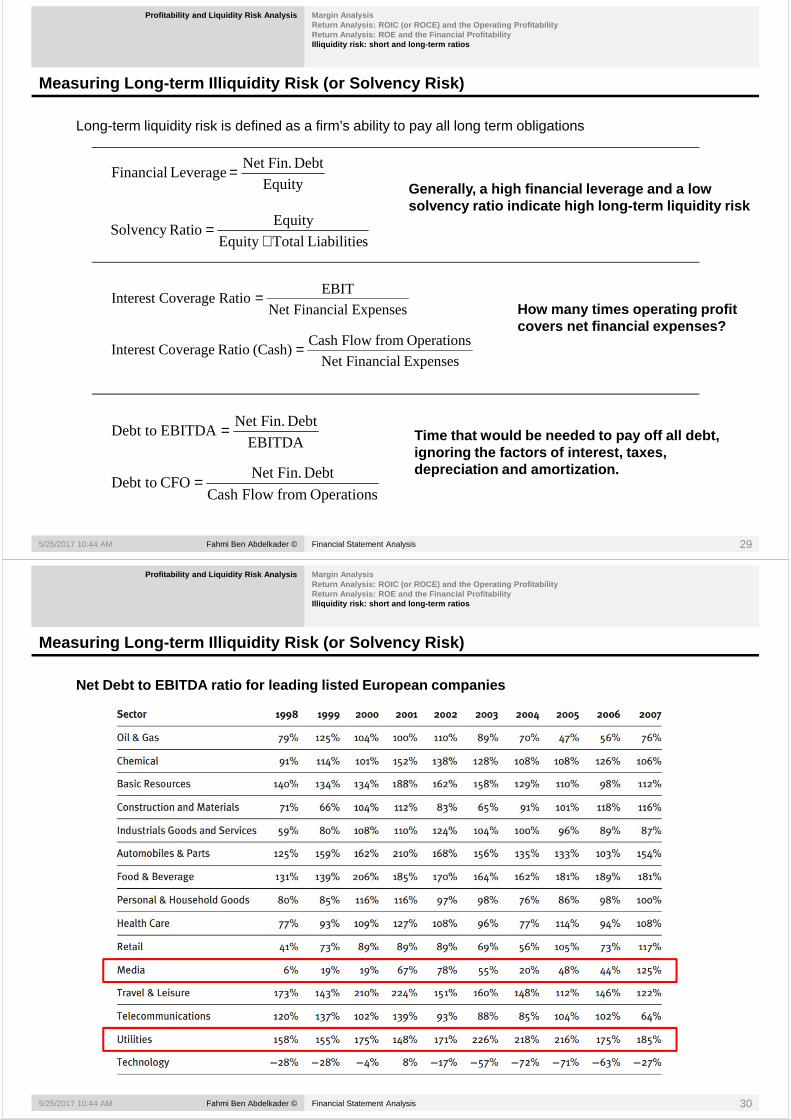
Net Debt to EBITDA ratio for leading listed Europea n companies
Fahmi Ben Abdelkader © Financial Statement Analysis5/25/2017 10:44 AM 30
Weaknesses of financial ratios measuring liquidity risk
Knowledge of a company's liquidity is important, as lack of liquidity may lead to loss of business opportunities and, in a worst case, suspension of payments
Margin AnalysisReturn Analysis: ROIC (or ROCE) and the Operating P rofitabilityReturn Analysis: ROE and the Financial Profitabilit y Illiquidity risk: short and long-term ratios
Profitability and Liquidity Risk Analysis
Weaknesses of liquidity ratiosWeaknesses of liquidity ratios
Based on historical accounting information and, thus, backward-looking
Book value of assets is almost meaningless
Capital structure ratios at market value should make more sense than at book values but are very volatile
Liquidity ratios can be easily manipulated if the company knows that it is being analyzed:
Fahmi Ben Abdelkader © Financial Statement Analysis5/25/2017 10:44 AM 31
E.g. Interest or other financing costs can be shifted to the future
Bad liquidity ratios can be the result of good cash management
The Income Statement The Balance Sheet : An OverviewAssetsLiabilitiesShareholders’ Equity
1. When is it useful to define ROIC before and after tax, respectively?
2. A company experiences a drop in ROIC from 12% in year 1 to 5% in year 4. Provide potential explanations for the drop in ROIC of 7 percentage points.
Concept Check and Critical Thinking
Provide potential explanations for the drop in ROIC of 7 percentage points.
3. What is the appropriate benchmark for ROIC?
4. What actions can a management take to improve the profit margin?
5. What actions can the management take to improve the turnover rate of invested capital?
6. How does financial leverage affect the return to shareholders?
Fahmi Ben Abdelkader © Financial Statement Analysis5/25/2017 10:44 AM 32
7. What is the appropriate benchmark for ROE?
8. What are the potential shortcomings of financial ratios measuring liquidity risk?
9. How can these shortcomings be addressed?
The Income Statement The Balance Sheet : An OverviewAssetsLiabilitiesShareholders’ EquityAppendix
Some stories on margin trends
Fahmi Ben Abdelkader © Financial Statement Analysis5/25/2017 10:44 AM 33
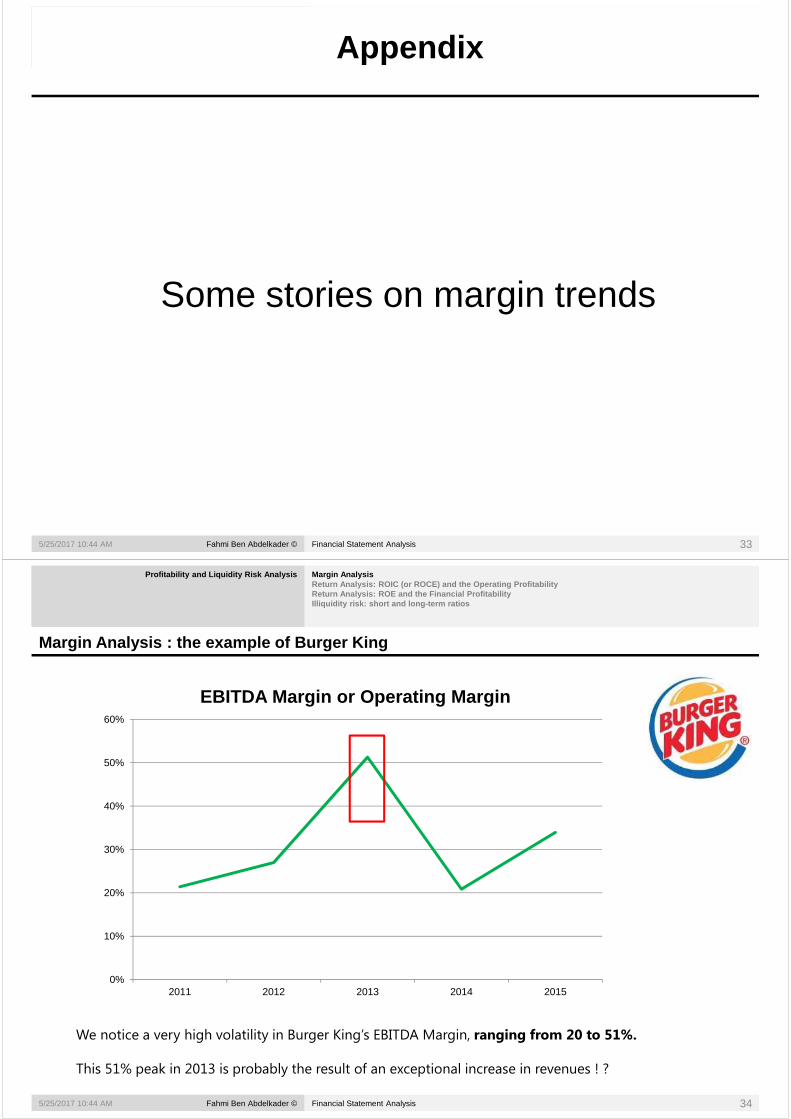
Margin Analysis : the example of Burger King
Profitability and Liquidity Risk Analysis Margin Ana lysisReturn Analysis: ROIC (or ROCE) and the Operating P rofitabilityReturn Analysis: ROE and the Financial Profitabilit y Illiquidity risk: short and long-term ratios
60%
EBITDA Margin or Operating Margin
20%
30%
40%
50%
Fahmi Ben Abdelkader © Financial Statement Analysis5/25/2017 10:44 AM 34
0%
10%
2011 2012 2013 2014 2015
We notice a very high volatility in Burger King’s EBITDA Margin, ranging from 20 to 51%.
This 51% peak in 2013 is probably the result of an exceptional increase in revenues ! ?
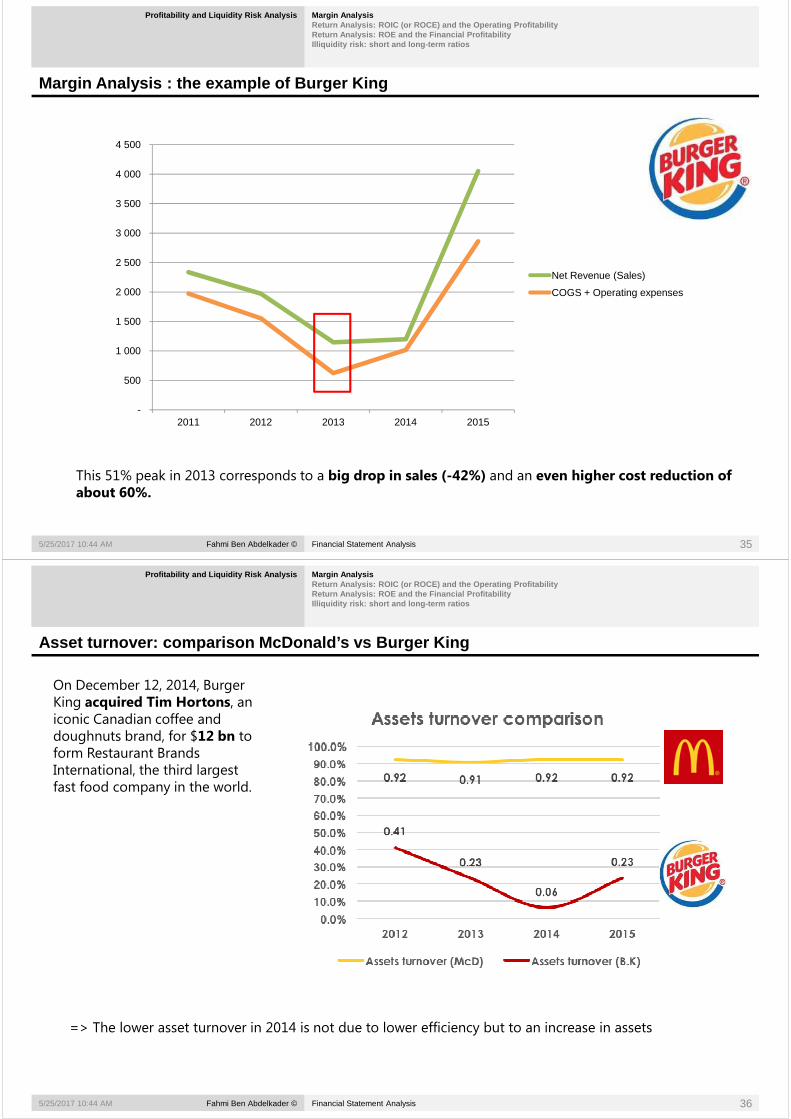
Margin Analysis : the example of Burger King
Profitability and Liquidity Risk Analysis Margin Ana lysisReturn Analysis: ROIC (or ROCE) and the Operating P rofitabilityReturn Analysis: ROE and the Financial Profitabilit y Illiquidity risk: short and long-term ratios
4 000
4 500
1 000
1 500
2 000
2 500
3 000
3 500
Net Revenue (Sales)
COGS + Operating expenses
Fahmi Ben Abdelkader © Financial Statement Analysis5/25/2017 10:44 AM 35
-
500
2011 2012 2013 2014 2015
This 51% peak in 2013 corresponds to a big drop in sales (-42%) and an even higher cost reduction of about 60%.
Asset turnover: comparison McDonald’s vs Burger Kin g
Profitability and Liquidity Risk Analysis Margin Ana lysisReturn Analysis: ROIC (or ROCE) and the Operating P rofitabilityReturn Analysis: ROE and the Financial Profitabilit y Illiquidity risk: short and long-term ratios
On December 12, 2014, Burger King acquired Tim Hortons, an iconic Canadian coffee and doughnuts brand, for $12 bn to form Restaurant Brands form Restaurant Brands International, the third largest fast food company in the world.
Fahmi Ben Abdelkader © Financial Statement Analysis5/25/2017 10:44 AM 36
=> The lower asset turnover in 2014 is not due to lower efficiency but to an increase in assets
The Income Statement The Balance Sheet : An OverviewAssetsLiabilitiesShareholders’ EquityAppendix
Value added and Residual income
Fahmi Ben Abdelkader © Financial Statement Analysis5/25/2017 10:44 AM 37
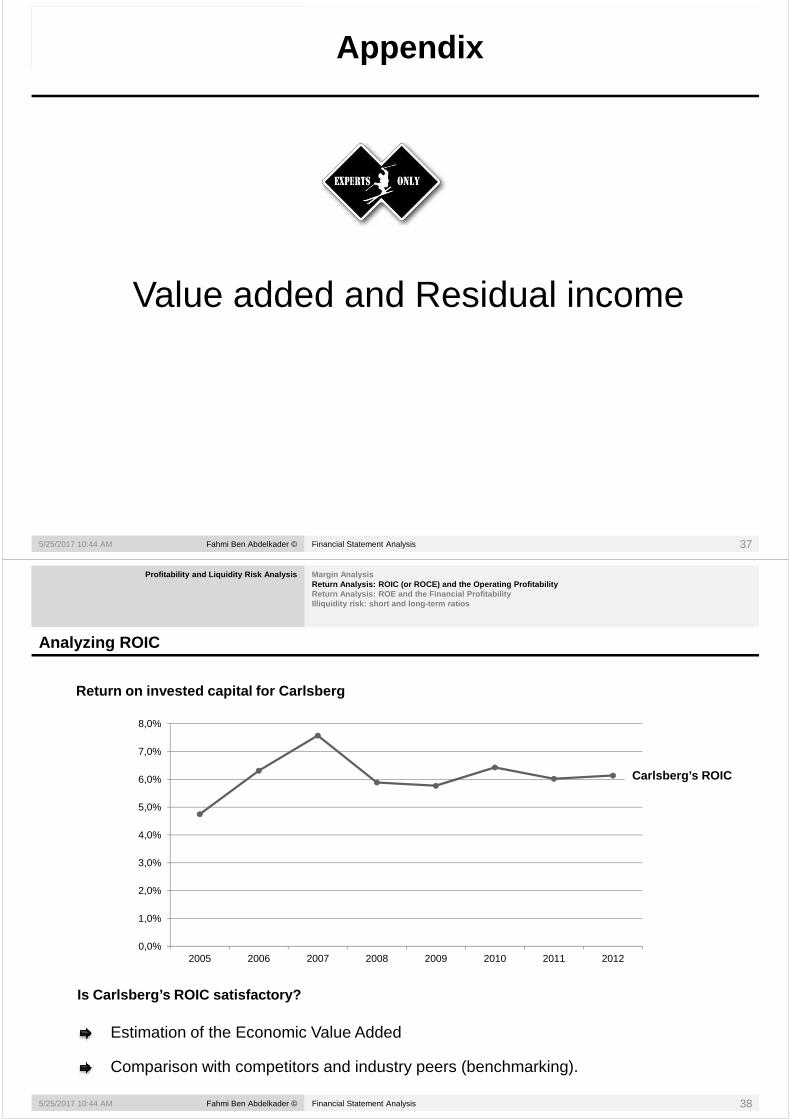
Analyzing ROIC
Profitability and Liquidity Risk Analysis Margin AnalysisReturn Analysis: ROIC (or ROCE) and the Operating P rofitabilityReturn Analysis: ROE and the Financial Profitabilit y Illiquidity risk: short and long-term ratios
Return on invested capital for Carlsberg
7,0%
8,0%
1,0%
2,0%
3,0%
4,0%
5,0%
6,0%
7,0%
Carlsberg’s ROIC
Fahmi Ben Abdelkader © Financial Statement Analysis5/25/2017 10:44 AM 38
Is Carlsberg’s ROIC satisfactory?
Estimation of the Economic Value Added
Comparison with competitors and industry peers (benchmarking).
0,0%2005 2006 2007 2008 2009 2010 2011 2012
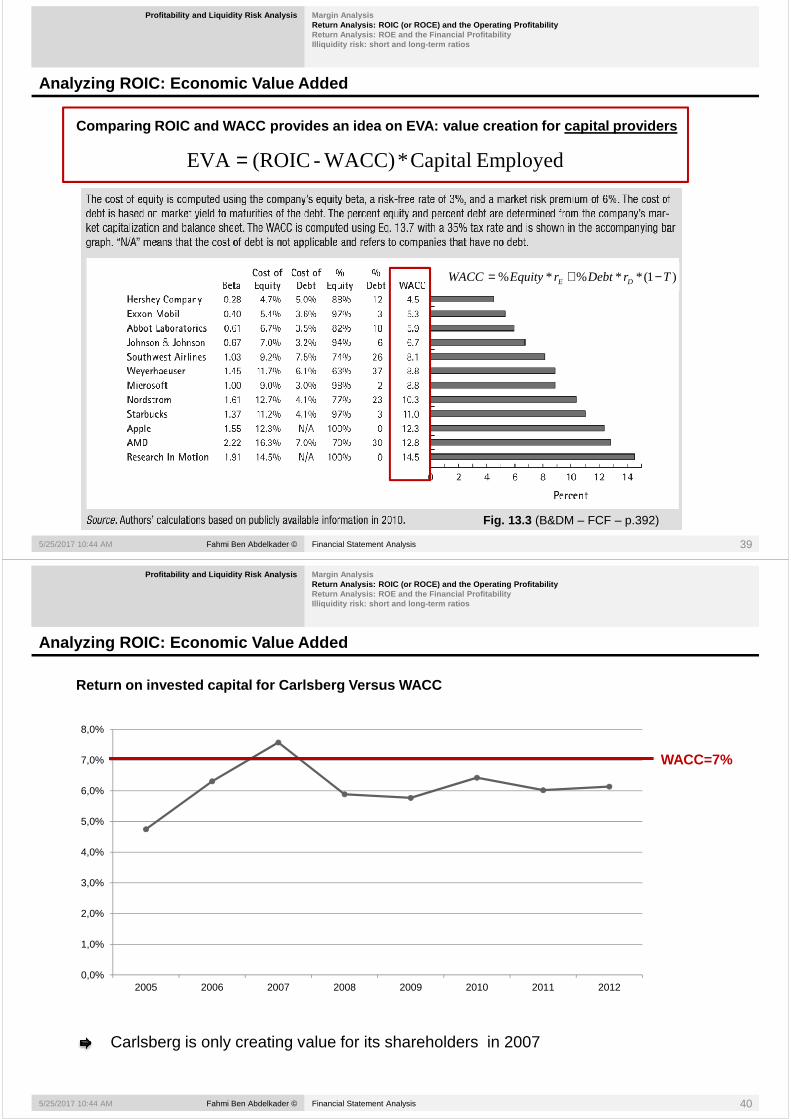
Analyzing ROIC: Economic Value Added
Profitability and Liquidity Risk Analysis Margin AnalysisReturn Analysis: ROIC (or ROCE) and the Operating P rofitabilityReturn Analysis: ROE and the Financial Profitabilit y Illiquidity risk: short and long-term ratios
Comparing ROIC and WACC provides an idea on EVA: va lue creation for capital providers
Employed Capital*WACC)-(ROICEVA =
)1(**%*% TrDebtrEquityWACC DE −+=
Fahmi Ben Abdelkader © Financial Statement Analysis5/25/2017 10:44 AM 39
Fig. 13.3 (B&DM – FCF – p.392)
Analyzing ROIC: Economic Value Added
Profitability and Liquidity Risk Analysis Margin AnalysisReturn Analysis: ROIC (or ROCE) and the Operating P rofitabilityReturn Analysis: ROE and the Financial Profitabilit y Illiquidity risk: short and long-term ratios
Return on invested capital for Carlsberg Versus WAC C
8,0%
2,0%
3,0%
4,0%
5,0%
6,0%
7,0% WACC=7%
Fahmi Ben Abdelkader © Financial Statement Analysis5/25/2017 10:44 AM 40
Carlsberg is only creating value for its shareholders in 2007
0,0%
1,0%
2005 2006 2007 2008 2009 2010 2011 2012
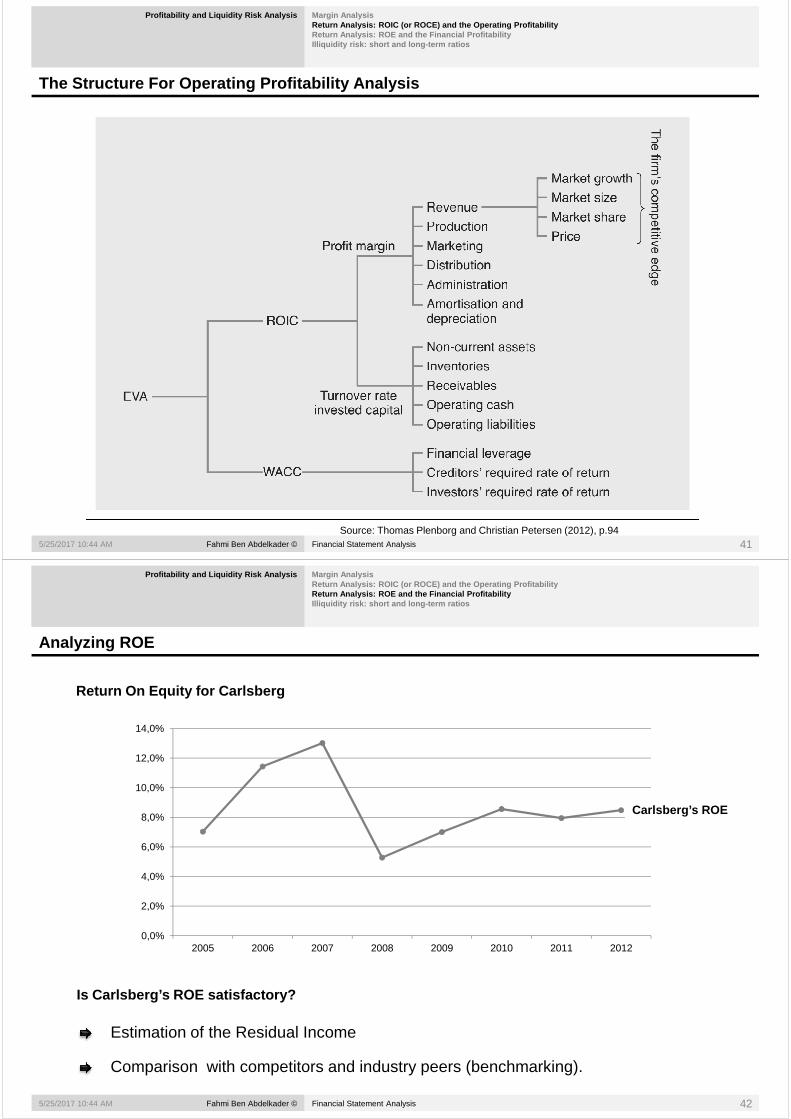
The Structure For Operating Profitability Analysis
Profitability and Liquidity Risk Analysis Margin AnalysisReturn Analysis: ROIC (or ROCE) and the Operating P rofitabilityReturn Analysis: ROE and the Financial Profitabilit y Illiquidity risk: short and long-term ratios
Market growth
Market size
Market shareRevenue
Market share
Price
Administration
Amortisation and
depreciation
Non-current assets
Inventories
ReceivablesTurnover rate
Profit Margin
ROIC
Production
Marketing
Distribution
Revenue
Fahmi Ben Abdelkader © Financial Statement Analysis5/25/2017 10:44 AM 41
Operating cash
Operating liabilities
Turnover rateInvested capital
EVA
WACC
Financial leverage
Creditors’ required rate of return
Investors’ required rate of return
Source: Thomas Plenborg and Christian Petersen (2012), p.94
Analyzing ROE
Profitability and Liquidity Risk Analysis Margin AnalysisReturn Analysis: ROIC (or ROCE) and the Operating P rofitabilityReturn Analysis: ROE and the Financial Profitabilit y Illiquidity risk: short and long-term ratios
Return On Equity for Carlsberg
14,0%
2,0%
4,0%
6,0%
8,0%
10,0%
12,0%
Carlsberg’s ROE
Fahmi Ben Abdelkader © Financial Statement Analysis5/25/2017 10:44 AM 42
Is Carlsberg’s ROE satisfactory?
Estimation of the Residual Income
Comparison with competitors and industry peers (benchmarking).
0,0%2005 2006 2007 2008 2009 2010 2011 2012
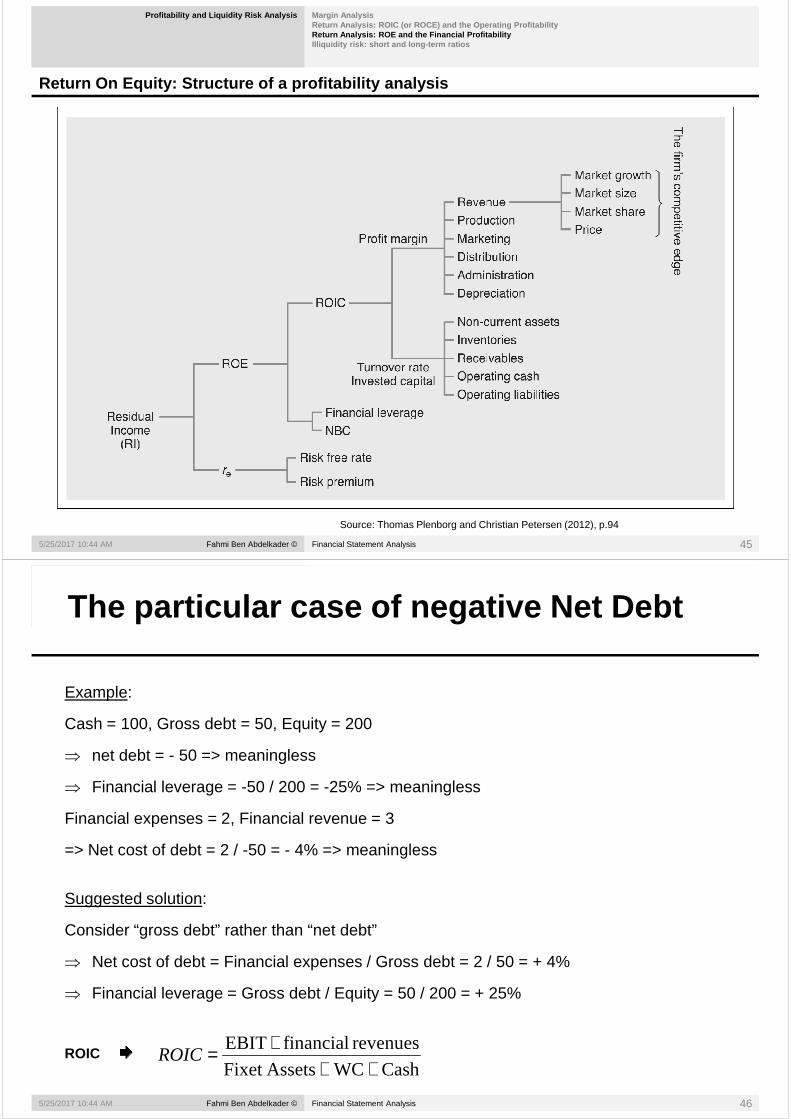
Analyzing ROE: Residual Income = Value added for ow ners = Owners’ Economic Profit
Profitability and Liquidity Risk Analysis Margin AnalysisReturn Analysis: ROIC (or ROCE) and the Operating P rofitabilityReturn Analysis: ROE and the Financial Profitabilit y Illiquidity risk: short and long-term ratios
Comparing ROE and re provides an idea on Residual Income : value creatio n for shareholders
Equity*)r-(ROEIncome Residual e= e
premiumrisk Market *β+= fE rr
Fahmi Ben Abdelkader © Financial Statement Analysis5/25/2017 10:44 AM 43Fig. 13.3 (B&DM – FCF – p.392)
Analyzing ROE: Residual Income = Value added for ow ners = Owners’ Economic Profit
Profitability and Liquidity Risk Analysis Margin AnalysisReturn Analysis: ROIC (or ROCE) and the Operating P rofitabilityReturn Analysis: ROE and the Financial Profitabilit y Illiquidity risk: short and long-term ratios
Return On Equity for Carlsberg Versus Required Retu rn on Equity (Equity Cost of Capital)
14,0%
re=10%
2,0%
4,0%
6,0%
8,0%
10,0%
12,0%
Carlsberg’s ROE
Fahmi Ben Abdelkader © Financial Statement Analysis5/25/2017 10:44 AM 44
Carlsberg is only creating value for its shareholders in 2006 and 2007
0,0%2005 2006 2007 2008 2009 2010 2011 2012
Return On Equity: Structure of a profitability anal ysis
Profitability and Liquidity Risk Analysis Margin AnalysisReturn Analysis: ROIC (or ROCE) and the Operating P rofitabilityReturn Analysis: ROE and the Financial Profitabilit y Illiquidity risk: short and long-term ratios
Fahmi Ben Abdelkader © Financial Statement Analysis5/25/2017 10:44 AM 45
Source: Thomas Plenborg and Christian Petersen (2012), p.94
The Income Statement The Balance Sheet : An OverviewAssetsLiabilitiesShareholders’ Equity
Example:
Cash = 100, Gross debt = 50, Equity = 200
⇒ net debt = - 50 => meaningless
The particular case of negative Net Debt
⇒ net debt = - 50 => meaningless
⇒ Financial leverage = -50 / 200 = -25% => meaningless
Financial expenses = 2, Financial revenue = 3
=> Net cost of debt = 2 / -50 = - 4% => meaningless
Suggested solution:
Consider “gross debt” rather than “net debt”
Fahmi Ben Abdelkader © Financial Statement Analysis5/25/2017 10:44 AM 46
Consider “gross debt” rather than “net debt”
⇒ Net cost of debt = Financial expenses / Gross debt = 2 / 50 = + 4%
⇒ Financial leverage = Gross debt / Equity = 50 / 200 = + 25%
ROICCash WC AssetsFixet
revenues financialEBIT
+++=ROIC