Embed Size (px)
Citation preview
Private Equity Placements and the Illiquidity Discount*
Rahsan Bozkurt Inget
Krannert Graduate School of Management Purdue University
West Lafayette, IN 47907 [email protected]
http://web.ics.purdue.edu/~rbozkurt
October 2009
Abstract This paper presents evidence on the private placement discounts for a large sample of private placement transactions completed by public companies between 2002 and 2007. Using detailed information about the restriction duration for the unregistered common stocks placed, I analyze whether the lack of liquidity of unregistered shares has an impact on the issue discounts. My results suggest that illiquidity is not priced into private placement discounts. Consistent with the previous literature, I find that revenues and intangible assets of the issuer and the size of the placement have a significant impact on the issue discounts.
* This paper has significantly benefited from suggestions of John McConnell and David Denis. I thank Laura Frieder and Spring-2007 MGMT 617 seminar participants for helpful comments. I also thank Sagient Research for providing the private placement data. All errors are mine.

1. Introduction
Over the last few years along with the rise of the private equity markets, the use of private equity
placements by publicly traded companies has exploded. Sagient Research reports that the number and size
of the private placement transactions by public companies increase from 114 and $1.3 billion in 1995 to
1,336 and $28 billion in 2006, respectively. It is well documented in the literature that private equity in
publicly held firms is on average issued at a substantial discount relative to the market price1. Often in
practice it is believed that discounts on private placements reflect the illiquidity of these securities.
Therefore, aside from their recent increasing economic importance, private placements of common stock
are used widely to estimate marketability discounts in practice, especially in legal settings.
Private placement is private sale of securities by a public company to a select group of individuals
or institutions (sophisticated investors and accredited institutions). Private placements of common stock
can be broadly categorized into three: Regulation D offerings, Regulation S offerings and registered direct
offerings. Registered direct offerings are private placements that require a registration statement to be
effective at the closing of the deal whereas securities that are issued under Regulation D and Regulation S
are essentially unregistered securities and are subject to resale limitations. Therefore, unregistered shares
are sometimes called restricted shares. I use unregistered and restricted interchangeably in this paper.
Private placements, most of the time, entail offering of unregistered securities. Buyers of these securities
can sell these securities to other sophisticated investors; however, they can not resell these securities to
public until a registration statement has been filed with SEC and declared effective. After this mandatory
holding period (restriction period)2, only limited amounts of shares can be sold to public on open markets.
Private equity offerings are characterized by the simple issue process, the significant issue
discounts, and positive short-run abnormal returns. Privately placed securities are often issued at a
discount from the exchange price and private placement of equity entails a considerably simpler issue
1 Bajaj et al (2001) reports an average (median) discount of 22.21% (20.67%) for private equity placements between 1990 and 1995. In a sample of high-tech firms, Wu (2004) finds a discount of 8.7% (19.4%) at mean (median), and for their sample, Hertzel and Smith (1993) report an average (median) discount of 20.14% (13.25%). 2 SEC has relaxed the holding period over time, from 3 years to 2 years in 1995 and to 1 year in 1997.
2

process than the public sale. Companies can avoid the time, expense and disclosure requirements of filing
a registration statement. Private placements may also have an impact on the resulting ownership of the
issuing company because large blocks of securities are placed with a few sophisticated investors.
In this paper, I analyze private placement discounts to investigate if there is any discount
associated with lack of liquidity stemming from the resale restrictions. Several previous studies suggest
that illiquidity is among the factors that contribute to the private placement discounts and provide indirect
empirical evidence whereas others argue that there is a market for unregistered shares and that registration
status does little to explain the private placement discounts. The analyses in this paper provide evidence
consistent with the latter. After controlling for the issuer and deal characteristics that have been
documented to affect the private placement discounts, I find that restriction period for the unregistered
shares does not have a significant impact on private placement discounts. For my analyses, I use a large
sample of private equity placements of common stock by publicly traded companies. My data set includes
detailed information about the filing dates for the registration statements and the dates these statements
are declared effective, allowing me to directly estimate the impact of the restriction duration on the
discounts.
To the best of my knowledge this study uses the most recent data and a sample with a more
extensive coverage of the private placements compared to previous studies. Prior studies construct their
samples using a key word search in the Dow Jones News Retrieval Service, Lexis-Nexis, company proxy
statements and 10-K reports or retrieve the data from the SDC database. They distinguish between
registered equity sales and unregistered equity sales at the time of the offering, but they do not have the
information about the time period between completion of the offering and the filing for the registration
statement and also the time period between the filing and when the registration statement becomes
effective. A company may choose to file for registration right after the offering and complete the
registration process in less than a month, essentially reducing the restriction period substantially, while
some other company may choose not to file the registration statement at all. So, failing to distinguish
3
between these placements may produce misleading results in a study that analyzes the effect of
marketability on discounts.
2. Background and related literature
Prior research has documented that private equity in publicly held firms is on average offered at a
substantial discount relative to the market price. It also provides several explanations and evidence as to
what the determinants of this discount are. Among the most accepted and studied hypotheses are
monitoring (Wruck, 1989), certification (Hertzel and Smith, 1983), management entrenchment (Barclay
et al, 2007 and Wu, 2004) and illiquidity hypotheses (Silber, 1991 and Bajaj et al, 2001).
In private equity offerings, most of the time large blocks of securities are placed with a few
sophisticated investors, leading to a more concentrated ownership in issuing company. According to the
monitoring hypothesis, private placement discounts reflect the compensation to the purchasers of stock
for monitoring and expert advice. Certification hypothesis of Hertzel and Smith (1993) argues that private
placements are used by firms that have higher information asymmetries to signal undervaluation and issue
discounts reflect the compensation to the private investors for information acquisition costs. Under
management entrenchment hypothesis, private placements allow managers to expropriate shareholders by
entrenching themselves or by purchasing at low prices. In their paper, Barclay et al (2007) compare these
three hypotheses and find evidence supporting the entrenchment hypothesis.
Another explanation advanced for price difference between the restricted shares and the shares
traded in the market is the compensation demanded by the investors for the lack of liquidity of the
restricted shares. Liquidity seems to be important in a wide range of markets and is valued by investors.
However the role and importance of liquidity has been a puzzle for researchers. Private placements
provide a setting to measure the importance of liquidity on the cost of equity capital. Privately placed
shares and publicly traded shares give their holders claim to the same underlying asset. They are identical
except that private placements involve fewer buyers and resale limitations on the securities.
4

Silber (1991), in his paper, examines the issue discounts on restricted stocks using a sample of
private placements by public companies and concludes that liquidity has a significant impact on the cost
of equity capital. Silber argues that the private placement discount varies with the issuing firm and issue
characteristics. He hypothesizes that creditworthiness and cash flows of the issuer, special provisions
given to the buyers, and marketability of the offered shares affect the private placement discounts. He
predicts that buyers demand less compensation, that is, the discounts are lower (in absolute terms) when
the issuer is more creditworthy and has higher cash flows, when placed shares are more marketable and
when there are special relationships (customer relations or board representation) between the buyer and
the issuer. He finds that private placements of firms with higher revenues, higher earnings, and higher
market capitalization are associated with lower discounts. He also finds that discounts are lower when
there is a customer-relationship between the company and the investors. His results indicate that as the
fraction of shares placed increases the buyers pay less per share. He concludes that his results support the
illiquidity hypotheses since even the creditworthy firms need to offer larger discounts to market a larger
fraction of restricted shares.
Bajaj et al (2001) is another paper that studies the effect of registration status on restricted stock
discounts. In their paper, they review several methods that are used to estimate valuation discounts for
assets that are not readily marketable. They discuss restricted stock approach as one of these methods and
present an analysis of the private placement discounts. They provide regression analysis of private
placement discounts on several explanatory variables including fraction of shares issued, z-score of the
issuer, and the registration status of the shares. They document that registration status significantly affects
the issue discounts. Also consistent with Silber (1991), they find a statistically significant relationship
between the discounts and the fraction of shares placed. So, as fraction of shares issued goes up, restricted
stock discount also goes up.
On the other hand, Barclay et al (2007) suggest that it is unlikely that the private placement
discounts reflect the compensation for illiquidity. They argue that since the shares are placed with
sophisticated investors who have substantial portfolios of financial assets, any given private placement
5
would constitute a small portion of these investors’ portfolios. They also argue that lack of liquidity of
restricted shares does not have a significant effect on private placement discounts because there is an
active market among sophisticated investors for the unregistered securities. Moreover, they note that
companies can register their outstanding unregistered stock at any time with very low costs relative to the
issue discounts. Finally, as evidence against the illiquidity hypothesis, they state that although the
limitations on the sale of unregistered securities have changed over time, there is no significant variation
in private placements discounts between different periods.
Wu (2004) also analyzes private placement discount in a sample of technology firms and does not
find that restriction status has a significant impact on the discounts. She finds that issue discounts are
slightly smaller for registered private placements than for restricted private placements. In her
multivariate analysis of the determinants of private placement discounts, she controls for restriction status
and does not find restriction status to be a significant determinant3. She also looks at the difference
between the mean (median) restricted stock discount in 1986-1995 and 1996-1997. In 1995 the restriction
period has been reduced from 3 years to 2 years. Her results indicate that in her sample this difference is
not statistically significant.
3. Sample selection and data description
The initial sample contains 2,793 private equity placements of common stock completed between
January 2002 and August 2007 by 1,833 public companies that operate in U.S. This sample is provided
to me by Sagient Research. Sagient Research offers detailed coverage of the private investments in public
entities (PIPE). The information provided for this study by Sagient Research can be listed as follows: i)
Information about the offerings such as announcement date of placement, closing date of placement, gross
proceeds (size of the offering), offering price, issue discount (at closing and at announcement), shares
issued, warrant coverage, placement agent (if any). ii) Information about the registration status: Filing
3 The coefficient of the registration status is significant in one sub-sample, the sample that includes placements with positive discount only.
6
date if a registration statement for the placed shares has been filed with SEC, effectiveness date if the
registration has become effective, number of days between the closing and the filing, and the number of
days between the closing and the effectiveness. iii) Information about the issuing company: industry and
market price of share at closing.
The accounting data and the rest of the price data come from CRSP and Compustat. I perform the
first regression analysis using the initial sample. However, since accounting data is needed for the
multivariate analyses, I restrict these analyses to firms with available accounting and price data on
Compustat and CRSP the year prior to the placement. Moreover, I exclude the placements of shares other
than ordinary common shares (CRSP share codes 10 and 11) and the placements by financial and utility
companies. After filtering based on the data availability, the sample size reduces to 1,125 placements. I
call this the final sample. Nevertheless, the sample size may change for different analyses depending on
the availability of the data items used in those analyses.
Sagient Research reports two different issue discounts, discount at closing and discount at
announcement. Issue discount is defined as offering price less market price as a percentage of the market
price. So, if the private placement share price is less than the market price, the issue discount will obtain a
negative value and if the shares are offered at a premium to the market price, the issue discount will
obtain a positive value. To distinguish the placements that involve shares offered below the market price
from all other placements, I will call the former negative issue discount group and the latter non-negative
issue discount group. Discount at closing (announcement) is computed using the share price at the closing
(announcement) of the placement. The announcement date information is not available for any of the
placements in 2002, for most of them in 2003 and for a few in 2004. Since the closing date information is
available for all the placements, I use issue discounts at closing in my analyses4 and I will refer to this
discount in the analyses.
4 Hertzel and Smith (1993) use the stock price ten trading days after the announcement to allow the price to reflect any information contained in the announcement. In my sample, announcement date may come before or after the closing date; there is no systematic pattern.
7
In the initial sample, 2,198 of the placements involve a negative issue discount, that is, offering
share price is less than the exchange share price while 595 placements involve a non-negative issue
discount, that is, offering share price is greater than or equal to the market price. The final sample (1,125
private placements) includes 240 deals with non-negative issue discounts and 885 deals with negative
discounts.
Table 1 reports the time profile for private placements of common stock in the initial sample. The
number of offerings completed per year increases from 319 in 2002 to 614 in 2004 before it decreases to
just above 500 deals and, then, it seems to stay above 500. Since the data I have ends in August 2007, the
number for 2007 does not reflect the total number for that year. Silber (1991) notes that SDC reports 310
private placements between 1981 and 1988. The difference might be due to both the recent increase in
private offerings and more extensive coverage by Sagient Research. Table 2 gives the industry profile for
the final sample of private placements. We see concentration in certain industries, especially in
technology and pharmaceuticals. These industries are characterized by high growth opportunities and
higher informational asymmetries.
Rest of the summary statistics is presented in table 3. Panel A gives the summary statistics for all
the placements in the final sample. Typical issuing company is fairly small with $66 million market value
of equity and $29 million total assets. Median (mean) EBITDA and net income for the issuing companies
are negative. If we look at the deal characteristics, median (mean) size of a private placement is $8
millions ($18 millions). Issue discounts as a percentage of the market price at the closing are 9.38%
(11.48%) at mean (median). The discounts range from -80% to more than 1000%. Fraction of common
shares offered5 in the placements is 19.75% (12.70%) at mean (median). On average companies file for
registration 34 days after the completion of the offering and the registration statement is declared
effective 82 days after the completion. If the issuing firm does not file the registration statement with
SEC, mandatory holding period for the shares is 1 year. However, data show that in an average private
5 These percentages do not account for warrants. Private placement contract often include stock warrants in addition to the common shares offered.
8
placement restricted shares become registered in less than three months. Panel B and C report the
summary statistics for the negative discount and non-negative discount groups separately.
The summary statistics indicate that private equity offerings are concentrated in certain industries
and typically used by small firms and firms with high market-to-book values, which are characterized by
high informational asymmetries. We also see that on average issuers of private equity have fairly high
leverage and negative earnings. These statistics imply that firms in financial distress tend to choose
private equity offerings as an equity-selling mechanism.
4. Empirical Analysis
In this section I present univariate and multivariate analyses of the private placement discounts
and, specifically, the analysis of the effect of the restriction duration on the private placement discounts.
Several studies examine the determinants of the private placement discount and investigate whether
registration status is a significant factor. Most of these studies look at the differences in discounts between
the placements of registered stock and the placements of unregistered (restricted) stock. If the discounts in
the unregistered stock group are significantly higher (in absolute terms) than the discounts in the
registered stock group, this is interpreted as compensation to investors for the relative illiquidity of
restricted stocks. When measuring the difference in discounts between these two groups (registered and
unregistered), some studies account for the variability across issuer, buyer and deal characteristics while
some just compare the discounts between two groups without controlling for any other effects.
I start with univariate analysis of the issue discounts. The median discount for the whole sample
is -11.5%. So, in a typical private placement shares are offered at 88.5% of the market price. I divide the
sample into two groups as above the median and below the median and examine the variables between the
groups. Results of the univariate analysis are shown in table 4. FILDAYS is the number of days between
the closing date of the offering and the filing date of the registration statement. EFFDAYS is the number
of days between the offering and when the registration becomes effective. When we look at the ‘below
the median group’, where the issue discounts are less than -11.5%, we see that it takes slightly longer for
9
these companies to file for registration and for their shares to become registered. However, this difference
is not statistically significant. Consistent with the prior literature I find that earnings are lower, leverage is
higher and the size of the issue is higher in the group with higher discounts (issue discounts < -11.5%).
Unlike prior studies, this paper does not look at the difference in discounts between registered and
unregistered placements. This is because in my whole dataset of 2,793 placements, only 12 transactions
involve the sale of registered securities.
Illiquidity hypothesis predicts that the longer the shares stay unregistered, that is, the longer the
resale limitations are in effect, the higher the compensation demanded by buyers will be. Although mostly
unregistered shares are offered in the private placements and the holders of the unregistered stock have to
wait 1 year before they can sell these to the public, this is not the case many times. As we see in Table 3,
it takes on average 82 days for the privately placed unregistered shares to become registered. In private
placement contracts, there is often a covenant to provide registration of the shares within a prescribed
period. This implies that at the time of the offerings, investors have a notion of the expected restriction
duration.
In the rest of the paper, I test this prediction of the illiquidity hypothesis and report the results.
Table 5 gives the results of the OLS regression of the issue discount. Explanatory variables are the
number of days between the offering and the filing FILDAYS and the number of days between the
offering and when the registration statement becomes effective EFFDAYS. I enter these variables into the
regression together and separately. EFFDAYS has negative and significant coefficients whereas
FILDAYS has an insignificant negative coefficient when entered the regression alone and an insignificant
positive coefficient when entered along with EFFDAYS. According to the regression in column 2, for
each day the shares stay restricted, buyers expect to pay 0.028% less than the market price. If the
company choose not to register the shares at all and the buyers wait for a year, expected amount of
discount demanded due to lack of liquidity is 10.22%. However, these regressions do not control for year
and industry effects or for the variability in firm, deal, and buyer characteristics.
10
Table 6 and 7 represent the results of multivariate analyses of issue discounts. I run the regression
of issue discounts on the filing period FILDAYS and restriction period EFFDAYS along with other control
variables and industry and year fixed effects. The control variables used in the regressions are those
hypothesized by prior research as determinants of private placement discounts. The first group includes
private placement contract characteristics: size of the offering (gross proceeds) and fraction of shares
placed. The second group has variables that proxy for the costs investors incur to acquire information
about the firm value. These are size variables (market value of equity and total assets), R&D expense,
intangible assets, and book-to-market ratio. Next I add variables that proxy for the issuer’s financial
profile of the company. These are earnings dummy (takes the value 1 if the earnings are positive, 0
otherwise), ratio of interest expense to EBITDA (reverse coverage ratio), leverage, log of revenues, and
cash flows. To control for the effect of placement agents on the issue discounts, I use a dummy variable
that takes the value 1 when equity is placed through a placement agent. Finally, I control for year and
industry effects in all regressions.
Table 6 reports the results for the final sample of 1,125 placements while Table 7 reports the
results for the negative issue discount sample of 885 placements. In all regressions given in Table 6,
EFFDAYS has negative insignificant coefficients whereas FILDAYS has positive insignificant
coefficients. Including FILDAYS and EFFDAYS together or separately in the analysis does not change
the main results and the coefficients of these two variables stay insignificant. So, even before I include
any issuer and deal characteristics, EFFDAYS (the variable of interest) loses its significance when year
and industry is controlled for. When we look at the results for the negative discount sample in Table 7, we
see that EFFDAYS stay significant through the first three regressions. FILDAYS is again insignificant
everywhere. However, the significance of EFFDAYS goes away once I include the control variables for
the issuer characteristics in the fifth regression. In column 5, I add those variables that proxy for the
information acquisition costs. These are R&D, intangible assets, book-to-market ratio, and the size
variables total assets and market value of equity.
11

Results in Table 6 and 7 show that log of revenue is consistently significant. Intangible assets,
R&D expense, and gross proceeds also have significant coefficients for most of the time. As the dollar
size of the issue increases, the issue discount decreases in absolute terms (increases in real terms), that is,
investors pay more per share. Also, the discount decreases as the revenues of the issuer increases. These
are consistent with Silber (1991). He finds that firms in the high discount group are characterized by
smaller dollar size of the issue and lower revenues. Consistent with the certification hypothesis, I find that
shares are offered at higher discounts as the intangible assets of the firm increases. It is harder to assess
value of firms with higher intangible assets, so buyers incur higher information acquisition costs.
5. Tests of robustness
To test the robustness of my results, I repeat the regression analyses using different specifications.
I use log of issue discounts instead of issue discounts. I scaled issuer’s market value of equity, gross
proceeds, R&D expense, and intangible assets by total assets. I replace total assets with log of total assets.
None of these changes affects the main results. Barclay et al note that warrants are hard to evaluate, so I
exclude all the deals with warrants and repeat the analyses. Also keeping deals with warrants in the
sample, I run the regressions by using a dummy variable for the warrant coverage. Again I obtain similar
results. Finally, eliminating placements with extreme discounts from the sample does not change any of
the results.
6. Conclusion
This paper examines private placement discounts and investigates whether the resale limitations
of unregistered shares have an impact on the issue discount. Overall, the results suggest that illiquidity is
not priced into private placement discounts After controlling for the issuer and deal characteristics that
have been documented to affect the private placement discounts, I find that restriction period for the
unregistered shares is not a significant determinant of the private placement discounts. Consistent with the
12

previous literature, I find that revenues and intangible assets of the issuer and the size of the placement
have a significant effect on the issue discounts.
13
References:
Bajaj, Mukesh, David Denis, Stephen Ferris and Atulya Sarin, 2001, Firm value and marketability discounts, Journal of Corporation Law 27, 89-115. Barclay, Michael, Clifford Holderness, and Dennis Sheehan, 2006, Private placements and managerial entrenchment, Working Paper. Hertzel, Michael and Richard L. Smith, 1993, Market discounts and shareholder gains for placing equity privately, Journal of Finance 48, 459–486. Hertzel, Michael, Michael Lemmon, James S. Linck, and Lynn Rees, 2002, Long-run performance following private placements of equity, Journal of Finance 57, 2595-2617. Officer, Micah S., 2007, The price of corporate liquidity: Acquisition discounts for unlisted targets, Journal of Financial Economics 83, 571–598. Silber, William L., 1991, Discounts on restricted stock: The impact of illiquidity on stock prices, Financial Analysts Journal 47, 60–64. Wruck, Karen H., 1989, Equity ownership concentration and firm value: Evidence from private equity financings, Journal of Financial Economics 23, 3–27. Wu, YiLin, 2004, The choice of equity-selling mechanisms, Journal of Financial Economics 74, 93-119. Wu, YiLin, 2000, The choice between public and private equity offerings, Working Paper.
14
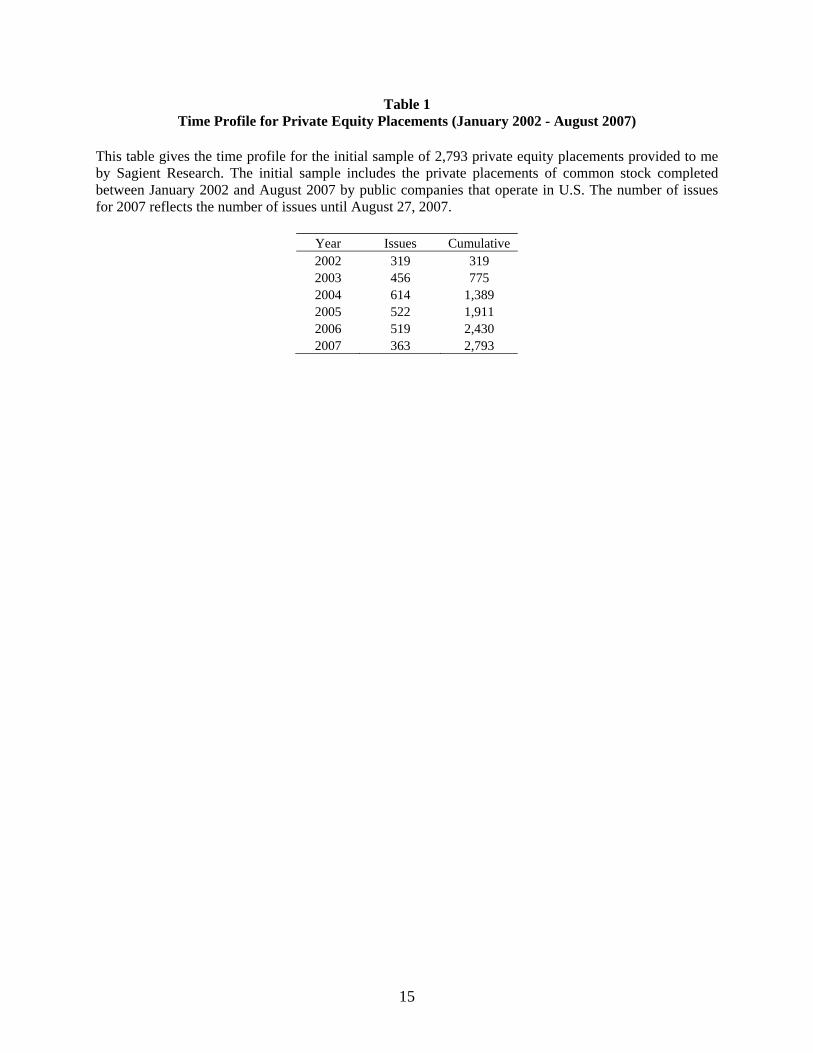
Table 1 Time Profile for Private Equity Placements (January 2002 - August 2007)
This table gives the time profile for the initial sample of 2,793 private equity placements provided to me by Sagient Research. The initial sample includes the private placements of common stock completed between January 2002 and August 2007 by public companies that operate in U.S. The number of issues for 2007 reflects the number of issues until August 27, 2007.
Year Issues Cumulative 2002 319 319 2003 456 775 2004 614 1,389 2005 522 1,911 2006 519 2,430 2007 363 2,793
15
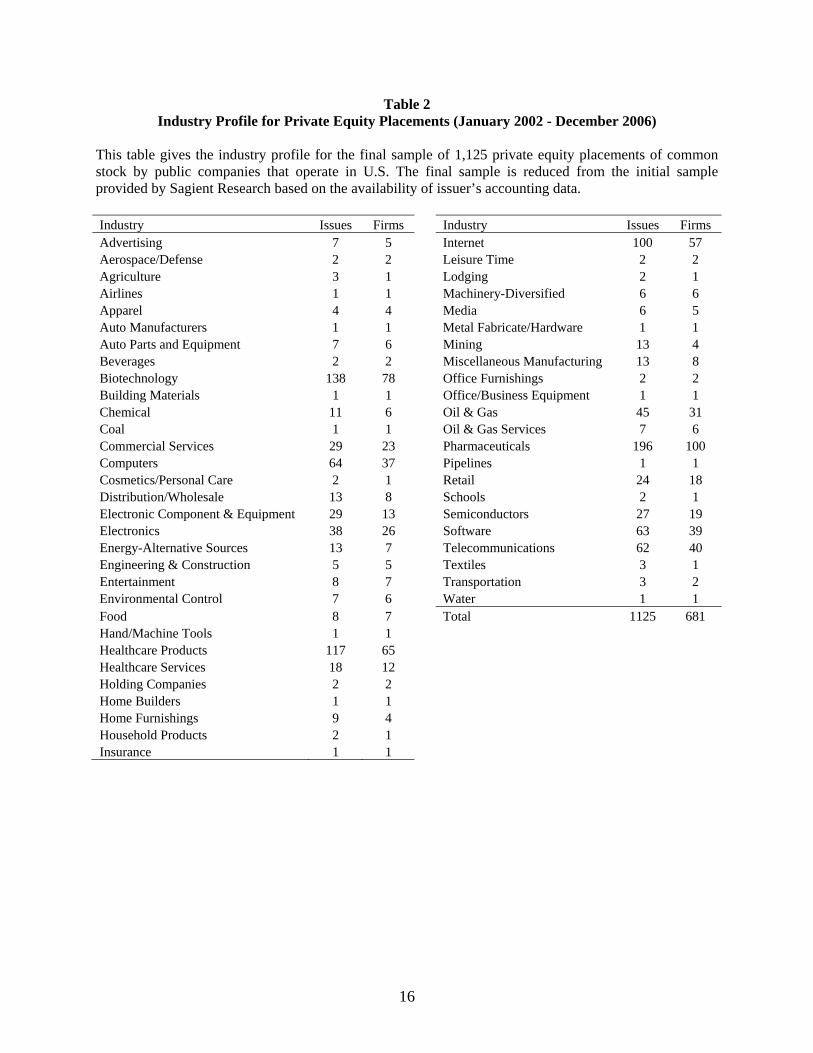
Table 2 Industry Profile for Private Equity Placements (January 2002 - December 2006)
This table gives the industry profile for the final sample of 1,125 private equity placements of common stock by public companies that operate in U.S. The final sample is reduced from the initial sample provided by Sagient Research based on the availability of issuer’s accounting data. Industry Issues Firms Industry Issues Firms Advertising 7 5 Internet 100 57 Aerospace/Defense 2 2 Leisure Time 2 2 Agriculture 3 1 Lodging 2 1 Airlines 1 1 Machinery-Diversified 6 6 Apparel 4 4 Media 6 5 Auto Manufacturers 1 1 Metal Fabricate/Hardware 1 1 Auto Parts and Equipment 7 6 Mining 13 4 Beverages 2 2 Miscellaneous Manufacturing 13 8 Biotechnology 138 78 Office Furnishings 2 2 Building Materials 1 1 Office/Business Equipment 1 1 Chemical 11 6 Oil & Gas 45 31 Coal 1 1 Oil & Gas Services 7 6 Commercial Services 29 23 Pharmaceuticals 196 100 Computers 64 37 Pipelines 1 1 Cosmetics/Personal Care 2 1 Retail 24 18 Distribution/Wholesale 13 8 Schools 2 1 Electronic Component & Equipment 29 13 Semiconductors 27 19 Electronics 38 26 Software 63 39 Energy-Alternative Sources 13 7 Telecommunications 62 40 Engineering & Construction 5 5 Textiles 3 1 Entertainment 8 7 Transportation 3 2 Environmental Control 7 6 Water 1 1 Food 8 7 Total 1125 681 Hand/Machine Tools 1 1 Healthcare Products 117 65 Healthcare Services 18 12 Holding Companies 2 2 Home Builders 1 1 Home Furnishings 9 4 Household Products 2 1 Insurance 1 1
16
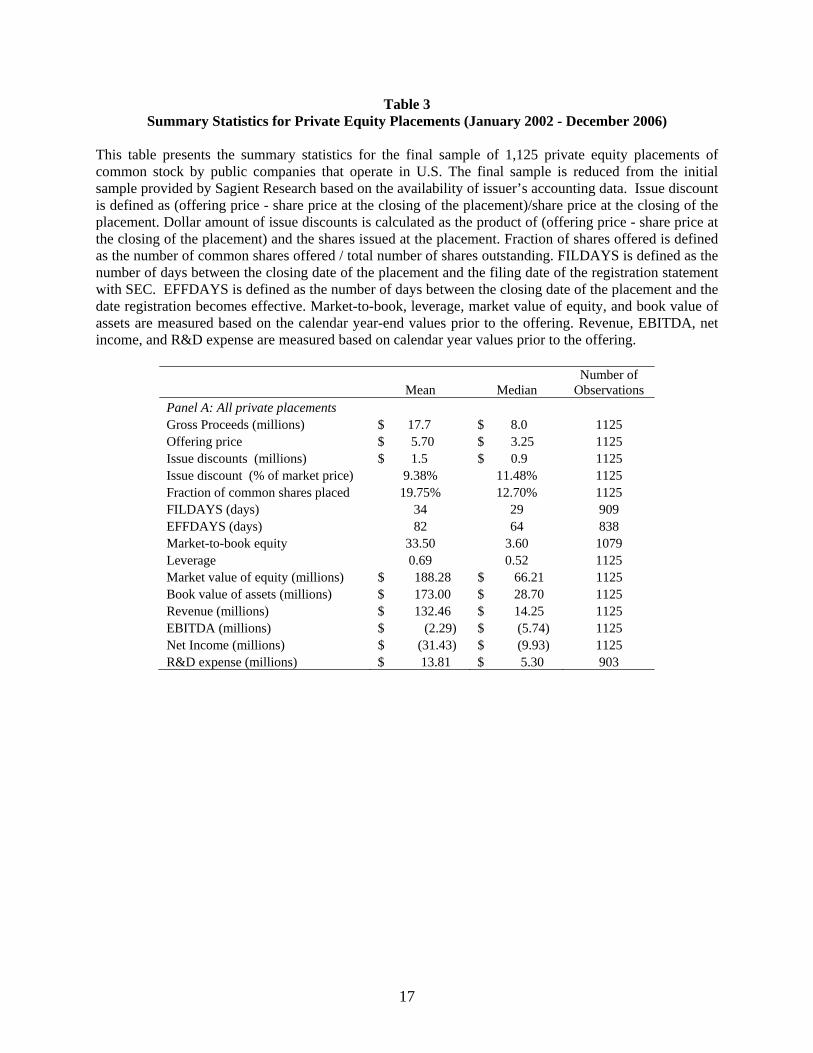
Table 3 Summary Statistics for Private Equity Placements (January 2002 - December 2006)
This table presents the summary statistics for the final sample of 1,125 private equity placements of common stock by public companies that operate in U.S. The final sample is reduced from the initial sample provided by Sagient Research based on the availability of issuer’s accounting data. Issue discount is defined as (offering price - share price at the closing of the placement)/share price at the closing of the placement. Dollar amount of issue discounts is calculated as the product of (offering price - share price at the closing of the placement) and the shares issued at the placement. Fraction of shares offered is defined as the number of common shares offered / total number of shares outstanding. FILDAYS is defined as the number of days between the closing date of the placement and the filing date of the registration statement with SEC. EFFDAYS is defined as the number of days between the closing date of the placement and the date registration becomes effective. Market-to-book, leverage, market value of equity, and book value of assets are measured based on the calendar year-end values prior to the offering. Revenue, EBITDA, net income, and R&D expense are measured based on calendar year values prior to the offering.
Mean Median Number of
Observations Panel A: All private placements Gross Proceeds (millions) $ 17.7 $ 8.0 1125 Offering price $ 5.70 $ 3.25 1125 Issue discounts (millions) $ 1.5 $ 0.9 1125 Issue discount (% of market price) 9.38% 11.48% 1125 Fraction of common shares placed 19.75% 12.70% 1125 FILDAYS (days) 34 29 909 EFFDAYS (days) 82 64 838 Market-to-book equity 33.50 3.60 1079 Leverage 0.69 0.52 1125 Market value of equity (millions) $ 188.28 $ 66.21 1125 Book value of assets (millions) $ 173.00 $ 28.70 1125 Revenue (millions) $ 132.46 $ 14.25 1125 EBITDA (millions) $ (2.29) $ (5.74) 1125 Net Income (millions) $ (31.43) $ (9.93) 1125 R&D expense (millions) $ 13.81 $ 5.30 903
17
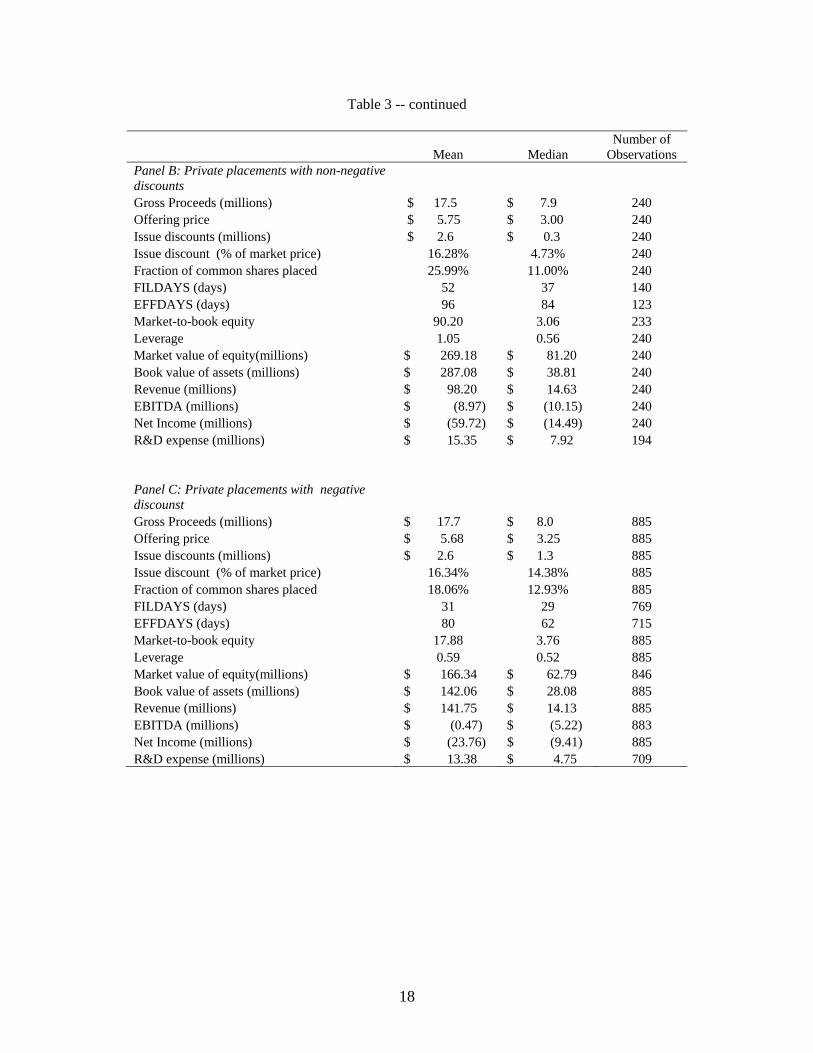
Table 3 -- continued
Mean Median Number of
Observations Panel B: Private placements with non-negative discounts Gross Proceeds (millions) $ 17.5 $ 7.9 240 Offering price $ 5.75 $ 3.00 240 Issue discounts (millions) $ 2.6 $ 0.3 240 Issue discount (% of market price) 16.28% 4.73% 240 Fraction of common shares placed 25.99% 11.00% 240 FILDAYS (days) 52 37 140 EFFDAYS (days) 96 84 123 Market-to-book equity 90.20 3.06 233 Leverage 1.05 0.56 240 Market value of equity(millions) $ 269.18 $ 81.20 240 Book value of assets (millions) $ 287.08 $ 38.81 240 Revenue (millions) $ 98.20 $ 14.63 240 EBITDA (millions) $ (8.97) $ (10.15) 240 Net Income (millions) $ (59.72) $ (14.49) 240 R&D expense (millions) $ 15.35 $ 7.92 194 Panel C: Private placements with negative discounst Gross Proceeds (millions) $ 17.7 $ 8.0 885 Offering price $ 5.68 $ 3.25 885 Issue discounts (millions) $ 2.6 $ 1.3 885 Issue discount (% of market price) 16.34% 14.38% 885 Fraction of common shares placed 18.06% 12.93% 885 FILDAYS (days) 31 29 769 EFFDAYS (days) 80 62 715 Market-to-book equity 17.88 3.76 885 Leverage 0.59 0.52 885 Market value of equity(millions) $ 166.34 $ 62.79 846 Book value of assets (millions) $ 142.06 $ 28.08 885 Revenue (millions) $ 141.75 $ 14.13 885 EBITDA (millions) $ (0.47) $ (5.22) 883 Net Income (millions) $ (23.76) $ (9.41) 885 R&D expense (millions) $ 13.38 $ 4.75 709
18
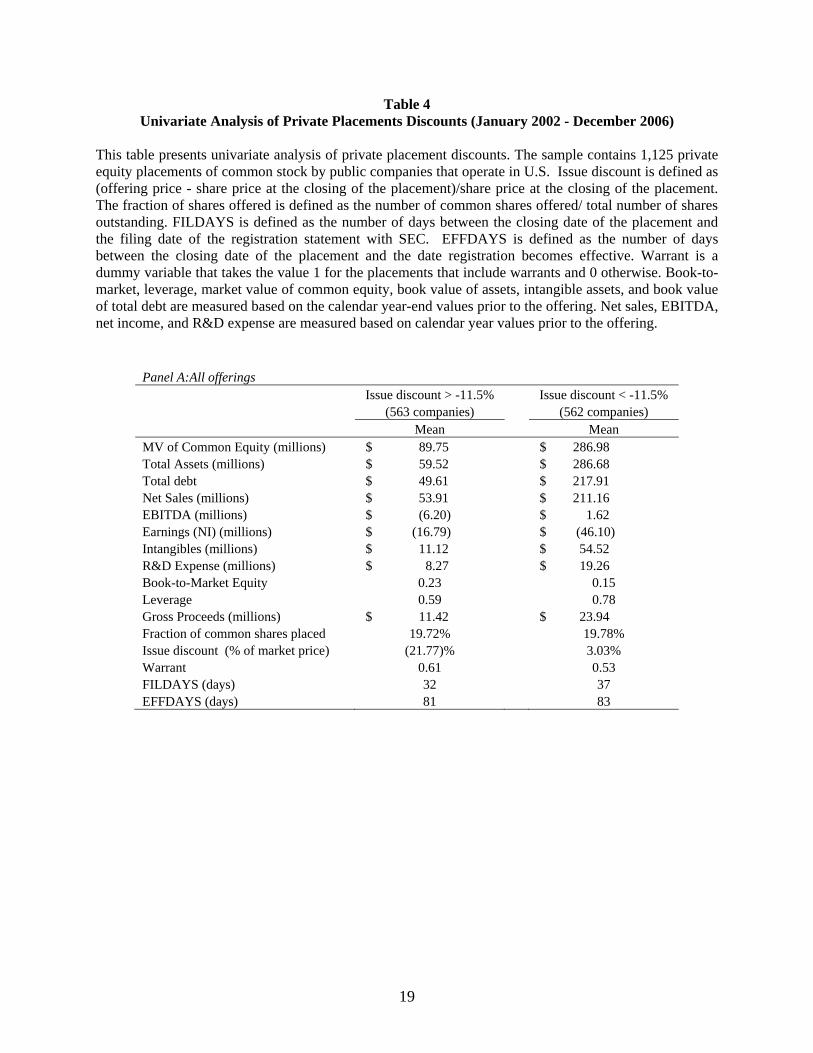
Table 4 Univariate Analysis of Private Placements Discounts (January 2002 - December 2006)
This table presents univariate analysis of private placement discounts. The sample contains 1,125 private equity placements of common stock by public companies that operate in U.S. Issue discount is defined as (offering price - share price at the closing of the placement)/share price at the closing of the placement. The fraction of shares offered is defined as the number of common shares offered/ total number of shares outstanding. FILDAYS is defined as the number of days between the closing date of the placement and the filing date of the registration statement with SEC. EFFDAYS is defined as the number of days between the closing date of the placement and the date registration becomes effective. Warrant is a dummy variable that takes the value 1 for the placements that include warrants and 0 otherwise. Book-to-market, leverage, market value of common equity, book value of assets, intangible assets, and book value of total debt are measured based on the calendar year-end values prior to the offering. Net sales, EBITDA, net income, and R&D expense are measured based on calendar year values prior to the offering.
Panel A:All offerings Issue discount > -11.5% Issue discount < -11.5% (563 companies) (562 companies) Mean Mean MV of Common Equity (millions) $ 89.75 $ 286.98 Total Assets (millions) $ 59.52 $ 286.68 Total debt $ 49.61 $ 217.91 Net Sales (millions) $ 53.91 $ 211.16 EBITDA (millions) $ (6.20) $ 1.62 Earnings (NI) (millions) $ (16.79) $ (46.10) Intangibles (millions) $ 11.12 $ 54.52 R&D Expense (millions) $ 8.27 $ 19.26 Book-to-Market Equity 0.23 0.15 Leverage 0.59 0.78 Gross Proceeds (millions) $ 11.42 $ 23.94 Fraction of common shares placed 19.72% 19.78% Issue discount (% of market price) (21.77)% 3.03% Warrant 0.61 0.53 FILDAYS (days) 32 37 EFFDAYS (days) 81 83
19
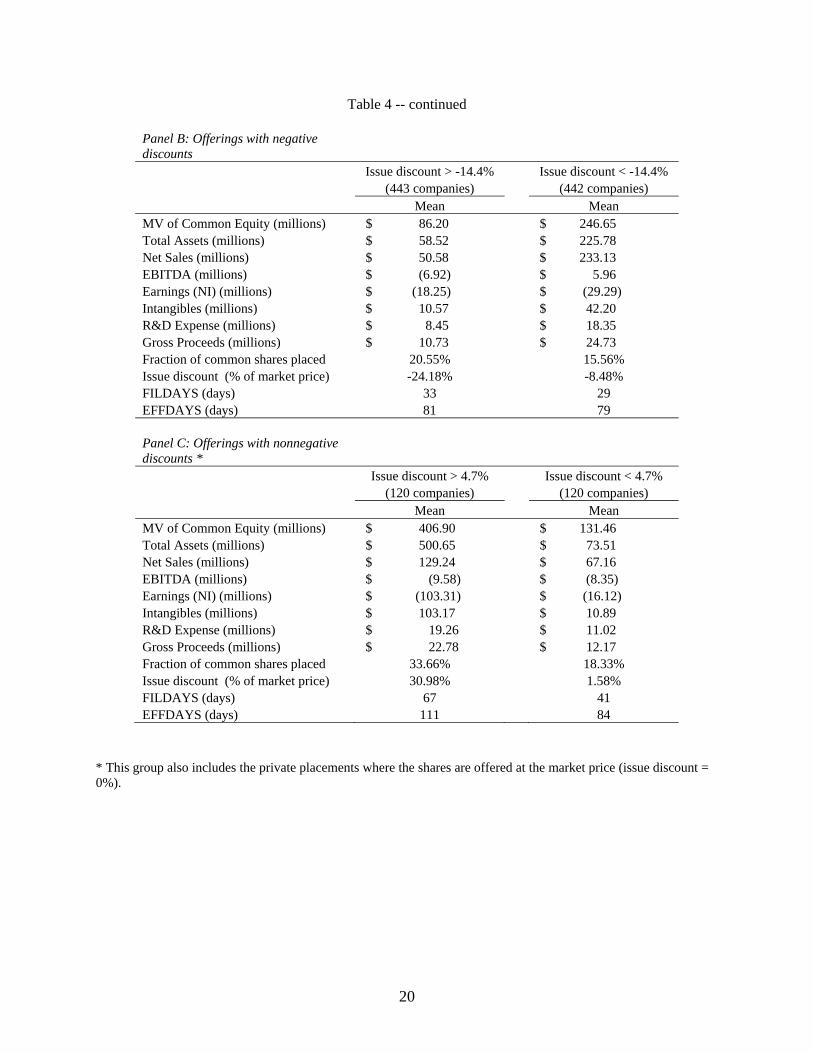
Table 4 -- continued
Panel B: Offerings with negative discounts Issue discount > -14.4% Issue discount < -14.4% (443 companies) (442 companies) Mean Mean MV of Common Equity (millions) $ 86.20 $ 246.65 Total Assets (millions) $ 58.52 $ 225.78 Net Sales (millions) $ 50.58 $ 233.13 EBITDA (millions) $ (6.92) $ 5.96 Earnings (NI) (millions) $ (18.25) $ (29.29) Intangibles (millions) $ 10.57 $ 42.20 R&D Expense (millions) $ 8.45 $ 18.35 Gross Proceeds (millions) $ 10.73 $ 24.73 Fraction of common shares placed 20.55% 15.56% Issue discount (% of market price) -24.18% -8.48% FILDAYS (days) 33 29 EFFDAYS (days) 81 79 Panel C: Offerings with nonnegative discounts * Issue discount > 4.7% Issue discount < 4.7% (120 companies) (120 companies) Mean Mean MV of Common Equity (millions) $ 406.90 $ 131.46 Total Assets (millions) $ 500.65 $ 73.51 Net Sales (millions) $ 129.24 $ 67.16 EBITDA (millions) $ (9.58) $ (8.35) Earnings (NI) (millions) $ (103.31) $ (16.12) Intangibles (millions) $ 103.17 $ 10.89 R&D Expense (millions) $ 19.26 $ 11.02 Gross Proceeds (millions) $ 22.78 $ 12.17 Fraction of common shares placed 33.66% 18.33% Issue discount (% of market price) 30.98% 1.58% FILDAYS (days) 67 41 EFFDAYS (days) 111 84
* This group also includes the private placements where the shares are offered at the market price (issue discount = 0%).
20
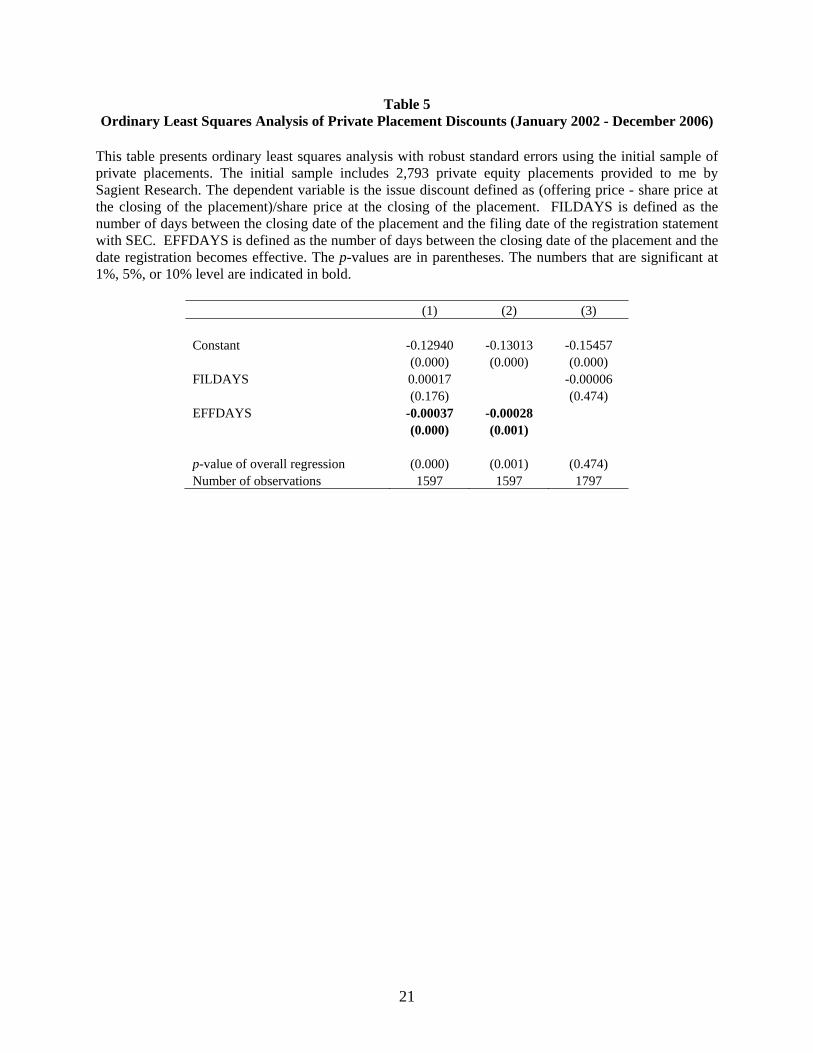
Table 5 Ordinary Least Squares Analysis of Private Placement Discounts (January 2002 - December 2006)
This table presents ordinary least squares analysis with robust standard errors using the initial sample of private placements. The initial sample includes 2,793 private equity placements provided to me by Sagient Research. The dependent variable is the issue discount defined as (offering price - share price at the closing of the placement)/share price at the closing of the placement. FILDAYS is defined as the number of days between the closing date of the placement and the filing date of the registration statement with SEC. EFFDAYS is defined as the number of days between the closing date of the placement and the date registration becomes effective. The p-values are in parentheses. The numbers that are significant at 1%, 5%, or 10% level are indicated in bold.
(1) (2) (3) Constant -0.12940 -0.13013 -0.15457 (0.000) (0.000) (0.000) FILDAYS 0.00017 -0.00006 (0.176) (0.474) EFFDAYS -0.00037 -0.00028 (0.000) (0.001) p-value of overall regression (0.000) (0.001) (0.474) Number of observations 1597 1597 1797
21

Table 6
Multivariate Analysis of Private Placements Discounts (January 2002 - December 2006) This table presents the multivariate analysis of private placement discounts with year and industry fixed effects. The sample contains 1,125 private equity placements of common stock by public companies that operate in U.S. The dependent variable is the issue discount defined as (offering price - share price at the closing of the placement)/share price at the closing of the placement. Fraction of common shares (CS) placed is defined as the number of common shares offered/ total number of shares outstanding. FILDAYS is defined as the number of days between the closing date of the placement and the filing date of the registration statement with SEC. EFFDAYS is defined as the number of days between the closing date of the placement and the date registration becomes effective. Book-to-market, leverage, market value of equity, book value of assets, and intangible assets are measured based on the calendar year-end values prior to the offering. Revenue, EBITDA, net income, interest and R&D expense are measured based on calendar year values prior to the offering. Warrant is a dummy variable that takes the value 1 for the placements that include warrants and 0 otherwise. Agent is a dummy variable that takes the value 1 for the placements that involve a placement agent and 0 otherwise. The p-values are in parentheses. The numbers that are significant at 1%, 5%, or 10% level are indicated in bold.
22
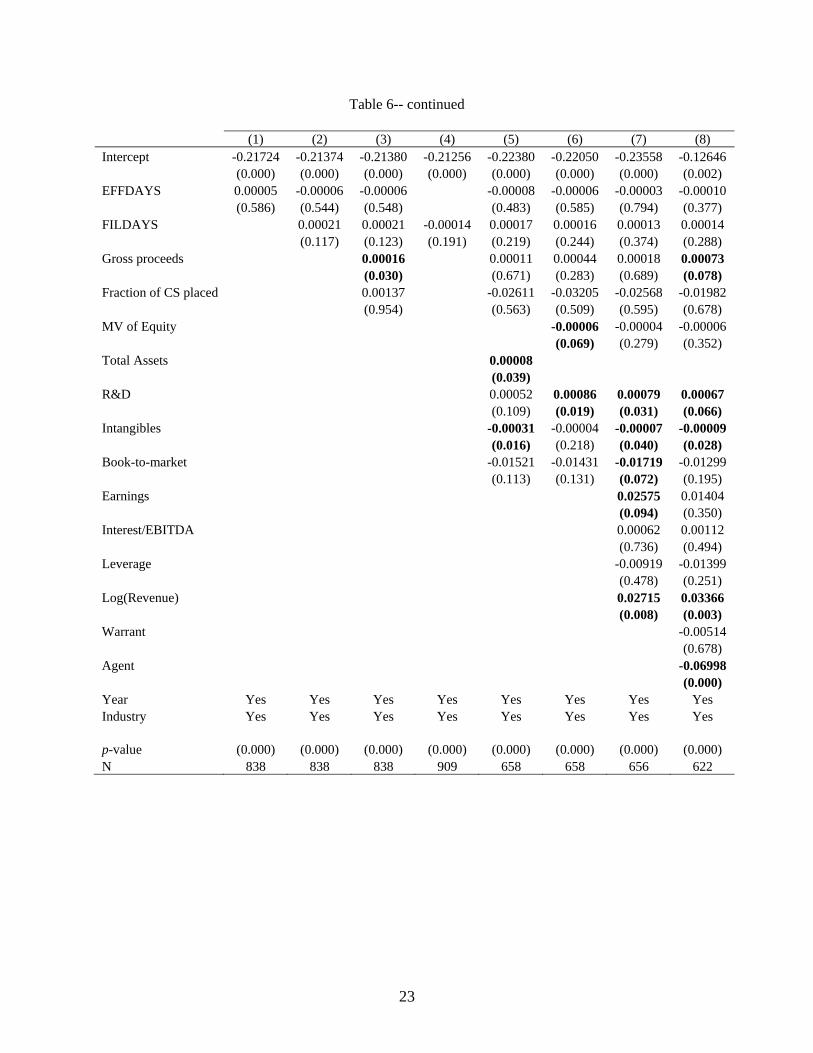
Table 6-- continued (1) (2) (3) (4) (5) (6) (7) (8) Intercept -0.21724 -0.21374 -0.21380 -0.21256 -0.22380 -0.22050 -0.23558 -0.12646 (0.000) (0.000) (0.000) (0.000) (0.000) (0.000) (0.000) (0.002) EFFDAYS 0.00005 -0.00006 -0.00006 -0.00008 -0.00006 -0.00003 -0.00010 (0.586) (0.544) (0.548) (0.483) (0.585) (0.794) (0.377) FILDAYS 0.00021 0.00021 -0.00014 0.00017 0.00016 0.00013 0.00014 (0.117) (0.123) (0.191) (0.219) (0.244) (0.374) (0.288) Gross proceeds 0.00016 0.00011 0.00044 0.00018 0.00073 (0.030) (0.671) (0.283) (0.689) (0.078) Fraction of CS placed 0.00137 -0.02611 -0.03205 -0.02568 -0.01982 (0.954) (0.563) (0.509) (0.595) (0.678) MV of Equity -0.00006 -0.00004 -0.00006 (0.069) (0.279) (0.352) Total Assets 0.00008 (0.039) R&D 0.00052 0.00086 0.00079 0.00067 (0.109) (0.019) (0.031) (0.066) Intangibles -0.00031 -0.00004 -0.00007 -0.00009 (0.016) (0.218) (0.040) (0.028) Book-to-market -0.01521 -0.01431 -0.01719 -0.01299 (0.113) (0.131) (0.072) (0.195) Earnings 0.02575 0.01404 (0.094) (0.350) Interest/EBITDA 0.00062 0.00112 (0.736) (0.494) Leverage -0.00919 -0.01399 (0.478) (0.251) Log(Revenue) 0.02715 0.03366 (0.008) (0.003) Warrant -0.00514 (0.678) Agent -0.06998 (0.000) Year Yes Yes Yes Yes Yes Yes Yes Yes Industry Yes Yes Yes Yes Yes Yes Yes Yes p-value (0.000) (0.000) (0.000) (0.000) (0.000) (0.000) (0.000) (0.000) N 838 838 838 909 658 658 656 622
23
Table 7 Multivariate Analysis of Private Placements Discounts - Negative Discounts (January 2002 -
December 2006) This table presents the multivariate analysis of private placement discounts with year and industry fixed effects. The sample includes 885 private equity placements with negative issue discounts only. The dependent variable is the issue discount defined as (offering price - share price at the closing of the placement)/share price at the closing of the placement. Fraction of common shares (CS) placed is defined as the number of common shares offered/ total number of shares outstanding. FILDAYS is defined as the number of days between the closing date of the placement and the filing date of the registration statement with SEC. EFFDAYS is defined as the number of days between the closing date of the placement and the date registration becomes effective. Book-to-market, leverage, market value of equity, book value of assets, and intangible assets are measured based on the calendar year-end values prior to the offering. Revenue, EBITDA, net income, interest and R&D expense are measured based on calendar year values prior to the offering. Warrant is a dummy variable that takes the value 1 for the placements that include warrants and 0 otherwise. Agent is a dummy variable that takes the value 1 for the placements that involve a placement agent and 0 otherwise. The p-values are in parentheses. The numbers that are significant at 1%, 5%, or 10% level are indicated in bold.
24
25
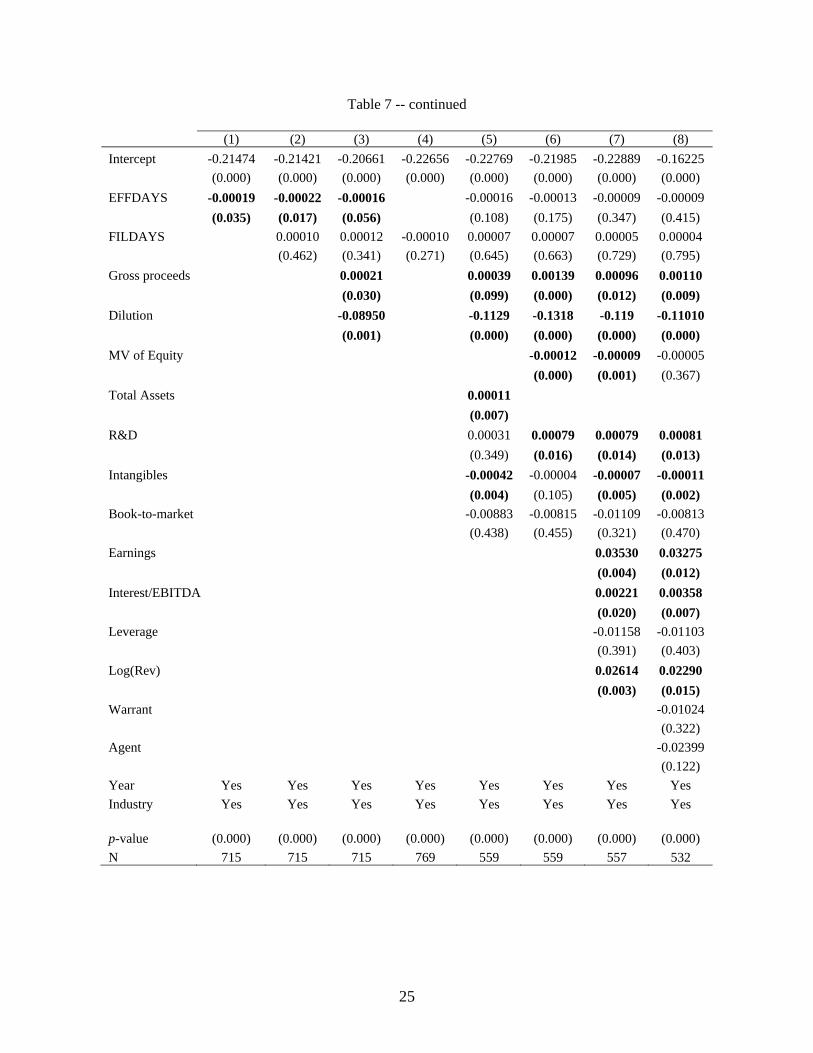
Table 7 -- continued
(1) (2) (3) (4) (5) (6) (7) (8) Intercept -0.21474 -0.21421 -0.20661 -0.22656 -0.22769 -0.21985 -0.22889 -0.16225 (0.000) (0.000) (0.000) (0.000) (0.000) (0.000) (0.000) (0.000) EFFDAYS -0.00019 -0.00022 -0.00016 -0.00016 -0.00013 -0.00009 -0.00009 (0.035) (0.017) (0.056) (0.108) (0.175) (0.347) (0.415) FILDAYS 0.00010 0.00012 -0.00010 0.00007 0.00007 0.00005 0.00004 (0.462) (0.341) (0.271) (0.645) (0.663) (0.729) (0.795) Gross proceeds 0.00021 0.00039 0.00139 0.00096 0.00110 (0.030) (0.099) (0.000) (0.012) (0.009) Dilution -0.08950 -0.1129 -0.1318 -0.119 -0.11010 (0.001) (0.000) (0.000) (0.000) (0.000) MV of Equity -0.00012 -0.00009 -0.00005 (0.000) (0.001) (0.367) Total Assets 0.00011 (0.007) R&D 0.00031 0.00079 0.00079 0.00081 (0.349) (0.016) (0.014) (0.013) Intangibles -0.00042 -0.00004 -0.00007 -0.00011 (0.004) (0.105) (0.005) (0.002) Book-to-market -0.00883 -0.00815 -0.01109 -0.00813 (0.438) (0.455) (0.321) (0.470) Earnings 0.03530 0.03275 (0.004) (0.012) Interest/EBITDA 0.00221 0.00358 (0.020) (0.007) Leverage -0.01158 -0.01103 (0.391) (0.403) Log(Rev) 0.02614 0.02290 (0.003) (0.015) Warrant -0.01024 (0.322) Agent -0.02399 (0.122) Year Yes Yes Yes Yes Yes Yes Yes Yes Industry Yes Yes Yes Yes Yes Yes Yes Yes p-value (0.000) (0.000) (0.000) (0.000) (0.000) (0.000) (0.000) (0.000) N 715 715 715 769 559 559 557 532


