Embed Size (px)
Citation preview

179
Managerial Economics2016, vol. 17, no. 2, pp. 179–201
http://dx.doi.org/10.7494/manage.2016.17.2.179
Anna Blajer-Gołębiewska*, Arkadiusz Kozłowski**
Financial determinants of corporate reputation: A short-term approach
1. Introduction
When observing companies listed on stock exchanges, it can be noticed that
the gap between a company’s book value (BV) and its market value (MV) is often
significant. The fact that investors are willing to pay more for companies’ assets
is often explained using the concept of corporate reputation – an intangible ad-
ditional asset of a company, which is worth to paying for.
Similarly, analysing literature in the corporate reputation problem, its strong
connection with the value of a company is often underlined; it is even claimed
that corporate reputation represents the value of a company (Marcellis-Warin
and Teodoresco, 2012, pp. 7–17). Corporate reputation is often defined as the
perception of a company among its stakeholders, the outcome of shared socially
impressions of a firm (Fombrun and Van Riel, 1997). It is a function of collective
judgements of a firm ‘based on assessments of the financial, social, and environ-
mental impacts attributed to the corporation over time’ (Barnett et al., 2006).
There are many definitions of corporate reputation based mainly in economics,
management, sociology, and psychology. There are also different determinants
and aspects of corporate reputation that matter while taking into consideration
each stakeholder group. Corporate reputation is fundamental for creating and
establishing appropriate relationships between a company and its stakeholders.
It is widely claimed that a higher corporate reputation can encourage stakehold-
ers to undertake certain activities that improve a company’s financial situation in
terms of profit, market value, etc. (Roberts and Dowling, 2002, pp. 1077–1093; Har-
rington, 2003, pp. 52–61; Riahi-Belkaoui, 2003, pp. 1–22; Cox et al., 2004, pp. 27–47;
Anderson and Smith, 2006, pp. 86–93; Smith et al., 2010, pp. 201–221 etc.).
** University of Gdansk, Faculty of Economics, Microeconomics Department, e-mail: [email protected]
** University of Gdansk, Faculty of Management, Statistics Department, e-mail: arkadiusz.kozlow-

180
Anna Blajer-Gołębiewska, Arkadiusz Kozłowski
On the one hand, a better financial situation results in an increase in a com-
pany’s reputation (especially while approaching the problem from an investor’s
perspective); but on the other hand, a better corporate reputation is supposed to
improve a company’s performance. Fombrun (1996, p. 72) states that corporate
reputation is “a perceptual representation of a company’s past actions and future
prospects…”. Following this definition, Roberts and Dowling created a model of
reputation-financial performance dynamics, where past financial performance
influences reputation, and a reputation influences future financial performance
of a given company (Roberts and Dowling, 2002, p. 1078; Figure 1).
Moreover, they indicate that investors do not have access to all of the infor-
mation about a company, so their decisions rely mostly on ‘previous financial
performance outcomes as signals of a firm’s overall esteem.’ The authors decom-
pose an overall reputation into a financial reputation (predicted by its previous
financial performance) and residual reputation (‘left over’; Fig. 1).
Studies on relationships between corporate reputation and its performance
mostly consider the impact of corporate reputation on a company’s performance;
as a result, the aim of this study was to examine the other part of the Roberts
and Dowling model of reputation-financial performance dynamics. Particularly,
the aim of this study was to verify the short-term impact of financial variables on
corporate reputation perceived by investors.
Figure 1. Roberts and Dowling’s model of reputation-financial dynamics
Source: own compilation on the basis of Roberts and Dowling (2002, p. 1078)
In the study, we applied an assumption based on various business valuation
theories and the literature in the subject, stating that overall corporate reputation

181
Financial determinants of corporate reputation: A short-term approach
is reflected in the difference between the valuation of a company by investors
and its book value.
In order to verify their impact, financial variables were grouped into three catego-
ries measuring the level of a company’s profitability, stability, and risk. This division
aims to verify the most important financial characteristics for investors in the process
of building their perception of a company’s reputation, and later in influencing their
behaviour on the stock exchange. The methods applied in the study are multiple
regressions on ranks and on first differences and an analysis of contingency tables
(chi-squared tests of independence and Yule’s coefficient of colligation).
The article proceeds as follows. The next section provides a brief overview of
the literature on previous studies on relationships between corporate reputation
and companies’ financial performances, as well as concepts of business valuation
incorporating the idea of corporate reputation. In the following section, the ap-
plied methodologies are outlined. In the penultimate section, findings on the
short-term determinants of corporate reputation are presented and discussed.
The final section provides conclusions, the study weaknesses, and establishes
directions for future research.
2. Literature review
As mentioned above, there is a wide array of studies on the impact of corporate
reputation on a company’s performance. According to Beatty and Ritter (1986,
pp. 213–232) as well as Riahi-Belkaoui (1999, pp. 25–36), a better reputation can
create a better image of a company in capital markets and a more-correct valua-
tion by investors. In sociology and social psychology, an impression management
theory suggests that the process of creating positive reputation leads to tangible
benefits. This kind of management is a process in which one attempts to influ-
ence the perceptions of stakeholders about a company.
Some research also suggests that positive information (concerning reputa-
tion) is often overestimated, while negative information is either ignored or
underestimated by stakeholders (Brennan et al., 2008, pp. 789–832). Positive
financial information about a corporation’s reputation increases the probability
of buying its shares much more than positive information about corporate ethics
(Blajer-Gołębiewska and Kos, 2016, pp. 11–31).
Moreover, corporate reputation may be relative. Roberts and Dowling (2002,
pp. 1077–1093) suggest that a company’s higher performance results from its
advantages in its relationship with its competitors. Results of their study show
that companies with superior reputations are better able to maintain superior
profitability over time. Similar conclusions were drawn from the study of Smith

182
Anna Blajer-Gołębiewska, Arkadiusz Kozłowski
and others. They compared high reputation firms to a control sample of firms
and found that firms with high reputations receive a market value premium
($1.3 billion on average; Smith et al., 2010, pp. 201–221). In this context, the im-
portant fact is that “each corporate reputation is unique and impossible to copy”
(Marcellis-Warin and Teodoresco, 2012, p. 7), so each company has to work for
its own good reputation.
According to Riahi-Belkaoui (2003, pp. 1–22), reputation explains relative
market value for multinational firms. Moreover, the higher the corporate reputa-
tion, the greater is the impact of multinationality on the q-Value of the company.
In the studies on relationships between corporate reputation and financial
variables, the proxies applied for corporate reputation were mainly points/numbers
in rankings of companies with the best reputations (Black et al., 2000, pp. 31–42;
Roberts and Dowling, 2002, pp. 1077–1093; Brammer et al., 2006, pp. 1–28;
Smith et al., 2010, pp. 201–221; Cole, 2012, pp. 47–68; Blajer-Gołębiewska,
2014a, pp. 194–207 etc.). The most common is the list of America’s Most Admired
Companies, published by Fortune.
In the corporate reputation perspective, return on assets (ROA) is the most
common proxy for financial performance (Black et al., 2000, pp. 31–42; Roberts
and Dowling, 2002, pp. 1077–1093; Smith et al., 2010, pp. 201–221). Not only
does it show a company’s ability to generate profits, but it can also be used for
comparisons across industries that are crucial while analysing companies from
different sectors (Sabate and Puente, 2003, pp. 161–177). Similarly, a proxy for
financial performance is sometimes a company’s efficiency at generating profits
from every unit of shareholder equity, which is represented by a return on eq-
uity indicator ROE (Smith et al., 2010, pp. 201–221; Blajer-Gołębiewska, 2014a,
pp. 194–207). In their research, Smith and others (2010) used a wide range of
financial indicators, which included cost of capital, volatility in sales, volatility
net income, current ratio, and financial leverage. They found that companies
with better reputations experienced superior financial performance and lower
risk (measured as a lower cost of capital, less volatility in sales, and net income).
There were also other variables included in studies on corporate reputation,
such as the size of a company (Black et al., 2000 pp. 31–42; Roberts and Dowling,
2002, pp. 1077–1093), relative market-to-book value (market value divided by
total shareholder equity; Roberts and Dowling, 2002, pp. 1077–1093), stock price
volatility (the standard deviation of the monthly logged price relatives; Hillier et
al., 2008 Smith et al., 2010, pp. 201–221), and credit score – a measure calculated
as the combination of main financial variables used also to predict bankruptcy
and cost of debt issuances (Altman, 2000; Smith et al., 2010, pp. 201–221).
Studies on the value of corporate reputation show evidence of ‘an invisible
intangible asset that is value-relevant in explaining the market value of the firm’

183
Financial determinants of corporate reputation: A short-term approach
(Black et al., 2000, pp. 31–42). As mentioned above, it is often stated that corporate
reputation is reflected in the relationship between a company’s market value and
its book value (Riahi-Belkaoui, 2003, pp. 1–22; Marcellis-Warin and Teodoresco,
2012, pp. 2–43). It may be also perceived as a representation of the validity of
decisions on reputation-enhancing expenditures. Certainly, there is a gap between
the book value of a company and its valuation by investors (market value). In the
theory of business valuation, there are models aiming to calculate the value of
corporate reputation on the basis of the gap.
There is a group of business valuation methods called the mixed methods,
reputation-based methods, or goodwill-based methods. These include the Indirect
Method, Direct Method (also called Anglo-Saxon Method), Union of European Ac-
counting Experts Method (UEC Method), Risk-Bearind and Risk-Free Rate Method,
and others. They are based on the assumption that a firm’s real value consists of its
book value and the value of its reputation/goodwill (Machała, 2011, pp. 506–508;
Fernández, 2005, pp. 128–141). The value of reputation in these models is based
on the difference between book value and other valuations. There is also a param-
eter that is explained differently in each of the mixed methods and represents the
share of reputation in the difference between book value and the other valuations.
In a basic approach, the parameter is assumed to be constant . In others, such
as the UEC Method, the parameter is based on annuity calculation (Jaki, 2008,
pp. 108–117). In the popular Gref Method, a discount rate and the amortization of
reputation are also taken into consideration. There are also other mixed methods
of different explanations of a parameter; in other words, explanations of a share
of reputation is the excess of a company’s market value over its book value (Jaki,
2008, pp. 108–117). Construction of the parameter is not the subject of this study,
however; what is important is the idea that corporate reputation is related to the
value of a company above its book value (above the net asset value).
Following the above-mentioned studies, it would be beneficial for under-
standing the problem of corporate reputation to identify financial determinants
influencing investors’ decisions to buy shares of a company and to place a certain
value on a share that, very often, is higher than its results from book value. There-
fore, in this study, the impact of financial determinants on corporate reputation,
measured as a difference between its book value and market value, was analysed.
3. Methods of the research
In order to find an impact of financial variables on the perceived corpo-
rate reputation, the following stages of research were conducted: (1) selection
of proxy for corporate reputation; (2) selection of proxies for a company’s
184
Anna Blajer-Gołębiewska, Arkadiusz Kozłowski
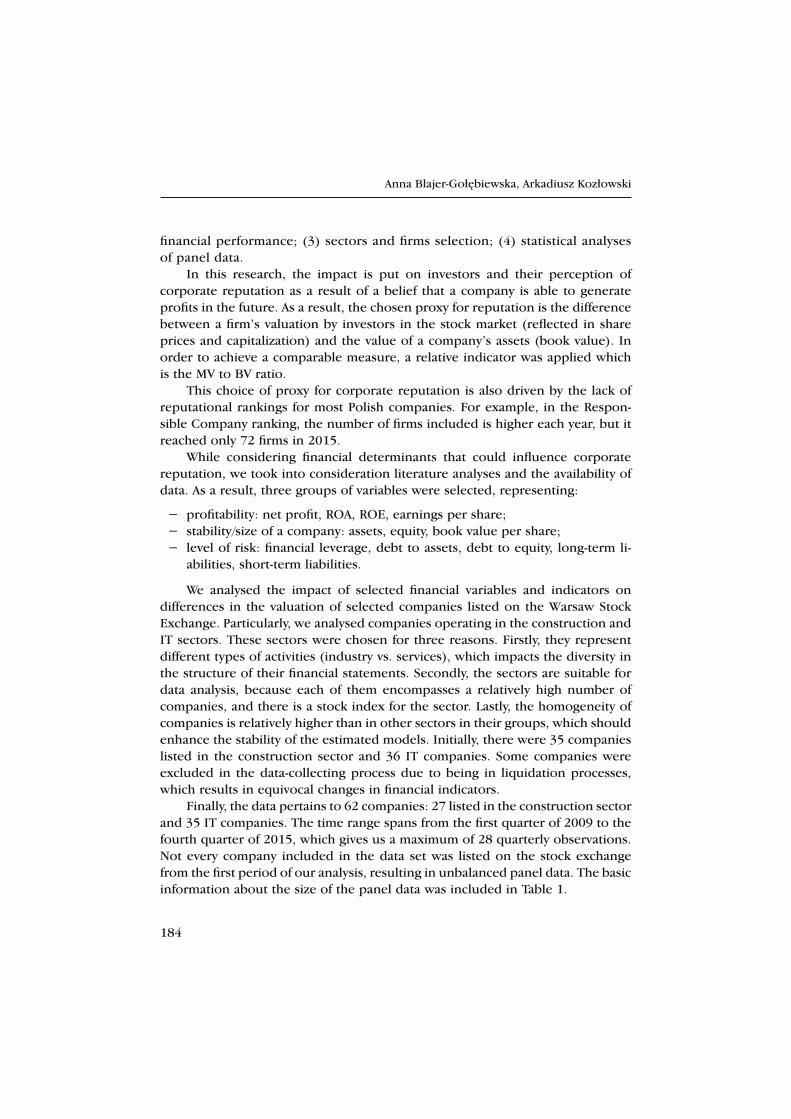
financial performance; (3) sectors and firms selection; (4) statistical analyses
of panel data.
In this research, the impact is put on investors and their perception of
corporate reputation as a result of a belief that a company is able to generate
profits in the future. As a result, the chosen proxy for reputation is the difference
between a firm’s valuation by investors in the stock market (reflected in share
prices and capitalization) and the value of a company’s assets (book value). In
order to achieve a comparable measure, a relative indicator was applied which
is the MV to BV ratio.
This choice of proxy for corporate reputation is also driven by the lack of
reputational rankings for most Polish companies. For example, in the Respon-
sible Company ranking, the number of firms included is higher each year, but it
reached only 72 firms in 2015.
While considering financial determinants that could influence corporate
reputation, we took into consideration literature analyses and the availability of
data. As a result, three groups of variables were selected, representing:
− profitability: net profit, ROA, ROE, earnings per share;
− stability/size of a company: assets, equity, book value per share;
− level of risk: financial leverage, debt to assets, debt to equity, long-term li-
abilities, short-term liabilities.
We analysed the impact of selected financial variables and indicators on
differences in the valuation of selected companies listed on the Warsaw Stock
Exchange. Particularly, we analysed companies operating in the construction and
IT sectors. These sectors were chosen for three reasons. Firstly, they represent
different types of activities (industry vs. services), which impacts the diversity in
the structure of their financial statements. Secondly, the sectors are suitable for
data analysis, because each of them encompasses a relatively high number of
companies, and there is a stock index for the sector. Lastly, the homogeneity of
companies is relatively higher than in other sectors in their groups, which should
enhance the stability of the estimated models. Initially, there were 35 companies
listed in the construction sector and 36 IT companies. Some companies were
excluded in the data-collecting process due to being in liquidation processes,
which results in equivocal changes in financial indicators.
Finally, the data pertains to 62 companies: 27 listed in the construction sector
and 35 IT companies. The time range spans from the first quarter of 2009 to the
fourth quarter of 2015, which gives us a maximum of 28 quarterly observations.
Not every company included in the data set was listed on the stock exchange
from the first period of our analysis, resulting in unbalanced panel data. The basic
information about the size of the panel data was included in Table 1.

185
Financial determinants of corporate reputation: A short-term approach
Table 1
Size of the panel data
Statistics OverallConstruc-tion sector
IT sector
Number of observations 1512 670 842
Length of time series 13–26 16–26 13–26
Number of companies 62 27 35
Source: own compilation
Financial indicators are published after the period they concern; thus, their
impact on market value is shifted over time. In the case of the analysed companies
(listed on the Warsaw Stock Exchange), the quarterly and consolidated quarterly
reports shall be submitted at the same time (on the date specified by the issuer,
but no later than within 45 days after the end of the quarter to which it relates).
However, a company is not obligated to submit quarterly reports for the second
and fourth quarters of the financial year, so companies do it voluntarily, often
while submitting half-yearly reports and reports considering the whole fiscal year
(Rozporządzenie Ministra…, 2014).
It was not our intention to analyse the short-term impact of earnings an-
nouncement on share prices, and consequently on market valuation, as it usually
considers a few days after the announcement and may be biased by short-term
behavioural anomalies. In order to analyse the changes in corporate reputation,
we needed to check the effect after a longer term, which allows us to omit short-
term volatilities caused by the announcements.
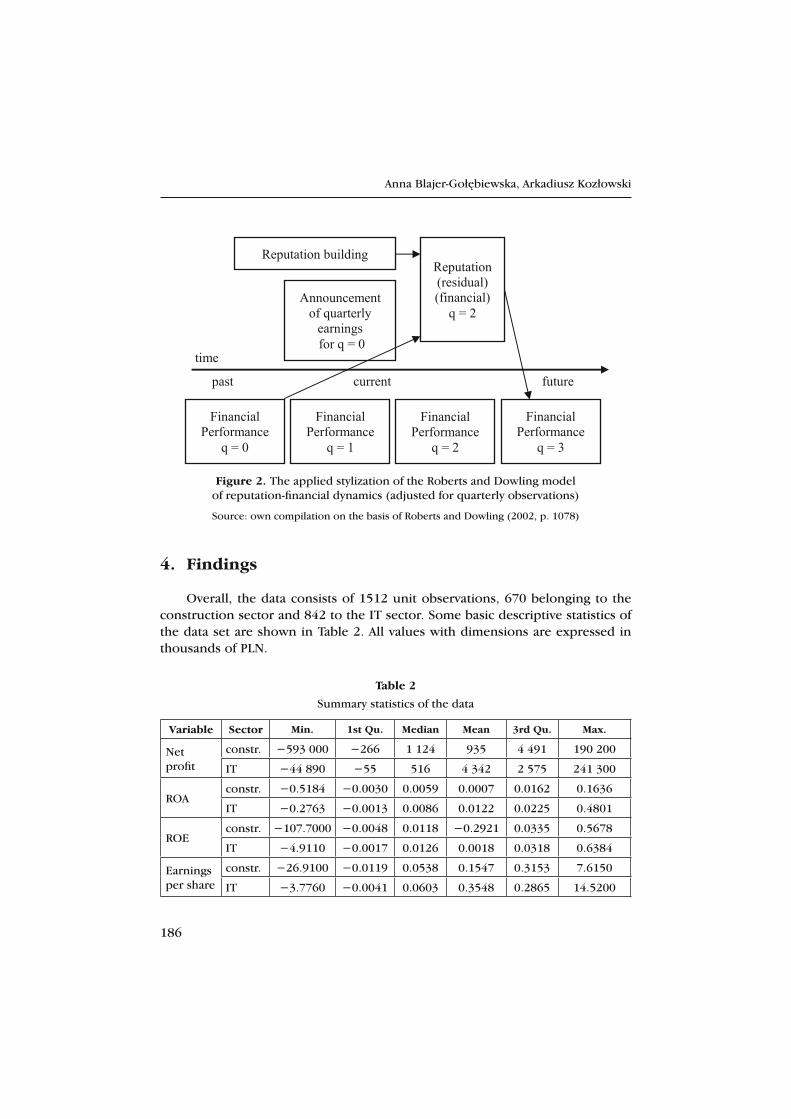
As mentioned above, the impact of financial indicators on market value is
shifted in time. To reflect this lag, we adjusted the Roberts and Dowling’s model
matching financial indicators from one quarter with the market value of the sec-
ond quarter after the one in question (Fig. 2). Market value itself was computed
as a product of mean share prices from a quarter and the number of shares. Due
to the shifting, the maximum length of time series is 26.
The data about financial performance consists of observations from the same
set of companies over multiple time periods. This is panel data, also known as
longitudinal data.
The analysis was made so to reflect the intrinsic structure of the data. Therefore,
the main focus of the analysis was on panel data models. Because of some features
of the date described below, real values were replaced by various transformations.
We have distinguished four approaches to the analysis: (1) multiple regression on
ranks across time and companies; (2) multiple regression on ranks made separately
for each period, (3) multiple regression on first differences; (4) analysis of contin-
gency tables (chi-squared tests of independence and Yule’s coefficient of colligation).
186
Anna Blajer-Gołębiewska, Arkadiusz Kozłowski
Figure 2. The applied stylization of the Roberts and Dowling model
of reputation-financial dynamics (adjusted for quarterly observations)
Source: own compilation on the basis of Roberts and Dowling (2002, p. 1078)
4. Findings
Overall, the data consists of 1512 unit observations, 670 belonging to the
construction sector and 842 to the IT sector. Some basic descriptive statistics of
the data set are shown in Table 2. All values with dimensions are expressed in
thousands of PLN.
Table 2
Summary statistics of the data
Variable Sector Min. 1st Qu. Median Mean 3rd Qu. Max.
Net
profit
constr. −593 000 −266 1 124 935 4 491 190 200
IT −44 890 −55 516 4 342 2 575 241 300
ROAconstr. −0.5184 −0.0030 0.0059 0.0007 0.0162 0.1636
IT −0.2763 −0.0013 0.0086 0.0122 0.0225 0.4801
ROEconstr. −107.7000 −0.0048 0.0118 −0.2921 0.0335 0.5678
IT −4.9110 −0.0017 0.0126 0.0018 0.0318 0.6384
Earnings
per share
constr. −26.9100 −0.0119 0.0538 0.1547 0.3153 7.6150
IT −3.7760 −0.0041 0.0603 0.3548 0.2865 14.5200

187
Financial determinants of corporate reputation: A short-term approach
Assetsconstr. 7 199 102 300 242 900 501 700 523 300 3 859 000
IT 1 304 26 750 79 720 313 800 249 300 5 595 000
Equityconstr. 427 55 650 119 900 172 000 233 700 1 115 000
IT 396 16 720 54 980 246 200 179 200 5 097 000
Book
value per
share
constr. 0.00 1.90 7.98 14.49 18.69 95.76
IT 0.00 1.77 6.69 16.48 13.92 158.20
Financial
leverage
constr. 1.0640 1.4560 1.7890 9.3530 2.5760 2 475.0000
IT 1.0050 1.1960 1.3890 1.9710 1.7840 110.5000
Debt to
assets
constr. 0.0601 0.3097 0.4404 0.4604 0.6097 0.9996
IT 0.0046 0.1582 0.2724 0.3085 0.4349 0.9910
Debt to
equity
constr. 0.0642 0.4495 0.7875 8.3400 1.5760 2 474.0000
IT 0.0046 0.1880 0.3785 0.9694 0.7840 109.5000
Long-
term
liabilities
constr. 0 2 565 11 520 62 280 62 780 1 222 000
IT 0 365 2 084 22 360 8 518 416 500
Short-
term
liabilities
constr. 730 19 870 66 320 266 400 187 700 3 075 000
IT 32 4 823 14 500 43 890 53 500 503 400
Market
value
constr. 830 45 850 138 800 1 745 000 365 100 109 000 000
IT 635 17 830 69 330 419 800 259 800 25 500 000
Market
value /
Equity
constr. 0.07 0.68 1.17 13.12 2.08 3705.00
IT 0.08 0.65 1.07 6.78 2.19 965.90
Source: own compilation
The most important feature of these empirical distributions is the presence
of outliers. Almost every variable contains values that dramatically exceed the
typical range of variability. Not only are minimal and maximal values far from aver-
age values, but also there are substantial differences between mean and median,
indicating huge skewness, usually positive. For instance, the mean net profit for
the IT sector is 4,302,000 PLN, while the median barely exceeds 500,000 PLN –
there are a few cases where net profit was much larger than the other ones, and
they pull the mean far to the right on the axis.
Out of all of the companies in all time periods, corporate reputation, as de-
fined above, was positive, i.e., the ratio of the market value to the book value was
greater than one in 516 cases (34%), of which, 193 concerned the construction
sector and 323 concerned the IT sector.
Table 2 cont.

188
Anna Blajer-Gołębiewska, Arkadiusz Kozłowski
Because of the presence of outliers and, thus, considerable asymmetry in
the variable distributions, parametric methods for analysing the data would be
inappropriate. Although one can remove the outliers from the data and perform
classical parametric analysis, the criteria for exclusion are always subjective to
some extent. Therefore, we decided to keep all observations and (in order to
minimize the impact of outliers) transform real values from a ratio or interval
scale to an ordinal scale. The transformation was made in several different ways.
In the first approach, real values were replaced with their ranks across time
and companies within a sector. A rank is the relative position of a value, if the data
were sorted in an increasing way. With this solution, a company’s performance is
measured relative to its competitors’ performance and to itself in different periods.
The goal of the analysis was to model corporate reputation, defined as the ratio
of MV to BV (the ratio is also ranked), against other variables. The first choice
was to use multiple regression, considering the panel structure of the data. In
the case of modelling panel data, two types of effects must be considered. One
is the individual effect; i.e., the part of variability of the dependent variable that
is specific to an individual (a company), causing a correlation in this individual’s
behaviour over time. Second is the time effect; i.e., the part of variability of the
dependent variable that is specific to a time period, causing again a correlation in
observations over the same period (Wooldridge, 2002, pp. 247–252). Each effect
can be considered fixed (constant over time or across section) or random; i.e., as
a realisation of a random variable with certain distribution. To test which approach
is more suitable for each effect, the Hausman tests were performed (Hausman,
1978, pp. 1251–1271). The null hypothesis in the test states that the coefficients
in both fixed and random effects models are consistent; but, the random effects
model is preferred due to its higher efficiency. Under the alternative hypothesis,
only a fixed effect estimator is consistent and, thus, preferred.
The other tests (which need to be done before choosing the final model)
examine whether or not the individual and time effects are significant; otherwise,
one can treat the data as homogeneous and fit the pooled model. These tests are
the F test and Lagrange multiplier test (Breush and Pagan, 1980, pp. 239–253),
for fixed and random effects, respectively.
The estimated fixed effects (two-way) model for the construction sector and
the results for the accompanying tests are presented in Table 3.
The results for the Hausman tests suggest that it is more appropriate to treat
both individual and time effects as fixed. The F test for two-way effects (individual
and time simultaneously) proves that both effects are significant. This means
that companies, as well as time periods, have their own specific effects that are
constant over time and across sections and affect the relationship between repu-
tation and its regressors.

189
Financial determinants of corporate reputation: A short-term approach
Table 3
Fixed effects (two-way) model for the construction sector
Variable Coefficient Std. Err. t-value Pr(>|t|)
Net profit −0.2219 0.0766 −2.8974 0.0039 **
ROA −0.3108 0.1216 −2.5557 0.0108 *
ROE 0.4156 0.1408 2.9526 0.0033 **
Earnings per share 0.1246 0.0664 1.8755 0.0612 .
Assets −0.8375 0.1290 −6.4901 0.0000 ***
Equity 0.3828 0.0844 4.5359 0.0000 ***
Book value per share −0.8526 0.0815 −10.4557 0.0000 ***
Financial leverage −0.8825 0.4847 −1.8208 0.0691 *
Debt to assets 0.9870 0.7832 1.2602 0.2081
Debt to equity −0.1187 1.1676 −0.1016 0.9191
Long-term liabilities 0.0813 0.0801 1.0148 0.3106
Short-term liabilities 0.3423 0.1455 2.3519 0.0190 *
Signif. codes: 0 ‘***’ 0.001 ‘**’ 0.01 ‘*’ 0.05 ‘.’ 0.1 ‘ ’
R-Squared: 0.3050 Adj. R-Squared: 0.2758
Hausman tests for panel model (random vs. fixed effects)
Effects test statistics ( 2) df p-value
individual 67.42 12 0.0000
time 133.03 12 0.0000
F test for two-way effects (fixed)
F df1 df2 p-value
21.15 51 606 0.0000
Source: own compilation
Since each value is replaced by rank, interpretation of the coefficients in terms
of nominal impact of certain variables on the dependent variable is not possible.
However, thanks to ranks, each variable is expressed on the same scale; thus, es-
timated coefficients allow for the comparison of the magnitude and direction of
impact for each variable. The highest impact on reputation occurred in the cases
of book value per share and assets, both variables being negatively correlated
with reputation. Among other variables that are significant (i.e., with p-value less
than 0.05) are net profit, ROA, ROE, equity, and financial leverage. However, the
model is not well-fitted to the data; the adjusted R2 is 0.28, which is very low.

190
Anna Blajer-Gołębiewska, Arkadiusz Kozłowski
The same procedure was done with the IT sector as with the construction
sector. This time, Hausman tests suggested that the random effects model would
be more suitable for individual effects and the fixed effect model would be more
suitable for time effects. The F test indicated, however, that the time effect is not
significant. This means that, unlike the construction sector, the IT sector could be
perceived as homogenous over time. Nevertheless, each company has a somehow
different relationship between reputation and financial indicators due to strong
individual effects. Therefore, the random effects (individual) model was fitted to
the data from the IT sector. The estimated model is presented in Table 4.
In the model above, four variables turned out to be significant: equity,
book value per share, long-term liabilities, and financial leverage. The great-
est impact on reputation has book value per share (negative), same as in the
construction sector. The financial leverage, which was significantly positively
correlated with reputation in the construction sector, is also significant in the
IT sector, but its correlation is negative. Again, interpretation of the coefficient
is to be done with caution, because the model is not well-fitted to the data
(adjusted R2 = 0.2769).
Table 4
Random effects (individual) model for the IT sector
Variable Coefficient Std. Err. t-value Pr(>|t|)
(Intercept) 632.9484 42.6315 14.8470 0.0000 ***
Net profit 0.0136 0.0563 0.2417 0.8091
ROA −0.0364 0.1295 −0.2810 0.7788
ROE 0.0419 0.1258 0.3334 0.7389
Earnings per share 0.0787 0.0611 1.2889 0.1978
Assets 0.0773 0.1642 0.4706 0.6380
Equity 0.4615 0.1379 3.3465 0.0009 ***
Book value per share −0.9107 0.0603 −15.0983 0.0000 ***
Financial leverage −0.1902 0.3152 −0.6033 0.5465
Debt to assets 0.1425 0.8086 0.1762 0.8602
Debt to equity 0.2921 1.0650 0.2743 0.7840
Long-term liabilities −0.1500 0.0453 −3.3149 0.0010 ***
Short-term liabilities −0.3080 0.0672 −4.5806 0.0000 ***
Signif. codes: 0 ‘***’ 0.001 ‘**’ 0.01 ‘*’ 0.05 ‘.’ 0.1 ‘ ’
R-Squared: 0.2812 Adj. R-Squared: 0.2769

191
Financial determinants of corporate reputation: A short-term approach
Hausman tests for panel model (random vs. fixed effects)
effects test statistics ( 2) df p-value
individual 0.07 12 1.0000
time 27.6 12 0.0063
Tests for individual and time effects
test test statistics df p-value
individual – random
(Lagrange multiplier test,
Breush-Pagan)
2 = 4632.5 1 0.0000
time – fixed (F test) F = 1.25df1 = 25,
df2 = 8040.1857
Source: own compilation
The second approach to the analysis consisted in replacing real values with
ranks, similar to the first approach; but this time, the ranks have been made
separately for each period. This means that, for each quarter, companies have
been sorted by every variable, and ranks have been assigned ranging from one to
a number of companies. The same panel data models as in the first approach were
tested for each sector. The results of these analyses are shown in Tables 5 and 6.
Table 5
Fixed effects (individual) model for the construction sector (second approach)
Variable Coefficient Std. Err. t-value Pr(>|t|)
Net profit −0.1651 0.0726 −2.2749 0.0232 *
ROA −0.2297 0.0970 −2.3682 0.0182 *
ROE 0.2925 0.1094 2.6730 0.0077 **
Earnings per share 0.1219 0.0693 1.7595 0.0790 .
Assets −0.8444 0.1388 −6.0816 0.0000 ***
Equity 0.3960 0.0865 4.5778 0.0000 ***
Book value per share −0.5496 0.0853 −6.4456 0.0000 ***
Financial leverage −0.4533 0.3676 −1.2332 0.2180
Debt to assets 0.0300 0.4897 0.0613 0.9512
Debt to equity 0.5203 0.6786 0.7668 0.4435
Table 4 cont.

192
Anna Blajer-Gołębiewska, Arkadiusz Kozłowski
Variable Coefficient Std. Err. t-value Pr(>|t|)
Long-term liabilities −0.0364 0.0899 −0.4043 0.6861
Short-term liabilities 0.3772 0.1362 2.7706 0.0058 **
Signif. codes: 0 ‘***’ 0.001 ‘**’ 0.01 ‘*’ 0.05 ‘.’ 0.1 ‘ ’
R-Squared: 0.1569 Adj. R-Squared: 0.1478
Hausman tests for panel model (random vs. fixed effects)
Effects test statistics ( 2) df p-value
individual 108.55 12 0.0000
F test for individual effects
F df1 df2 p-value
20.29 26 631 0.0000
Source: own compilation
Table 6
Fixed effects (individual) model for IT sector (second approach)
Variable Coefficient Std. Err. t-value Pr(>|t|)
Net profit 0.0114 0.0513 0.2218 0.8246
ROA 0.0280 0.1023 0.2733 0.7847
ROE −0.0019 0.0993 −0.0188 0.9850
Earnings per share 0.0580 0.0565 1.0278 0.3044
Assets 0.1789 0.1396 1.2817 0.2003
Equity 0.4194 0.1177 3.5645 0.0004 ***
Book value per share −0.6759 0.0584 −11.5759 0.0000 ***
Financial leverage −0.0027 0.2065 −0.0131 0.9895
Debt to assets 0.1049 0.4059 0.2585 0.7961
Debt to equity 0.2405 0.5182 0.4641 0.6427
Long-term liabilities −0.1718 0.0445 −3.8632 0.0001 ***
Short-term liabilities −0.2931 0.0628 −4.6670 0.0000 ***
Signif. codes: 0 ‘***’ 0.001 ‘**’ 0.01 ‘*’ 0.05 ‘.’ 0.1 ‘ ’
R-Squared: 0.1945 Adj. R-Squared: 0.1836
Table 5 cont.

193
Financial determinants of corporate reputation: A short-term approach
Hausman tests for panel model (random vs. fixed effects)
effects test statistics ( 2) df p-value
individual 37.03 12 0.0002
F test for individual effects
F df1 df2 p-value
40.38 34 795 0.0000
Source: own compilation
Because of the way the data has been ranked, there is no point in taking
time effects into consideration. Therefore, one Hausman test has been made for
individual effects only. It indicated that the fixed effects model would be more
appropriate. The F test strongly suggested that individual effects are significant.
The fitted model has more or less the same estimated coefficients as the corre-
sponding one from the first approach to data transformation. The same variables
are significant and with the same direction. However, the model is poorly fitted
to the data; the adjusted R2 do not exceed 0.15.
The fixed effects (individual) model for the IT sector in the second approach
shares the same characteristics as the random effects (individual) model in the first
approach to data transformation (Tables 4 and 6). It has the same four significant
variables with the same signs of coefficients. However, this model is weaker due
to the lower R2.
In the third approach to modelling reputation, the first difference of real values
were used instead of any transformation changing scale. The motivation of this op-
eration was the assumption that investors tend to invest in companies that are able
to improve their financial positions in terms of profitability, stability, and to lower
their levels of risk. These positive changes could influence investors’ decisions more
than just single numbers. For instance, a higher profit in a given quarter does not
guarantee a company’s better performances in the future. A natural consequence of
the introduction of differences is that the time dimension of data becomes shorter.
Here, the length of data set became shorter by the number of companies.
The same procedure as previous was applied to fitting panel data models.
For the construction sector, Hausman tests suggested using the random effects
approach for both effects. The Lagrange multiplier tests proved only the individual
effects to be significant. Therefore, the random effects (individual) model has
been fitted, and the estimates are presented in Table 7.
Again, the model is not well-fitted to the data. Also, the differences are ex-
pressed in the units of variables; thus, the above-mentioned influence of outliers
might be substantial. As a consequence, the estimated coefficients for the models
presented in Tables 7 and 8 are unreliable.
Table 6 cont.

194
Anna Blajer-Gołębiewska, Arkadiusz Kozłowski
Table 7
Random effects (individual) model for the construction sector (third approach)
Variable Coefficient Std. Err. t-value Pr(>|t|)
(Intercept) −1.1031 4.2695 −0.2584 0.7962
Net profit 0.0016 0.0002 6.8389 0.0000 ***
ROA 8.8470 144.8367 0.0611 0.9513
ROE 12.1070 3.2716 3.7007 0.0002 ***
Earnings per share −12.7691 4.2771 −2.9855 0.0029 **
Assets −0.0003 0.0030 −0.0977 0.9222
Equity −0.0001 0.0030 −0.0347 0.9723
Book value per share −0.2578 2.3082 −0.1117 0.9111
Financial leverage 100.8556 347.5211 0.2902 0.7717
Debt to assets −33.7633 93.9449 −0.3594 0.7194
Debt to equity −100.3062 347.5238 −0.2886 0.7730
Long-term liabilities 0.0008 0.0030 0.2681 0.7887
Short-term liabilities 0.0001 0.0030 0.0386 0.9692
Signif. codes: 0 ‘***’ 0.001 ‘**’ 0.01 ‘*’ 0.05 ‘.’ 0.1 ‘ ’
R-Squared: 0.2556 Adj. R-Squared: 0.2505
Hausman tests for panel model (random vs. fixed effects)
effects test statistics ( 2) df p-value
individual 1.91 12 0.9995
time 4.6 12 0.9701
Lagrange multiplier (Breush-Pagan) tests for individual and time effects
effects 2 df p-value
individual – random 12.29 1 0.0005
time – random 0.07 1 0.7914
Source: own compilation
Another approach to the analysis could be the use of ranks of first differences.
This approach was tested by the authors, and the results are very poor (R2 less
than 0.05); therefore, they will not be presented in this paper.

195
Financial determinants of corporate reputation: A short-term approach
Table 8
Random effects (individual) model for the IT sector (third approach)
Variable Coefficient Std. Error t-value Pr(>|t|)
(Intercept) −0.3316 0.6860 −0.4835 0.6289
Net profit 0.0000 0.0001 0.3660 0.7144
ROA −121.3203 30.2496 −4.0106 0.0001 ***
ROE 54.2505 5.2296 10.3737 0.0000 ***
Earnings per share 0.5539 1.2823 0.4320 0.6659
Assets 0.0000 0.0002 0.1186 0.9057
Equity 0.0001 0.0002 0.3641 0.7159
Book value per share −0.3385 0.6944 −0.4874 0.6261
Financial leverage 13.6253 16.2168 0.8402 0.4011
Debt to assets 54.3012 18.0786 3.0036 0.0028 **
Debt to equity −17.4093 16.2219 −1.0732 0.2835
Long-term liabilities 0.0000 0.0002 −0.0926 0.9262
Short-term liabilities −0.00 01 0.0002 −0.3704 0.7112
Signif. codes: 0 ‘***’ 0.001 ‘**’ 0.01 ‘*’ 0.05 ‘.’ 0.1 ‘ ’
R-Squared: 0.2809 Adj. R-Squared: 0.2764
Hausman tests for panel model (random vs. fixed effects)
effects test statistics ( 2) df p-value
individual 6.1 12 0.9109
time 15.76 12 0.2026
Lagrange multiplier (Breush-Pagan) tests for individual and time effects
effects 2 df p-value
individual – random 16.1 1 0.0001
time – random 0.03 1 0.8738
Source: own compilation
The last approach to the analysis was to compare companies with positive
reputations (i.e., where market value is greater than book value) to companies
with negative reputations. Because of the presence of outliers and highly skewed
distributions, the comparison was based on counts, and well-known chi-squared
tests for independence were performed. Each variable was divided in half by
median, and 2×2 contingency tables were created. To assess the magnitude of
correlation, Yule’s coefficients of colligation were also computed. The results
of these computations are presented in Tables 9 and 10.

196
Anna Blajer-Gołębiewska, Arkadiusz Kozłowski
Table 9
Chi-squared independence tests for the construction sector
VariableReputation
2 p-valueMV < BV MV > BV
Net profitbm 152 183
2.70 0.1003 0.067am 130 205
ROAbm 155 180
4.46 0.0346 0.085am 127 208
ROEbm 162 173
10.29 0.0013 0.127am 120 215
Earnings
per share
bm 133 2021.38 0.2405 −0.048
am 149 186
Assetsbm 174 161
25.87 0.0000 0.200am 108 227
Equitybm 164 171
12.40 0.0004 0.139am 118 217
Book value
per share
bm 108 22725.87 0.0000 −0.200
am 174 161
Financial
leverage
bm 172 16322.79 0.0000 0.187
am 110 225
Debt to assetsbm 173 162
24.30 0.0000 0.193am 109 226
Debt to equitybm 173 162
24.30 0.0000 0.193am 109 226
Long-term
liabilities
bm 169 16618.52 0.0000 0.169
am 113 222
Short-term
liabilities
bm 169 16618.52 0.0000 0.169
am 113 222
am – above median; bm – below median;
φ – Yule’s coefficient of colligation
Source: own compilation
The results presented in Tables 9 and 10 show that being either above or
below median for almost every variable is significantly associated with having
a positive or negative reputation. Nevertheless, such outcomes partially result
from relatively high counts, which make small percentage differences statisti-

197
Financial determinants of corporate reputation: A short-term approach
cally significant. Yule’s coefficients, showing the scale of correlation irrespective
of number of observations, are relatively low; i.e., not far from zero. In the case
of the construction sector, the highest absolute value of Yule’s coefficient is 0.2
for assets and −0.2 for book value per share. In the case of the IT sector, book
value per share is even more negatively associated with reputation, with the coef-
ficient’s value of −0.424.
Table 10
Chi-squared independence tests for the IT sector
VariableReputation
2 p-valueMV < BV MV > BV
Net profitbm 213 208
4.01 0.0452 0.071am 183 238
ROAbm 219 202
8.01 0.0046 0.100am 177 244
ROEbm 229 192
17.74 0.0000 0.148am 167 254
Earnings
per share
bm 195 2260.12 0.7299 −0.014
am 201 220
Assetsbm 177 244
8.01 0.0046 −0.100am 219 202
Equitybm 175 246
9.65 0.0019 −0.109am 221 200
Book value
per share
bm 109 312149.36 0.0000 −0.424
am 287 134
Financial leveragebm 219 202
8.01 0.0046 0.100am 177 244
Debt to assetsbm 218 203
7.25 0.0071 0.095am 178 243
Debt to equitybm 218 203
7.25 0.0071 0.095am 178 243
Long-term
liabilities
bm 189 2321.38 0.2405 −0.043
am 207 214
Short-term
liabilities
bm 185 2362.98 0.0843 −0.062
am 211 210
am – above median; bm – below median;
φ – Yule’s coefficient of colligation
Source: own compilation

198
Anna Blajer-Gołębiewska, Arkadiusz Kozłowski
Despite not being very high, Yule’s coefficients of colligation are in line
with most of the regression coefficients from the panel data models in the first
and second approaches. In both sectors, book value per share seems to have the
strongest influence on perceived reputation, and it is negative (which means the
greater the book value per share, the smaller the reputation). Book value (equity)
itself is positively correlated with reputation. Other than these two factors, there
are more differences than similarities between the sectors. According to regression
analysis, profitability has more impact on reputation in the construction sector,
whereas it is irrelevant in the IT sector.
5. Conclusions, study weaknesses, and directions for future research
In the study, we wanted to verify short-term impacts of selected financial
determinants on corporate reputation (as perceived by investors) in the context
of Roberts and Dowling’s model of reputation-financial performance dynamics.
In the model, it is assumed that past financial performance influences reputa-
tion, and reputation influences future financial performance of a given company
(Roberts and Dowling, 2002, pp. 1077–1093). As the influence of reputation on
financial performance was widely investigated and presented within the litera-
ture, we wanted to focus on the other part of the model: financial determinants
influencing corporate reputation.
In order to find an indicator for corporate reputation (as perceived by inves-
tors), we applied an approach from the field of business valuation assuming that
corporate reputation is reflected in the gap between the book value of a company
and the value that investors put on it (market value of a company).
Regarding quarter-to-quarter observations, analysed financial factors either
weakly affect or do not affect corporate reputation. In both analysed sectors
changes in profitability significantly affected corporate reputation. Nevertheless, it
is clear that the two analysed sectors have somehow different relationships between
financial determinants and corporate reputation. Generally, it seems that other
determinants of corporate reputation in the construction sector are stability and
profitability. For corporate reputation as perceived by investors in the IT sector,
significant determinants are stability and the level of financial risk (measured with
long- and short-term liabilities and changes in the debt-to-assets ratio).
The main weakness of the study is that the above findings are limited to the
two examined sectors – the estimated relationships in the construction sector
differ from those in the IT sector (and the same probably applies to other sec-
tors). Also, the estimated models are not well-fitted to the data, which may mean
199
Financial determinants of corporate reputation: A short-term approach
either financial factors do not influence corporate reputation at all, or the type
of relationships is different than examined.
The popular sentence says that reputation takes time to build up, but it is
easily damaged (Scott and Walsham, 2005, pp. 308–322). Data analyses conducted
for the purpose of this study seems to be consistent with this thesis. The fact
that there are only weak influences of financial variables on corporate reputation
could be explained by the fact that reputation building is a long process, taking
place in many small steps.
Therefore, it is necessary to conduct a similar study taking into account the
long-term impact of financial factors on the development of the reputation of stock
listed companies. Moreover, it would be beneficial to conduct analyses of impacts
of other factors that may influence corporate reputation, which constitute the
residual reputation in Roberts and Dowling. Such analyses should be conducted
not only in the long-run, but also in the short-run (for example, by applying an
event study methodology).
References
[1] Altman, E.I. (2000) ‘Predicting financial distress of companies: Revisiting the
Z-score and ZETA models’, Working Paper, Dept. of Finance, NYU, July 2000.
[2] Anderson, J. and Smith, G.N. (2006) ‘A Great Company Can Be a Great In-
vestment’, Financial Analysts Journal, vol. 62, no. 4, pp. 86–93.
[3] Barnett, M.L., Jermier, J.M. and Lafferty, B.A. (2006) ‘Corporate Reputation:
The Definitional Landscape’, Corporate Reputation Review, vol. 9, no. 1,
pp. 26–38.
[4] Beatty, R.P. and Ritter, J.R. (1986) ‘Investment Banking, Reputation, and
Underpricing of Initial Public Offerings’, Journal of Financial Economics,
vol. 15, no. 1–2, pp. 213–232.
[5] Black E.L., Carnes, T.A. and Richardson, V.J. (2000) ‘The Market Valuation
of Corporate Reputation’, Corporate Reputation Review, vol. 3, no. 1,
pp. 31–42.
[6] Blajer-Gołębiewska, A. (2014a) ‘Corporate Reputation and Economic Perfor-
mance: the Evidence from Poland’, Economics and Sociology, vol. 7, no. 3,
pp. 194–207.
[7] Blajer-Gołębiewska, A. (2014b) ‘Do Stock Exchange Indices Based on Reputa-
tional Factors Matter?’, International Journal of Academic Research, Part B,
vol. 6, no. 4, pp. 231–237.
[8] Blajer-Gołębiewska, A. and Kos, M. (2016) ‘Investors are More Sensitive to
Information About Financial Rather than Ethical Reputation of a Company:
Evidence from an Experimental Study’, Economics and Sociology, vol. 9,
no. 1, pp. 11–31.

200
Anna Blajer-Gołębiewska, Arkadiusz Kozłowski
[9] Brammer, S., Brooks, C. and Pavelin, S. (2006) ‘Corporate Reputation and
Stock Returns: Are Good Firms Good for Investors?’, ICMA Center Discussion
Papers in Finance, DP2006-05.
[10] Brennan, N.M., Guillamon-Saorin, E. and Pierce, A. (2009) ‘Impression
management: Developing and illustrating a scheme of analysis for narrative
disclosures – A methodological note: Accounting’, Auditing and Account-
ability Journal, vol. 22, no. 5, pp. 789–832.
[11] Breusch, T.S. and Pagan, A.R. (1980) ‘The Lagrange multiplier test and its
applications to model specification in econometrics’, Review of Economic
Studies, vol. 47, no. 1, pp. 239–253.
[12] Cole, S. (2012) ‘The Impact of Reputation on Market Value’, World Econom-
ics, vol. 13, no. 3, pp. 47–68.
[13] Cox, P., Brammer, S. and Millington, A. (2004) ‘An Empirical Examination of
Institutional Investor Preferences for Corporate Social Performance’, Journal
of Business Ethics, vol. 52, no. 1, pp. 27–43.
[14] Easton, P. and Harris, T. (1991) ‘Earnings as an Explanatory Variable for
Returns’, Journal of Accounting Research, vol. 29, no. 1, pp. 19–36.
[15] Feltham, G.A. and Ohlson, J.A. (1995) ‘Valuation and clean surplus accounting
for operating and financial activities’, Contemporary Accounting Research,
vol. 11, no. 2, pp. 689–731.
[16] Fernández, P. (2005) ‘Company Valuation Methods: The most common Errors
in Valuation’, Investment Management and Financial Innovations Journal,
vol. 2, no. 2, pp. 128–141.
[17] Fombrun, C.J. and van Riel, C.B.M. (1997) ‘The Reputational Landscape’,
Corporate Reputation Review, vol. 1, no. 1/2, pp. 5–13.
[18] Harrington, C. (2003) ‘Socially Responsible Investing’, Journal of Accoun-
tancy, January, pp. 52–61.
[19] Hausman, J.A. (1978) ‘Specification tests in econometrics’, Econometrica,
vol. 46, no. 6, pp. 1251–1271.
[20] Hillier, D., Grinblatt, M. and Titman, S. (2008) Financial Markets and Cor-
porate Strategy, New York: McGraw-Hill.
[21] Jaki, A. (2008) Wycena i kształtowanie wartości przedsiębiorstwa, Kraków:
Oficyna Wolters Kluwer.
[22] Machała R. (2011) Zarządzanie finansami i wycena firmy, Wrocław: Wydawnic-
two Unimex.
[23] Marcellis-Warin de, N. and Teodoresco, S. (2012) ‘Corporate Reputation: Is
Your Most Strategic Asset at Risk?’, Center for Interuniversity Research and
Analysis on Organizations, Burgundy Report 2012RB-01.
[24] Responsible Company Ranking (2015) Responsible Business Forum, [Online],
Available: http://odpowiedzialnybiznes.pl [15 May 2016].

Financial determinants of corporate reputation: A short-term approach
[25] Riahi-Belkaoui, A. (1999) ‘Contextual Accrual and Cash Flow Based Valuation
Models: Impact of Multinationality and Reputation’, Advances in Financial
Planning and Forecasting, vol. 10, pp. 25–36.
[26] Riahi-Belkaoui, A. (2003) ‘Corporate Reputation, Internalization and the
Market Valuation of Multinational Firms’, Working paper, University of
Illinois at Chicago, [Online], Available: http://ssrn.com/abstract=412005
[2 Jan 2016].
[27] Roberts, P. and Dowling, G. (2002) ‘Corporate Reputation and Sustained
Superior Financial Performance’, Strategic Management Journal, vol. 23,
no. 12, pp. 1077–1093.
[28] Rozporządzenie Ministra Finansów w sprawie informacji bieżących i okre-
sowych przekazywanych przez emitentów papierów wartościowych oraz
warunków uznawania za równoważne informacji wymaganych przepi-
sami prawa państwa niebędącego państwem członkowskim, Dz. U. 2014,
poz. 133, [Online], Available: http://www.isip.sejm.gov.pl [17 May 2016].
[29] Sabate, J.M. and Puente, E. (2003) ‘Empirical Analysis of the relationship
between corporate reputation and financial performance: A survey of the
literature’, Corporate Reputation Review, vol. 6, no. 2, pp. 161–177.
[30] Scott, S.V. and Walsham, G. (2005) ‘Reconceptualising and managing reputa-
tion risk in the knowledge economy: towards reputable action’, Organiza-
tional Science, vol. 16, no. 3, pp. 308–322.
[31] Smith, K.T., Smith, M. and Wang, K. (2010) ‘Does Brand Management of
Corporate Reputation Translate into Higher Market Value?’, Journal of
Strategic Marketing, vol. 18, no. 3, pp. 201–221.
[32] Wooldridge, J.M. (2002) Econometric analysis of cross-section and panel
data, London: MIT Press.