Embed Size (px)
Citation preview

Financial crisis and quantitative methods: problems and solutions
Are European Deposit Protection Schemes
efficient enough?
Adamo UboldiJoint Research Centre
European Commission
Unit for Econometrics and Applied StatisticsFinancial Econometrics for a Single Market and Competitiveness Policies

Financial crisis and quantitative methods: problems and solutions
Plan of the talk
Deposit Protection Schemes (DPS) in the EU
Reaction to the financial crisis
Efficiency of EU DPS
Quantitative tools and risk-based contributions

Financial crisis and quantitative methods: problems and solutions
Deposit Protection in the EU
AIM: to provide a safety net for depositors so that, if a credit
institution fails, they will be able to recover their bank
deposits up to a certain limit
HOW: Directive 94/19/EC on Deposit Guarantee Schemes
(DGS) and current amendment proposal

Financial crisis and quantitative methods: problems and solutions
Protection of depositors’
wealth
through the introduction of a
minimum threshold (€20,000 till
October 08)
Directive 94/19/EC (I)
Maintenance of confidence in
the EU banking system
through protection of stability,
avoiding a run on the banks
Objectives

Financial crisis and quantitative methods: problems and solutions
Directive 94/19/EC (II)
Member States have to ensure one or more officially recognised
DGS and ALL deposit-taking credit institutions must join DGS
EU has a total of 39 DGS (some MS have more than one DGS)
Minimum coverage level set at € 20,000
MS apply different coverage levels from min. € 20,000 to max. € 103,000
Obligation for DGS to repay depositors’ claims within three
months from triggering event (possible extension up to nine
months)
90% of deposits and 70% of depositors have been repaid within 3 months
Key provisions and implementation

Financial crisis and quantitative methods: problems and solutions
Current financial crisis (I)
Quick response to crisis: DG-MARKT asked JRC to perform an
early IA on possible changes of coverage level
October 9th: delivery of a confidential Impact Assessment to
feed the amendment proposal of Directive 94/19/EC
as the situation of financial markets was requiring immediate
actions, no detailed IA was possible at that time…
Financial crisis and quantitative methods: problems and solutions
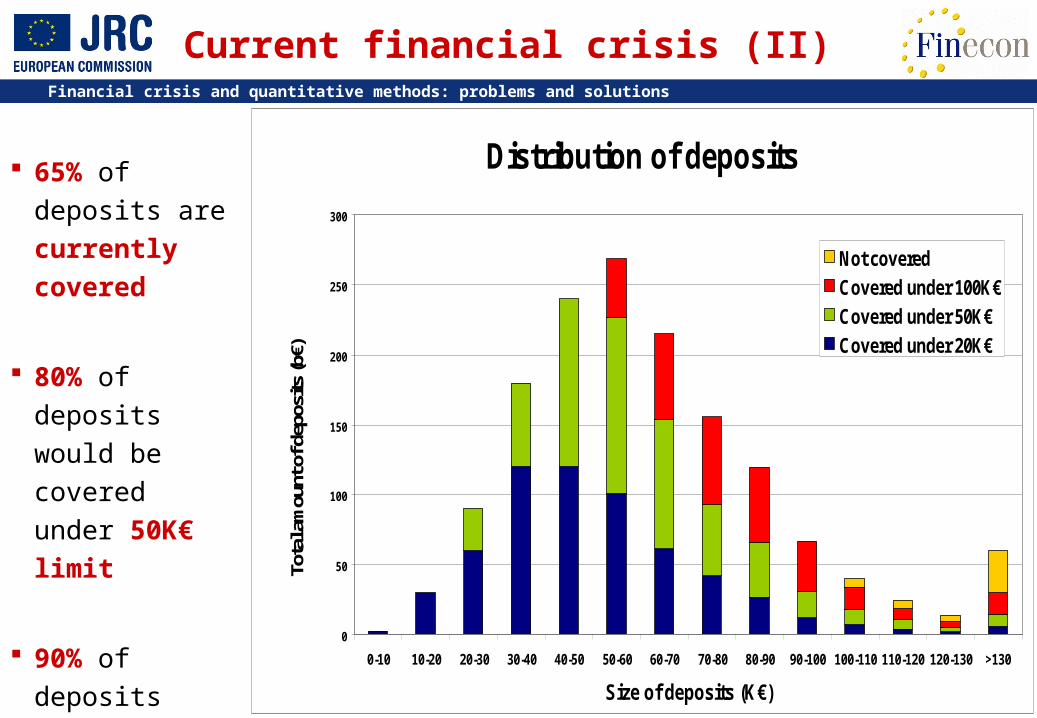
Current financial crisis (II)
65% of deposits are currently covered
80% of deposits would be covered under 50K€ limit
90% of deposits would be covered under 100K€ limit
Distribution of deposits
0
50
100
150
200
250
300
0-10 10-20 20-30 30-40 40-50 50-60 60-70 70-80 80-90 90-100 100-110 110-120 120-130 >130
Size of deposits (K€)
Tota
l am
ount
of d
epos
its (b
€)
Not covered
Covered under 100K€
Covered under 50K€
Covered under 20K€
Financial crisis and quantitative methods: problems and solutions
50K€ Eligible deposits (m€) Absolute exposure (m€)
BE 188,791 66,172
CZ 40,854 866
DK 106,029 9,986
DE 1,615,946 530,812
EE 2,590 137
IE 143,226 43,593
GR 98,926 27,816
ES 575,940 160,284
FR 839,391 -
IT 511,527 -CY 16,887 1,336
LV 5,115 284
LT 3,903 141
LU 86,734 30,486
HU 27,649 1,059
MT 4,617 365
NL 264,839 23,249
AT 158,338 66,883
PL 63,934 4,588
PT 108,384 19,828
SI 10,760 3,261
SK 10,150 1,120
FI 68,948 17,248
SE 113,094 28,520
UK 1,728,510 -
EU 25 total 6,795,082 1,038,035
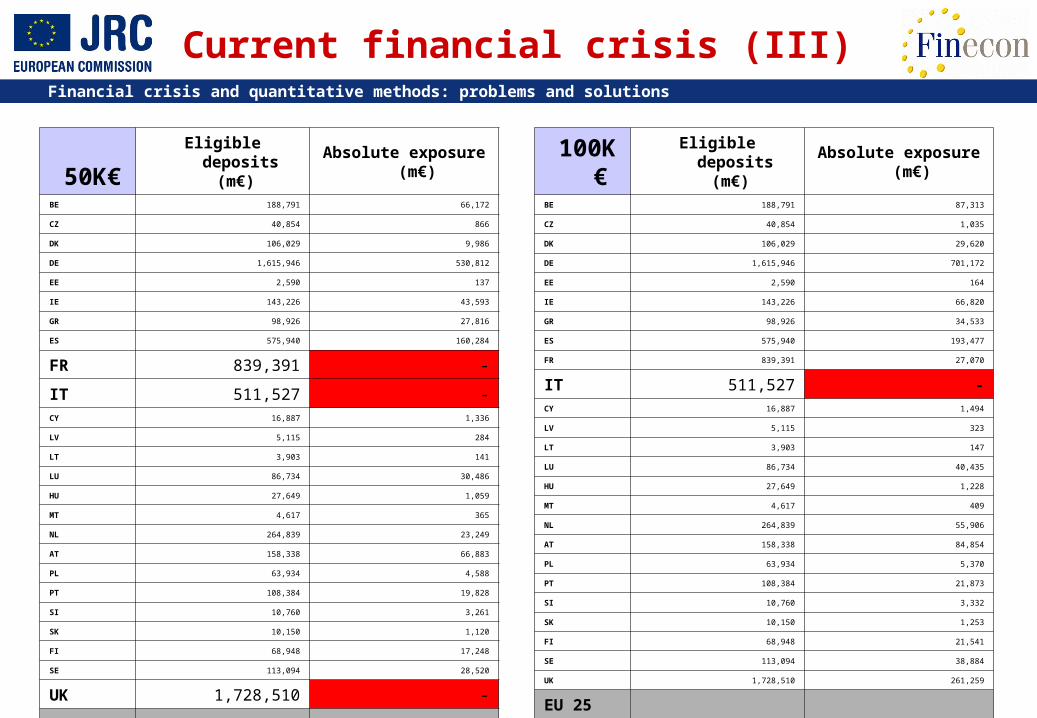
Current financial crisis (III)
100K€ Eligible deposits (m€) Absolute exposure (m€)
BE 188,791 87,313
CZ 40,854 1,035
DK 106,029 29,620
DE 1,615,946 701,172
EE 2,590 164
IE 143,226 66,820
GR 98,926 34,533
ES 575,940 193,477
FR 839,391 27,070
IT 511,527 -CY 16,887 1,494
LV 5,115 323
LT 3,903 147
LU 86,734 40,435
HU 27,649 1,228
MT 4,617 409
NL 264,839 55,906
AT 158,338 84,854
PL 63,934 5,370
PT 108,384 21,873
SI 10,760 3,332
SK 10,150 1,253
FI 68,948 21,541
SE 113,094 38,884
UK 1,728,510 261,259
EU 25 total 6,795,082 1,679,510

Financial crisis and quantitative methods: problems and solutions
Data Problems
Deposits/Fund/Premiums
Past DGS actions
Payout delays
Cross-border exposure
Qu
an
t.Q
ualit
. Triggering event
Intervention procedure
Authorities involved
Dataset incomplete
Confidentiality
Definitions
Late answers (DE missing)
Aggregation of data
Missing information
Heterogeneity of data
Overlapping with bankruptcy law
Investigating DGS Efficiency

Financial crisis and quantitative methods: problems and solutions
DGS Actions
Types
Payout (16 DGS out of 37)
Preventive (21 DGS out of 37)
Since 1994 only 22/37 DGS
have intervened
67 payouts (37 EU-15, 22
UK)
27 preventive (26 EU-15)
No cross-border cases

Financial crisis and quantitative methods: problems and solutions
Triggering Event of Payouts
Following the Directive the
event triggering the payout in all
EU MS is the unavailability of
deposits
The DGS intervenes only after
the declaration by the competent
authority
No common rules
Financial crisis and quantitative methods: problems and solutions
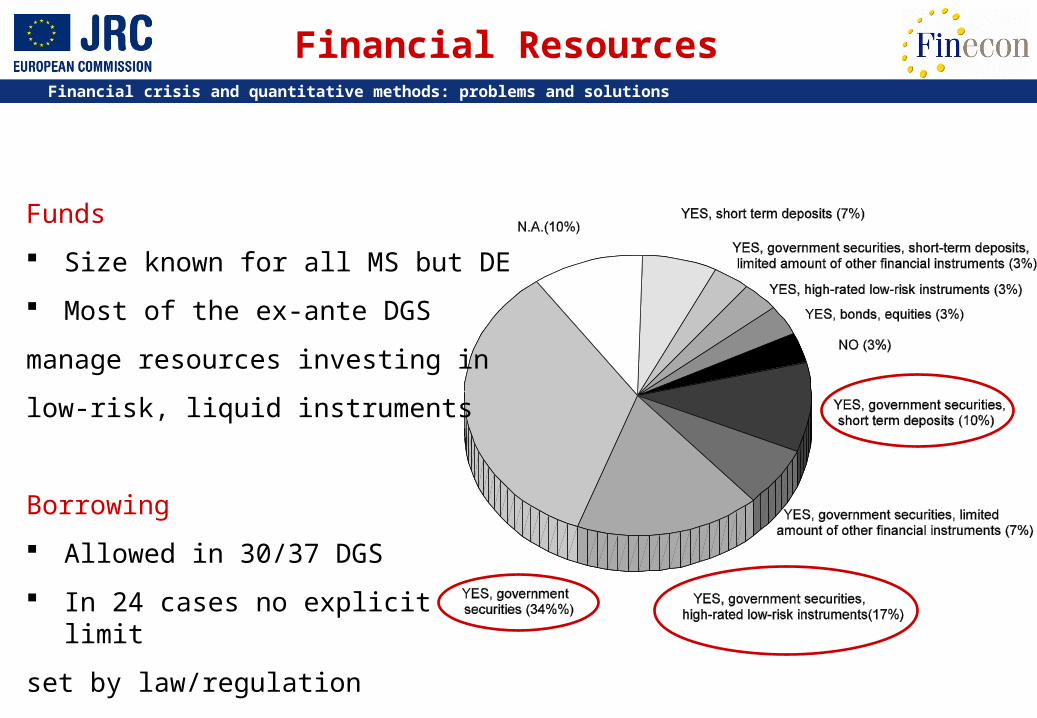
Financial Resources
Funds
Size known for all MS but DE
Most of the ex-ante DGS
manage resources investing in
low-risk, liquid instruments
Borrowing
Allowed in 30/37 DGS
In 24 cases no explicit limit
set by law/regulation

Financial crisis and quantitative methods: problems and solutions
Payout Delays
AmountNumber

Financial crisis and quantitative methods: problems and solutions
Scenarios Definition
Scenario 1: High
Scenario 2: Medium
Scenario 3: Small
Scenario 4: Medium
Scenario 5: Very High
Payout
Preventive
Cross-border
IR = 3.24, highest in EU-12
IR = 0.81, 2003 failure in EU-12
IR = 0.035, highest in EU-15
IR = 0.16, 2003 failure EU-15
Fictitious, due to lack of data
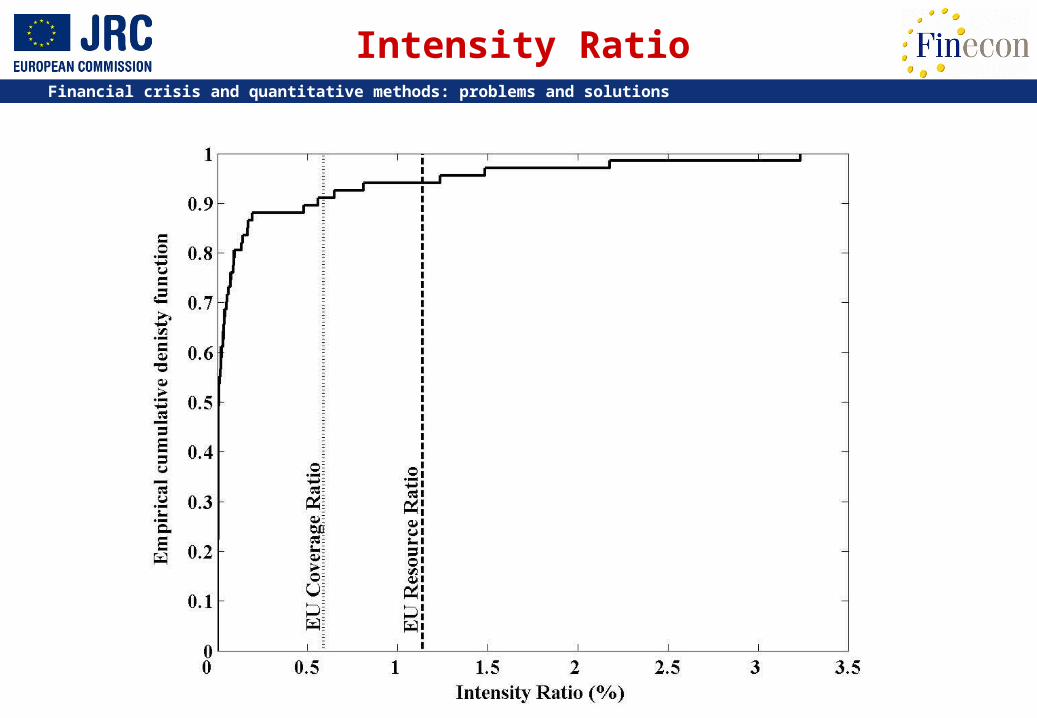
Deposits Eligible of Amount TotalonInterventi ofCost Total Intensity Ratio =

Financial crisis and quantitative methods: problems and solutions
Scenarios Results EU-15
BB

Financial crisis and quantitative methods: problems and solutions
BBB B BB
B B
Scenarios Results EU-12
Financial crisis and quantitative methods: problems and solutions
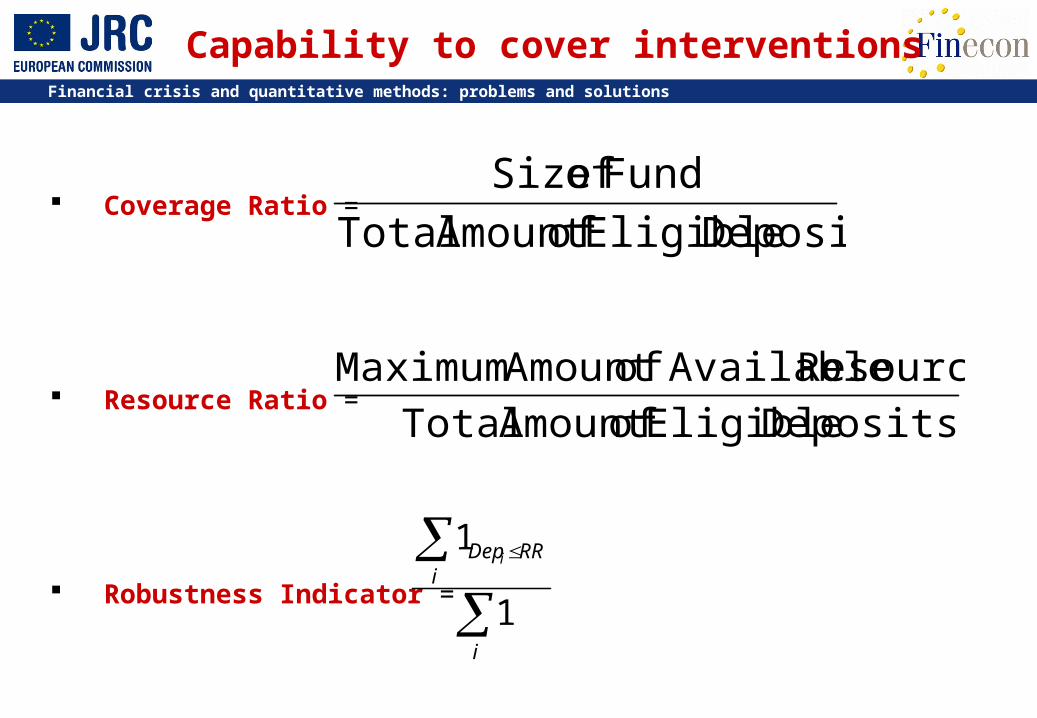
Coverage Ratio =
Resource Ratio =
Robustness Indicator =
Capability to cover interventions
Deposits Eligible of Amount TotalResources Availableof Amount Maximum
Deposits Eligible of Amount TotalFund of Size
i
iRRDepi
1
1

Financial crisis and quantitative methods: problems and solutions
Coverage and Resource Ratio
Financial crisis and quantitative methods: problems and solutions
Intensity Ratio

Financial crisis and quantitative methods: problems and solutions
Cross-border exposures: branches
Financial crisis and quantitative methods: problems and solutions
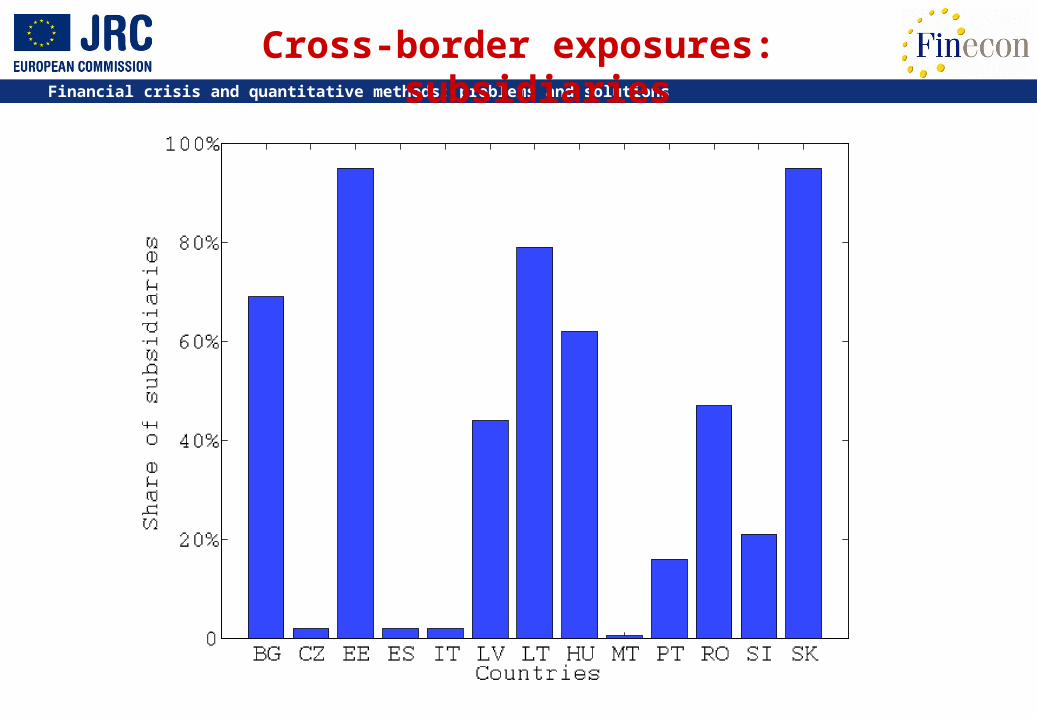
Cross-border exposures: subsidiaries
Financial crisis and quantitative methods: problems and solutions
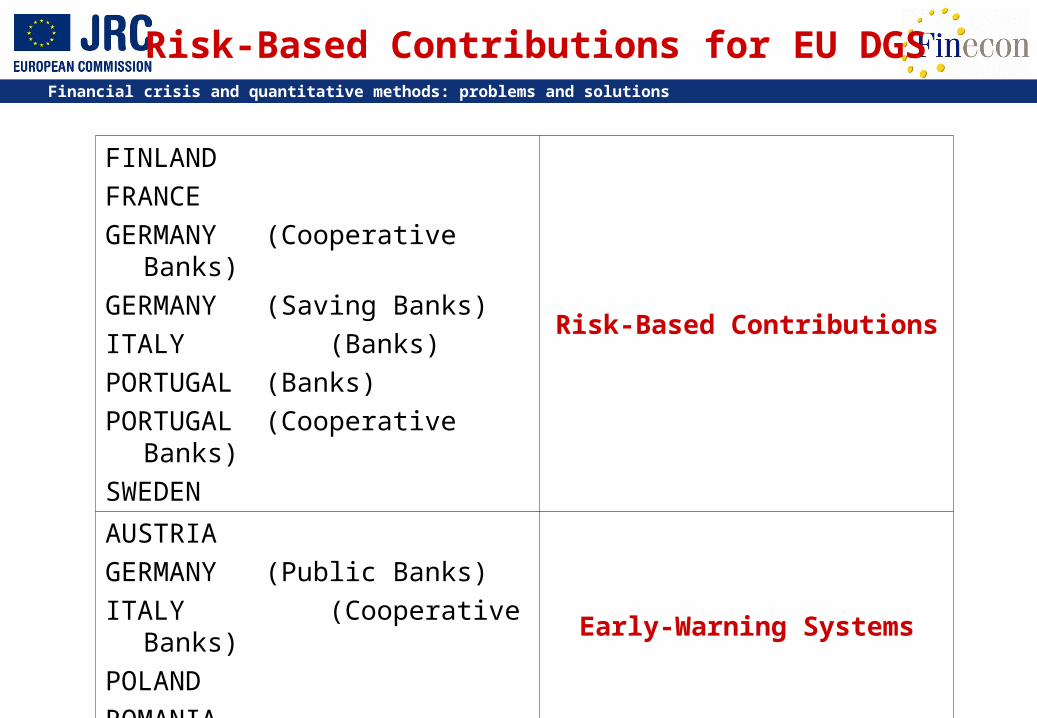
Risk-Based Contributions for EU DGS
FINLANDFRANCEGERMANY (Cooperative
Banks)GERMANY (Saving Banks)ITALY (Banks)PORTUGAL (Banks)PORTUGAL (Cooperative
Banks)SWEDEN
Risk-Based Contributions
AUSTRIAGERMANY (Public Banks)ITALY (Cooperative Banks)POLANDROMANIA
Early-Warning Systems

Financial crisis and quantitative methods: problems and solutions
Indicators
Capital Structure / Solvency Profile
Riskiness / Exposure
Profitability / Income
Maturity transformation / Duration
Classes ofIndicators
• The risk is assessed using indicators
• The indicators are built using financial ratios based on balance-sheet data, financial statement data or other types of accounting data
• Current ratios are quite heterogeneous

Financial crisis and quantitative methods: problems and solutions
Towards a common Risk-Based System
iii xc
Homogenous Framework: identification of a generalized formula for risk-based contributions ci of the i-th member
xi = i-th member’s contribution base (e.g. eligible or covered deposits…)
i = i-th member’s risk-based adjustment
= fixed percentage determining the aggregated contribution (i.e. NOT influenced by single members’ risk, common value for ALL members)Indicators Scores Rating
Classi

Financial crisis and quantitative methods: problems and solutions
Contribution
OAC ∙ NSR
Overall Amount
of Contribution
(OAC)
Net Risk Amount
(xi + i) ∙i
Correction i
Contribution base (xi + i)
Indicators
Scores i
Net Share of
Risk (NSR)
France

Financial crisis and quantitative methods: problems and solutions
Contribution Quotas
Risk
Correction (i)
Indicators (WAAI)
ContributionRegressive Quotas
Dimension Correction (i)
Proportional Quotas
Covered Deposits
Italy – Commercial banks

Financial crisis and quantitative methods: problems and solutions
Elasticity analysis

Financial crisis and quantitative methods: problems and solutions
Reliability and time evolution

Financial crisis and quantitative methods: problems and solutions
Real mathematical modelling...
Merton framework: it assesses the credit risk of a bank by characterizing the bank's equity as a call option on its assets.
The bank has a certain amount of zero-coupon debt that will become due at a future time T.
The bank defaults if the value of its assets is less than the promised debt repayment at time T.
The equity of the bank is a European call option on the assets of the bank with maturity T and a strike price equal to the face value of the debt. The model can be used to estimate the risk-neutral probability of the bank.