Embed Size (px)
Citation preview


Contents
Financial and Operating Highlights 1
To Shareholders 2
2013 Result 2
2014 Preview 6
Future Development Strategies 7
Competition, Legal Issues and the Operating Environment 8
The Company 10
Major Milestones 10
Calendar of 2013 & 2014 Events 12
Organization 13
Directors and Supervisors 14
Principal Officers 21
Corporate Governance 28
Corporate Social Responsibility 31
Ethical Corporate Management 36
Major Shareholder and BOD Resolutions 39
Capital and Shares 44
The Fleet 48
The Network 49
Human Resources 52
Financial and Operating Results 53
Financial Results 53
Analysis of Financial Status and Financial Performance 65
Principal Subsidiaries 68
Operating Results 69
Financial Statements 70
Consolidated Financial Statements with Independent Auditors' Report 70
Parent-Company-Only Financial Statements with Independent Auditors' 147
Report

Financial and Operating Highlights Financial Statistics
The Consolidated The Company
2013 2012 % Change 2013 2012 % Change
Results Revenue NT$ million 124,164 120,158 3.33% 110,747 107,148 3.36%
Total Costs NT$ million 120,694 117,749 2.50% 109,159 106,952 2.06%
Operating Income NT$ million 3,470 2,409 44.05% 1,588 196 709.89%
Profit NT$ million 1,280 1,196 7.03% 747 655 14.08%
EPS NT$ 0.23 0.20 15.00% 0.23 0.20 15.00%
Profit Margin % 1.03% 1.00% 0.03ppt 0.67% 0.61% 0.06ppt
Financial Position
Total Assets NT$ million 152,723 155,524 -1.80% 139,395 142,294 -2.04%
Total Liabilities NT$ million 112,466 116,140 -3.16% 103,557 106,926 -3.15%
Total Equity NT$ million 40,257 39,385 2.22% 35,838 35,368 1.33%
Debt Ratio % 73.64% 74.68% -1.04ppt 74.29% 75.14% -0.85ppt
The Company Operating Statistics 2013 2012 % Change
Passenger Revenue NT$ million 71,100 65,618 8.35%
Passengers Carried Thousand 8,009 7,525 6.44%
Passenger Traffic Million 27,681 25,988 6.52%
Passenger Capacity Million 34,765 32,770 6.09%
Passenger Load Factor % 79.62% 79.30% 0.32ppt
Passenger Yield NT$ 2.57 2.52 1.73%
Cargo Revenue NT$ million 32,033 34,351 -6.75%
Cargo Carried Tons 713,805 741,832 -3.78%
Cargo Traffic Million 4,278 4,472 -4.32%
Cargo Capacity Million 5,177 5,359 -3.39%
Cargo Load Factor % 82.64% 83.44% -0.81ppt
Cargo Yield NT$ 7.49 7.68 -2.53%
Overall Traffic Million 6,770 6,811 -0.60%
Overall Capacity Million 8,306 8,308 -0.03%
Overall Load Factor % 81.50% 81.97% -0.47ppt
Overall Yield NT$ 15.23 14.68 3.79%
Unit Cost NT$ 13.14 12.87 2.10%
Number of Employees 7,077 6,429 10.08%
Traffic per Employee Thousand 957 1,059 -9.63%
Capacity per Employee Thousand 1,174 1,292 -9.13%
Revenue per Employee NT$ thousands 15,649 16,666 -6.10%
1

To Shareholders
2013 Results
In 2013, we carried 8.01 million passengers
and 710,000 tons of cargo, achieving a combined
load factor of 82%. EVA Air’s annual operating
revenue climbed to NT$110.75 billion, a 3%
increase compared to 2012, resulting in profit for
the year of NT$0.75 billion. Consolidated annual
operating revenue reached NT$124.16 billion, also
a 3% increase over 2012, producing NT$1.28
billion in profit and per share earnings of NT$0.23
for the year.
Passenger revenue increased 8% or
NT$5.5 billion over 2012, reaching
NT$71.1 billion
Benefiting from the Japanese yen’s
depreciation, Taiwan tourism to Japan increased
sharply. And due to stable cross-Strait relations,
China has remained open to FIT (foreign
independent tours) to Taiwan for citizens of its
tier-2 cities. In addition to EVA Air joining Star
Alliance mid-year, these 2013 developments had a
multiplier effect that led to 6.4% more passengers.
Going forward, we will actively optimize our
networks in Europe, America and Asia by
strengthening our transport business in Europe and
North America and further developing our China
market. We will also grow our high-value
customer base through the complementary Star
Alliance network, strengthen our niche in
neighboring markets, more fully integrate regional
and intercontinental resources and work in
cooperation with the Taoyuan Aerotropolis
program to increase transit business.
Cargo revenue declined by 7% or NT$2.3
billion over 2012, totaling NT$32.0 billion
Due to economic conditions created by slow
global economic recovery, airfreight demand has
been weak. We responded by adjusting our route
structure and airfreight capacity, in addition to
initiating other measures that, together, stabilized
our load factor decline at a minimal 1% compared
to 2012.
Anticipating future changes in the global
airfreight market, we aim to maintain stable
profits by making moderate cargo fleet
adjustments and strengthening our sales network
worldwide.
Expanded fleet to 62 aircraft, continued to
replace older models
At year-end 2013, we were operating a fleet
of 62 aircraft made up of 47 passenger jets and 15
freighters. We removed one Boeing 747-400
Combi from service and took delivery of three
brand-new Airbus 321-200s. We have listed the
types of aircraft in our fleet in the following table:
Aircraft Type Quantity
B747-400 3
B747-400 Combi 2
B747-400 (Freighter) 9
MD-11 (Freighter) 6
MD-90 7
B777-300ER 15
A330-200 11
A330-300 3
A321-200 6
Total 62
Safety and quality service recognized for
excellence
We have remained committed to enhancing
the quality of all of our services and recognized
within the aviation industry for our top flight
safety record. Over the years, we have been
singled out for numerous honors and awards. In
2013, EVA was identified as one of world's 10
safest airlines by website AirlineRatings.com and
ranked fifth among the world’s top-10 safest
carriers by Germany’s AERO International
Magazine, consistently earning accolades for our
superb record and high standards. Highlighting the
quality of our services, EVA won two categories in
Business Traveller’s annual wine competition,
taking first place for both the best white and
sparkling wines.
2

We completed cabin upgrades to our 15
B777-300ERs in 2013 and successfully introduced
Royal Laurel Class in all of the markets we serve
with this fleet. We have configured this
luxurious new business class cabin in a reverse
herringbone with seats that envelope each
passenger in his or her own private space and, at
the same time, offer the option of moving forward
with the touch of a button to talk or dine with a
travel companion. Fully lie-flat seats and
thoughtful amenities such as adjustable lumbar
supports, coat hooks, spaces for shoe stowage,
movable armrests and convenient seat-side tables
for beverages, snacks, electronic devices or
reading materials make this cabin exceptionally
comfortable and attractive.
Our excellent flight safety record, service
reliability and advanced fleet have also captured
the attention of domestic and international
shippers with priceless cargo and we were
entrusted with two world-class art exhibitions in
2013. We carried 37 irreplaceable paintings for
“Joan Miró: Women, Birds, Stars” from Frankfurt
to Taipei and another 59 masterpieces for “Renoir
and Painters of the Twentieth Century” between
Tokyo, Osaka, Paris, New York and Taipei. We
also transported the “God Emperor Guansheng”
statue from Yuncheng City, Shanxi Province,
Mainland China to Taiwan for a widely acclaimed
blessing tour that included multiple stops in cities
throughout the island.
Established EVA Flight Training Academy
to enhance fundamental pilot
qualifications and quality
To elevate qualifications and flying skills, in
addition to cultivating our own pilots, we
established a flight training academy in California,
U.S.A. Our Flight Training Academy not only
improves fundamental flight-training quality but
also more effectively meets our rigid aviation
safety requirements.
We opened our new EVA Flight Training
Academy in December 2013. Current equipment
includes one twin-engine and two single-engine
trainer aircraft. Soon, we will expand Academy
facilities to also include a hangar, aircraft apron,
dormitory and more. We will continue to add
fundamental training equipment, one piece at a
time, and expect to be offering as many as 10
single-engine and three twin-engine trainer aircraft
by 2016. We will be equipped to train as many as
100 students a year at the Academy by 2017. In
addition to developing it as a resource for
cultivating our own pilots, we also expect to
extend the Academy’s services to pilots from
other airlines.
Consolidated subsidiary enterprises
We consolidated Evergreen Aviation
Technologies Corp., Evergreen Sky Catering
Corp., Evergreen Airline Services Corp. and
Evergreen Air Cargo Service Corp. to streamline
planning, optimize our participation in
aviation-related industries and ensure that we
continue to provide all of our customers excellent
airline services. Our consolidated companies
produced outstanding operating performances in
2013. We summarize reportable results for our
consolidated companies in the following
paragraphs.
Evergreen Aviation Technologies Corp. (EGAT)
EGAT provides aircraft maintenance and
parts and component procurement. EVA holds
80% of its shareholder equity. In addition to
servicing our own fleet throughout 2013, EGAT
renewed a five-year fuselage-maintenance
agreement with U.S.-based Atlas Air in 2013 and
signed a five-year fuselage-maintenance
agreement with Belgium-based TUI JetairFly.
Broad experience and exceptional capabilities also
lead other well-known airlines to use EGAT for
their aircraft maintenance.
Evergreen Sky Catering Corp. (EGSC)
EGSC provides catering services for airline
passengers. As it met growing demands from EVA
and other carriers in 2013, EGSC also initiated a
business promotion campaign and added Hawaiian
Airlines and Emirates Airlines to its lengthy roster
of food-service customers. By enhancing its
existing business and expanding its customer base,
EGSC’s air catering business and operating
income have both hit record highs.
Results vs. Projections
EVA forecast NT$110.30 billion in operating
revenue for 2013 and, at NT$110.75 billion,
achieved 100.4%. We expected pre-tax net profit
of NT$0.82 billion and produced higher results at
NT$0.92 billion.
We forecast NT$123.67 billion in 2013 operating
revenue for our Consolidated Company and, at
NT$124.16 billion, also achieved 100.4%. We
3
also expected pre-tax net profit of NT$1.69 billion
and produced even better results at NT$1.84
billion.
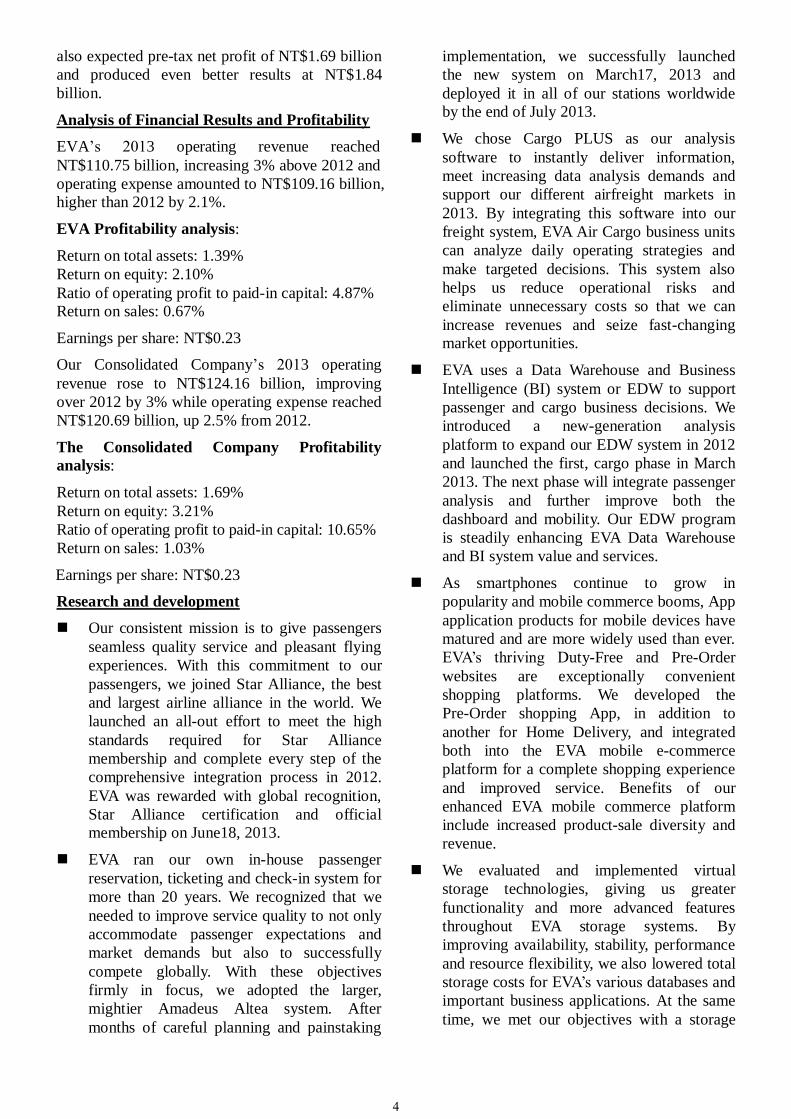
Analysis of Financial Results and Profitability
EVA’s 2013 operating revenue reached
NT$110.75 billion, increasing 3% above 2012 and
operating expense amounted to NT$109.16 billion,
higher than 2012 by 2.1%.
EVA Profitability analysis:
Return on total assets: 1.39%
Return on equity: 2.10%
Ratio of operating profit to paid-in capital: 4.87%
Return on sales: 0.67%
Earnings per share: NT$0.23
Our Consolidated Company’s 2013 operating
revenue rose to NT$124.16 billion, improving
over 2012 by 3% while operating expense reached
NT$120.69 billion, up 2.5% from 2012.
The Consolidated Company Profitability
analysis:
Return on total assets: 1.69%
Return on equity: 3.21%
Ratio of operating profit to paid-in capital: 10.65%
Return on sales: 1.03%
Earnings per share: NT$0.23
Research and development
Our consistent mission is to give passengers
seamless quality service and pleasant flying
experiences. With this commitment to our
passengers, we joined Star Alliance, the best
and largest airline alliance in the world. We
launched an all-out effort to meet the high
standards required for Star Alliance
membership and complete every step of the
comprehensive integration process in 2012.
EVA was rewarded with global recognition,
Star Alliance certification and official
membership on June18, 2013.
EVA ran our own in-house passenger
reservation, ticketing and check-in system for
more than 20 years. We recognized that we
needed to improve service quality to not only
accommodate passenger expectations and
market demands but also to successfully
compete globally. With these objectives
firmly in focus, we adopted the larger,
mightier Amadeus Altea system. After
months of careful planning and painstaking
implementation, we successfully launched
the new system on March17, 2013 and
deployed it in all of our stations worldwide
by the end of July 2013.
We chose Cargo PLUS as our analysis
software to instantly deliver information,
meet increasing data analysis demands and
support our different airfreight markets in
2013. By integrating this software into our
freight system, EVA Air Cargo business units
can analyze daily operating strategies and
make targeted decisions. This system also
helps us reduce operational risks and
eliminate unnecessary costs so that we can
increase revenues and seize fast-changing
market opportunities.
EVA uses a Data Warehouse and Business
Intelligence (BI) system or EDW to support
passenger and cargo business decisions. We
introduced a new-generation analysis
platform to expand our EDW system in 2012
and launched the first, cargo phase in March
2013. The next phase will integrate passenger
analysis and further improve both the
dashboard and mobility. Our EDW program
is steadily enhancing EVA Data Warehouse
and BI system value and services.
As smartphones continue to grow in
popularity and mobile commerce booms, App
application products for mobile devices have
matured and are more widely used than ever.
EVA’s thriving Duty-Free and Pre-Order
websites are exceptionally convenient
shopping platforms. We developed the
Pre-Order shopping App, in addition to
another for Home Delivery, and integrated
both into the EVA mobile e-commerce
platform for a complete shopping experience
and improved service. Benefits of our
enhanced EVA mobile commerce platform
include increased product-sale diversity and
revenue.
We evaluated and implemented virtual
storage technologies, giving us greater
functionality and more advanced features
throughout EVA storage systems. By
improving availability, stability, performance
and resource flexibility, we also lowered total
storage costs for EVA’s various databases and
important business applications. At the same
time, we met our objectives with a storage
4

system we can use to manage all critical data
that also has more security and future
scalability.
Including EVA’s data center network core and
office system, we restructured and improved
our headquarters network architecture in
2013, effectively meeting increasing
demands of daily airline operations. Our
expanded network capacity, wider bandwidth
and faster response time give us better
headquarters architecture availability and, as
a bonus, reduce the number of devices we
need for storage. We successfully eliminated
network device sprawl and significantly
improved performance. And we are ready to
prepare for operation network demands.
We renovated and implemented the new,
global EVA office VPN (Virtual Private
Network) network for our internal users
worldwide in 2013. This system provides
easier access, better performance, greater
stability, more availability and wider office
network bandwidth. Our VPN backbone
enhancements have made it easier to manage
our global office network and equipped us to
meet future traffic demands.
5

2014 Preview
Operating Guidelines
By focusing on aviation safety, convenience
and considerate services, EVA Air has repeatedly
advanced service quality. In 2013, we completed
Royal Laurel Class upgrades in all 15 of the
B777-300ERs that we operate and launched one
B777-300ER Hello Kitty Jet on the Taoyuan – Los
Angeles route, increasing the total number of the
character-themed aircraft in our fleet to six. In
2014, we are adding more new B777-300ER and
A321-200 aircraft. Our A321-200s are the first
aircraft in Taiwan to be equipped with fuel-saving
Sharklets. In addition to enhancing fuel efficiency,
these innovative wing tips reduce CO2 emissions,
improve take-off performance and extend flight
range.
By integrating fleet resources, we will
gradually phase out our B747-400 Combis and
MD90s, ensuring that our passengers continue to
enjoy safe, comfortable flight experiences aboard
advanced aircraft. By replacing the older
equipment, we will also enhance our
competitiveness on busy routes, give us more fleet
flexibility and boost income.
Plans for our consolidated company’s
reportable segments follows below:
In 2014, EGAT will focus on expanding our
maintenance capacity to elevate quality of the
services we provide and strengthen our position in
the global market as Asia’s aviation technology
maintenance center.
EGSC expects to grow total catering business
by 7% in 2014. We have the manpower,
equipment and processes in place and are prepared
to provide the tastiest and safest gourmet foods
available for inflight food service aboard the
different airlines that are our customers.
Estimated Air Traffic and Basis
Passenger services:
We are forecasting that we will carry 8.57
million passengers in 2014, a 7% increase
compared to the 8.01 million we served in 2013.
Estimation Basis:
Since April 1, 2013, China has increased its
quota for the number of group tourists traveling to
Taiwan from 4,000 to 5,000 per day and lifted the
cap on FIT tourists from 1,000 to 2,000 per day.
On June 28, China opened a third batch of cities
for FIT travelers: Shenyang, Zhengzhou, Wuhan,
Suzhou, Ningbo and Qingdao. And on August 28,
it approved seven more cities: Shijiazhuang,
Zhangchun, Hofei, Zhangsha, Nanning, Kunming
and Quanzhou.
The number of Taiwanese tourists visiting
Japan has increased sharply due to the Japanese
yen’s decline, driving up passenger numbers and
increasing our income.
Joining Star Alliance enabled us to expand
our customer sources and flight network and we
have attracted more high-end business travelers
with our luxurious B777-300ER Royal Laurel
Class.
We will continue to cultivate our cross-strait
customer bases, actively strive to access China’s
transit-passenger market and work with the
government to promote Taoyuan International
Airport as a major global transit center.
Cargo services:
We are forecasting that we will transport
716,000 tons of airfreight in 2014, a 0.5% increase
compared to the 712,000 tons we carried in 2013.
Estimation Basis:
Air cargo demand has been impacted by
factors such as high fuel prices and slow recovery
of the global economy. We expect market volume
to remain flat in 2014.
Through strategic fleet planning and route
adjustments, we have the flexibility to adjust our
shipping space supply and increase load rates.
We will continue to develop our global air
transport market, adding new freight destinations
that have market potential and strengthen our
cargo sales network.
Key Marketing Strategies
Passenger services:
EVA Air officially joined Star Alliance on
June 18, 2013. Within this aviation alliance
structure, we are strategically developing
joint operating partnerships in promising
regions with major airlines.
In 2014, we are introducing three new
B777-300ER and six new A321-200
passenger aircraft to meet demand for more
6

flights to America and on regional cross-strait
routes. We expect the fuel efficiency of these
aircraft and the market appeal of their
advanced passenger cabins to help boost our
operating profit.
Consistent with cross-strait direct-flight
policies, we will maximize opportunities
created by China’s increased quotas for
individual visits. We will actively pursue the
Chinese tourist market and passengers
transiting through Taiwan.
We will update booking, seat management
and control systems and further improve our
revenue management program. We will also
enhance operating efficiencies and reduce
operating costs by actively developing
additional e-services and m-services.
We will adjust aircraft model deployment
and flight frequencies to optimize services
for the destinations we serve, fully utilize our
fleet carrying capacity and strive to enhance
route efficiencies to meet market demands.
We will continue to strengthen and expand
EVA’s joint operating partnerships with
United Airlines, Singapore Airlines, All
Nippon Airways, Asiana Airlines, Air China,
Hainan Airlines, Shandong Airlines,
Bangkok Airways, Hong Kong Airlines, etc.
Cargo services:
We will continue to develop promising new
destinations in line with cross-strait policies,
fully utilize belly space to carry cargo on
regular passenger flights between China and
Taiwan and increase marketable routes. And
we will strengthen our global freight
distribution network by actively seeking to
cooperate with China’s cargo airlines on
regular cross-strait airfreight flights.
The International Monetary Fund (IMF)
revised its global economic growth forecast
upward for 2014 and leading financial
authorities predicted better performance in
the world’s top four markets: China, the
United States, Europe and Japan. Improved
economies are expected to invigorate exports
in Asia’s emerging markets and reignite
output momentum for China’s manufacturing
industry. In addition, revived demand for
consumer electronics in North America and
Europe will stimulate China’s export
momentum and encourage aviation
transportation.
Increased global demand for high-end mobile
devices is expected to spur information /
communication and electronic product
markets. The air cargo industry will also
benefit from growing demand for mid- and
low-end handsets in developing countries.
Through strategic cargo-fleet planning and
deployment, we are prepared to meet
ever-changing airfreight demands.
We will expand services to more destinations
through joint operating partnership networks,
increase flight frequencies and actively seek
new freight gateways with market potential.
We will further reduce operating costs by
continuing to develop and improve e-freight
services.
Future Development Strategies
EVA has established a vibrant global flight
network that links major cities in Europe,
America, Asia and Oceania. Now, we are
working to optimize this far-reaching route
system to expand the range of our
comfortable, convenient air services and
advance development of Taoyuan
International Airport as East Asia’s leading
transportation hub.
EVA will continue to grow our direct-link
flight network in accordance with open
cross-strait policies that permit regular
services. We are building flexibility into our
operations so that we can take appropriate
action to capture more of the potential
passenger and cargo markets and still retain
our competitive position whenever air
agreements are amended.
EVA is adding new B777-300ERs and
A321-200s equipped with brand-new seats
and In-flight entertainment systems to our
fleet. At the same time, we are strengthening
our capacity for America, China and other
major regions, providing premium services
and the safest air transport for our customers.
By joining Star Alliance, we are enhancing
our corporate brand image and increasing
awareness globally. Through cooperation
7

with other alliance members, we are quickly
expanding our passenger network in
Europe and even in Central America, South
America and Africa, regions not yet added to
our own service map.
EVA is currently cooperating with 11 carriers,
including United Airlines, Singapore Airlines,
All Nippon Airways, Asiana Airlines, Air
China, Hainan Airlines, Shandong Airlines,
Bangkok Airways, Hong Kong Airlines,
Lufthansa (cargo) and Air China (cargo). We
will continue to expand and strengthen
cooperation with other airlines. Within the
framework of the alliance, we are able to
extend our route network through those of
other members and build a reciprocal
operating environment. Our complementary
networks enable us to multiply customer
sources, upgrade services and attract more
high-end business. Joint procurement also
gives us the advantages of common service
standards, reduced operating costs,
diversified risks and added convenience due
to more schedule choices.
We are continuing to optimize our EVA
Cargo fleet, adjusting routes and aircraft
models to best fit different market conditions
and maximize airfreight profits. We are also
opening new gateways in China that have
freight potential and strengthen our routing
within that market. We are always on alert
for new trade opportunities and planning for
new freight routes while, at the same time,
making adjustments to accommodate
logistics demands in varying regions around
the globe.
On January 7, 2014, EVA obtained a general
aviation operating permit, becoming the first
airline in Taiwan to provide both regularly
scheduled services and chartered business
flights.
We added courtesy customs clearance
exclusively for non-chartered business
passengers at EVA Sky Jet Center, giving
more travelers fast premium services.
We have developed our civil aviation
affiliated enterprises strategically and now
cover maintenance, airline catering, aviation
ground-handling services and storage /
transportation sectors. Our affiliated
companies not only deliver premium services
and help ensure operating safety for EVA but
also actively seek the business of other
airlines, supporting more production capacity
and elevating operating efficiencies.
Competition, Legal Issues and the
Operating Environment
Competition
The global economic recovery continues to
lag, impacting corporate travel budgets,
slowing business and leisure markets and
squeezing passenger volume and fares.
Low-cost carriers are entering the passenger
market with rock-bottom fares and Taiwan’s
high-speed rail continues to force domestic
airlines to transform themselves. These
factors influence the competitive landscape
and supply-demand balance in regional
passenger and cargo markets.
More nations are deregulating airlines. For
example, the United States and Japan adopted
open-sky policies while Taiwan and Canada
signed an air service agreement. Both
developments are likely to promote
competition for intercontinental and regional
passengers and airfreight.
We expect China’s growing air transport
demand to continue to dominate Asia
markets. In addition to cross-strait passenger
and cargo volumes that repeatedly reach new
highs, related businesses such as
aviation-product manufacturing and aviation
personnel and maintenance are also thriving.
This trend creates significant opportunities
for companies in Taiwan.
China’s relaxation of its economic policies,
the dramatic increase in its people’s spending
power and continued economic growth in
emerging Asian countries remain key
financial drivers. Using Taiwan as an
operations center and establishing
manufacturing plants in China and emerging
Asian countries is still the business model
with the greatest cost benefits. Not only will
EVA actively develop more strategies and
tactics to dominate this market but we will
also survey shippers and use our far-reaching
global network to establish Taiwan as an
international transit center.
8

Legal Environment
Political and economic stability directly
impact ups and downs in passenger and cargo
markets.
The airline industry must remain vigilant and
ready to respond quickly to changes. Open
policies for direct cross-strait flights are still
being developed and support is fragmented.
The airline industry is burdened by
increasing consumer awareness and
regulatory changes. Prime examples are the
European Union’s penalty on airlines that
oversell seats and our industry’s inclusion in
its Emission Trading Scheme (ETS).
Mainland China’s relaxation of its passenger
transit policies affects Taiwan carriers’
competitiveness in international transport
networks.
Operating Environment
We expect the United States to end its
quantitative easing next year, which will
result in higher long-term interest rates,
increased loan costs, a downswing in the real
estate market and a further slowdown in the
economic recovery.
While the Japanese yen depreciates,
consumption tax rates continue to rise,
leading to a slowdown in consumer spending.
This trend may be a risk and lead to further
economic decline.
Oil-shale fracking technology has led to
increased oil and gas production while
turbulence in the Middle East has eased.
Supplies are relatively stable for now and that
may reduce the risks of soaring oil prices and
help us control operating costs.
Over the past year, EVA has phased out
older aircraft and begun integrating advanced new
models, updated our passenger transport operating
system, joined Star Alliance, established the EVA
Flight Training Academy and opened our second
state-of-the-art training building in Taiwan. These
actions have enabled us to substantially enhance
our operating structure and significantly improve
performance. Even though the aviation industry
faces difficult challenges in the year ahead, we are
steadfast in our determination to make every effort
to further improve safety and services and keep
EVA Air in its position as one of the highest
quality airlines in the world.
9

The Company
Founded in March 1989, EVA Air, a
one-hundred-percent privately owned
Taiwanese airline, is the sister company of
Evergreen Marine Corporation, which is the
world famous shipping line in terms of
container operation.
Since the inauguration of its maiden flight on
July 01, 1991, EVA Air is currently serving
63 destinations over four continents, except
Africa, with 59 aircraft (as of December 2011)
and is still steadily expanding its operation
network and fleet.
In 1997, after carefully nurturing an
environment where faultless service quality
and flight safety are the standard, EVA Air
became the first airline in Taiwan to achieve
official ISO 9002 Certification in three areas
at the same time -- passenger, cargo and
maintenance operations. Diligently upholding
these objectives, EVA Air earned
ISO-9001:2000 Certification for all
categories of operation in 2001.
In addition, EVA has ensured quality, smooth
ongoing operations and reduced costs by
investing capital and expertise in
airline-related companies, including
Evergreen Sky Catering Corporation,
Evergreen Airline Services Corporation,
Evergreen Air Cargo Services Corporation,
and other selected subsidiaries.
Operating strategies developed by the carrier
are far-reaching. Company goals place equal
importance on its passenger and cargo
services, and it works in cooperation with
affiliated carriers to maximize mutual
efficiencies and effectively compete on a
global scale. Its worldwide hub of operations
at Taoyuan International Airport in Taiwan
has proven to be both successful and
strategic.
EVA Air listed its stock on Taiwan’s
TAISDAQ Market in October 1999, and
moved to the main board, TSE, in September
2001.
Major Milestones
1988~1990
On September 1, 1988 at the celebration for
the 20th birthday of Evergreen Marine Corporation,
Group Chairman Y. F. Chang announced that
Evergreen would launch an international airline.
EVA Air was officially formed in March 1989.
After careful deliberation, the fledgling airline
signed a contract with Boeing/McDonnell Douglas
for 26 aircraft at a total purchase value of US$3.6
billion, and immediately captured the attention of
the global airline market.
1991
EVA Air accepted delivery of its first two
B767-300ERs in April, and made its inaugural
flight on July 1. Within that first week, the new
airline opened five destinations in Asia -- Bangkok,
Seoul, Jakarta, Kuala Lumpur and Singapore.
1992
The comprehensive EVA Training Center
opened in July, and the carrier’s first two
all-passenger B747-400s were delivered in
November. EVA used the first flights of the new
aircraft to launch its Taipei-Los Angeles route and
introduce its four classes of cabin service,
including the debut of its trend-setting Evergreen
Deluxe Class in-between Economy and Super
Business.
1993
EVA Air set new standards and heightened
expectations by expanding its network to more
than half a dozen new destinations, and by
launching service to London, Paris, Seattle, New
York, San Francisco, Brisbane, Sydney and Dubai.
1994
EVA made the greatest number of new
aircraft additions to its fleet this year, purchasing a
total of eight, including three MD-11s, one
B747-400 and four B767-200s. The airline also
added Bali, Fukuoka and Auckland routes to its
network.
10
1995
The carrier purchased three MD-11 freighters
and began to vigorously develop air cargo
operations. It set goals emphasizing passenger and
cargo services equally. And it used joint operations
and land transportation to successfully extend
EVA Cargo services worldwide.
1996
Enhancing the high quality of its operations,
EVA applied for ISO-9002 certification. Within
the next year, its passenger service, cargo service
and aviation maintenance operations were all three
granted ISO-9002 international certifications
simultaneously. EVA achieved ISO-9001:2000
certification in 2001.
1997
Ensuring consistent service quality, EVA and
Singapore Airlines formed Evergreen Sky
Catering Corporation as a joint venture and in
February, began providing in-flight catering
services.
1998
Promoting air safety, EVA signed a
joint-venture contract with General Electric and
established Evergreen Aviation Technologies
Corporation on February 24. That same day, a
powerful new engine test cell was placed in
operation, and the new joint venture began an
aggressive campaign to raise the standards of the
aircraft maintenance business.
1999
Earning brilliant results with both passenger
and cargo service, EVA produced outstanding
operating performances for five successive years.
The Securities and Futures Commission (SFC) of
Taiwan approved its admission to the exchange,
and on October 27, EVA Air shares began to be
traded on the over-the-counter market.
2000
In anticipation of future needs and to expand
its fleet, EVA signed a purchase contract in June
with the Boeing Company for 15
B777-200X/300Xs that included a firm order for
seven of the aircraft and an option for eight more.
Deliveries began in 2005. The carrier relocated its
hub to the brand-new Terminal 2 at Taoyuan
International Airport at the end of July.
2001
EVA committed to add more new,
technologically advanced aircraft to its fleet in
March by signing a purchase contract for eight
Airbus A330-200s and making plans to start
taking deliveries in 2003. EVA Air also secured
approval to transfer its stock listing from OTC and
on 17 September, moved its shares to the Taiwan
Security Exchange (TSE).
2002
EVA launched its online booking system on
January 9. It gained approval to add 24 passenger
flights on its thriving Hong Kong route and to
begin new freighter service. It also introduced a
new slogan “Just relax, your home in the air.”
2003
EVA debuted stylish new cabin-crew
uniforms on April 1, took delivery of its first
A330-200 on June 26 and introduced its new
generation of a top cabin class, Premium Laurel,
along with an upgraded economy class and an
awesome, state-of-the-art Audio / Video on
Demand system.
2004
EVA Air exercised an option for eight B777s
that was part of the firm purchase contract
executed with Boeing in June 2000, expanding its
fleet by a total of 15 brand-new B777s. Deliveries
of the new aircraft started in 2005 and will
continue through 2010.
2005
EVA took delivery of its first two of 15
B777s and introduced the extra-roomy,
exceptionally comfortable new aircraft to
passengers on the Bangkok and London with an
inviting new slogan, “Sharing the World, Flying
Together.”
2006
EVA Air opened its new Southern China
Cargo Center in Hong Kong, enabling it more
efficiently and quickly to move air freight
shipments in and out of the region.
2007 EVA Air received 2007 The Richard Teller
Crane Founder’s Award from the international
Flight Safety Foundation for “its corporate
11
leadership in aviation safety programs and its
superb safety records.” In the five years since the
coveted award was established, EVA is the first
Asian airline and only the second airline among
all recipients to receive it.
2008 Readers selected EVA Air as the Best Airline
for Premium Economy in Global Traveler
magazine’s fifth annual GT Tested Survey. The
international business-travel publication surveyed
its readers between Jan. 1 and Aug. 31, 2008,
inviting them to identify “the best” in 55
categories of business and luxury travel. Readers
returned 31,457 completed questionnaires.
2009
EVA Air launched the regular cross-strait
flights (30 flights per week) from August 31 2009
from Taipei, Taoyuan, and Kaohsiung to Beijing,
Shanghai, Guangzhou, Hangzhou, Tianjin, and
Ningbo.
2010
EVA added new service from Taipei’s
Songshan Airport to Shanghai’s Hongqiao
International Airport started from June 14, 2010. It
complemented EVA’s current nine flights a week
between Taoyuan International Airport and
Pudong International Airport. 2011
Belgium’s Brussels Airport has honored EVA
Air Cargo with its 2010 Network Development
Award Cargo Airline. This event marked the
airport’s fourth consecutive awards program to
recognize outstanding cargo and passengers
carriers for punctuality and efficiency,
environment and safety, and network and route
development.
2012
Star Alliance accepted the membership
application of EVA Air on March 29, 2012. By
2013 the integration process would be scheduled
to complete.
Calendar of 2013 & 2014 Events
January 2013
EVA Air has been ranked as one of world’s
10 safest airlines by Germany’s AERO
International Magazine. In the nine years that
EVA has been counted among the world’s 10
safest airlines, it has climbed in ranking. With its
safety programs, consistently superb record and
high standards, EVA has solid standing among
leading international airlines and is listed as sixth
among the top 10.
June 2013
EVA Air joined the Star Alliance network,
further strengthening the Alliance’s presence in
Asia/Pacific.
December 2013
EVA Air and Singapore Airlines team up on
Taipei-Singapore flights, give passengers more
choices.
January 2014
Industry experts ranked EVA Air among the
world's 10 safest airlines. At the same month, EVA
Air has been ranked among world’s 5 safest
airlines, rating marks ten years at top of AERO
International list.
February 2014
The international travel publication has just
revealed its 2013 winners and singled out EVA Air
in the Best Business Class White and Best
Business Class Sparkling categories.
March 2014
EVA Air Cargo won Air Cargo World’s Gold
Award in its 10th annual Excellence Survey.
12

Org
an
iza
tio
n
13

Dir
ecto
rs
an
d S
up
ervis
ors
A
s o
f A
pri
l 30
, 20
14
Tit
le
N
am
e
Date
of
Ele
cti
on
(In
au
gu
-
rati
on
)
Ten
ure
Date
of
Init
ial
Ele
cti
on
,
Ap
po
int-
men
t
Sh
are
ho
ldin
g
Wh
en
Ele
cte
d
Pre
sen
t
Sh
are
ho
ldin
gs
Sh
are
s H
eld
by
Sp
ou
ses
&
Dep
en
den
ts
Sh
are
s H
eld
by
Th
ird
Parti
es
Ed
ucati
on
&
Exp
erie
nce
Co
ncu
rre
nt
Po
siti
on
s
in O
ther
Co
mp
an
ies
Oth
er
Ma
nag
ers,
Dir
ecto
rs
or
Su
perv
iso
rs
Rela
ted
by M
arria
ge
or
Wit
hin
Seco
nd
-deg
ree B
loo
d
Rela
tio
nsh
ip o
f E
ach
Oth
er
Nu
mb
er
(%)
Nu
mb
er
(%)
Nu
mb
er
(%)
Nu
mb
er
(%
) T
itle
N
am
e
Rela
tio
nsh
ip
Chai
rman
C
han
g Y
ung
-Fa
Char
ity F
ou
ndati
on
2
011
.06
.10
3 Y
ears
2
00
9.0
6.1
6
116,
000
0.
00
11,4
82,1
04
0.3
5
- -
- -
- -
- -
-
Rep
rese
nta
tiv
e:
Chan
g K
uo
-Wei
20
13
.01
.01
1.44
Yea
rs
20
01
.04
.19
0
0.00
0
0.
00
0 0
.00
0
0.0
0
Pre
sid
ent,
EV
A
Air
way
s C
orp
.
Mas
ter
of
Art
s in
Eco
no
mic
s,
Cal
iforn
ia S
tate
Univ
ersi
ty,
Lo
ng
Bea
ch
Ch
air
ma
n:
Hsi
ang
-Li
Inve
stm
ent
Cor
p. E
verg
reen
Avi
atio
n
Pre
cisi
on C
orp.
,
Dir
ecto
r:
Eve
rgre
en S
ky C
ater
ing
Cor
p., U
ni A
irw
ays,
Eve
rgre
en A
viat
ion
Tec
hnol
ogie
s C
orp.
,
Eve
rgre
en A
ir C
argo
Ser
vice
s C
orp.
, Eve
rgre
en
Air
line
Ser
vice
s C
orp.
, G
E
Eve
rgre
en E
ngin
e S
ervi
ces
Cor
p.,
Ch
ang
Yun
g-F
a
Fou
ndat
ion,
Ch
ang
Yun
g-F
a C
hari
ty
Fou
ndat
ion
.
Dir
ecto
r C
han
g
Yu
ng
-Fa
Fat
her
Dir
ecto
r
Chan
g Y
ung
-Fa
Char
ity F
ou
ndati
on
2
011
.06
.10
3 Y
ears
2
00
9.0
6.1
6
116,
000
0.
00
11,4
82,1
04
0.3
5
- -
- -
- -
- -
-
Rep
rese
nta
tiv
e:
Chan
g Y
ung
-Fa
20
11
.06
.10
3 Y
ears
1
98
9.0
3.3
1
0
0.00
98
,360
,200
3.
02
0 0
.00
0
0.0
0
Gro
up C
hai
rman,
Ev
ergre
en G
rou
p.
Tai
pei
Co
mm
erci
al
Hig
h S
choo
l
Gro
up C
hair
man
,
Eve
rgre
en G
roup
Ch
air
ma
n:
Cha
ng Y
ung
-Fa
Fou
ndat
ion,
Ch
ang
Yun
g-F
a C
hari
ty
Fou
ndat
ion
Dir
ecto
r:
Eve
rgre
en M
arin
e C
orp.
(Tai
wan
) L
td.,
Eve
rgre
en
Inte
rnat
iona
l C
orp.
,
Eve
rgre
en S
teel
Cor
p.
Chai
rman
Su
per
-
vis
or
Chan
g
Ku
o-W
ei
Lin
Lon
g- H
wa
So
n
Bro
ther
-in
-law
14
Tit
le
N
am
e
Date
of
Ele
cti
on
(In
au
gu
-
rati
on
)
Ten
ure
Date
of
Init
ial
Ele
cti
on
,
Ap
po
int-
men
t
Sh
are
ho
ldin
g
Wh
en
Ele
cte
d
Pre
sen
t
Sh
are
ho
ldin
gs
Sh
are
s H
eld
by
Sp
ou
ses
&
Dep
en
den
ts
Sh
are
s H
eld
by
Th
ird
Parti
es
Ed
ucati
on
&
Exp
erie
nce
Co
ncu
rre
nt
Po
siti
on
s
in O
ther
Co
mp
an
ies
Oth
er
Ma
nag
ers,
Dir
ecto
rs
or
Su
perv
iso
rs
Rela
ted
by M
arria
ge
or
Wit
hin
Seco
nd
-deg
ree B
loo
d
Rela
tio
nsh
ip o
f E
ach
Oth
er
Nu
mb
er
(%)
Nu
mb
er
(%)
Nu
mb
er
(%)
Nu
mb
er
(%
) T
itle
N
am
e
Rela
tio
nsh
ip
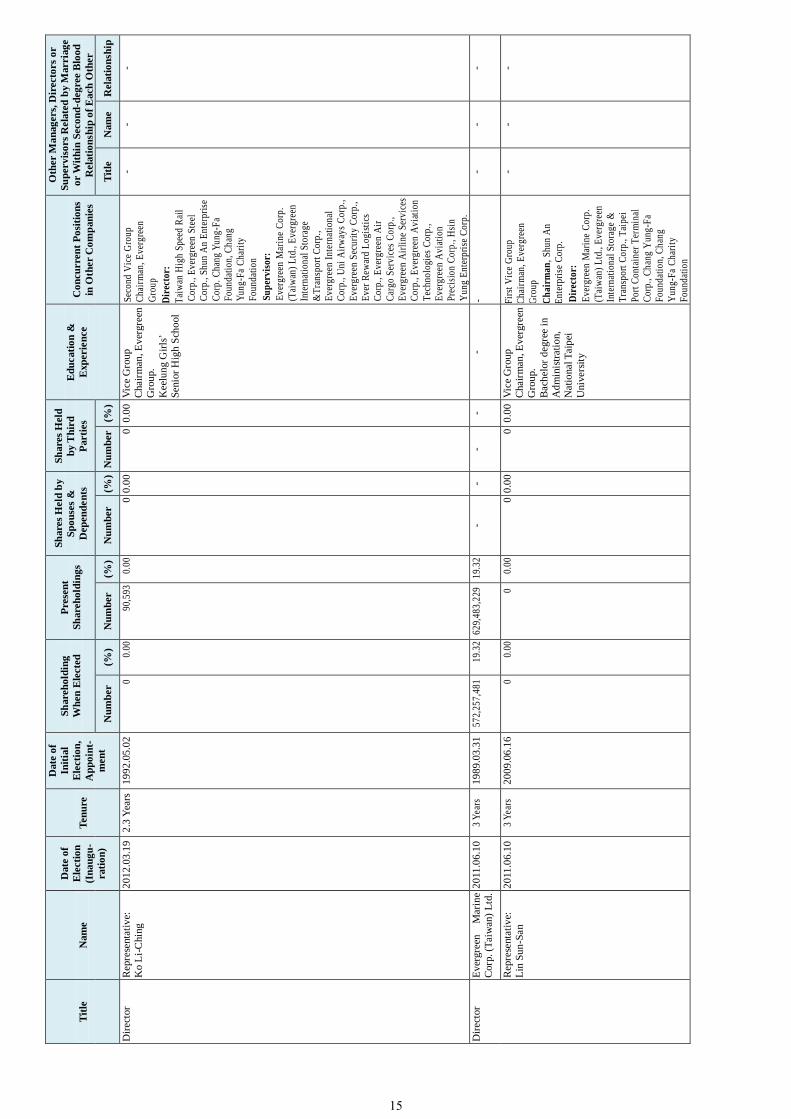
Dir
ecto
r
Rep
rese
nta
tiv
e:
Ko L
i-C
hin
g
20
12
.03
.19
2.3
Yea
rs
19
92
.05
.02
0
0.00
90
,593
0.
00
0 0
.00
0
0.0
0
Vic
e G
rou
p
Chai
rman
, E
ver
gre
en
Gro
up.
Kee
lun
g G
irls
’
Sen
ior
Hig
h S
cho
ol
Sec
ond
Vic
e G
roup
Cha
irm
an,
Eve
rgre
en
Gro
up
Dir
ecto
r:
Tai
wan
Hig
h S
peed
Rai
l
Cor
p.,
Eve
rgre
en S
teel
Cor
p.,
Shu
n A
n E
nter
pris
e
Cor
p. C
hang
Yun
g-F
a
Fou
ndat
ion,
Ch
ang
Yun
g-F
a C
hari
ty
Fou
ndat
ion
Su
per
vis
or:
Eve
rgre
en M
arin
e C
orp.
(Tai
wan
) L
td.,
Eve
rgre
en
Inte
rnat
iona
l S
tora
ge
&T
rans
port
Cor
p.,
Eve
rgre
en I
nter
nati
onal
Cor
p., U
ni A
irw
ays
Cor
p.,
Eve
rgre
en S
ecur
ity
Cor
p.,
Eve
r R
ewar
d L
ogis
tics
Cor
p., E
verg
reen
Air
Car
go S
ervi
ces
Cor
p.,
Eve
rgre
en A
irli
ne S
ervi
ces
Cor
p., E
verg
reen
Avi
atio
n
Tec
hnol
ogie
s C
orp.
,
Eve
rgre
en A
viat
ion
Pre
cisi
on C
orp.
, Hsi
n
Yu
ng
Ent
erpr
ise
Cor
p.
- -
-
Dir
ecto
r
Ev
ergre
en
Mar
ine
Corp
. (T
aiw
an)
Ltd
.
20
11
.06
.10
3 Y
ears
1
98
9.0
3.3
1
572,
257,
481
19
.32
62
9,48
3,22
9
19.3
2
- -
- -
- -
- -
-
Rep
rese
nta
tiv
e:
Lin
Su
n-S
an
20
11
.06
.10
3 Y
ears
2
00
9.0
6.1
6
0
0.00
0
0.
00
0 0
.00
0
0.0
0
Vic
e G
rou
p
Chai
rman
, E
ver
gre
en
Gro
up.
Bac
hel
or
deg
ree
in
Ad
min
istr
atio
n,
Nat
ional
Tai
pei
Univ
ersi
ty
Fir
st V
ice
Gro
up
Cha
irm
an,
Eve
rgre
en
Gro
up
Ch
air
ma
n,
Shu
n A
n
Ent
erpr
ise
Cor
p.
Dir
ecto
r:
Eve
rgre
en M
arin
e C
orp.
(Tai
wan
) L
td.,
Eve
rgre
en
Inte
rnat
iona
l S
tora
ge &
Tra
nspo
rt C
orp.
, Tai
pei
Por
t C
onta
iner
Ter
min
al
Cor
p., C
han
g Y
ung
-Fa
Fou
ndat
ion,
Ch
ang
Yun
g-F
a C
hari
ty
Fou
ndat
ion
- -
-
15

Tit
le
N
am
e
Date
of
Ele
cti
on
(In
au
gu
-
rati
on
)
Ten
ure
Date
of
Init
ial
Ele
cti
on
,
Ap
po
int-
men
t
Sh
are
ho
ldin
g
Wh
en
Ele
cte
d
Pre
sen
t
Sh
are
ho
ldin
gs
Sh
are
s H
eld
by
Sp
ou
ses
&
Dep
en
den
ts
Sh
are
s H
eld
by
Th
ird
Parti
es
Ed
ucati
on
&
Exp
erie
nce
Co
ncu
rre
nt
Po
siti
on
s
in O
ther
Co
mp
an
ies
Oth
er
Ma
nag
ers,
Dir
ecto
rs
or
Su
perv
iso
rs
Rela
ted
by M
arria
ge
or
Wit
hin
Seco
nd
-deg
ree B
loo
d
Rela
tio
nsh
ip o
f E
ach
Oth
er
Nu
mb
er
(%)
Nu
mb
er
(%)
Nu
mb
er
(%)
Nu
mb
er
(%
) T
itle
N
am
e
Rela
tio
nsh
ip
Dir
ecto
r
Rep
rese
nta
tiv
e:
Tai
Jii
n-C
hyu
an
20
11
.06
.10
3 Y
ears
2
011
.06
.10
0
0.00
11
,825
0.
00
0 0
.00
0
0.0
0
Ex
ecu
tiv
e V
ice
Pre
sid
ent,
Leg
al &
Insu
ran
ce,
EV
A
Air
way
s C
orp
.
Mas
ter
deg
ree
in
Mar
itim
e L
aw,
Nat
ional
Tai
wan
Oce
an U
niv
ersi
ty
Gro
up E
xecu
tive
off
icer
,
Leg
al, E
verg
reen
Gro
up
Dir
ecto
r:
Eve
rgre
en M
arin
e C
orp.
(Tai
wan
) L
td.,
Tai
pei
Por
t
Con
tain
er T
erm
inal
Cor
p.,
Sup
er M
ax E
ngin
eeri
ng
Ent
erpr
ise
Cor
p. C
han
g
Yun
g-F
a F
ound
atio
n,
Cha
ng Y
ung
-Fa
Cha
rity
Fou
ndat
ion
- -
-
Dir
ecto
r F
alco
n
Inv
estm
ent
Ser
vic
es L
td.
20
11
.06
.10
. 3
Yea
rs
20
11
.06
.10
148,
148,
114
5.
00
162,
962,
925
5.
00
- -
- -
-
-
- -
-
Rep
rese
nta
tiv
e:
Chan
g M
ing
-Che
20
12
.12
.25
1.46
Yea
rs
20
11
.06
.10
0
0.00
24
,880
0.
00
19
,74
2 0
.00
0
0.0
0
Pre
sid
ent,
Ev
ergre
en
Inte
rnat
ional
Co
rp.
EM
BA
, N
atio
nal
Tai
pei
Univ
ersi
ty
Ch
air
ma
n,
Eve
rgre
en
Inte
rnat
iona
l C
orp.
Dir
ecto
r:
Eve
r A
ccor
d C
onst
ruct
ion,
Eve
rgre
en I
nter
nati
onal
Eng
inee
ring
Cor
p., C
harn
g
Yan
g D
evel
opm
ent.
- -
-
16

Tit
le
N
am
e
Date
of
Ele
cti
on
(In
au
gu
-
rati
on
)
Ten
ure
Date
of
Init
ial
Ele
cti
on
,
Ap
po
int-
men
t
Sh
are
ho
ldin
g
Wh
en
Ele
cte
d
Pre
sen
t
Sh
are
ho
ldin
gs
Sh
are
s H
eld
by
Sp
ou
ses
&
Dep
en
den
ts
Sh
are
s H
eld
by
Th
ird
Parti
es
Ed
ucati
on
&
Exp
erie
nce
Co
ncu
rre
nt
Po
siti
on
s
in O
ther
Co
mp
an
ies
Oth
er
Ma
nag
ers,
Dir
ecto
rs
or
Su
perv
iso
rs
Rela
ted
by M
arria
ge
or
Wit
hin
Seco
nd
-deg
ree B
loo
d
Rela
tio
nsh
ip o
f E
ach
Oth
er
Nu
mb
er
(%)
Nu
mb
er
(%)
Nu
mb
er
(%)
Nu
mb
er
(%
) T
itle
N
am
e
Rela
tio
nsh
ip
Su
per
vis
or
Ev
ergre
en
Inte
rnat
ional
Co
rp.
20
11
.06
.10
3 Y
ears
1
99
3.0
4.3
0
426,
926,
600
14
.41
46
9,64
8,35
7
14.4
1
- -
- -
- -
- -
-
Rep
rese
nta
tiv
e:
Lin
Lon
g-H
wa
20
12
.03
.19
2.3
Yea
rs
2
00
9.0
8.2
7
0
0.00
1,
689,
827
0.
05
14
8,6
16 0
.00
0
0.0
0
Vic
e G
rou
p
Chai
rman
, E
ver
gre
en
Gro
up.
Nat
ional
Kaoh
siu
ng
Norm
al U
niv
ersi
ty,
En
gli
sh d
epar
tmen
t.
Vic
e G
roup
Cha
irm
an,
Eve
rgre
en G
roup
.
Dir
ecto
r:
Eve
rgre
en M
arin
e C
orp.
(Tai
wan
) L
td.,
Eve
rgre
en
Sky
Cat
erin
g C
orp.
, Uni
Air
way
s C
orp.
, E
verg
reen
Avi
atio
n T
echn
olog
ies
Cor
p.
Su
per
vis
or:
Shu
n A
n E
nter
pris
e C
orp.
,
Join
t S
teve
dori
ng C
ontr
act
Co.
, Ltd
. , T
aipe
i P
ort
Con
tain
er T
erm
inal
Cor
p.
Dir
ecto
r C
han
g
Yu
ng
-Fa
Sec
on
d-
deg
ree
rela
tiv
es
Rep
rese
nta
tiv
e:
Wu
Ku
ang
-Hu
i
20
11
.06
.10
3 Y
ears
2
01
0.1
2.0
1
0
0.00
33
,183
0.
00
0 0
.00
0
0.0
0
Ex
ecu
tiv
e V
ice
Pre
sid
ent,
EV
A
Air
way
s C
orp
.
MB
A,
Su
n Y
at S
en
Univ
ersi
ty
Gro
up E
xecu
tive
off
icer
,
Fin
ance
, E
verg
reen
Gro
up
Fin
ance
Exe
cuti
ve O
ffic
er,
Eve
rgre
en M
arin
e C
orp.
(Tai
wan
) L
td.
Dir
ecto
r:
Cha
ng Y
ung
-Fa
Fou
ndat
ion,
Ch
ang
Yun
g-F
a C
hari
ty
Fou
ndat
ion
Su
per
vis
or:
Eve
rgre
en I
nter
nati
onal
Sto
rage
&T
rans
port
Cor
p.,
Cen
tral
Rei
nsur
ance
Cor
p.,
Eve
rgre
en S
teel
Cor
p.,
Tai
wan
Ter
min
al S
ervi
ces
Cor
p., C
har
ng Y
ang
Dev
elop
men
t C
orp.
,
Hsi
ang
-Li
Inve
stm
ent
Cor
p.
- -
-
Rep
rese
nta
tiv
e:
Ch
en C
hen
g-P
ang
20
11
.06
.10
3 Y
ears
2
00
1.0
4.1
9
0
0.00
5,
036
0.
00
4,9
99 0
.00
0
0.0
0
Sen
ior
Vic
e
Pre
sid
ent,
Ita
lia
Mar
itti
ma S
.p.A
.
So
och
ow
Univ
ersi
ty
Acc
ou
nti
ng
&
Eco
no
mic
s D
ept.
Fin
ance
Exe
cuti
ve O
ffic
er,
Eve
rgre
en I
nter
nati
onal
Sto
rage
& T
rans
port
Cor
p.
- -
-
Note
1: A
s of
Apri
l 30, 20
14 t
he
Com
pan
y h
as i
ssu
ed 3
,25
8,9
45,0
05
sh
ares
17

Major Shareholder of EVA Air’s Institutional Shareholder April 30, 2014
Name of Institutional Shareholder Major Shareholders of Institutional Shareholder
Evergreen Marine Corp. (Taiwan)
Ltd.
Evergreen International S.A. (Panama) (10.63%),
Chang Kuo-Hua (7.55%),
Evergreen International Corp. (7.12%),
Chang Yung-Fa (6.00%),
Ultra International Investments Ltd. (4.25%),
Chang Kuo-Cheng (4.24%),
Chang Kuo-Ming (3.17%),
Public Service Pension Fund Management Board (2.30%),
Cathay Life Insurance Co., Ltd. (2.30%),
Cheng Shen-Chin (2.12%)
Chang Yung-Fa Charity Foundation Non-profit organization
Falcon Investment Services Ltd. Chang Kuo-Wei (100%)
Evergreen International Corp. Chang Yung-Fa Foundation (28.86%),
Chang Kuo-Cheng (16.67%),
Chang Kuo-Hua (12.90%),
Chang Kuo-Ming (12.19%),
Lee Yu-Mei (7.14%),
Chen Hui-Chu (5.81%),
Yang Mei-Chen (5.10%),
Chang Yung-Fa Charity Foundation (5.00%),
Chang Yung-Fa (5.00%),
Tseng Chiung-Hui (1.33%)
18

If the Above-mentioned Shareholders of Major Shareholder of EVA Air’s
Institutional Shareholder are Corporations, the Principal Shareholders of these
Corporations are as follows: April 30, 2014
Legal Entity Name of Institutional
Shareholders
Major Shareholders of Institutional
Shareholders
Evergreen Marine
Corp. (Taiwan) Ltd.
Evergreen International S.A.
(Panama)
Chang Yung-Fa (20%),
Chang Kuo-Hua (20%),
Chang Kuo-Ming (20%),
Chang Kuo-Cheng (20%),
Pieca Corp. (20%)
Evergreen International Corp.
Chang Yung-Fa Foundation (28.86%),
Chang Kuo-Cheng (16.67%),
Chang Kuo-Hua (12.90%),
Chang Kuo-Ming (12.19%),
Lee Yu-Mei (7.14%),
Chen Hui-Chu (5.81%),
Yang Mei-Chen (5.10%),
Chang Yung-Fa Charity Foundation
(5.00%),
Chang Yung-Fa (5.00%),
Tseng Chiung-Hui (1.33%)
Ultra International Investment Ltd. Chang Kuo-Wei (100%)
Public Service Pension Fund
Management Board Non-profit organization
Cathay Life Insurance Co., Ltd. Cathay Financial Holding Co., Ltd.
(100%)
Evergreen
International Corp.
Chang Yung-Fa Foundation Non-profit organization
Chang Yung-Fa Charity Foundation Non-profit organization
19

Criteria for Expertise and Independence of Directors and Supervisors April 30, 2014
Qualifications
Name
Meet One of the Following Qualification Requirements, Together
with at Least Five Years Work Experience
Independence Criteria
Concurrently Serving as an Independent
Director / Number of
Other Public Companies
An Instructor
or Higher
Position in a
Department of
Commerce,
Law, Finance,
Accounting, or
Other
Academic
Department
Related to the
Business Needs
of the
Company in a
Public or
Private Junior
College,
College or
University
A Judge, Public
Prosecutor,
Attorney,
Certified Public
Accountant, or
Other
Professional or
Technical
Specialists Who
Has Passed a
National
Examination and
Been Awarded a
Certificate in a
Profession
Necessary for
the Business of
the Company
Have Work
Experience
in the Area
of
Commerce,
Law,
Finance, or
Otherwise
Necessary
for the
Business of
the
Company
1 2 3 4 5 6 7 8 9 10
Chang Kuo-Wei 0 Chang Yung-Fa 0
Lin Sun-San 0 Ko Li-Ching 0
Chang Ming-Che 0 Tai Jiin-Chyuan 0 Lin Long-Hwa 0 Wu Kuang-Hui 0
Chen Cheng-Pang 0
(1) Not an employee of the Company or any of its affiliated companies.
(2) Not a director or supervisor of the Company or any of its affiliates. The same does not apply, however, in case
where the person is an independent director of the Company, its parent company or any subsidiary in which the
Company holds, directly or indirectly, more than 50% of the voting shares.
(3) Not an individual shareholder who holds shares, together with those held by the person’s spouse, minor children, or
held by the person under others’ names, in an aggregate amount of 1% or more of the total number of issued shares
of the Company or ranking in the top 10 in holdings.
(4) Not a spouse, relative within the second degree of kinship, or lineal relative within the third degree of kinship, of
any of the persons in the preceding three subparagraphs.
(5) Not a director, supervisor, or employee of a corporate shareholder that directly holds 5% or more of the total
number of issued shares of the Company or that holds shares ranking in the top five in holdings.
(6) Not a director, supervisor, officer, or shareholder holding 5% or more of the shares, of a specified company or
institution that has a financial relationship with the Company.
(7) Not a professional individual who, or an owner , partner, director, supervisor, or officer of a sole proprietorship,
partnership, company, or institution that, provides commercial, legal, financial, accounting services or consultation
to the Company or any affiliate of the Company, or a spouse thereof. The establishment of a remuneration
committee for listed or over-the-counter market trading companies, as well as members of the remuneration
committee exercising the powers of Article 7 in the performance of their duties, are not subject to the above
restrictions.
(8) Not having a marital relationship, or a relative within the second degree of kinship to any other director of the
Company.
(9) Not been a person of any conditions defined in Article 30 of the Company Code.
(10) Not a government, institutional person or its representative as defined in Article 27 of the Company Code.
20
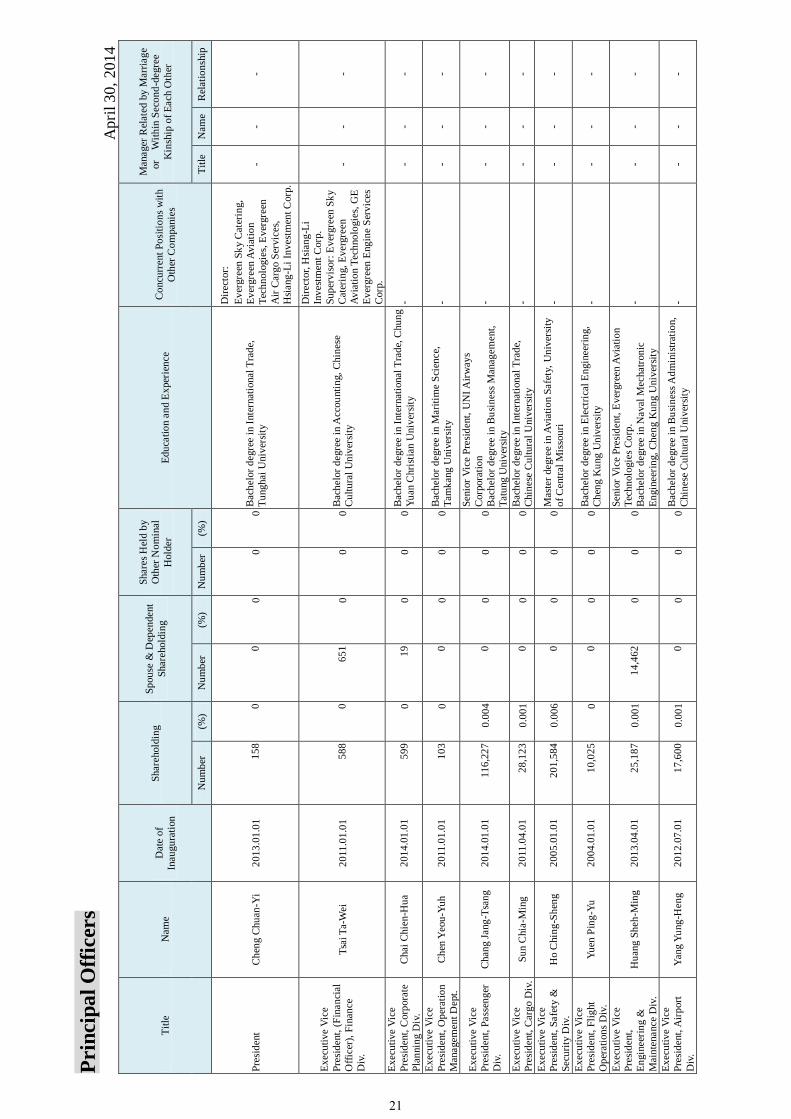
Prin
cip
al
Off
icer
s A
pri
l 30
, 201
4
Tit
le
Nam
e
Dat
e o
f
Inau
gu
rati
on
Shar
ehold
ing
S
pou
se &
Dep
enden
t
Shar
ehold
ing
Shar
es H
eld b
y
Oth
er N
om
inal
Hold
er
Edu
cati
on a
nd E
xper
ien
ce
Co
ncu
rren
t P
osi
tio
ns
wit
h
Oth
er C
om
pan
ies
Man
ager
Rel
ated
by
Mar
riag
e
or
W
ith
in S
eco
nd
-deg
ree
Kin
ship
of
Each
Oth
er
Nu
mb
er
(%)
Nu
mb
er
(%)
Nu
mb
er
(%)
Tit
le
Nam
e
Rel
atio
nsh
ip
Pre
sid
ent
Ch
eng C
hu
an-Y
i 2
01
3.0
1.0
1
15
8
0
0
0
0
0 B
ach
elor
deg
ree
in I
nte
rnat
ional
Tra
de,
Tu
nghai
Univ
ersi
ty
Dir
ecto
r:
Ev
ergre
en S
ky C
ater
ing,
Ev
ergre
en A
via
tio
n
Tec
hn
olo
gie
s, E
ver
gre
en
Air
Car
go S
ervic
es,
Hsi
ang
-Li
Inv
estm
ent
Corp
.
- -
-
Ex
ecu
tiv
e V
ice
Pre
sid
ent,
(F
inan
cial
Off
icer
), F
inan
ce
Div
.
Tsa
i T
a-W
ei
20
11
.01
.01
58
8
0
65
1
0
0
0 B
ach
elor
deg
ree
in A
ccou
nti
ng,
Chin
ese
Cu
ltu
ral
Un
iver
sity
Dir
ecto
r, H
sian
g-L
i
Inv
estm
ent
Corp
.
Su
per
vis
or:
Ev
ergre
en S
ky
Cat
erin
g,
Ev
ergre
en
Av
iati
on
Tec
hno
logie
s, G
E
Ev
ergre
en E
ng
ine
Ser
vic
es
Corp
.
- -
-
Ex
ecu
tiv
e V
ice
Pre
sid
ent,
Corp
ora
te
Pla
nnin
g D
iv.
Chai
Chie
n-H
ua
2
01
4.0
1.0
1
59
9
0
19
0
0
0 B
ach
elor
deg
ree
in I
nte
rnat
ional
Tra
de,
Chu
ng
Yu
an C
hri
stia
n U
niv
ersi
ty
-
- -
-
Ex
ecu
tiv
e V
ice
Pre
sid
ent,
Op
erat
ion
Man
agem
ent
Dep
t.
Ch
en Y
eou
-Yu
h
20
11
.01
.01
10
3
0
0
0
0
0 B
ach
elor
deg
ree
in M
arit
ime
Sci
ence
,
Tam
kan
g U
niv
ersi
ty
- -
- -
Ex
ecu
tiv
e V
ice
Pre
sid
ent,
Pass
eng
er
Div
.
Chan
g J
ang
-Tsa
ng
2
01
4.0
1.0
1
11
6,2
27
0.0
04
0
0
0
0 S
enio
r V
ice
Pre
sid
ent,
UN
I A
irw
ays
Corp
ora
tio
n
Bac
hel
or
deg
ree
in B
usi
nes
s M
anag
emen
t,
Tat
ung U
niv
ersi
ty
- -
- -
Ex
ecu
tiv
e V
ice
Pre
sid
ent,
Car
go D
iv.
Su
n C
hia
-Min
g
20
11
.04
.01
28
,12
3
0.0
01
0
0
0
0 B
ach
elor
deg
ree
in I
nte
rnat
ional
Tra
de,
Chin
ese
Cu
ltu
ral
Univ
ersi
ty
- -
- -
Ex
ecu
tiv
e V
ice
Pre
sid
ent,
Safe
ty &
Sec
uri
ty D
iv.
Ho C
hin
g-S
hen
g
20
05
.01
.01
20
1,5
84
0.0
06
0
0
0
0 M
aste
r deg
ree
in A
via
tio
n S
afe
ty,
Un
iver
sity
of
Cen
tral
Mis
sou
ri
- -
- -
Ex
ecu
tiv
e V
ice
Pre
sid
ent,
Fli
ght
Op
erat
ion
s D
iv.
Yu
en P
ing
-Yu
2
00
4.0
1.0
1
10
,02
5
0
0
0
0
0 B
ach
elor
deg
ree
in E
lect
rica
l E
ngin
eeri
ng,
Ch
eng K
ung
Un
iver
sity
-
- -
-
Ex
ecu
tiv
e V
ice
Pre
sid
ent,
En
gin
eeri
ng &
Mai
nte
nance
Div
.
Hu
ang S
heh
-Min
g
20
13
.04
.01
25
,18
7
0.0
01
14
,46
2
0
0
0 S
enio
r V
ice
Pre
sid
ent,
Ev
ergre
en A
via
tio
n
Tec
hn
olo
gie
s C
orp
.
Bac
hel
or
deg
ree
in N
aval
Mec
hat
ron
ic
En
gin
eeri
ng,
Ch
eng K
un
g U
niv
ersi
ty
- -
- -
Ex
ecu
tiv
e V
ice
Pre
sid
ent,
Air
port
Div
.
Yan
g Y
ung
-Hen
g
20
12
.07
.01
17
,60
0
0.0
01
0
0
0
0 B
ach
elor
deg
ree
in B
usi
nes
s A
dm
inis
trat
ion,
Chin
ese
Cu
ltu
ral
Univ
ersi
ty
- -
- -
21

Tit
le
Nam
e
Dat
e o
f
Inau
gu
rati
on
Shar
ehold
ing
S
pou
se &
Dep
enden
t
Shar
ehold
ing
Shar
es H
eld b
y
Oth
er N
om
inal
Hold
er
Edu
cati
on a
nd E
xper
ien
ce
Co
ncu
rren
t P
osi
tio
ns
wit
h
Oth
er C
om
pan
ies
Man
ager
Rel
ated
by
Mar
riag
e
or
W
ith
in S
eco
nd
-deg
ree
Kin
ship
of
Each
Oth
er
Nu
mb
er
(%)
Nu
mb
er
(%)
Nu
mb
er
(%)
Tit
le
Nam
e
Rel
atio
nsh
ip
Ex
ecu
tiv
e V
ice
Pre
sid
ent,
Co
mpu
ter
Div
.
Fan
g G
wo
-Shia
nn
g
20
07
.01
.01
10
6,8
46
0.0
03
0
0
0
0 D
epu
ty J
unio
r V
ice
Pre
sid
ent,
Ev
erg
reen
IT
Corp
.
Bac
hel
or
deg
ree
in C
om
pu
ter
Sci
ence
, F
eng
Chia
Univ
ersi
ty
- -
- -
Sen
ior
Vic
e
Pre
sid
ent,
Au
dit
ing
Div
.
Li
Pin
g-Y
in
20
08
.01
.01
65
,70
3
0.0
02
70
0
0
0
0 M
anager
, E
ver
gre
en H
eavy
In
du
stry
Corp
.
Mas
ter
deg
ree
in B
usi
nes
s A
dm
inis
trati
on,
Yu
an Z
e U
niv
ersi
ty
- -
- -
Sen
ior
Vic
e
Pre
sid
ent,
Gen
eral
Aff
air
s D
ept.
So
ong
All
en
20
07
.01
.01
19
4
0
0
0
0
0 D
epar
tmen
t o
f T
ou
rism
, W
orl
d C
oll
ege
of
Jou
rnal
ism
-
- -
-
Sen
ior
Vic
e
Pre
sid
ent,
Corp
ora
te
Pla
nnin
g D
iv.
Lia
o C
hi-
Wei
2
01
4.0
1.0
1
46
4
0
3,3
41
0
0
0 P
resi
den
t(Ju
nio
r V
ice
Pre
sid
ent)
,EZ
FL
Y.C
OM
Corp
ora
tio
n
Mas
ter
deg
ree
in M
arin
e B
iolo
gy,
Nat
ional
Su
n Y
at-s
en U
niv
ersi
ty
- -
- -
Sen
ior
Vic
e
Pre
sid
ent,
Cu
sto
mer
Ser
vic
e D
iv.
Lu
Yu
-Chu
an
20
06
.01
.01
1,0
63
0
0
0
0
0 Ju
nio
r V
ice
Pre
siden
t, E
ver
gre
en A
via
tio
n
Tec
hn
olo
gie
s C
orp
.
Bac
hel
or
deg
ree
in B
usi
nes
s A
dm
inis
trat
ion,
Fu
Jen
Univ
ersi
ty
- -
- -
Sen
ior
Vic
e
Pre
sid
ent,
Car
go D
iv.
Bu
sin
ess
Dep
t.
Chu
ang S
hih
-Hsi
un
g
20
14
.01
.01
0
0
0
0
0
0 B
ach
elor
deg
ree
in A
nim
al S
cien
ce a
nd
Bio
tech
nolo
gy,
Tu
ng
hai
Univ
ersi
ty
- -
- -
Sen
ior
Vic
e
Pre
sid
ent,
Cab
in
Cre
w D
iv.
Yan
g H
siu
-Hu
ey
20
13
.01
.01
25
1
0
0
0
0
0 D
epar
tmen
t o
f R
adio
& T
elev
isio
n,
Worl
d
Coll
ege
of
Jou
rnal
ism
-
- -
-
Sen
ior
Vic
e
Pre
sid
ent,
Cab
in
Ser
vic
e D
iv.
Chan
g L
ih-L
ih
20
04
.01
.01
0
0
0
0
0
0 D
epu
ty S
enio
r V
ice
Pre
sid
ent,
Ev
ergre
en S
ky
Cat
erin
g C
orp
.
Bac
hel
or
deg
ree
in S
tati
stic
s, T
amk
ang
Univ
ersi
ty
- -
- -
Sen
ior
Vic
e
Pre
sid
ent,
En
gin
eeri
ng &
Mai
nte
nance
Div
.
Yeh
Ch
ing
-Far
2
01
2.0
1.0
1
2,1
10
0
0
0
0
0 M
aste
r deg
ree
in B
usi
nes
s A
dm
inis
trati
on
s ,
Nat
ional
Ch
eng C
hi
Univ
ersi
ty
Mas
ter
deg
ree
in M
echanic
al E
ngin
eeri
ng,
Tat
ung C
oll
ege
of
Tec
hn
olo
gy
- -
- -
Sen
ior
Vic
e
Pre
sid
ent,
Air
port
Div
. T
aoyu
an A
irpo
rt
Off
ice
Liu
Yin
g
20
11
.01
.01
9,3
35
0
0
0
0
0 M
aste
r deg
ree
in G
radu
ate
Inst
itu
te o
f H
um
an
Res
ou
rce
Man
ag
emen
t, N
atio
nal
Cen
tral
Univ
ersi
ty
- -
- -
Sen
ior
Vic
e
Pre
sid
ent,
Co
mpu
ter
Div
.
Hou
Hsi
en-Y
u
20
11
.01
.01
1,1
00
0
0
0
0
0 S
enio
r E
ngin
eer,
Ev
ergre
en E
-Ser
vic
es C
orp
.
Mas
ter
deg
ree
in I
nfo
rmat
ion
Manag
emen
t,
Nat
ional
Tai
wan
Univ
ersi
ty
- -
- -
Sec
reta
ry (
Dep
uty
Sen
ior
Vic
e
Pre
sid
ent)
Ch
ou
Yu
-Chu
an
20
14
.01
.01
0
0
0
0
0
0 S
ecre
tary
(Ju
nio
r V
ice
Pre
sid
ent)
, G
rou
p
Man
agem
ent
Hea
d O
ffic
e
Bac
hel
or
deg
ree
in G
erm
an L
angu
age
an
d
Lit
erat
ure
, F
u J
en U
niv
ersi
ty
- -
- -
22

Tit
le
Nam
e
Dat
e o
f
Inau
gu
rati
on
Shar
ehold
ing
S
pou
se &
Dep
enden
t
Shar
ehold
ing
Shar
es H
eld b
y
Oth
er N
om
inal
Hold
er
Edu
cati
on a
nd E
xper
ien
ce
Co
ncu
rren
t P
osi
tio
ns
wit
h
Oth
er C
om
pan
ies
Man
ager
Rel
ated
by
Mar
riag
e
or
W
ith
in S
eco
nd
-deg
ree
Kin
ship
of
Each
Oth
er
Nu
mb
er
(%)
Nu
mb
er
(%)
Nu
mb
er
(%)
Tit
le
Nam
e
Rel
atio
nsh
ip
Dep
uty
Sen
ior
Vic
e
Pre
sid
ent,
Per
son
nel
Div
.
Wu
Chu
n-H
ung
2
01
2.0
1.0
1
28
0
0
0
0
0 B
ach
elor
deg
ree
in B
usi
nes
s A
dm
inis
trat
ion,
Nat
ional
Ch
engC
hi
Un
iver
sity
-
- -
-
Dep
uty
Sen
ior
Vic
e
Pre
sid
ent,
(Acc
ou
nti
ng O
ffic
er)
Fin
an
ce D
iv.
Fin
ance
Dep
t.
Chia
ng
Ch
in-L
an
20
12
.01
.01
8,8
34
0
0
0
0
0 B
ach
elor
deg
ree
in E
con
om
ics,
Nat
ional
Tai
wan
Univ
ersi
ty
- -
- -
Dep
uty
Sen
ior
Vic
e
Pre
sid
ent,
Fin
ance
Div
. R
even
ue
Au
dit
Dep
t.
Ho L
i-C
hen
g
20
12
.01
.01
15
,00
0
0
0
0
0
0 B
ach
elor
deg
ree
in B
ank
ing a
nd
Fin
ance
,
Tam
kan
g U
niv
ersi
ty
- -
- -
Dep
uty
Sen
ior
Vic
e
Pre
sid
ent,
Corp
ora
te
Pla
nnin
g D
iv.
Wan
g Y
uan
-Shyan
g
20
14
.01
.01
111
0
0
0
0
0 B
ach
elor
deg
ree
in B
usi
nes
s A
dm
inis
trat
ion,
Nat
ional
Tai
wan
Univ
ersi
ty
- -
- -
Dep
uty
Sen
ior
Vic
e
Pre
sid
ent,
Corp
ora
te
Pla
nnin
g D
iv.
Chia
ng
Wei
-Du
2
01
2.0
1.0
1
2,2
00
0
7,6
76
0
0
0 D
epu
ty J
unio
r V
ice
Pre
sid
ent,
Ev
erg
reen
Av
iati
on
Tec
hno
logie
s C
orp
.
Bac
hel
or
deg
ree
in F
ore
ign L
an
gu
ages
an
d
Lit
erat
ure
, N
atio
nal
Tsi
ng H
ua
Univ
ersi
ty
- -
- -
Dep
uty
Sen
ior
Vic
e
Pre
sid
ent,
Corp
ora
te
Pla
nnin
g D
iv.
Hu
ang C
hie
h-C
hih
2
011
.07
.01
1,4
06
0
0
0
0
0 M
aste
r deg
ree
in B
usi
nes
s A
dm
inis
trati
on,
Nat
ional
Cen
tral
Un
iver
sity
-
- -
-
Dep
uty
Sen
ior
Vic
e
Pre
sid
ent,
Op
erat
ion
Man
agem
ent
Dep
t.
Hsi
ao C
hin
-Lu
ng
2
011
.07
.01
0
0
0
0
0
0 D
epar
tmen
t o
f In
tern
atio
nal
Tra
de,
Tam
sui
Inst
itu
te o
f B
usi
nes
s A
dm
inis
trat
ion
-
- -
-
Dep
uty
Sen
ior
Vic
e
Pre
sid
ent,
Pass
eng
er
Div
. R
even
ue
Man
agem
ent
Dep
t.
Chiu
Chu
ng
-Yu
2
01
4.0
1.0
1
18
1
0
0
0
0
0 B
ach
elor
deg
ree
in M
echan
ical
Eng
inee
rin
g,
Fen
g C
hia
Univ
ersi
ty
- -
- -
Dep
uty
Sen
ior
Vic
e
Pre
sid
ent,
Pass
eng
er
Div
. R
eser
vat
ion &
Tar
iff
Man
agem
ent
Dep
t.
Wu
Shu
-Pin
g
20
13
.01
.01
2,4
75
0
4,4
64
0
0
0 D
epar
tmen
t o
f T
ou
rism
, H
sin
g W
u C
oll
ege
of
Co
mm
erce
-
- -
-
Dep
uty
Sen
ior
Vic
e
Pre
sid
ent,
Pass
eng
er
Div
. B
usi
nes
s D
ept.
Lin
Nan
-Yan
g
20
14
.01
.01
5,6
13
0
0
0
0
0 B
ach
elor
deg
ree
in M
ass
Co
mm
unic
atio
ns,
Chin
ese
Cu
ltu
ral
Univ
ersi
ty
- -
- -
Dep
uty
Sen
ior
Vic
e
Pre
sid
ent,
Cu
sto
mer
Ser
vic
e D
iv.
Res
ervat
ion
&
Tic
ket
ing D
ept.
Wu
Su
-Shin
2
00
6.0
1.0
1
11
,456
0
0
0
0
0 B
ach
elor
deg
ree
in S
oci
olo
gy,
Fu
Jen
Univ
ersi
ty
- -
- -
23
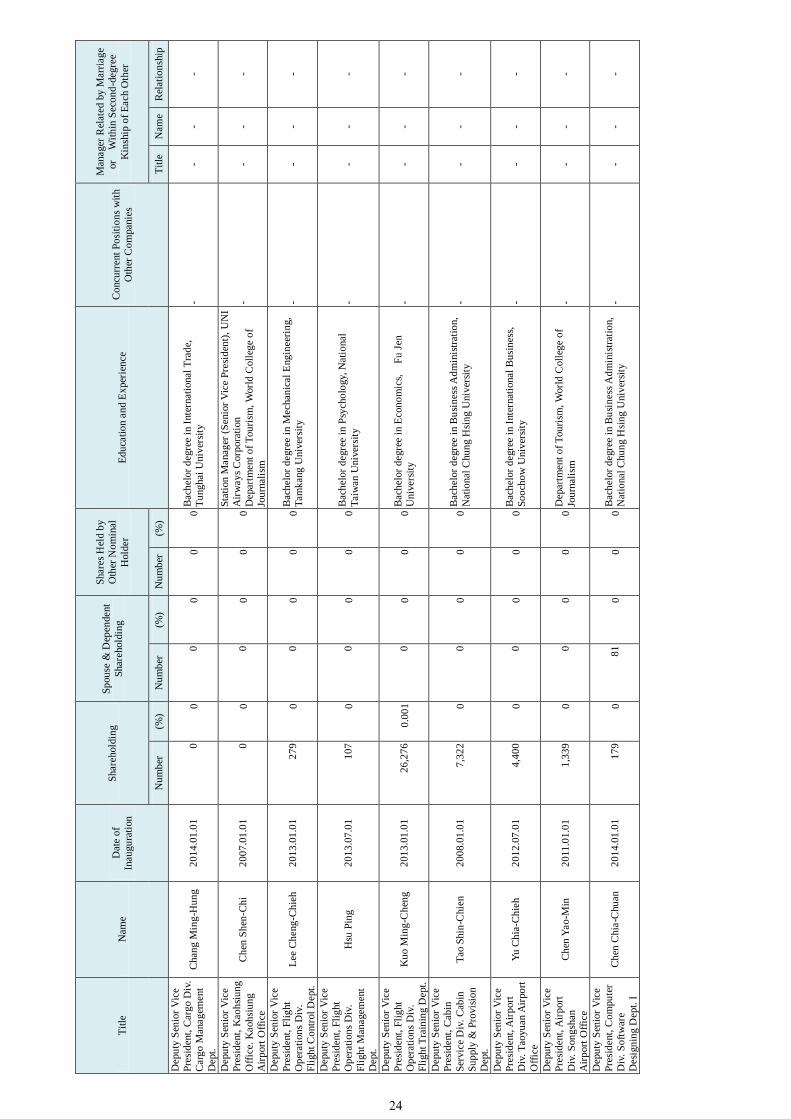
Tit
le
Nam
e
Dat
e o
f
Inau
gu
rati
on
Shar
ehold
ing
S
pou
se &
Dep
enden
t
Shar
ehold
ing
Shar
es H
eld b
y
Oth
er N
om
inal
Hold
er
Edu
cati
on a
nd E
xper
ien
ce
Co
ncu
rren
t P
osi
tio
ns
wit
h
Oth
er C
om
pan
ies
Man
ager
Rel
ated
by
Mar
riag
e
or
W
ith
in S
eco
nd
-deg
ree
Kin
ship
of
Each
Oth
er
Nu
mb
er
(%)
Nu
mb
er
(%)
Nu
mb
er
(%)
Tit
le
Nam
e
Rel
atio
nsh
ip
Dep
uty
Sen
ior
Vic
e
Pre
sid
ent,
Car
go D
iv.
Car
go M
anag
emen
t
Dep
t.
Chan
g M
ing
-Hu
ng
2
01
4.0
1.0
1
0
0
0
0
0
0 B
ach
elor
deg
ree
in I
nte
rnat
ional
Tra
de,
Tu
nghai
Univ
ersi
ty
- -
- -
Dep
uty
Sen
ior
Vic
e
Pre
sid
ent,
Kao
hsi
un
g
Off
ice.
Kaoh
siu
ng
Air
port
Off
ice
Ch
en S
hen
-Ch
i 2
00
7.0
1.0
1
0
0
0
0
0
0 S
tati
on
Manag
er (
Sen
ior
Vic
e P
resi
den
t),
UN
I
Air
way
s C
orp
ora
tion
Dep
artm
ent
of
Tou
rism
, W
orl
d C
oll
ege
of
Jou
rnal
ism
- -
- -
Dep
uty
Sen
ior
Vic
e
Pre
sid
ent,
Fli
ght
Op
erat
ion
s D
iv.
Fli
gh
t C
ontr
ol
Dep
t.
Lee
Ch
eng
-Ch
ieh
2
01
3.0
1.0
1
27
9
0
0
0
0
0 B
ach
elor
deg
ree
in M
echan
ical
Eng
inee
rin
g,
Tam
kan
g U
niv
ersi
ty
- -
- -
Dep
uty
Sen
ior
Vic
e
Pre
sid
ent,
Fli
ght
Op
erat
ion
s D
iv.
Fli
gh
t M
anagem
ent
Dep
t.
Hsu
Pin
g
20
13
.07
.01
10
7
0
0
0
0
0 B
ach
elor
deg
ree
in P
sych
olo
gy, N
atio
nal
Tai
wan
Univ
ersi
ty
- -
- -
Dep
uty
Sen
ior
Vic
e
Pre
sid
ent,
Fli
ght
Op
erat
ion
s D
iv.
Fli
gh
t T
rain
ing D
ept.
Ku
o M
ing
-Ch
eng
2
01
3.0
1.0
1
26
,27
6
0.0
01
0
0
0
0 B
ach
elor
deg
ree
in E
con
om
ics,
F
u J
en
Univ
ersi
ty
- -
- -
Dep
uty
Sen
ior
Vic
e
Pre
sid
ent,
Cab
in
Ser
vic
e D
iv.
Cab
in
Su
pply
& P
rovis
ion
Dep
t.
Tao
Shin
-Chie
n
20
08
.01
.01
7,3
22
0
0
0
0
0 B
ach
elor
deg
ree
in B
usi
nes
s A
dm
inis
trat
ion,
Nat
ional
Chu
ng H
sin
g U
niv
ersi
ty
-
- -
-
Dep
uty
Sen
ior
Vic
e
Pre
sid
ent,
Air
port
Div
. T
aoyu
an A
irpo
rt
Off
ice
Yu
Ch
ia-C
hie
h
20
12
.07
.01
4,4
00
0
0
0
0
0 B
ach
elor
deg
ree
in I
nte
rnat
ional
Bu
sin
ess,
So
och
ow
Univ
ersi
ty
- -
- -
Dep
uty
Sen
ior
Vic
e
Pre
sid
ent,
Air
port
Div
. S
on
gsh
an
Air
port
Off
ice
Ch
en Y
ao
-Min
2
011
.01
.01
1,3
39
0
0
0
0
0 D
epar
tmen
t o
f T
ou
rism
, W
orl
d C
oll
ege
of
Jou
rnal
ism
- -
- -
Dep
uty
Sen
ior
Vic
e
Pre
sid
ent,
Co
mpu
ter
Div
. S
oft
war
e
Des
ign
ing D
ept.
I
Ch
en C
hia
-Chu
an
20
14
.01
.01
17
9
0
81
0
0
0 B
ach
elor
deg
ree
in B
usi
nes
s A
dm
inis
trat
ion,
Nat
ional
Chu
ng H
sin
g U
niv
ersi
ty
- -
- -
24

C
om
pen
sati
on
for
Dir
ecto
rs
Dec
ember
31, 20
13
Un
it:
NT
$ th
ousa
nd
s
Tit
le
Nam
e
Rem
un
erat
ion f
or
Dir
ecto
rs
Tota
l o
f A
, B
, C
an
d
D a
s %
of
20
13
Net
Pro
fit
Co
mp
ensa
tio
n E
arn
ed a
s E
mplo
yee
of
EV
A o
r E
VA
Su
bsi
dia
ry A
ffil
iate
s T
ota
l o
f A
, B
, C
, D
,
E,
F a
nd G
as
% o
f
20
13
Net
Pro
fit
Oth
er
Co
mp
ens
atio
n
fro
m
Non
-Su
bs
idia
ry
Aff
ilia
tes
Sal
ary(A
) P
ensi
on(B
) C
om
pen
sati
on(C
) A
llo
wan
ce(D
) S
alar
y, B
onu
s et
c.
(E)
Pen
sio
n(F
) E
mplo
yee
Pro
fit
Shar
ing
(G)
Em
plo
yee
Sto
ck
Opti
on(H
)
EV
A
Co
nso
lid
ated
Sub
sid
iari
es
of
EV
A
EV
A
Co
nso
lid
ated
Sub
sid
iari
es
of
EV
A
EV
A
Co
nso
lid
ated
Sub
sid
iari
es
of
EV
A
EV
A
Co
nso
lid
ated
Sub
sid
iari
es
of
EV
A
EV
A
Co
nso
lid
ated
Sub
sid
iari
es
of
EV
A
EV
A
Co
nso
lid
ated
Sub
sid
iari
es
of
EV
A
EV
A
Co
nso
lid
ated
Sub
sid
iari
es
of
EV
A
EV
A
Co
nso
lid
ated
Sub
sid
iari
es
of
EV
A
EV
A
Co
nso
lid
ated
Sub
sid
iari
es
of
EV
A
EV
A
Co
nso
lid
ated
Sub
sid
iari
es
of
EV
A
C
ash
S
tock
C
ash
S
tock
Cha
irm
an
Chan
g Y
ung
-Fa
Char
ity F
ou
ndati
on
Chan
g K
uo
-Wei
4,8
00
4,8
00
-
-
-
4,9
00
60
60
0.6
5%
1
.31
%
-
-
3,7
43
3,7
43
-
-
-
-
-
-
1.1
5%
1.8
1%
12
,80
0
Dir
ecto
r
Chan
g Y
ung
-Fa
Char
ity F
ou
ndati
on
Chan
g Y
ung
-Fa
Ko L
i-C
hin
g
Dir
ecto
r
Ev
ergre
en M
arin
e
Corp
. (T
aiw
an)
Ltd
.
Lin
Su
n-S
an
Tai
Jii
n-C
hyu
an
Jen
g K
ung
-Yeu
n
Dir
ecto
r
Fal
con I
nv
estm
ent
Ser
vic
es L
td.
Chan
g M
ing
-Che
25
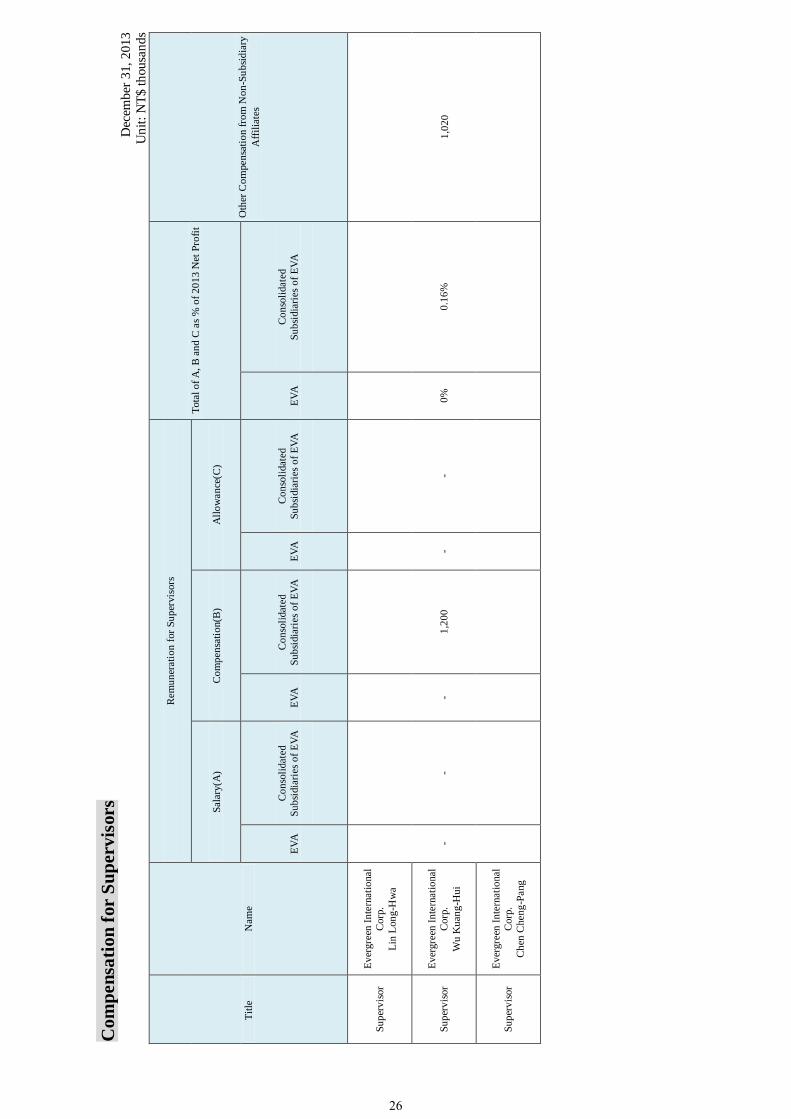
Com
pen
sati
on
for
Su
perv
isors
Dec
ember
31,
20
13
U
nit
: N
T$
th
ousa
nd
s
Tit
le
Nam
e
Rem
un
erat
ion f
or
Su
per
vis
ors
Tota
l o
f A
, B
an
d C
as
% o
f 2
01
3 N
et P
rofi
t
Oth
er C
om
pen
sati
on f
rom
No
n-S
ub
sid
iary
Aff
ilia
tes
Sal
ary(A
) C
om
pen
sati
on(B
) A
llo
wan
ce(C
)
EV
A
Co
nso
lidat
ed
Su
bsi
dia
ries
of
EV
A
EV
A
Co
nso
lidat
ed
Su
bsi
dia
ries
of
EV
A
EV
A
Co
nso
lidat
ed
Su
bsi
dia
ries
of
EV
A
EV
A
Co
nso
lidat
ed
Su
bsi
dia
ries
of
EV
A
Su
per
vis
or
Ev
ergre
en I
nte
rnat
ional
Corp
.
Lin
Lon
g-H
wa
-
-
-
1,2
00
- -
0%
0
.16
%
1,0
20
Su
per
vis
or
Ev
ergre
en I
nte
rnat
ional
Corp
.
Wu
Ku
ang
-Hu
i
Su
per
vis
or
Ev
ergre
en I
nte
rnat
ional
Corp
.
Ch
en C
hen
g-P
ang
26

Com
pen
sati
on
for
Pre
sid
en
t a
nd
Execu
tive V
ice P
resi
den
ts
D
ecem
ber
31,
20
13
Un
it:
NT
$ t
housa
nd
s
Tit
le
Nam
e
Sal
ary(A
) P
ensi
on(B
) B
onu
s &
Per
qu
isit
e(C
) E
mplo
yee
Pro
fit
Shar
ing(D
) T
ota
l o
f A
, B
, C
an
d D
as %
of
20
13
Net
Pro
fit
E
mplo
yee
Sto
ck
Opti
on
s
C
om
pen
sati
on
fro
m I
nves
tmen
ts
Oth
er t
han
Su
bsi
dia
ries
E
VA
Co
nso
lidat
ed
Su
bsi
dia
ries
of
EV
A
EV
A
Co
nso
lidat
ed
Su
bsi
dia
ries
of
EV
A
EV
A
Co
nso
lidat
ed
Su
bsi
dia
ries
of
EV
A
EV
A
Co
nso
lidat
ed
Su
bsi
dia
ries
of
EV
A
EV
A
Co
nso
lidat
ed
Su
bsi
dia
ries
of
EV
A
EV
A
Co
nso
lidat
ed
Su
bsi
dia
ries
of
EV
A
Cas
h
Sto
ck
Cas
h
Sto
ck
Pre
sid
ent
Ch
eng C
hu
an-Y
i
21
,28
3
21
,28
3
3,1
37
3,1
37
5,2
34
5,2
34
- -
- -
3.9
7%
3
.97
%
- -
- E
xec
uti
ve
Vic
e P
resi
den
t
Tsa
i T
a-W
ei
Ch
en Y
eou
-Yu
h
Li
Sh
yh
-Lia
ng
Su
n C
hia
-Min
g
Ho C
hin
g-S
hen
g
Yu
en P
ing
-Yu
Yan
g Y
ung
-Hen
g
Tsa
o B
uo
-Yen
Fan
g G
wo
-Shia
nn
g
Hu
ang S
heh
-Min
g
27

Corporate Governance
Corporate Governance Execution Results and Deviations from Corporate Governance
Best-Practice Principles for TWSE Listed Companies
Item Implementation Status
Deviations from Corporate
Governance Best-Practice
Principles for TWSE Listed
Companies & Why
1. Shareholding Structure &
Shareholders’ Rights:
(1) Method of serving
shareholders and
responding to their
suggestions or complaints
(2) The Company’s possession
of a list of major
shareholders and a list of
ultimate owners of these
major shareholders
(3) Risk management and
firewall between the
Company and its affiliates
The Company has designated the Stock Department
as its liaison to serve shareholders and respond to
their suggestions and complaints.
The relevant department keeps up-to-date
information.
The Company has established risk control measures
within internal control operating procedures.
None.
None.
None.
2. Composition and
Responsibilities of the Board
of Directors:
(1) Independent Directors
(2) Regular evaluation of the
independence of CPAs
The Board did not include independent directors.
The CPA firm is an independent, professional and
respected Taiwan accounting practice that is not a
related party. The Company’s Board of Directors
has approved the appointment and remuneration of
certified public accountants (CPAs), and conducted
an evaluation in terms of the CPAs’ professionalism
and independence.
In 2014, 3 independent directors
will be elected on shareholders’
meeting. Though no member of the
Board of Directors is technically
independent, the Board acts in full
accordance with Company Law,
Articles of Incorporation and
resolutions adopted by shareholders
during regular meetings.
None.
28

Item Implementation Status
Deviations from Corporate
Governance Best-Practice
Principles for TWSE Listed
Companies & Why
3. Communication with
stakeholders and other
interested parties
The Company has designated relevant departments
to communicate with stakeholders and other
interested parties. Contact information for a
spokesperson and customer service is available on
the Company’s website.
None.
4. Information Disclosure:
(1) Corporate website used to
disclose information about
the Company’s financial,
business and corporate
governance status
(2) English-language website
used to disclose
information such as names
of individuals designated
to collect and disclose
information, name of
spokesperson disclosing
information and investor-
conference information,
etc.
1. The Company has set up a corporate website
(URL:http://www.evaair.com) and designated
appropriate people to monitor and keep it
up-to-date with current information.
2. Corporate governance status:
The Company has disclosed Articles of
Incorporation and important operating
procedures in addition to resolutions adopted
during Board of Director meetings.
The Company has established an English-language
website and spokesperson system for gathering and
disclosing information.
None.
None.
5. Operations of the Company’s
Nominating Committee and
other committees with
various functions
The Company had established a Remuneration
Committee. Please refer to Page 39 of the
Company’s Chinese-language annual report for its
operation status.
None.
6. If the Company has established principles based on Corporate Governance Best-Practice Principles for TWSE
Listed Companies, please explain implementation progress and any difference:
Not Applicable. The Company hasn’t yet established written governance principles based on the Corporate Governance
Best-Practice Principles for TWSE Listed Companies.
7. Important information concerning implementation of corporate governance, e.g., employee welfare, employee
care, investor relations, supplier relations, rights of stakeholders, advance familiarization for directors and
supervisors, implementation of risk management policy and risk metrics, implementation of customer policy,
Liability insurance for directors and supervisors etc.:
29

Item Implementation Status
Deviations from Corporate
Governance Best-Practice
Principles for TWSE Listed
Companies & Why
(1) In addition to providing labor and health insurance for employees, the Company also provides accident, medical and
other insurance to expatriate staff.
(2) The Company has set up an in-house clinic to provide physician consultation, medication and regular medical
checkups for all staff to ensure good health, all free of charge to employees.
(3) The Company has designated staff to gather and disclose information and respond to investor queries. The Company
also provides operating and financial information on its website for investors' reference.
(4) The Company is in the airline service business and has selected major suppliers to provide aviation fuel, materials and
aircraft maintenance. The Company has thoroughly evaluated each supplier’s qualifications, credit and ability to meet
strict technical specifications. The Company uses contracts that protect the rights and obligations of both parties for all
transactions and has formed excellent long-term relationships with suppliers.
(5) The Company and stakeholders exercise rights and obligations in accordance with relevant regulations.
(6) The global website of EVA Air is built on a corporate-level content management platform, with a multi-language
online ticketing interface that constantly facilitates improvements in passenger amenities. EVA Air also introduced a
next-generation core system for passenger transport, in order to enhance the flight-booking, ticketing and check-in
services.
(7) The Company has launched a mobile business application that, with the help of a mobile device, gives passengers and
consignees real-time transport information. Mobile applications that enable customers to pre-order duty-free items or
take advantage of the EVA Sky Shop are also integrated with the airline’s existing e-commerce platforms for both a
widened range of services and diversified product sales channels.
(8) The Company designated our Audit Division to perform annual audit planning, inspection, assessment of the
implementation of various control scenarios and provided recommendations for improvements to properly ensure
compliance with risk management policies and sustain effective implementation.
(9) The Company’s Directors and Supervisors participated in training courses:
1. Directors Mr. Lin Sun-San, Ms. Ko Li-Ching, Mr. Chang Ming-Che and Mr. Tai Jiin-Chyuan as well as supervisors
Mr. Lin Long-Hwa and Mr. Chen Cheng-Pang participated in, three-hour Jan. 17, 2013 Foundation for the
Development of Securities and Futures Market, ROC training courses on “The ability of corporations and
individuals to make decisions on taxation of capital gains on securities and Second-Generation National Health
Insurance”.
2. Supervisor Mr. Chen Cheng-Pang participated in a three-hour July 11, 2013 Foundation for the Development of
Securities and Futures Market, the forum presented as Equity Transfers and Legal Compliance by Insiders of Listed
Company, and in a three-hour October 31, 2013 Taiwan Corporate Governance Association, the forum presented as
Exploring a New Era of Corporate Governance: Taking Family Businesses in a Broad Sense and Small-to-Mid sized
Companies as Examples.
(10) The Company purchased liability insurance for Directors and Supervisors:
The Company was not previously purchasing liability insurance to cover all directors and supervisors but instead
provided it based on situations.
8. If corporate governance reports are self-examined or commissioned by relevant professional institutions, please
elaborate results, major defects or suggestions and remedies:
Not applicable. The Company has neither made a self-examined corporate governance report nor been commissioned by
relevant professional institutions.
30

Corporate Social Responsibility
Environmental protection, community involvement, social contributions, social services, social
welfare, consumer protection, human rights, health and safety and social responsibility actions
are initiated through our CSR program:
Item Implementation Status
Deviations from CSR
Best-Practice Principles for
TWSE Listed Companies
& Why
1. Corporate Governance
Implementation:
(1) Corporate social
responsibility policy and
performance evaluation
(2) Dedicated organization for
promotion and execution of
corporate social
responsibility programs
(3) Regular training and
promotion of corporate ethics
among employees and the
Board of Directors, and
integration with the
employee performance
appraisal system
To underscore its commitment to Corporate Social
Responsibilities (CSR), the Company will draft and
submit a CSR policy to its 2014 annual Board of
Directors for approval.
In 2014, the Company plans to introduce a CSR
management unit that proposes and executes CSR
policies or programs, and reports the results to the
Board of Directors at regular intervals.
The Company advises every employee of our code of
conduct and our business ethics and guides them
through a presentation of all relevant provisions on
the employee web portal as soon as they are hired. If
any violation of the code of conduct occurs or is
suspected, the Company takes swift action that is
determined by the seriousness of the breach and
linked to the employee performance appraisal system.
The Company has not established
corporate social responsibility
policies or systems but CSR has
been incorporated into our
management principles.
None.
2.Environmental Sustainability
and Responsibility:
(1) The Company is committed to
improving its use resources vs.
renewable materials
The Company promotes paperless operations:
1. Paperless Electronic Flight Bag
The Company makes flight manuals available to
its pilots electronically. Currently, every pilot is
equipped with an iPad to access to the flight
operations handbooks, available now in the digital
format and updatable with an embedded “Flight
OPS Bag” App.
EVA began adopting Electronic Flight Bags for
different aircraft models in its fleet in 1998,
replacing paper manuals with electronic
information. The computer programs also enhance
take-off and landing performance with consistently
accurate calculations. Usage is now 100%.
None.
31

Item Implementation Status
Deviations from CSR
Best-Practice Principles for
TWSE Listed Companies
& Why
(2) Environmental management
system designed to industry
characteristics
(3) Dedicated environmental
management unit or
personnel
(4) Company strategy for climate
change, energy conservation
and greenhouse gas reduction
2. International Air Transport Association (IATA)
International aviation e-tickets Airline
The Company adopted the Electronic ticket
(e-ticket) and developed an internal process in
October 2000, creating an effective, efficient
system for inter-lines sales and travel agents and
providing paperless electronic ticketing. The
Company also worked with IATA to implement an
Electronic Miscellaneous Document (EMD)
system, moving passenger business closer to our
paperless environment goal.
3. IATA International e-freight Airlines
The Company successfully fulfilled IATA’s
e-freight import and export standard measurement
inspection needed to become a paperless e-freight
service and officially became an IATA
International e-freight Airline on November 3,
2009, and began to implement e-AWB on July 1,
2013.
Since EVA Air’s inaugural flight in 1991, it has
actively adopted practices enabling it to provide
green services, from inviting passengers to
participate by recycling newspapers for return flight
passengers to implemented paperless measures that
include electronic tickets and electronic flight bags.
The Company not only continues to add
fuel-efficient, environmentally-friendly aircraft but
has also established a cross-departmental Fuel and
Emissions Reduction Committee (FERC) chaired by
the President.
FERC developed and promoted aircraft-weight
reduction procedures to both boost aircraft fuel
efficiency and reduce carbon emissions and
continually works to identify additional fuel-saving
measures.
The Company’s “Environment Commitment” website
discloses its environmental sustainability statement
and policy, besides the detailed results of carbon
reduction efforts.
None.
None.
None.
32

Item Implementation Status
Deviations from CSR
Best-Practice Principles for
TWSE Listed Companies
& Why
3. Promotion of employee
welfare:
(1) The Company complies with
relevant labor laws and
regulations, respects
internationally recognized
labor human rights principles,
safeguards the legal rights and
interests of all employees and
facilitates non-discrimination
policies. We have also
established appropriate
management methods,
practices and procedures.
(2) The Company is dedicated to
providing a safe, healthy work
environment and regularly
offers employees safety and
health education programs
(3) The Company established a
regular employee
communication program and
an effective notification
process for operational
changes that could
significantly impact
employees
(4) The Company stipulates and
discloses its consumer
protection policies and
provides an effective,
transparent consumer
complaint process for its
products and services
(5) Collaboration with arts and
cultural institutions
worldwide
The Company established work rules in accordance
with labor laws and regulations and uses related
human-resource management regulations as the a
guide for management.
The Company provides occupational health and
safety training, fire safety seminars and practical
training to all personnel as soon as they are
employed. The Company also supervises handling
of occupational accidents, collects occupational
injury statistics and uses sound protection measures
for the safety of employees.
Divisions throughout the Company regularly hold
department meetings and conferences to
communicate plans for future development,
strategic objectives, significant messages, critical
measures and significant changes to ensure that
employees understand operating conditions and
have opportunities to share ideas and express
opinions.
The Company safeguards consumer interests by
establishing appropriate procedures and work
practices and has created a services management
division that is dedicated to handling customer
comments and conduct service quality inspections.
The Company has long been a trustworthy partner for
major art museums and art organizations in Taiwan
and abroad. Not only has EVA been repeatedly
None.
None.
None.
None.
None.
33
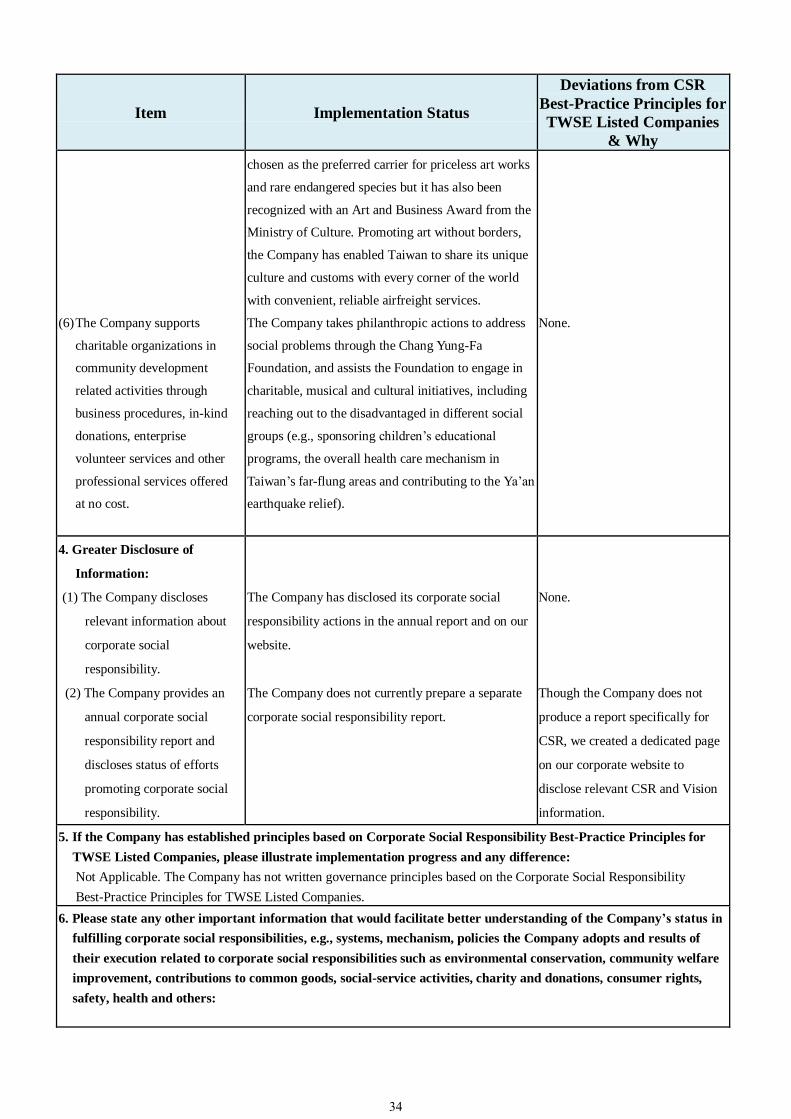
Item Implementation Status
Deviations from CSR
Best-Practice Principles for
TWSE Listed Companies
& Why
(6) The Company supports
charitable organizations in
community development
related activities through
business procedures, in-kind
donations, enterprise
volunteer services and other
professional services offered
at no cost.
chosen as the preferred carrier for priceless art works
and rare endangered species but it has also been
recognized with an Art and Business Award from the
Ministry of Culture. Promoting art without borders,
the Company has enabled Taiwan to share its unique
culture and customs with every corner of the world
with convenient, reliable airfreight services.
The Company takes philanthropic actions to address
social problems through the Chang Yung-Fa
Foundation, and assists the Foundation to engage in
charitable, musical and cultural initiatives, including
reaching out to the disadvantaged in different social
groups (e.g., sponsoring children’s educational
programs, the overall health care mechanism in
Taiwan’s far-flung areas and contributing to the Ya’an
earthquake relief).
None.
4. Greater Disclosure of
Information:
(1) The Company discloses
relevant information about
corporate social
responsibility.
(2) The Company provides an
annual corporate social
responsibility report and
discloses status of efforts
promoting corporate social
responsibility.
The Company has disclosed its corporate social
responsibility actions in the annual report and on our
website.
The Company does not currently prepare a separate
corporate social responsibility report.
None.
Though the Company does not
produce a report specifically for
CSR, we created a dedicated page
on our corporate website to
disclose relevant CSR and Vision
information.
5. If the Company has established principles based on Corporate Social Responsibility Best-Practice Principles for
TWSE Listed Companies, please illustrate implementation progress and any difference:
Not Applicable. The Company has not written governance principles based on the Corporate Social Responsibility
Best-Practice Principles for TWSE Listed Companies.
6. Please state any other important information that would facilitate better understanding of the Company’s status in
fulfilling corporate social responsibilities, e.g., systems, mechanism, policies the Company adopts and results of
their execution related to corporate social responsibilities such as environmental conservation, community welfare
improvement, contributions to common goods, social-service activities, charity and donations, consumer rights,
safety, health and others:
34

Item Implementation Status
Deviations from CSR
Best-Practice Principles for
TWSE Listed Companies
& Why
The Company and its affiliates closely monitor and control any greenhouse gas, noise or waste produced in the
transportation process to reduce their environmental impact. In our environmental management solutions, we strive to:
(1) Prevent pollution by conserving energy and resources, recycling, reducing wastes, lowering noise and pursuing
more conservation strategies.
(2) Conduct operations in compliance with applicable local, national and international environmental laws,
regulations and requirements related to our operations and services.
(3) Participate in community activities, sharing social responsibilities.
(4) Provide safe, efficient, environmentally friendly, quality passenger and cargo transportation services.
(5) Ensure a safe, healthy working environment for our employees.
The Company and its affiliates take its responsibilities as a member of the global village seriously. To help combat
global warming and climate change, we have adopted numerous measures to reduce carbon emissions and comply
with government environmental protection policies, regulations and related programs. The Company and its affiliates
are committed to safeguarding our environment and promoting a greener, healthier earth.
Please refer to relevant information included with Corporate Governance implementation.
(URL:http://eco.evaair.com)
35

Ethical Corporate Management
Ethical Corporate Management Execution Results:
Item Implementation Status
Deviations from ECM
Best-Practice Principles for
TWSE Listed Companies
& Why
1. Established best practice
policies and programs:
(1) The Company explicitly
demonstrates best practice
policies in its rules,
regulations and external
documents and through the
Board of Directors’ and
Management’s commitment
to their implementation
(2) The Company stipulates
measures designed to
prevent instances of
unethical behavior or
practices, including
operational procedures,
behavior guidelines and
educational training
(3) In developing the
prevention program for
unethical behavior, the
Company included
countermeasures against
bribery, accepting bribes and
illegal political contributions
with emphasis on activities
that are at higher risk for
unethical behavior within the
normal scope of business
Although ECM Best-Practice Principles are not
specifically stipulated, the Company clearly
demonstrates integrity among the most fundamental
and necessary principles of operation detailed in
management guidelines and our publicly disclosed
annual reports. All employees are required to apply
these guidelines to all business activities involving or
related to the Company.
The Company gives each new employee a thorough
background in our Code of Ethical Conduct and
business ethics standards. The employee portal on
the website also presents all relevant provisions,
enabling employees to access the information and
even conduct self-reviews.
Management guidelines clearly state that no one
associated with the Company should use his/her
position to facilitate malpractice of any kind. All
Company personal are also responsible for reporting
any coworker who does not do their job, neglects to
fulfill duties or does something that may harm the
interests of the Company or the safety of its
customers.
None.
None.
None.
2.Implementation of Best
Practices:
(1)The Company avoids doing
business with those who
have records of unethical
conduct and states terms
regarding unethical behavior
In management regulations, the Company clearly
states that Integrity is a fundamental and necessary
principle of operations. All employees are required
to follow these guidelines in all business activities.
When an employee is hired, he/she must declare and
None.
36

Item Implementation Status
Deviations from ECM
Best-Practice Principles for
TWSE Listed Companies
& Why
in commercial contracts.
(2)Under supervision of the
Board of Directors, the
Company has established
both dedicated and part-time
administrative units to
promote best practices
(3)The Company stipulates a
Conflict of Interest
Prevention Policy and
provides appropriate
reporting channels
(4)The Company has established
an effective accounting
system and internal controls
for implementation of best
practices, in addition to
review by internal auditors
agree to abide by all management regulations as part
of the Company’s employment contract.
The Company established an auditing department
that reports directly to the Board of Directors. The
department is responsible for investigating and
determining whether or not there is a breach of best
practices within the Company. All directors and
managers are accountable to the Board of Directors
and Shareholders for behavior within the scope of
best practices.
The Company’s auditing department regularly
performs internal audits and presents results and
recommendations to the Board of Directors and
President, assessing effectiveness of overall internal
control systems and providing a basis for
improvements.
The Company has established internal control system
guidelines, internal audit implementation regulations
and various management measures. The Company’s
quality management system is certified to be in
compliance with ISO9001 international standards.
The Company implements annual audit programs and
regularly schedules audits by internal and external
auditors, continually reviewing and improving
operating procedures and discouraging malpractice.
None.
None.
None.
3. The Company has established
reporting channels and
disciplinary measures for
violating best practice
regulations in addition to a
complaint system
The Company created complaint channels to
facilitate customer feedback on the quality of
services, including comments, complaints and
accolades.
The Company has stipulated the guidelines for
employee complaints, which is disclosed internally;
employees may file a complaint in accordance with
the guidelines.
If an employee violates the Code of Ethical Conduct
or related standards of business ethics, the Company
will take disciplinary action that is in proportion to
the severity of the matter. The matter and related
action will also be linked to performance appraisal.
None.
37
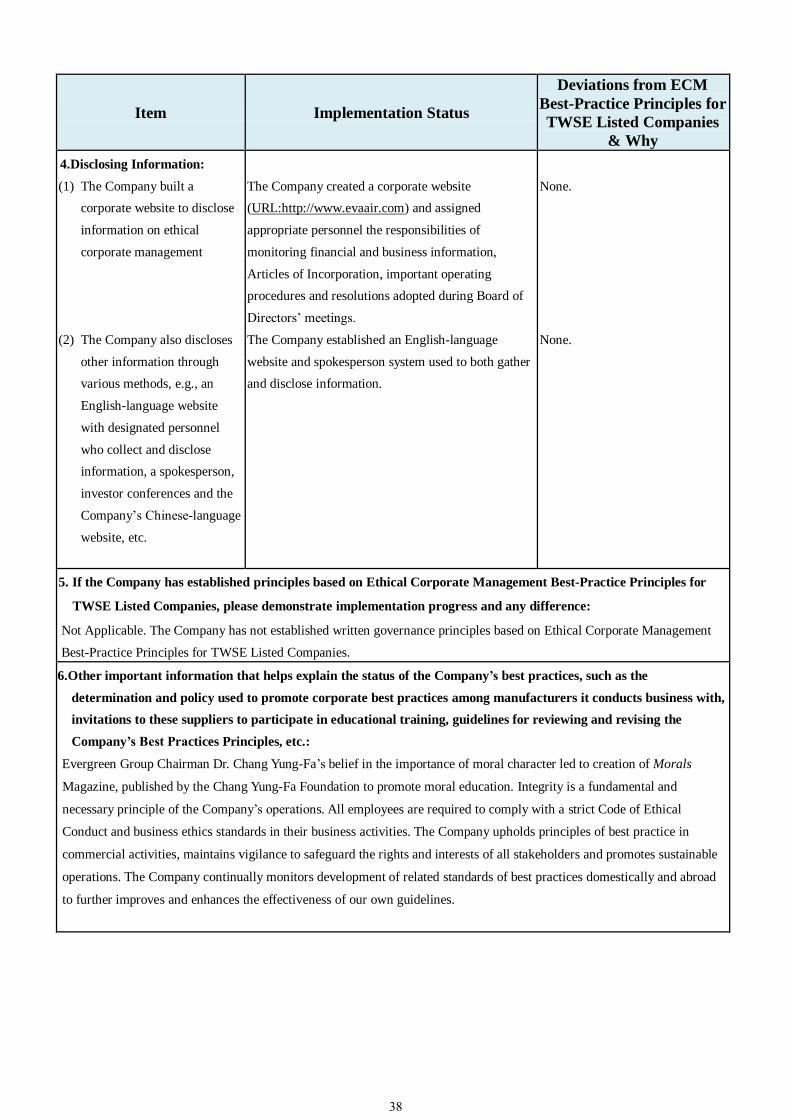
Item Implementation Status
Deviations from ECM
Best-Practice Principles for
TWSE Listed Companies
& Why
4.Disclosing Information:
(1) The Company built a
corporate website to disclose
information on ethical
corporate management
(2) The Company also discloses
other information through
various methods, e.g., an
English-language website
with designated personnel
who collect and disclose
information, a spokesperson,
investor conferences and the
Company’s Chinese-language
website, etc.
The Company created a corporate website
(URL:http://www.evaair.com) and assigned
appropriate personnel the responsibilities of
monitoring financial and business information,
Articles of Incorporation, important operating
procedures and resolutions adopted during Board of
Directors’ meetings.
The Company established an English-language
website and spokesperson system used to both gather
and disclose information.
None.
None.
5. If the Company has established principles based on Ethical Corporate Management Best-Practice Principles for
TWSE Listed Companies, please demonstrate implementation progress and any difference:
Not Applicable. The Company has not established written governance principles based on Ethical Corporate Management
Best-Practice Principles for TWSE Listed Companies.
6.Other important information that helps explain the status of the Company’s best practices, such as the
determination and policy used to promote corporate best practices among manufacturers it conducts business with,
invitations to these suppliers to participate in educational training, guidelines for reviewing and revising the
Company’s Best Practices Principles, etc.:
Evergreen Group Chairman Dr. Chang Yung-Fa’s belief in the importance of moral character led to creation of Morals
Magazine, published by the Chang Yung-Fa Foundation to promote moral education. Integrity is a fundamental and
necessary principle of the Company’s operations. All employees are required to comply with a strict Code of Ethical
Conduct and business ethics standards in their business activities. The Company upholds principles of best practice in
commercial activities, maintains vigilance to safeguard the rights and interests of all stakeholders and promotes sustainable
operations. The Company continually monitors development of related standards of best practices domestically and abroad
to further improves and enhances the effectiveness of our own guidelines.
38

Major Shareholder and BOD Resolutions
Major Shareholder Resolutions
Date of Meeting Summary of Important Proposals Execution
June 24, 2013
1. Distributing retained earnings:
Shareholders proposed reserving all
earnings to meet future needs and not
allocating Dividends, Remuneration
to directors and supervisors and
Bonuses to employees.
The resolution has been executed
accordingly.
2. Amending Articles of Incorporation. The Company’s revised Articles of
Incorporation have been approved and
registered as per the document,
Jing-Shou-Shang Zi No.10201132680
and 10301005360 issued by the
Ministry of Economic Affairs.
Additional tasks have been processed
in accordance with revised Article of
Incorporation.
3. Amending Procedures for Acquiring
and Disposing of Assets.
Related actions on behalf of the
Company have been conducted in
accordance with revised Procedures
for Acquiring and Disposing of Assets.
4. Amending Procedures for Fund
Lending, Endorsement and
Guarantee.
Related actions on behalf of the
Company have been conducted in
accordance with revised Procedures
for Fund Lending, Endorsement and
Guarantee.
39

Major Board of Director Resolutions
Date of Meeting Major Proposals
February 5, 2013
1. To approve the investment and set-up of a 100% owned subsidiary EVA
Flight Training Academy in the United States.
2. To approve removal of the business strife limitation on the Company’s
managers.
March 26, 2013
1. To accept impact of the Company’s initial adoption of IFRSs on retained
earnings and appropriation of a special surplus reserve.
2. To accept 2012 Financial Statements and Consolidated Financial Statements.
3. To accept 2012 Profit Distribution Proposal.
4. To accept 2012 Operation Report.
5. To accept 2013 Operation Plan.
6. To accept the 2012 Declaration of Internal Control.
7. To amend the Internal Control System and Internal Audit Implementation
Rules.
8. To amend Articles of Incorporation.
9. To amend Procedures for Acquiring and Disposing of Assets.
10. To approve establishing branch offices in China’s Hohhot and Hailar regions.
11. To add an office at Asahikawa Airport for the Company’s Japanese branch.
12. To stipulate the date and venue for the annual 2013 General Shareholders'
meeting.
May 14, 2013
1. To procure one Boeing 737 Business Jet.
2. To approve non-acceptance of shareholders’ proposals submitted after the
submission deadline.
August 13, 2013
1. To cancel the transaction for sale of one 747-400 Combi aircraft.
2. To donate cash to Chang Yung-Fa Foundation.
3. To amend the Internal Control System and Internal Audit Implementation
Rules.
October 7, 2013 1. To procure four B777-300ER aircraft that is scheduled to introduce by
leasing.
November 11, 2013 1. To amend the Accounting System.
December 27, 2013
1. To approve the amendment of the compensation structure and performance
incentive system for managers.
2. To approve continuation of the compensation structure and performance
incentive system for directors and supervisors.
3. To approve the 2013 annual bonus for managers.
4. To approve 2014 compensation for managers.
5. To approve remuneration for members of the Company’s 2014 Remuneration
Committee.
6. To approve the 2013 annual bonus for the Chairman.
7. To approve 2014 remuneration to the Chairman.
8. To appoint the Company’s certified public accountants and determine their
remuneration.
9. To stipulate the Company’s 2014 Internal Audit Plan.
40

Date of Meeting Major Proposals
March 25, 2014
1. To accept 2013 Parent-company-only Financial Statements and Consolidated
Financial Statements.
2. To accept 2013 Profit Distribution Proposal.
3. To accept 2013 Operation Report.
4. To accept 2014 Operation Plan.
5. To accept the 2013 Declaration of Internal Control.
6. To amend the Internal Control System and Internal Audit Implementation
Rules.
7. To amend Procedures for Acquiring and Disposing of Assets.
8. To amend Procedures for Transaction of Derivative Products.
9. To amend Procedures for Fund Lending, Endorsement and Guarantee.
10. To amend Regulations for Board of Directors Meeting Procedures.
11. To amend Remuneration Committee and set up agendas for Committee.
12. To re-elect the directors and supervisors of the Company.
13. To discuss lifting the restriction of "Non-Competition" for the newly elected
directors.
14. To stipulate the date and venue for the annual 2014 General Shareholders'
meeting.
April 24, 2014
1. To review the roster of candidates about directors (including independent
directors) and supervisors submitted by the shareholders.
2. To approve non-acceptance of shareholders’ proposals submitted after the
submission deadline.
41

Net Changes in Shareholdings and Shares Pledged by Directors, Supervisors,
Managers and Major Shareholders
Title Name
2013 As of April 30, 2014
Increase (Decrease) in Shareholding
Increase (Decrease) in
Shares Pledged
Increase (Decrease) in Shareholding
Increase (Decrease) in
Shares Pledged
Chairman
Chang Yung-Fa Charity Foundation
0 0 11,354,504 0
Representative: Chang Kuo-Wei
0 0 0 0
Director
Chang Yung-Fa Charity Foundation
0 0 11,354,504 0
Representative: Chang Yung-Fa
0 0 0 0
Representative: Ko Li-Ching
0 0 0 0
Director
Evergreen Marine Corp. (Taiwan) Ltd.
0 0 0 0
Representative: Lin Sun-San
0 0 0 0
Representative: Tai Jiin-Chyuan
0 0 0 0
Director
Falcon Investment Services Ltd.
0 0 0 0
Representative: Chang Ming-Che
0 0 0 0
Supervisor
Evergreen International Corp. 0 0 0 0
Representative: Lin Long-Hwa
0 0 0 0
Representative: Wu Kuang-Hui
0 0 0 0
Representative: Chen Cheng-Pang
0 0 0 0
Major Shareholder
Evergreen Marine Corp. (Taiwan) Ltd.
0 0 0 0
Major Shareholder
Evergreen International Corp. 0 0 0 0
President Cheng Chuan-Yi 0 0 0 0
Executive Vice President
Tsai Ta-Wei 0 0 558
(558) 0
Executive Vice President
Chai Chien-Hua 0 0 0 0
Executive Vice President
Chen Yeou-Yuh 0 0 0 0
Executive Vice President
Chang Jang-Tsang 0 0 0 0
Executive Vice President
Sun Chia-Ming 0 0 0 0
Executive Vice President
Ho Ching-Sheng 0 0 0 0
Executive Vice President
Yuen Ping-Yu 0 0 0 0
Executive Vice President
Huang Sheh-Ming 0 0 0 0
Executive Vice President
Yang Yung-Heng 0 0 0 0
Executive Vice President
Fang Gwo-Shianng 0 0 0 0
Senior Vice President
Li Ping-Yin 0 0 0 0
Senior Vice President
Soong Allen 0 0 0 0
42

Title Name
2013 As of April 30, 2014
Increase (Decrease) in Shareholding
Increase (Decrease) in
Shares Pledged
Increase (Decrease) in Shareholding
Increase (Decrease) in
Shares Pledged
Senior Vice President
Liao Chi-Wei 0 0 0 0
Senior Vice President
Lu Yu-Chuan 0 0 0 0
Senior Vice President
Chuang Shih-Hsiung 0 0 0 0
Senior Vice President
Yang Hsiu-Huey 10,000
(10,000) 0 0 0
Senior Vice President
Chang Lih-Lih 0 0 0 0
Senior Vice President
Yeh Ching-Far 0 0 0 0
Senior Vice President
Liu Ying 0 0 0 0
Senior Vice President
Hou Hsien-Yu 0 0 0 0
Deputy Senior Vice President
Chou Yu-Chuan 0 0 0 0
Deputy Senior Vice President
Wu Chun-Hung 0 0 0 0
Deputy Senior Vice President
Chiang Chin-Lan 0 0 0 0
Deputy Senior Vice President
Ho Li-Cheng 0 0 0 0
Deputy Senior Vice President
Wang Yuan-Shyang 0 0 0 0
Deputy Senior Vice President
Chiang Wei-Du 0 0 0 0
Deputy Senior Vice President
Huang Chieh-Chih 0 0 0 0
Deputy Senior Vice President
Hsiao Chin-Lung 0 0 0 0
Deputy Senior Vice President
Chiu Chung-Yu 0 0 0 0
Deputy Senior Vice President
Wu Shu-Ping 0 0 0 0
Deputy Senior Vice President
Lin Nan-Yang 0 0 0 0
Deputy Senior Vice President
Wu Su-Shin 0 0 0 0
Deputy Senior Vice President
Chang Ming-Hung 0 0 0 0
Deputy Senior Vice President
Chen Shen-Chi 0 0 0 0
Deputy Senior Vice President
Lee Cheng-Chieh 0 0 0 0
Deputy Senior Vice President
Hsu Ping 0 0 0 0
Deputy Senior Vice President
Kuo Ming-Cheng 0 0 0 0
Deputy Senior Vice President
Tao Shin-Chien 0 0 0 0
Deputy Senior Vice President
Yu Chia-Chieh 0 0 0 0
Deputy Senior Vice President
Chen Yao-Min 0 0 0 0
Deputy Senior Vice President
Chen Chia-Chuan 0 0 0 0
Information on Stock Transfer: Nil
Information on Stock Pledged: Nil
43

Capital and Shares
History of Capitalization
Month/Year Price
Authorized Capital Issued Capital
Sources of Capital
(‘000)
Non-
Monetary
Capital
Expansion
Shares
(‘000)
Amount
(‘000)
Shares
(‘000)
Amount
(‘000)
03/2008 10 4,000,000 40,000,000 3,906,815 39,068,150 Corporate bond
conversion 318,356 -
04/2008 10 4,000,000 40,000,000 3,942,677 39,426,773 Corporate bond
conversion 358,623 -
07/2009 10 4,000,000 40,000,000 2,262,677 22,626,773 Capital Reduction
16,800,000 -
09/2009 10 4,000,000 40,000,000 2,962,677 29,626,773 Cash offering
7,000,000 -
09/2011 10 4,000,000 40,000,000 3,258,945 32,589,450
Capitalization of
retained earnings
2,962,677
-
Status of Shareholders
As of April 19, 2014
Item \ Entity Government
Agency
Financial
Institution
Other Legal
Entity
Domestic
Individual
Foreign
Institution or
Individual
Total
Number of
Shareholders 3 27 188 117,037 832 118,087
Shareholdings 26,941,200 225,040,499 1,231,114,306 1,240,075,221 535,773,779 3,258,945,005
Holding (%) 0.83 6.91 37.78 38.04 16.44 100.00
44

Distribution of Common Shares
As of April 19, 2014
Range of Shareholdings Number of
Shareholders Number of Shares Holding (%)
1-999 37,276 12,304,083 0.38
1,000-5,000 48,370 111,878,025 3.44
5,001-10,000 14,901 108,320,605 3.32
10,001-15,000 6,313 75,260,318 2.31
15,001-20,000 2,972 53,481,920 1.64
20,001-30,000 3,079 75,248,419 2.31
30,001-50,000 2,380 92,579,153 2.84
50,001-100,000 1,528 109,332,681 3.35
100,001-200,000 668 93,146,015 2.86
200,001-400,000 292 83,163,569 2.55
400,001-600,000 91 44,796,688 1.37
600,001-800,000 37 25,895,202 0.79
800,001-1,000,000 35 32,018,028 0.98
1,000,001 and above 145 2,341,520,299 71.86
Total 118,087 3,258,945,005 100.00
Major Shareholder Name List As of April 19, 2014
Shareholding
Entity Number of Shares Holding (%)
Evergreen Marine Corp. (Taiwan) Ltd. 629,483,229 19.32
Evergreen International Corp. 469,648,357 14.41
Falcon Investment Services Ltd. 162,962,925 5.00
Fubon Life Insurance Co., Ltd. 100,005,400 3.07
Chang Yung-Fa 98,360,200 3.02
Chang Kuo-Cheng 74,957,249 2.30
Nan Shan Life Insurance Co., Ltd. 54,817,200 1.68
Chang Kuo-Hua 52,506,568 1.61
Chang Kuo-Ming 47,858,445 1.47
Evergreen International Storage & Transport Corp. 38,045,443 1.17
45

Market Price, Net Worth, Earnings and Dividends per Share
Year
Items
2012
(Distributed in 2013)
2013
(Distributed in 2014)
2014
(As of April 30 2014)
Market Price
per Share
Highest NT$22.50 NT$19.35 NT$16.90
Lowest NT$16.20 NT$15.70 NT$15.05
Average NT$18.41 NT$17.34 NT$15.89
Net Worth
per Share
Before Distribution NT$10.85 NT$11.00 -
After Distribution - - -
Earnings
per Share
Weighted Average Shares 3,258,945,005 shares 3,258,945,005 shares 3,258,945,005 shares
Earnings
per Share
Before Adjustment NT$0.20 NT$0.23 -
After Adjustment - - -
Dividends
per Share
Cash Dividends - - -
Stock
Dividends
Dividends from
Retained Earnings - - -
Dividends from
Capital Surplus - - -
Return on
Investment
Price/Earnings Ratio
(Note 1) 92.05 75.39 -
Price/Dividend Ratio
(Note 2) - - -
Cash Dividend Yield Rate
(Note 3) - - -
Note 1: Price/Earnings Ratio = Average Share Price at Market Close for Current Fiscal Year/Earnings per Share
Note 2: Price/Dividend Ratio = Average Share Price at Market Close for Current Fiscal Year/Cash Dividend per
Share.
Note 3: Cash Dividend Yield Rate = Cash Dividend per Share/Average Market Closing Share Price for
Current Fiscal Year.
46

Dividend Policy and Implementation Status
Dividend Policy
In accordance with Article 26 of EVA’s Articles
of Incorporation, any earning from the annual
settlement should first be used to offset
accumulated deficits for previous years, after
deducting all applicable taxes and, second,
10% of the balance should be set aside in a
legal reserve; and set aside or reverse the
special reserve in compliance with regulations,
then be added to undistributed earnings from
the prior period for distribution after the board
of directors proposes a distribution program
with employee bonuses of no less than 1% and
director/supervisor compensation that does not
exceed 5% of the distributed amount and
submits the program at a shareholders’ meeting
for resolution.
Stockholders’ dividends shall be distributed in
cash dividends and stock dividends, with the
cash dividend at least 10% of the total amount
of distribution.
Dividend Distribution in Current Year
The board adopted a proposal for 2013
dividend distribution at its meeting on March
25, 2014 that no dividend will be distributed to
shareholders.
Employee Bonuses and Compensation Paid
to Directors and Supervisors
Range or Percentage of Employee Bonuses and
Compensation Paid to Directors and
Supervisors Specified in Article 26 of EVA’s
Articles of Incorporation: Earnings, if any,
from the annual settlement should first offset
accumulated deficits for previous years after
all applicable taxes are deducted and, second,
10% of the balance should be set aside in a
legal reserve; and set aside or reverse the
special reserve in compliance with regulations,
then be added to undistributed earnings from
the prior period for distribution after the board
of directors proposes a distribution program
with employee bonuses of no less than 1% and
director/supervisor compensation that does not
exceed 5% of the distributed amount and
submits the program at a shareholders’ meeting
for resolution.
Proposed Employee Bonus Plan Approved
by Board of Directors
Employee Cash Bonus: Nil
Employee Stock Bonus: Nil
Compensation Paid to Directors and
Supervisors: Nil
Number of shares proposed for distribution to
employees and the percentage of the shares
above capitalized earnings: 0 share, 0%
Estimated EPS after deduction of employee
bonuses and compensation to directors and
supervisors: Not applicable.
Status of Stock Repurchased by EVA: N/A
47

The Fleet
Since 2013 EVA took delivery of three brand-new A321-200 passenger aircraft and phased out
one 747-400 Combi aircraft.
As of December 31 2013
Aircraft Type Owned Capital
Lease
Operating
Lease Total
On Order
(Delivery date)
B747-400 3 - - 3 -
B747-400 Combi 2 - - 2 -
B777-300ER 9 2 4 15 7
May.2014~Jun.2016
A330-200 3 - 8 11 -
A330-300 - - 3 3 -
MD-90 - - 7 7 -
B747-400 Freighter 5 4 - 9 -
MD-11 Freighter 4 - 2 6 -
A321-200 - - 6 6 18
Mar.2014~Oct.2016
Total 26 6 30 62 25
48

The Network
EVA Air launched Taipei - Niigata passenger service in January 2013.
EVA Air launched Taipei - Okayama passenger service in April 2013.
EVA Air launched Kaohsiung - Jinan passenger service in May 2013.
EVA Air launched Taipei - Asahikawa passenger service in May 2013.
EVA Air launched Taipei - Hohhot passenger service in June 2013.
EVA Air launched Kaohsiung - Seoul passenger service in June 2013.
EVA Air launched Kaohsiung – Tokyo (Narita) passenger service in December 2013.
As of April 30, 2014
North
America
Anchorage Atlanta Dallas Guam New York
(JFK) Los Angeles
Chicago San Francisco Seattle Vancouver Toronto
Asia
Bangkok Jakarta Sapporo Delhi Bali Fukuoka
Gimpo Hanoi Hong Kong Hakodate Tokyo
(Haneda) Seoul
Kaohsiung Osaka Komatsu Kuala
Lumpur Macau Manila
Tokyo
(Narita) Penang Phnom Penh Asahikawa Sendai
Ho Chi Minh
City
Singapore Surabaya Taipei
(Taoyuan)
Taipei (Songshan)
Niigata Okayama
Taichung
Mainland
China
Guangzhou Chongqing Zhengzhou Chengdu Hangzhou Hohhot
Harbin Guilin Ningbo Beijing Shanghai
(Pudong)
Shanghai
(Hongqiao)
Jinan Tianjin Huangshan
Europe Amsterdam Paris Frankfurt London Vienna
Oceania Brisbane
Air cargo destination only
Total 63 destinations
49

The Market
The Consolidated Revenue by Business Segment
NT$(Million)
Year Passenger Cargo Other Total
2013 71,100 57% 32,033 26% 21,032 17% 124,164 100%
2012 65,618 55% 34,351 28% 20,189 17% 120,158 100%
Passenger Operations
Region No. of Passenger RPK (Million) Revenue (NT$ Million)
2013 2012 % 2013 2012 % 2013 2012 %
America 1,233,831 1,193,283 3.40% 12,998 12,519 3.83% 26,857 24,324 10.41%
Europe 652,724 614,615 6.20% 4,746 4,488 5.75% 9,170 8,404 9.11%
Asia 6,082,539 5,679,802 7.09% 9,664 8,728 10.72% 34,519 32,363 6.66%
Oceania 40,390 37,315 8.24% 273 253 7.91% 554 527 5.12%
Total 8,009,484 7,525,015 6.44% 27,681 25,988 6.51% 71,100 65,618 8.35%
Cargo Operations
Region Cargo carried (Tons) FTK (Million) Revenue (NT$ Million)
2013 2012 % 2013 2012 % 2013 2012 %
America 255,727 266,070 -3.89% 3,051 3,195 -4.51% 20,371 21,533 -5.40%
Europe 54,695 56,052 -2.42% 551 566 -2.65% 3,831 3,972 -3.55%
Asia 401,727 418,309 -3.96% 665 702 -5.27% 7,768 8,787 -11.60%
Oceania 1,656 1,401 18.20% 11 9 22.22% 63 59 6.78%
Total 713,805 741,832 -3.78% 4,278 4,472 -4.34% 32,033 34,351 -6.75%
Market Shares
Item 2013 2012
Number of Flights
EVA Airways 38,770 34,988
Taiwan 212,375 195,363
Market Share (%) 18.25 17.91
Number of Passengers
EVA Airways 7,847,954 7,321,265
Taiwan 38,898,209 35,151,356
Market Share (%) 20.18 20.83
Tons of Cargo
EVA Airways 436,099 456,061
Taiwan 1,632,433 1,632,397
Market Share (%) 26.71 27.94
Data Source: Monthly Digest of Statistics, CAA
50

2014 Outlook
Due to the stable development of cross-strait
political relations, trade and economic activities
will continue to warm up, and the gradual
relaxation of policy limitations on visitors from
Mainland China and regularly scheduled
cross-strait flights will lead to more business
and leisure travel. Prospects for EVA’s major
routes worldwide are described in the
paragraphs that follow. American routes
The Company operates 45 direct passenger
flights to the United States and Canada weekly:
17 to Los Angeles, five to New York, 12 to San
Francisco, five to Seattle, three to Vancouver
and three to Toronto. Since June 2014, the
number of flights has increased to 55 per week:
21 to Los Angeles, seven to New York, 14 to
San Francisco, four to Vancouver and four to
Toronto. In addition, we provide people
convenient connecting flight services by code
sharing with other leading airlines such as
United Airlines. EVA’s freighter service to North America is our
major source of cargo revenue. We provide
cargo service to seven destinations include Los
Angeles, San Francisco, Seattle, Chicago,
Dallas, New York and Atlanta. Three direct
flights from Atlanta to Osaka a week could
shorten the transportation process and enhance
the load factor. Besides, we would plan to
increase flights and enhance the flexibility of
adjusting freighter routes to improve
operational efficiency for seasonal demands. European routes
EVA has 18 scheduled nonstop passenger
flights a week to Europe, including three to
Amsterdam, four to Vienna, four to Paris and
seven to London. We give passengers on these
routes comfortable and convenient service. The Company is also collaborating with
Lufthansa to offer regular, dedicated cargo
services and extend our network within Europe.
These joint operations upgrade overall
performance in the region. Australian route
EVA’s Australian route primarily serves the
tourism market. In view of market demand and
operating costs, the Company will continue our
two weekly Taipei - Brisbane flights. Asian routes
Following inauguration of regular cross-strait
services on August 31, 2009, EVA and UNI Air
are now operating 116 scheduled weekly flights
between Taiwan and Mainland China. We serve
26 destinations: Beijing, Shanghai Pudong,
Shanghai Hongqiao, Guangzhou, Shenzhen,
Fuzhou, Xiamen, Hangzhou, Nanjing, Ningbo,
Tianjin, Dalian, Qingdao, Chongqing,
Chengdu, Zhengzhou, Jinan, Shenyang, Xian,
Kunming, Yanchen, Guilin, Changsha, Harbin,
Huangshan and Hohhot. With the ongoing liberalization of cross-strait
waypoint, the Company has launched Pudong,
Guangzhou, Chongqing, Tianjin and
Zhengzhou five scheduled freighter
destinations, and cooperated with China Cargo
Airlines by code sharing in the Pudong route.
For the destinations with cargo demand but no
freighter flight such as Shenzhen and others,
we operate with B747-400 Combi to increase
market competitiveness. Mainland China has
gradually changed from external demand to
internal demand, from "world factory" to
"world market", from the type of importing
material and exporting product to emphasizing
channels. The Company will grasp this
opportunity to increase the load factor of
inter-regional flights in Asia. Taiwan’s geographic location makes it an ideal
pivot point for traffic between North America
and Asia. The Company is leveraging this
geographic superiority and, at the same time,
supporting the government’s goal of
establishing Taiwan as the leading Asia Pacific
Operations Center with our extensive route
network connecting North America and Asia.
The Asia-Pacific region still has potential for
cargo business in the coming years. China
continues to stand out as a dominate business
and trade driver in the region. The Company
will continue to optimize opportunities such as
those created by the Economic Cooperation
Framework Agreement (ECFA). Catalyzing
acceleration of China’s domestic demand, the
Company will strategically seek greater shares
of the markets in China and Asia.
51

Human Resources - EVA Air and Consolidated Subsidiaries
Items \ Year 2012 2013 2014
(as of Apr. 30 2014)
No. of Employees
Pilots 887 967 1,028
Cabin Crew 1,926 2,144 2,538
Other 8,846 9,565 9,913
Total 11,659 12,676 13,479
Average Age 36.4 35.8 35.2
Average Seniority 9.8 9.4 9.3
Education Profile
Distribution (%)
Doctorate 0.1 0.1 0.1
Master’s 4.6 5.0 5.1
Bachelor’s 81.7 81.9 82.5
High School 9.9 9.7 9.2
Other 3.7 3.3 3.2
52

Financial and Operating Results
Financial Results
1.Condensed Balance Sheets from 2012 to 2014Q1 (Consolidated)
Unit: NT$ thousands
Item 2012 2013 2014.3.31
Current Assets 45,489,820 46,119,654 45,566,482
Property, plant and equipment 94,745,769 88,226,342 86,482,606
Intangible Assets 2,271,741 2,431,864 2,477,475
Other Assets 13,016,987 15,945,074 16,627,086
Total Assets 155,524,317 152,722,934 151,153,649
Current
Liabilities
Before Distribution 38,861,449 38,740,228 39,589,020
After Distribution 39,172,707 - -
Non-current Liabilities 77,278,067 73,725,345 72,027,152
Total
Liabilities
Before Distribution 116,139,516 112,465,573 111,616,172
After Distribution 116,450,774 - -
Equity attributable to Owners of parent 35,367,922 35,838,033 34,980,465
Common stock 32,589,450 32,589,450 32,589,450
Capital surplus 1,723,602 1,723,602 1,723,602
Retained
earnings
Before Distribution 1,895,476 2,275,240 1,365,409
After Distribution 1,536,422 - -
Other equity (840,606) (750,259) (697,996)
Treasury stock 0 0 0
Non-controlling interests 4,016,879 4,419,328 4,557,012
Total Equity Before Distribution 39,384,801 40,257,361 39,537,477
After Distribution 39,073,543 - -
Note1: Above data are based on the consolidated financial statements as of December 31, 2013 and 2012, and
the consolidated financial statements as of March 31, 2014 which haven’t been reviewed by
independent auditors as of the printing date.
Note2: If the Company has compiled the parent-company-only financial statements, the last five years
Condensed Balance Sheet and the Condensed Statement of Comprehensive Income for the
parent-company-only shall be disclosed.
Note3: If the adoption of IFRS for the financial information is less than five years, the ROC GAAP financial
information shall be disclosed.
53

2.Condensed Statement of Comprehensive Income from 2012 to 2014Q1 (Consolidated)
Unit: NT$ thousands (Except EPS:NT$)
Item 2012 2013 2014.3.31
Operating Revenue 120,158,467 124,164,451 30,392,098
Gross Profit 10,902,960 12,967,732 2,095,252
Operating Income (Loss) 2,409,150 3,470,319 (171,649)
Non-operating income and expenses (713,983) (1,629,981) (457,289)
Profit before tax 1,695,167 1,840,338 (628,938)
Profit (Loss) 1,195,687 1,279,725 (781,121)
Other comprehensive income, net of
tax (1,541,101) (279,340) 64,443
Comprehensive Income (345,414) 1,000,385 (716,678)
Profit or Loss attributable to:
Owners of Parent 655,200 747,450 (909,831)
Non-controlling interests 540,487 532,275 128,710
Comprehensive income attributable to:
Owners of Parent (826,131) 470,111 (857,568)
Non-controlling interests 480,717 530,274 140,890
Basic earnings per share 0.20 0.23 (0.28)
Note1: Above data are based on the consolidated financial statements as of December 31, 2013 and 2012,
and the consolidated financial statements as of March 31, 2014 which haven’t been reviewed by
independent auditors as of the printing date.
Note2: If the Company has compiled the parent-company-only financial statements, the last five years
Condensed Balance Sheet and the Condensed Statement of Comprehensive Income for the
parent-company-only shall be disclosed.
Note3: If the adoption of IFRS for the financial information is less than five years, the ROC GAAP
financial information shall be disclosed.
54
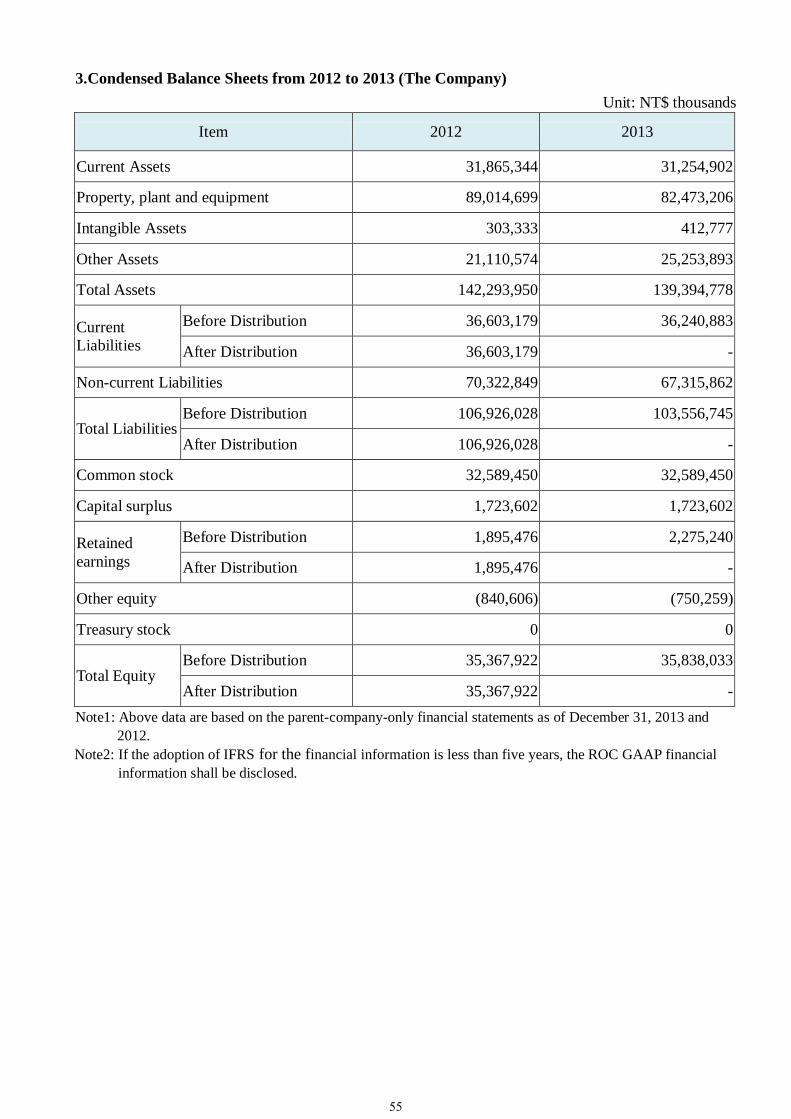
3.Condensed Balance Sheets from 2012 to 2013 (The Company)
Unit: NT$ thousands
Item 2012 2013
Current Assets 31,865,344 31,254,902
Property, plant and equipment 89,014,699 82,473,206
Intangible Assets 303,333 412,777
Other Assets 21,110,574 25,253,893
Total Assets 142,293,950 139,394,778
Current
Liabilities
Before Distribution 36,603,179 36,240,883
After Distribution 36,603,179 -
Non-current Liabilities 70,322,849 67,315,862
Total Liabilities Before Distribution 106,926,028 103,556,745
After Distribution 106,926,028 -
Common stock 32,589,450 32,589,450
Capital surplus 1,723,602 1,723,602
Retained
earnings
Before Distribution 1,895,476 2,275,240
After Distribution 1,895,476 -
Other equity (840,606) (750,259)
Treasury stock 0 0
Total Equity Before Distribution 35,367,922 35,838,033
After Distribution 35,367,922 -
Note1: Above data are based on the parent-company-only financial statements as of December 31, 2013 and
2012.
Note2: If the adoption of IFRS for the financial information is less than five years, the ROC GAAP financial
information shall be disclosed.
55

4.Condensed Statement of Comprehensive Income from 2012 to 2013 (The Company)
Unit: NT$ thousands (Except EPS:NT$)
Item 2012 2013
Operating Revenue 107,147,807 110,747,462
Gross Profit 8,075,673 10,284,596
Operating Income 196,107 1,588,253
Non-operating income and expenses 557,916 (686,542)
Profit before tax 754,023 901,711
Profit 655,200 747,450
Other comprehensive income, net of tax (1,481,331) (277,339)
Comprehensive Income (826,131) 470,111
Basic earnings per share 0.20 0.23
Note1: Above data are based on the parent-company-only financial statements as of December 31, 2013
and 2012.
Note2: If the adoption of IFRS for the financial information is less than five years, the ROC GAAP
financial information shall be disclosed.
56

5.Condensed Balance Sheets from 2009 to 2012 (Consolidated) - ROC GAAP
Unit: NT$ thousands
Item 2009 2010 2011 2012
Current Assets 33,904,924 44,595,513 45,720,568 49,938,664
Funds and investments 4,056,428 4,225,198 5,224,441 5,295,605
Property, plant and
equipment 110,918,235 103,631,981 94,857,339 87,779,979
Intangible Assets 262,810 188,486 351,146 281,504
Other Assets 10,592,237 6,050,323 5,242,218 5,970,823
Total Assets 159,734,634 158,691,501 151,395,712 149,266,575
Current
Liabilities
Before
Distribution 41,382,835 40,971,867 36,234,830 38,076,906
After
Distribution 41,896,940 44,583,603 36,647,779 38,388,164
Long-term liabilities 81,164,772 71,730,936 70,566,107 67,892,564
Other liabilities 1,937,676 1,883,398 2,948,851 2,582,594
Total
Liabilities
Before
Distribution 124,485,283 114,586,201 109,749,788 108,552,064
After
Distribution 124,999,388 118,197,937 110,162,737 108,863,322
Common stock 29,626,772 29,626,772 32,589,450 32,589,450
Capital surplus 5,564,505 2,649,436 2,626,446 2,626,446
Retained
earnings
Before
Distribution (2,915,074) 12,016,736 6,301,045 6,805,056
After
Distribution (3,448,884) 5,421,631 5,844,465 6,446,002
Unrealized gains or losses
on financial instruments (515,511) 408,136 202,590 265,365
Cumulative translation
adjustments 423,833 (3,554,690) (2,579,360) (4,376,170)
Net loss not recognized as
pension cost (157,412) (511,128) (1,266,896) (1,356,686)
Minority interest 3,222,238 3,470,038 3,772,649 4,161,050
Total
Equity
Before
Distribution 35,249,351 44,105,300 41,645,924 40,714,511
After
Distribution 34,735,246 40,493,564 41,232,975 40,403,253
Data Source:The audited financial statements for each financial year are certified by independent auditors.
57

6.Condensed Statement of Income from 2009 to 2012 (Consolidated) - ROC GAAP
Unit: NT$ thousands (Except EPS: NT$)
Item 2009 2010 2011 2012
Operating Revenue 81,496,329 114,054,453 113,619,373 120,121,016
Gross Profit 4,701,325 21,557,728 10,255,304 11,584,765
Operating Income(Loss) (1,699,620) 14,174,331 2,440,954 2,995,372
Non-operating income and gains 974,748 761,014 707,204 792,723
Non-operating expenses and losses 2,384,857 2,222,235 2,028,976 2,317,222
Income(loss) before income tax (3,109,729) 12,713,110 1,119,182 1,470,873
Net income(loss) (2,585,006) 12,423,848 750,933 1,041,083
Income attributable to:
Parent Company (2,844,254) 12,016,736 209,028 504,011
Minority interest 259,248 407,112 541,905 537,072
Basic
earnings per
share
Before retraced
adjustment (1.14) 4.06 0.06 0.15
After retraced
adjustment (1.14) 3.69 0.06 0.15
Data Source:The audited financial statements for each financial year are certified by independent auditors.
58

7.Condensed Balance Sheets from 2009 to 2012 (The Company) - ROC GAAP
Unit: NT$ thousands
Item 2009 2010 2011 2012
Current Assets 25,588,374 34,373,857 32,841,444 35,967,240
Funds and investments 11,211,034 11,850,022 13,449,975 14,359,368
Property, plant and
equipment 106,539,215 95,802,438 87,529,888 80,598,176
Intangible Assets 238,093 149,633 301,345 225,167
Other Assets 6,360,020 5,853,569 5,123,260 5,900,614
Total Assets 149,936,736 148,029,519 139,245,912 137,050,565
Current
Liabilities
Before
Distribution 37,732,901 36,392,207 33,383,685 35,942,709
After
Distribution 37,732,901 39,354,884 33,383,685 35,942,709
Long-term liabilities 78,143,293 69,054,677 64,952,297 61,609,082
Other liabilities 2,033,429 1,947,373 3,036,655 2,945,313
Total
Liabilities
Before
Distribution 117,909,623 107,394,257 101,372,637 100,497,104
After
Distribution 117,909,623 110,356,934 101,372,637 100,497,104
Common stock 29,626,772 29,626,772 32,589,450 32,589,450
Capital surplus 5,564,505 2,649,436 2,626,446 2,626,446
Retained
earnings
Before
Distribution (2,915,074) 12,016,736 6,301,045 6,805,056
After
Distribution (2,915,074) 6,091,381 6,301,045 6,805,056
Unrealized gains or losses on
financial instruments (515,511) 408,136 202,590 265,365
Cumulative translation
adjustments 423,833 (3,554,690) (2,579,360) (4,376,170)
Net loss not recognized as
pension cost (157,412) (511,128) (1,266,896) (1,356,686)
Total
Equity
Before
Distribution 32,027,113 40,635,262 37,873,275 36,553,461
After
Distribution 32,027,113 37,672,585 37,873,275 36,553,461
Data Source:The audited financial statements for each financial year are certified by independent auditors.
59

8.Condensed Statement of Income from 2009 to 2012 (The Company) - ROC GAAP
Unit: NT$ thousands (Except EPS: NT$)
Item 2009 2010 2011 2012
Operating Revenue 73,279,511 104,410,011 102,192,051 107,110,356
Gross Profit 3,088,115 19,620,811 7,780,266 8,783,242
Operating Income(Loss) (2,820,224) 12,648,748 447,553 810,972
Non-operating income and gains 1,124,674 1,476,477 1,675,937 1,543,329
Non-operating expenses and losses 2,029,783 2,079,958 1,886,123 1,821,944
Income(loss) before income tax (3,725,333) 12,045,267 237,367 532,357
Net income(loss) (2,844,254) 12,016,736 209,028 504,011
Basic
earnings per
share
Before retraced
adjustment (1.14) 4.06 0.06 0.15
After retraced
adjustment (1.14) 3.69 0.06 0.15
Data Source:The audited financial statements for each financial year are certified by independent auditors.
Auditors' Opinions from 2009 to 2013
Year CPA Auditors’ Opinion
2009 Chen Ya-Ling、Chang Chia-Hsin
An Unqualified Opinion
with explanatory paragraph
2010 Chen Ya-Ling、Chang Chia-Hsin
2011 Chen Ya-Ling、Chang Chia-Hsin
2012 Chang Chia-Hsin、Shih Wei-Ming
2013 Chang Chia-Hsin、Shih Wei-Ming An Unqualified Opinion
60

9.Financial Analysis from 2012 to 2014Q1 (Consolidated)
Note1: Not applicable due to Industry characteristics. Note2: Above data are based on the consolidated financial statements as of December 31, 2013 and 2012, and the
consolidated financial statements as of March 31, 2014 which haven’t been reviewed by independent auditors as of the printing date.
Note3: If the Company has compiled the parent-company-only financial statements, the last five years Condensed Balance Sheet and the Condensed Statement of Comprehensive Income for the parent-company-only shall be disclosed.
Note4: If the adoption of IFRS for the financial information is less than five years, the ROC GAAP financial information shall be disclosed.
Item 2012 2013 2014.3.31
Financial Structure
(%)
Debts Ratio 74.68 73.64 73.84
Long-term Fund to Property, Plant and Equipment 113.23 118.38 117.56
Solvency (%)
Current Ratio 117.06 119.05 115.10
Quick Ratio 91.54 94.11 92.02
Times Interest Earned (Times) 205.30 225.03 (85.46)
Operating
Performance
Average Collection Turnover (Times)(Note1) - - -
Average Collection Days for Receivables (Note1) - - -
Average Inventory Turnover (Times)(Note1) - - -
Average Payment Turnover (Times)(Note1) - - -
Average Days for Sale of Goods (Note1) - - -
Property, Plant and Equipment Turnover (Times) 1.23 1.36 0.35
Total Assets Turnover (Times) 0.77 0.81 0.20
Profitability
Return on Total Assets (%) 1.72 1.69 (0.32)
Return on Total Equity (%) 3.02 3.21 (1.96)
Pre-tax Income to Paid-in Capital Ratio (%) 5.20 5.65 (1.93)
Net Margin (%) 1.00 1.03 (2.57)
Earnings Per Share (NT$) 0.20 0.23 (0.28)
Cash Flow (%)
Ratio of Cash Flows 38.29 44.53 1.99
Cash Flow Adequacy Ratio 214.14 202.97 191.81
Ratio of Re-Investment for Cash 8.70 10.16 0.46
Leverage Operating Leverage 13.31 10.31 (47.54)
Financial Leverage 3.86 1.86 0.32
Analysis of deviation of 2013 vs. 2012 over 20%:
Operating Leverage and Financial Leverage decreased primarily due to increase in operating income.
61

10.Financial Analysis from 2012 to 2013 (The Company)
Note1: Not applicable due to Industry characteristics.
Note2: Above data are based on the parent-company-only financial statements as of December 31, 2013 and
2012.
Note3: If the adoption of IFRS for the financial information is less than five years, the ROC GAAP financial
information shall be disclosed.
Item 2012 2013
Financial Structure
(%)
Debts Ratio 75.14 74.29
Long-term Fund to Property, Plant and Equipment 108.94 114.02
Solvency (%)
Current Ratio 87.06 86.24
Quick Ratio 77.73 78.77
Times Interest Earned (Times) 153.56 170.15
Operating
Performance
Average Collection Turnover (Times)(Note1) - -
Average Collection Days for Receivables (Note1) - -
Average Inventory Turnover (Times)(Note1) - -
Average Payment Turnover (Times)(Note1) - -
Average Days for Sale of Goods (Note1) - -
Property, Plant and Equipment Turnover (Times) 1.16 1.29
Total Assets Turnover (Times) 0.75 0.79
Profitability
Return on Total Assets (%) 1.42 1.39
Return on Total Equity (%) 1.83 2.10
Pre-tax Income to Paid-in Capital Ratio (%) 2.31 2.77
Net Margin (%) 0.61 0.67
Earnings Per Share (NT$) 0.20 0.23
Cash Flow (%)
Ratio of Cash Flows 40.38 38.65
Cash Flow Adequacy Ratio 242.12 203.30
Ratio of Re-Investment for Cash 9.69 9.27
Leverage Operating Leverage 127.85 17.96
Financial Leverage (0.13) 12.90
Analysis of deviation of 2013 vs. 2012 over 20%:
1. Operating Leverage decreased as a result of increase in operating income.
2. Financial Leverage increased primarily due to increase in operating income.
62

11.Financial Analysis from 2009 to 2012 (Consolidated) - ROC GAAP
Item 2009 2010 2011 2012
Financial
Structure
(%)
Debts Ratio 77.93 72.21 72.49 72.72
Long-term Fund to Property,
Plant and Equipment 104.95 111.78 118.30 123.73
Solvency
(%)
Current Ratio 81.93 108.84 126.18 131.15
Quick Ratio 50.05 72.83 82.19 93.39
Times Interest Earned (Times) (47.73) 708.55 161.02 183.32
Operating
Performance
Average Collection Turnover
(Times)(Note1) - - - -
Average Collection Days for
Receivables (Note1) - - - -
Average Inventory Turnover
(Times)(Note1) - - - -
Average Payment Turnover
(Times)(Note1) - - - -
Average Days for Sale of Goods
(Note1) - - - -
Property, Plant and Equipment
Turnover (Times) 0.75 1.06 1.14 1.32
Total Assets Turnover (Times) 0.52 0.72 0.73 0.80
Profitability
Return on Total Assets (%) (0.67) 8.76 1.43 1.65
Return on Equity (%) (8.08) 31.31 1.75 2.53
Income (loss) before income tax
to Paid-in Capital Ratio (%) (10.50) 42.91 3.43 4.51
Net Margin (%) (3.17) 10.89 0.66 0.87
Earnings Per
Share (NT$)
Before retraced
adjustment (1.14) 4.06 0.06 0.15
After retraced
adjustment (1.14) 3.69 0.06 0.15
Cash Flow
(%)
Ratio of Cash Flows 0.00 47.32 38.60 31.74
Cash Flow Adequacy Ratio 16.62 34.91 57.96 90.48
Ratio of Re-Investment for Cash 0.00 11.31 6.34 7.42
Leverage Operating Leverage (13.83) 2.85 11.97 10.47
Financial Leverage 0.45 1.15 3.59 2.39
Data Source:The audited financial statements for each financial year are certified by independent auditors.
Note1: Not applicable due to Industry characteristics.
63

12.Financial Analysis from 2009 to 2012 (The Company) - ROC GAAP
Item 2009 2010 2011 2012
Financial
Structure
(%)
Debts Ratio 78.64 72.55 72.80 73.33
Long-term Fund to Property,
Plant and Equipment 103.41 114.50 117.47 121.79
Solvency
(%)
Current Ratio 67.81 94.45 98.38 100.07
Quick Ratio 42.70 66.23 69.32 79.19
Times Interest Earned (Times) (82.69) 697.00 112.36 132.18
Operating
Performance
Average Collection Turnover
(Times)(Note1) - - - -
Average Collection Days for
Receivables (Note1) - - - -
Average Inventory Turnover
(Times)(Note1) - - - -
Average Payment Turnover
(Times)(Note1) - - - -
Average Days for Sale of Goods
(Note1) - - - -
Property, Plant and Equipment
Turnover (Times) 0.70 1.03 1.11 1.27
Total Assets Turnover (Times) 0.49 0.70 0.71 0.78
Profitability
Return on Total Assets(%) (0.93) 9.05 1.11 1.33
Return on Equity (%) (9.85) 33.08 0.53 1.35
Income (loss) before income tax to Paid-in Capital Ratio (%)
(12.57) 40.66 0.73 1.63
Net Margin (%) (3.88) 11.51 0.20 0.47
Earnings Per
Share (NT$)
Before retraced
adjustment (1.14) 4.06 0.06 0.15
After retraced
adjustment (1.14) 3.69 0.06 0.15
Cash Flow
(%)
Ratio of Cash Flows 0.00 52.96 40.48 34.41
Cash Flow Adequacy Ratio 8.99 35.00 59.64 98.52
Ratio of Re-Investment for Cash 0.00 12.19 6.73 8.57
Leverage Operating Leverage (6.60) 2.75 51.24 30.46
Financial Leverage 0.59 1.16 (0.37) (1.02)
Data Source:The audited financial statements for each financial year are certified by independent auditors.
Note1: Not applicable due to Industry characteristics.
64
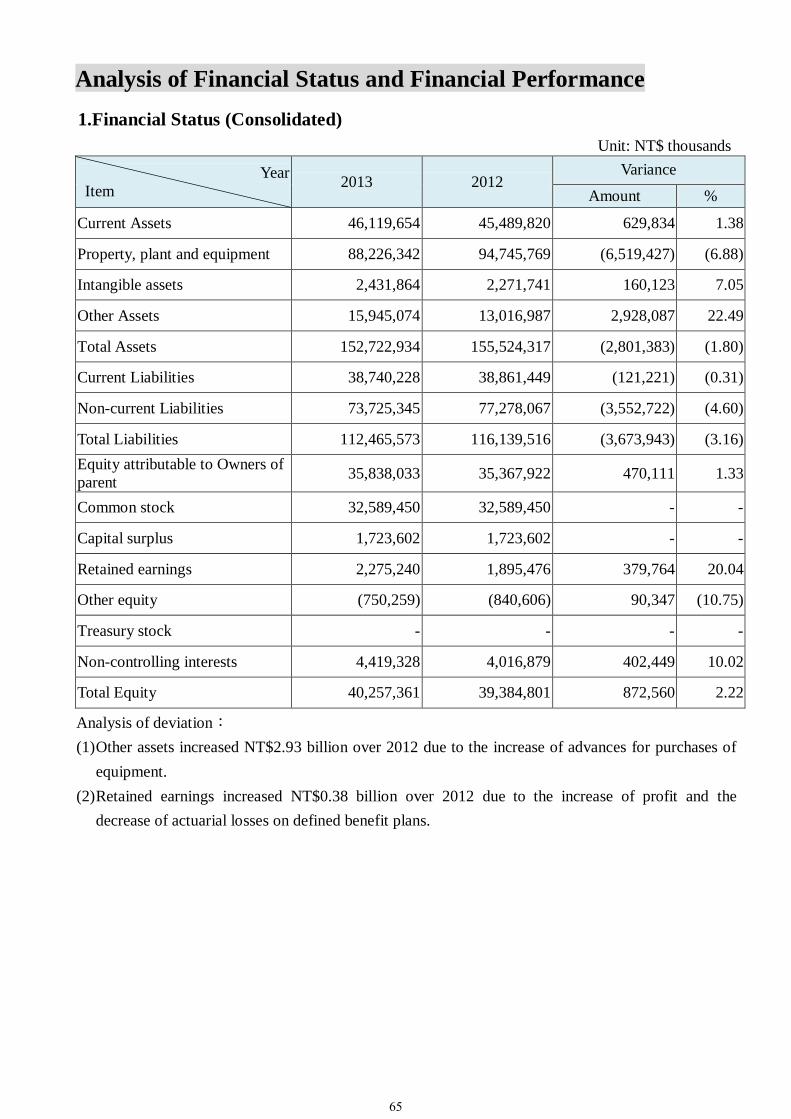
Analysis of Financial Status and Financial Performance
1.Financial Status (Consolidated)
Unit: NT$ thousands
Year
Item 2013 2012
Variance
Amount %
Current Assets 46,119,654 45,489,820 629,834 1.38
Property, plant and equipment 88,226,342 94,745,769 (6,519,427) (6.88)
Intangible assets 2,431,864 2,271,741 160,123 7.05
Other Assets 15,945,074 13,016,987 2,928,087 22.49
Total Assets 152,722,934 155,524,317 (2,801,383) (1.80)
Current Liabilities 38,740,228 38,861,449 (121,221) (0.31)
Non-current Liabilities 73,725,345 77,278,067 (3,552,722) (4.60)
Total Liabilities 112,465,573 116,139,516 (3,673,943) (3.16)
Equity attributable to Owners of
parent 35,838,033 35,367,922 470,111 1.33
Common stock 32,589,450 32,589,450 - -
Capital surplus 1,723,602 1,723,602 - -
Retained earnings 2,275,240 1,895,476 379,764 20.04
Other equity (750,259) (840,606) 90,347 (10.75)
Treasury stock - - - -
Non-controlling interests 4,419,328 4,016,879 402,449 10.02
Total Equity 40,257,361 39,384,801 872,560 2.22
Analysis of deviation:
(1) Other assets increased NT$2.93 billion over 2012 due to the increase of advances for purchases of
equipment.
(2) Retained earnings increased NT$0.38 billion over 2012 due to the increase of profit and the
decrease of actuarial losses on defined benefit plans.
65
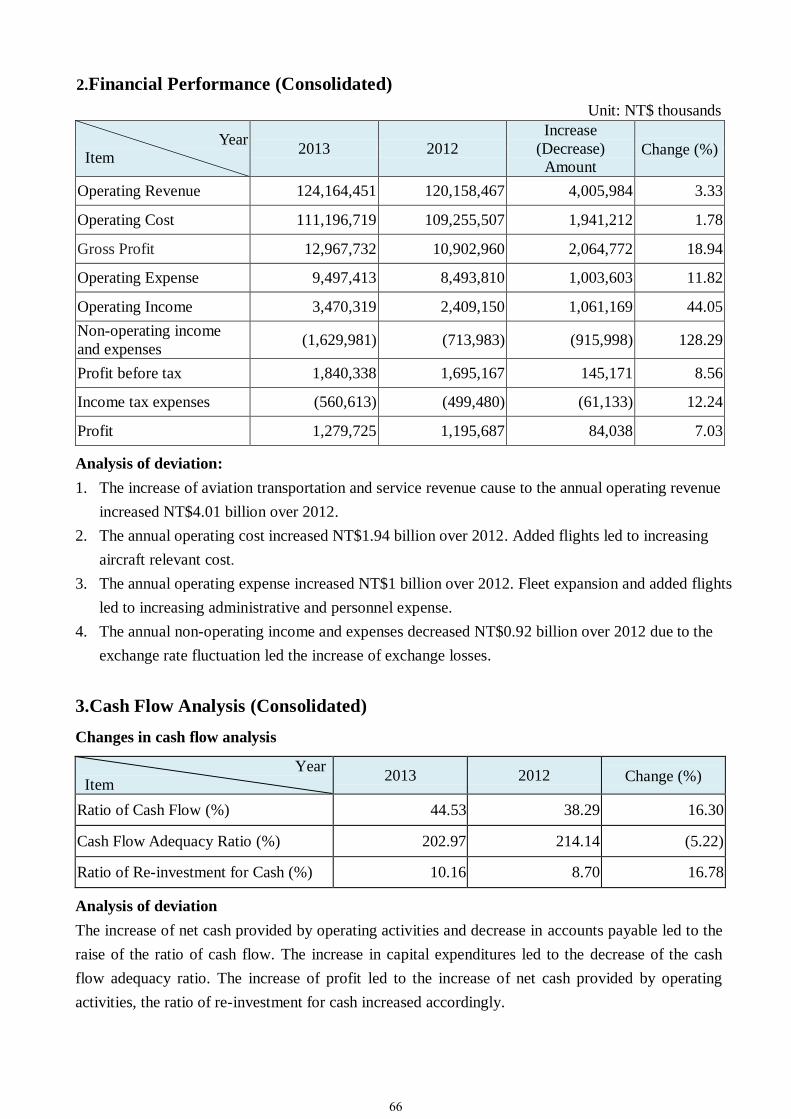
2.Financial Performance (Consolidated)
Unit: NT$ thousands
Year
Item 2013 2012
Increase
(Decrease)
Amount Change (%)
Operating Revenue 124,164,451 120,158,467 4,005,984 3.33
Operating Cost 111,196,719 109,255,507 1,941,212 1.78
Gross Profit 12,967,732 10,902,960 2,064,772 18.94
Operating Expense 9,497,413 8,493,810 1,003,603 11.82
Operating Income 3,470,319 2,409,150 1,061,169 44.05
Non-operating income
and expenses (1,629,981) (713,983) (915,998) 128.29
Profit before tax 1,840,338 1,695,167 145,171 8.56
Income tax expenses (560,613) (499,480) (61,133) 12.24
Profit 1,279,725 1,195,687 84,038 7.03
Analysis of deviation:
1. The increase of aviation transportation and service revenue cause to the annual operating revenue
increased NT$4.01 billion over 2012.
2. The annual operating cost increased NT$1.94 billion over 2012. Added flights led to increasing
aircraft relevant cost.
3. The annual operating expense increased NT$1 billion over 2012. Fleet expansion and added flights
led to increasing administrative and personnel expense.
4. The annual non-operating income and expenses decreased NT$0.92 billion over 2012 due to the
exchange rate fluctuation led the increase of exchange losses.
3.Cash Flow Analysis (Consolidated)
Changes in cash flow analysis
Year
Item 2013 2012 Change (%)
Ratio of Cash Flow (%) 44.53 38.29 16.30
Cash Flow Adequacy Ratio (%) 202.97 214.14 (5.22)
Ratio of Re-investment for Cash (%) 10.16 8.70 16.78
Analysis of deviation
The increase of net cash provided by operating activities and decrease in accounts payable led to the
raise of the ratio of cash flow. The increase in capital expenditures led to the decrease of the cash
flow adequacy ratio. The increase of profit led to the increase of net cash provided by operating
activities, the ratio of re-investment for cash increased accordingly.
66

Remedy Measures for Inadequate Liquidity
The Company expects to make financing through mid and long-term unsecured loans and issuing
corporate bonds.
Liquidity Analysis for 2014 (Consolidated)
NT$ thousands
Initial Cash
Balance
(1)
Net Cash Flow
from Operations
During This Year
(2)
Cash Outflows
During This
Year (3)
Cash Balance
(Negative)
(1)+(2)-(3)
Remedy Measures for Negative Cash
Balance
Investment Plans Financing Plans
24,898,172 12,444,829 32,630,800 4,712,201 - 15,749,860
Operating activities: The Company estimate cash flow from operations in the next one year would
accumulate to NT$12,445 million.
Investment activities: The estimated equipment purchase reaches NT$20,660 million.
Financing activities: The estimated both mid and long-term mortgage loans reach NT$11,971
million.
Remedy Measures for Inadequate Cash Liquidity: Mid and long-term loans to get NT$15,750 million.
Significant capital expenditures
In May 2012 and October 2013, the Company entered into aircraft purchase contracts with Boeing
Company and four subsidiaries of GECAS for 7 Boeing 777 aircraft. The total amount of the
contracts price is US$2,261 million. The Company has partially paid the amount of NT$4,659 million
and was recognized in advances for purchases of equipment included in other non-current assets.
Recent Reinvestment Policy, Major Reason of Profit & Loss, Remedy Actions and
Forward Investment Plan
The recent reinvestments entered mainly concentrate on integration of aviation relative business to
ensure service quality. Stemming from outstanding operating performance of subsidiaries including
Evergreen Aviation Technologies Corp., Evergreen Sky Catering Corp., Evergreen Airline Services
Corp., and Evergreen Air Cargo Services Corp., the Company reported investment income of
NT$807 million.
The Company entered investment in 「EVA Flight Training Academy」USD 10 million in 2013.
In the most recent fiscal year, the Consolidated Company recent reinvestments entered mainly
concentrate on aviation-related industries, involving the ground handling services, air freight
terminals and aircraft component manufacturing. For the year 2013, the Consolidated Company
reported investment income of NT$85 million.
67

Principal Subsidiaries As of December 31, 2013
Company Principal
Activities Location
Date
Founded Capital Share%
Evergreen Airline
Services Corp.
Ground
handling Taiwan Oct. 1990 NT$379.83 million 56.33%
Evergreen Aviation
Technologies Corp.
Aircraft
repair and
maintenance
Taiwan Nov. 1997 NT$5.26 billion 80.00%
Evergreen Air
Cargo Services
Corp.
Cargo terminal
operation Taiwan Mar. 2000 NT$1.2 billion 60.00%
Evergreen Sky
Catering Corp. Airline catering Taiwan Oct. 1993 NT$1 billion 49.80%
Hsiang-Li
Investment Corp.
Investment
business Taiwan Jan. 2001 NT$26.8 million 100%
Evergreen Airways
Service (Macau)
Ltd.
Investment
business Macau Dec. 1994 US$12,488 99.00%
Green Siam Air
Services Co., Ltd. Travel business Thailand May 1990 THB20 million 49.00%
RTW Air
Services(S) Pte
Ltd.
Travel business Singapore Oct. 1989 SG$1.5 million 49.00%
PT Perdana
Andalan Air
Service
Travel business Indonesia May 1991 IDR1.6 billion 51.00%
Sky Castle
Investment Ltd.
Investment
business Samoa Feb. 2005 US$5.5 million 100%
Concord Pacific
Ltd.
Investment
business Samoa Apr. 2005 US$74.1 million 100%
Sino Gain Ltd. Aircraft
Leasing Samoa Aug. 2009 US$25,000 100%
EVA Flight
Training Academy
Flight Training
Academy
The United
States Feb. 2013 US$10 million 100%
68

Operating Results - The Company
Item 2013 2012 2011 2010 2009
Overall Capacity (Million) 8,306 8,308 8,720 8,838 7,188
Overall Traffic (Million) 6,770 6,811 7,045 7,294 5,672
Overall Load Factor (%) 81.5 82.0 80.8 82.5 78.9
Overall Yield (NT$) 15.23 14.68 13.64 13.39 12.02
Passenger Capacity (Million) 34,765 32,770 30,809 29,632 29,311
Passenger Traffic (Million) 27,681 25,988 24,033 23,627 22,689
Passengers Carried (‘000) 8,009 7,525 6,663 6,436 6,022
Passenger Load Factor (%) 79.6 79.3 78.0 79.7 77.4
Passenger Yield (NT$) 2.57 2.52 2.48 2.39 1.94
Cargo Capacity (Million) 5,177 5,359 5,947 6,171 4,550
Cargo Traffic (Million) 4,278 4,472 4,883 5,168 3,630
Cargo Carried (Tons) 713,805 741,832 793,060 850,617 609,734
Cargo Load Factor (%) 82.6 83.4 82.1 83.7 79.8
Cargo Yield (NT$) 7.49 7.68 7.49 7.99 6.67
Unit Cost (NT$) 13.14 12.87 11.67 10.38 10.59
Number of Aircraft 62 60 59 56 55
Number of Employees 7,077 6,429 5,807 5,121 4,486
Capacity per Employee (Thousand) 1,174 1,292 1,501 1,726 1,602
Traffic per Employee(Thousand) 957 1,059 1,213 1,424 1,264
Revenue per Employee (Thousand) 15,649 16,666 17,598 20,389 16,335
69

EVA AIRWAYS CORP. Consolidated Financial Statements
December 31, 2013 and 2012 (With Independent Auditors' Report Thereon)
Address: No. 376 Hsin-nan Road, Sec. 1, Luchu, Taoyuan Hsien, Taiwan
Telephone No.: 886(03)3515151
70

Independent Auditors’ Report The Board of Directors EVA Airways Corp.: We have audited the accompanying consolidated balance sheets of EVA Airways Corp. (the “Company”) and subsidiaries as of December 31, 2013 and 2012, and January 1, 2012, and the related consolidated statements of comprehensive income, changes in equity, and cash flows for the years ended December 31, 2013 and 2012. These consolidated financial statements are the responsibility of the Company’s management. Our responsibility is to express an opinion on these consolidated financial statements based on our audits. We conducted our audits in accordance with the “Regulations Governing Auditing and Certification of Financial Statements by Certified Public Accountants” and auditing standards generally accepted in the Republic of China. Those regulations and standards require that we plan and perform the audit to obtain reasonable assurance about whether the consolidated financial statements are free of material misstatement. An audit includes examining, on a test basis, evidence supporting the amounts and disclosures in the consolidated financial statements. An audit also includes assessing the accounting principles used and significant estimates made by management, as well as evaluating the overall consolidated financial statement presentation. We believe that our audits provide a reasonable basis for our opinion. In our opinion, the consolidated financial statements referred to in the first paragraph present fairly, in all material respects, the financial position of the Company and subsidiaries as of December 31, 2013 and 2012, and January 1, 2012, and their financial performance and cash flows for the years ended December 31, 2013 and 2012, in conformity with the “Regulations Governing the Preparation of Financial Reports by Securities Issuers” and the International Financial Reporting Standards, International Accounting Standards, IFRS Interpretations and SIC Interpretations approved by the Republic of China Financial Supervisory Commission.
71

Note to Readers The accompanying consolidated financial statements are intended only to present the financial position, financial performance, and cash flows in accordance with the “Regulations Governing the Preparation of Financial Reports by Securities Issuers” and the International Financial Reporting Standards, International Accounting Standards, IFRIC Interpretations and SIC Interpretations approved by the Financial Supervisory Commission, R.O.C. The standards, procedures and practices to audit such financial statements are those generally accepted and applied in the Republic of China.
The auditors’ report and the accompanying financial statements are the English translation of the Chinese version prepared and used in the Republic of China. If there is any conflict between, or any difference in the interpretation of, the English and Chinese language auditors’ report and financial statements, the Chinese version shall prevail.
We have audited the Company’s parent-company-only financial statements as of December 31, 2013 and 2012, and January 1, 2012, and for the years ended December 31, 2013 and 2012, on which we have expressed an unqualified opinion.
Taipei, Taiwan (the Republic of China) March 25, 2014
72

73
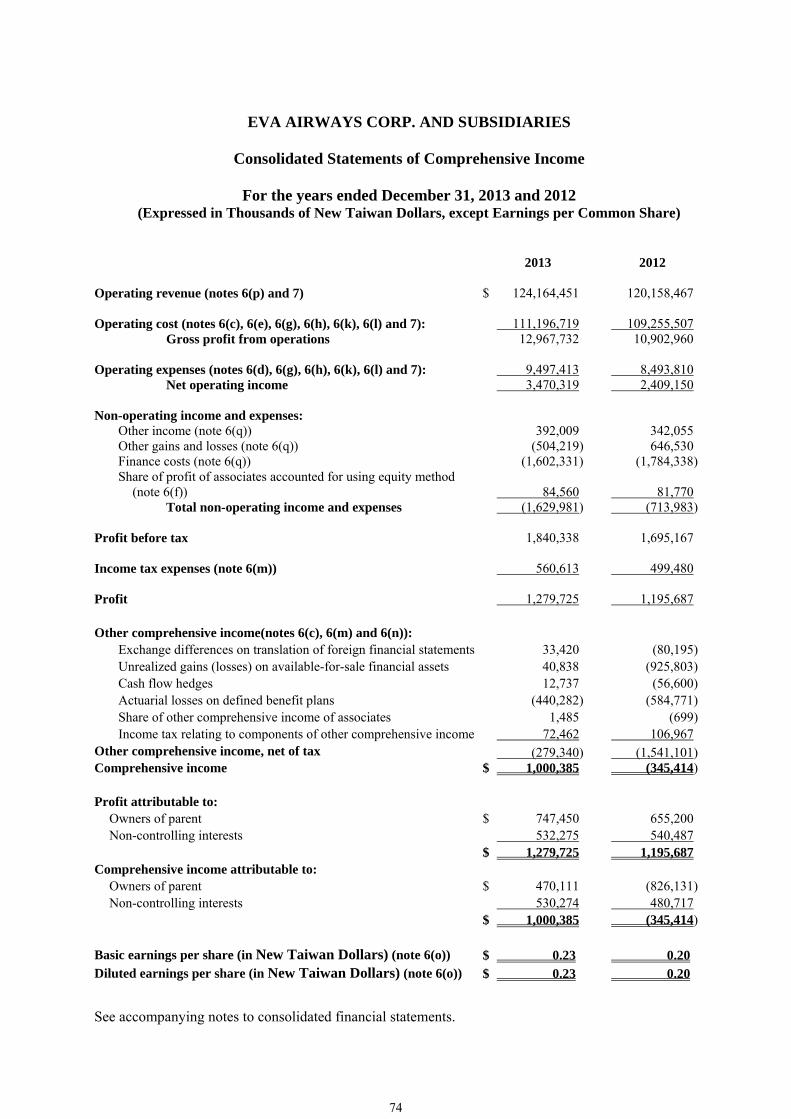
See accompanying notes to consolidated financial statements.
EVA AIRWAYS CORP. AND SUBSIDIARIES
Consolidated Statements of Comprehensive Income
For the years ended December 31, 2013 and 2012 (Expressed in Thousands of New Taiwan Dollars, except Earnings per Common Share)
2013 2012 Operating revenue (notes 6(p) and 7) $ 124,164,451 120,158,467 Operating cost (notes 6(c), 6(e), 6(g), 6(h), 6(k), 6(l) and 7): 111,196,719 109,255,507
Gross profit from operations 12,967,732 10,902,960 Operating expenses (notes 6(d), 6(g), 6(h), 6(k), 6(l) and 7): 9,497,413 8,493,810
Net operating income 3,470,319 2,409,150 Non-operating income and expenses:
Other income (note 6(q)) 392,009 342,055 Other gains and losses (note 6(q)) (504,219) 646,530 Finance costs (note 6(q)) (1,602,331) (1,784,338)Share of profit of associates accounted for using equity method
(note 6(f)) 84,560 81,770 Total non-operating income and expenses (1,629,981) (713,983)
Profit before tax 1,840,338 1,695,167 Income tax expenses (note 6(m)) 560,613 499,480 Profit 1,279,725 1,195,687 Other comprehensive income(notes 6(c), 6(m) and 6(n)):
Exchange differences on translation of foreign financial statements 33,420 (80,195)Unrealized gains (losses) on available-for-sale financial assets 40,838 (925,803)Cash flow hedges 12,737 (56,600)Actuarial losses on defined benefit plans (440,282) (584,771)Share of other comprehensive income of associates 1,485 (699)Income tax relating to components of other comprehensive income 72,462 106,967
Other comprehensive income, net of tax (279,340) (1,541,101)Comprehensive income $ 1,000,385 (345,414)
Profit attributable to:
Owners of parent $ 747,450 655,200 Non-controlling interests 532,275 540,487
$ 1,279,725 1,195,687 Comprehensive income attributable to:
Owners of parent $ 470,111 (826,131)Non-controlling interests 530,274 480,717
$ 1,000,385 (345,414) Basic earnings per share (in New Taiwan Dollars) (note 6(o)) $ 0.23 0.20 Diluted earnings per share (in New Taiwan Dollars) (note 6(o)) $ 0.23 0.20
74
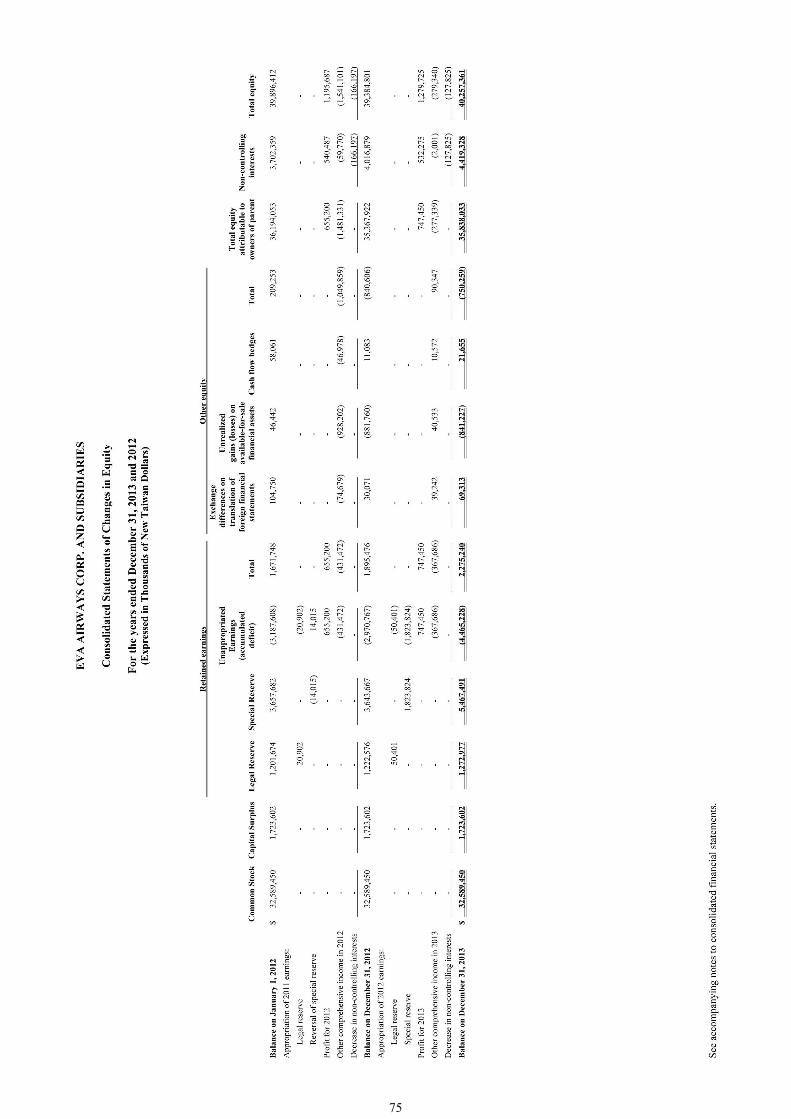
75

76
EVA AIRWAYS CORP. and Subsidiaries
Notes to Consolidated Financial Statements
December 31, 2013 and 2012
(Expressed in Thousands of New Taiwan Dollars Unless Otherwise Specified)
1. Organization and business scope
EVA Airways Corp. (the Company) was incorporated on April 7, 1989, as a corporation limited by shares under special permission of the Republic of China (R.O.C.) Ministry of Transportation and Communications. The address of the Company’s registered office is No. 376 Hsin-nan Road, Sec. 1, Luchu, Taoyuan county, Taiwan.
The business activities of the Company and its subsidiaries (together referred to as the Group and individually as Group entities) are 1.1 civil aviation transportation;
1.2 aircraft, engine, and parts of aircraft maintenance
1.3 ground service at airports
1.4 catering service
1.5 air cargo entrepot
2. Approval date and procedures of the financial statements
The consolidated financial statements were authorized for issuance by the Company’s Board of Directors as of March 25, 2014.
3. New standards and interpretations not yet adopted
(a) New standards and interpretations approved by the R.O.C. Financial Supervisory Commission
(“FSC”) but not yet in effect. International Accounting Standards Board (“IASB”) issued International Financial Reporting Standard 9 Financial instruments (“IFRS 9”), which takes effect as of January 1, 2013 (In December 2011, IASB postponed the effective date of IFRS 9 to January 1, 2015; however, in November 2013, IASB cancelled the announcement mentioned above to allow the preparation of financial statements to have sufficient time to be converted in to the new standard). This standard had been approved by the FSC; however, the effective date has not been announced. In accordance with the rules by the FSC, early adoption is not permitted, and companies shall follow the guidance in the 2009 version of International Accounting Standards 39 Financial instruments (“IAS 39”). Upon the adoption of this new standard, it is expected there will be significant impacts on the classification and measurement of financial instruments in the consolidated financial statements.
77

2
EVA AIRWAYS CORP.
Notes to Consolidated Financial Statements
(Continued)
(b) New standards and interpretations not yet approved by the FSC A summary of the new standards and amendments issued by the IASB not yet approved by the FSC that may have an impact on the consolidated financial statements:
Issue date New standards and
amendments Description and possible impacts Effective date
per IASB May 12, 2011 June 28, 2012
IFRS 10 Consolidated Financial Statements IFRS 11 Joint Arrangements IFRS 12 Disclosure of Interests in Other Entities Amended IAS 27 Separate Financial Statements Amended IAS 28 Investments in Associates and Joint Ventures
On May 12, 2011, the IASB issued a series of standards and amendments related to consolidation, joint arrangements, and investments.
The new standards provide a
single model in determining whether an entity has control over an investee (including special purpose entities). However, the original guidance and method apply to the consolidation process. In addition, joint arrangements are separated into joint operations (formerly known as jointly controlled assets and jointly controlled operations), and joint venture (formerly known as jointly controlled entities), and removal of the proportionate consolidation method.
On June 28, 2012, issuance of
amendments clarified the guidance over the transition period. Upon the adoption of the new standards and amendments, some of the determinations of the investees could be changed, which might increase the disclosure of the equity of subsidiaries and associates.
January 1, 2013
78

3
EVA AIRWAYS CORP.
Notes to Consolidated Financial Statements
(Continued)
Issue date New standards and
amendments Description and possible impacts Effective date
per IASB May 12, 2011 IFRS 13 Fair Value
Measurement Replaces fair value measurement guidance in other standards, and consolidates as one single guidance. Adoption of the new standard may have an impact on the measurement of certain assets and liabilities. In addition, this amendment might increase the disclosure of fair value.
January 1, 2013
June 16, 2011 Amended IAS 1 Presentation of Financial Statements
Items presented in other comprehensive income shall be based on whether they are potentially reclassifiable to profit or loss subsequently. Adoption of the amendment will change the presentation of other comprehensive income in the statement of comprehensive income.
July 1, 2012
June 16, 2011 Amended IAS 19 Employee Benefits
Eliminates the corridor method and eliminates the option to recognise changes in the net defined benefit liability (asset) in profit or loss; in addition, requires the immediate recognition of past service cost. Adoption of the amendment will change the presentation and the measurement of accrued pension liabilities and actuarial gains (losses) on defined benefit plans.
January 1, 2013
November 19, 2013
Amended IFRS 9 Financial Instruments
Adopts more principle-based regulation, including amending regulations governing the achievement, continuation and discontinuation of the adoption of hedge accounting so that hedge accounting is closer to risk management, and therefore, more exposures can meet the criteria of hedged items.
Not yet adopted(early adoption
is permitted)
79

4
EVA AIRWAYS CORP.
Notes to Consolidated Financial Statements
(Continued)
Issue date New standards and
amendments Description and possible impacts Effective date
per IASB
Adoption of the amendment may increase the transactions adopting hedge accounting and will change the measurement and presentation of related hedging instruments and hedged items.
May 28, 2010 Amended IFRS 9 Financial Instruments
Amendments of the new regulations related to classification and measurement of financial liabilities at fair value through profit or loss and include the regulations of IFRS 39 Financial Instrument.
Not yet adopted(early adoption
is permitted)
December16, 2011
Amended IFRS 7 Financial Instruments: Disclosures Amended IAS 32 Financial Instruments: Presentation
Amends regulations of offsetting financial assets and financial liabilities, which provide more guidance about judgments, and related disclosures.
January 1, 2014Presentation January 1, 2013Disclosure
December16, 2011
Amended IFRS 7 Financial Instruments: Disclosures Amended IFRS 9 Financial Instruments
Amends regulations of the mandatory effective date of adoption, which is postponed to January 1, 2015 from January 1, 2013, and transition disclosure. However, in November 2013 IASB cancelled the announcement mentioned above to allow the preparation of financial statements to have sufficient time to be converted in to the new standard. Adoption of the new standard may have an impact on the measurement of certain assets and liabilities. In addition, amendment might increase the disclosure of fair value.
Not yet adopted(early adoption
is permitted)
80

5
EVA AIRWAYS CORP.
Notes to Consolidated Financial Statements
(Continued)
4. Summary of significant accounting policies
The consolidated financial statements are the English translation of the Chinese version prepared and used in the R.O.C.. If there is any conflict between, or any difference in the interpretation of, the English and Chinese language financial statements, the Chinese version shall prevail.
The significant accounting policies have been applied consistently to all periods presented in these financial statements, except when otherwise indicated. These financial statements include the balance sheet as of January 1, 2012, prepared for the purpose of the first-year adoption of the Regulations Governing in the Preparation of Financial Reports by Securities Issuers and International Financial Reporting Standards, International Accounting Standards (IAS), IFRIC Interpretations, and Standard Interpretations Committee (SIC) Interpretations approved by the FSC (hereinafter referred to as the IFRSs, approved by the FSC).
The significant accounting policies presented in the consolidated financial statements are summarized as follows: (a) Statement of compliance
These consolidated financial statements have been prepared in accordance with the “Regulations Governing the Preparation of Financial Reports by Securities Issuers” (hereinafter referred to as the Regulations) and the IFRSs approved by the FSC. These are the Group’s first IFRS consolidated annual financial statements for the period covered by the first IFRSs (approved by the FSC) annual financial statements, and IFRS 1 First-time Adoption of International Financial Reporting Standards has been applied. An explanation of how the transition to IFRSs has affected the reported financial position, financial performance, and cash flows of the Group is provided in note 15.
(b) Basis of preparation
1. Basis of measurement
The consolidated financial statements have been prepared on a historical cost basis except for the following material items in the balance sheet:
(1) Financial instruments at fair value through profit or loss (included Derivative Financial
Instruments);
(2) Available-for-sale financial assets are measured at fair value;
(3) Hedging derivative financial instruments are measured at fair value; and
81

6
EVA AIRWAYS CORP.
Notes to Consolidated Financial Statements
(Continued)
(4) The defined benefit liability is recognized as unrecognized actuarial gain and the present
value of the defined benefit obligations less plan assets, plus unrecognized prior service cost and unrecognized actuarial loss.
2. Functional and presentation currency
The functional currency of the Group entities is determined based on the primary economic environment in which the entities operates. The consolidated financial statements are presented in New Taiwan Dollar (NTD), which is the Company’s functional currency. All financial information presented in NTD has been rounded to the nearest thousand.
(c) Basis of consolidation
1. Principle of preparation of the consolidated financial statements
The consolidated financial statements comprise the Company and its subsidiaries. The financial statements of subsidiaries are included in consolidated financial statements from the date that control commences until the date that control ceases. Profits or losses applicable to the non-controlling interests in a subsidiary are allocated to the non-controlling interests even if doing so causes the non-controlling interests to have a deficit balance. Intra-group balances and transactions, and any unrealized income and expenses arising from intra-group transactions are eliminated in preparing the consolidated financial statements.
2. List of subsidiaries in the consolidated financial statements
Shareholding
Name of Investor
Name of Investee
Principal activity
2013.12.31
2012.12.31
2012.1.1
Note
The Company Evergreen Aviation Technologies Corp.
Aircraft, engine, and parts of aircraft maintenance
80.00% 80.00% 80.00% -
The Company Evergreen Airline Services Corp. Ground service at airport
56.33% 56.33% 56.33% -
The Company Evergreen Sky Catering Corp. Catering service 49.80% 49.80% 49.80% Note 1
The Company Evergreen Air Cargo Services Corp.
Air cargo entrepot
60.00% 60.00% 60.00% -
The Company Green Siam Air Services Co., Ltd. Traveling agency 49.00% 49.00% 49.00% Note 1
The Company RTW Air Services (S) Pte. Ltd. Traveling agency 49.00% 49.00% 49.00% Note 1
82
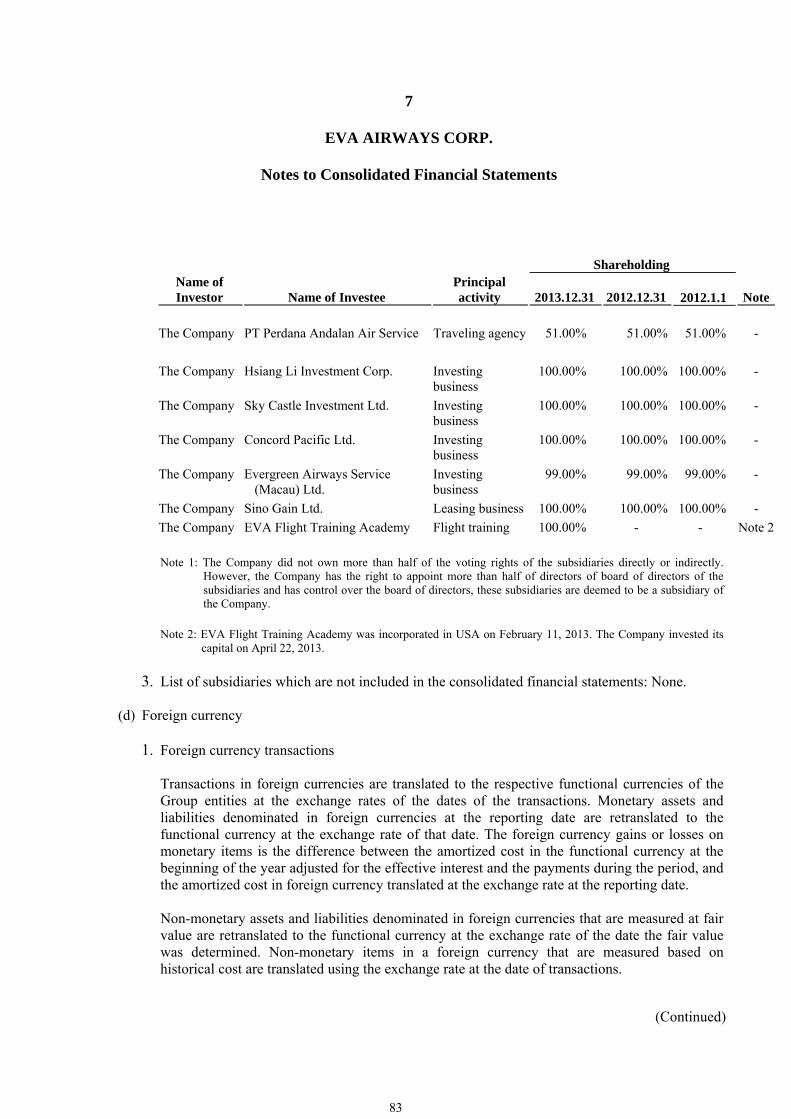
7
EVA AIRWAYS CORP.
Notes to Consolidated Financial Statements
(Continued)
Shareholding Name of Investor
Name of Investee
Principal activity
2013.12.31
2012.12.31
2012.1.1
Note
The Company PT Perdana Andalan Air Service Traveling agency 51.00% 51.00% 51.00% -
The Company Hsiang Li Investment Corp. Investing business
100.00% 100.00% 100.00% -
The Company Sky Castle Investment Ltd. Investing business
100.00% 100.00% 100.00% -
The Company Concord Pacific Ltd. Investing business
100.00% 100.00% 100.00% -
The Company Evergreen Airways Service (Macau) Ltd.
Investing business
99.00% 99.00% 99.00% -
The Company Sino Gain Ltd. Leasing business 100.00% 100.00% 100.00% -
The Company EVA Flight Training Academy Flight training 100.00% - - Note 2
Note 1: The Company did not own more than half of the voting rights of the subsidiaries directly or indirectly.
However, the Company has the right to appoint more than half of directors of board of directors of the subsidiaries and has control over the board of directors, these subsidiaries are deemed to be a subsidiary of the Company.
Note 2: EVA Flight Training Academy was incorporated in USA on February 11, 2013. The Company invested its
capital on April 22, 2013.
3. List of subsidiaries which are not included in the consolidated financial statements: None.
(d) Foreign currency
1. Foreign currency transactions
Transactions in foreign currencies are translated to the respective functional currencies of the Group entities at the exchange rates of the dates of the transactions. Monetary assets and liabilities denominated in foreign currencies at the reporting date are retranslated to the functional currency at the exchange rate of that date. The foreign currency gains or losses on monetary items is the difference between the amortized cost in the functional currency at the beginning of the year adjusted for the effective interest and the payments during the period, and the amortized cost in foreign currency translated at the exchange rate at the reporting date.
Non-monetary assets and liabilities denominated in foreign currencies that are measured at fair value are retranslated to the functional currency at the exchange rate of the date the fair value was determined. Non-monetary items in a foreign currency that are measured based on historical cost are translated using the exchange rate at the date of transactions.
83

8
EVA AIRWAYS CORP.
Notes to Consolidated Financial Statements
(Continued)
Foreign currency differences arising from retranslation are recognized in profit or loss, except for the following differences which are recognized in other comprehensive income that arise from the retranslation:
available-for-sale equity investment; financial liability designated as a hedge of the net investment in a foreign operation to the
extent that the hedge is effective; or qualifying cash flow hedges to the extent the hedge is effective.
2. Foreign operations
The assets and liabilities of foreign operations, including goodwill and fair value adjustments arising on acquisition, are translated to the Group’s functional currency at the exchange rates of the reporting date. The income and expenses of foreign operations, excluding foreign operations in hyperinflationary economies, are translated to the Group’s functional currency at average rate. Foreign currency differences are recognized in other comprehensive income.
When a foreign operation is disposed of such that control, significant influence or joint control is lost, the cumulative amount in the translation reserve related to that foreign operation is reclassified to profit or loss as part of the gain or loss on disposal. When the Company disposes of any part of its interest in a subsidiary that includes a foreign operation while retaining control, the relevant proportion of the cumulative amount is reattributed to non-controlling interest. When the Group disposes of only part of investment in an associate of joint venture that includes a foreign operation while retaining significant or joint control, the relevant proportion of the cumulative amount is reclassified to profit or loss. When the settlement of a monetary item receivable from or payable to a foreign operation is neither planned nor likely predicted in the foreseeable future, the foreign currency gains and losses arising from such items are considered as a part of investment in the foreign operation and are recognized in other comprehensive income.
(e) Classification of current and non-current assets and liabilities
The Group classifies an asset as current when: (i) It expects to realize the asset, or intends to sell or consume it, in its normal operating cycle; (ii) It holds the asset primarily for the purpose of trading; (iii) It expects to realize the asset within twelve months after the reporting period; or (iv) The asset is cash or a cash equivalent unless the asset is restricted from being exchanged or
used to settle a liability for at least twelve months after the reporting period. The Group classifies all other assets as non-current.
84

9
EVA AIRWAYS CORP.
Notes to Consolidated Financial Statements
(Continued)
The Group classifies a liability as current when: (i) It expects to settle the liability in its normal operating cycle; (ii) It holds the liability primarily for the purpose of trading; (iii) The liability is due to be settled within twelve months after the reporting period; or (iv) It does not have an unconditional right to defer settlement of the liability for at least twelve
months after the reporting period. Terms of a liability that could, at the option of the counterparty, result in its settlement by the issuance of equity instruments that do not affect its classification.
The Group classifies all other liabilities as non-current.
(f) Cash and cash equivalents
Cash and cash equivalents comprise cash, demand deposits, and call deposits that are subject to an insignificant risk of changes in their fair value, and are used by the Group in the management of its short-term commitments. Time deposits with maturities of one year or less from the acquisition date that are held for the purpose of meeting short-term cash commitments rather than for investment or other purposes, and that are subject to an insignificant risk of changes in their fair value are recognized as cash and cash equivalents.
(g) Financial instruments
Financial assets and financial liabilities are initially recognized when the Group becomes a party to the contractual provisions of the instruments.
1. Financial assets
The Group classifies assets as follows: financial assets at fair value through profit or loss, loans and receivables and available-for-sale financial assets. A regular purchase or sale of financial assets shall be recognized and derecognized, as applicable, using trade-date accounting. a. Financial assets at fair value through profit or loss
These financial assets were acquired for the purpose of trading or designated as financial assets at fair value though profit or loss.
85

10
EVA AIRWAYS CORP.
Notes to Consolidated Financial Statements
(Continued)
A financial asset is classified in this category if acquired principally for the purpose of selling or repurchasing in the short term. This type of financial asset is measured at fair value at the time of initial recognition, and attributable transaction costs are recognized in profit or loss as incurred. Subsequent to initial recognition, financial assets at fair value through profit or loss are measured at fair value, and changes therein, which take into account any dividend and interest income, are recognized in profit or loss and are included in other income, other gains and losses under non-operating income and expenses.
b. Loans and receivables
Loans and receivables are financial assets with fixed or determinable payments that are not quoted in an active market. Loans and receivables comprise trade receivables and other receivables. Such assets are recognized initially at fair value plus any directly attributable transaction costs. Subsequent to initial recognition, loans and receivables other than insignificant interest on short-term receivables are measured at amortized cost using the effective interest method, less any impairment losses. Interest income is recognized in profit or loss, and is included in other income under non-operating income and expenses.
c. Available-for sale financial assets
Available-for-sale financial assets are non-derivative financial assets that are designated as available-for-sale or are not classified in any of the other categories of financial assets. Available-for-sale financial assets are recognized initially at fair value plus any directly attributable transaction cost. Subsequent to initial recognition, they are measured at fair value and changes therein are recognized in other comprehensive income and are presented in the fair value reserve in equity, other than impairment losses, interest income calculated using the effective interest method, dividend income, and foreign currency differences on available-for-sale monetary items are recognized in profit or loss, dividends on available-for-sale securities are recognized as other income under non-operating income and expenses when the Group is authorized to receive, normally on the ex-dividend date.
d. Impairment of financial assets
A financial asset is impaired if, and only if, there is any objective evidence of impairment as a result of one or more events that occurred after the initial recognition of the asset and that loss event has an impact on the estimated future cash flows of the financial assets that can be estimated reliably.
Objective evidence that financial assets are impaired includes default or delinquency by a debtor, restructuring of an amount due to the Group on terms that the Group would not consider otherwise, indications that a debtor or issuer will enter bankruptcy, adverse changes in the payment status of borrowers or issuers, economic conditions that correlate with defaults, or the disappearance of an active market for a security.
86

11
EVA AIRWAYS CORP.
Notes to Consolidated Financial Statements
(Continued)
All individually significant financial assets found not to be specifically impaired are then collectively assessed for any impairment that has been incurred but not yet identified. Objective evidence that the collection of financial assets are impaired includes the Group’s experience of collections, the increasing payment terms of the collection over the average term, and economic conditions that correlate with defaults.
The evidence of impairment for financial assets measured at amortized cost is considered at both an individual and collective level. All individually significant financial assets are assessed for specific impairment. The financial assets, which were assessed individually for any impairment and the impairment was recognized or being recognized, were not collectively assessed for impairment by grouping together. If, in a subsequent period, the amount of the impairment loss of a financial asset measured at amortized cost decreases and the decrease can be related objectively to an event occurring after the impairment was recognized, the decrease in impairment loss is reversed through profit or loss to the extent that the carrying value of the asset does not exceed its amortized cost before impairment was recognized at the reversal date.
For an investment in an equity security, a significant or prolonged decline in its fair value below its cost is accounted for as objective evidence of impairment. Impairment losses on available-for-sale financial assets are recognized by reclassifying the accumulated losses in the fair value reserve in equity to profit or loss. Impairment losses recognized on an available-for-sale equity security are not reversed through profit or loss. Any subsequent recovery in the fair value of an impaired available-for-sale equity security is recognized in other comprehensive income, and accumulated in other equity. If, in a subsequent period, the fair value of an impaired available-for-sale debt security increases and the increase can be related objectively to an event occurring after the impairment loss was recognized, then the impairment loss is reversed, with the amount of the reversal recognized in profit or loss.
An impairment loss in respect of a financial asset is reduced from the carrying amount except for trade receivables, for which an impairment loss is reflected in an allowance account against the receivables. When it is determined a receivable is uncollectible, it is written off from the allowance account. Any subsequent recovery of a receivable written off is recorded in the allowance account. Changes in the amount of the allowance account are recognized in profit or loss.
Impairment losses and recoveries of financial assets are recognized in profit or loss, which are included in other gains and losses under non-operating income and expenses.
87

12
EVA AIRWAYS CORP.
Notes to Consolidated Financial Statements
(Continued)
e. Derecognition of financial assets
The Group derecognizes financial assets when the contractual rights of the cash inflow from the asset are terminated, or when the Group transfers substantially all the risks and rewards of ownership of the financial assets.
On derecognition of a financial asset in its entirety, the difference between the carrying amount and the sum of the consideration received or receivable and any cumulative gain or loss that had been recognized in other comprehensive income and presented in other equity – unrealized gains or losses on available-for-sale financial assets is recognized in profit or loss, and is included in other gains and losses under non-operating income and expenses.
The Group separates the part that continues to be recognized and the part that is derecognized based on the relative fair values of those parts on the date of the transfer. The difference between the carrying amount allocated to the part derecognized and the sum of the consideration received for the part derecognized and any cumulative gain or loss allocated to it that had been recognized in other comprehensive income shall be recognized in profit or loss, and is included in other gains and losses under non-operating income and expenses. A cumulative gain or loss that had been recognized in other comprehensive income is allocated between the part that continues to be recognized and the part that is derecognized, based on the relative fair values of those parts.
2. Financial liabilities
a. Financial liabilities at fair value through profit or loss
These financial liabilities were acquired for the purpose of trading or designated as financial liabilities at fair value through profit or loss. This type of financial liability is measured at fair value at the time of initial recognition, and attributable transaction costs are recognized in profit or loss as incurred. Subsequent to initial recognition financial liabilities at fair value through profit or loss are measured at fair value, and changes therein, which take into account, are recognized in profit or loss, and are included in other gains and losses under non-operating income and expenses.
b. Other financial liabilities
Financial liabilities not classified as held-for-trading or designated as at fair value through profit or loss, which comprise short-term and long-term borrowings, and trade payables and other payables, shall be measured at fair value plus any directly attributable transaction cost at the time of initial recognition. Subsequent to initial recognition, they are measured at amortized cost calculated using the effective interest method. Interest expense not
88
13
EVA AIRWAYS CORP.
Notes to Consolidated Financial Statements
(Continued)
capitalized as capital cost is recognized in profit or loss, and is included in finance costs under non-operating income and expenses.
c. Derecognition of financial liabilities The Group derecognizes a financial liability when its contractual obligation has been discharged or cancelled or has expired. The difference between the carrying amount of a financial liability removed and the consideration paid (including any non-cash assets transferred or liabilities assumed) is recognized in profit or loss, and is included in other gains and losses under non-operating income and expenses.
d. Offsetting of financial assets and liabilities
The Group presents financial assets and liabilities on a net basis when the Group has the legally enforceable rights to offset and intends to settle such financial assets and liabilities on a net basis or to realize the assets and settle the liabilities simultaneously.
3. Derivative financial instrument and hedge accounting
Derivatives are used to hedge the risks associated with changes in foreign currency rates, interest rates and fuel prices. They are recognized initially (trade date), and are subsequently re-measured at fair value. The transaction costs are recognized in profit or loss. Method of recognizing fair value gains and losses on derivative financial instruments depends on the nature of the hedging relationship. All derivatives are presented as assets when their fair value is positive and as liabilities when their fair value is negative.
The documentation at inception of each hedging relationship sets out purpose and strategy of risk management. To qualify for hedge accounting at the inception of the hedge throughout its life, each hedge must be kept in records if it is highly effective in offsetting the changes (which arise from risks to be managed) in fair value or cash flow of the hedged items on an ongoing basis.
Hedging transactions fall into two categories:
a. Fair value hedges
Changes in the fair value of derivatives that are designated and qualify as fair value hedges are recognized in profit or loss, together with changes in the fair value of the asset or liability or group, thereof, that are attributable to the hedged risk, and are both presented under hedged items in the statement of comprehensive income as well.
89

14
EVA AIRWAYS CORP.
Notes to Consolidated Financial Statements
(Continued)
If the hedging instrument no longer meets the criteria for hedge accounting, expires, is sold, terminated, exercised or its designation is revoked, then hedge accounting is discontinued prospectively. Under effective interest method, adjustments made for fair value of hedged items (which arises from risk to be managed) are amortized as profit or loss once the hedge accounting is discontinued. The amortization is based on the effective interest rate that is recalculated at the inception of amortization so that the adjustment in fair value will be fully amortized at maturity date.
b. Cash flow hedges
The effective portion of changes in the fair value of derivatives that are designated and qualify as cash flow hedges is recognized in other comprehensive income and accumulated in other equity the effective portion of gains and losses from changes in fair value of cash flow hedges. Any gain or loss relating to an ineffective portion is recognized immediately under non-operating income and expenses in the statement of comprehensive income.
When a hedged item is recognized in profit or loss, the amount accumulated in equity and retained in other comprehensive income is reclassified to profit or loss in the same period or periods during which the hedged item affects profit or loss, and it is presented in the same accounting caption with the hedged item recognized in the consolidated statement of comprehensive income. However, when a forecast transaction that is hedged results in the recognition of a non-financial asset or a non-financial liability, the gains and losses previously deferred in equity are transferred from equity and are included in the initial measurement of the cost of the asset or liability.
(h) Inventories
Inventories are measured at the lower of cost and net realizable value. The cost of inventories is based on the weighted-average method, and includes expenditure incurred in acquiring the inventories, production or conversion costs, and other costs incurred in bringing them to their existing location and condition.
Net realizable value is the estimated selling price in the ordinary course of business, less the estimated costs of completion and selling expenses.
(i) Investment in associates Associates are those entities in which the Group has significant influence, but not control, over the financial and operating policies. Significant influence is presumed to exist when the Group holds between 20% and 50% of the voting power of another entity.
90

15
EVA AIRWAYS CORP.
Notes to Consolidated Financial Statements
(Continued)
Investments in associates are accounted for using the equity method and are recognized initially at cost. The cost of the investment includes transaction costs. The carrying amount of the investment in associates includes goodwill arising from the acquisition less any accumulated impairment losses.
The financial statements include the Group’s share of the profit or loss and other comprehensive income of equity-accounted investees, after adjustments to align the accounting policies with those of the Group, from the date that significant influence commences until the date that significant influence ceases. Unrealized profits resulting from transactions between the Group and an associate are eliminated to the extent of the Group’s interest in the associate. Unrealized losses on transactions with an associate are eliminated in the same way, except to the extent that the underlying asset is impaired. When the Group’s share of losses exceeds its interest in an associate, the carrying amount of the investment, including any long-term interests that form part thereof, is reduced to zero, and the recognition of further losses is discontinued except to the extent that the Group has an obligation or has made payments on behalf of the investee.
(j) Property, plant and equipment
1. Recognition and measurement
Items of property, plant and equipment are measured at cost less accumulated depreciation and accumulated impairment losses. Cost includes expenditure that is directly attributed to the acquisition of the asset. Cost also includes transfers from equity of any gain or loss on qualifying cash flow hedges of foreign currency purchases of property, plant and equipment.
Each part of an item of property, plant and equipment with a cost that is significant in relation to the total cost of the item shall be depreciated separately, unless the useful life and the depreciation method of the significant part of an item of property, plant and equipment are the same as the useful life and depreciation method of another significant part of that same item. The gain or loss arising from the disposal of an item of property, plant and equipment shall be determined as the difference between the net disposal proceeds, if any, and the carrying amount of the item, and it shall be recognized as other gains and losses.
91

16
EVA AIRWAYS CORP.
Notes to Consolidated Financial Statements
(Continued)
2. Major inspection and overhaul cost:
Major inspection and overhaul expenditures of self-owned and finance leased aircrafts are capitalized as costs of aircrafts and leased assets by components, and are depreciated using the straight-line method over the estimated useful life of the overhaul. Costs of designated inspections to be performed at the end of the lease term of operating leased aircrafts are estimated and depreciated using the straight-line method over the lease term.
3. Subsequent cost
Subsequent expenditure is capitalized only when it is probable that the future economic benefits associated with the expenditure will flow to the Group. The carrying amount of those parts that are replaced is derecognized. Ongoing repairs and maintenance are expensed as incurred.
4. Depreciation
The depreciable amount of an asset is determined after deducting its residual value, and it shall be allocated on a systematic basis over the asset’s useful life. Items of property, plant and equipment with the same useful life may be grouped in determining the depreciation charge. The remainder of the items may be depreciated separately. The depreciation charge for each period shall be recognized in profit or loss. The estimated useful lives are as follows: (1) Buildings and structures: 5 to 55 years (2) Machinery and equipment: 2 to 18 years (3) Aircraft: 5 to 18 years (4) Leased assets are depreciated over the shorter of the lease term or the estimated useful live.
Depreciation methods, useful lives, and residual values are reviewed at each fiscal year-end date. If expectations differ from the previous estimates, the change is accounted for as a change in an accounting estimate.
(k) Leases Leases in which the Group assumes substantially all of the risks and rewards of ownership are classified as finance leases. On initial recognition, the leased asset is measured at an amount equal to the lower of its fair value or the present value of the minimum lease payments. Subsequent to initial recognition, the asset is accounted for in accordance with the accounting policy applicable to the asset. Minimum lease payments made under finance leases are apportioned between the finance expense and the reduction of the outstanding liability. The finance expense is allocated to each period
92

17
EVA AIRWAYS CORP.
Notes to Consolidated Financial Statements
(Continued)
during the lease term so as to produce a constant periodic rate of interest on the remaining balance of the liability. Other leases are operating leases and are not recognized in the Group’s balance sheets. Payments made under an operating lease, excluding insurance and maintenance expenses, are recognized expenses over the term of the lease. Recognition of income arising from sale and leaseback transaction depends upon the type of lease involved. If a sale and leaseback transaction results in a finance lease, any excess of sales proceeds over the carrying amount is deferred and amortized over the lease term. If a sale and leaseback transaction results in an operating lease, and the sales price is at or below fair value, any profit or loss shall be recognized immediately except that, if the loss is compensated for by future lease payments at below market price, it is deferred and amortized in proportion to the lease payments over the period for which the asset is expected to be used. If the sales price is above fair value, the excess over fair value is deferred and amortized over the period for which the asset is expected to be used.
(l) Impairment of non-financial assets
The Group measures whether impairment occurred in non-financial assets (except for inventories and deferred tax assets), at the end of each reporting period, and estimates their recoverable amount. If it is not possible to determine the recoverable amount (fair value less costs to sell and value in use) for an individual asset, then the Group will have to determine the recoverable amount for the asset’s cash-generating unit. The recoverable amount for an individual asset or a cash-generating unit is the higher of its fair value less costs to sell and its value in use. If, and only if, the recoverable amount of an asset is less than its carrying amount, the carrying amount of the asset shall be reduced to its recoverable amount. That reduction is an impairment loss. An impairment loss shall be recognized immediately in profit or loss.
The Group should assess at the end of each reporting period whether there is any indication that an impairment loss recognized in prior periods for an asset other than goodwill may no longer exist or may have decreased. If any such indication exists, the entity shall estimate the recoverable amount of that asset. An impairment loss recognized in prior periods for an asset other than goodwill shall be reversed if, and only if, there has been a change in the estimates used to determine the asset’s recoverable amount since the last impairment loss was recognized. If this is the case, the carrying amount of the asset shall be increased to its recoverable amount. That increase is a reversal of previously recognized impairment loss. An impairment loss is reversed only to the extent that the asset’s carrying amount does not exceed the carrying amount net of depreciation or amortization that would have been determined if no impairment loss had been recognized.
93

18
EVA AIRWAYS CORP.
Notes to Consolidated Financial Statements
(Continued)
Notwithstanding whether indicators exist, recoverability of goodwill and intangible assets with indefinite useful lives or those not yet in use is required to be tested at least annually. Impairment loss is recognized if the recoverable amount is less than the carrying amount. For the purpose of impairment testing, goodwill acquired in a business combination shall, from the acquisition date, be allocated to each of the Group’s cash-generating units or groups of cash-generating units, that are expected to benefit from the synergies of the combination, irrespective of whether other assets or liabilities of the acquiree are assigned to those units or groups of units. If the carrying amount of the cash-generating unit exceeds the recoverable amount of the unit, the Group recognizes the impairment loss, and the impairment loss shall be allocated to reduce the carrying amount of each asset in the unit. Reversal of an impairment loss for goodwill is prohibited.
(m) Intangible assets
The Group entered into contracts with the government to provide public service in infrastructure. The Group is obliged to construct the public sector asset and provide operation service for 30 years since the public sector asset was contracted. At the end of the operating period, the public sector asset should be returned to the government for no incremental consideration. Based on the IFRIC 12 Service Concession Arrangements, the Group allocates the consideration received by reference to the relative fair values of the construction and operation services delivered. Subsequently, the Group recognizes and measures revenue in accordance with IAS 11 Construction Contacts and IAS 18 Revenue. The fair value of the services is determined as intangible assets or financial assets, by the nature of the consideration given by the grantor to the operator and by reference to the contract terms. Intangible assets that are acquired by the Group are measured at cost less accumulated amortization and any accumulated impairment losses. Subsequent expenditure is capitalized only when it increases the future economic benefits embodied in the specific asset to which it relates. The amortization amount is the cost of an asset less its residual value. Amortization is recognized in profit or loss on a straight-line basis over the estimated useful lives of intangible assets, other than goodwill and intangible assets with indefinite useful lives, from the date that they are available for use. The estimated useful lives were as follows: 1. Operating concession: 30 years 2. Computer software: 3 to 5 years
94

19
EVA AIRWAYS CORP.
Notes to Consolidated Financial Statements
(Continued)
(n) Revenue recognition
1. Aviation transportation revenue
Ticket sales for passengers and cargo are recorded as unearned revenue. They are included in current liabilities, and recognized as revenue when service is provided.
2. Customer loyalty program The Group has a customer loyalty program, whereby, customers are awarded rights of accumulating mileages during their flights, and the fair value of the consideration received or receivable in respect of initial sale is allocated between the rights of accumulated mileages and the other components of the sale. The amount allocated to rights of accumulated mileages is estimated by the fair value of the redeemable part of the customer loyalty program and by reference to past experience of probability of redemption. Thus, the corresponding fair value is estimated and deferred, and service revenues will not be recognized until the rights have been redeemed and obligations are fulfilled. Also, unearned revenues will be converted into revenues when it is expected that the rights are probable not to be redeemed.
3. Services
Revenue from services rendered is recognized in profit or loss in proportion to the stage of completion of the transaction at the reporting date. The Group determines the stage of completion of a transaction in terms of services performed as a percentage of total services to be performed.
(o) Employee benefits
1. Defined contribution plans
Obligations for contributions to defined contribution pension plans are recognized as an employee benefit expense in profit or loss in the periods during which services are rendered by employees.
2. Defined benefit plans
A defined benefit plan is a post-employment benefit plan other than a defined contribution plan. The Group’s net obligation in respect of the defined benefit pension plans is calculated separately for each plan by estimating the amount of future benefit that employees have earned in return for their service in the current and prior periods; that benefit is discounted to determine its present value. Any unrecognized past service costs and the fair value of any plan assets are deducted. The discount rate is the yield at the reporting date on market yields of government
95
20
EVA AIRWAYS CORP.
Notes to Consolidated Financial Statements
(Continued)
bonds that have maturity dates approximating the terms of the Group’s obligations and that are denominated in the same currency in which the benefits are expected to be paid. The calculation is performed annually by a qualified actuary using the projected unit credit method. When the calculation results in a benefit to the Group, the recognized asset is limited to the total of any unrecognized past service costs and also the present value of economic benefits available in the form of any future refunds from the plan or reductions in future contributions to the plan. In order to calculate the present value of economic benefits, consideration is given to any minimum funding requirements that apply to any plan in the Group. An economic benefit is available to the Group if it is realizable during the life of the plan, or on settlement of the plan liabilities. When the benefits of a plan are improved, the portion of the increased benefit relating to past service by employees is recognized in profit or loss on a straight-line basis over the average period until the benefits become vested. To the extent that the benefits vest immediately, the expense is recognized immediately in profit or loss. All actuarial gains and losses as of January 1, 2012, the date of transition to the IFRSs approved by the FSC, were recognized in retained earnings. The Group recognized all actuarial gains and losses arising subsequently from the defined benefit plans in other comprehensive income, which was then transferred to retained earnings immediately. The Group recognizes gains or losses on the curtailment or settlement of a defined benefit plan when the curtailment or settlement occurs. The gain or loss on curtailment or settlement comprises any resulting change in the fair value of plan assets, any change in the present value of the defined benefit obligation, and any related actuarial gains or losses and past service cost that had not previously been recognized.
3. Short-term employee benefits Short-term employee benefit obligations are accrued when the Group has a present legal or constructive obligation to pay this amount as a result of past service provided by the employee. A liability is recognized when the obligation can be estimated reliably.
(p) Income taxes Income tax expenses include both current taxes and deferred taxes. Except for expenses related to business combinations or recognized directly in equity or other comprehensive income, all current and deferred taxes shall be recognized in profit or loss. Current taxes include tax payables and tax deduction receivables on taxable gains (losses) for the year calculated using the statutory tax rate on the reporting date or the actual legislative tax rate, as well as tax adjustments related to prior years.
96

21
EVA AIRWAYS CORP.
Notes to Consolidated Financial Statements
(Continued)
Deferred taxes arise due to temporary differences between the carrying amounts of assets and liabilities for financial reporting purposes and their respective tax bases. Deferred taxes shall not be recognized for the exceptions below: 1. Assets and liabilities that are initially recognized but are not related to a business combination
and have no effect on net income or taxable gains (losses) during the transaction.
2. Temporary differences arising from equity investments in subsidiaries or joint ventures where there is a high probability that such temporary differences will not reverse.
3. Initial recognition of goodwill.
Deferred tax assets and liabilities shall be measured at the tax rates that are expected to apply to the period when the asset is realized or the liability is settled, based on tax rates that have been enacted or substantively enacted by the end of the reporting period.
Deferred tax assets and liabilities may be offset against each other if the following criteria are met:
1. The Group has the legal right to settle tax assets and liabilities on a net basis; and
2. the taxing of deferred tax assets and liabilities fulfills one of the scenarios below:
(1) levied by the same taxing authority; or
(2) levied by different taxing authorities, but where each such authority intends to settle tax
assets and liabilities (where such amounts are significant) on a net basis every year of the period of expected asset realization or debt liquidation, or where the timing of asset realization and debt liquidation is matched.
A deferred tax asset should be recognized for the carry forward of unused tax losses, unused tax credits, and deductible temporary differences to the extent that it is probable that future taxable profit will be available against which the unused tax losses, unused tax credits, and deductible temporary differences can be utilized. Such unused tax losses, unused tax credits, and deductible temporary differences shall also be re-evaluated on the financial reporting date, and adjusted based on the probability that future taxable profit will be available against which the unused tax losses, unused tax credits, and deductible temporary differences can be utilized.
97
22
EVA AIRWAYS CORP.
Notes to Consolidated Financial Statements
(Continued)
(q) Earnings per share (EPS)
The Group discloses the Company’s basic and diluted earnings per share attributable to ordinary equity holders of the Company. The calculation of basic earnings per share is based on the profit or loss attributable to the ordinary equity holders of the Company divided by the weighted-average number of ordinary shares outstanding. The calculation of diluted earnings per share is based on the profit or loss attributable to ordinary equity holders of the Company, divided by the weighted-average number of ordinary shares outstanding after adjustment for the effects of all dilutive potential ordinary shares.
(r) Operating segment
An operating segment is a component of the Group that engages in business activities from which it may earn revenues and incur expenses (including revenues and expenses relating to transactions with other components of the Group). Operating results of the operating segment are regularly reviewed by the Group’s chief operating decision maker to make decisions about resources to be allocated to the segment and to assess its performance. Each operating segment is a component of an entity for which discrete financial information is available.
5. Major sources of accounting assumptions, judgments and estimation uncertainty
The preparation of the consolidated financial statements based on the Regulations requires management to make judgments, estimates and assumptions that affect the application of the accounting policies and the reported amount of assets, liabilities, income and expenses. Actual results may differ from these estimates. Management continues to monitor the accounting assumptions, estimates and judgments. Management recognizes any changes in the accounting estimates during the period and the impact of the changes in the accounting estimates in the next year. Information about critical judgments in applying accounting policies that have the most significant effect on amounts recognized in the financial statements is included in the following notes: Note 6(g), classification of lease Information about assumptions and estimation uncertainties that have a significant risk of resulting in a material adjustment within the next year is included in the following note: (a) Note 6(e), valuation of inventories (b) Note 6(m), realization of deferred tax assets
98

23
EVA AIRWAYS CORP.
Notes to Consolidated Financial Statements
(Continued)
6. Significant account disclosures
(a) Cash and cash equivalents
2013.12.31 2012.12.31 2012.1.1 Cash on hand $ 92,314 102,954 99,630Cash in bank 23,742,147 20,960,038 16,536,036Short-term notes 1,063,711 1,020,338 834,653 $ 24,898,172 22,083,330 17,470,319
Refer to note 6(r) for the interest rate risk and fair value sensitivity analysis of the financial assets and liabilities of the Group.
(b) Financial instruments
1. Financial assets at fair value through profit or loss-current:
2013.12.31 2012.12.31 2012.1.1 Money market funds $ 1,192 260,289 885
2. Available-for-sale financial assets-current :
2013.12.31 2012.12.31 2012.1.1 Money market funds $ 2,059,740 2,180,986 2,551,236
3. Available-for-sale financial assets-non-current :
2013.12.31 2012.12.31 2012.1.1 Non-publicly traded stocks $ 2,255,793 2,575,661 3,958,318Publicly traded stocks 789,046 689,494 588,668U.S. Treasury notes 89,274 100,070 121,090 $ 3,134,113 3,365,225 4,668,076
In 2013 and 2012, the Group recognized the impairment losses of $289,866 and $289,350, respectively, in other gains or losses, due to the permanent decrease in value of the investment in securities of foreign company.
99

24
EVA AIRWAYS CORP.
Notes to Consolidated Financial Statements
(Continued)
The exposure to credit risk, currency risk and interest rate risk arising from financial instrument is disclosed in note 6(r). As of December 31, 2013 and 2012, and January 1, 2012, the pledge for Group’s financial assets is disclosed in note 8.
4. Sensitivity analysis-price risk of equity securities:
If the price of the equity securities changes, and it is on the same basis for both years and assumes that all other variables remain the same, the impact on other comprehensive income will be as follows:
2013 2012 Price of the equity securities at the reporting date
Other Comprehensive Income, net of tax
Profit (losses)
Other Comprehensive Income, net of tax
Profit (losses)
increase 5% $ 259.227 50 276,856 10,802 decrease 5% $ (259.227) (50) (276,856) (10,802)
Information about material foreign currency investment on equity security at the reporting date was as follows:
2013.12.31 2012.12.31 2012.1.1 Foreign
currency Exchange
rate NTD
Foreign currency
Exchange rate
NTD
Foreign currency
Exchange rate
NTD
USD $ 1,990 29.805 $ 59,313 1,994 29.04 57,905 1,518 30.28 45,941
CNY - - - 90,635 4.66 422,361 328,000 4.81 1,524,200
$ 59,313 480,266 1,570,141
(c) Hedging derivative financial instruments
The Group needs fuel for operating. However, cash flow risk will occur if the future cash flows for fuel fluctuate due to the floating market prices. The Group evaluates the risk as significant, and thus, hedges the risk by signing swap agreements. As of December 31, 2013 and 2012, and January 1, 2012, the cash flow hedged items and derivative financial hedging instruments were as follows:
Hedged item
Hedging Instrument
Fair value of assigned hedging instrument Period when cash flows
are expected to occur
Period when
profit or loss is affected
Account
2013.12.31
2012.12.31
2012.1.1
Floating price of fuel
Fuel swap agreement
$ 26,090 13,353 69,953 2013~2014 2013~2014 Derivative financial assets for hedge purposes-current
100
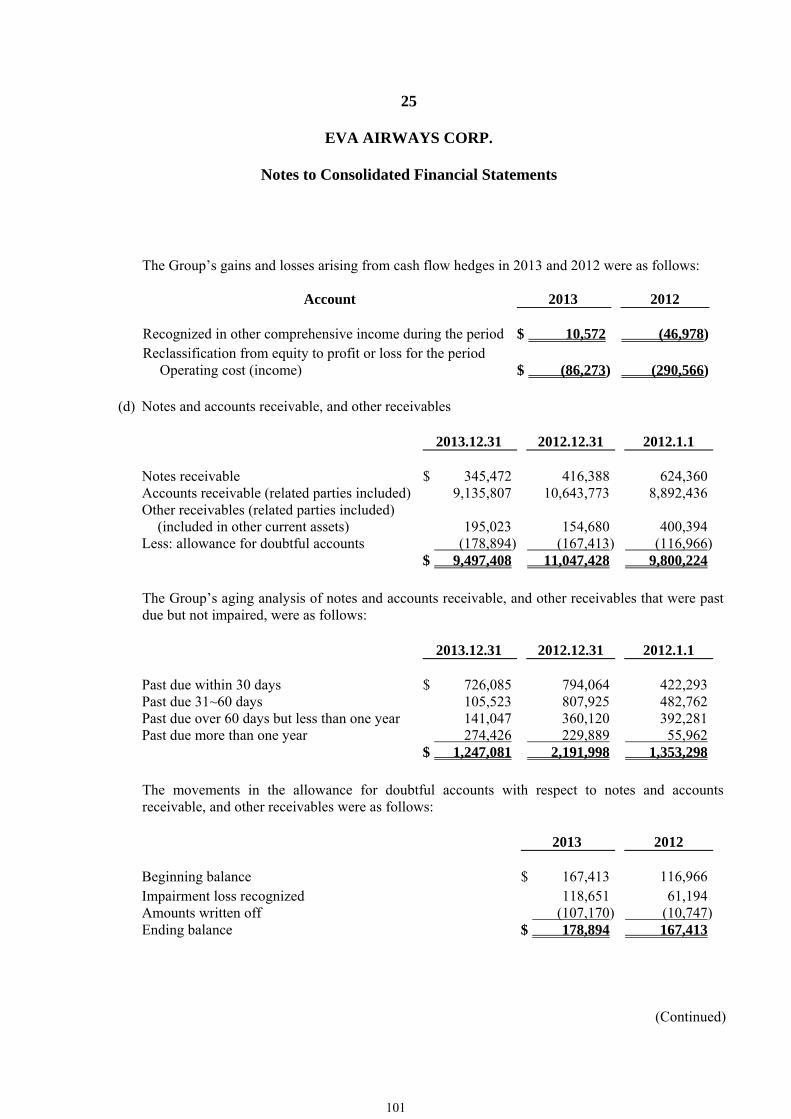
25
EVA AIRWAYS CORP.
Notes to Consolidated Financial Statements
(Continued)
The Group’s gains and losses arising from cash flow hedges in 2013 and 2012 were as follows:
Account 2013 2012
Recognized in other comprehensive income during the period $ 10,572 (46,978)Reclassification from equity to profit or loss for the period
Operating cost (income) $ (86,273)
(290,566)
(d) Notes and accounts receivable, and other receivables
2013.12.31 2012.12.31 2012.1.1 Notes receivable $ 345,472 416,388 624,360Accounts receivable (related parties included) 9,135,807 10,643,773 8,892,436Other receivables (related parties included)
(included in other current assets) 195,023
154,680
400,394
Less: allowance for doubtful accounts (178,894) (167,413) (116,966) $ 9,497,408 11,047,428 9,800,224
The Group’s aging analysis of notes and accounts receivable, and other receivables that were past due but not impaired, were as follows:
2013.12.31 2012.12.31 2012.1.1 Past due within 30 days $ 726,085 794,064 422,293Past due 31~60 days 105,523 807,925 482,762Past due over 60 days but less than one year 141,047 360,120 392,281Past due more than one year 274,426 229,889 55,962 $ 1,247,081 2,191,998 1,353,298
The movements in the allowance for doubtful accounts with respect to notes and accounts receivable, and other receivables were as follows:
2013 2012
Beginning balance $ 167,413 116,966Impairment loss recognized 118,651 61,194Amounts written off (107,170) (10,747)Ending balance $ 178,894 167,413
101
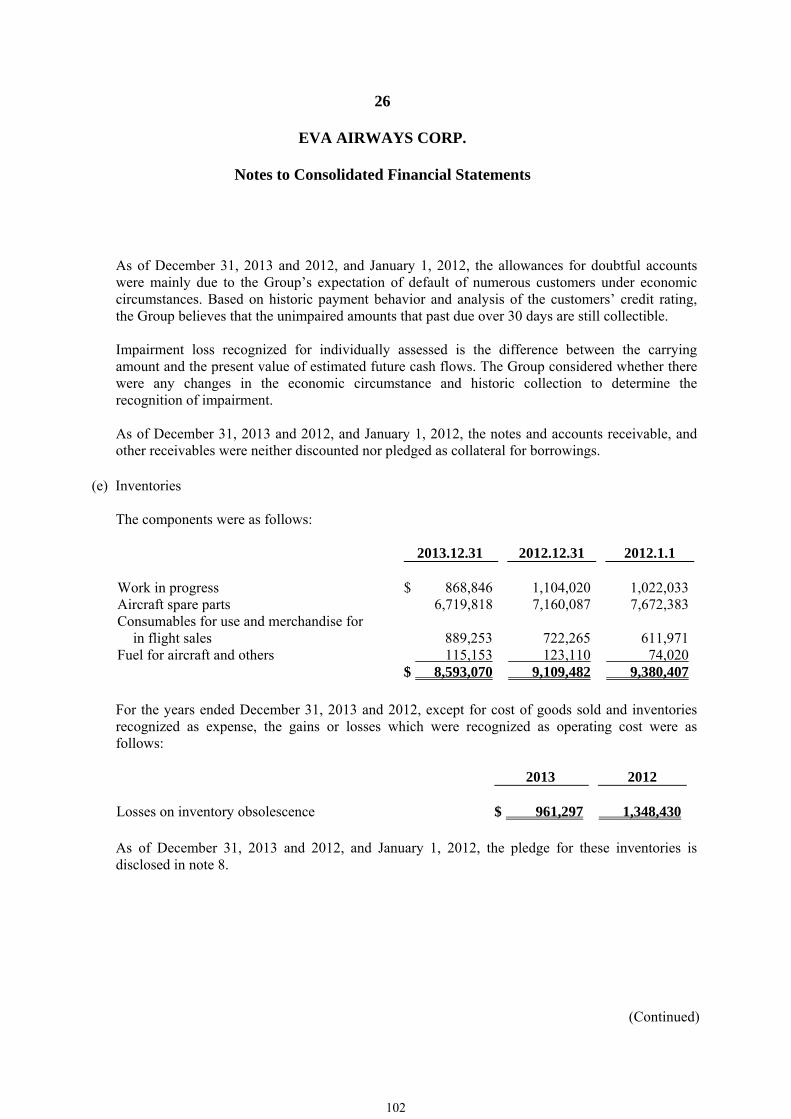
26
EVA AIRWAYS CORP.
Notes to Consolidated Financial Statements
(Continued)
As of December 31, 2013 and 2012, and January 1, 2012, the allowances for doubtful accounts were mainly due to the Group’s expectation of default of numerous customers under economic circumstances. Based on historic payment behavior and analysis of the customers’ credit rating, the Group believes that the unimpaired amounts that past due over 30 days are still collectible. Impairment loss recognized for individually assessed is the difference between the carrying amount and the present value of estimated future cash flows. The Group considered whether there were any changes in the economic circumstance and historic collection to determine the recognition of impairment. As of December 31, 2013 and 2012, and January 1, 2012, the notes and accounts receivable, and other receivables were neither discounted nor pledged as collateral for borrowings.
(e) Inventories
The components were as follows: 2013.12.31 2012.12.31 2012.1.1 Work in progress $ 868,846 1,104,020 1,022,033Aircraft spare parts 6,719,818 7,160,087 7,672,383Consumables for use and merchandise for
in flight sales 889,253
722,265
611,971
Fuel for aircraft and others 115,153 123,110 74,020 $ 8,593,070 9,109,482 9,380,407 For the years ended December 31, 2013 and 2012, except for cost of goods sold and inventories recognized as expense, the gains or losses which were recognized as operating cost were as follows:
2013 2012
Losses on inventory obsolescence $ 961,297 1,348,430
As of December 31, 2013 and 2012, and January 1, 2012, the pledge for these inventories is disclosed in note 8.
102
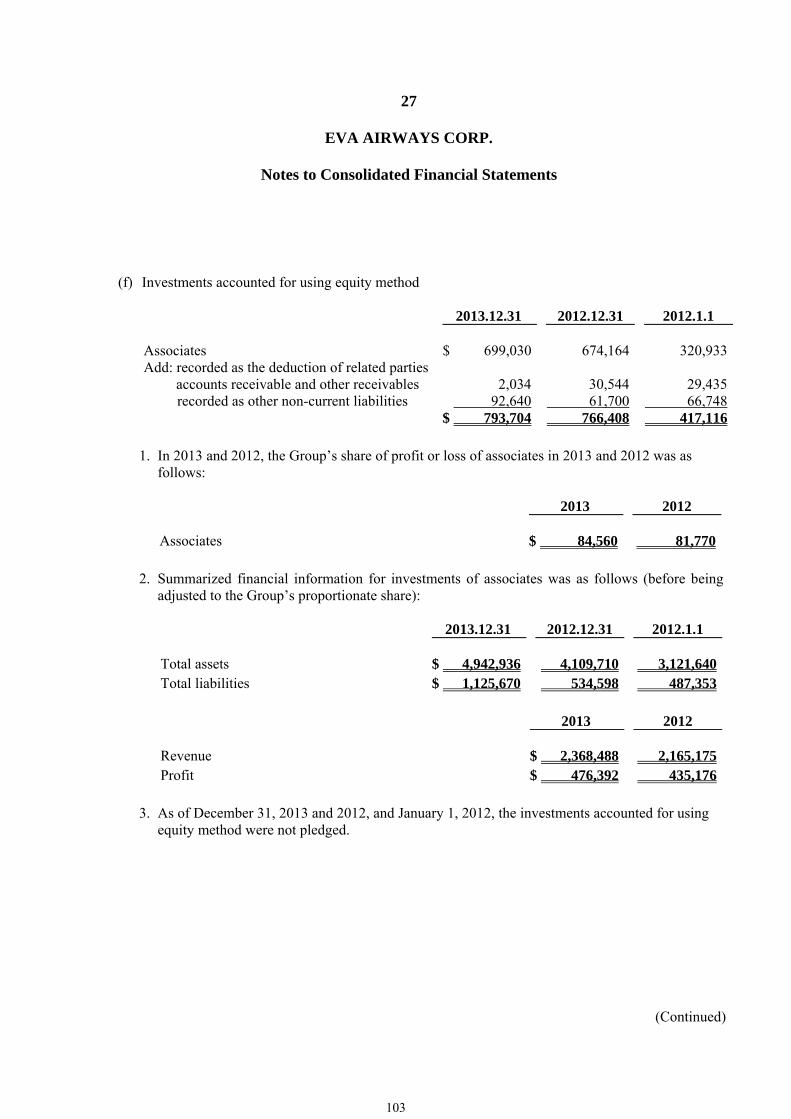
27
EVA AIRWAYS CORP.
Notes to Consolidated Financial Statements
(Continued)
(f) Investments accounted for using equity method
2013.12.31 2012.12.31 2012.1.1 Associates $ 699,030 674,164 320,933Add: recorded as the deduction of related parties
accounts receivable and other receivables 2,034
30,544
29,435
recorded as other non-current liabilities 92,640 61,700 66,748 $ 793,704 766,408 417,116 1. In 2013 and 2012, the Group’s share of profit or loss of associates in 2013 and 2012 was as
follows:
2013 2012 Associates $ 84,560 81,770
2. Summarized financial information for investments of associates was as follows (before being
adjusted to the Group’s proportionate share):
2013.12.31 2012.12.31 2012.1.1 Total assets $ 4,942,936 4,109,710 3,121,640Total liabilities $ 1,125,670 534,598 487,353
2013 2012 Revenue $ 2,368,488 2,165,175Profit $ 476,392 435,176
3. As of December 31, 2013 and 2012, and January 1, 2012, the investments accounted for using
equity method were not pledged.
103

28
EVA AIRWAYS CORP.
Notes to Consolidated Financial Statements
(Continued)
(g) Property, plant and equipment
The movements in cost and accumulated depreciation of property, plant and equipment for the years ended December 31, 2013 and 2012 were as follows:
Land
Building and
structures
Machinery and
equipment
Leased assets
Aircraft
Unfinished
construction
Total
Cost:
Beginning balance as of January 1, 2013 $ 2,574,955 11,451,144 21,292,528 20,702,034 97,971,111 288,027 154,279,799
Additions - 304,709 1,825,922 1,232,892 1,229,046 475,578 5,068,147
Disposals (4,410) (14,940) (879,997) (40,084) (479,874) - (1,419,305)
Reclassification (Note) - 612,915 (236,633) (3,709,755) (5,085,092) (601,790) (9,020,355)
Effect of exchange rate changes - - (2,350) - - - (2,350)
Balance as of December 31, 2013 $ 2,570,545 12,353,828 21,999,470 18,185,087 93,635,191 161,815 148,905,936
Beginning balance as of January 1, 2012 $ 2,550,924 11,284,929 21,265,272 21,071,351 109,521,746 4,868 165,699,090
Additions 24,031 165,579 1,309,208 1,115,440 2,170,937 283,159 5,068,354
Disposals - (325) (1,401,951) (29,066) (8,219,957) - (9,651,299)
Reclassification - 961 120,868 (1,455,691) (5,501,615) - (6,835,477)
Effect of exchange rate changes - - (869) - - - (869)
Balance as of December 31, 2012 $ 2,574,955 11,451,144 21,292,528 20,702,034 97,971,111 288,027 154,279,799
Accumulated depreciation:
Beginning balance as of January 1, 2013 $ - 5,283,016 11,490,660 7,015,247 35,745,107 - 59,534,030
Depreciation expense - 352,179 1,588,617 2,068,578 6,714,492 - 10,723,866
Disposals - (13,440) (652,199) (10,791) (353,920) - (1,030,350)
Reclassification (Note) - - (245,497) (3,239,623) (5,060,883) - (8,546,003)
Effect of exchange rate changes - - (1,950) - 1 - (1,949)
Balance as of December 31, 2013 $ - 5,621,755 12,179,631 5,833,411 37,044,797 - 60,679,594
Beginning balance as of January 1, 2012 $ - 4,936,516 11,567,189 6,600,821 41,402,257 - 64,506,783
Depreciation expense - 346,514 1,582,879 1,870,117 7,128,137 - 10,927,647
Disposals - (325) (1,323,533) - (7,283,672) - (8,607,530)
Reclassification - 311 (335,099) (1,455,691) (5,501,615) - (7,292,094)
Effect of exchange rate changes - - (776) - - - (776)
Balance as of December 31, 2012 $ - 5,283,016 11,490,660 7,015,247 35,745,107 - 59,534,030
Carrying amounts:
Balance as of December 31, 2013 $ 2,570,545 6,732,073 9,819,839 12,351,676 56,590,394 161,815 88,226,342
Balance as of December 31, 2012 $ 2,574,955 6,168,128 9,801,868 13,686,787 62,226,004 288,027 94,745,769
Beginning balance as of January 1, 2012 $ 2,550,924 6,348,413 9,698,083 14,470,530 68,119,489 4,868 101,192,307
Note: Reclassification primarily consists of the reclassification to other non-current assets and inventories.
104

29
EVA AIRWAYS CORP.
Notes to Consolidated Financial Statements
(Continued)
1. Leased aircraft and computer equipment
The Group leased aircraft and computer equipment under a number of finance lease arrangements. Such leases are treated as finance leases in accordance with the terms and conditions of the contracts. Leased equipments are used as pledge for lease obligations and are disclosed in note 8.
The estimated recovery costs incurred by leasing aircraft are recognized as leased assets and the related restoration obligations are recognized as other non-current liabilities and are amortized using interest method.
As of December 31, 2013 and 2012, and January 1, 2012, the restoration obligations were $3,882,172, $3,437,143 and $2,751,138, respectively.
2. Sale and leaseback transactions
The Group leased aircraft under sale and leaseback arrangements, which were judged as finance leases. The unrealized gain on sale and leaseback, resulting from the difference between sale price and book value of the equipment, is recorded as a reduction of depreciation expenses over the lease term. As of December 31, 2013 and 2012, and January 1, 2012, the unrealized gains from the sale and leaseback were $531,483, $643,305 and $755,128, respectively and were recognized as other non-current liabilities.
3. Pledge
As of December 31, 2013 and 2012 and January 1, 2012, the Group’s property, plant and equipment were used as pledge for long-term borrowings and lines of credit, and they are disclosed in note 8.
4. For the years ended December 31, 2013 and 2012, the Group capitalized the interest expenses
on purchase of assets amounting to $60,956 and $11,281, respectively. The range of the monthly interest rate used for capitalization calculation were 0.13% and 0.13%~0.14%, respectively.
105

30
EVA AIRWAYS CORP.
Notes to Consolidated Financial Statements
(Continued)
(h) Intangible assets
The movements in cost and accumulated amortization of intangible assets for the years ended December 31, 2013 and 2012 were as follows:
Operating concession
Computer software
Total
Costs: Beginning balance as of January 1, 2013 $ 2,065,902 460,396 2,526,298 Additions 162,677 231,287 393,964 Balance as of December 31, 2013 $ 2,228,579 691,683 2,920,262 Beginning balance as of January 1, 2012 $ 2,065,902 213,992 2,279,894 Additions - 246,403 246,403 Balance as of December 31, 2012 $ 2,065,902 460,395 2,526,297 Accumulated amortization: Beginning balance as of January 1, 2013 $ 122,981 131,576 254,557 Amortization expense 122,982 110,859 233,841 Balance as of December 31, 2013 $ 245,963 242,435 488,398 Beginning balance as of January 1, 2012 $ - 72,423 72,423 Amortization expense 122,981 59,152 182,133 Balance as of December 31, 2012 $ 122,981 131,575 254,556 Carrying amounts: Balance as of December 31, 2013 $ 1,982,616 449,248 2,431,864 Balance as of December 31, 2012 $ 1,942,921 328,820 2,271,741 Beginning Balance as of January 1, 2012 $ 2,065,902 141,569 2,207,471
1. Amortization
The amortization of intangible assets is included under operating costs and operating expenses in the consolidated statement of comprehensive income.
2. Pledge
As of December 31, 2013 and 2012, and January 1, 2012, the Group’s intangible assets were used as pledge for long-term borrowings and loan commitments and are disclosed in note 8.
106

31
EVA AIRWAYS CORP.
Notes to Consolidated Financial Statements
(Continued)
(i) Other non-current assets
The details of the Group’s other non-current assets were as follows: 2013.12.31 2012.12.31 2012.1.1 Advances for purchases of equipment $ 5,448,537 2,237,299 70,995Refundable deposits 1,142,103 1,054,846 1,751,335Pledged time deposits 95,107 81,467 97,413Others 57,034 22,493 12,132Total $ 6,742,781 3,396,105 1,931,875
(j) Short-term borrowings, long-term borrowings and lease liabilities
The details, conditions and terms of the Group’s short-term borrowings, long-term borrowings and lease liabilities were as follows:
2013.12.31 Currency Interest rate Year due Amount Unsecured short-term loans NTD 1.10%~1.48% 2014 $ 1,252,774Secured short-term loans NTD 1.20% 2014 76,000 $ 1,328,774Secured bonds payable NTD 1.15%~1.44% 2016~2018 $ 21,200,000Unsecured loans NTD 1.29%~2.28% 2014~2018 $ 10,720,103Secured loans NTD, USD 0.24%~4.59% 2014~2022 36,213,522Subtotal 46,933,625Less: Current portion 9,334,554Total $ 37,599,071Lease liabilities NTD, USD 1.18%~6.93% 2014~2019 $ 6,957,087Less: Current portion (included in other
current liabilities)
1,571,239Total $ 5,385,848
107

32
EVA AIRWAYS CORP.
Notes to Consolidated Financial Statements
(Continued)
2012.12.31 Currency Interest rate Year due Amount Unsecured short-term loans NTD 1.02%~1.48% 2013 $ 1,350,777Secured short-term loans NTD 1.15% 2013 132,000 $ 1,482,777Secured bonds payable NTD 1.21%~1.44% 2016~2017 $ 16,700,000Unsecured loans NTD 1.32%~2.70% 2013~2017 $ 10,726,638Secured loans NTD, USD 0.34%~4.59% 2013~2022 43,655,569Subtotal 54,382,207Less: Current portion 10,524,796Total $ 43,857,411Lease liabilities NTD, USD 1.18%~6.93% 2014~2019 $ 8,882,533Less: Current portion (included in other
current liabilities)
1,547,380Total $ 7,335,153
2012.1.1 Currency Interest rate Year due Amount Unsecured short-term loans NTD 1.08%~1.49% 2012 $ 1,869,436Secured short-term loans NTD 1.10%~1.52% 2012 300,000 $ 2,169,436Secured bonds payable NTD 1.21%~1.44% 2016 $ 10,200,000Unsecured loans NTD 1.20%~2.70% 2012~2016 $ 8,840,017Secured loans NTD, USD 0.25%~4.59% 2012~2022 52,955,981Subtotal 61,795,998Less: Current portion 10,433,022Total $ 51,362,976Lease liabilities NTD, USD 1.18%~6.93% 2014~2019 $ 10,525,724Less: Current portion (included in other
current liabilities)
1,522,593Total $ 9,003,131
108
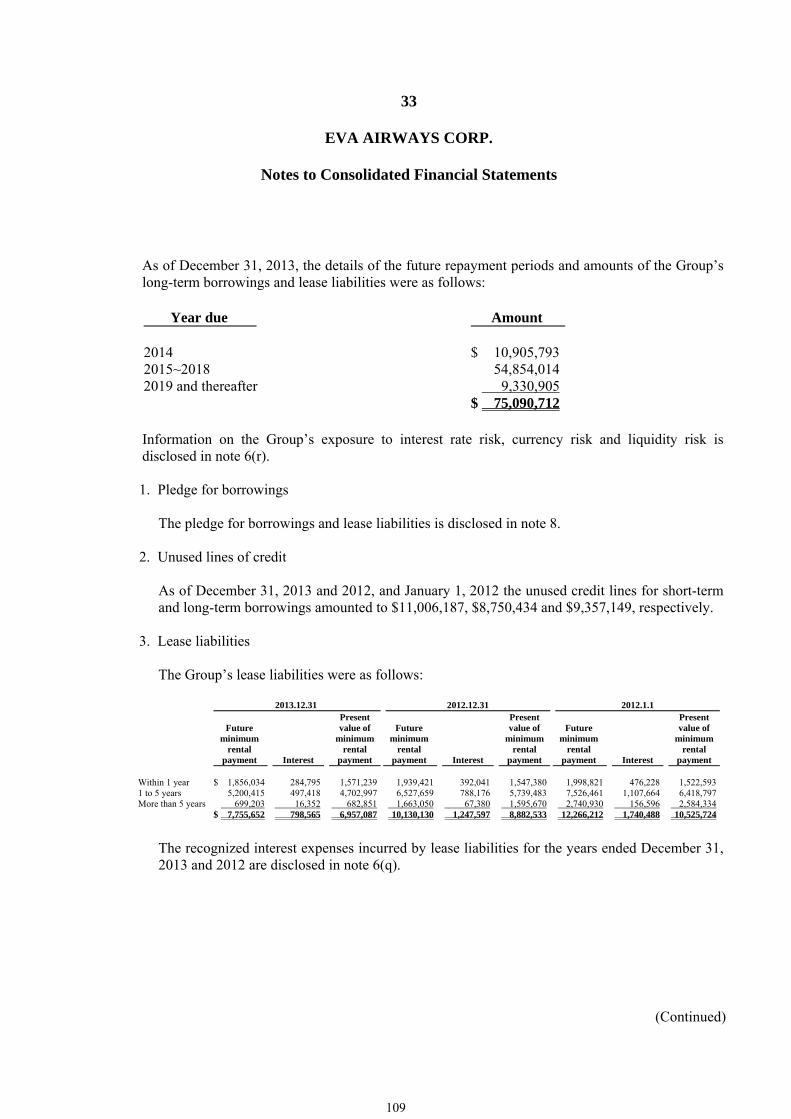
33
EVA AIRWAYS CORP.
Notes to Consolidated Financial Statements
(Continued)
As of December 31, 2013, the details of the future repayment periods and amounts of the Group’s long-term borrowings and lease liabilities were as follows:
Year due Amount 2014 $ 10,905,793 2015~2018 54,854,014 2019 and thereafter 9,330,905 $ 75,090,712 Information on the Group’s exposure to interest rate risk, currency risk and liquidity risk is disclosed in note 6(r). 1. Pledge for borrowings
The pledge for borrowings and lease liabilities is disclosed in note 8.
2. Unused lines of credit
As of December 31, 2013 and 2012, and January 1, 2012 the unused credit lines for short-term and long-term borrowings amounted to $11,006,187, $8,750,434 and $9,357,149, respectively.
3. Lease liabilities
The Group’s lease liabilities were as follows:
2013.12.31 2012.12.31 2012.1.1
Future minimum
rental payment
Interest
Present value of
minimum rental
payment
Future
minimum rental
payment
Interest
Present value of
minimum rental
payment
Future
minimum rental
payment
Interest
Present value of
minimum rental
payment Within 1 year $ 1,856,034 284,795 1,571,239 1,939,421 392,041 1,547,380 1,998,821 476,228 1,522,5931 to 5 years 5,200,415 497,418 4,702,997 6,527,659 788,176 5,739,483 7,526,461 1,107,664 6,418,797More than 5 years 699,203 16,352 682,851 1,663,050 67,380 1,595,670 2,740,930 156,596 2,584,334 $ 7,755,652 798,565 6,957,087 10,130,130 1,247,597 8,882,533 12,266,212 1,740,488 10,525,724
The recognized interest expenses incurred by lease liabilities for the years ended December 31, 2013 and 2012 are disclosed in note 6(q).
109

34
EVA AIRWAYS CORP.
Notes to Consolidated Financial Statements
(Continued)
(k) Operating leases
The Group leased aircraft, land, buildings, and parking lots under operating lease agreements with rental payable in the future as follows:
2013.12.31 2012.12.31 2012.1.1
Within 1 year $ 7,125,669 6,674,072 6,647,0181 to 5 years 17,858,263 19,080,007 21,385,516More than 5 years 8,767,482 9,322,723 10,919,617 $ 33,751,414 35,076,802 38,952,151
For the years ended December 31, 2013 and 2012, rental expenses included in operating costs and operating expenses were $7,126,472 and $6,670,219, respectively. The Group did not assume the residual value of the abovementioned lease items, and determined that the risk and return of those lease items are still assumed by the lessor. Hence, the Group treated the abovementioned lease as operating leases.
(l) Employee benefits
1. Defined benefit plans
The movements in the present value of the defined benefit obligations and the fair value of plan assets were as follows:
2013.12.31 2012.12.31 2012.1.1
Total present value of defined benefit
obligations $ 8,525,724
8,038,731 7,368,254
Fair value of plan assets (5,152,605) (4,709,800) (4,252,365)Recognized liabilities for defined benefit
obligations $ 3,373,119
3,328,931
3,115,889
The Group makes defined benefit plan contributions to the pension fund account at Bank of Taiwan that provides pensions for employees upon retirement. The plans (covered by the Labor Standards Act) entitle a retired employee to receive retirement payment calculated by the unit based on years of service and average salary for the six months prior to retirement.
110

35
EVA AIRWAYS CORP.
Notes to Consolidated Financial Statements
(Continued)
(1) Composition of plan assets
The Group allocates pension funds in accordance with the Regulations for Revenues, Expenditures, Safeguard and Utilization of the Labor Retirement Fund, and such funds are managed by the Labor Pension Fund Supervisory Committee of the Council of Labor Affairs. Minimum earnings on such funds shall be no less than the earnings attainable from the amounts accrued from two-year time deposits with interest rates offered by local banks. The Group’s labor pension reserve account balance in Bank of Taiwan amounted to $5,114,568 as of December 31, 2013. The utilization of the labor pension fund assets, including the asset allocation and yield of the fund. Please refer to the website of the Labor Pension Fund Supervisory Committee.
(2) Movements in present value of the defined benefit obligations
The movements in present value of the defined benefit obligations were as follows:
2013 2012 Defined benefit obligations at January 1 $ 8,038,731 7,368,254Benefits paid by the plan (290,570) (227,903)Current service costs and interest 364,149 361,351Actuarial losses (gains) 413,414 537,029Defined benefit obligations at December 31 $ 8,525,724 8,038,731
(3) Movements of defined benefit plan assets
The movements in the fair value of the defined benefit plan assets were as follows:
2013 2012 Fair value of plan assets at January 1 $ 4,709,800 4,252,365Contributions from plan participants 634,666 590,590Benefits paid by the plan (252,571) (175,766)Expected return on plan assets 87,578 90,353Actuarial gains (losses) (26,868) (47,742)Fair value of plan assets at December 31 $ 5,152,605 4,709,800
111

36
EVA AIRWAYS CORP.
Notes to Consolidated Financial Statements
(Continued)
(4) Expenses recognized in profit or loss
The expenses recognized in profit or loss were as follows: 2013 2012 Current services costs $ 228,397 220,005Interest on obligations 135,752 141,346Expected return on plan assets (87,578) (90,353) $ 276,571 270,998Operating costs $ 223,941 215,331Operating expenses 52,630 55,667 $ 276,571 270,998Actual return on plan assets $ 60,710 42,611
(5) Actuarial gains and losses recognized in other comprehensive income
The Group’s actuarial gains and losses recognized in other comprehensive income were as follows:
2013 2012 Cumulative amount at January 1 $ (584,771) - Recognized during the period (440,282) (584,771)Cumulative amount at December 31 $ (1,025,053) (584,771)
(6) Actuarial assumptions
The following are the Group’s principal actuarial assumptions (using the weighted-average method) at the reporting date:
2013 2012 Discount rate 1.75%~2.00% 1.38%~1.75%Expected return on plan assets 2.00% 1.75%~1.88%Future salary increases 1.41%~3.00% 1.30%~3.00% The overall expected long-term rate of return on assets was based on the portfolio as a whole and not on the sum of the returns on individual asset categories. The return ratio was exclusively based on historical returns, without adjustments.
112

37
EVA AIRWAYS CORP.
Notes to Consolidated Financial Statements
(Continued)
(7) Experience adjustments on historical information
2013.12.31 2012.12.31 2012.1.1
Present value of defined benefit
obligations $ 8,525,724
8,038,731
7,368,254
Fair value of plan assets (5,152,605) (4,709,800) (4,252,365)Net liabilities of defined benefit
obligations $ 3,373,119
3,328,931
3,115,889
Experience adjustments arising on the present value of defined benefit plans
$ 413,414
537,029
-
Experience adjustments arising on the fair value of plan assets
$ 26,868
47,742
-
The expected allocation payments made by the Group to the defined benefit plans during the annual period after December 31, 2013 are $634,193.
(8) When calculating the present value of defined benefit obligations, the Group used
judgments and estimations to determine the actuarial assumptions, including the employee turnover rates and future salary changes as of the end of the reporting period. Any changes in the actuarial assumptions may significantly impact the amount of the defined benefit obligations. As of December 31, 2013, the Group’s accrued pension liabilities were $3,373,119. If the discount rate had increased or decreased by 0.25%, the Group’s accrued pension liabilities would have decreased by $254,438 or increased by $265,326, respectively; if the future salary increase rate had increased or decreased by 0.25%, the Group’s accrued pension liabilities would have increased by $255,882 or decreased by $248,366.
2. Defined contribution plans The Group set aside 6% of each employee’s monthly wages to contribute to the labor pension personal accounts at the Bureau of Labor Insurance in accordance with the provisions of the Labor Pension Act. The Group set aside a fixed amount to contribute to the Bureau of Labor Insurance without the payment of additional legal or constructive obligations.
The Group set aside $366,598 and $318,952 as pension costs under the defined contribution plans in 2013 and 2012, respectively. Payment was made to the Bureau of Labor Insurance.
113
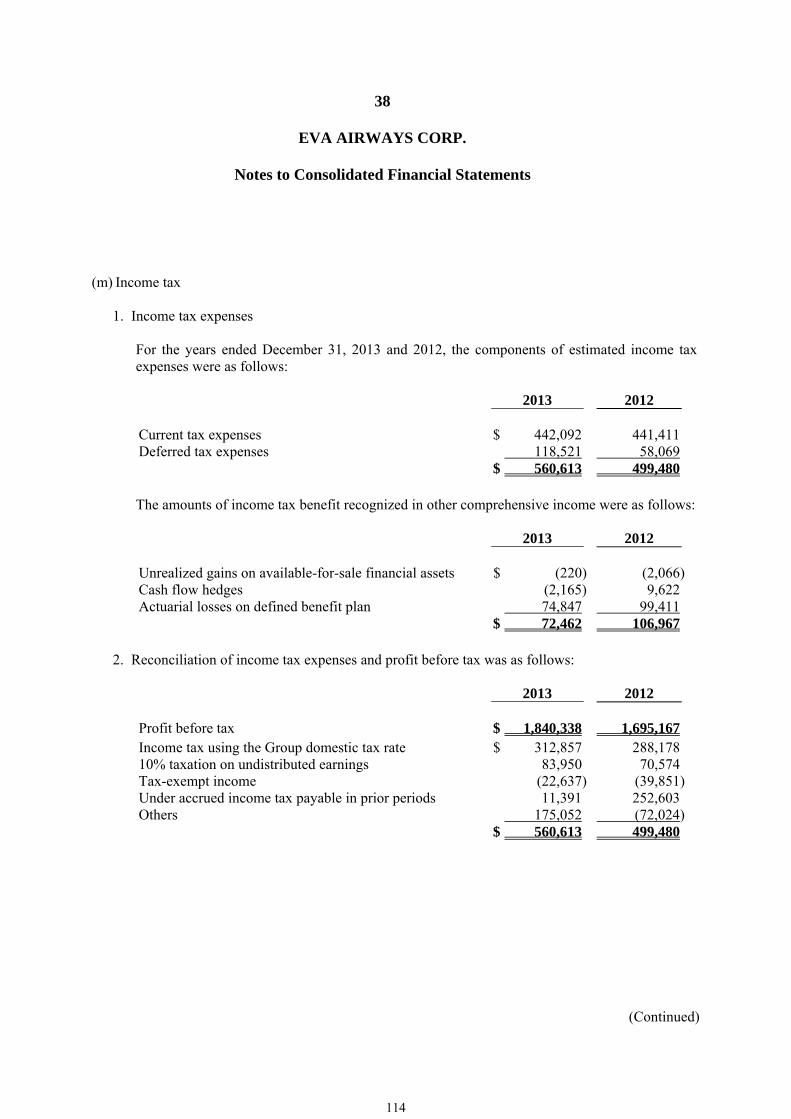
38
EVA AIRWAYS CORP.
Notes to Consolidated Financial Statements
(Continued)
(m) Income tax
1. Income tax expenses
For the years ended December 31, 2013 and 2012, the components of estimated income tax expenses were as follows:
2013 2012
Current tax expenses $ 442,092 441,411Deferred tax expenses 118,521 58,069 $ 560,613 499,480
The amounts of income tax benefit recognized in other comprehensive income were as follows:
2013 2012
Unrealized gains on available-for-sale financial assets $ (220) (2,066)Cash flow hedges (2,165) 9,622Actuarial losses on defined benefit plan 74,847 99,411 $ 72,462 106,967
2. Reconciliation of income tax expenses and profit before tax was as follows:
2013 2012
Profit before tax $ 1,840,338 1,695,167Income tax using the Group domestic tax rate $ 312,857 288,17810% taxation on undistributed earnings 83,950 70,574Tax-exempt income (22,637) (39,851)Under accrued income tax payable in prior periods 11,391 252,603Others 175,052 (72,024) $ 560,613 499,480
114
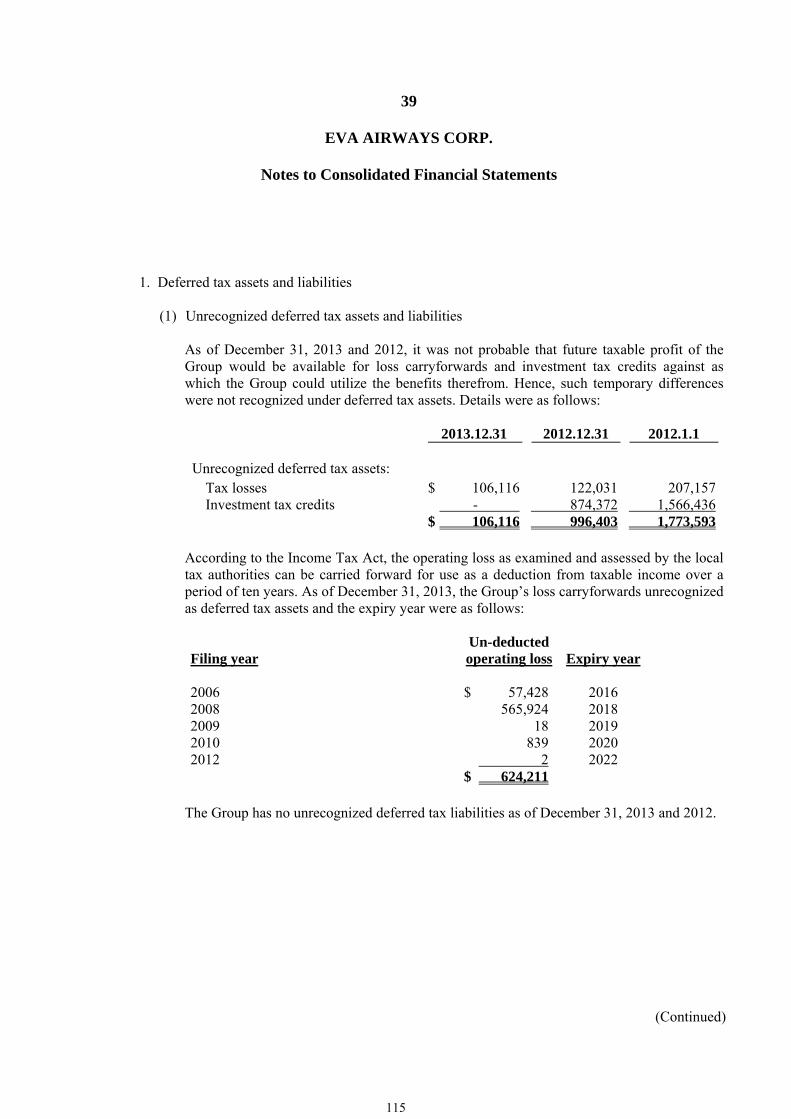
39
EVA AIRWAYS CORP.
Notes to Consolidated Financial Statements
(Continued)
1. Deferred tax assets and liabilities
(1) Unrecognized deferred tax assets and liabilities
As of December 31, 2013 and 2012, it was not probable that future taxable profit of the Group would be available for loss carryforwards and investment tax credits against as which the Group could utilize the benefits therefrom. Hence, such temporary differences were not recognized under deferred tax assets. Details were as follows:
2013.12.31 2012.12.31 2012.1.1 Unrecognized deferred tax assets:
Tax losses $ 106,116 122,031 207,157Investment tax credits - 874,372 1,566,436
$ 106,116 996,403 1,773,593
According to the Income Tax Act, the operating loss as examined and assessed by the local tax authorities can be carried forward for use as a deduction from taxable income over a period of ten years. As of December 31, 2013, the Group’s loss carryforwards unrecognized as deferred tax assets and the expiry year were as follows:
Filing year
Un-deducted operating loss
Expiry year
2006 $ 57,428 2016 2008 565,924 2018 2009 18 2019 2010 839 2020 2012 2 2022 $ 624,211
The Group has no unrecognized deferred tax liabilities as of December 31, 2013 and 2012.
115
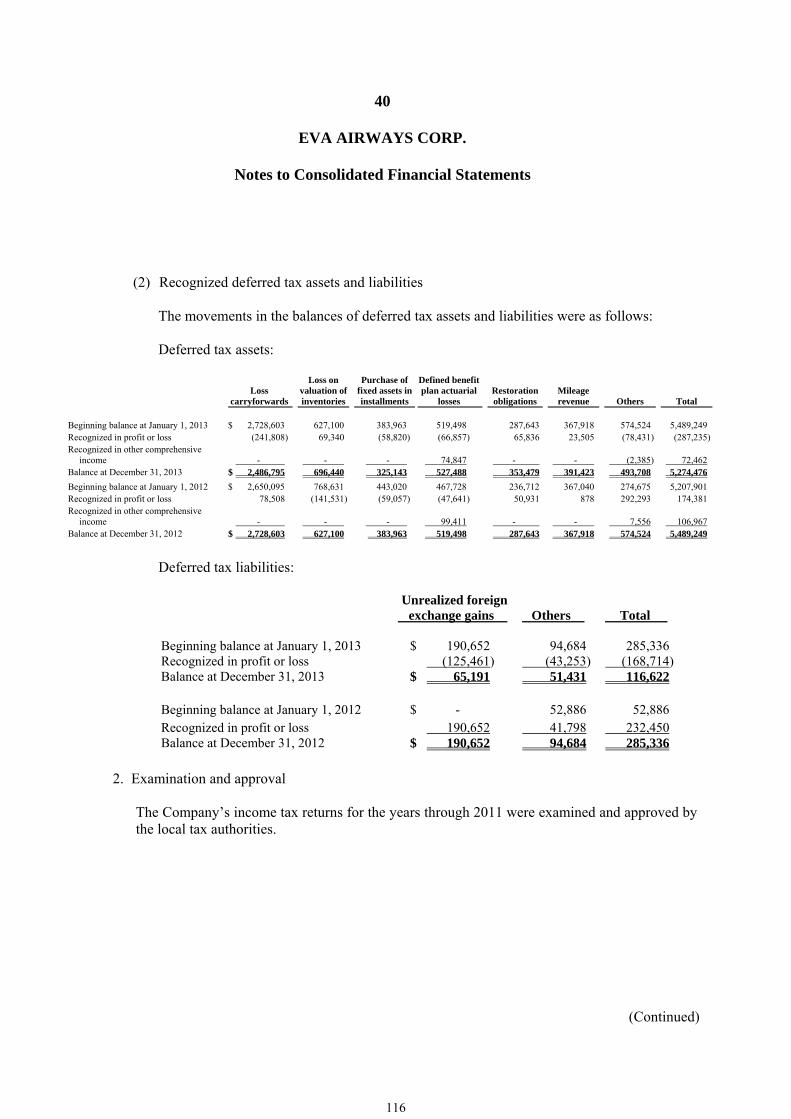
40
EVA AIRWAYS CORP.
Notes to Consolidated Financial Statements
(Continued)
(2) Recognized deferred tax assets and liabilities
The movements in the balances of deferred tax assets and liabilities were as follows:
Deferred tax assets:
Loss
carryforwards
Loss on valuation of inventories
Purchase of fixed assets in installments
Defined benefit plan actuarial
losses
Restorationobligations
Mileage revenue
Others
Total Beginning balance at January 1, 2013 $ 2,728,603 627,100 383,963 519,498 287,643 367,918 574,524 5,489,249Recognized in profit or loss (241,808) 69,340 (58,820) (66,857) 65,836 23,505 (78,431) (287,235)Recognized in other comprehensive
income -
-
-
74,847
-
-
(2,385)
72,462
Balance at December 31, 2013 $ 2,486,795 696,440 325,143 527,488 353,479 391,423 493,708 5,274,476Beginning balance at January 1, 2012 $ 2,650,095 768,631 443,020 467,728 236,712 367,040 274,675 5,207,901Recognized in profit or loss 78,508 (141,531) (59,057) (47,641) 50,931 878 292,293 174,381Recognized in other comprehensive
income -
-
-
99,411
-
-
7,556
106,967
Balance at December 31, 2012 $ 2,728,603 627,100 383,963 519,498 287,643 367,918 574,524 5,489,249
Deferred tax liabilities:
Unrealized foreign
exchange gains Others Total
Beginning balance at January 1, 2013 $ 190,652 94,684 285,336Recognized in profit or loss (125,461) (43,253) (168,714)Balance at December 31, 2013 $ 65,191 51,431 116,622 Beginning balance at January 1, 2012 $ - 52,886 52,886Recognized in profit or loss 190,652 41,798 232,450Balance at December 31, 2012 $ 190,652 94,684 285,336
2. Examination and approval The Company’s income tax returns for the years through 2011 were examined and approved by the local tax authorities.
116

41
EVA AIRWAYS CORP.
Notes to Consolidated Financial Statements
(Continued)
3. Information related to unappropriated earnings and creditable ratio:
2013.12.31 2012.12.31 2012.1.1 Unappropriated earnings before 1997 $ - - - Unappropriated earnings after 1998 (4,465,228) (2,970,767) (3,187,608)
$ (4,465,228) (2,970,767) (3,187,608)Balance of ICA $ 158,662 365,367 214,388
2013 2012 Tax creditable ratio for earnings distribution to
R.O.C. residents
- % (estimated)
- % (actual)
According to the announcement by the Ministry of Finance on October 17, 2013, under Decree No. 10204562810, the Company’s income tax information and imputation tax credit information should be disclosed in compliance with the Decree.
(n) Capital and other equity
As of December 31, 2013 and 2012 and January 1, 2012, the Company’s authorized share capital consisted of 4,000,000 thousand shares of common stock, with par value of $10 (dollars) per share, of which the issued and outstanding share capital were $32,589,450.
1. Capital surplus
The details of capital surplus were as follows:
2013.12.31 2012.12.31 2012.1.1 Cash subscription in excess of par value
of shares $ 29,672
29,672
29,672
Stock options granted to employees 282,100 282,100 282,100Additional paid-in capital from bond
conversion 1,411,830 1,411,830
1,411,830
$ 1,723,602 1,723,602 1,723,602
In accordance with R.O.C. Company Act amended in January 2012, realized capital surplus can only be reclassified as share capital or distributed as cash dividends after offsetting losses. The aforementioned capital surplus included share premiums and donation gains. In accordance with the Securities Offering and Issuance Guidelines, the amount of capital surplus to be reclassified under share capital shall not exceed 10% of the actual share capital amount.
117

42
EVA AIRWAYS CORP.
Notes to Consolidated Financial Statements
(Continued)
2. Retained earnings
According to the Company’s articles of incorporation, current-period earnings should first be used to settle all outstanding tax payables and accumulated deficit, and then 10% of statutory earnings reserves should be retained, and special reserve should be recognized or reversed according to statutory requirements. Thereafter, the remaining current-period earnings and the unappropriated prior-period earnings can be distributed by reference to a resolution approved by the stockholders. The Company must appropriate employee bonuses of at least 1% of earnings of each year, and less than 5% of earnings of each year for remuneration of directors and supervisors.
The Company adopts the dividend policy that cash dividends and stock dividends are distributed with cash dividends accounting for at least 10% of total dividends distributed.
(1) Legal reserve
In accordance with R.O.C. Company Act amended in January 2012, the Company must retain 10% of its annual income as a legal reserve until such retention equals the amount of paid-in capital. If a company has no accumulated deficit, it may, pursuant to a resolution approved by the stockholders, distribute its legal reserve by issuing new shares or cash for the portion in excess of 25% of the paid-in capital.
(2) Special reserve
In accordance with Decree No. 1010012865 issued by the FSC on April 6, 2012, a portion of current-period earnings and undistributed prior-period earnings shall be reclassified as a special earnings reserve during earnings distribution. The amount to be reclassified should be equal to the current-period total net reduction of other equity. Similarly, a portion of undistributed prior-period earnings shall be reclassified as a special earnings reserve (which does not qualify for earnings distribution) to account for cumulative changes to other shareholders’ equity pertaining to prior periods. Amounts of subsequent reversals pertaining to the net reduction of other equity shall qualify for additional distributions.
(3) Earnings distribution On June 24, 2013 and June 21, 2012, the Company’s stockholders did not appropriate dividends, employee bonuses, and directors’ and supervisors’ remuneration in consideration of operational needs and sustainable development. For the years ended December 31, 2013 and 2012, the Company did not recognize any bonuses to employees and remuneration to directors and supervisors. Differences between the amount approved in the shareholders’ meeting and recognized in the financial statements, if any, are recognized as profit or loss.
118

43
EVA AIRWAYS CORP.
Notes to Consolidated Financial Statements
(Continued)
3. Other equity
Exchange
differences ontranslation of
foreign financial statements
Unrealized gains (losses) on
available-for-sale financial
assets Cash flow hedges Total
Beginning balance at January 1, 2013 $ 30,071 (881,760) 11,083 (840,606)Exchange differences on translation of foreign
financial statements 39,242
-
-
39,242
Unrealized gains (losses) on available-for-sale financial assets (net of taxes)-the Company
-
40,533
-
40,533
Cash flow hedges, effective portion - - 10,572 10,572Balance at December 31, 2013 $ 69,313 (841,227) 21,655 (750,259) Beginning balance at January 1, 2012 $ 104,750 46,442 58,061 209,253Exchange differences on translation of foreign
financial statements (74,679)
-
-
(74,679)
Unrealized gains (losses) on available-for-sale financial assets (net of taxes)-the Company
-
(928,202)
-
(928,202)
Cash flow hedges, effective portion - - (46,978) (46,978)Balance at December 31, 2012 $ 30,071 (881,760) 11,083 (840,606)
(o) Earnings per share (“EPS”)
The calculation of earnings per share is based on the profit attributable to the ordinary equity holders of the Company. Earnings per share were calculated as follows:
2013
Profit
Weighted-average number of shares
outstanding during the year
(thousand shares) EPS (in dollars) Basic earnings per share:
Profit attributable to ordinary equity holders
$ 747,450
3,258,945
0.23
Diluted earnings per share: Profit attributable to ordinary equity
holders $ 747,450
3,258,945
0.23
119
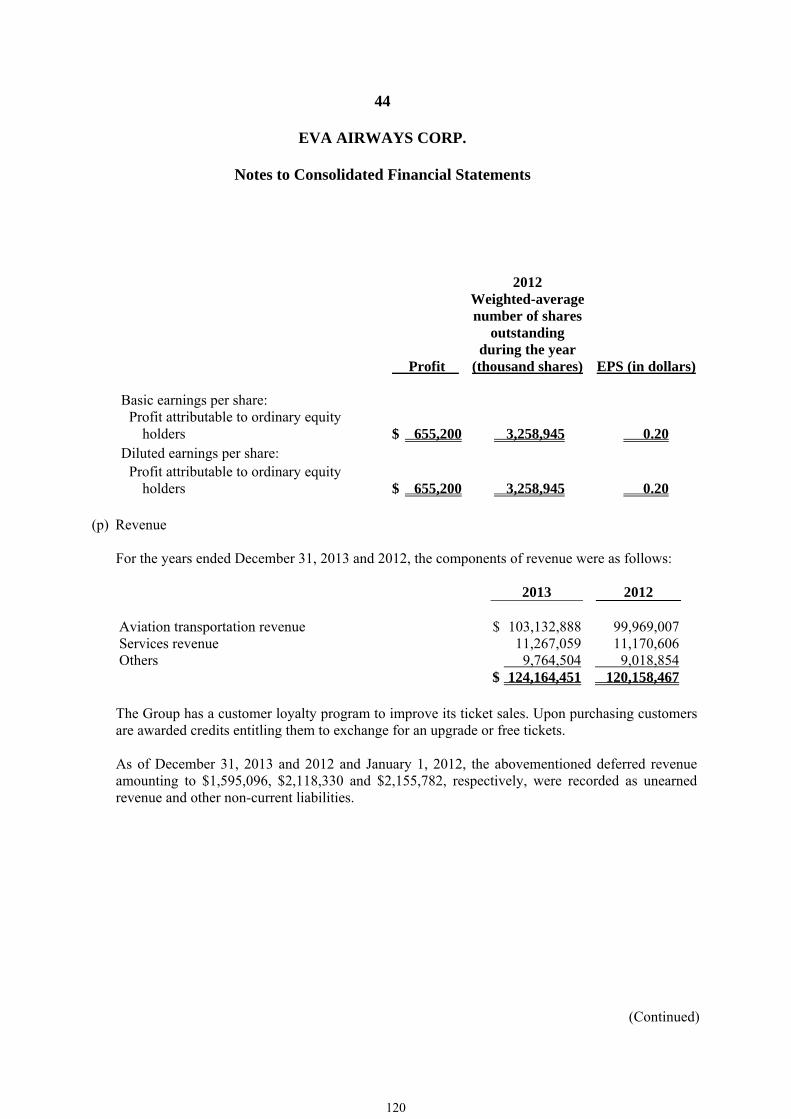
44
EVA AIRWAYS CORP.
Notes to Consolidated Financial Statements
(Continued)
2012
Profit
Weighted-average number of shares
outstanding during the year
(thousand shares) EPS (in dollars) Basic earnings per share:
Profit attributable to ordinary equity holders
$ 655,200
3,258,945
0.20
Diluted earnings per share: Profit attributable to ordinary equity
holders $ 655,200
3,258,945
0.20
(p) Revenue
For the years ended December 31, 2013 and 2012, the components of revenue were as follows:
2013 2012
Aviation transportation revenue $ 103,132,888 99,969,007Services revenue 11,267,059 11,170,606Others 9,764,504 9,018,854 $ 124,164,451 120,158,467
The Group has a customer loyalty program to improve its ticket sales. Upon purchasing customers are awarded credits entitling them to exchange for an upgrade or free tickets. As of December 31, 2013 and 2012 and January 1, 2012, the abovementioned deferred revenue amounting to $1,595,096, $2,118,330 and $2,155,782, respectively, were recorded as unearned revenue and other non-current liabilities.
120

45
EVA AIRWAYS CORP.
Notes to Consolidated Financial Statements
(Continued)
(q) Non-operating income and expenses
1. Other income
2013 2012
Interest income $ 251,299 203,262Dividend income 113,479 112,441Others 27,231 26,352 $ 392,009 342,055
2. Other gains and losses
2013 2012
Foreign exchange gains (losses) $ (260,584) 770,984Impairment losses (289,866) (289,350)Losses on disposal of property, plant and equipment (161,107) (34,940)Others 207,338 199,836 $ (504,219) 646,530
3. Finance costs
2013 2012
Interest expense
Bank borrowings $ 1,080,917 1,163,785Lease liabilities 345,713 415,674Others 236,657 216,160Less: capitalized interest (60,956) (11,281)
$ 1,602,331 1,784,338
121

46
EVA AIRWAYS CORP.
Notes to Consolidated Financial Statements
(Continued)
(r) Financial instruments
1. Type of financial instruments
(1) Financial assets
2013.12.31 2012.12.31 2012.1.1
Financial assets at fair value through profit
or loss $ 1,192
260,289
885
Derivative financial assets for hedge purposes $ 26,090 13,353 69,953Available-for-sale financial assets-current 2,059,740 2,180,986 2,551,236Available-for-sale financial assets-non-current 3,134,113 3,365,225 4,668,076Loans and receivables:
Cash and cash equivalents 24,898,172 22,083,330 17,470,319Notes and accounts receivable, and other
receivables (including related parties) 9,497,408
11,047,428
9,800,224
34,395,580 33,130,758 27,270,543Other non-current assets 1,237,210 1,136,313 1,848,748 $ 40,853,925 40,086,924 36,409,441
(2) Financial liabilities
2013.12.31 2012.12.31 2012.1.1
Financial liabilities at amortized cost:
Short-term borrowings $ 1,328,774 1,482,777 2,169,436Accounts payable (including related parties) 2,859,605 4,295,357 2,628,845Bonds payable 21,200,000 16,700,000 10,200,000Long-term borrowings (including current
portion of long-term liabilities) 46,933,625
54,382,207
61,795,998
Lease liabilities 6,957,087 8,882,533 10,525,724Other payables 10,800,328 9,382,282 9,155,862
$ 90,079,419 95,125,156 96,475,865
122
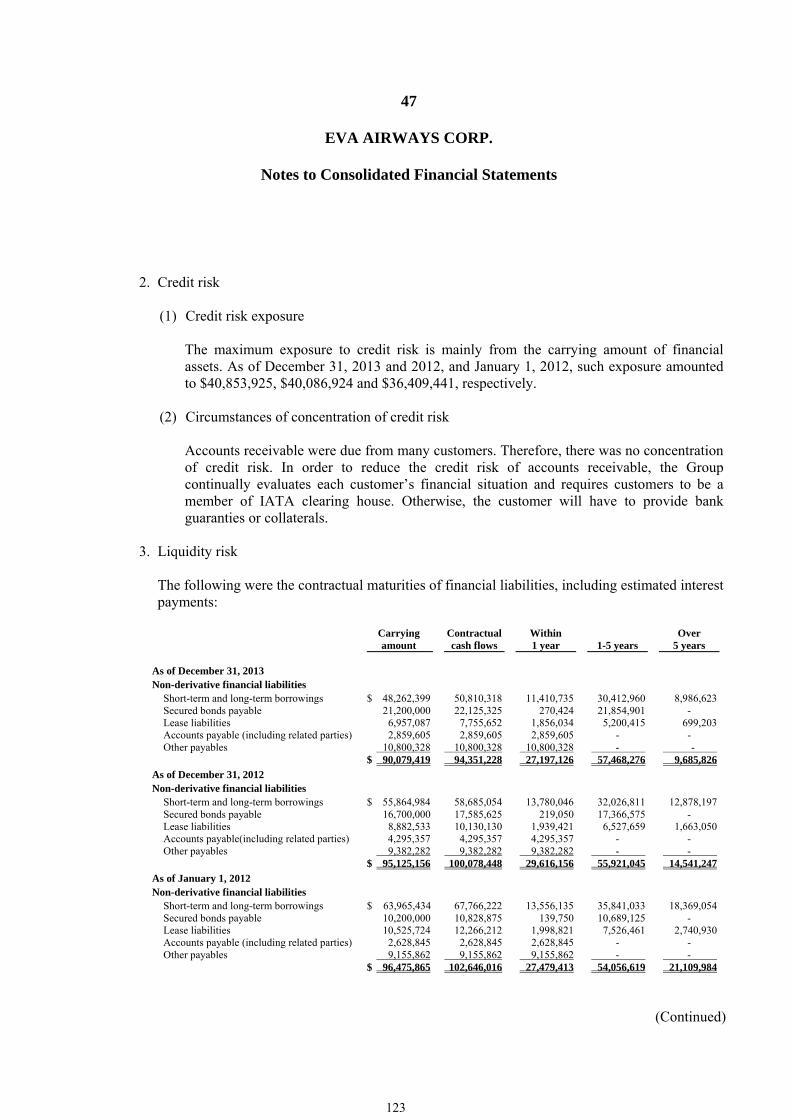
47
EVA AIRWAYS CORP.
Notes to Consolidated Financial Statements
(Continued)
2. Credit risk
(1) Credit risk exposure
The maximum exposure to credit risk is mainly from the carrying amount of financial assets. As of December 31, 2013 and 2012, and January 1, 2012, such exposure amounted to $40,853,925, $40,086,924 and $36,409,441, respectively.
(2) Circumstances of concentration of credit risk
Accounts receivable were due from many customers. Therefore, there was no concentration of credit risk. In order to reduce the credit risk of accounts receivable, the Group continually evaluates each customer’s financial situation and requires customers to be a member of IATA clearing house. Otherwise, the customer will have to provide bank guaranties or collaterals.
3. Liquidity risk The following were the contractual maturities of financial liabilities, including estimated interest payments:
Carrying
amount Contractualcash flows
Within 1 year
1-5 years
Over 5 years
As of December 31, 2013 Non-derivative financial liabilities
Short-term and long-term borrowings $ 48,262,399 50,810,318 11,410,735 30,412,960 8,986,623Secured bonds payable 21,200,000 22,125,325 270,424 21,854,901 - Lease liabilities 6,957,087 7,755,652 1,856,034 5,200,415 699,203Accounts payable (including related parties) 2,859,605 2,859,605 2,859,605 - - Other payables 10,800,328 10,800,328 10,800,328 - -
$ 90,079,419 94,351,228 27,197,126 57,468,276 9,685,826As of December 31, 2012 Non-derivative financial liabilities
Short-term and long-term borrowings $ 55,864,984 58,685,054 13,780,046 32,026,811 12,878,197Secured bonds payable 16,700,000 17,585,625 219,050 17,366,575 - Lease liabilities 8,882,533 10,130,130 1,939,421 6,527,659 1,663,050Accounts payable(including related parties) 4,295,357 4,295,357 4,295,357 - - Other payables 9,382,282 9,382,282 9,382,282 - -
$ 95,125,156 100,078,448 29,616,156 55,921,045 14,541,247As of January 1, 2012 Non-derivative financial liabilities
Short-term and long-term borrowings $ 63,965,434 67,766,222 13,556,135 35,841,033 18,369,054Secured bonds payable 10,200,000 10,828,875 139,750 10,689,125 - Lease liabilities 10,525,724 12,266,212 1,998,821 7,526,461 2,740,930Accounts payable (including related parties) 2,628,845 2,628,845 2,628,845 - - Other payables 9,155,862 9,155,862 9,155,862 - -
$ 96,475,865 102,646,016 27,479,413 54,056,619 21,109,984
123

48
EVA AIRWAYS CORP.
Notes to Consolidated Financial Statements
(Continued)
The Group is not expecting that the cash flows including the maturity analysis could occur significantly earlier or at significantly different amounts.
4. Currency risk
(1) Exposure to currency risk
The Group’s significant exposure to foreign currency risk was as follows:
2013.12.31 2012.12.31 2012.1.1
Foreign currency
Exchange NTD
Foreign currency
Exchange NTD
Foreign currency
Exchange NTD
(in thousands) rate (in thousands) rate (in thousands) rate Financial assets
Monetary items USD $ 210,637 29.805 6,278,036 218,333 29.04 6,340,394 128,151 30.28 3,879,764EUR 5,665 41.09 232,775 5,913 38.49 227,586 4,603 39.18 180,356JPY 672,612 0.2839 190,955 423,515 0.3364 142,471 421,111 0.3906 164,486HKD 216,691 3.84 832,744 240,418 3.75 900,848 199,684 3.90 778,168CNY 1,322,590 4.92 6,505,820 566,978 4.66 2,642,119 753,013 4.81 3,619,734
$ 14,040,330 10,253,418 8,622,508Financial liabilities
Monetary items USD $ 636,627 29.805 18,974,654 800,913 29.04 23,258,504 889,541 30.28 26,930,848EUR 9,526 41.09 391,423 7,878 38.49 303,208 6,550 39.18 256,642JPY 1,475,251 0.2839 418,824 1,242,389 0.3364 417,940 1,054,213 0.3906 411,776HKD 2,997 3.84 11,517 14,992 3.75 56,176 20,456 3.90 79,716CNY 293,241 4.92 1,442,452 238,621 4.66 1,111,972 162,644 4.81 781,829
$ 21,238,870 25,147,800 28,460,811
(2) Sensitivity analysis
The Group’s exposure to foreign currency risk arises from the translation of the foreign currency exchange gains and losses on cash and cash equivalents, notes receivable, accounts receivable (including related parties), available-for-sale financial assets-non-current, refundable deposits (included in other non-current assets), long-term borrowings, accounts payable (including related parties), other payables, lease liabilities and restoration obligations (included in other non-current liabilities) that are denominated in foreign currency. A 1% depreciation (appreciation) of the NTD against the USD, EUR, JPY, HKD and CNY as of December 31, 2013 and 2012, would have decreased (increased) the profit by $71,986 and $148,944 in 2013 and 2012, respectively. The analysis assumes that all other variables remain constant. The analysis is performed on the same basis for 2013 and 2012.
124

49
EVA AIRWAYS CORP.
Notes to Consolidated Financial Statements
(Continued)
(3) Interest rate risk
The liquidity risk and interest rate exposure of the Group’s financial liabilities are illustrated in note (s).
The following sensitivity analysis is based on the exposure to interest rate risk of the non-derivative financial instruments on the reporting date. For variable-rate instruments, the sensitivity analysis assumes the variable-rate liabilities are outstanding for the whole year on the reporting date. The Group’s internal department reported the increases/decreases in the interest rates and the exposure to changes in interest rates on 100 basis points to the Group’s key management so as to allow key management to assess the reasonableness of the changes in the interest rates.
If the interest rate increases (decreases) by 1% all other variable factors that remain constant, the profit of the Group will decrease (increase) $487,874 and $566,774 for the years ended December 31, 2013 and 2012, respectively due to the Group’s floating-interest borrowings.
(4) Fair value
(i) Fair value and carrying amount
Aside from those listed as follows, the Group’s management believes the carrying amounts of its financial assets and financial liabilities at amortized cost are approximately equal to their fair value.
2013.12.31 2012.12.31 2012.1.1 Carrying
amount
Fair valueCarrying amount
Fair value
Carrying amount
Fair value
Financial liabilities: Secured bonds payable $ 21,200,000 20,964,867 16,700,000 16,532,696 10,200,000 10,099,526Long-term borrowings 4,111,046 4,200,047 3,846,880 3,916,634 4,368,472 4,634,449Lease liabilities 1,830,499 1,886,325 2,905,535 3,070,120 3,708,809 4,003,664 $ 27,141,545 27,051,239 23,452,415 23,519,450 18,277,281 18,737,639
(ii) Valuation techniques and assumptions used in fair value determination
The Group uses the following methods in determining the fair value of its financial assets and liabilities:
A. The fair value of investments in securities of listed companies, with standard terms
and conditions which are traded in active markets, is based on quoted market price.
125

50
EVA AIRWAYS CORP.
Notes to Consolidated Financial Statements
(Continued)
B. The fair value of derivative instruments is based on quoted prices.
C. For all other financial assets and financial liabilities, the fair value is determined
using a discounted cash flow analysis based on expected future cash flows.
(iii) Interest rates used for determining fair value The interest rates used for discounting estimated cash flows were as follows:
2013 2012 Secured bonds payable 1.52% 1.58% Long-term borrowings 1.52%~1.64% 1.58%~1.65% Lease liabilities 1.52% 1.58%
(iv) Fair value hierarchy
The table below analyzes the financial instruments measured at fair value classified by measurement method. The definitions of fair value hierarchy levels are as follows:
− Level 1: quoted prices (unadjusted) in active markets for identified assets or
liabilities.
− Level 2: inputs other than quoted prices included within Level 1 that are observable for the asset or liability, either directly (i.e. as prices) or indirectly (i.e. derived from prices).
− Level 3: inputs for the asset or liability that are not based on observable market
data (unobservable inputs).
126

51
EVA AIRWAYS CORP.
Notes to Consolidated Financial Statements
(Continued)
Level 1 Level 2 Level 3 Total
As of December 31, 2013 Financial assets at fair value through
profit or loss $ 1,192
-
-
1,192
Available-for-sale financial assets 3,625,594 - 1,568,259 5,193,853Derivative financial assets - 26,090 - 26,090 $ 3,626,786 26,090 1,568,259 5,221,135 As of December 31, 2012 Financial assets at fair value through
profit or loss $ 260,289
-
-
260,289
Available-for-sale financial assets 3,602,475 - 1,943,736 5,546,211Derivative financial assets - 13,353 - 13,353 $ 3,862,764 13,353 1,943,736 5,819,853
As of January 1, 2012 Financial assets at fair value through
profit or loss $ 885
-
-
885
Available-for-sale financial assets 3,890,391 - 3,328,921 7,219,312Derivative financial assets - 69,953 - 69,953 $ 3,891,276 69,953 3,328,921 7,290,150
(v) Movements in fair value measurements of financial assets in Level 3 and sensitivity
analysis.
The following table shows reconciliation from the beginning balance to the ending balances for fair value measurements in Level 3 of the fair value hierarchy:
Unquoted equity instruments
Beginning balance at January 1, 2013 $ 1,943,736 Recognized in other comprehensive income (375,477) Balance at December 31, 2013 $ 1,568,259 Beginning balance at January 1, 2012 $ 3,328,921 Recognized in other comprehensive income (1,385,185) Balance at December 31, 2012 $ 1,943,736 The fair value hierarchy levels of financial assets were not transferred in 2013 and 2012.
127

52
EVA AIRWAYS CORP.
Notes to Consolidated Financial Statements
(Continued)
The fair value measurements of the Group’s financial instruments are reasonable; however, changes in the use of valuation models or valuation variables may affect the estimations. For fair value measurements in Level 3, fluctuation in the valuation variable by 5% would have the following effect:
Effects of changes in fair value on other comprehensive income Favorable Unfavorable
As of December 31, 2013
Available-for-sale financial assets $ 77,947 (77,947) As of December 31, 2012
Available-for-sale financial assets $ 96,732 (96,732)
The favorable and unfavorable effects represent the changes in fair value, and fair value is based on a variety of unobservable inputs calculated using a valuation technique. The analysis above only reflects the effects of changes in a single input, and it does not include the inter-relationships with another input.
(s) Management of financial risk
1. The Group is exposed to the nature and extent of the risks arising from financial instruments as below: a. Credit risk b. Liquidity risk c. Market risk Detailed information about exposure risk arising from the aforementioned risk and the Group’s objective, policies and process for managing risks have been stated below. Further quantitative disclosures have been disclosed as notes to the financial statements.
2. Risk management framework
The Group’s Board of Directors has responsibility for the oversight of the risk management framework. The Group’s inter-departmental management and committee, which consists of managers from all departments, is responsible for monitoring the Group’s risk management policies and reports regularly to the Board of Directors on its activities.
128

53
EVA AIRWAYS CORP.
Notes to Consolidated Financial Statements
(Continued)
The Group’s risk management policies are established to identify and analyze the risks faced by the Group, to set appropriate risk limits and controls, and to monitor risks and adherence to limits. The inter-department management and committee are reviewed regularly to reflect change in market conditions and the Group’s activities. The Group, through its training and management standards and procedures, aims to develop a disciplined and constructive control environment in which all employees understand their roles and obligations. The Group’s supervisors oversee how management monitors compliance with the Group’s risk management policies and procedures and reviews the adequacy of the risk management framework in relation to the risk faced by the Group. The Group’s supervisors are assisted in this oversight role by the internal auditor. The internal auditor reviews the risk controls and procedures, and reports the results on a regular or irregular basis to the supervisors.
3. Credit risk
Credit risk is the risk of financial loss to the Group if a customer or counterparty to financial instruments fails to meet its contractual obligations and arises principally from the Group’s receivables from customers and investments in securities. (1) Notes and accounts receivable
The Group’s exposure to credit risk is influenced mainly by the individual characteristic of each customer. In accordance with the Group’s credit policy, each customer is analyzed individually for creditworthiness, and is required to be a member of IATA clearing house. Otherwise, the customer will have to provide bank guarantees or collaterals before its credit terms and credit limit are offered. Credit limit is offered to each customer as the limit of transactions and is reviewed regularly. The transaction amount of the majority of the Group’s customers is not significant, leading to an insignificant influence of loss from credit risk arising from single customer on the Group. The Group set up the allowance for doubtful accounts to reflect the estimated loss of notes and accounts receivable. The major component of the allowance accounts includes the specific loss component related to individually significant exposure.
(2) Investments The credit risk exposure in the bank deposits, fixed income investments and other financial instruments are measured and monitored by the Group’s finance department. Since the Group’s transactions are with external parties with good credit standing, highly rated financial institutions, publicly traded stock companies and unlisted companies with good reputation, there are no non-compliance issues and therefore no significant credit risk.
129

54
EVA AIRWAYS CORP.
Notes to Consolidated Financial Statements
(Continued)
(3) Guarantees As of December 31, 2013, the Group did not provide guarantee.
4. Liquidity risk
Liquidity risk is a risk that the Group will encounter difficulty in meeting the obligations associated with its financial liabilities that are settled by delivering cash or another financial asset. The Group’s approach to managing liquidity risk is to ensure, as far as possible, that it always has sufficient liquidity to meet its liabilities when due, under both normal and stressed conditions, without incurring unacceptable losses or risking damage to the Group’s reputation.
The Group’s finance department monitors the needs for cash flows, and plans optional return from investments of idle capital. The Group aims to maintain the level of its cash and cash equivalents at an amount to cope with expected cash outflows on operation, including meeting its financial obligations. This excludes the potential impact of extreme circumstances that cannot reasonably be predicted, such as natural disasters.
5. Market risk
Market risk is the risk that changes in market prices, such as foreign exchange rates, interest rates and equity prices that will affect the Group’s income or the value of its holdings of financial instruments. The objective of market risk management is to manage and control market risk exposures within acceptable parameters, while optimizing the return.
(1) Currency risk
The Group is exposed to currency risk on sales, purchases and borrowings that are denominated in a currency other than the respective functional currencies of the Group entities primarily the TWD and USD. The currencies used in these transactions are principally denominated in TWD, CNY, EUR, USD and JPY.
The Group hedges its cash and cash equivalents, trade receivables from sales, trade payables to purchase and leases payments for aircraft denominated in a foreign currency. When necessary the Group uses foreign currency financing and forward exchange contracts to hedge its currency risk. The financial department proactively collects information of currency to monitor the trend of currency rate and keeps connection with the foreign currency department of banks to collect the market information for securing the currency risk.
130
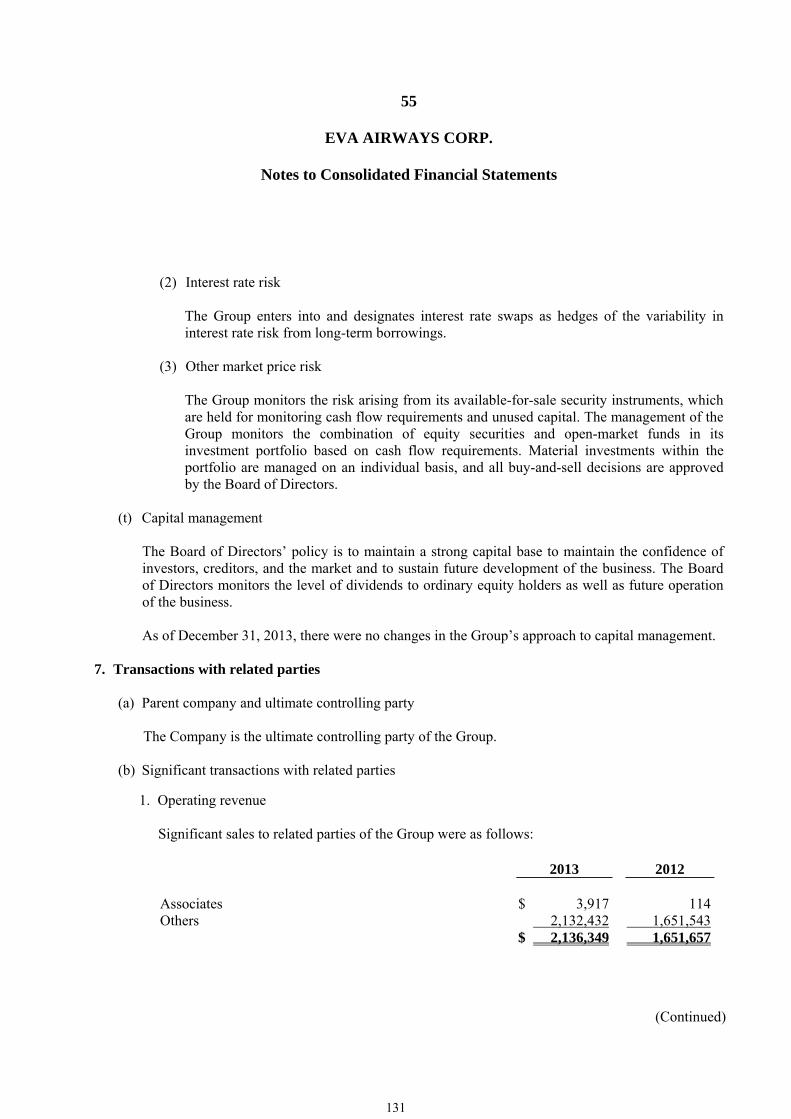
55
EVA AIRWAYS CORP.
Notes to Consolidated Financial Statements
(Continued)
(2) Interest rate risk
The Group enters into and designates interest rate swaps as hedges of the variability in interest rate risk from long-term borrowings.
(3) Other market price risk
The Group monitors the risk arising from its available-for-sale security instruments, which are held for monitoring cash flow requirements and unused capital. The management of the Group monitors the combination of equity securities and open-market funds in its investment portfolio based on cash flow requirements. Material investments within the portfolio are managed on an individual basis, and all buy-and-sell decisions are approved by the Board of Directors.
(t) Capital management
The Board of Directors’ policy is to maintain a strong capital base to maintain the confidence of investors, creditors, and the market and to sustain future development of the business. The Board of Directors monitors the level of dividends to ordinary equity holders as well as future operation of the business. As of December 31, 2013, there were no changes in the Group’s approach to capital management.
7. Transactions with related parties
(a) Parent company and ultimate controlling party
The Company is the ultimate controlling party of the Group.
(b) Significant transactions with related parties
1. Operating revenue
Significant sales to related parties of the Group were as follows:
2013 2012
Associates $ 3,917 114Others 2,132,432 1,651,543 $ 2,136,349 1,651,657
131

56
EVA AIRWAYS CORP.
Notes to Consolidated Financial Statements
(Continued)
Related parties leased aircraft from the Group to operate cross-strait flights between Mainland China and Taiwan. The rental is charged by actual flight hours and recorded under operating revenue.
The prices for sales to related parties are not materially different from those of the third-parties sales. The payment terms are within 1~3 months, which do not materially differ from those of third-party transactions. There was no collateral on the accounts receivable from related parties. Provisions for bad debt expenses were accrued properly after assessment.
2. Operating cost Significant purchases from related parties of the Group were as follows:
2013 2012 Associates $ 83,621 65,856Others 1,387,859 1,283,446 $ 1,471,480 1,349,302
The prices for purchases from related parties are not materially different from those of the third-party vendors. The payment terms are within 1~3 months, which do not materially differ from those of third-party transactions.
3. Operating expense
Operating expenses from transactions with related parties were as follows:
2013 2012
Associates $ 60,207 47,278Others 340,512 309,327 $ 400,719 356,605
The prices for related parties transactions are not materially different from those of the third- party vendors. The payment terms are within 1~3 months, which do not materially differ from those of third-party transactions.
4. The Group purchased spare parts for maintenance from related parties, amounting to $1,378,598
for the year ended December 31, 2013. There was no such transaction for the year ended December 31, 2012.
132

57
EVA AIRWAYS CORP.
Notes to Consolidated Financial Statements
(Continued)
5. Construction commitment
In February 2012, the Group entered into a contract amounting to $720,000 with related parties for the purpose of construction of its training center. As of December 31, 2013 and 2012, the unpaid contract price amounted to $198,598 and $460,080, respectively. In February 2013, the Group entered into a contract amounting to $191,625 with related parties for the purpose of expansion construction of the northeast station of Taiwan Taoyuan International Airport. As of December 31, 2013, the unpaid contract price amounted to $24,145.
6. Receivables from related parties
Receivables from related parties of the Group were as follows:
Account Class of related parties 2013.12.31 2012.12.31 2012.1.1 Accounts receivable Associates $ 300 - 24Accounts receivable Others 357,972 316,596 274,919Other receivables Associates 526 21 - Other receivables Others (note) 112,799 80,235 283,833 $ 471,597 396,852 558,776
As of December 31, 2013 and 2012, and January 1, 2012, $2,034, $30,544 and $29,435 were deducted respectively for the credit balance of investment accounted for using equity method. In addition, overdue accounts receivable were recorded as other receivables under other current assets.
Note: As of December 31, 2013 and 2012, and January 1, 2012, the overdue accounts
receivable were reclassified to other receivables. The aging for the abovementioned overdue accounts receivable were shown below:
2013.12.31
Aging for overdue accounts receivable
Name Amount Overdue
1-6 months Overdue
7-12 monthsOverdue
one year
Shanghai Airlines Cargo International Co., Ltd. $ 2,034 - - 2,034
133

58
EVA AIRWAYS CORP.
Notes to Consolidated Financial Statements
(Continued)
2012.12.31
Aging for overdue accounts receivable
Name Amount Overdue
1-6 monthsOverdue
7-12 months Overdue
one year
Shanghai Airlines Cargo International Co., Ltd. $ 19,625 - 1,882 17,743
2012.1.1
Aging for overdue accounts receivable
Name Amount Overdue
1-6 monthsOverdue
7-12 months Overdue
one year
Shanghai Airlines Cargo International Co., Ltd. $ 25,558 11,623 2,606 11,329Uni Airways Corporation 231,426 77,744 153,682 -
7. Payables to related parties
Payables to related parties of the Group were as follows:
Account Class of related parties 2013.12.31 2012.12.31 2012.1.1 Accounts payable Associates $ 4,995 8,010 2,756Accounts payable Others 224,588 121,026 111,918Other payables Associates 7,204 6,620 6,862Other payables Others 322,855 78,770 101,543 $ 559,642 214,426 223,079
(c) Key management personnel compensation
Key management personnel compensation comprised the following:
2013 2012 Short-term employee benefits $ 99,045 97,098 Post-employment benefits 9,729 5,384
$ 108,774 102,482
134

59
EVA AIRWAYS CORP.
Notes to Consolidated Financial Statements
(Continued)
8. Pledged assets
The book values of the pledged assets were as follows:
Pledged assets Object 2013.12.31 2012.12.31 2012.1.1 Property, plant, and
equipment Short-term and long-term
borrowings $ 53,739,219
60,797,450
69,583,124
Operating assets used for service concession arrangement-included in intangible assets
Long-term borrowings 1,618,416
1,727,957
1,837,497
Available-for-sale financial assets-non-current
Contract performance guaranties
89,274
100,070
121,090
Time deposit-included in other non-current assets
Letters of credit, customs duty, and contract performance guaranties
95,107
81,467
97,413
Inventories Long-term borrowings - - 500,033 $ 55,542,016 62,706,944 72,139,157
9. Commitments and contingencies
(a) Significant commitments: None.
(b) Significant contingencies:
1. In May 2012 and October 2013, the Group entered into aircraft purchase contracts with Boeing Company and four subsidiaries of GECAS for 7 Boeing 777 aircraft. The total amount of the contracts price is US$2,261,094. The Group has partially paid the price as follows:
2013.12.31 2012.12.31 2012.1.1
Advances for purchases of equipment-included
in other non-current assets $ 4,658,998
1,656,044
-
135
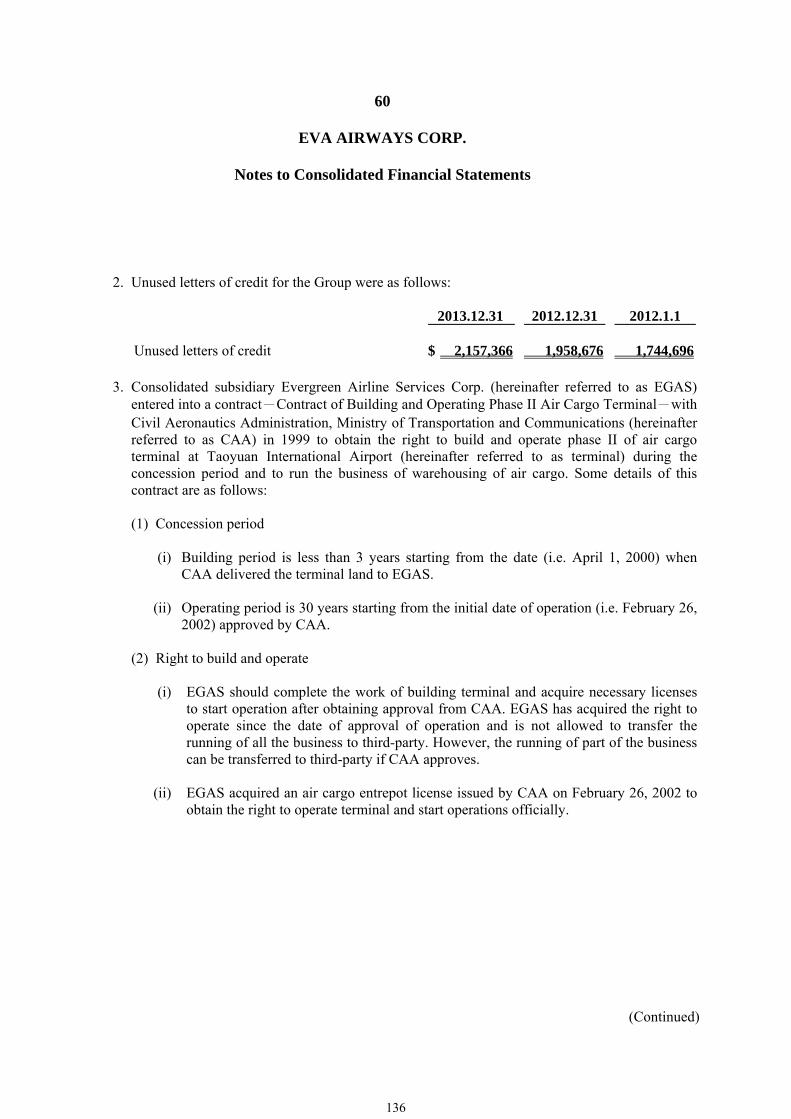
60
EVA AIRWAYS CORP.
Notes to Consolidated Financial Statements
(Continued)
2. Unused letters of credit for the Group were as follows:
2013.12.31 2012.12.31 2012.1.1 Unused letters of credit $ 2,157,366 1,958,676 1,744,696
3. Consolidated subsidiary Evergreen Airline Services Corp. (hereinafter referred to as EGAS)
entered into a contract-Contract of Building and Operating Phase II Air Cargo Terminal-with Civil Aeronautics Administration, Ministry of Transportation and Communications (hereinafter referred to as CAA) in 1999 to obtain the right to build and operate phase II of air cargo terminal at Taoyuan International Airport (hereinafter referred to as terminal) during the concession period and to run the business of warehousing of air cargo. Some details of this contract are as follows:
(1) Concession period
(i) Building period is less than 3 years starting from the date (i.e. April 1, 2000) when
CAA delivered the terminal land to EGAS.
(ii) Operating period is 30 years starting from the initial date of operation (i.e. February 26, 2002) approved by CAA.
(2) Right to build and operate
(i) EGAS should complete the work of building terminal and acquire necessary licenses
to start operation after obtaining approval from CAA. EGAS has acquired the right to operate since the date of approval of operation and is not allowed to transfer the running of all the business to third-party. However, the running of part of the business can be transferred to third-party if CAA approves.
(ii) EGAS acquired an air cargo entrepot license issued by CAA on February 26, 2002 to
obtain the right to operate terminal and start operations officially.
136

61
EVA AIRWAYS CORP.
Notes to Consolidated Financial Statements
(Continued)
(3) Royalty
EGAS should pay CAA royalties with the amount of a certain percentage (originally set at 6% before being adjusted to 6.10% on July 1, 2005 and adjusted subsequently to 6% in October 2008 until September 2014) of operating revenue, plus business tax, for each two-month period during the operating period. At the end of each accounting year, the adjustments will be made based on the differences between the amount of royalties EGAS has to pay, which is calculated as the total revenue (inclusive of operating revenue and non-operating income but exclusive of rental income from subletting operating facilities to Fedex) disclosed in the financial statements audited by the certified public accountants and multiplied by the aforementioned percentage, and adjusted by the amount of royalties EGAS has already paid during the same period. EGAS has to make up for the difference if the amount of royalties EGAS has to pay is more than those already paid; the difference will be deducted from the amount EGAS has to pay in the following period if the situation is the opposite.
(4) Transfer of assets at the end of concession period
At the end of concession period, the lease agreement of the land is terminated and the land has to be returned to the government. EGAS is allowed to transfer with remuneration to the government the operating assets, in their status quo at the end of concession period, whose addition has been approved by CAA during the 5-year period before the expiration of concession period. The operating assets (in their status quo at the end of concession period, and acquired prior to the 5-year period before the expiration of concession period) have to be transferred without remuneration to the government, unless otherwise agreed. The transferred object consists of all the operating assets as well as other assets necessary to operations which were acquired by building and operating in accordance with the concession contract during the concession period.
10. Significant disaster losses: none
11. Significant subsequent events: none
137

62
EVA AIRWAYS CORP.
Notes to Consolidated Financial Statements
(Continued)
12. Others
(a) A summary of employee expenses, depreciation and amortization expenses, by function, is as
follows:
2013 2012 Operating Operating Operating Operating
cost expenses Total cost expenses Total Personnel expenses
Salaries $ 7,868,561 3,722,995 11,591,556 7,138,286 3,409,134 10,547,420 Labor and health
insurance 546,710 223,747 770,457 491,016 196,674 687,690 Pension 474,518 168,651 643,169 437,919 152,031 589,950 Others 1,951,586 427,659 2,379,245 1,754,203 458,655 2,212,858
Depreciation (Note) 10,275,141 313,309 10,588,450 10,533,576 258,655 10,792,231 Amortization 130,660 103,181 233,841 125,263 56,870 182,133
Note: For the years ended December 31, 2013 and 2012, the depreciation expenses recognized were $10,723,866 and $10,927,647, respectively, less deferred gains of $135,416 and $135,416, respectively.
13. Operating segments (a) General information
The Group has three reportable segments: aviation transportation segment, maintenance segment, and catering service segment. Aviation transportation segment is involved in aviation transportation of passengers and cargo. Maintenance segment is involved in maintenance of aircraft, engine, and aircraft parts. Catering service segment is involved in provision of catering service.
Other operating segments are mainly involved in ground handling services, travel agency, distribution of cargo, and investment. For the years ended December 31, 2013 and 2012, the above segments do not meet the quantitative thresholds to be reportable.
138

63
EVA AIRWAYS CORP.
Notes to Consolidated Financial Statements
(Continued)
(b) Profit or loss data of the reportable segments (including specific revenues and expenses), assets and
liabilities of the reportable segments, the basis of measurement and the related eliminations
The Group allocates its resources and evaluates performance based on the internal management report, including profit before taxation but excluding any extraordinary activity and foreign exchange gains or losses, which is reviewed by chief operating decision maker. The reportable amount is the same as that in the report used by the chief operating decision maker. The accounting policies of operating segments are the same as those described in note 4 “significant accounting policies”. The Group treats intersegment sales and transfers as third-party transactions, which are measured at market price. The Group’s operating segment information and reconciliation are as follows:
2013 Aviation
transportationsegment
Maintenance
segment
Catering services segment
Other
segments
Reconciliation and
elimination
Total Revenue:
Revenue from external customers $ 110,539,919 12,043,278 478,260 1,180,480 (77,486) 124,164,451
Intersegment revenue 207,543 5,248,357 1,786,304 2,124,755 (9,366,959) -
Interest income 220,976 10,762 7,744 14,507 (2,690) 251,299
Net revenues $ 110,968,438 17,302,397 2,272,308 3,319,742 (9,447,135) 124,415,750Interest expense $ (1,465,130) (133,590) (6) (6,295) 2,690 (1,602,331)
Depreciation and amortization (10,042,734) (499,314) (52,976) (239,064) 11,797 (10,822,291)
Share of profit (loss) of associates accounted for using equity method 818,889 (5,085)
-
77,518
(806,762) 84,560
Other significant non-cash items:
Impairment loss - - - (289,866) - (289,866)
Reportable segment profit or loss $ 901,711 1,004,141 551,309 203,468 (820,291) 1,840,338Assets:
Investment accounted for using equity method
$ 10,686,982 234,964
-
320,519
(10,448,761) 793,704
Capital expenditures of non-current assets 4,680,806 266,868 139,540
420,051
- 5,507,265
Reportable segment assets $ 139,394,778 19,290,630 2,805,164 5,577,355 (14,344,993) 152,722,934Reportable segment liabilities $ 103,556,745 11,151,229 419,349 1,054,289 (3,716,039) 112,465,573
139

64
EVA AIRWAYS CORP.
Notes to Consolidated Financial Statements
(Continued)
2012 Aviation
transportation segment
Maintenance
segment
Catering services segment
Other
segments
Reconciliation and
elimination
Total Revenue:
Revenue from external customers $ 106,847,361 11,829,023 431,025 1,119,231 (68,173) 120,158,467
Intersegment revenue 300,446 6,177,812 1,495,358 2,012,205 (9,985,821) -
Interest income 181,810 4,041 6,868 24,902 (14,359) 203,262
Net revenues $ 107,329,617 18,010,876 1,933,251 3,156,338 (10,068,353) 120,361,729Interest expense $ (1,651,554) (126,316) (14) (20,813) 14,359 (1,784,338)
Depreciation and amortization (10,175,924) (535,241) (37,394) (219,185) (6,620) (10,974,364)
Share of profit (loss) of associates accounted for using equity method
990,688 (47)
- 68,173
(977,044) 81,770
Other significant non-cash items:
Impairment loss - - - (289,350) - (289,350)
Reportable segment profit or loss $ 754,023 1,256,581 438,888 241,150 (995,475) 1,695,167Assets:
Investment accounted for using equity method
$ 9,796,991 239,953
- 372,919
(9,643,455) 766,408
Capital expenditures of non-current assets
4,280,315 304,042 122,863 234,176
- 4,941,396
Reportable segment assets $ 142,293,950 19,033,524 2,420,106 6,772,979 (14,996,242) 155,524,317Reportable segment liabilities $ 106,926,028 11,715,674 361,100 1,567,578 (4,430,864) 116,139,516
(c) Entity-wide information
1. Information about the products and services
Since the reportable segments of the Group are presented by the products, services and revenue from external customers that are disclosed in 13(b), therefore, information about the products and services will not be disclosed in this paragraph.
2. Geographical information
In presenting information on the basis of geography, segment revenue is based on the geographical location of customers and segment assets that are based on the geographical location of the assets.
140

65
EVA AIRWAYS CORP.
Notes to Consolidated Financial Statements
(Continued)
Revenue from external customers: Geography 2013 2012
Taiwan $ 55,453,400 51,352,423Asia 37,561,459 38,568,646Europe 5,994,859 5,969,144North America 24,779,667 23,932,612Others 375,066 335,642 $ 124,164,451 120,158,467
Non-current assets: Geography 2013 2012
Taiwan $ 95,860,782 99,030,828Asia 209,375 205,821Others 36,586 18,160 $ 96,106,743 99,254,809
Non-current assets include property, plant and equipment, intangible assets, and other non-current assets, excluding financial instruments and deferred tax assets.
3. Information about revenue from major customers
The Group is involved in international aviation transportation with its major customers being the masses.
14. First-time adoption of IFRSs approved by the FSC
The Group’s consolidated financial statements as of December 31, 2012, were previously prepared in accordance with accounting principles generally accepted in the R.O.C. (R.O.C. GAAP). As described in note 4(a), the consolidated financial statements are the Group’s first annual consolidated financial statements prepared in accordance with the Regulations and the IFRSs approved by the FSC, and IFRS 1 First-time Adoption of International Financial Reporting Standards has been applied.
The accounting policies described in note 4 have been adopted when preparing the comparative consolidated financial statements for the year ended December 31, 2012, the balance sheet as of December 31, 2012, and the initial IFRS balance sheet as of January 1, 2012 (the Group’s conversion date).
141

66
EVA AIRWAYS CORP.
Notes to Consolidated Financial Statements
(Continued)
In preparing the financial statements for the year 2012, the Group has adjusted amounts reported previously in the financial statements prepared in accordance with R.O.C. GAAP. An explanation of how the transition to IFRSs approved by the FSC has affected the Group’s financial position, financial performance, and cash flows is set out in the following tables and the notes that accompany the tables. The adjustments of the consolidated balance sheets at December 31, 2012, and January 1, 2012 (the Group’s conversion date) and statement of comprehensive income for 2012 were as follows:
(a) Reconciliation of consolidated balance sheets items
2012.12.31 2012.1.1
ROC GAAP
Effect of transition to
IFRSs
IFRSs
ROC GAAP
Effect of transition to
IFRSs
IFRSs Assets
Cash and cash equivalents $ 22,083,330 - 22,083,330 17,470,319 - 17,470,319
Available-for-sale financial assets-current 2,180,986 - 2,180,986 2,551,236 - 2,551,236
Notes and accounts receivable, net (including related parties) 10,892,748
- 10,892,748 9,399,830
- 9,399,830
Inventories (1) 12,919,774 (3,810,292) 9,109,482 13,346,258 (3,965,851) 9,380,407
Other current assets (1), (2) 1,861,826 (638,552) 1,223,274 2,952,925 (1,507,209) 1,445,716
Total current assets 49,938,664 (4,448,844) 45,489,820 45,720,568 (5,473,060) 40,247,508
Available-for-sale financial assets-non-current (3) 789,564 2,575,661 3,365,225 709,758 3,958,318 4,668,076
Investments accounted for using equity method (4) 793,699 (27,291) 766,408 455,573 (38,457) 417,116
Financial assets carried at cost-non-current (3) 3,712,342 (3,712,342) - 4,059,110 (4,059,110) -
Property, plant and equipment (1), (5), (9) 87,779,979 6,965,790 94,745,769 94,857,339 6,334,968 101,192,307
Intangible assets (5), (7) 281,504 1,990,237 2,271,741 351,146 1,856,325 2,207,471
Deferred tax assets (2) 4,474,692 1,014,557 5,489,249 3,231,263 1,976,638 5,207,901
Other non-current assets (1), (7), (9) 1,496,131 1,899,974 3,396,105 2,010,955 (79,080) 1,931,875
Total non-current assets 99,327,911 10,706,586 110,034,497 105,675,144 9,949,602 115,624,746
Total assets $ 149,266,575 6,257,742 155,524,317 151,395,712 4,476,542 155,872,254Liabilities
Short-term borrowings $ 1,482,777 - 1,482,777 2,169,436 - 2,169,436
Accounts payable (including related parties) 4,295,357 - 4,295,357 2,628,845 - 2,628,845
Other current liabilities (6), (7) 32,298,772 784,543 33,083,315 31,436,549 309,033 31,745,582
Total current liabilities 38,076,906 784,543 38,861,449 36,234,830 309,033 36,543,863
Long-term borrowings (including bonds payable) 60,557,411 - 60,557,411 61,562,976 - 61,562,976
Deferred tax liabilities (2) - 285,336 285,336 - 52,886 52,886
Lease liability-non-current 7,335,153 - 7,335,153 9,003,131 - 9,003,131
Accrued employee retirement liabilities (7) 1,304,488 2,024,443 3,328,931 1,469,210 1,646,679 3,115,889
Other non-current liabilities (1), (6),(7), (8) 1,278,106 4,493,130 5,771,236 1,479,641 4,217,456 5,697,097
Total non-current liabilities 70,475,158 6,802,909 77,278,067 73,514,958 5,917,021 79,431,979
Total liabilities 108,552,064 7,587,452 116,139,516 109,749,788 6,226,054 115,975,842
Common stock 32,589,450 - 32,589,450 32,589,450 - 32,589,450
Capital surplus (4) 2,626,446 (902,844) 1,723,602 2,626,446 (902,844) 1,723,602
Retained earnings (1), (2), (4), (5), (6), (7), (8) 6,805,056 (4,909,580) 1,895,476 6,301,045 (4,629,297) 1,671,748
Other equity (1), (3), (7) (5,467,491) 4,626,885 (840,606) (3,643,666) 3,852,919 209,253
Total equity attributable to owners of parent 36,553,461 (1,185,539) 35,367,922 37,873,275 (1,679,222) 36,194,053
Non-controlling interests 4,161,050 (144,171) 4,016,879 3,772,649 (70,290) 3,702,359
Total equity 40,714,511 (1,329,710) 39,384,801 41,645,924 (1,749,512) 39,896,412
Total liabilities and equity $ 149,266,575 6,257,742 155,524,317 151,395,712 4,476,542 155,872,254
142

67
EVA AIRWAYS CORP.
Notes to Consolidated Financial Statements
(Continued)
(b) Reconciliation of consolidated statement of comprehensive income items 2012
ROC GAAP
Effect of Transition to
IFRSs
IFRSs Operating revenue (6) $ 120,121,016 37,451 120,158,467Operating cost (1), (5), (7), (8) (108,536,251) (719,256) (109,255,507)Gross profit from operations 11,584,765 (681,805) 10,902,960Operating expenses (5), (7) (8,589,393) 95,583 (8,493,810)Net operating income 2,995,372 (586,222) 2,409,150Non-operating income and expenses:
Other income 342,055 - 342,055Other gains and losses (1) (206,062) 852,592 646,530Finance costs (1) (1,740,334) (44,004) (1,784,338)Share of profit of associates accounted for using equity method (4) 79,842 1,928 81,770
Profit before tax 1,470,873 224,294 1,695,167Income tax expenses (2) (429,790) (69,690) (499,480)Profit 1,041,083 154,604 1,195,687Other comprehensive income:
Exchange differences on translation of foreign financial statements (2,155,050) 2,074,855 (80,195)Unrealized gains (losses) on available-for-sale financial assets 110,085 (1,035,888) (925,803)Cash flow hedges (56,600) - (56,600)Net loss not recognized as pension cost (85,471) 85,471 - Actuarial losses on defined benefit plans (11) - (584,771) (584,771)Share of other comprehensive income of associates (11) - (699) (699)Income tax relating to components of other comprehensive 380,738 (273,771) 106,967
Other comprehensive income, net of tax (1,806,298) 265,197 (1,541,101)Comprehensive income $ (765,215) 419,801 (345,414)Profit attributable to :
Owners of parent $ 504,011 151,189 655,200Non-controlling interests 537,072 3,415 540,487
$ 1,041,083 154,604 1,195,687Comprehensive income attributable to:
Owners of parent $ (1,319,814) 493,683 (826,131)Non-controlling interests 554,599 (73,882) 480,717
$ (765,215) 419,801 (345,414)Earnings per common share
Basic earnings per share (dollars) $ 0.15 0.05 0.20Diluted earnings per share (dollars) $ 0.15 0.05 0.20
143

68
EVA AIRWAYS CORP.
Notes to Consolidated Financial Statements
(Continued)
(c) Reconciliation of consolidated statement of cash flows:
There are no significant differences between R.O.C. GAAP and IFRSs approved by the FSC in the consolidated statement of cash flows.
(d) Explanation of reconciliation of significant differences:
1. The Group performs inspections or overhaul for the property, plant and equipment project
periodically. Major inspection or overhaul cost is recognized in the carrying amount of the item of property, plant and equipment as a replacement if the recognition criteria are met. In addition, the remaining carrying amount of the cost of previous inspection or overhaul should be derecognized. If the inspection or overhaul cost has not been separately identified when the asset was acquired or constructed, the estimated cost of a similar inspection or overhaul may be used as an indication of the existing inspection component. A provision is recognized if, as a result of a past event, the Group has a present obligation that can be estimated reliably, and it is probable that an outflow of economic benefits will be required to settle the obligation. Provisions are determined by discounting the expected future cash flows if the impact of time value of money is significant. Also, the IFRSs approved by the FSC do not include regulations of Decree No. 01666, which regards the fleet obtained via its own USD dollar funds and USD dollar loans and operated for international transportation of passengers and cargo as foreign operating units. Based on the aforementioned regulations, the Group made adjustments in inventories, other current assets, property, plant and equipment, other non-current assets, other non-current liabilities, retained earnings, and other equity as of December 31 and January 1, 2012. Also, the Group made adjustments in operating cost, interest expense, and foreign exchange gains (losses) for the year ended December 31, 2012.
2. The Group recognizes the taxable loss, income tax credit, and temporary differences as deferred tax assets or liabilities, which are classified as non-current, to the extent that it is probable that there will be taxable income available in the future. The reclassification has no effect on the statement of comprehensive income for the year ended December 31, 2012, as well as the equity as of December 31 and January 1, 2012. As of December 31 and January 1, 2012, the Group remeasured temporary differences and adjusted the presentation of accounts, including other current assets, deferred tax assets, deferred tax liabilities, and retained earnings, in accordance with the IFRSs approved by the FSC. In addition, the Group made adjustments in the income tax expense for the year ended December 31, 2012.
3. The Group measures its financial assets by reference to the quoted price in the active market,
which is deemed to be best evidence of the fair value of financial assets. If the market of financial assets is not active, the fair value is determined by using valuation techniques. The Group made adjustments in available-for-sale financial assets-non-current, financial assets carried at cost-non-current, and other equity as of December 31 and January 1, 2012.
144

69
EVA AIRWAYS CORP.
Notes to Consolidated Financial Statements
(Continued)
4. The variation in the proportion of share equity arising from the additional share issuance by
affiliates in which the original shareholders do not acquire new shares proportionately was recognized as profit or loss. In addition, the IFRSs approved by the FSC do not include the regulations, which are included in Decree No. 045, requiring that capital surplus be recognized for the donated fixed assets. Due to the aforementioned regulations, the Group made adjustments in investment accounted for using equity method, capital surplus, and retained earnings as of December 31 and January 1, 2012. Also, the Group made adjustments in the share of profit of associates accounted for using equity method for the year ended December 31, 2012.
5. The Group recognizes the cost of terminal construction, which is directly relevant to operating
activities of terminal and which has to be transferred without remuneration to the government at the end of concession period, as intangible asset - operating concession. Due to the aforementioned regulations, the Group made adjustments in property, plant and equipment, intangible asset, and retained earnings as of December 31 and January 1, 2012. Also, the Group made adjustments in operating cost and operating expense for the year ended December 31, 2012.
6. The Group’s customer loyalty program, whereby customers are awarded credits known as points
at the timing of sale in exchange for free or discounted goods or services in the future, includes several identifiable components. The Group sells two items to its customers: goods or services and the points. The Group should estimate and defer the corresponding fair value of the points based on experience of the probability of redemption, and the revenue would not be recognized until the customers exercise their conversion in the future. The Group made adjustments in other current liabilities, other non-current liabilities, and retained earnings as of December 31 and January 1, 2012. Also, the Group made adjustments in operating revenue for the year ended December 31, 2012.
7. Based on the expected additional expenditures incurred by accumulated but unexercised rights of leave, the Group measures the expected cost of accumulating compensated absences. Besides, when the actuarial gains and losses of pension occur, the actuarial gains and losses for the period shall immediately be recognized as other comprehensive income. The Group made adjustments in intangible assets, other current liabilities, accrued pension liabilities, other non-current liabilities, retained earnings, and other equity as of December 31 and January 1, 2012. Also, the Group made adjustments in operating cost and operating expenses for the year ended December 31, 2012.
8. The gains (losses) from sale of Group’s sale and leaseback transactions, whose sale price is fair
value, should be immediately recognized. The Group made adjustments in other non-current liabilities and retained earnings as of December 31 and January 1, 2012. Also, the Group made adjustments in operating cost for the year ended December 31, 2012.
145

70
EVA AIRWAYS CORP.
Notes to Consolidated Financial Statements
9. The Group’s advances for purchases of equipment should be classified as long-term prepayments according to its nature. The Group reclassified property, plant and equipment as other non-current assets in accordance with the regulations. The reclassification has no impact on the statement of comprehensive income for the year ended December 31, 2012, as well as the equity as of December 31 and January 1, 2012.
10. The Group made adjustments in non-controlling interests for all the aforementioned issues.
11. In accordance with previous GAAP, the Group recognized actuarial gains (losses) as profit or
loss based on the residual period of service. At the conversion date, the Group recognized all the previously unrecognized accumulated actuarial gains (losses) as retained earnings in accordance with IFRS 1 First-time adoption of International Financial Reporting Standards. In addition, the Group designated the investment in securities of non-publicly listed companies as available-for-sale financial assets at the conversion date.
146
EVA AIRWAYS CORP. Parent-Company-Only Financial Statements
December 31, 2013 and 2012 (With Independent Auditors' Report Thereon)
Address: No. 376 Hsin-nan Road, Sec. 1, Luchu, Taoyuan Hsien, Taiwan
Telephone No.: 886(03)3515151
147

Note to Readers The accompanying parent-company-only financial statements are intended only to present the financial position, financial performance and cash flows in accordance with the “Regulations Governing the Preparation of Financial Reports by Securities Issuers”. The standards, procedures and practices to audit such financial statements are those generally accepted and applied in the Republic of China. The auditors’ report and the accompanying financial statements are the English translation of the Chinese version prepared and used in the Republic of China. If there is any conflict between, or any difference in the interpretation of, the English and Chinese language auditors’ report and financial statements, the Chinese version shall prevail.
Independent Auditors’ Report The Board of Directors EVA Airways Corp.: We have audited the balance sheets of EVA Airways Corp. (the “Company”) as of December 31, 2013 and 2012, and January 1, 2012 and the related statements of comprehensive income, changes in equity, and cash flows for the years ended December 31, 2013 and 2012. These parent-company-only financial statements are the responsibility of the Company’s management. Our responsibility is to express an opinion on these financial statements based on our audits. We conducted our audits in accordance with the “Regulations Governing Auditing and Certification of Financial Statements by Certified Public Accountants” and auditing standards generally accepted in the Republic of China. Those regulations and standards require that we plan and perform the audit to obtain reasonable assurance about whether the parent-company-only financial statements are free of material misstatement. An audit includes examining, on a test basis, evidence supporting the amounts and disclosures in the parent-company-only financial statements. An audit also includes assessing the accounting principles used and significant estimates made by management, as well as evaluating the overall parent-company-only financial statement presentation. We believe that our audits provide a reasonable basis for our opinion. In our opinion, the parent-company-only financial statements referred to in the first paragraph present fairly, in all material respects, the financial position of the Company as of December 31, 2013 and 2012, and January 1, 2012, and its financial performance and cash flows for the years ended December 31, 2013 and 2012, in conformity with the “Regulations Governing the Preparation of Financial Reports by Securities Issuers”. Taipei, Taiwan (the Republic of China) March 25, 2014
148

149

See accompanying notes to financial statements.
EVA AIRWAYS CORP.
Statements of Comprehensive Income
For the years ended December 31, 2013 and 2012 (Expressed in Thousands of New Taiwan Dollars, except Earnings per Common Share)
2013 2012 Operating revenue (notes 6(p) and 7) $ 110,747,462 107,147,807 Operating cost (notes 6(c), 6(e), 6(g), 6(h), 6(k), 6(l) and 7): 100,462,866 99,072,134
Gross profit from operations 10,284,596 8,075,673 Operating expenses (notes 6(d), 6(g), 6(k), 6(l) and 7): 8,696,343 7,879,566
Net operating income 1,588,253 196,107 Non-operating income and expenses:
Other income (note 6(q)) 334,408 294,203 Other gains and losses (note 6(q)) (374,709) 924,579 Finance costs (note 6(q)) (1,465,130) (1,651,554) Share of profit of subsidiaries and associates accounted
for using equity method (note 6(f)) 818,889 990,688 Total non-operating income and expenses (686,542) 557,916
Profit before tax 901,711 754,023 Income tax expenses (note 6(m)) (154,261) (98,823) Profit 747,450 655,200 Other comprehensive income (notes 6(c), 6(l), 6(m) and 6(n)):
Exchange differences on translation of foreign financial statements 39,242 (74,679)
Unrealized gains (losses) on available-for-sale financial assets 200,421 (174,450) Cash flow hedges 12,737 (56,600) Actuarial losses on defined benefit plans (458,502) (301,261) Share of other comprehensive income of subsidiaries
and associates (146,797) (933,111) Income tax relating to components of other comprehensive
income 75,560 58,770 Other comprehensive income, net of tax (277,339) (1,481,331) Comprehensive income $ 470,111 (826,131)
Basic earnings per share (in New Taiwan Dollars) (note 6(o)) $ 0.23 0.20 Diluted earnings per share (in New Taiwan Dollars (note 6(o)) $ 0.23 0.20
150

151
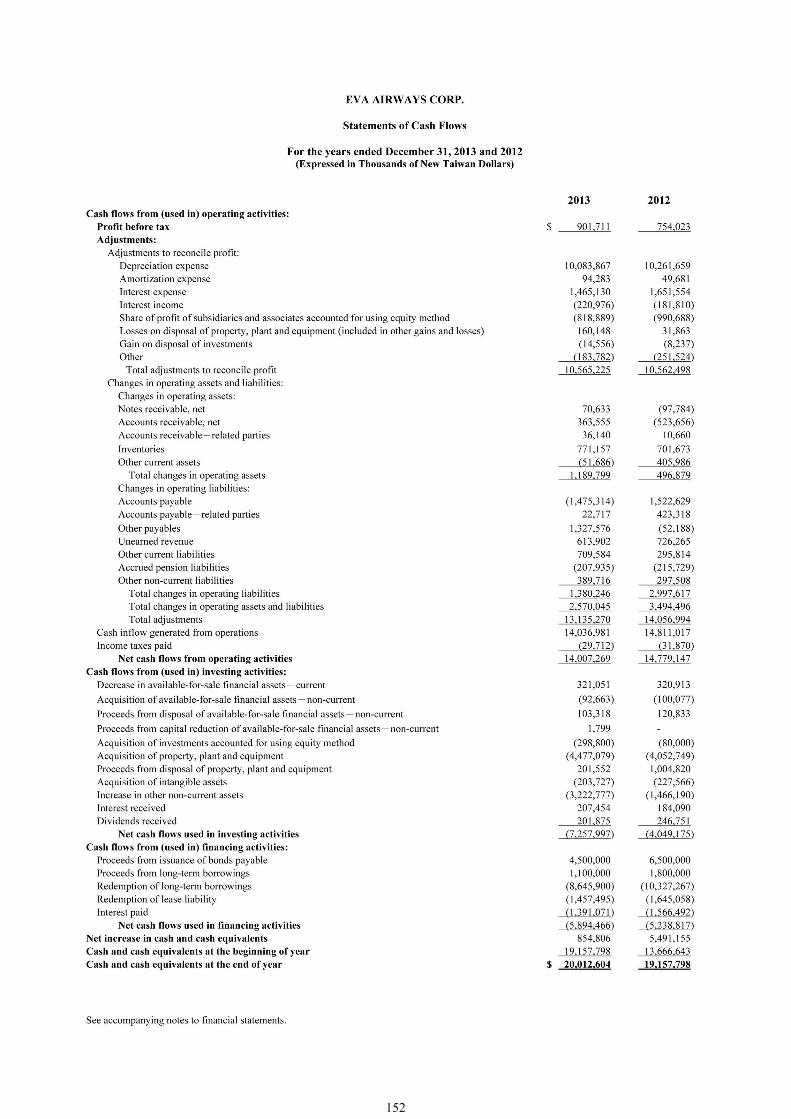
152

(Continued)
EVA AIRWAYS CORP.
Notes to Parent-Company-Only Financial Statements
December 31, 2013 and 2012
(Expressed in Thousands of New Taiwan Dollars Unless Otherwise Specified)
1. Organization and business scope
EVA Airways Corp. (the Company) was incorporated on April 7, 1989, as a corporation limited by shares under special permission of the Republic of China (R.O.C.) Ministry of Transportation and Communications. The address of the Company’s registered office is No. 376 Hsin-nan Road, Sec. 1, Luchu, Taoyuan County, Taiwan.
The Company’s business activities are 1.1 civil aviation transportation;
1.2 to carry out any business which is not forbidden or restricted by the applicable laws and
regulations, excluding those requiring licensing.
2. Approval date and procedures of the financial statements
The parent-company-only financial statements were authorized for issuance by the Company’s Board of Directors as of March 25, 2014.
3. New standards and interpretations not yet adopted
(a) New standards and interpretations approved by the R.O.C. Financial Supervisory Commission
(“FSC”) but not yet in effect. International Accounting Standards Board (“IASB”) issued International Financial Reporting Standard 9 Financial instruments (“IFRS 9”), which takes effect as of January 1, 2013 (In December 2011, IASB postponed the effective date of IFRS 9 to January 1, 2015; however, in November 2013, IASB cancelled the announcement mentioned above to allow the preparation of financial statements to have sufficient time to be converted into the new standard). This standard had been approved by the FSC; however, the effective date has not been announced. In accordance with the rules by the FSC, early adoption is not permitted, and companies shall follow the guidance in the 2009 version of International Accounting Standards 39 Financial instruments (“IAS 39”). Upon the adoption of this new standard, it is expected there will be significant impacts on the classification and measurement of financial instruments in the parent-company-only financial statements.
153
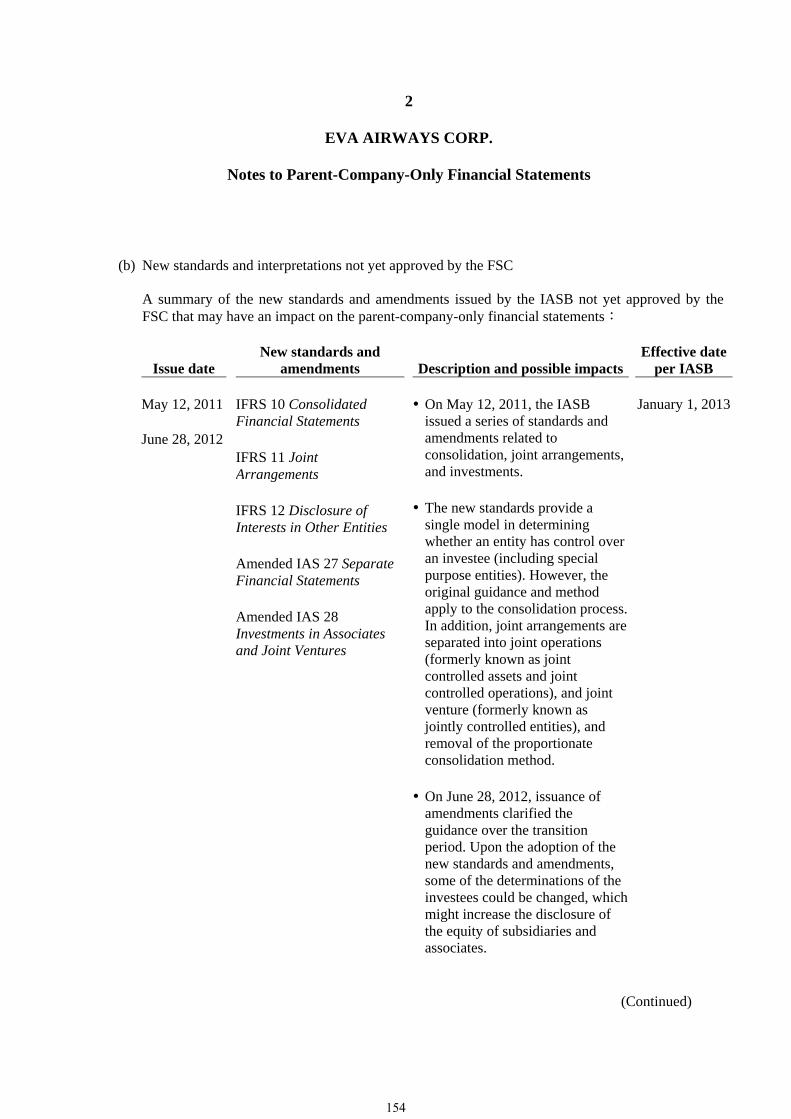
2
EVA AIRWAYS CORP.
Notes to Parent-Company-Only Financial Statements
(Continued)
(b) New standards and interpretations not yet approved by the FSC A summary of the new standards and amendments issued by the IASB not yet approved by the FSC that may have an impact on the parent-company-only financial statements:
Issue date New standards and
amendments Description and possible impacts Effective date
per IASB May 12, 2011 June 28, 2012
IFRS 10 Consolidated Financial Statements IFRS 11 Joint Arrangements IFRS 12 Disclosure of Interests in Other Entities Amended IAS 27 Separate Financial Statements Amended IAS 28 Investments in Associates and Joint Ventures
On May 12, 2011, the IASB issued a series of standards and amendments related to consolidation, joint arrangements, and investments.
The new standards provide a
single model in determining whether an entity has control over an investee (including special purpose entities). However, the original guidance and method apply to the consolidation process. In addition, joint arrangements are separated into joint operations (formerly known as joint controlled assets and joint controlled operations), and joint venture (formerly known as jointly controlled entities), and removal of the proportionate consolidation method.
On June 28, 2012, issuance of
amendments clarified the guidance over the transition period. Upon the adoption of the new standards and amendments, some of the determinations of the investees could be changed, which might increase the disclosure of the equity of subsidiaries and associates.
January 1, 2013
154

3
EVA AIRWAYS CORP.
Notes to Parent-Company-Only Financial Statements
(Continued)
Issue date New standards and
amendments Description and possible impacts Effective date
per IASB May 12, 2011 IFRS 13 Fair Value
Measurement Replaces fair value measurement guidance in other standards, and consolidates as one single guidance. Adoption of the new standard may have an impact on the measurement on certain assets and liabilities. In addition, this amendment might increase the disclosure of fair value.
January 1, 2013
June 16, 2011 Amended IAS 1 Presentation of Financial Statements
Items presented in other comprehensive income shall be based on whether they are potentially reclassifiable to profit or loss subsequently. Adoption of the amendment will change the presentation of other comprehensive income in the statement of comprehensive income.
July 1, 2012
June 16, 2011 Amended IAS 19 Employee Benefits
Eliminates of the corridor method and eliminates the option to recognize changes in the net defined benefit liability (asset) in profit or loss; in addition, requires the immediate recognition of past service cost. Adoption of the amendment will change the presentation and the measurement of accrued pension liabilities and actuarial gains (losses) on defined benefit plans.
January 1, 2013
November 19, 2013
Amended IFRS 9 Financial Instruments
Adopts more principle-based regulation, including amending regulations governing the achievement, continuation and discontinuation of the adoption of hedge accounting so that hedge accounting is closer to risk management, and therefore, more exposures can meet the criteria of hedged items.
Not yet adopted(early adoption
is permitted)
155

4
EVA AIRWAYS CORP.
Notes to Parent-Company-Only Financial Statements
(Continued)
Issue date New standards and
amendments Description and possible impacts Effective date
per IASB
Adoption of the amendment may increase the transactions adopting hedge accounting and will change the measurement and presentation of related hedging instruments and hedged items.
May 28, 2010 Amended IFRS 9 Financial Instruments
Amendments of the new regulations related to classification and measurement of financial liabilities at fair value through profit or loss and includes the regulations of IFRS 39 Financial Instrument.
Not yet adopted(early adoption
is permitted)
December16, 2011
Amended IFRS 7 Financial Instruments: Disclosures Amended IAS 32 Financial Instruments: Presentation
Amends regulations of offsetting financial assets and financial liabilities, which provide more guidance about judgments, and related disclosures.
January 1, 2014Presentation January 1, 2013Disclosure
December16, 2011
Amended IFRS 7 Financial Instruments: Disclosures Amended IFRS 9 Financial Instruments
Amends regulations of the mandatory effective date of adoption, which is postponed to January 1, 2015 from January 1, 2013, and transition disclosure. However, in November 2013 IASB cancelled the announcement mentioned above to allow the preparation of financial statements to have sufficient time to be converted into new standard. Adoption of the new standard may have an impact on the measurement on certain assets and liabilities. In addition, amendment might increase the disclosure of fair value.
Not yet adopted(early adoption
is permitted)
156

5
EVA AIRWAYS CORP.
Notes to Parent-Company-Only Financial Statements
(Continued)
4. Summary of significant accounting policies
The parent-company-only financial statements are the English translation of the Chinese version prepared and used in the R.O.C. If there is any conflict between, or any difference in the interpretation of, the English and Chinese language financial statements, the Chinese version shall prevail.
The significant accounting policies have been applied consistently to all periods presented in these financial statements, except when otherwise indicated. These financial statements include the balance sheet as of January 1, 2012, prepared for the purpose of the first-year adoption of the Regulations Governing the Preparation of Financial Reports by Securities Issuers and International Financial Reporting Standards, International Accounting Standards (IAS), IFRIC Interpretations, and Standard Interpretations Committee (SIC) Interpretations approved by the FSC (hereinafter referred to as the IFRSs, approved by the FSC).
The significant accounting policies presented in the parent-company-only financial statements are summarized as follows: (a) Statement of compliance
These parent-company-only financial statements are the Company’s first annual parent-company-only financial statements prepared in accordance with the “Regulations Governing the Preparation of Financial Reports by Securities Issuers” (hereinafter referred to as the Regulations).
(b) Basis of preparation
1. Basis of measurement
The parent-company-only financial statements have been prepared on a historical cost basis except for the following material items in the balance sheet:
(1) Available-for-sale financial assets are measured at fair value;
(2) Hedging derivative financial instruments are measured at fair value; and
(3) The defined benefit liability is recognized as unrecognized actuarial gain and the present
value of the defined benefit obligation less plan assets, plus unrecognized prior service cost and unrecognized actuarial loss.
157

6
EVA AIRWAYS CORP.
Notes to Parent-Company-Only Financial Statements
(Continued)
2. Functional and presentation currency
The functional currency of the Company is determined based on the primary economic environment in which the Company operates. The parent-company-only financial statements are presented in New Taiwan Dollar (NTD), which is the Company’s functional currency. All financial information presented in NTD has been rounded to the nearest thousand.
(c) Foreign currency
1. Foreign currency transactions
Transactions in foreign currencies are translated to the respective functional currencies of the Company at the exchange rates of the dates of the transactions. Monetary assets and liabilities denominated in foreign currencies at the reporting date are retranslated to the functional currency at the exchange rate of that date. The foreign currency gains or losses on monetary items is the difference between the amortized cost in the functional currency at the beginning of the year adjusted for the effective interest and the payments during the period, and the amortized cost in foreign currency translated at the exchange rate at the reporting date.
Non-monetary assets and liabilities denominated in foreign currencies that are measured at fair value are retranslated to the functional currency at the exchange rate of the date the fair value was determined. Non-monetary items in a foreign currency that are measured based on historical cost are translated using the exchange rate at the date of transactions.
Foreign currency differences arising from retranslation are recognized in profit or loss, except for the following differences which are recognized in other comprehensive income that arise from the retranslation:
available-for-sale equity investment; financial liability designated as a hedge of the net investment in a foreign operation to the
extent that the hedge is effective; or qualifying cash flow hedges to the extent the hedge is effective.
2. Foreign operations
The assets and liabilities of foreign operations, including goodwill and fair value adjustments arising on acquisition, are translated to the Company’s functional currency at the exchange rates of the reporting date. The income and expenses of foreign operations, excluding foreign operations in hyperinflationary economies, are translated to the Company’s functional currency at average rate. Foreign currency differences are recognized in other comprehensive income.
158

7
EVA AIRWAYS CORP.
Notes to Parent-Company-Only Financial Statements
(Continued)
When a foreign operation is disposed of such that control, significant influence or joint control is lost, the cumulative amount in the translation reserve related to that foreign operation is reclassified to profit or loss as part of the gain or loss on disposal. When the Company disposes of any part of its interest in a subsidiary that includes a foreign operation while retaining control, the relevant proportion of the cumulative amount is reattributed to non-controlling interest. When the Company disposes of only part of investment in an associate of joint venture that includes a foreign operation while retaining significant or joint control, the relevant proportion of the cumulative amount is reclassified to profit or loss. When the settlement of a monetary item receivable from or payable to a foreign operation is neither planned nor likely predicted in the foreseeable future, the foreign currency gains and losses arising from such items are considered as a part of investment in the foreign operation and are recognized in other comprehensive income.
(d) Classification of current and non-current assets and liabilities
The Company classifies an asset as current when: (i) It expects to realize the asset, or intends to sell or consume it, in its normal operating cycle; (ii) It holds the asset primarily for the purpose of trading; (iii) It expects to realize the asset within twelve months after the reporting period; or (iv) The asset is cash or a cash equivalent unless the asset is restricted from being exchanged or
used to settle a liability for at least twelve months after the reporting period. The Company classifies all other assets as non-current. The Company classifies a liability as current when: (i) It expects to settle the liability in its normal operating cycle; (ii) It holds the liability primarily for the purpose of trading; (iii) The liability is due to be settled within twelve months after the reporting period; or (iv) It does not have an unconditional right to defer settlement of the liability for at least twelve
months after the reporting period. Terms of a liability that could, at the option of the counterparty, result in its settlement by the issuance of equity instruments that do not affect its classification.
The Company classifies all other liabilities as non-current.
159

8
EVA AIRWAYS CORP.
Notes to Parent-Company-Only Financial Statements
(Continued)
(e) Cash and cash equivalents
Cash and cash equivalents comprise cash, demand deposits, and call deposits that are subject to an insignificant risk of changes in their fair value, and are used by the Company in the management of its short-term commitments. Time deposits with maturities of one year or less from the acquisition date that are held for the purpose of meeting short-term cash commitments rather than for investment or other purposes, and that are subject to an insignificant risk of changes in their fair value are recognized as cash and cash equivalents.
(f) Financial instruments
Financial assets and financial liabilities are initially recognized when the Company becomes a party to the contractual provisions of the instruments.
1. Financial assets
The Company classifies assets as follows: loans and receivables and available-for-sale financial assets. A regular purchase or sale of financial assets shall be recognized and derecognized, as applicable, using trade-date accounting. a. Loans and receivables
Loans and receivables are financial assets with fixed or determinable payments that are not quoted in an active market. Loans and receivables comprise trade receivables and other receivables. Such assets are recognized initially at fair value plus any directly attributable transaction costs. Subsequent to initial recognition, loans and receivables other than insignificant interest on short-term receivables are measured at amortized cost using the effective interest method, less any impairment losses. Interest income is recognized in profit or loss, and is included in other income under non-operating income and expenses.
160

9
EVA AIRWAYS CORP.
Notes to Parent-Company-Only Financial Statements
(Continued)
b. Available-for sale financial assets
Available-for-sale financial assets are non-derivative financial assets that are designated as available-for-sale or are not classified in any of the other categories of financial assets. Available-for-sale financial assets are recognized initially at fair value plus any directly attributable transaction cost. Subsequent to initial recognition, they are measured at fair value and changes therein, are recognized in other comprehensive income and are presented in the fair value reserve in equity other than impairment losses, interest income calculated using the effective interest method, dividend income, and foreign currency differences on available-for-sale monetary items, are recognized in profit or loss, dividends on available-for-sale securities are recognized as other income under non-operating income and expenses when the Company is authorized to receive, normally on the ex-dividend date.
c. Impairment of financial assets
A financial asset is impaired if, and only if, there is any objective evidence of impairment as a result of one or more events that occurred after the initial recognition of the asset and that loss event has an impact on the estimated future cash flows of the financial assets that can be estimated reliably.
Objective evidence that financial assets are impaired includes default or delinquency by a debtor, restructuring of an amount due to the Company on terms that the Company would not consider otherwise, indications that a debtor or issuer will enter bankruptcy, adverse changes in the payment status of borrowers or issuers, economic conditions that correlate with defaults, or the disappearance of an active market for a security.
All individually significant financial assets found not to be specifically impaired are then collectively assessed for any impairment that has been incurred but not yet identified. Objective evidence that the collection of financial assets impaired includes the Company’s experience of collections, the increasing payment terms of the collection over the average term, and economic conditions that correlate with defaults. The evidence of impairment for financial assets measured at amortized cost is considered at both an individual and collective level. All individually significant financial assets are assessed for specific impairment.
161

10
EVA AIRWAYS CORP.
Notes to Parent-Company-Only Financial Statements
(Continued)
The financial assets, which were assessed individually for any impairment and the impairment was recognized or being recognized, were not collectively assessed for impairment by grouping together. If, in a subsequent period, the amount of the impairment loss of a financial asset measured at amortized cost decreases and the decrease can be related objectively to an event occurring after the impairment was recognized, the decrease in impairment loss is reversed through profit or loss to the extent that the carrying value of the asset does not exceed its amortized cost before impairment was recognized at the reversal date. For an investment in an equity security, a significant or prolonged decline in its fair value below its cost is accounted for as objective evidence of impairment. Impairment losses on available-for-sale financial assets are recognized by reclassifying the accumulated losses in the fair value reserve in equity to profit or loss. Impairment losses recognized on an available-for-sale equity security are not reversed through profit or loss. Any subsequent recovery in the fair value of an impaired available-for-sale equity security is recognized in other comprehensive income, and accumulated in other equity. If, in a subsequent period, the fair value of an impaired available-for-sale debt security increases and the increase can be related objectively to an event occurring after the impairment loss was recognized, then the impairment loss is reversed, with the amount of the reversal recognized in profit or loss.
An impairment loss in respect of a financial asset is reduced from the carrying amount except for trade receivables, for which an impairment loss is reflected in an allowance account against the receivables. When it is determined a receivable is uncollectible, it is written off from the allowance account. Any subsequent recovery of a receivable written off is recorded in the allowance account. Changes in the amount of the allowance account are recognized in profit or loss.
Impairment losses and recoveries of financial assets are recognized in profit or loss, which are included in other gains and losses under non-operating income and expenses.
d. Derecognition of financial assets
The Company derecognizes financial assets when the contractual rights of the cash inflow from the asset are terminated, or when the Company transfers substantially all the risks and rewards of ownership of the financial assets.
162

11
EVA AIRWAYS CORP.
Notes to Parent-Company-Only Financial Statements
(Continued)
On derecognition of a financial asset in its entirety, the difference between the carrying amount and the sum of the consideration received or receivable and any cumulative gain or loss that had been recognized in other comprehensive income and presented in other equity – unrealized gains or losses on available-for-sale financial assets is recognized in profit or loss, and is included in other gains and losses under non-operating income and expenses.
The Company separates the part that continues to be recognized and the part that is derecognized based on the relative fair values of those parts on the date of the transfer. The difference between the carrying amount allocated to the part derecognized and the sum of the consideration received for the part derecognized and any cumulative gain or loss allocated to it that had been recognized in other comprehensive income shall be recognized in profit or loss, and is included in other gains and losses under non-operating income and expenses. A cumulative gain or loss that had been recognized in other comprehensive income is allocated between the part that continues to be recognized and the part that is derecognized, based on the relative fair values of those parts.
2. Financial liabilities
a. Other financial liabilities
Financial liabilities not classified as held-for-trading or designated as at fair value through profit or loss, which comprise short-term and long-term borrowings, and trade payables and other payables, shall be measured at fair value plus any directly attributable transaction cost at the time of initial recognition. Subsequent to initial recognition, they are measured at amortized cost calculated using the effective interest method. Interest expense not capitalized as capital cost is recognized in profit or loss, and is included in finance costs under non-operating income and expenses.
b. Derecognition of financial liabilities The Company derecognizes a financial liability when its contractual obligation has been discharged or cancelled or has expired. The difference between the carrying amount of a financial liability removed and the consideration paid (including any non-cash assets transferred or liabilities assumed) is recognized in profit or loss, and is included in other gains and losses under non-operating income and expenses.
163

12
EVA AIRWAYS CORP.
Notes to Parent-Company-Only Financial Statements
(Continued)
c. Offsetting of financial assets and liabilities
The Company presents financial assets and liabilities on a net basis when the Company has the legally enforceable rights to offset and intends to settle such financial assets and liabilities on a net basis or to realize the assets and settle the liabilities simultaneously.
3. Derivative financial instrument and hedge accounting
Derivatives are used to hedge the risks associated with changes in foreign currency rates, interest rates and fuel prices. They are recognized initially (trade date), and are subsequently re-measured at fair value. The transaction costs are recognized in profit or loss. Method of recognizing fair value gains and losses on derivative financial instruments depends on the nature of the hedging relationship. All derivatives are presented as assets when their fair value is positive and as liabilities when their fair value is negative.
The documentation at inception of each hedging relationship sets out purpose and strategy of risk management. To qualify for hedge accounting at the inception of the hedge throughout its life, each hedge must be kept in records if it is highly effective in offsetting the changes (which arise from risks to be managed) in fair value or cash flow of the hedged items on an ongoing basis.
Hedging transactions fall into two categories:
a. Fair value hedges
Changes in the fair value of derivatives that are designated and qualify as fair value hedges are recognized in profit or loss, together with changes in the fair value of the asset or liability or group, thereof, that are attributable to the hedged risk, and are both presented under hedged items in the statement of comprehensive income as well.
If the hedging instrument no longer meets the criteria for hedge accounting, expires, is sold, terminated, exercised or its designation is revoked, then hedge accounting is discontinued prospectively. Under effective interest method, adjustments made for fair value of hedged items (which arises from risk to be managed) are amortized as profit or loss once the hedge accounting is discontinued. The amortization is based on the effective interest rate that is recalculated at the inception of amortization so that the adjustment in fair value will be fully amortized at maturity date.
164

13
EVA AIRWAYS CORP.
Notes to Parent-Company-Only Financial Statements
(Continued)
b. Cash flow hedges
The effective portion of changes in the fair value of derivatives that are designated and qualify as cash flow hedges is recognized in other comprehensive income and accumulated in other equity the effective portion of gains and losses from changes in fair value of cash flow hedges. Any gain or loss relating to an ineffective portion is recognized immediately under non-operating income and expenses in the statement of comprehensive income.
When a hedged item is recognized in profit or loss, the amount accumulated in equity and retained in other comprehensive income is reclassified to profit or loss in the same period or periods during which the hedged item affects profit or loss, and it is presented in the same accounting caption with the hedged item recognized in the statement of comprehensive income. However, when a forecast transaction that is hedged results in the recognition of a non-financial asset or a non-financial liability, the gains and losses previously deferred in equity are transferred from equity and are included in the initial measurement of the cost of the asset or liability.
(g) Inventories
Inventories are measured at the lower of cost and net realizable value. The cost of inventories is based on the weighted-average method, and includes expenditure incurred in acquiring the inventories, production or conversion costs, and other costs incurred in bringing them to their existing location and condition.
Net realizable value is the estimated selling price in the ordinary course of business, less the estimated costs of completion and selling expenses.
(h) Investment in associates Associates are those entities in which the Company has significant influence, but not control, over the financial and operating policies. Significant influence is presumed to exist when the Company holds between 20% and 50% of the voting power of another entity.
Investments in associates are accounted for using the equity method and are recognized initially at cost. The cost of the investment includes transaction costs. The carrying amount of the investment in associates includes goodwill arising from the acquisition less any accumulated impairment losses.
165

14
EVA AIRWAYS CORP.
Notes to Parent-Company-Only Financial Statements
(Continued)
The financial statements include the Company’s share of the profit or loss and other comprehensive income of equity-accounted investees, after adjustments to align the accounting policies with those of the Company, from the date that significant influence commences until the date that significant influence ceases. Unrealized profits resulting from transactions between the Company and an associate are eliminated to the extent of the Company’s interest in the associate. Unrealized losses on transactions with an associate are eliminated in the same way, except to the extent that the underlying asset is impaired. When the Company’s share of losses exceeds its interest in an associate, the carrying amount of the investment, including any long-term interests that form part thereof, is reduced to zero, and the recognition of further losses is discontinued except to the extent that the Company has an obligation or has made payments on behalf of the investee.
(i) Investment in subsidiaries
When preparing the parent-company-only financial statements, investment in subsidiaries which are controlled by the Company is accounted for using the equity method. Under the equity method, an investment in a subsidiary is initially recognized at cost and adjusted thereafter to recognize the Company’s share of profit or loss and other comprehensive income of the subsidiary as well as the distribution received. The Company also recognized its share in the changes in the equity of subsidiaries. Changes in a parent’s ownership interest in a subsidiary that do not result in the loss of control are accounted for within equity.
(j) Property, plant and equipment
1. Recognition and measurement
Items of property, plant and equipment are measured at cost less accumulated depreciation and accumulated impairment losses. Cost includes expenditure that is directly attributed to the acquisition of the asset. Cost also includes transfers from equity of any gain or loss on qualifying cash flow hedges of foreign currency purchases of property, plant and equipment.
Each part of an item of property, plant and equipment with a cost that is significant in relation to the total cost of the item shall be depreciated separately, unless the useful life and the depreciation method of the significant part of an item of property, plant and equipment are the same as the useful life and depreciation method of another significant part of that same item.
166

15
EVA AIRWAYS CORP.
Notes to Parent-Company-Only Financial Statements
(Continued)
The gain or loss arising from the disposal of an item of property, plant and equipment shall be determined as the difference between the net disposal proceeds, if any, and the carrying amount of the item, and it shall be recognized as other gains and losses.
2. Major inspection and overhaul cost:
Major inspection and overhaul expenditures of self-owned and finance leased aircrafts are capitalized as costs of aircrafts and leased assets by components, and are depreciated using the straight-line method over the estimated useful life of the overhaul. Costs of designated inspections to be performed at the end of the lease term of operating leased aircrafts are estimated and depreciated using the straight-line method over the lease term.
3. Subsequent cost
Subsequent expenditure is capitalized only when it is probable that the future economic benefits associated with the expenditure will flow to the Company. The carrying amount of those parts that are replaced is derecognized. Ongoing repairs and maintenance are expensed as incurred.
4. Depreciation
The depreciable amount of an asset is determined after deducting its residual value, and it shall be allocated on a systematic basis over the asset’s useful life. Items of property, plant and equipment with the same useful life may be grouped in determining the depreciation charge. The remainder of the items may be depreciated separately. The depreciation charge for each period shall be recognized in profit or loss. The estimated useful lives are as follows: (1) Buildings and structures: 5 to 55 years (2) Machinery and equipment: 3 to 18 years (3) Aircraft: 5 to 18 years (4) Leased assets are depreciated over the shorter of the lease term or the estimated useful live.
Depreciation methods, useful lives, and residual values are reviewed at each fiscal year-end date. If expectations differ from the previous estimates, the change is accounted for as a change in an accounting estimate.
167

16
EVA AIRWAYS CORP.
Notes to Parent-Company-Only Financial Statements
(Continued)
(k) Leases
Leases in which the Company assumes substantially all of the risks and rewards of ownership are classified as finance leases. On initial recognition, the leased asset is measured at an amount equal to the lower of its fair value or the present value of the minimum lease payments. Subsequent to initial recognition, the asset is accounted for in accordance with the accounting policy applicable to the asset. Minimum lease payments made under finance leases are apportioned between the finance expense and the reduction of the outstanding liability. The finance expense is allocated to each period during the lease term so as to produce a constant periodic rate of interest on the remaining balance of the liability. Other leases are operating leases and are not recognized in the Company’s balance sheets. Payments made under an operating lease, excluding insurance and maintenance expenses, are recognized expenses over the term of the lease. Recognition of income arising from sale and leaseback transaction depends upon the type of lease involved. If a sale and leaseback transaction results in a finance lease, any excess of sales proceeds over the carrying amount is deferred and amortized over the lease term. If a sale and leaseback transaction results in an operating lease, and the sales price is at or below fair value, any profit or loss shall be recognized immediately except that, if the loss is compensated for by future lease payments at below market price, it is deferred and amortized in proportion to the lease payments over the period for which the asset is expected to be used. If the sales price is above fair value, the excess over fair value is deferred and amortized over the period for which the asset is expected to be used.
(l) Impairment of non-financial assets
The Company measures whether impairment occurred in non-financial assets (except for inventories and deferred tax assets), at the end of each reporting period, and estimates their recoverable amount. If it is not possible to determine the recoverable amount (fair value less costs to sell and value in use) for an individual asset, then the Company will have to determine the recoverable amount for the asset’s cash-generating unit. The recoverable amount for an individual asset or a cash-generating unit is the higher of its fair value less costs to sell and its value in use. If, and only if, the recoverable amount of an asset is less than its carrying amount, the carrying amount of the asset shall be reduced to its recoverable amount. That reduction is an impairment loss. An impairment loss shall be recognized immediately in profit or loss.
168

17
EVA AIRWAYS CORP.
Notes to Parent-Company-Only Financial Statements
(Continued)
The Company should assess at the end of each reporting period whether there is any indication that an impairment loss recognized in prior periods for an asset other than goodwill may no longer exist or may have decreased. If any such indication exists, the entity shall estimate the recoverable amount of that asset. An impairment loss recognized in prior periods for an asset other than goodwill shall be reversed if, and only if, there has been a change in the estimates used to determine the asset’s recoverable amount since the last impairment loss was recognized. If this is the case, the carrying amount of the asset shall be increased to its recoverable amount. That increase is a reversal of previously recognized impairment loss. An impairment loss is reversed only to the extent that the asset’s carrying amount does not exceed the carrying amount net of depreciation or amortization that would have been determined if no impairment loss had been recognized. Notwithstanding whether indicators exist, recoverability of goodwill and intangible assets with indefinite useful lives or those not yet in use is required to be tested at least annually. Impairment loss is recognized if the recoverable amount is less than the carrying amount. For the purpose of impairment testing, goodwill acquired in a business combination shall, from the acquisition date, be allocated to each of the Company’s cash-generating units or groups of cash-generating units, that are expected to benefit from the synergies of the combination, irrespective of whether other assets or liabilities of the acquiree are assigned to those units or groups of units. If the carrying amount of the cash-generating unit exceeds the recoverable amount of the unit, the Company recognizes the impairment loss, and the impairment loss shall be allocated to reduce the carrying amount of each asset in the unit. Reversal of an impairment loss for goodwill is prohibited.
(m) Intangible assets
Intangible assets that are acquired by the Company are measured at cost less accumulated amortization and any accumulated impairment losses. Subsequent expenditure is capitalized only when it increases the future economic benefits embodied in the specific asset to which it relates. The amortization amount is the cost of an asset less its residual value. Amortization is recognized in profit or loss on a straight-line basis over the estimated useful lives of 3~5 years of intangible assets, other than goodwill and intangible assets with indefinite useful lives, from the date that they are available for use.
169

18
EVA AIRWAYS CORP.
Notes to Parent-Company-Only Financial Statements
(Continued)
(n) Revenue recognition
1. Aviation transportation revenue
Ticket sales for passengers and cargo are recorded as unearned revenue. They are included in current liabilities, and recognized as revenue when service is provided.
2. Customer loyalty program The Company has a customer loyalty program, whereby, customers are awarded rights of accumulating mileages during their flights, and the fair value of the consideration received or receivable in respect of initial sale is allocated between the rights of accumulated mileages and the other components of the sale. The amount allocated to rights of accumulated mileages is estimated by the fair value of the redeemable part of the customer loyalty program and by reference to past experience of probability of redemption. Thus, the corresponding fair value is estimated and deferred, and service revenues will not be recognized until the rights have been redeemed and obligations are fulfilled. Also, unearned revenues will be converted into revenues when it is expected that the rights are probable not to be redeemed.
(o) Employee benefits
1. Defined contribution plans Obligations for contributions to defined contribution pension plans are recognized as an employee benefit expense in profit or loss in the periods during which services are rendered by employees.
2. Defined benefit plans
A defined benefit plan is a post-employment benefit plan other than a defined contribution plan. The Company’s net obligation in respect of the defined benefit pension plans is calculated separately for each plan by estimating the amount of future benefit that employees have earned in return for their service in the current and prior periods; that benefit is discounted to determine its present value. Any unrecognized past service costs and the fair value of any plan assets are deducted. The discount rate is the yield at the reporting date on market yields of government bonds that have maturity dates approximating the terms of the Company’s obligations and that are denominated in the same currency in which the benefits are expected to be paid.
170

19
EVA AIRWAYS CORP.
Notes to Parent-Company-Only Financial Statements
(Continued)
The calculation is performed annually by a qualified actuary using the projected unit credit method. When the calculation results in a benefit to the Company, the recognized asset is limited to the total of any unrecognized past service costs and also the present value of economic benefits available in the form of any future refunds from the plan or reductions in future contributions to the plan. In order to calculate the present value of economic benefits, consideration is given to any minimum funding requirements that apply to any plan in the Company. An economic benefit is available to the Company if it is realizable during the life of the plan, or on settlement of the plan liabilities. When the benefits of a plan are improved, the portion of the increased benefit relating to past service by employees is recognized in profit or loss on a straight-line basis over the average period until the benefits become vested. To the extent that the benefits vest immediately, the expense is recognized immediately in profit or loss. All actuarial gains and losses as of January 1, 2012, the date of transition to the IFRSs approved by the FSC, were recognized in retained earnings. The Company recognized all actuarial gains and losses arising subsequently from the defined benefit plans in other comprehensive income, which was then transferred to retained earnings immediately. The Company recognizes gains or losses on the curtailment or settlement of a defined benefit plan when the curtailment or settlement occurs. The gain or loss on curtailment or settlement comprises any resulting change in the fair value of plan assets, any change in the present value of the defined benefit obligation, and any related actuarial gains or losses and past service cost that had not previously been recognized.
3. Short-term employee benefits Short-term employee benefit obligations are accrued when the Company has a present legal or constructive obligation to pay this amount as a result of past service provided by the employee. A liability is recognized when the obligation can be estimated reliably.
(p) Income taxes Income tax expenses include both current taxes and deferred taxes. Except for expenses related to business combinations or recognized directly in equity or other comprehensive income, all current and deferred taxes shall be recognized in profit or loss. Current taxes include tax payables and tax deduction receivables on taxable gains (losses) for the year calculated using the statutory tax rate on the reporting date or the actual legislative tax rate, as well as tax adjustments related to prior years.
171

20
EVA AIRWAYS CORP.
Notes to Parent-Company-Only Financial Statements
(Continued)
Deferred taxes arise due to temporary differences between the carrying amounts of assets and liabilities for financial reporting purposes and their respective tax bases. Deferred taxes shall not be recognized for the exceptions below: 1. Assets and liabilities that are initially recognized but are not related to a business combination
and have no effect on net income or taxable gains (losses) during the transaction.
2. Temporary differences arising from equity investments in subsidiaries or joint ventures where there is a high probability that such temporary differences will not reverse.
3. Initial recognition of goodwill.
Deferred tax assets and liabilities shall be measured at the tax rates that are expected to apply to the period when the asset is realized or the liability is settled, based on tax rates that have been enacted or substantively enacted by the end of the reporting period.
Deferred tax assets and liabilities may be offset against each other if the following criteria are met:
1. The Company has the legal right to settle tax assets and liabilities on a net basis; and
2. the taxing of deferred tax assets and liabilities fulfills one of the scenarios below:
(1) levied by the same taxing authority; or
(2) levied by different taxing authorities, but where each such authority intends to settle tax
assets and liabilities (where such amounts are significant) on a net basis every year of the period of expected asset realization or debt liquidation, or where the timing of asset realization and debt liquidation is matched.
A deferred tax asset should be recognized for the carry forward of unused tax losses, unused tax credits, and deductible temporary differences to the extent that it is probable that future taxable profit will be available against which the unused tax losses, unused tax credits, and deductible temporary differences can be utilized. Such unused tax losses, unused tax credits, and deductible temporary differences shall also be re-evaluated on the financial reporting date, and adjusted based on the probability that future taxable profit will be available against which the unused tax losses, unused tax credits, and deductible temporary differences can be utilized.
172

21
EVA AIRWAYS CORP.
Notes to Parent-Company-Only Financial Statements
(Continued)
(q) Earnings per share (EPS)
The Company discloses the Company’s basic and diluted earnings per share attributable to ordinary equity holders of the Company. The calculation of basic earnings per share is based on the profit or loss attributable to the ordinary equity holders of the Company divided by the weighted-average number of ordinary shares outstanding. The calculation of diluted earnings per share is based on the profit or loss attributable to ordinary equity holders of the Company, divided by the weighted-average number of ordinary shares outstanding after adjustment for the effects of all dilutive potential ordinary shares.
(r) Operating segment
The Company discloses the operating segment information in the consolidated financial statements. Therefore, the Company does not disclose the operating segment information in the parent-company-only financial statements.
5. Major sources of accounting assumptions, judgments and estimation uncertainty
The preparation of the parent-company-only financial statements based on the Regulations requires management to make judgments, estimates and assumptions that affect the application of the accounting policies and the reported amount of assets, liabilities, income and expenses. Actual results may differ from these estimates. Management continues to monitor the accounting assumptions, estimates and judgments. Management recognizes any changes in the accounting estimates during the period and the impact of the changes in the accounting estimates in the next year. Information about critical judgments in applying accounting policies that have the most significant effect on amounts recognized in the financial statements is included in the following note: Note 6(g), classification of lease Information about assumptions and estimation uncertainties that have a significant risk of resulting in a material adjustment within the next year is included in the following notes: (a) Note 6(e), valuation of inventories (b) Note 6(m), realization of deferred tax assets
173

22
EVA AIRWAYS CORP.
Notes to Parent-Company-Only Financial Statements
(Continued)
6. Significant account disclosures
(a) Cash and cash equivalents
2013.12.31 2012.12.31 2012.1.1 Cash on hand $ 89,748 97,370 96,243Cash in bank 19,922,856 19,060,428 13,570,400 $ 20,012,604 19,157,798 13,666,643
Refer to note 6(r) for the interest rate risk and fair value sensitivity analysis of the financial assets and liabilities of the Company.
(b) Financial instruments
1. Available-for-sale financial assets-current :
2013.12.31 2012.12.31 2012.1.1 Money market funds $ 1,799,429 2,106,688 2,410,548
2. Available-for-sale financial assets-non-current :
2013.12.31 2012.12.31 2012.1.1 Non-publicly traded stocks $ 2,251,302 2,148,926 2,429,556Publicly traded stocks 751,461 654,310 556,682U.S. Treasury notes 89,274 100,070 121,090 $ 3,092,037 2,903,306 3,107,328
The exposure to credit risk, currency risk and interest rate risk arising from financial instruments is disclosed in note 6(r).
As of December 31, 2013 and 2012, and January 1, 2012, the pledge for Company’s financial assets is disclosed in note 8.
174

23
EVA AIRWAYS CORP.
Notes to Parent-Company-Only Financial Statements
(Continued)
3. Sensitivity analysis-price risk of equity securities:
If the price of the equity securities changes, and it is on the same basis for both years and assumes that all other variables remain the same, the impact on other comprehensive income will be as follows:
2013 2012 Price of the equity securities at the reporting date
Other Comprehensive Income, net of tax
Profit (losses)
Other Comprehensive Income, net of tax
Profit (losses)
increase 5% $ 244,107 - 250,045 - decrease 5% $ (244,107) - (250,045) -
Information about material foreign currency investment on equity security at the reporting date was as follows:
2013.12.31 2012.12.31 2012.1.1 Foreign
currency Exchange
rate NTD
Foreign currency
Exchange rate
NTD
Foreign currency
Exchange rate
NTD
USD $ 1,839 29.805 54,822 1,843 29.04 53,530 1,367 30.28 41,379
(c) Hedging derivative financial instruments
The Company needs fuel for operating. However, cash flow risk will occur if the future cash flows for fuel fluctuate due to the floating market prices. The Company evaluates the risk as significant, and thus, hedges the risk by signing swap agreements. As of December 31, 2013 and 2012, and January 1, 2012, the cash flow hedged items and derivative financial hedging instruments were as follows:
Hedged item
Hedging instrument
Fair value of assigned hedging instrument Period when cash flows are expected
to occur
Period when profit or loss is
affected Account 2013.12.31 2012.12.31 2012.1.1 Floating price of fuel
Fuel swap agreement
$ 26,090 13,353 69,953 2013~2014 2013~2014 Derivative financial assets for hedge purposes-current
175

24
EVA AIRWAYS CORP.
Notes to Parent-Company-Only Financial Statements
(Continued)
The Company’s gains and losses arising from cash flow hedges in 2013 and 2012 were as follows:
Account 2013 2012
Recognized in other comprehensive income during the period $ 10,572 (46,978)Reclassification from equity to profit or loss for the period
Operating cost (income) $ (86,273)
(290,566)
(d) Notes and accounts receivable, and other receivables
2013.12.31 2012.12.31 2012.1.1 Notes receivable $ 344,738 415,371 317,587Accounts receivable (related parties included) 6,247,970 6,656,245 6,112,417Other receivables (related parties included)
(included in other current assets) 175,402
157,306
575,134
Less: allowance for doubtful accounts (33,803) (42,383) (11,551) $ 6,734,307 7,186,539 6,993,587
The Company’s aging analysis of notes and accounts receivable, and other receivables that were past due but not impaired, were as follows:
2013.12.31 2012.12.31 2012.1.1 Past due within 30 days $ 39,870 42,586 41,267Past due 31~60 days 7,273 7,771 7,531Past due over 60 days but less than one year 4,116 4,395 4,259Past due more than one year 5,896 6,296 6,101 $ 57,155 61,048 59,158
The movement in the allowance for doubtful accounts with respect to notes and accounts receivable, and other receivables were as follows:
2013 2012
Beginning balance $ 42,383 11,551Impairment loss recognized 5,344 38,687Amounts written off (13,924) (7,855)Ending balance $ 33,803 42,383
176
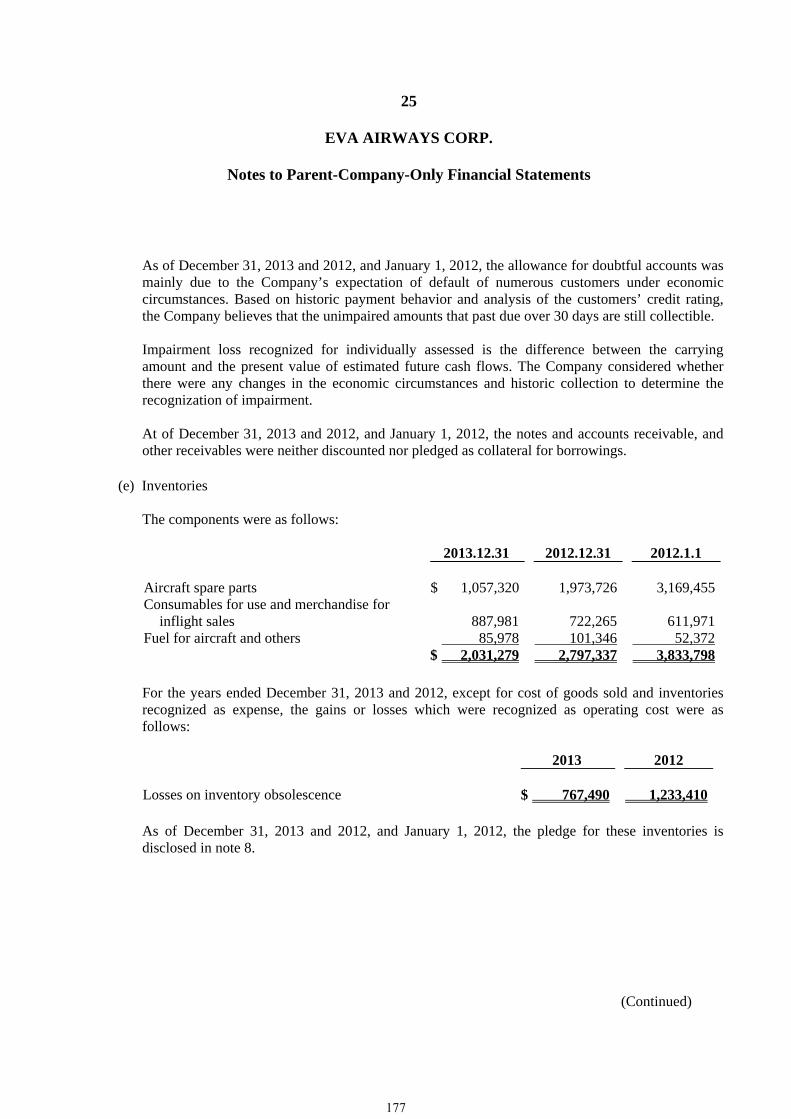
25
EVA AIRWAYS CORP.
Notes to Parent-Company-Only Financial Statements
(Continued)
As of December 31, 2013 and 2012, and January 1, 2012, the allowance for doubtful accounts was mainly due to the Company’s expectation of default of numerous customers under economic circumstances. Based on historic payment behavior and analysis of the customers’ credit rating, the Company believes that the unimpaired amounts that past due over 30 days are still collectible. Impairment loss recognized for individually assessed is the difference between the carrying amount and the present value of estimated future cash flows. The Company considered whether there were any changes in the economic circumstances and historic collection to determine the recognization of impairment. At of December 31, 2013 and 2012, and January 1, 2012, the notes and accounts receivable, and other receivables were neither discounted nor pledged as collateral for borrowings.
(e) Inventories
The components were as follows: 2013.12.31 2012.12.31 2012.1.1 Aircraft spare parts $ 1,057,320 1,973,726 3,169,455Consumables for use and merchandise for
inflight sales 887,981
722,265
611,971
Fuel for aircraft and others 85,978 101,346 52,372 $ 2,031,279 2,797,337 3,833,798 For the years ended December 31, 2013 and 2012, except for cost of goods sold and inventories recognized as expense, the gains or losses which were recognized as operating cost were as follows:
2013 2012
Losses on inventory obsolescence $ 767,490 1,233,410
As of December 31, 2013 and 2012, and January 1, 2012, the pledge for these inventories is disclosed in note 8.
177

26
EVA AIRWAYS CORP.
Notes to Parent-Company-Only Financial Statements
(Continued)
(f) Investments accounted for using equity method
The components were as follows: 2013.12.31 2012.12.31 2012.1.1 Subsidiaries $ 10,448,761 9,643,455 9,920,254Associates 156,490 153,536 60,592 10,605,251 9,796,991 9,980,846Add: recorded as other non-current liabilities 81,731 - - $ 10,686,982 9,796,991 9,980,846 1. Subsidiaries
Please see the consolidated financial statements for the year ended December 31, 2013.
2. In 2013 and 2012, the Company’s share of profit or loss of subsidiaries and associates was as
follows:
2013 2012 Subsidiaries $ 806,762 977,045Associates 12,127 13,643 $ 818,889 990,688
3. Summarized financial information of associates for investments was as follows (before being
adjusted to the Company’s proportionate share):
2013.12.31 2012.12.31 2012.1.1 Total assets $ 1,741,236 1,245,004 397,649Total liabilities $ 707,882 209,856 203,756
2013 2012 Revenue $ 718,457 730,916Profit $ 27,340 43,493
178

27
EVA AIRWAYS CORP.
Notes to Parent-Company-Only Financial Statements
(Continued)
4. As of December 31, 2013 and 2012, and January 1, 2012, the investments accounted for using
equity method were not pledged.
(g) Property, plant and equipment The movements in cost and accumulated depreciation of property, plant and equipment for the years ended December 31, 2013 and 2012 were as follows:
Land
Building and
structures
Machinery and
equipment
Leased assets
Aircraft
Unfinished
construction
Total
Cost:
Beginning balance as of January 1, 2013 $ 1,869,572 4,693,649 15,336,355 20,651,308 97,971,111 275,180 140,797,175
Additions - 254,321 1,324,388 1,228,494 1,211,417 413,304 4,431,924
Disposals (4,410) (10,178) (704,384) (40,084) (479,874) - (1,238,930) Reclassification (Note) - 539,922 (108,663) (3,707,266) (5,049,548) (539,922) (8,865,477)
Balance as of December 31, 2013 $ 1,865,162 5,477,714 15,847,696 18,132,452 93,653,106 148,562 135,124,692 Beginning balance as of January 1, 2012 $ 1,869,572 4,611,207 15,807,838 21,025,766 109,521,746 4,868 152,840,997
Additions - 82,442 792,121 1,110,299 2,170,937 270,312 4,426,111
Disposals - - (1,263,604) (29,066) (8,219,957) - (9,512,627)
Reclassification - - - (1,455,691) (5,501,615) - (6,957,306)
Balance as of December 31, 2012 $ 1,869,572 4,693,649 15,336,355 20,651,308 97,971,111 275,180 140,797,175
Accumulated depreciation:
Beginning balance as of January 1, 2013 $ - 2,176,573 6,898,746 6,975,383 35,731,774 - 51,782,476
Depreciation expense - 111,798 1,193,040 2,064,799 6,714,230 - 10,083,867
Disposals - (8,847) (503,672) (10,791) (353,920) - (877,230)
Reclassification (Note) - - (61,739) (3,237,448) (5,038,440) - (8,337,627)
Balance as of December 31, 2013 - 2,279,524 7,526,375 5,791,943 37,053,644 - 52,651,486 Beginning balance as of January 1, 2012 $ - 2,075,641 7,259,755 6,564,544 41,388,915 - 57,288,855
Depreciation expense - 100,932 1,166,051 1,866,530 7,128,146 - 10,261,659
Disposals - - (1,192,272) - (7,283,672) - (8,475,944)
Reclassification - - (334,788) (1,455,691) (5,501,615) - (7,292,094)
Balance as of December 31, 2012 - 2,176,573 6,898,746 6,975,383 35,731,774 - 51,782,476 Carrying amounts:
Balance as of December 31, 2013 $ 1,865,162 3,198,190 8,321,321 12,340,509 56,599,462 148,562 82,473,206 Balance as of December 31, 2012 $ 1,869,572 2,517,076 8,437,609 13,675,925 62,239,337 275,180 89,014,699 Beginning balance as of January 1, 2012 $ 1,869,572 2,535,566 8,548,083 14,461,222 68,132,831 4,868 95,552,142
Note: Reclassification primarily consists of the reclassification to other non-current assets and inventories.
179

28
EVA AIRWAYS CORP.
Notes to Parent-Company-Only Financial Statements
(Continued)
1. Leased aircraft and computer equipment
The Company leased aircraft and computer equipment under a number of finance lease arrangements. Such leases are treated as finance leases in accordance with the terms and conditions of the contracts. Leased equipments are used as pledge for lease obligations and are disclosed in note 8.
The estimated recovery costs incurred by leasing aircraft are recognized as leased assets and the related restoration obligations are recognized as other non-current liabilities and are amortized using interest method.
As of December 31, 2013 and 2012, and January 1, 2012, the restoration obligations were $3,882,172, $3,437,143 and $2,751,138, respectively.
2. Sale and leaseback transactions
The Company leased aircraft under sale and leaseback arrangements, which were judged as finance leases. The unrealized gain on sale and leaseback, resulting from the difference between sale price and book value of the equipment, is recorded as a reduction of depreciation expenses over the lease term. As of December 31, 2013 and 2012, and January 1, 2012, the unrealized gains from the sale and leaseback were $531,483, $643,305 and $755,128, respectively and were recognized as other non-current liabilities.
3. Pledge
As of December 31, 2013 and 2012, and January 1, 2012, the Company’s property, plant and equipment were used as pledge for long-term borrowings and lines of credit, and they are disclosed in note 8.
4. For the years ended December 31, 2013 and 2012, the Company capitalized the interest
expenses on purchase of assets amounting to $60,956 and $11,281, respectively. The range of the monthly interest rates used for capitalization calculation were 0.13% and 0.13%~0.14%, respectively.
180

29
EVA AIRWAYS CORP.
Notes to Parent-Company-Only Financial Statements
(Continued)
(h) Intangible assets
The movements in cost and accumulated amortization of intangible assets for the years ended December 31, 2013 and 2012 were as follows:
Computer software Costs: Beginning balance as of January 1, 2013 $ 418,822 Additions 203,727 Balance as of December 31, 2013 $ 622,549 Beginning balance as of January 1, 2012 $ 191,255 Additions 227,566 Balance as of December 31, 2012 $ 418,821 Accumulated amortization: Beginning balance as of January 1, 2013 $ 115,489 Amortization expense 94,283 Balance as of December 31, 2013 $ 209,772 Beginning balance as of January 1, 2012 $ 65,807 Amortization expense 49,681 Balance as of December 31, 2012 $ 115,488 Carrying amounts: Balance as of December 31, 2013 $ 412,777 Balance as of December 31, 2012 $ 303,333 Beginning balance as of January 1, 2012 $ 125,448 1. Amortization
The amortization of intangible assets is included under operating expenses in the statement of comprehensive income.
2. Pledge
As of December 31, 2013 and 2012, and January 1, 2012, the Company’s intangible assets were not pledged.
181
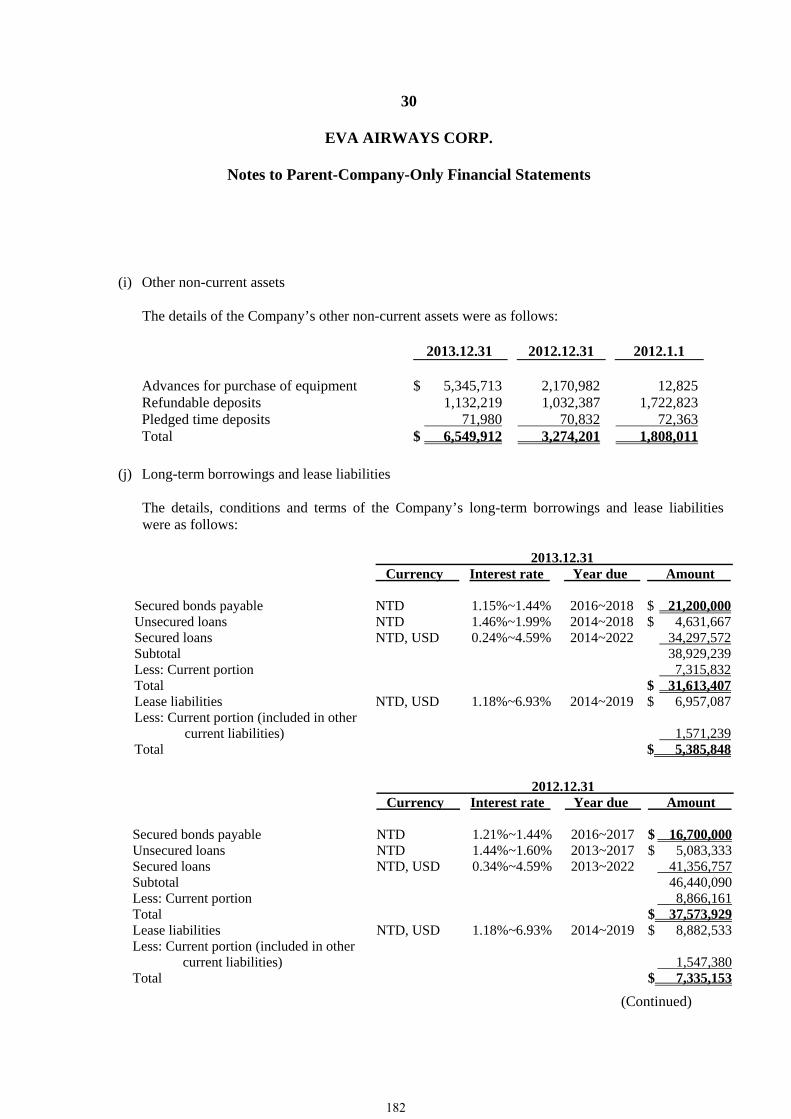
30
EVA AIRWAYS CORP.
Notes to Parent-Company-Only Financial Statements
(Continued)
(i) Other non-current assets
The details of the Company’s other non-current assets were as follows: 2013.12.31 2012.12.31 2012.1.1 Advances for purchase of equipment $ 5,345,713 2,170,982 12,825Refundable deposits 1,132,219 1,032,387 1,722,823Pledged time deposits 71,980 70,832 72,363Total $ 6,549,912 3,274,201 1,808,011
(j) Long-term borrowings and lease liabilities
The details, conditions and terms of the Company’s long-term borrowings and lease liabilities were as follows:
2013.12.31 Currency Interest rate Year due Amount Secured bonds payable NTD 1.15%~1.44% 2016~2018 $ 21,200,000Unsecured loans NTD 1.46%~1.99% 2014~2018 $ 4,631,667Secured loans NTD, USD 0.24%~4.59% 2014~2022 34,297,572Subtotal 38,929,239Less: Current portion 7,315,832Total $ 31,613,407Lease liabilities NTD, USD 1.18%~6.93% 2014~2019 $ 6,957,087Less: Current portion (included in other
current liabilities)
1,571,239Total $ 5,385,848
2012.12.31 Currency Interest rate Year due Amount Secured bonds payable NTD 1.21%~1.44% 2016~2017 $ 16,700,000Unsecured loans NTD 1.44%~1.60% 2013~2017 $ 5,083,333Secured loans NTD, USD 0.34%~4.59% 2013~2022 41,356,757Subtotal 46,440,090Less: Current portion 8,866,161Total $ 37,573,929Lease liabilities NTD, USD 1.18%~6.93% 2014~2019 $ 8,882,533Less: Current portion (included in other
current liabilities)
1,547,380Total $ 7,335,153
182

31
EVA AIRWAYS CORP.
Notes to Parent-Company-Only Financial Statements
(Continued)
2012.1.1 Currency Interest rate Year due Amount Secured bonds payable NTD 1.21%~1.44% 2016 $ 10,200,000Unsecured loans NTD 1.20%~1.56% 2012~2016 $ 4,183,000Secured loans NTD, USD 0.25%~4.59% 2012~2022 50,749,308Subtotal 54,932,308Less: Current portion 9,183,142Total $ 45,749,166Lease liabilities NTD, USD 1.18%~6.93% 2014~2019 $ 10,525,724Less: Current portion (included in other
current liabilities)
1,522,593Total $ 9,003,131
As of December 31, 2013, the details of the future repayment periods and amounts of the Company’s long-term borrowings and lease liabilities were as follows:
Year due Amount 2014 $ 8,887,071 2015~2018 48,868,350 2019 and thereafter 9,330,905 $ 67,086,326 Information on the Company’s exposure to interest rate risk, currency risk and liquidity risk is disclosed in note 6(r). 1. Pledge for borrowings
The pledge for long-term borrowings and lease liabilities is disclosed in note 8.
2. Unused lines of credit
As of December 31, 2013 and 2012, and January 1, 2012 the unused credit lines for long-term borrowing amounted to $7,939,607, $7,291,052 and $8,476,472, respectively.
183

32
EVA AIRWAYS CORP.
Notes to Parent-Company-Only Financial Statements
(Continued)
3. Lease liabilities
The Company’s lease liabilities were as follows:
2013.12.31 2012.12.31 2012.1.1
Future minimum
rental payment
Interest
Present value of
minimum rental
payment
Future
minimum rental
payment
Interest
Present value of
minimum rental
payment
Future
minimum rental
payment
Interest
Present value of
minimum rental
payment Within 1 year $ 1,856,034 284,795 1,571,239 1,939,421 392,041 1,547,380 1,998,821 476,228 1,522,5931 to 5 years 5,200,415 497,418 4,702,997 6,527,659 788,176 5,739,483 7,526,461 1,107,664 6,418,797More than 5 years 699,203 16,352 682,851 1,663,050 67,380 1,595,670 2,740,930 156,596 2,584,334 $ 7,755,652 798,565 6,957,087 10,130,130 1,247,597 8,882,533 12,266,212 1,740,488 10,525,724
The recognized interest expenses incurred by lease liabilities for the years ended December 31, 2013 and 2012 are disclosed in note 6(q).
(k) Operating leases
The Company leased aircraft, land, buildings, and parking lots under operating lease agreements with rental payable in the future as follows:
2013.12.31 2012.12.31 2012.1.1
Within 1 year $ 6,898,603 6,441,503 6,427,9271 to 5 years 17,232,586 18,481,668 20,770,393More than 5 years 8,499,159 8,871,262 10,381,713 $ 32,630,348 33,794,433 37,580,033
For the years ended December 31, 2013 and 2012, rental expenses included in operating costs and operating expenses were $6,875,599 and $6,432,461, respectively. The Company did not assume the residual value of the abovementioned lease items, and determined that the risk and return of those lease items are still assumed by the lessor. Hence, the Company treated the abovementioned lease as operating leases.
184

33
EVA AIRWAYS CORP.
Notes to Parent-Company-Only Financial Statements
(Continued)
(l) Employee benefits
1. Defined benefit plans
The movements in the present value of the defined benefit obligations and the fair value of plan assets were as follows:
2013.12.31 2012.12.31 2012.1.1
Total present value of defined benefit
obligations $ 6,063,401
5,567,566 5,211,077
Fair value of plan assets (3,276,976) (3,031,708) (2,760,749)Recognized liabilities for defined benefit
obligations $ 2,786,425
2,535,858
2,450,328
The Company makes defined benefit plan contributions to the pension fund account at Bank of Taiwan that provides pensions for employees upon retirement. The plans (covered by the Labor Standards Act) entitle a retired employee to receive retirement payment calculated by the units based on years of service and average salary for the six months prior to retirement.
(1) Composition of plan assets
The Company allocates pension funds in accordance with the Regulations for Revenues, Expenditures, Safeguard and Utilization of the Labor Retirement Fund, and such funds are managed by the Labor Pension Fund Supervisory Committee of the Council of Labor Affairs. Minimum earnings on such funds shall be no less than the earnings attainable from two-year time deposits with interest rates offered by local banks. The Company’s labor pension reserve account balance in Bank of Taiwan amounted to $3,276,976 as of December 31, 2013. The utilization of the labor pension fund assets, including the asset allocation and yield of the fund. Please refer to the website of the Labor Pension Fund Supervisory Committee.
185

34
EVA AIRWAYS CORP.
Notes to Parent-Company-Only Financial Statements
(Continued)
(2) Movements in present value of the defined benefit obligations
The movements in present value of the defined benefit obligations were as follows:
2013 2012 Defined benefit obligations at January 1 $ 5,567,566 5,211,077Benefits paid by the plan (200,102) (166,280)Current service costs and interest 252,674 251,705Actuarial losses (gains) 443,263 271,064Defined benefit obligations at December 31 $ 6,063,401 5,567,566
(3) Movements of defined benefit plan assets
The movements in the fair value of the defined benefit plan assets were as follows:
2013 2012 Fair value of plan assets at January 1 $ 3,031,708 2,760,749Contributions from plan participants 381,275 358,058Benefits paid by the plan (175,211) (114,940)Expected return on plan assets 54,443 58,038Actuarial gains (losses) (15,239) (30,197)Fair value of plan assets at December 31 $ 3,276,976 3,031,708
(4) Expenses recognized in profit or loss The expenses recognized in profit or loss were as follows: 2013 2012 Current services costs $ 156,330 148,658Interest on obligations 96,344 103,047Expected return on plan assets (54,443) (58,038) $ 198,231 193,667Operating costs $ 154,394 148,816Operating expenses 43,837 44,851 $ 198,231 193,667Actual return on plan assets $ 39,204 27,841
186
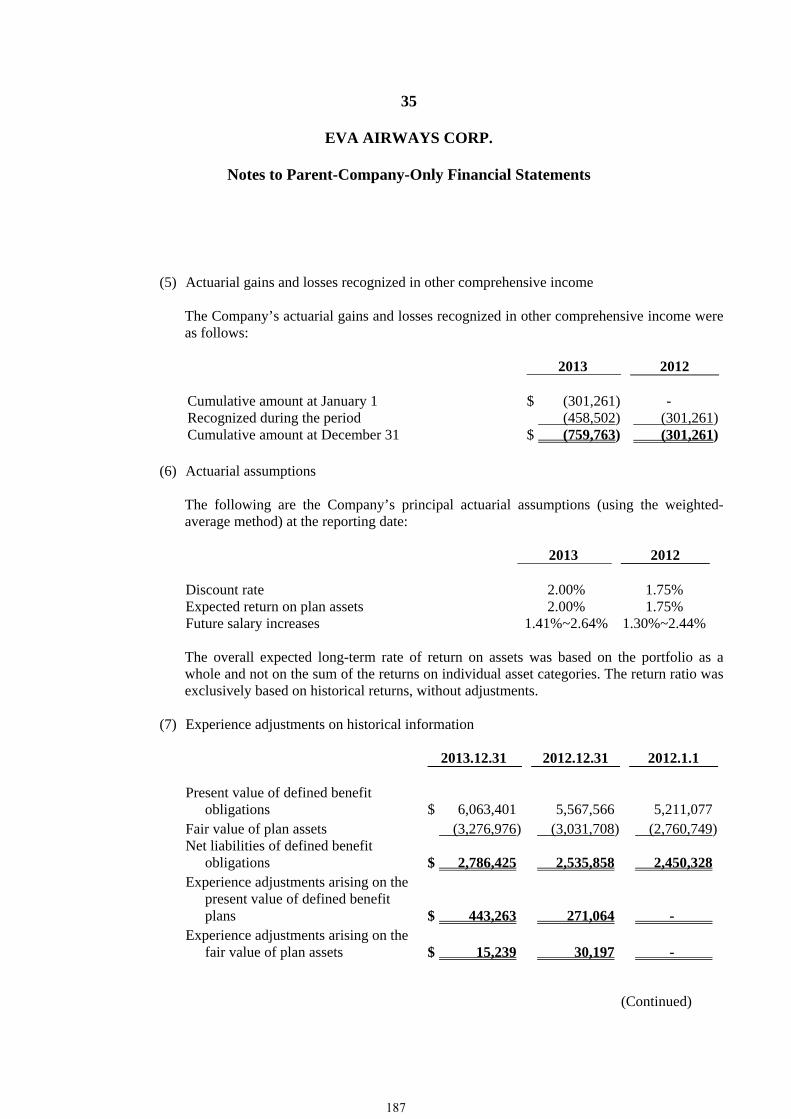
35
EVA AIRWAYS CORP.
Notes to Parent-Company-Only Financial Statements
(Continued)
(5) Actuarial gains and losses recognized in other comprehensive income
The Company’s actuarial gains and losses recognized in other comprehensive income were as follows:
2013 2012 Cumulative amount at January 1 $ (301,261) - Recognized during the period (458,502) (301,261)Cumulative amount at December 31 $ (759,763) (301,261)
(6) Actuarial assumptions
The following are the Company’s principal actuarial assumptions (using the weighted-average method) at the reporting date:
2013 2012 Discount rate 2.00% 1.75% Expected return on plan assets 2.00% 1.75% Future salary increases 1.41%~2.64% 1.30%~2.44% The overall expected long-term rate of return on assets was based on the portfolio as a whole and not on the sum of the returns on individual asset categories. The return ratio was exclusively based on historical returns, without adjustments.
(7) Experience adjustments on historical information
2013.12.31 2012.12.31 2012.1.1 Present value of defined benefit
obligations $ 6,063,401
5,567,566
5,211,077
Fair value of plan assets (3,276,976) (3,031,708) (2,760,749)Net liabilities of defined benefit
obligations $ 2,786,425
2,535,858
2,450,328
Experience adjustments arising on the present value of defined benefit plans
$ 443,263
271,064
-
Experience adjustments arising on the fair value of plan assets
$ 15,239
30,197
-
187

36
EVA AIRWAYS CORP.
Notes to Parent-Company-Only Financial Statements
(Continued)
The expected allocation payments made by the Company to the defined benefit plans during the annual period after December 31, 2013 are $394,793.
(8) When calculating the present value of defined benefit obligations, the Company used
judgments and estimations to determine the actuarial assumptions, including the employee turnover rates and future salary changes, as of the end of the reporting period. Any changes in the actuarial assumptions may significantly impact the amount of the defined benefit obligations. As of December 31, 2013, the Company’s accrued pension liabilities were $2,786,425. If the discount rate had increased or decreased by 0.25%, the Company’s accrued pension liabilities would have decreased by $172,143 or increased by $179,163, respectively; if the future salary increase rate had increased or decreased by 0.25%, the Company’s accrued pension liabilities would have increased by $171,981 or decreased by $166,106.
2. Defined contribution plans The Company set aside 6% of each employee’s monthly wages to contribute to the labor pension personal accounts at the Bureau of Labor Insurance in accordance with the provisions of the Labor Pension Act. The Company set aside a fixed amount to contribute to the Bureau of Labor Insurance without the payment of additional legal or constructive obligations.
The Company set aside $203,107 and $180,057 as pension costs under the defined contribution plans in 2013 and 2012, respectively. Payment was made to the Bureau of Labor Insurance.
(m) Income tax
1. Income tax expenses
For the years ended December 31, 2013 and 2012, the components of estimated income tax expenses were as follows:
2013 2012
Current tax expenses $ 29,260 28,348Deferred tax expenses 125,001 70,475 $ 154,261 98,823
188
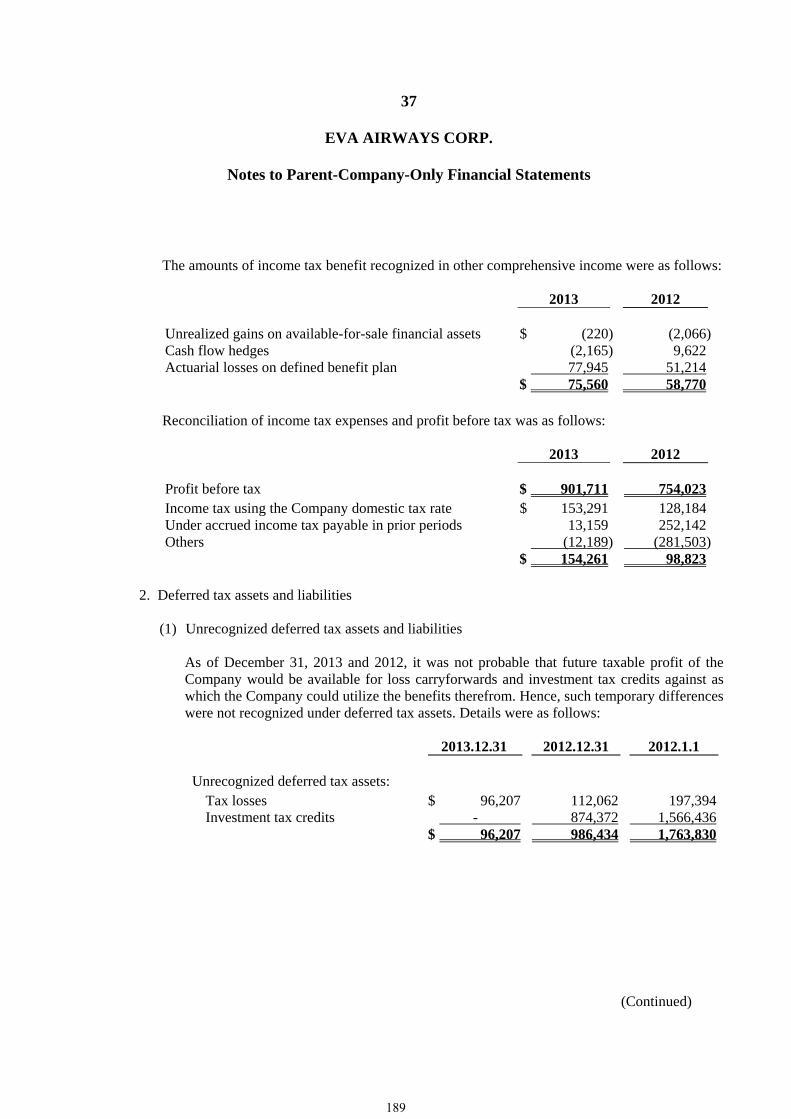
37
EVA AIRWAYS CORP.
Notes to Parent-Company-Only Financial Statements
(Continued)
The amounts of income tax benefit recognized in other comprehensive income were as follows:
2013 2012 Unrealized gains on available-for-sale financial assets $ (220) (2,066)Cash flow hedges (2,165) 9,622Actuarial losses on defined benefit plan 77,945 51,214 $ 75,560 58,770
Reconciliation of income tax expenses and profit before tax was as follows:
2013 2012
Profit before tax $ 901,711 754,023Income tax using the Company domestic tax rate $ 153,291 128,184Under accrued income tax payable in prior periods 13,159 252,142Others (12,189) (281,503) $ 154,261 98,823
2. Deferred tax assets and liabilities
(1) Unrecognized deferred tax assets and liabilities
As of December 31, 2013 and 2012, it was not probable that future taxable profit of the Company would be available for loss carryforwards and investment tax credits against as which the Company could utilize the benefits therefrom. Hence, such temporary differences were not recognized under deferred tax assets. Details were as follows:
2013.12.31 2012.12.31 2012.1.1 Unrecognized deferred tax assets:
Tax losses $ 96,207 112,062 197,394Investment tax credits - 874,372 1,566,436
$ 96,207 986,434 1,763,830
189

38
EVA AIRWAYS CORP.
Notes to Parent-Company-Only Financial Statements
(Continued)
According to the Income Tax Act, the operating loss as examined and assessed by the local tax authorities can be carried forward for use as a deduction from taxable income over a period of ten years. As of December 31, 2013, the Company’s loss carryforwards unrecognized as deferred tax assets and the expiry year were as follows:
Filing year
Un-deducted operating loss
Expiry year
2008 $ 565,924 2018
The Company has no unrecognized deferred tax liabilities as of December 31, 2013 and 2012.
(2) Recognized deferred tax assets and liabilities
The movements in the balances of deferred tax assets and liabilities were as follows:
Deferred tax assets:
Loss
carryforwards
Loss on valuation of inventories
Purchase of fixed assets in installments
Defined benefit plan
actuarial losses
Restoration obligations
Mileage revenue
Others
Total Beginning balance at January 1, 2013 $ 2,728,603 467,635 383,963 431,096 287,643 367,918 469,218 5,136,076Recognized in profit or loss (241,808) 36,432 (58,820) (35,349) 65,836 23,505 (76,470) (286,674)Recognized in other comprehensive
income -
-
-
77,945
-
-
(2,385)
75,560
Balance at December 31, 2013 $ 2,486,795 504,067 325,143 473,692 353,479 391,423 390,363 4,924,962Beginning balance at January 1, 2012 $ 2,650,095 628,671 443,020 416,556 236,712 367,040 178,823 4,920,917Recognized in profit or loss 78,508 (161,036) (59,057) (36,674) 50,931 878 282,839 156,389Recognized in other comprehensive
income -
-
-
51,214
-
-
7,556
58,770
Balance at December 31, 2012 $ 2,728,603 467,635 383,963 431,096 287,643 367,918 469,218 5,136,076
Deferred tax liabilities:
Unrealized foreign
exchange gains Others Total
Beginning balance at January 1, 2013 $ 190,652 36,212 226,864Recognized in profit or loss (125,461) (36,212) (161,673)Balance at December 31, 2013 $ 65,191 - 65,191 Beginning balance at January 1, 2012 $ - - - Recognized in profit or loss 190,652 36,212 226,864Balance at December 31, 2012 $ 190,652 36,212 226,864
190

39
EVA AIRWAYS CORP.
Notes to Parent-Company-Only Financial Statements
(Continued)
3. Examination and approval The Company’s income tax returns for the years through 2011 were examined and approved by the local tax authorities.
4. Information related to unappropriated earnings and creditable ratio:
2013.12.31 2012.12.31 2012.1.1 Unappropriated earnings before 1997 $ - - - Unappropriated earnings after 1998 (4,465,228) (2,970,767) (3,187,608)
$ (4,465,228) (2,970,767) (3,187,608)Balance of ICA $ 158,662 365,367 214,388
2013 2012 Tax creditable ratio for earnings distribution to
R.O.C. residents
- % (estimated)
- % (actual)
According to the announcement by the Ministry of Finance on October 17, 2013, under Decree No. 10204562810, the Company’s income tax information and imputation tax credit information should be disclosed in compliance with the Decree.
(n) Capital and other equity
As of December 31, 2013 and 2012 and January 1, 2012, the Company’s authorized share capital consisted of 4,000,000 thousand shares of common stock, with par value of $10 (dollars) per share, of which the issued and outstanding share capital were $32,589,450.
191

40
EVA AIRWAYS CORP.
Notes to Parent-Company-Only Financial Statements
(Continued)
1. Capital surplus
The details of capital surplus were as follows:
2013.12.31 2012.12.31 2012.1.1 Cash subscription in excess of par value
of shares $ 29,672
29,672
29,672
Stock options granted to employees 282,100 282,100 282,100Additional paid-in capital from bond
conversion 1,411,830 1,411,830
1,411,830
$ 1,723,602 1,723,602 1,723,602
In accordance with R.O.C. Company Act amended in January 2012, realized capital surplus can only be reclassified as share capital or distributed as cash dividends after offsetting losses. The aforementioned capital surplus included share premiums and donation gains. In accordance with the Securitues Offering and Issuance Guidelines, the amount of capital surplus to be reclassified under share capital shall not exceed 10% of the actual share capital amount.
2. Retained earnings
According to the Company’s articles of incorporation, current-period earnings should first be used to settle all outstanding tax payables and accumulated deficit, and then 10% of statutory earnings reserves should be retained, and special reserve should be recognized or reversed according to statutory requirements. Thereafter, the remaining current-period earnings and the unappropriated prior-period earnings can be distributed by reference to a resolution approved by the stockholders. The Company must appropriate employee bonuses of at least 1% of earnings of each year, and less than 5% of earnings of each year for remuneration of directors and supervisors.
The Company adopts the dividend policy that cash dividends and stock dividends are distributed with cash dividends accounting for at least 10% of total dividends distributed.
(1) Legal reserve
In accordance with R.O.C. Company Act amended in January 2012, the Company must retain 10% of its annual profit as a legal reserve until such retention equals the amount of paid-in capital. If a company has no accumulated deficit, it may, pursuant to a resolution approved by the stockholders, distribute its legal reserve by issuing new shares or cash for the portion in excess of 25% of the paid-in capital.
192
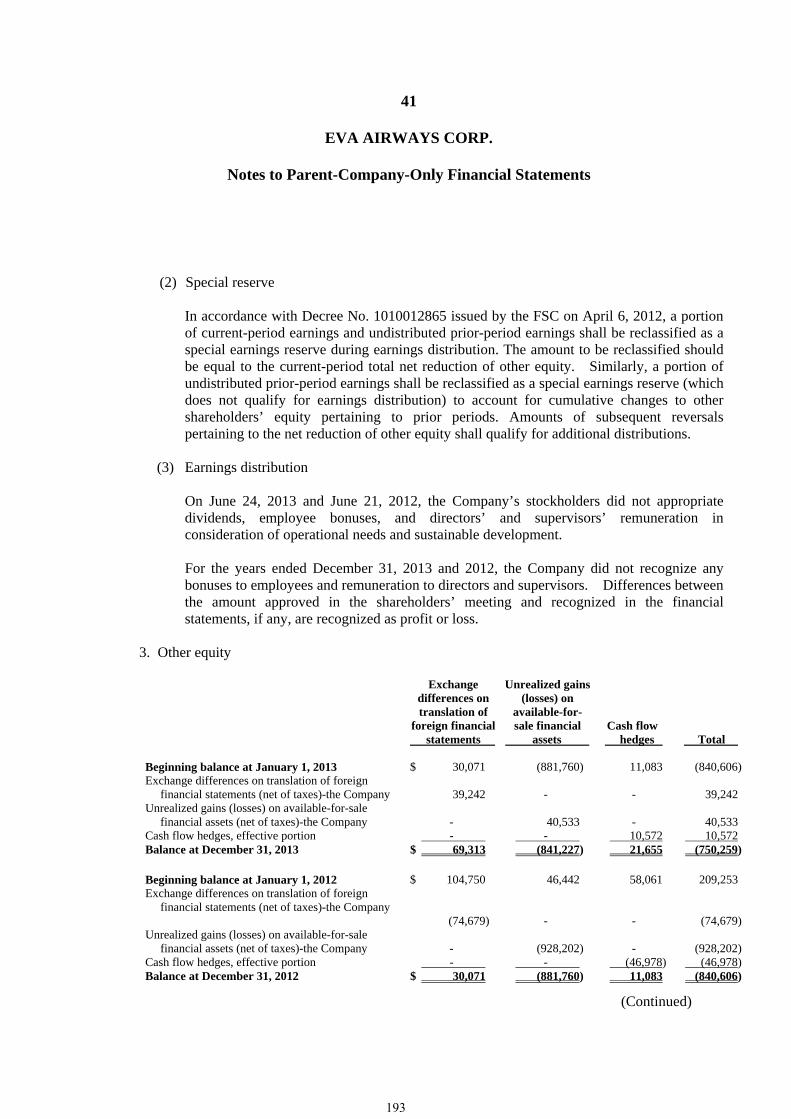
41
EVA AIRWAYS CORP.
Notes to Parent-Company-Only Financial Statements
(Continued)
(2) Special reserve
In accordance with Decree No. 1010012865 issued by the FSC on April 6, 2012, a portion of current-period earnings and undistributed prior-period earnings shall be reclassified as a special earnings reserve during earnings distribution. The amount to be reclassified should be equal to the current-period total net reduction of other equity. Similarly, a portion of undistributed prior-period earnings shall be reclassified as a special earnings reserve (which does not qualify for earnings distribution) to account for cumulative changes to other shareholders’ equity pertaining to prior periods. Amounts of subsequent reversals pertaining to the net reduction of other equity shall qualify for additional distributions.
(3) Earnings distribution On June 24, 2013 and June 21, 2012, the Company’s stockholders did not appropriate dividends, employee bonuses, and directors’ and supervisors’ remuneration in consideration of operational needs and sustainable development. For the years ended December 31, 2013 and 2012, the Company did not recognize any bonuses to employees and remuneration to directors and supervisors. Differences between the amount approved in the shareholders’ meeting and recognized in the financial statements, if any, are recognized as profit or loss.
3. Other equity
Exchange differences ontranslation of
foreign financial statements
Unrealized gains (losses) on
available-for-sale financial
assets Cash flow hedges Total
Beginning balance at January 1, 2013 $ 30,071 (881,760) 11,083 (840,606)Exchange differences on translation of foreign
financial statements (net of taxes)-the Company 39,242
-
-
39,242
Unrealized gains (losses) on available-for-sale financial assets (net of taxes)-the Company
-
40,533
-
40,533
Cash flow hedges, effective portion - - 10,572 10,572Balance at December 31, 2013 $ 69,313 (841,227) 21,655 (750,259) Beginning balance at January 1, 2012 $ 104,750 46,442 58,061 209,253Exchange differences on translation of foreign
financial statements (net of taxes)-the Company (74,679)
-
-
(74,679)
Unrealized gains (losses) on available-for-sale financial assets (net of taxes)-the Company
-
(928,202)
-
(928,202)
Cash flow hedges, effective portion - - (46,978) (46,978)Balance at December 31, 2012 $ 30,071 (881,760) 11,083 (840,606)
193

42
EVA AIRWAYS CORP.
Notes to Parent-Company-Only Financial Statements
(Continued)
(o) Earnings per share (“EPS’)
The calculation of earnings per share is based on the profit attributable to the ordinary equity holders of the Company. Earnings per share were calculated as follows:
2013
Profit
Weighted-average number of shares
outstanding during the year
(thousand shares) EPS (in dollars) Basic earnings per share:
Profit attributable to ordinary equity holders
$ 747,450
3,258,945
0.23
Diluted earnings per share: Profit attributable to ordinary equity
holders $ 747,450
3,258,945
0.23
2012
Profit
Weighted-average number of shares
outstanding during the year
(thousand shares) EPS (in dollars) Basic earnings per share:
Profit attributable to ordinary equity holders
$ 655,200
3,258,945
0.20
Diluted earnings per share: Profit attributable to ordinary equity
holders $ 655,200
3,258,945
0.20
194

43
EVA AIRWAYS CORP.
Notes to Parent-Company-Only Financial Statements
(Continued)
(p) Revenue
For the years ended December 31, 2013 and 2012, the components of revenue were as follows:
2013 2012
Aviation transportation revenue $ 103,132,888 99,969,007Others 7,614,574 7,178,800 $ 110,747,462 107,147,807 The Company has a customer loyalty program to improve its ticket sales. Upon purchasing, customers are awarded credits entitling them to exchange for an upgrade or free tickets. As of December 31, 2013 and 2012 and January 1, 2012, the abovementioned deferred revenue amounting to $1,595,096, $2,118,330 and $2,155,782, respectively, were recorded as unearned revenue and other non-current liabilities.
(q) Non-operating income and expenses
1. Other income
2013 2012
Interest income $ 220,976 181,810Dividend income 113,432 112,393 $ 334,408 294,203
2. Other gains and losses
2013 2012
Foreign exchange gains (losses) $ (341,667) 827,097Losses on disposal of property, plant and equipment (160,148) (31,863)Others 127,106 129,345 $ (374,709) 924,579
195

44
EVA AIRWAYS CORP.
Notes to Parent-Company-Only Financial Statements
(Continued)
3. Finance costs
2013 2012
Interest expense
Bank borrowings $ 943,850 1,031,013Lease liabilities 345,713 415,674Others 236,523 216,148Less: capitalized interest (60,956) (11,281)
$ 1,465,130 1,651,554
(r) Financial instruments
1. Type of financial instruments
(1) Financial assets
2013.12.31 2012.12.31 2012.1.1 Derivative financial assets for hedge purposes $ 26,090 13,353 69,953Available-for-sale financial assets-current 1,799,429 2,106,688 2,410,548Available-for-sale financial assets-non-current
3,092,037 2,903,306
3,107,328
Loans and receivables: Cash and cash equivalents 20,012,604 19,157,798 13,666,643Notes and accounts receivable, and other
receivables (including related parties) 6,734,307
7,186,539
6,993,587
26,746,911 26,344,337 20,660,230Other non-current assets 1,204,199 1,103,219 1,795,186 $ 32,868,666 32,470,903 28,043,245
(2) Financial liabilities
2013.12.31 2012.12.31 2012.1.1
Financial liabilities at amortized cost: Accounts payable (including related parties) $ 5,244,068 6,943,501 4,624,192Bonds payable 21,200,000 16,700,000 10,200,000Long-term borrowings (including current
portion of long-term liabilities) 38,929,239
46,440,090
54,932,308
Other payables 9,682,100 8,142,076 8,167,005Lease liabilities 6,957,087 8,882,533 10,525,724
$ 82,012,494 87,108,200 88,449,229
196

45
EVA AIRWAYS CORP.
Notes to Parent-Company-Only Financial Statements
(Continued)
2. Credit risk
(1) Credit risk exposure
The maximum exposure to credit risk is mainly from the carrying amount of financial assets. As of December 31, 2013 and 2012, and January 1, 2012, such exposure amounted to $32,868,666, $32,470,903 and $28,043,245, respectively.
(2) Circumstances of concentration of credit risk
Accounts receivable were due from many customers. Therefore, there was no concentration of credit risk. In order to reduce the credit risk of accounts receivable, the Company continually evaluates each customer’s financial situation and requires customers to be a member of IATA clearing house. Otherwise, the customer will have to provide bank guaranties or collaterals.
3. Liquidity risk The following were the contractual maturities of financial liabilities, including estimated interest payments:
Carrying
amount Contractualcash flows
Within 1 year
1-5 years
Over 5 years
As of December 31, 2013 Non-derivative financial liabilities
Long-term borrowings $ 38,929,239 41,222,569 7,950,315 24,343,966 8,928,288Secured bonds payable 21,200,000 22,125,325 270,424 21,854,901 - Lease liabilities 6,957,087 7,755,652 1,856,034 5,200,415 699,203Accounts payable (including related parties) 5,244,068 5,244,068 5,244,068 - - Other payables 9,682,100 9,682,100 9,682,100 - -
$ 82,012,494 86,029,714 25,002,941 51,399,282 9,627,491As of December 31, 2012 Non-derivative financial liabilities
Long-term borrowings $ 46,440,090 48,895,044 9,560,830 26,571,113 12,763,101Secured bonds payable 16,700,000 17,585,625 219,050 17,366,575 - Lease liabilities 8,882,533 10,130,130 1,939,421 6,527,659 1,663,050Accounts payable (including related parties) 6,943,501 6,943,501 6,943,501 - - Other payables 8,142,076 8,142,076 8,142,076 - -
$ 87,108,200 91,696,376 26,804,878 50,465,347 14,426,151As of January 1, 2012 Non-derivative financial liabilities
Long-term borrowings $ 54,932,308 58,478,194 10,047,013 30,217,399 18,213,782Secured bonds payable 10,200,000 10,828,875 139,750 10,689,125 - Lease liabilities 10,525,724 12,266,212 1,998,821 7,526,461 2,740,930Accounts payable (including related parties) 4,624,192 4,624,192 4,624,192 - - Other payables 8,167,005 8,167,005 8,167,005 - -
$ 88,449,229 94,364,478 24,976,781 48,432,985 20,954,712
197

46
EVA AIRWAYS CORP.
Notes to Parent-Company-Only Financial Statements
(Continued)
The Company is not expecting that the cash flows including the maturity analysis could occur significantly earlier or at significantly different amounts.
4. Currency risk
(1) Exposure to currency risk
The Company’s significant exposure to foreign currency risk was as follows:
2013.12.31 2012.12.31 2012.1.1 Foreign currency
Exchange NTD
Foreign currency
Exchange NTD
Foreign currency
Exchange NTD
(in thousands) rate (in thousands) rate (in thousands) rate Financial assets
Monetary items USD $ 100,101 29.805 2,983,505 85,598 29.04 2,485,799 74,282 30.28 2,248,912EUR 5,665 41.09 232,775 5,913 38.49 227,586 4,603 39.18 180,356JPY 672,612 0.2839 190,955 423,514 0.3364 142,470 421,111 0.3906 164,486HKD 216,691 3.84 832,744 240,418 3.75 900,848 199,684 3.90 778,168CNY 1,322,590 4.92 6,505,820 566,978 4.66 2,642,119 753,013 4.81 3,619,734
$ 10,745,799 6,398,822 6,991,656Financial liabilities
Monetary items USD $ 624,730 29.805 18,620,078 777,022 29.04 22,564,707 880,156 30.28 26,646,715EUR 9,526 41.09 391,423 7,851 38.49 302,186 6,440 39.18 252,315JPY 1,475,251 0.2839 418,824 1,242,389 0.3364 417,940 1,054,213 0.3906 411,776HKD 2,997 3.84 11,517 14,989 3.75 56,165 20,456 3.90 79,716CNY 293,241 4.92 1,442,452 238,621 4.66 1,111,972 162,644 4.81 781,829
$ 20,884,294 24,452,970 28,172,351
(2) Sensitivity analysis
The Company’s exposure to foreign currency risk arises from the translation of the foreign currency exchange gains and losses on cash and cash equivalents, notes receivable, accounts receivable (including related parties), available-for-sale financial assets-non-current, refundable deposits (included in other non-current assets), long-term borrowings, accounts payable (including related parties), other payables, lease liabilities and restoration obligations (included in other non-current liabilities) that are denominated in foreign currency. A 1% depreciation (appreciation) of the NTD against the USD, EUR, HKD, CNY and JPY as of December 31, 2013 and 2012, would have decreased (increased) the profit by $101,385 and $180,542 in 2013 and 2012, respectively. The analysis assumes that all other variables remain constant. The analysis is performed on the same basis for 2013 and 2012.
198

47
EVA AIRWAYS CORP.
Notes to Parent-Company-Only Financial Statements
(Continued)
(3) Interest rate risk
The liquidity risk and interest rate exposure of the Company’s financial liabilities are illustrated in note (s).
The following sensitivity analysis is based on the exposure to interest rate risk of the non-derivative financial instruments on the reporting date. For variable-rate instruments, the sensitivity analysis assumes the variable-rate liabilities are outstanding for the whole year on the reporting date. The Company’s internal department reported the increases/decreases in the interest rates and the exposure to changes in interest rates on 100 basis points to the Company’s key management so as to allow key management to assess the reasonableness of the changes in the interest rates.
If the interest rate increases (decreases) by 1% all other variable factors that remain constant, the profit of the Company will decrease (increase) $413,149 and $500,940 for the years ended December 31, 2013 and 2012, respectively due to the Company’s floating-interest borrowings.
(4) Fair value
(i) Fair value and carrying amount
Aside from those listed as follows, the Company’s management believes the carrying amounts of its financial assets and financial liabilities at amortized cost are approximately equal to their fair value.
2013.12.31 2012.12.31 2012.1.1 Carrying
amount
Fair value Carrying amount
Fair value
Carrying amount
Fair value
Financial liabilities: Secured bonds payable $ 21,200,000 20,964,867 16,700,000 16,532,696 10,200,000 10,099,526Long-term borrowings 2,740,934 2,816,716 2,323,057 2,456,384 2,855,981 3,199,182Lease liabilities 1,830,499 1,886,325 2,905,535 3,070,120 3,708,809 4,003,664 $ 25,771,433 25,667,908 21,928,592 22,059,200 16,764,790 17,302,372
199
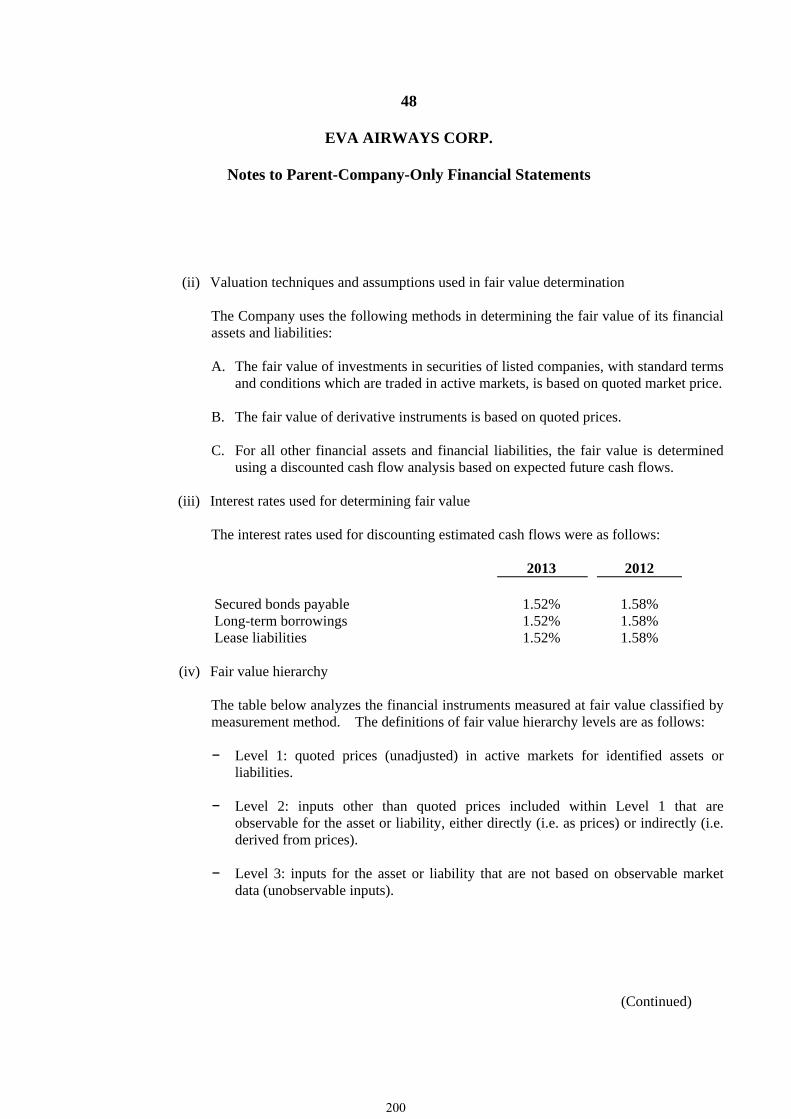
48
EVA AIRWAYS CORP.
Notes to Parent-Company-Only Financial Statements
(Continued)
(ii) Valuation techniques and assumptions used in fair value determination
The Company uses the following methods in determining the fair value of its financial assets and liabilities:
A. The fair value of investments in securities of listed companies, with standard terms
and conditions which are traded in active markets, is based on quoted market price.
B. The fair value of derivative instruments is based on quoted prices.
C. For all other financial assets and financial liabilities, the fair value is determined using a discounted cash flow analysis based on expected future cash flows.
(iii) Interest rates used for determining fair value
The interest rates used for discounting estimated cash flows were as follows:
2013 2012 Secured bonds payable 1.52% 1.58% Long-term borrowings 1.52% 1.58% Lease liabilities 1.52% 1.58%
(iv) Fair value hierarchy
The table below analyzes the financial instruments measured at fair value classified by measurement method. The definitions of fair value hierarchy levels are as follows:
− Level 1: quoted prices (unadjusted) in active markets for identified assets or
liabilities.
− Level 2: inputs other than quoted prices included within Level 1 that are observable for the asset or liability, either directly (i.e. as prices) or indirectly (i.e. derived from prices).
− Level 3: inputs for the asset or liability that are not based on observable market
data (unobservable inputs).
200

49
EVA AIRWAYS CORP.
Notes to Parent-Company-Only Financial Statements
(Continued)
Level 1 Level 2 Level 3 Total
As of December 31, 2013 Available-for-sale financial assets $ 3,327,698 - 1,563,768 4,891,466Derivative financial assets - 26,090 - 26,090 $ 3,327,698 26,090 1,563,768 4,917,556 As of December 31, 2012 Available-for-sale financial assets $ 3,492,993 - 1,517,001 5,009,994Derivative financial assets - 13,353 - 13,353 $ 3,492,993 13,353 1,517,001 5,023,347
As of January 1, 2012 Available-for-sale financial assets $ 3,717,717 - 1,800,159 5,517,876Derivative financial assets - 69,953 - 69,953 $ 3,717,717 69,953 1,800,159 5,587,829
(v) Movements in fair value measurements of financial assets in Level 3 and sensitivity
analysis.
The following table shows a reconciliation from the beginning balance to the ending balances for fair value measurements in Level 3 of the fair value hierarchy:
Unquoted equity instruments
Beginning balance at January 1, 2013 $ 1,517,001 Recognized in other comprehensive income 46,767 Balance at December 31, 2013 $ 1,563,768 Beginning balance at January 1, 2012 $ 1,800,159 Recognized in other comprehensive income (283,158) Balance at December 31, 2012 $ 1,517,001 The fair value hierarchy levels of financial assets were not transferred in 2013 and 2012.
201
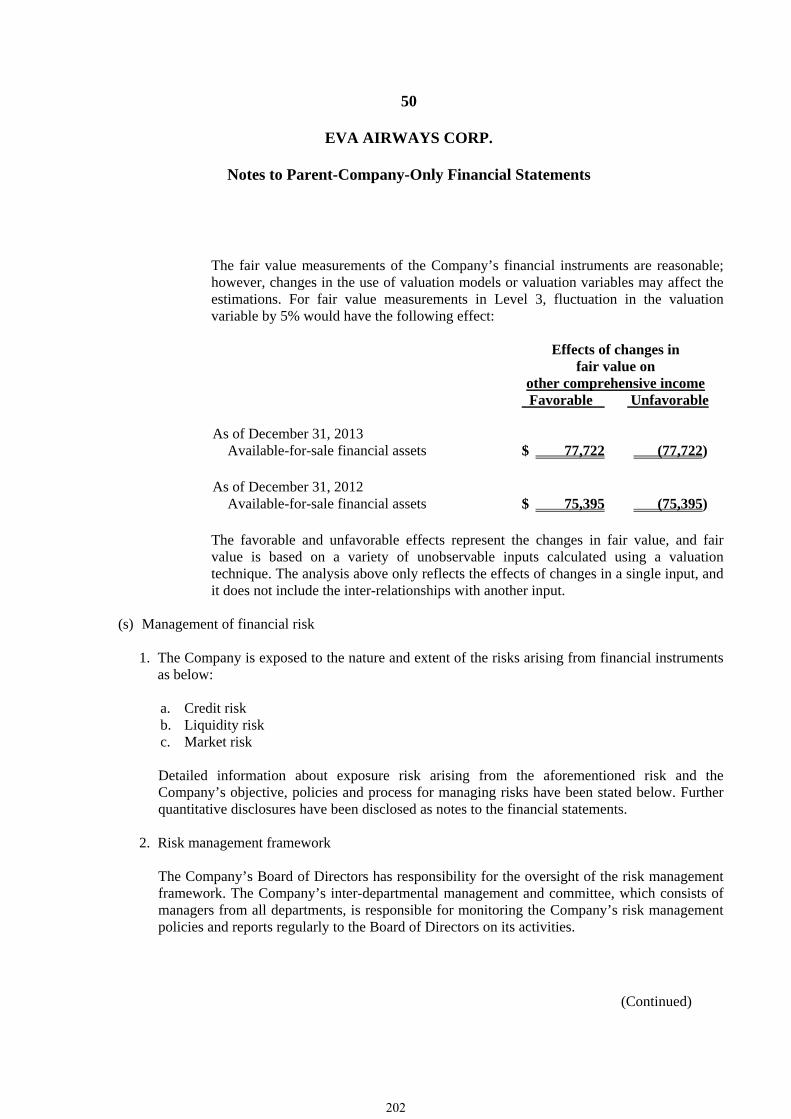
50
EVA AIRWAYS CORP.
Notes to Parent-Company-Only Financial Statements
(Continued)
The fair value measurements of the Company’s financial instruments are reasonable; however, changes in the use of valuation models or valuation variables may affect the estimations. For fair value measurements in Level 3, fluctuation in the valuation variable by 5% would have the following effect:
Effects of changes in fair value on
other comprehensive income Favorable Unfavorable
As of December 31, 2013
Available-for-sale financial assets $ 77,722 (77,722) As of December 31, 2012
Available-for-sale financial assets $ 75,395 (75,395)
The favorable and unfavorable effects represent the changes in fair value, and fair value is based on a variety of unobservable inputs calculated using a valuation technique. The analysis above only reflects the effects of changes in a single input, and it does not include the inter-relationships with another input.
(s) Management of financial risk
1. The Company is exposed to the nature and extent of the risks arising from financial instruments as below: a. Credit risk b. Liquidity risk c. Market risk Detailed information about exposure risk arising from the aforementioned risk and the Company’s objective, policies and process for managing risks have been stated below. Further quantitative disclosures have been disclosed as notes to the financial statements.
2. Risk management framework
The Company’s Board of Directors has responsibility for the oversight of the risk management framework. The Company’s inter-departmental management and committee, which consists of managers from all departments, is responsible for monitoring the Company’s risk management policies and reports regularly to the Board of Directors on its activities.
202
51
EVA AIRWAYS CORP.
Notes to Parent-Company-Only Financial Statements
(Continued)
The Company’s risk management policies are established to identify and analyze the risks faced by the Company, to set appropriate risk limits and controls, and to monitor risks and adherence to limits. The inter-department management and committee are reviewed regularly to reflect change in market conditions and the Company’s activities. The Company, through its training and management standards and procedures, aims to develop a disciplined and constructive control environment in which all employees understand their roles and obligations. The Company’s supervisors oversee how management monitors compliance with the Company’s risk management policies and procedures and reviews the adequacy of the risk management framework in relation to the risk faced by the Company. The Company’s supervisors are assisted in this oversight role by the internal auditor. The internal auditor reviews the risk controls and procedures, and reports the results on a regular or irregular basis to the supervisors.
3. Credit risk Credit risk is the risk of financial loss to the Company if a customer or counterparty to financial instruments fails to meet its contractual obligations and arises principally from the Company’s receivables from customers and investments in securities. (1) Notes and accounts receivable
The Company’s exposure to credit risk is influenced mainly by the individual characteristic of each customer. In accordance with the Company’s credit policy, each customer is analyzed individually for creditworthiness, and is required to be a member of IATA clearing house. Otherwise, the customer will have to provide bank guarantees or collaterals before its credit terms and credit limit are offered. Credit limit is offered to each customer as the limit of transactions and is reviewed regularly. The transaction amount of the majority of the Company’s customers is not significant, leading to an insignificant influence of loss from credit risk arising from single customer on the Company. The Company set up the allowance for doubtful accounts to reflect the estimated loss of notes and accounts receivable. The major component of the allowance account includes the specific loss component related to individually significant exposure.
(2) Investments The credit risk exposure in the bank deposits, fixed income investments and other financial instruments are measured and monitored by the Company’s finance department. Since the Company’s transactions are with external parties with good credit standing, highly rated financial institutions, publicly traded stock companies and unlisted companies with good reputation, there are no non-compliance issues and therefore no significant credit risk.
203

52
EVA AIRWAYS CORP.
Notes to Parent-Company-Only Financial Statements
(Continued)
(3) Guarantees As of December 31, 2013, the Company did not provide guarantee.
4. Liquidity risk Liquidity risk is a risk that the Company will encounter difficulty in meeting the obligations associated with its financial liabilities that are settled by delivering cash or another financial asset. The Company’s approach to managing liquidity risk is to ensure, as far as possible, that it always has sufficient liquidity to meet its liabilities when due, under both normal and stressed conditions, without incurring unacceptable losses or risking damage to the Company’s reputation.
The Company’s finance department monitors the needs for cash flows, and plans optional return from investments of idle capital. The Company aims to maintain the level of its cash and cash equivalents at an amount to cope with expected cash outflows on operation, including meeting its financial obligations. This excludes the potential impact of extreme circumstances that cannot reasonably be predicted, such as natural disasters.
5. Market risk
Market risk is the risk that changes in market prices, such as foreign exchange rates, interest rates and equity prices that will affect the Company’s income or the value of its holdings of financial instruments. The objective of market risk management is to manage and control market risk exposures within acceptable parameters, while optimizing the return.
(1) Currency risk
The Company is exposed to currency risk on sales, purchases and borrowings that are denominated in a currency other than the respective functional currencies of the Company, primarily the TWD and USD. The currencies used in these transactions are principally denominated in TWD, CNY, EUR, USD, and JPY.
204

53
EVA AIRWAYS CORP.
Notes to Parent-Company-Only Financial Statements
(Continued)
The Company hedges its cash and cash equivalents, trade receivables from sales, trade payables to purchase and leases payments for aircraft denominated in a foreign currency. When necessary, the Company uses foreign currency financing and forward exchange contracts to hedge its currency risk. The financial department proactively collects information of currency to monitor the trend of currency rate and keeps connection with the foreign currency department of banks to collect the market information for securing the currency risk.
(2) Interest rate risk
The Company enters into and designates interest rate swaps as hedges of the variability in interest rate risk from long-term borrowings.
(3) Other market price risk
The Company monitors the risk arising from its available-for-sale security instruments, which are held for monitoring cash flow requirements and unused capital. The management of the Company monitors the combination of equity securities and open-market funds in its investment portfolio based on cash flow requirements. Material investments within the portfolio are managed on an individual basis, and all buy-and-sell decisions are approved by the Board of Directors.
(t) Capital management
The Board of Directors’ policy is to maintain a strong capital base to maintain the confidence of investors, creditors, and the market and to sustain future development of the business. The Board of Directors monitors the level of dividends to ordinary equity holders as well as future operation of the business. As of December 31, 2013, there were no changes in the Company’s approach to capital management.
205

54
EVA AIRWAYS CORP.
Notes to Parent-Company-Only Financial Statements
(Continued)
7. Transactions with related parties
(a) Relationships between parent and subsidiaries
A detailed list of the Company’s subsidiaries is as follows:
Country of Ownership interest (shareholding%) Name incorporation 2013.12.31 2012.12.31 2012.1.1
Evergreen Airline Services Corp. Taiwan 56.33% 56.33% 56.33% Evergreen Sky Catering Corp. Taiwan 49.80% 49.80% 49.80% Evergreen Aviation Technologies Corp. Taiwan 80.00% 80.00% 80.00% Evergreen Air Cargo Services Corp. Taiwan 60.00% 60.00% 60.00% Hsiang-Li Investment Corp. Taiwan 100.00% 100.00% 100.00% RTW Air Services (S) Pte. Ltd. Singapore 49.00% 49.00% 49.00% Green Siam Air Services Co., Ltd. Thailand 49.00% 49.00% 49.00% Evergreen Airways Service (Macau) Ltd. Macau 99.00% 99.00% 99.00% PT Perdana Andalan Air Service Indonesia 51.00% 51.00% 51.00% Sky Castle Investment Ltd. Samoa 100.00% 100.00% 100.00% Concord Pacific Ltd. Samoa 100.00% 100.00% 100.00% Sino Gain Ltd. Samoa 100.00% 100.00% 100.00% EVA Flight Training Academy USA 100.00% - -
(b) Parent company and ultimate controlling party
The Company is the ultimate controlling party of the Company.
(c) Significant transactions with related parties
1. Operating revenue
Significant sales to related parties of the Company were as follows:
2013 2012
Subsidiaries $ 207,542 300,447Associates 13 - Others 1,131,729 893,916 $ 1,339,284 1,194,363
206

55
EVA AIRWAYS CORP.
Notes to Parent-Company-Only Financial Statements
(Continued)
Related parties leased aircraft from the Company to operate cross-strait flights between Mainland China and Taiwan. The rental is charged by actual flight hours and recorded under operating revenue. The prices for sales to related parties are not materially different from those of the third-parties sales. The payment terms are within 1~3 months, which do not materially differ from those of the third-party transactions. There was no collateral on the accounts receivable from related parties. Provisions for bad debt expenses were accrued properly after assessment.
2. Purchase Significant purchases from related parties of the Company were as follows:
2013 2012 Subsidiaries $ 8,736,244 8,988,725Associates 4,356 3,235Others 1,180,030 1,074,721 $ 9,920,630 10,066,681
Operating expenses from transactions with related parties were as follows:
2013 2012
Subsidiaries $ 196,259 197,794Associates 45,855 46,338Others 331,309 258,595 $ 573,423 502,727
The prices for purchases from related parties are not materially different from those of the third-party vendors. The payment terms are within 1~3 months, which do not materially differ from those of third-party transactions.
3. The Company sold spare parts amounting to $10,714 and $940,533 to subsidiaries for the years
ended December 31, 2013 and 2012, respectively.
4. One subsidiary provides maintenance services for aircraft and engines for the Company. For the years ended December 31, 2013 and 2012, the amounts were $3,069,303 and $3,116,041, respectively, recorded under aircraft and machinery and equipment.
207

56
EVA AIRWAYS CORP.
Notes to Parent-Company-Only Financial Statements
(Continued)
5. Property transaction
The Company sold two aircraft for US$97,067 to one subsidiary on November 27, 2009, and immediately bought them back by installments. There were no gains or losses on disposal recorded for this sale and buyback transaction.
6. Construction commitment In February 2012, the Company entered into a contract amounting to $720,000 with related parties for the purpose of construction of its training center. As of December 31, 2013 and 2012, the unpaid contract price amounted to $198,598 and $460,080, respectively.
7. Endorsement and guarantees
The details of guarantees to the Company’s subsidiary were as follows:
2013.12.31 2012.12.31 2012.1.1 Foreign currency
(in thousands)
NTD Foreign currency
(in thousands)
NTD Foreign currency
(in thousands)
NTD
- - USD 8,265 $ 250,470 USD 32,500 $ 984,100
8. Receivables from related parties
Receivables from related parties of the Company were as follows:
Account
Class of related parties
2013.12.31
2012.12.31
2012.1.1
Accounts receivable Subsidiaries $ 12,802 17,647 30,850Accounts receivable Others 118,954 150,249 147,706Other receivables Subsidiaries 5,516 17,544 468,506Other receivables Associates 15 2 - Other receivables Others (note) 108,633 89,895 63,532 $ 245,920 275,337 710,594
208

57
EVA AIRWAYS CORP.
Notes to Parent-Company-Only Financial Statements
(Continued)
Note: As of December 31, 2012 and January 1, 2012, the overdue accounts receivable were reclassified to other receivables. The aging for the abovementioned overdue accounts receivable were shown below:
2012.12.31
Aging for overdue accounts receivable
Name Amount Overdue
1-6 months Overdue
7-12 monthsOverdue
one year
Shanghai Airlines Cargo International Co., Ltd. $ 15,722 - - 15,722
2012.1.1
Aging for overdue accounts receivable
Name Amount Overdue
1-6 months Overdue
7-12 monthsOverdue
one year
Shanghai Airlines Cargo International Co., Ltd. $ 18,920 5,979 1,612 11,329
9. Payables to related parties
Payables to related parties of the Company were as follows:
Account
Class of related parties
2013.12.31
2012.12.31
2012.1.1
Accounts payable Subsidiaries $ 3,195,068 3,514,170 2,711,292Accounts payable Associates 352 325 44Accounts payable Others 200,133 105,177 111,656Other payables Subsidiaries 137,570 52,128 99,997Other payables Associates 3,975 3,975 4,048Other payables Others 288,578 50,625 69,497 $ 3,825,676 3,726,400 2,996,534
(d) Key management personnel compensation
Key management personnel compensation comprised the following:
2013 2012 Short-term employee benefits $ 31,318 31,858Post-employment benefits 6,879 2,628
$ 38,197 34,486
209

58
EVA AIRWAYS CORP.
Notes to Parent-Company-Only Financial Statements
(Continued)
8. Pledged assets
The book values of the pledged assets were as of follows:
Pledged assets Object 2013.12.31 2012.12.31 2012.1.1 Property, plant and equipment
Long-term borrowings $ 49,720,827
56,576,010
65,195,313
Available-for-sale financial assets-non-current
Contract performance guaranties
89,274
100,070
121,090
Time deposit-included in other non-current assets
Letters of credit, customs duty, and contract performance guaranties
71,980
70,832
72,363
Inventories Long-term borrowings - - 500,033 $ 49,882,081 56,746,912 65,888,799
9. Commitments and contingencies
(a) Significant contingencies: None.
(b) Significant commitments:
1. In May 2012 and October 2013, the Company entered into aircraft purchase contracts with Boeing Company and four subsidiaries of GECAS for 7 Boeing 777 aircraft. The total amount of the contracts price is US$2,261,094. The Company has partially paid the price as follows:
2013.12.31 2012.12.31 2012.1.1
Advances for purchases of equipment-included
in other non-current assets $ 4,658,998
1,656,044
-
2. Unused letters of credit for the Company were as follows:
2013.12.31 2012.12.31 2012.1.1 Unused letters of credit $ 2,122,531 1,924,209 1,704,293
210

59
EVA AIRWAYS CORP.
Notes to Parent-Company-Only Financial Statements
(Continued)
10. Significant disaster losses: none
11. Significant subsequent events: none
12. Others
A summary of employee expenses, depreciation and amortization expenses, by function, is as follows:
2013 2012 Operating Operating Operating Operating
cost expenses Total cost expenses Total Personnel expenses
Salaries $ 4,322,107 3,322,224 7,644,331 3,913,762 3,048,906 6,962,668 Labor and health
insurance 229,014 194,122 423,136 210,586 171,721 382,307 Pension 263,225 138,113 401,338 246,155 127,569 373,724 Others 1,642,573 393,870 2,036,443 1,450,093 430,875 1,880,968
Depreciation (Note) 9,679,624 268,827 9,948,451 9,905,184 221,059 10,126,243 Amortization - 94,283 94,283 - 49,681 49,681
Note: For the years ended December 31, 2013 and 2012, the depreciation expenses recognized were $10,083,867 and $10,261,659, respectively, less deferred gains of $135,416 and $135,416, respectively.
13. Operating segments Please see the consolidated financial statements for the year ended December 31, 2013.
14. First-time adoption of IFRSs approved by the FSC
The Company’s financial statements as of December 31, 2012, were previously prepared in accordance with accounting principles generally accepted in the R.O.C. (R.O.C. GAAP.) As described in note 4(a), the parent-company-only financial statements have been prepared in accordance with the “Regulations Governing the Preparation of Financial Reports by Securities Issuers”.
211

60
EVA AIRWAYS CORP.
Notes to Parent-Company-Only Financial Statements
(Continued)
The accounting policies described in note 4 have been adopted when preparing the comparative parent-company-only financial statements for the year ended December 31, 2012, the balance sheet as of December 31, 2012, and the initial IFRS balance sheet as of January 1, 2012 (the Company’s conversion date).
In preparing the financial statements for the years 2012, the Company has adjusted amounts reported previously in the financial statements prepared in accordance with R.O.C. GAAP. An explanation of how the transition to IFRSs approved by the FSC has affected the Company’s financial position, financial performance, and cash flows is set out in the following tables and the notes that accompany the tables. The adjustments of the parent-company-only balance sheets at December 31, 2012, and January 1, 2012 (the Company’s conversion date) and statement of comprehensive income for 2012 were as follows:
(a) Reconciliation of balance sheets items
2012.12.31 2012.1.1
ROC GAAP
Effect of transition to
IFRSs
IFRSs
ROC GAAP
Effect of transition to
IFRSs
IFRSs Assets
Cash and cash equivalents $ 19,157,798 - 19,157,798 13,666,643 - 13,666,643Available-for-sale financial assets-current 2,106,688 - 2,106,688 2,410,548 - 2,410,548Notes and accounts receivable, net (including related
parties) 7,029,233 - 7,029,233
6,418,453
- 6,418,453
Inventories (1) 6,504,322 (3,706,985) 2,797,337 7,804,560 (3,970,762) 3,833,798Other current assets (1), (2) 1,169,199 (394,911) 774,288 2,541,240 (1,305,608) 1,235,632
Total current assets 35,967,240 (4,101,896) 31,865,344 32,841,444 (5,276,370) 27,565,074Available-for-sale financial assets-non-current (3), (9) 754,380 2,148,926 2,903,306 677,772 2,429,556 3,107,328Investments accounted for using equity method (4) 11,074,640 (1,277,649) 9,796,991 10,241,855 (261,009) 9,980,846Financial assets carried at cost-non-current (3), (9) 2,530,348 (2,530,348) - 2,530,348 (2,530,348) - Property, plant and equipment (1), (8) 80,598,176 8,416,523 89,014,699 87,529,888 8,022,254 95,552,142Intangible assets (6) 225,167 78,166 303,333 301,345 (175,897) 125,448Deferred tax assets (2) 4,494,062 642,014 5,136,076 3,202,626 1,718,291 4,920,917Other non-current assets (1), (8) 1,406,552 1,867,649 3,274,201 1,920,634 (112,623) 1,808,011
Total non-current assets 101,083,325 9,345,281 110,428,606 106,404,468 9,090,224 115,494,692Total assets $ 137,050,565 5,243,385 142,293,950 139,245,912 3,813,854 143,059,766Liabilities
Short-term borrowings $ - - - - - - Accounts payable (including related parties) 6,943,501 - 6,943,501 4,624,192 - 4,624,192
Other current liabilities (5), (6) 28,999,208 660,470 29,659,678 28,759,493 195,229 28,954,722Total current liabilities 35,942,709 660,470 36,603,179 33,383,685 195,229 33,578,914
Long-term borrowings (including bonds payable) 54,273,929 - 54,273,929 55,949,166 - 55,949,166 Lease liability-non-current 7,335,153 - 7,335,153 9,003,131 - 9,003,131 Deferred tax liabilities (2) - 226,864 226,864 - - - Accrued employee retirement liabilities (6) 1,464,274 1,071,584 2,535,858 1,357,097 1,093,231 2,450,328 Other non-current liabilities (1), (5), (6), (7) 1,481,039 4,470,006 5,951,045 1,679,558 4,204,616 5,884,174
Total non-current liabilities 64,554,395 5,768,454 70,322,849 67,988,952 5,297,847 73,286,799 Total liabilities 100,497,104 6,428,924 106,926,028 101,372,637 5,493,076 106,865,713 Common stock 32,589,450 - 32,589,450 32,589,450 - 32,589,450 Capital surplus (4) 2,626,446 (902,844) 1,723,602 2,626,446 (902,844) 1,723,602 Retained earnings (1), (2), (4), (5), (6), (7) 6,805,056 (4,909,580) 1,895,476 6,301,045 (4,629,297) 1,671,748 Other equity (1), (3), (6) (5,467,491) 4,626,885 (840,606) (3,643,666) 3,852,919 209,253
212

61
EVA AIRWAYS CORP.
Notes to Parent-Company-Only Financial Statements
(Continued)
2012.12.31 2012.1.1
ROC GAAP
Effect of transition to
IFRSs
IFRSs
ROC GAAP
Effect of transition to
IFRSs
IFRSs Total equity 36,553,461 (1,185,539) 35,367,922 37,873,275 (1,679,222) 36,194,053Total liabilities and equity $ 137,050,565 5,243,385 142,293,950 139,245,912 3,813,854 143,059,766
(b) Reconciliation of statement of comprehensive income items
2012
ROC GAAP
Effect of Transition to
IFRSs
IFRSs Operating revenue (5) $ 107,110,356 37,451 107,147,807Operating cost (1), (6), (7) (98,327,114) (745,020) (99,072,134)Gross profit from operations 8,783,242 (707,569) 8,075,673Operating expenses (6) (7,972,270) 92,704 (7,879,566)Net Operating income 810,972 (614,865) 196,107Non-operating income and expenses::
Other income 294,203 - 294,203Other gains and losses (1) 71,988 852,591 924,579Finance costs (1) (1,607,551) (44,003) (1,651,554)Share of profit of subsidiaries and associates accounted for using equity
method (4) 962,745
27,943
990,688
Profit before tax 532,357 221,666 754,023Income tax expenses (2) (28,346) (70,477) (98,823)Profit 504,011 151,189 655,200Other comprehensive income:
Exchange differences on translation of foreign financial statements (2,149,536) 2,074,857 (74,679)Unrealized gains (losses) on available-for-sale financial assets 109,753 (284,203) (174,450)Cash flow hedges (56,600) - (56,600)Net loss not recognized as pension cost (108,180) 108,180 - Actuarial losses on defined benefit plans (4) - (301,261) (301,261)Share of other comprehensive income of subsidiaries and associates - (933,111) (933,111)Income tax relating to components of other comprehensive 380,738 (321,968) 58,770
Other comprehensive income, net of tax (1,823,825) 342,494 (1,481,331)Comprehensive income $ (1,319,814) 493,683 (826,131)Earnings per common share
Basic earnings per share (dollars) $ 0.15 0.05 0.20
(c) Reconciliation of statement of cash flows: There are no significant differences between R.O.C. GAAP and IFRSs approved by the FSC in the statement of cash flows.
213

62
EVA AIRWAYS CORP.
Notes to Parent-Company-Only Financial Statements
(Continued)
(d) Explanation of reconciliation of significant differences:
1. The Company performs inspections or overhaul for the property, plant and equipment project
periodically. Major inspection or overhaul cost is recognized in the carrying amount of the item of property, plant and equipment as a replacement if the recognition criteria are met. In addition, the remaining carrying amount of the cost of previous inspection or overhaul should be derecognized. If the inspection or overhaul cost has not been separately identified when the asset was acquired or constructed, the estimated cost of a similar inspection or overhaul may be used as an indication of the existing inspection component. A provision is recognized if, as a result of a past event, the Company has a present obligation that can be estimated reliably, and it is probable that an outflow of economic benefits will be required to settle the obligation. Provisions are determined by discounting the expected future cash flows if the impact of time value of money is significant. Also, the IFRSs approved by the FSC do not include regulations, which are included in Decree No. 01666, which regards the fleet obtained via its own USD dollar funds and USD dollar loans and operated for international transportation of passengers and cargo as foreign operating units. Based on the aforementioned regulations, the Company made adjustments in inventories, other current assets, property, plant and equipment, other non-current assets, other non-current liabilities, retained earnings, and other equity as of December 31 and January 1, 2012. Also, the Company made adjustments in operating cost, interest expense, and foreign exchange gains (losses) for the year ended December 31, 2012.
2. The Company recognizes the taxable loss, income tax credit, and temporary differences as
deferred tax assets or liabilities, which are classified as non-current, to the extent that it is probable that there will be taxable income available in the future. The reclassification has no effect on the statement of comprehensive income for the year ended December 31, 2012, as well as the equity as of December 31 and January 1, 2012. As of December 31 and January 1, 2012, the Company remeasured temporary differences and adjusted the presentation of accounts, including other current assets, deferred tax assets, deferred tax liabilities, and retained earnings, in accordance with the IFRSs approved by the FSC. In addition, the Company made adjustments in the income tax expense for the year ended December 31, 2012.
3. The Company measures its financial assets by reference to the quoted price in active markets,
which is deemed to be the best evidence of the fair value of financial assets. If the market of financial assets is not active, the fair value is determined by using valuation techniques. The Company made adjustments in available-for-sale financial assets-non-current, financial assets carried at cost-non-current, and other equity as of December 31 and January 1, 2012.
214

63
EVA AIRWAYS CORP.
Notes to Parent-Company-Only Financial Statements
(Continued)
4. The variation in the proportion of share equity arising from the additional share issuance by affiliates in which the original shareholders do not acquire new shares proportionately was recognized as profit or loss. In addition, the IFRSs approved by the FSC do not include the regulations, which are included in Decree No. 045, requiring that capital surplus be recognized for the donated fixed assets. Due to the aforementioned regulations, the Company made adjustments in investment accounted for using equity method, capital surplus, and retained earnings as of December 31 and January 1, 2012. Also, the Company made adjustments in the share of profit of subsidiaries and associates accounted for using equity method for the year ended December 31, 2012.
5. The Company’s customer loyalty program, whereby customers are awarded credits known as
points at the timing of sale in exchange for free or discounted goods or services in the future, includes several identifiable components. The Company sells two items to its customers: goods or services and the points. The Company should estimate and defer the corresponding fair value of the points based on experience of the probability of redemption, and the revenue would not be recognized until the customers exercise their conversion in the future. The Company made adjustments in other current liabilities, other non-current liabilities, and retained earnings as of December 31 and January 1, 2012. Also, the Company made adjustments in operating revenue for the year ended December 31, 2012.
6. Based on the expected additional expenditures incurred by accumulated but unexercised rights
of leave, the Company measures the expected cost of accumulating compensated absences. Besides, when the actuarial gains and losses of pension occur, the actuarial gains and losses for the period shall immediately be recognized as other comprehensive income. The Company made adjustments in intangible assets, other current liabilities, accrued pension liabilities, other non-current liabilities, retained earnings, and other equity as of December 31 and January 1, 2012. Also, the Company made adjustments in operating cost and operating expenses for the year ended December 31, 2012.
7. The gains (losses) from sale of Company’s sale and leaseback transactions, whose sale price is
fair value, should be immediately recognized. The Company made adjustments in other non-current liabilities and retained earnings as of December 31 and January 1, 2012. Also, the Company made adjustments in operating cost for the year ended December 31, 2012.
8. The Company’s advances for purchases of equipment should be classified as long-term
prepayments according to its nature. The Company reclassified property, plant and equipment as other non-current assets in accordance with the regulations. The reclassification has no impact on the statement of comprehensive income for the year ended December 31, 2012, as well as the equity as of December 31 and January 1, 2012.
215
64
EVA AIRWAYS CORP.
Notes to Parent-Company-Only Financial Statements
9. In accordance with previous GAAP, the Company recognized actuarial gains (losses) as profit or
loss based on the residual period of service. At the conversion date, the Company recognized all the previously unrecognized accumulated actuarial gains (losses) as retained earnings in accordance with IFRS 1 First-time adoption of International Financial Reporting Standards. In addition, the Company designated the investment in securities of non-publicly listed companies as available-for-sale financial assets at the conversion date.
216


