Embed Size (px)
Citation preview
CRESCENT POINT ENERGY CORP. 1
FINANCIAL AND OPERATING HIGHLIGHTS
Three months ended September 30 Nine months ended September 30
(CDN$000s except shares, per share and per boe amounts) 2010 2009 % Change 2010 2009 % Change
Financial
Funds flow from operations (1) (3) 230,424 155,415 48 619,641 481,603 29
Per share (1) (2) (3) 0.91 0.96 (5) 2.70 3.19 (15)
Net income (loss) (4) (16,636) 45,357 (137) 74,372 (27,051) 375
Per share (2) (4) (0.07) 0.28 (125) 0.32 (0.18) 278
Dividends paid or declared 175,753 113,158 55 472,832 315,162 50
Per share (2) 0.69 0.69 - 2.07 2.07 -
Payout ratio (%) (1) 76 73 3 76 65 11
Per share (%) (1) (2) 76 72 4 77 65 12
Net debt (1) (5) 1,340,196 741,287 81 1,340,196 741,287 81
Capital acquisitions (net) (6) 1,446,164 523,566 176 1,996,277 987,946 102
Development capital expenditures 348,513 110,362 216 712,058 226,799 214
Weighted average shares outstanding (mm)
Basic 250.0 160.3 56 225.2 148.7 51
Diluted 254.0 162.6 56 229.1 151.1 52
Operating
Average daily production
Crude oil and NGLs (bbls/d) 58,390 40,854 43 52,519 37,635 40
Natural gas (mcf/d) 42,947 32,806 31 38,134 29,004 31
Total (boe/d) 65,548 46,322 42 58,875 42,469 39
Average selling prices (7)
Crude oil and NGLs ($/bbl) 70.54 67.97 4 72.44 60.70 19
Natural gas ($/mcf) 3.69 3.14 18 4.21 3.88 9
Total ($/boe) 65.25 62.17 5 67.35 56.44 19
Netback ($/boe)
Oil and gas sales 65.25 62.17 5 67.35 56.44 19
Royalties (10.49) (11.17) (6) (11.58) (9.69) 20
Operating expenses (11.27) (9.05) 25 (10.89) (8.69) 25
Transportation (1.49) (1.51) (1) (1.64) (1.54) 6
Netback prior to realized derivatives 42.00 40.44 4 43.24 36.52 18
Realized gain on derivatives (8) 1.25 1.27 (2) 0.66 4.64 (86)
Operating netback (1) 43.25 41.71 4 43.90 41.16 7
Crescent Point’s financial and operating results for the three months ending September 30, 2010 reflect the acquisition of Shelter Bay Energy Inc. (“Shelter Bay”) which closed July 2, 2010. Comparative financial and operating results do not reflect the production and cash flows of Shelter Bay other than the production and cash flows associated with Crescent Point’s interests in the wells farmed out to Shelter Bay by Crescent Point. Prior to July 2, 2010, Crescent Point accounted for its investment in Shelter Bay using the equity method of accounting. Accordingly, Crescent Point recorded its share of Shelter Bay net income or loss in the “equity and other income (loss)” caption on the consolidated statements of operations, comprehensive income and deficit.
(1) Funds flow from operations, payout ratio, net debt and operating netback as presented do not have any standardized meaning prescribed by Canadian generally accepted accounting principles and, therefore, may not be comparable with the calculation of similar measures presented by other entities.
(2) The per share amounts (with the exception of per share dividends) are the per share – diluted amounts. (3) Funds flow from operations for the nine month period ended September 30, 2009 includes a realized derivative gain on crystallization of various oil contracts
of $72.5 million. (4) Net income of $74.4 million for the nine months ended September 30, 2010 includes unrealized derivative gains of $8.2 million. The net loss of $27.1 million
for the nine months ended September 30, 2009 includes unrealized derivative losses of $147.4 million, a $72.5 million realized derivative gain on crystallization of various oil contracts and a $11.4 million bad debt provision for SemCanada.
(5) Net debt includes long-term debt, working capital and long-term investments, but excludes risk management assets, risk management liabilities and unrealized foreign exchange loss on translation of US dollar senior guaranteed notes.
(6) Capital acquisitions represent total consideration for the transactions including long-term debt and working capital assumed and, commencing January 1, 2010, excluding transaction costs.
(7) The average selling prices reported are before realized derivatives and transportation charges. (8) The realized derivative gain for the nine month period ended September 30, 2009 excludes a realized derivative gain on crystallization of $72.5 million.

CRESCENT POINT ENERGY CORP. 2
MANAGEMENT’S DISCUSSION AND ANALYSIS
Management’s discussion and analysis (“MD&A”) is dated November 4, 2010 and should be read in conjunction with the unaudited consolidated financial statements for the period ended September 30, 2010 and the audited consolidated financial statements and MD&A for the year ended December 31, 2009 for a full understanding of the financial position and results of operations of Crescent Point Energy Corp.
STRUCTURE OF THE BUSINESS
On July 2, 2009, Crescent Point Energy Trust (“Crescent Point” or the “Trust”) and Wild River Resources Ltd. (“Wild River”) completed a plan of arrangement (the “Wild River Arrangement”) whereby the Trust unitholders exchanged their trust units for common shares in Wild River on a one-to-one basis thereby effectively converting the Trust into a corporation. In addition, pursuant to the Wild River Arrangement, the shares of Wild River were consolidated on a 0.1512 for one basis prior to the exchange, the Board of Directors and management team of Wild River were replaced with Crescent Point’s existing Board of Directors and management team, and Wild River changed its name to Crescent Point Energy Corp. (“Crescent Point” or the “Company”). As a result of the Wild River Arrangement, the Trust was dissolved and Crescent Point Energy Corp. received all of the assets and assumed all of the liabilities of the Trust.
After completion of the Wild River Arrangement, the former unitholders of the Trust owned approximately 97 percent of the Company and the former shareholders of Wild River owned approximately 3 percent. In accordance with Canadian generally accepted accounting principles (“GAAP”), the Wild River Arrangement was accounted for as a reverse take-over, whereby the Trust was deemed to be the acquirer of Wild River. The consolidated financial statements have been prepared on a continuity of interest basis, which recognizes Crescent Point Energy Corp. as the successor entity to the Trust. As a result, in this MD&A, Crescent Point refers to common shares, shareholders and dividends which were formerly referred to as units, unitholders and distributions under the trust structure. Comparative amounts include the results of the Trust.
The principal undertakings of the Company are to carry on the business of acquiring and holding interests in petroleum and natural gas properties and assets related thereto through a general partnership and wholly owned subsidiaries. Amounts reported in this report are in Canadian dollars unless noted otherwise; United States (“US”) dollars are denoted as “US$”.
Non-GAAP Financial Measures
Throughout this discussion and analysis, the Company uses the terms “funds flow from operations”, “funds flow from operations per share”, “funds flow from operations per share–diluted”, “net debt”, “netback”, “operating netback”, “market capitalization” and “total capitalization”. These terms do not have any standardized meaning as prescribed by Canadian GAAP and, therefore, may not be comparable with the calculation of similar measures presented by other issuers.
Funds flow from operations is calculated based on cash flow from operating activities before changes in non–cash working capital, transaction costs and asset retirement obligation expenditures. Funds flow from operations per share–diluted is calculated based on cash flow from operating activities before changes in non-cash working capital, transaction costs and asset retirement obligation expenditures. Management utilizes funds flow from operations as a key measure to assess the ability of the Company to finance dividends, operating activities, capital expenditures and debt repayments. Funds flow from operations as presented is not intended to represent cash flow from operating activities, net earnings or other measures of financial performance calculated in accordance with Canadian GAAP.
The following table reconciles the cash flow from operating activities to funds flow from operations:
Three months ended September 30 Nine months ended September 30
($000) 2010 2009 % Change 2010 2009 % Change
Cash flow from operating activities 204,583 150,067 36 580,990 452,887 28
Changes in non-cash working capital 24,480 4,861 404 29,075 27,292 7
Transaction costs 951 - - 8,062 - -
Asset retirement expenditures 410 487 (16) 1,514 1,424 6
Funds flow from operations 230,424 155,415 48 619,641 481,603 29

CRESCENT POINT ENERGY CORP. 3
Net debt is calculated as current liabilities plus long-term debt less current assets and long term investments but excludes risk management assets, risk management liabilities and unrealized foreign exchange on translation of US dollar senior guaranteed notes. Management utilizes net debt as a key measure to assess the liquidity of the Company.
The following table reconciles long-term debt to net debt as at September 30, 2010 and 2009:
As at September 30
($000) 2010 2009 % Change
Long-term debt 1,214,705 907,561 34
Current liabilities 357,110 181,808 96
Current assets (171,755) (157,389) 9
Long-term investments (46,161) (207,682) (78)
Excludes:
Risk management asset 14,110 25,120 (44)
Risk management liability (25,079) (8,131) 208
Unrealized foreign exchange loss on translation of US dollar senior guaranteed notes (2,734) - -
Net debt 1,340,196 741,287 81
Netback is calculated on a per boe basis as oil and gas sales, less royalties, operating and transportation expenses and realized derivative gains and losses including derivative crystallizations. Operating netback is calculated as netback excluding gains and losses arising from derivative crystallizations. Operating netback and netback are used by management to measure operating results on a per boe basis to better analyze performance against prior periods on a comparable basis.
Market capitalization is calculated by applying the period end closing share trading price to the number of shares outstanding. Market capitalization is an indication of the enterprise value.
Total capitalization is calculated as market capitalization plus current liabilities and long-term debt, less current assets and long term investments, but excludes risk management assets, risk management liabilities and unrealized foreign exchange on translation of US dollar senior guaranteed notes. Total capitalization is used by management to assess the amount of debt leverage used in the Company’s capital structure.
Forward-Looking Information
Cautionary Statement Regarding Forward-Looking Information and Statements
Certain statements contained in this report constitute forward-looking statements and are based on Crescent Point’s beliefs and assumptions based on information available at the time the assumption was made. By its nature, such forward-looking information involves known and unknown risks, uncertainties and other factors that may cause actual results or events to differ materially from those anticipated in such forward-looking statements. The Company believes the expectations reflected in those forward-looking statements are reasonable but no assurance can be given that these expectations will prove to be correct and such forward-looking statements should not be unduly relied upon. These statements are effective only as of the date of this report.
Certain statements contained in this report, including statements related to Crescent Point’s capital expenditures, projected asset growth, view and outlook toward future commodity prices, drilling activity and statements that contain words such as "could", "should", "can", "anticipate", "expect", "believe", "will", "may", “projected”, “sustain”, “continues”, “strategy”, “potential”, “projects”, “grow”, “take advantage”, “estimate”, “well positioned” and similar expressions and statements relating to matters that are not historical facts constitute "forward-looking information" within the meaning of applicable Canadian securities legislation. The material assumptions in making these forward-looking statements are disclosed in this analysis under the headings “Dividends”, “Capital Expenditures”, “Asset Retirement Obligation”, “Liquidity and Capital Resources”, “Critical Accounting Estimates”, “New Accounting Pronouncements” and “Outlook”.
In particular, forward-looking information and statements include, but are not limited to:
• Crescent Point’s 2010 guidance as outlined in the Outlook section;
• Maintaining monthly dividends; and
• Projected average net debt to 12 month funds flow of approximately 1.0 times.
All of the material assumptions underlying these statements are noted in the “Outlook” and “Liquidity and Capital Resources” sections of this report. All of the material risks underlying these statements are outlined below.
The following are examples of references to forward-looking information:
• Volume and product mix of Crescent Point’s oil and gas production;
• Future oil and gas prices and interest rates in respect of Crescent Point’s commodity risk management programs;
• The amount and timing of future asset retirement obligations;
• Future liquidity and financial capacity;
• Future interest rates;
CRESCENT POINT ENERGY CORP. 4
• Future results from operations and operating metrics;
• Future development, exploration and other expenditures;
• Future costs, expenses and royalty rates;
• Future tax rates; and
• The Company’s tax pools.
This disclosure contains certain forward-looking estimates that involve substantial known and unknown risks and uncertainties, certain of which are beyond Crescent Point’s control. Therefore, Crescent Point’s actual results, performance or achievement could differ materially from those expressed in, or implied by, these forward-looking estimates and if such actual results, performance or achievements transpire or occur, or if any of them do so, there can be no certainty as to what benefits Crescent Point will derive therefrom.
Crescent Point is exposed to several operational risks inherent in exploiting, developing, producing and marketing crude oil and natural gas. These risks include, but are not limited to:
• Uncertainties associated with estimating oil and natural gas reserves;
• Economic risk of finding and producing reserves at a reasonable cost;
• Incorrect assessments of the value of acquisitions and exploration and development programs;
• Failure to realize the anticipated benefits of acquisitions;
• Financial risk of marketing reserves at an acceptable price given market conditions;
• Volatility in market prices for oil and natural gas;
• Fluctuations in foreign exchange and interest rates;
• Stock market volatility;
• Uncertainties associated with partner plans and approvals;
• Operational matters related to non-operated properties;
• Delays in business operations, pipeline restrictions, blowouts;
• Debt service, indebtedness may limit timing or amount of dividends as well as market price of shares;
• The continued availability of adequate debt and equity financing and cash flow to fund planned expenditures;
• Sufficient liquidity for future operations;
• Cost of capital risk to carry out the Company’s operations;
• Unforeseen title defects;
• Aboriginal land claims;
• Increased competition for, among other things, capital, acquisitions of reserves and undeveloped lands;
• Competition for and availability of qualified personnel or management;
• Loss of key personnel;
• Uncertainties associated with regulatory approvals;
• Uncertainty of government policy changes;
• The risk of carrying out operations with minimal environmental impact;
• Unexpected geological, technical, drilling, construction and processing problems and availability of insurance;
• Industry conditions including changes in laws and regulations including the adoption of new environmental laws and regulations and changes in how they are interpreted and enforced;
• General economic, market and business conditions;
• Competitive action by other companies;
• The ability of suppliers to meet commitments;
• Obtaining required approvals of regulatory authorities; and
• Uncertainties associated with credit facilities and counterparty credit risk.
Crescent Point strives to manage or minimize these risks in a number of ways, including:
• Employing qualified professional and technical staff;
• Concentrating in a limited number of areas with low cost exploitation and development objectives;
• Utilizing the latest technology for finding and developing reserves;
• Constructing quality, environmentally sensitive, safe production facilities;
• Maximizing operational control of drilling and producing operations;
• Mitigating risk through strategic hedging;
• Adhering to conservative borrowing guidelines;
• Monitoring counterparty creditworthiness; and
• Obtaining counterparty credit insurance.
A barrel of oil equivalent (“boe”) is based on a conversion rate of six thousand cubic feet of natural gas to one barrel of oil.

CRESCENT POINT ENERGY CORP. 5
Results of Operations
Production
Three months ended September 30 Nine months ended September 30 2010 2009 % Change 2010 2009 % Change Crude oil and NGL (bbls/d) 58,390 40,854 43 52,519 37,635 40 Natural gas (mcf/d) 42,947 32,806 31 38,134 29,004 31 Total (boe/d) 65,548 46,322 42 58,875 42,469 39 Crude oil and NGL (%) 89 88 1 89 89 - Natural gas (%) 11 12 (1) 11 11 - Total (%) 100 100 - 100 100 -
Production increased by 42 percent and 39 percent in the three and nine months ended September 30, 2010 compared to the same 2009 periods, primarily due to 2009 and 2010 acquisitions and the Company’s successful drilling and fracture stimulation programs, partially offset by natural declines.
On January 15, 2010, Crescent Point completed the acquisition of assets in southwest Saskatchewan from Penn West Energy Trust (“Penn West”) which added approximately 2,900 boe/d of high quality production, net of production associated with non-core properties exchanged as consideration.
On July 2, 2010, Crescent Point completed the acquisition of Shelter Bay which added more than 7,400 boe/d of production, 97 percent of which was from the southeast Saskatchewan Viewfield Bakken oil resource play and the southwest Saskatchewan Lower Shaunavon oil resource play.
On July 5, 2010, Crescent Point completed the acquisition of a private oil and gas company (“Private Company”) which added approximately 900 boe/d of low-decline conventional production, focused primarily in southern Alberta.
Crescent Point’s successful drilling program also contributed to the increase in production in both the three and nine month periods ended September 30, 2010. In the three and nine months ended September 30, 2010, the Company drilled 152 (117.5 net) wells and 301 (231.1 net) wells, respectively, focused primarily in the Viewfield Bakken resource play in southeast Saskatchewan and the Shaunavon resource play in southwest Saskatchewan.
The Company’s weighting to oil in the three and nine month periods ending September 30, 2010 remained consistent with the comparative 2009 periods.
Marketing and Prices
Average Selling Prices (1) Three months ended September 30 Nine months ended September 30
2010 2009 % Change 2010 2009 % Change Crude oil and NGL ($/bbl) 70.54 67.97 4 72.44 60.70 19 Natural gas ($/mcf) 3.69 3.14 18 4.21 3.88 9 Total ($/boe) 65.25 62.17 5 67.35 56.44 19
(1) The average selling prices reported are before realized derivatives and transportation charges.
Benchmark Pricing Three months ended September 30 Nine months ended September 30 2010 2009 % Change 2010 2009 % Change WTI crude oil (US$/bbl) 76.21 68.29 12 77.65 57.13 36 WTI crude oil (Cdn$/bbl) 79.39 75.04 6 80.05 66.43 21 AECO natural gas (1) (Cdn$/mcf) 3.54 2.94 20 4.12 3.78 9 Exchange rate – US$/Cdn$ 0.96 0.91 5 0.97 0.86 13
(1) The AECO natural gas price reported is the average daily spot price.
The Company’s average selling price for oil increased from $67.97 per bbl in the third quarter of 2009 to $70.54 per bbl in the third quarter of 2010, primarily due to the 12 percent increase in the US$ WTI benchmark, partially offset by a stronger Canadian dollar and increased market differentials for its Canadian light and medium crude. Crescent Point’s oil differential for the three months ended September 30, 2010 was $8.85 per bbl compared to $7.07 per bbl for the same period in 2009. The Company’s oil differential as a percent of Cdn$ WTI was 11 percent in the third quarter of 2010 compared to 9 percent in the third quarter of 2009. This was primarily the result of less favorable market conditions due to market disruptions caused by the Enbridge pipeline shutdowns in the third quarter of 2010.
In the nine months ending September 30, 2010, the Company’s average selling price for oil increased by 19 percent from the comparable 2009 period primarily as a result of the 36 percent increase in the US$ WTI benchmark, partially offset by a stronger Canadian dollar. The Company’s oil differential for the nine month period ending September 30, 2010 was $7.61 per bbl, or 10 percent, compared to $5.73 per bbl, or 9 percent, for the same period in 2009.
The Company’s average selling price for gas increased 18 percent to $3.69 per mcf in the third quarter of 2010 from $3.14 per mcf in the third quarter of 2009, which is consistent with the increase in AECO daily benchmark gas prices. The Company’s average selling price for gas of $4.21 per mcf for the nine month period ending September 30, 2010 increased 9 percent from the same 2009 period, corresponding to the increase in AECO daily gas prices.

CRESCENT POINT ENERGY CORP. 6
Derivatives and Risk Management
The following is a summary of the realized derivative gains on oil and gas contracts:
Three months ended September 30 Nine months ended September 30 ($000, except per boe and volume amounts) 2010 2009 % Change 2010 2009 % Change Average crude oil volumes hedged (bbls/d) 25,750 18,250 41 23,373 17,425 34 Crude oil realized derivative gain 5,493 4,105 34 6,192 51,605 (88) per bbl 1.02 1.09 (6) 0.43 5.02 (91) Average natural gas volumes hedged (GJ/d) 10,000 4,663 114 8,681 2,905 199 Natural gas realized derivative gain 2,070 1,302 59 4,439 2,233 99 per mcf 0.52 0.43 21 0.43 0.28 54 Average barrels of oil equivalent hedged (boe/d) 27,330 18,987 44 24,745 17,884 38 Operating realized derivative gain 7,563 5,407 40 10,631 53,838 (80) per boe 1.25 1.27 (2) 0.66 4.64 (86) Derivative crystallization gain - - - - 72,513 (100) per boe - - - - 6.25 (100) Total realized derivative gain 7,563 5,407 40 10,631 126,351 (92) per boe 1.25 1.27 (2) 0.66 10.89 (94)
Management of cash flow variability is an integral component of Crescent Point’s business strategy. Changing business conditions are monitored regularly and reviewed with the Board of Directors to establish risk management guidelines used by management in carrying out the Company’s strategic risk management program. The risk exposure inherent in movements in the price of crude oil and natural gas, fluctuations in the US/Cdn dollar exchange rate, changes in the price of power and interest rate movements on long-term debt are all proactively managed by Crescent Point through the use of derivatives with investment grade counterparties. The Company considers these derivative contracts to be an effective means to manage cash flow.
The Company’s crude oil and natural gas derivatives are referenced to WTI and AECO, unless otherwise noted. Crescent Point utilizes a variety of derivatives including swaps, collars and put options to protect against downward commodity price movements while providing the opportunity for some upside participation during periods of rising prices. For commodities, Crescent Point’s risk management policy allows for hedging a forward profile of 3½ years, and up to 65 percent net of royalty interest production.
The Company recorded total realized derivative gains of $7.6 million and $10.6 million for the three and nine months ended September 30, 2010 as compared to gains of $5.4 million and $126.4 million in the same 2009 periods. The total derivative gain in the nine months ended September 30, 2009 consisted of operating realized derivative gains of $53.8 million plus $72.5 million of realized derivative gains resulting from the derivative reset program which is discussed below.
The Company’s operating realized derivative gains for oil were $5.5 million and $6.2 million for the three and nine months ended September 30, 2010, respectively, as compared to $4.1 million and $51.6 million for the same periods in 2009. The slightly larger gain in the three month period ended September 30, 2010 is due to the significant increase in the Company’s average hedged volumes and the increase in the Company’s average hedge price being largely offset by the increase in the Cdn$ WTI benchmark price. The smaller gain in the nine month period ended September 30, 2010 is attributable to the increase in the Cdn$ WTI benchmark price partially offset by an increase in the Company’s average hedge price and an increase in average hedged volumes. In the three months ended September 30, 2010, the Company’s average derivative oil price increased 5 percent or $4.23 per barrel, from $77.48 per barrel in 2009 to $81.71 per barrel in 2010, while the Cdn$ WTI benchmark price increased 6 percent. During the nine months ended September 30, 2010, the Cdn$ WTI benchmark price increased 21 percent, while the Company’s average derivative oil price increased 5 percent or $3.74 per barrel, from $77.28 per barrel in 2009 to $81.02 per barrel in 2010.
Crescent’s Point’s operating realized derivative gains for gas were $2.1 million and $4.4 million for the three and nine months ended September 30, 2010, respectively, as compared to gains of $1.3 million and $2.2 million for the same periods in 2009. The increased realized gains are primarily attributable Company entering into additional gas contracts as a result of increased production volumes.
The Company’s gain in the nine month period ended September 30, 2009 pursuant to its derivative mark-to-market crystallization and reset program (“derivative crystallization”) announced March 4, 2009 was $72.5 million. The Company crystallized a portion of its forward market gains on swaps and collars for 2010, 2011 and 2012 and reset the hedges using swaps at then current market prices.
The Company has not designated any of its risk management activities as accounting hedges under the Canadian Institute of Chartered Accountants (the “CICA”) section 3855 and, accordingly, has marked to market its derivatives.

CRESCENT POINT ENERGY CORP. 7
The Company’s unrealized derivative loss for the third quarter of 2010 was $80.9 million compared to an unrealized derivative gain of $91.2 million for the same period in 2009. The unrealized loss in 2010 includes a $17.4 million loss relating to the Company’s Cross Currency Interest Rate Swaps (“CCIRS”) entered in conjunction with the issuance of the US senior guaranteed notes on March 24, 2010; this loss is primarily attributable to a strengthening in the Canadian dollar forward exchange rate relative to the US dollar at September 30, 2010 as compared to June 30, 2010. The remaining unrealized derivative loss in the third quarter of 2010 is primarily attributable to the increase in the Cdn$ WTI forward benchmark price at September 30, 2010 compared to June 30, 2010. The unrealized derivative gain in the three months ended September 30, 2009 is due to the decrease in the forward benchmark prices during the same period.
The unrealized derivative gain for the nine months ended September 30, 2010 was $8.2 million compared to an unrealized derivative loss of $147.4 million for the same period in 2009. The unrealized gain in 2010 includes a $5.8 million gain relating to the Company’s CCIRS; this gain is primarily attributable to a weakening in Canadian dollar forward exchange rate relative to the US dollar at September 30, 2010 compared to March 24, 2010. The remaining unrealized derivative gain in the nine month period ended September 30, 2010 is largely attributable to the slight decrease in the Cdn$ WTI forward benchmark price at September 30, 2010 as compared to December 31, 2009. The unrealized derivative loss on commodities for the nine month period ended September 30, 2009 is primarily the result of the slight increase in Cdn$ WTI benchmark price at September 30, 2009 as compared to December 31, 2008 combined with the maturity and crystallization during 2009 of in the money derivative contracts.
Revenues
Three months ended September 30 Nine months ended September 30 ($000) (1) 2010 2009 % Change 2010 2009 % Change Crude oil and NGL sales 378,916 255,469 48 1,038,577 623,611 67 Natural gas sales 14,583 9,467 54 43,876 30,754 43 Revenues 393,499 264,936 49 1,082,453 654,365 65
(1) Revenue is reported before transportation charges and realized derivatives.
Crude oil and NGL sales increased 48 percent in the three months ending September 30, 2010, from $255.5 million in the third quarter of 2009 to $378.9 million in the third quarter of 2010 primarily due to the 43 percent increase in production and 4 percent increase in realized prices. The increased production in 2010 is due to the acquisitions completed in 2009 and 2010 and the Company’s successful drilling program. The increase in realized prices is largely a result of the increase in US$ WTI benchmark price as compared to the same period in 2009, partially offset by a stronger Canadian dollar and widening differentials.
Crude oil and NGL sales increased 67 percent in the nine months ending September 30, 2010 compared to the same period in 2009. The increase is primarily due to the 40 percent increase in production and 19 percent increase in realized prices. The increased production and increase in realized prices is due to the same reasons discussed above for the three month period.
Natural gas sales increased 54 percent and 43 percent in the three and nine month periods ending September 30, 2010, respectively, compared to the same periods in 2009. The increase is primarily due to the 31 percent increase in natural gas production volumes in both the three and nine month periods ending September 30, 2010 as compared to the same periods in 2009, largely due to gas production acquired through capital acquisitions and successful drilling at Viewfield. In addition, the 20 percent and 9 percent increases in the AECO daily gas prices for the three and nine month periods ending September 30, 2010, respectively, compared to the same periods in 2009, contributed to the increases in natural gas sales.
Transportation Expenses
Three months ended September 30 Nine months ended September 30 ($000, except per boe amounts) 2010 2009 % Change 2010 2009 % Change Transportation expenses 8,991 6,430 40 26,367 17,823 48 Per boe 1.49 1.51 (1) 1.64 1.54 6
Transportation expense per boe in the three month period ended September 30, 2010 remained consistent with the comparable 2009 period. Transportation expense per boe increased 6 percent in the nine months ended September 30, 2010 compared to the same period in 2009 primarily due to pipeline constraint issues in southeast Saskatchewan in the first half of 2010.
CRESCENT POINT ENERGY CORP. 8
Royalty Expenses
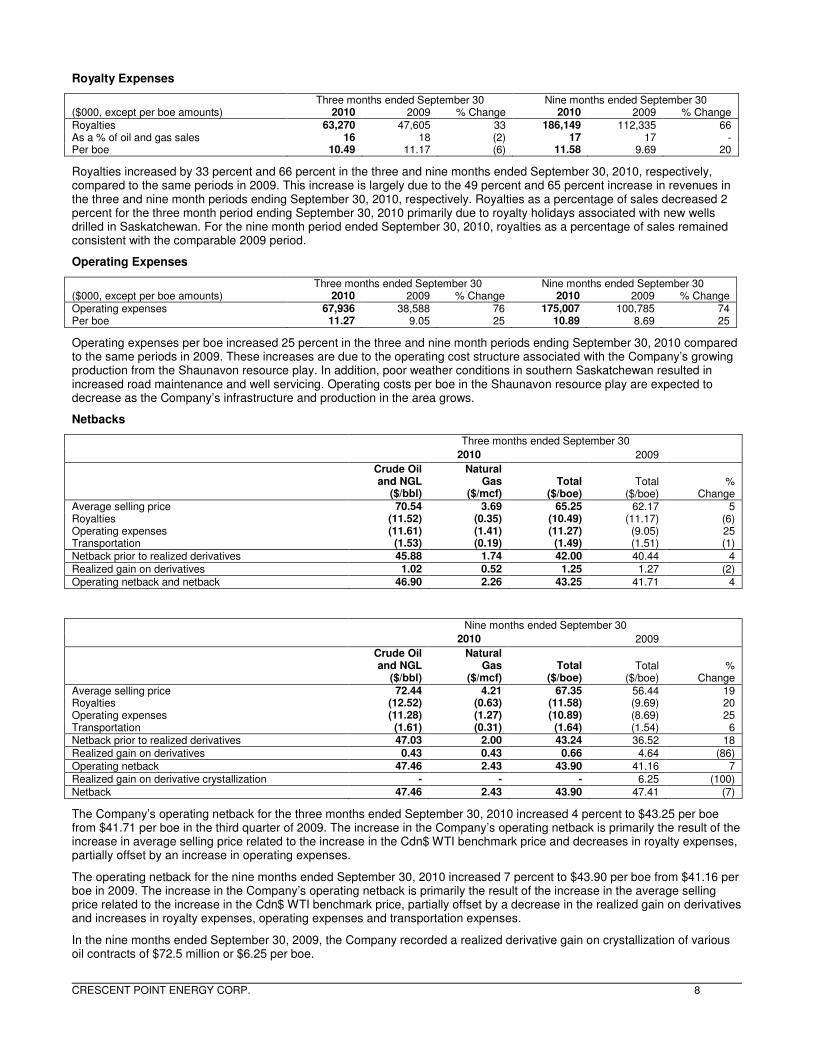
Three months ended September 30 Nine months ended September 30 ($000, except per boe amounts) 2010 2009 % Change 2010 2009 % Change Royalties 63,270 47,605 33 186,149 112,335 66 As a % of oil and gas sales 16 18 (2) 17 17 - Per boe 10.49 11.17 (6) 11.58 9.69 20
Royalties increased by 33 percent and 66 percent in the three and nine months ended September 30, 2010, respectively, compared to the same periods in 2009. This increase is largely due to the 49 percent and 65 percent increase in revenues in the three and nine month periods ending September 30, 2010, respectively. Royalties as a percentage of sales decreased 2 percent for the three month period ending September 30, 2010 primarily due to royalty holidays associated with new wells drilled in Saskatchewan. For the nine month period ended September 30, 2010, royalties as a percentage of sales remained consistent with the comparable 2009 period.
Operating Expenses
Three months ended September 30 Nine months ended September 30 ($000, except per boe amounts) 2010 2009 % Change 2010 2009 % Change Operating expenses 67,936 38,588 76 175,007 100,785 74 Per boe 11.27 9.05 25 10.89 8.69 25
Operating expenses per boe increased 25 percent in the three and nine month periods ending September 30, 2010 compared to the same periods in 2009. These increases are due to the operating cost structure associated with the Company’s growing production from the Shaunavon resource play. In addition, poor weather conditions in southern Saskatchewan resulted in increased road maintenance and well servicing. Operating costs per boe in the Shaunavon resource play are expected to decrease as the Company’s infrastructure and production in the area grows.
Netbacks
Three months ended September 30
2010 2009
Crude Oil and NGL
($/bbl)
Natural Gas
($/mcf) Total
($/boe) Total
($/boe) %
Change Average selling price 70.54 3.69 65.25 62.17 5 Royalties (11.52) (0.35) (10.49) (11.17) (6) Operating expenses (11.61) (1.41) (11.27) (9.05) 25 Transportation (1.53) (0.19) (1.49) (1.51) (1) Netback prior to realized derivatives 45.88 1.74 42.00 40.44 4 Realized gain on derivatives 1.02 0.52 1.25 1.27 (2) Operating netback and netback 46.90 2.26 43.25 41.71 4
Nine months ended September 30
2010 2009
Crude Oil and NGL
($/bbl)
Natural Gas
($/mcf) Total
($/boe) Total
($/boe) %
Change Average selling price 72.44 4.21 67.35 56.44 19 Royalties (12.52) (0.63) (11.58) (9.69) 20 Operating expenses (11.28) (1.27) (10.89) (8.69) 25 Transportation (1.61) (0.31) (1.64) (1.54) 6 Netback prior to realized derivatives 47.03 2.00 43.24 36.52 18 Realized gain on derivatives 0.43 0.43 0.66 4.64 (86) Operating netback 47.46 2.43 43.90 41.16 7 Realized gain on derivative crystallization - - - 6.25 (100) Netback 47.46 2.43 43.90 47.41 (7)
The Company’s operating netback for the three months ended September 30, 2010 increased 4 percent to $43.25 per boe from $41.71 per boe in the third quarter of 2009. The increase in the Company’s operating netback is primarily the result of the increase in average selling price related to the increase in the Cdn$ WTI benchmark price and decreases in royalty expenses, partially offset by an increase in operating expenses.
The operating netback for the nine months ended September 30, 2010 increased 7 percent to $43.90 per boe from $41.16 per boe in 2009. The increase in the Company’s operating netback is primarily the result of the increase in the average selling price related to the increase in the Cdn$ WTI benchmark price, partially offset by a decrease in the realized gain on derivatives and increases in royalty expenses, operating expenses and transportation expenses.
In the nine months ended September 30, 2009, the Company recorded a realized derivative gain on crystallization of various oil contracts of $72.5 million or $6.25 per boe.

CRESCENT POINT ENERGY CORP. 9
General and Administrative Expenses
Three months ended September 30 Nine months ended September 30 ($000, except per boe amounts) 2010 2009 % Change 2010 2009 % Change General and administrative costs 11,851 9,144 30 38,152 36,446 5 Capitalized (3,045) (2,182) 40 (8,490) (6,583) 29 Total general and administrative expenses 8,806 6,962 26 29,662 29,863 (1) Transaction costs (951) - - (8,062) - - (Provision for) recovery of uncollectible amounts from SemCanada - - - 1,424 (11,382) (113) General and administrative expenses 7,855 6,962 13 23,024 18,481 25 Per boe 1.30 1.63 (20) 1.43 1.59 (10)
General and administrative expenses increased 13 percent and 25 percent in the three and nine month periods ending September 30, 2010, respectively, compared to the same periods in 2009. These increases are primarily due to increased employee costs and office rent as a result of the Company’s growth, partially offset by costs incurred in 2009 related to the corporate conversion.
Transaction costs incurred in the three and nine month periods ending September 30, 2010 relate to the assets acquired from Penn West, acquisitions of Shelter Bay, Private Company and Ryland, and the advisory costs incurred on the issuance of the senior guaranteed notes. As a result of adopting CICA Handbook section 1582 “Business Combinations” effective January 1, 2010, the Company records related transaction costs as general and administrative expenses.
Restricted Share Bonus Plan
Stock-based Compensation Expense Three months ended September 30 Nine months ended September 30 ($000, except per boe amounts) 2010 2009 % Change 2010 2009 % Change Stock-based compensation costs 18,790 7,918 137 58,512 39,166 49 Capitalized (4,887) - - (14,330) - - Stock-based compensation expense 13,903 7,918 76 44,182 39,166 13 Per boe 2.31 1.86 24 2.75 3.38 (19)
The Company has a Restricted Share Bonus Plan and under the terms of this plan, the Company may grant restricted shares to directors, officers, employees and consultants. Restricted shares vest at 33⅓ percent on each of the first, second and third anniversaries of the grant date or at a date approved by the Board of Directors. Restricted shareholders are eligible for monthly dividends immediately upon grant.
Under the Restricted Share Bonus Plan, the Company is authorized to issue up to 11,000,000 shares. The Company had 3,943,092 restricted shares outstanding at September 30, 2010 compared with 2,264,625 restricted shares outstanding at September 30, 2009.
The Company recorded stock-based compensation costs of $18.8 million in the third quarter of 2010, based on the fair value of the shares on the date of the grant. Stock-based compensation costs increased 137 percent for the three month period ended September 30, 2010 compared to the same period in 2009 primarily as a result of shares awarded to employees of the Company in the first quarter of 2010 as part of the 2009 annual performance award and an increase in the number of employees.
During the nine month period ending September 30, 2010, the Company recorded stock-based compensation costs of $58.5 million, an increase of 49 percent compared to the same period in 2009 due to the same reasons discussed above for the three month period, partially offset by the special performance award recorded in 2009.
The Company capitalized $4.9 million and $14.3 million of stock-based compensation in the three and nine month periods ended September 30, 2010, respectively, compared to nil in the same 2009 periods.

CRESCENT POINT ENERGY CORP. 10
Interest Expense
Three months ended September 30 Nine months ended September 30 ($000, except per boe amounts) 2010 2009 % Change 2010 2009 % Change Interest expense 15,605 10,973 42 45,063 24,711 82 Per boe 2.59 2.57 1 2.80 2.13 31
Interest expense increased 42 percent and 82 percent in the three and nine month periods ending September 30, 2010, respectively, compared to the same periods in 2009. These increases are largely attributable to higher average interest rates and a higher average debt balance resulting from the Company’s increased development capital and capital acquisition expenditures, partially offset by 2009 and 2010 equity financings.
Crescent Point actively manages exposure to fluctuations in interest rates through interest rate swaps, short term banker’s acceptances and the issuance of fixed rate senior guaranteed notes; refer to Derivatives and Risk Management section above.
Depletion, Depreciation and Amortization
Three months ended September 30 Nine months ended September 30 ($000, except per boe amounts) 2010 2009 % Change 2010 2009 % Change Depletion, depreciation and amortization 202,759 107,480 89 508,994 289,206 76 Per boe 33.62 25.22 33 31.67 24.94 27
The depletion, depreciation and amortization (“DD&A”) rate increased by 33 percent to $33.62 per boe for the three months ended September 30, 2010 from $25.22 in the same period of 2009. In the nine months ending September 30, 2010, the DD&A rate increased 27 percent to $31.67 from $24.94 in the comparable 2009 period. These increases are largely a result of the Company’s capital acquisitions completed in 2009 and 2010.
Taxes
Three months ended September 30 Nine months ended September 30 ($000) 2010 2009 % Change 2010 2009 % Change Capital and other tax expense 6,985 4,370 60 19,306 10,091 91 Future income tax expense (recovery) (15,419) 87,713 (118) 6,527 33,849 (81)
Capital and Other Tax Expense
Capital and other tax expense, which consists of Saskatchewan Corporation Capital Tax Resource Surcharge, increased 60 percent and 91 percent in the three and nine month periods ending September 30, 2010, respectively, as compared to the same periods in 2009. The increase in both the three and nine months ended September 30, 2010 is largely due to the increase in the Company’s Saskatchewan-based revenue as a result of acquisitions completed during 2009 and 2010, the Company’s development drilling program and an increase in the Company’s realized oil price.
Future Income Tax Expense
In the third quarter of 2010, the Company reported a future tax recovery of $15.4 million compared to a future tax expense of $87.7 million in the third quarter of 2009. The recovery in the third quarter of 2010 relates primarily to the $80.9 million unrealized derivative loss. The expense in the third quarter of 2009 relates primarily to the tax effect of the conversion from an income trust to a corporate structure and the $91.2 million unrealized derivative gain recorded in the third quarter of 2009. For the nine month period ended September 30, 2010, the Company reported a future tax expense of $6.5 million compared to future tax expense of $33.8 million in the third quarter of 2009. The expense in the nine months ended September 30, 2010 relates primarily to the $8.2 million unrealized derivative gain. The expense in the nine months ended September 30, 2009 is the result of the conversion from an income trust to a corporate structure, partially offset by a recovery resulting from the unrealized derivative loss of $147.4 million.

CRESCENT POINT ENERGY CORP. 11
Funds Flow, Cash Flow and Net Income (Loss)
Three months ended September 30 Nine months ended September 30 ($000, except per share amounts) 2010 2009 % Change 2010 2009 % Change Funds flow from operations 230,424 155,415 48 619,641 481,603 29 Funds flow from operations per share – diluted
0.91 0.96 (5) 2.70 3.19 (15)
Cash flow from operating activities 204,583 150,067 36 580,990 452,887 28 Cash flow from operating activities per share – diluted
0.81 0.92 (12) 2.54 3.00 (15)
Net income (loss) (16,636) 45,357 (137) 74,372 (27,051) 375 Net income (loss) per share – diluted (0.07) 0.28 (125) 0.32 (0.18) 278
Funds flow from operations increased to $230.4 million in the third quarter of 2010 from $155.4 million in the third quarter of 2009 and decreased to $0.91 per share – diluted from $0.96 per share – diluted. The increase in funds flow from operations is primarily the result of the significant increase in production volumes and the slight increase in operating netback. Production volumes increased due to 2009 and 2010 acquisitions and the Company’s successful drilling and fracture stimulation programs. The operating netback increased as a result of the higher average selling price related to the increase in the Cdn$ WTI benchmark price and decreases in royalty expenses and transportation expenses, partially offset by a increase in operating expenses. Funds flow from operations per share – diluted was impacted by the June 2010 equity offering, however, the proceeds provided funding for future cash flow growth from the Company’s drilling, development and acquisition programs.
In the nine month period ending September 30, 2010, funds flow from operations increased to $619.6 million from $481.6 million in the same 2009 period and decreased to $2.70 per share – diluted from $3.19 per share – diluted. The increase in funds flow from operations is primarily the result of increases in production volumes and the operating netback. Production volumes increased due to 2009 and 2010 acquisitions and the Company’s successful drilling and fracture stimulation programs. The operating netback increased as a result of the higher average selling price related to the increase in the Cdn$ WTI benchmark price, partially offset by a decrease in the realized gain on derivatives and increases in royalty expenses, operating expenses and transportation expenses. The funds flow from operations in the first nine months of 2009 includes a $72.5 million realized derivative gain on crystallization of various oil contracts; excluding this realized crystallization gain, funds flow from operations for the nine month period ending September 30, 2009 was $2.71 per share – diluted.
Cash flow from operating activities for the third quarter of 2010 increased to $204.6 million from $150.1 million in the third quarter of 2009 for the same reasons discussed above, as well as due to fluctuations in working capital. Cash flow from operating activities per share – diluted decreased 12 percent to $0.81 per share – diluted in the third quarter of 2010 for the same reasons discussed above. In the nine month period ending September 30, 2010, cash flow from operating activities increased 28 percent to $581.0 million for the same reasons discussed above.
Net loss for the third quarter of 2010 of $16.6 million decreased from net income of $45.4 million in 2009 primarily as a result of the unrealized loss on derivatives of $80.9 million in 2010 as compared to an unrealized gain on derivatives of $91.2 million in 2009 and increased DD&A, partially offset by increased funds flow from operations and future income tax recovery of $15.4 million in the third quarter of 2010 compared to future income tax expense of $87.7 million in the third quarter of 2009.
In the nine month period ending September 30, 2010, net income increased to $74.4 million from a net loss of $27.1 million in the same period in 2009. The increase in net income is largely a result of increased funds flow from operations, the unrealized gain on derivatives of $8.2 million in 2010 as compared to an unrealized loss on derivatives of $147.4 million in 2009 and decreased future income tax expense, partially offset by increases in DD&A.
As noted in the Derivatives and Risk Management section, the Company has not designated any of its risk management activities as accounting hedges under the CICA Handbook section 3855 and, accordingly, has marked to market its derivatives and records the result to the statement of operations.
Crescent Point uses financial commodity derivatives, including swaps, costless collars and put options, to reduce the volatility of the selling price of its crude oil and natural gas production. This provides a measure of stability to the Company’s cash flows and dividends over time. The Company’s commodity derivatives portfolio extends out 3½ years from the current quarter.
The CICA Handbook section 3855 “Financial Instruments – Recognition and Measurement”, gives guidelines for mark to market accounting for financial derivatives. Financial derivatives that have not settled during the current quarter are marked to market. The change in mark to market from the previous quarter represents a gain or loss that is recorded in the statement of operations. As such, if benchmark oil and natural gas prices rise during the quarter, the Company records a loss based on the change in price multiplied by the volume of oil and natural gas hedged. If prices fall during the quarter, the Company records a gain. The prices used to record the actual gain or loss are subject to an adjustment for volatility, then the resulting gain (asset) or loss (liability) is discounted to a present value using a risk-free rate adjusted for counterparty risk.

CRESCENT POINT ENERGY CORP. 12
Crescent Point’s underlying physical reserves are not marked to market each quarter, hence no gain or loss associated with price changes is recorded; the Company realizes the benefit/detriment of any price increase/decrease in the period which the physical sales occur.
The Company’s financial results should be viewed with the understanding that the future gain or loss on financial derivatives is recorded in the current period’s results, while the future value of the underlying physical sales is not.
Dividends
The following table provides a reconciliation of dividends:
Three months ended September 30 Nine months ended September 30 ($000,except per share amounts) (1) 2010 2009 % Change 2010 2009 % Change Accumulated dividends, beginning of period 1,610,768 1,062,375 52 1,313,689 860,371 53 Dividends declared to shareholders 175,753 113,158 55 472,832 315,162 50 Accumulated dividends, end of period 1,786,521 1,175,533 52 1,786,521 1,175,533 52 Accumulated dividends per share, beginning
of period 16.41 13.65 20 15.03 12.27 22 Dividends to shareholders per share 0.69 0.69 - 2.07 2.07 - Accumulated dividends per share, end of
period 17.10 14.34 19 17.10 14.34 19
(1) Amounts prior to July 2, 2009 were distributions on trust units. Accumulated dividends reflect the sum of the amounts declared monthly, as a trust or a corporation, since Crescent Point’s inception in 2003.
The Company maintained monthly dividends of $0.23 per share during the nine months ended September 30, 2010.
Dividends increased 55 percent and 50 percent in the three and nine months ended September 30, 2010, respectively, compared to the same periods in 2009. The increase in dividends relates to an increase in the number of shares outstanding resulting from the Wild River, Gibraltar Exploration Ltd., Wave Energy Ltd. and TriAxon Resources Ltd. (“TriAxon”) acquisitions in 2009, the Shelter Bay, Private Company and Ryland acquisitions in 2010, the bought deal financings which closed in September and November 2009, June 2010 and the DRIP program.
Crescent Point believes it is well positioned to maintain monthly dividends as the Company continues to exploit and develop its resource plays. Crescent Point’s risk management strategy minimizes exposure to commodity price volatility and provides a measure of sustainability to dividends through periods of fluctuating market prices.
Investments in Marketable Securities
In the fourth quarter of 2007, Crescent Point received 1.5 million shares of a publicly traded exploration and production company for $1.00 per share or $1.5 million in connection with a disposition of properties. The Company continues to hold these shares and recorded an unrealized loss of $0.1 million and $0.3 million in the three and nine months ended September 30, 2010, respectively. During the three and nine months ended September 30, 2009, Crescent Point recorded an unrealized gain of $0.3 million and $0.5 million, respectively.
Long-Term Investments
a) Reliable Energy Ltd.
In October 2009, the Company purchased 32.2 million common shares in Reliable Energy Ltd. The investment is classified as held-for-trading and is marked to market with the resulting gain or loss recorded in the statement of operations. The investment is recorded at fair value which is $6.8 million more than the original cost of the investment.
b) Painted Pony Petroleum Ltd.
In conjunction with the acquisition of Shelter Bay, the Company acquired 5.9 million common shares of Painted Pony Petroleum Ltd. (“Painted Pony”), a publicly traded oil and gas corporation. The investment is classified as held-for-trading and is marked to market with the resulting gain or loss recorded in the statement of operations. The investment is recorded at fair value which is $2.1 million less than the Company’s cost of the investment.

CRESCENT POINT ENERGY CORP. 13
Related Party Transactions
On July 2, 2010, Crescent Point closed the acquisition of Shelter Bay by way of plan of arrangement (“Shelter Bay Arrangement”). Prior to the Shelter Bay Arrangement, Crescent Point’s investment in Shelter Bay of $200.4 million consisted of 173.9 million Class A Common Shares, representing an interest of 21 percent, plus the accumulated equity earnings of $6.6 million.
The following related party transactions occurred in 2010 between Crescent Point and Shelter Bay prior to the Shelter Bay Arrangement on July 2, 2010:
• Management and Technical Services Agreement – Crescent Point entered into a Management and Technical Services Agreement with Shelter Bay, effective January 11, 2008 through December 31, 2012, with both early termination and extension provisions. Crescent Point was responsible for managing, administering and operating the assets and business of Shelter Bay. The services were provided in exchange for a monthly management fee. The Company billed management fees to Shelter Bay of $2.3 million in 2010 prior to the Shelter Bay Arrangement (three months ending September 30, 2009 - $1.3 million, nine months ending September 30, 2009 - $3.2 million).
• Farm-Out Agreement – Effective January 11, 2008, Crescent Point entered into a farm-out agreement with Shelter Bay. Under the agreement, Shelter Bay had the right to farm-in on 22 net sections of Viewfield Bakken lands owned by the Company. Shelter Bay was responsible for paying 100 percent of the capital costs and earned a 50 percent interest in production from the property, while the Company retained the other 50 percent production interest. In 2010, prior to the Shelter Bay Arrangement, Shelter Bay drilled 8 gross wells on lands farmed out by the Company.
• Amounts Owing From / Due To – All amounts owing to / from Shelter Bay were settled in conjunction with closing the Shelter Bay Arrangement on July 2, 2010.
Capital Expenditures
Corporate Acquisitions
Shelter Bay Energy Inc.
On July 2, 2010, Crescent Point completed the acquisition, by way of plan of arrangement, of all remaining issued and outstanding common shares of Shelter Bay, a private oil and gas company with properties contiguous with Crescent Point’s existing core areas in southern Saskatchewan. Total consideration of approximately $1.2 billion included the issuance of approximately 24.4 million shares, assumed long-term debt, working capital, long-term investment and the historical cost of Crescent Point’s previously held equity investment of $200.4 million ($1.2 billion was allocated to property, plant and equipment). The goodwill recognized on acquisition is attributed to the expected future cash flows derived from unbooked possible reserves. The business combination was accounted for using the acquisition method of accounting.
Private Company
On July 5, 2010, Crescent Point completed the acquisition, by way of plan of arrangement, of all issued and outstanding common shares of a private oil and gas company with exploratory land in southern Alberta prospective for multi-zone light oil opportunities. Total consideration of approximately $95.6 million included the issuance of approximately 0.7 million shares, assumed long-term debt and working capital ($105.1 million was allocated to property, plant and equipment). The business combination was accounted for using the acquisition method of accounting.
Ryland Oil Corp.
On August 20, 2010, Crescent Point completed the acquisition, by way of plan of arrangement, of all remaining issued and outstanding common shares of Ryland Oil Corp. (“Ryland”), a public oil and gas company with properties primarily located in Crescent Point’s Flat Lake area in southeastern Saskatchewan and in North Dakota, United States. Total consideration of approximately $116.3 million included the issuance of approximately 2.2 million shares, assumed long-term debt, working capital and the historical cost of Crescent Point’s previously held equity investment of $7.6 million ($122.0 million was allocated to property, plant and equipment). The business combination was accounted for using the acquisition method of accounting.
Major Property Acquisitions and Dispositions
Penn West Assets
On January 15, 2010 Crescent Point completed the acquisition of certain assets in southwest Saskatchewan from Penn West. Total consideration paid included Crescent Point’s 100 percent working interest in the Pembina Cardium play acquired through the Company’s arrangement with TriAxon Resources Ltd., a 50 percent working interest in Crescent Point’s Dodsland Viking play and $440.1 million cash including closing adjustments. The net addition recorded to property, plant and equipment was $443.6 million. Southeast Saskatchewan Assets
On January 25, 2010 Crescent Point completed the acquisition of assets in southeast Saskatchewan for cash consideration of approximately $28.7 million ($30.7 million was allocated to property plant, plant and equipment).

CRESCENT POINT ENERGY CORP. 14
Southwest Saskatchewan Assets
On March 23, 2010 Crescent Point completed the acquisition of assets in southwest Saskatchewan for cash consideration of approximately $67.7 million ($68.4 million was allocated to property, plant and equipment).
Minor Acquisitions, Dispositions and Purchase Price Adjustments
Minor property acquisitions, dispositions and purchase price adjustments during the nine months ended September 30, 2010 amounted to additions to property plant and equipment of $17.3 million ($20.6 million was allocated to property, plant and equipment).
Development Capital
Three months ended September 30 Nine months ended September 30 ($000) 2010 2009 % Change 2010 2009 % Change Capital acquisitions (net) (1) 1,446,164 523,566 176 1,996,277 987,946 102 Development capital expenditures 348,513 110,362 216 712,058 226,799 214 Capitalized administration (2) 3,045 2,182 40 8,490 6,583 29 Office equipment (1,472) 2,441 (160) 1,604 4,422 (64) Total 1,796,250 638,551 181 2,718,429 1,225,750 122
(1) Capital acquisitions represent total consideration for the transactions including net debt and, commencing January 1, 2010, excluding transaction costs.
(2) Capitalized administration excludes capitalized stock-based compensation and related future income taxes.
The Company’s development capital expenditures for the third quarter of 2010 were $348.5 million compared to $110.4 million for the same period in 2009. In the third quarter of 2010, 152 (117.5 net) wells were drilled with a success rate of 99 percent. The development capital for the quarter included $144.7 million on facilities, land and seismic.
The Company’s development capital expenditures for the nine months ended September 30, 2010 were $712.1 million compared to $226.8 million for the same period in 2009. In the nine months ended September 30, 2010, 301 (231.1 net) wells were drilled with a success rate of 99 percent. The development capital for the nine months ended September 30, 2010 included $287.5 million on facilities, land and seismic.
Crescent Point’s budgeted capital program for 2010 is approximately $925 million, not including acquisitions. The Company searches for opportunities that align with strategic parameters and evaluates each prospect on a case-by-case basis.
Goodwill
The goodwill balance as at September 30, 2010 was $204.8 million compared to $100.3 million as at December 31, 2009. The increase of $104.5 million is attributable to the acquisition of Shelter Bay completed in July 2010. The remainder of the goodwill balance is attributable to the corporate acquisitions of TriAxon, Tappit Resources Ltd., Capio Petroleum Corporation and Bulldog Energy Inc. during the period 2003 through 2009.
Reclamation Fund
Crescent Point established a reclamation fund for future asset retirement obligation costs and environmental emissions reduction costs. The Company currently contributes $0.45 per produced boe to the fund, of which $0.15 per boe is for future asset retirement obligation costs and $0.30 per boe is for environmental emissions reduction costs.
The reclamation fund decreased by $2.6 million during the third quarter of 2010 due to expenditures of $5.3 million, partially offset by contributions of $2.7 million. The expenditures of $5.3 million pertained primarily to environmental work completed in the Viewfield area.
Asset Retirement Obligation
The asset retirement obligation increased by $19.3 million during the third quarter of 2010. This increase relates to liabilities of $12.9 million as a result of capital acquisitions, $3.7 million recorded in respect of drilling and $3.1 million of accretion expense, partially offset by liabilities settled of $0.4 million.

CRESCENT POINT ENERGY CORP. 15
Liquidity and Capital Resources
Capitalization Table ($000, except share, per share and percent amounts) September 30, 2010 December 31, 2009 Net debt 1,340,196 370,937 Shares outstanding (1) 253,797,171 209,389,932 Market price at end of period (per share) 37.91 39.49 Market capitalization 9,621,451 8,268,808 Total capitalization 10,961,647 8,639,745 Net debt as a percentage of total capitalization (%) 12 4 Annual funds flow from operations (2) 810,933 672,895 Net debt to funds flow from operations (3) 1.7 0.6
(1) Common shares outstanding balance at September 30, 2010 includes 912,972 common shares issued on October 15, 2010 pursuant to the DRIP program.
(2) Annual funds flow from operations is calculated using trailing four quarters of funds flows.
(3) The net debt reflects the financing of acquisitions, however the funds flow from operations only reflects funds flow from operations generated from the acquired properties since the closing dates of the acquisitions.
The Company’s long-term debt consists of bank credit facilities and senior guaranteed notes.
The Company has a syndicated credit facility with twelve banks and an operating credit facility with one Canadian chartered bank totaling $1.6 billion. As at September 30, 2010, the Company had approximately $900 million drawn on bank credit facilities, leaving unutilized borrowing capacity of approximately $700 million.
On March 24, 2010 the Company closed a private offering of senior guaranteed notes raising gross proceeds of US$260.0 million and CDN$50.0 million. These notes rank pari passu with the Company’s bank credit facilities and are unsecured with terms of maturity from 5 to 10 years. Concurrent with the issuance of the US$260.0 million senior guaranteed notes, the Company entered into CCIRS with a syndicate of financial institutions. Under the terms of the CCIRS, the amount of the notes was fixed for purposes of interest and principal repayments at a notional amount of CDN$265.5 million and a weighted average CDN$ interest rate of 5.94%.
At September 30, 2010, Crescent Point was capitalized with 88 percent equity, an 8 percent decrease from December 31, 2009, primarily due to the increased net debt of the Company and the decreased share price, partially offset by the increase in shares outstanding. The Company’s net debt to funds flow from operations ratio at September 30, 2010 was 1.7 times (December 31, 2009 - 0.6 times). This increase is largely due to the favorable impact of the November 3, 2009 equity financing on the 2009 ratio and timing of the deployment of the cash as consideration in the acquisition of assets from Penn West which closed on January 15, 2010, and an increase in net debt as at September 30, 2010 resulting from the Company’s third quarter drilling program and corporate acquisitions. Crescent Point’s projected average net debt to 12 month cash flow is approximately 1.0 times.
In June and October 2010, the Company successfully completed a total of $750.4 million in equity financings, in March 2010 the Company closed a private offering of senior guaranteed notes raising gross proceeds of US$260.0 million and CDN$50.0 million, and in 2009, the Company completed a total of $1.2 billion in equity financings. These financings highlight the high quality nature of the asset base and demonstrate the ability of Crescent Point to consistently secure adequate capital and maintain liquidity, positioning it for the opportunities that lie ahead. At September 30, 2010, the Company also had $1.6 billion of bank credit facilities with approximately $700 million of unutilized borrowing capacity. Crescent Point has significant liquidity available to meet its short and medium term needs.
Crescent Point’s development capital budget for 2010 was revised in September 2010 to $925 million, with average 2010 production forecast at 61,000 boe/d.
Crescent Point’s management believes that with the high quality reserve base and development inventory, excellent balance sheet and solid hedging program, the Company is well positioned to continue generating strong operating and financial results through 2010 and beyond.
Shareholders’ Equity
At September 30, 2010, Crescent Point had 253.8 million common shares issued and outstanding compared to 209.4 million shares at December 31, 2009. The increase of 44.4 million shares relates primarily to the June 2010 bought deal financing and the acquisitions of Shelter Bay, Private Company and Ryland in the third quarter of 2010:
• Crescent Point and a syndicate of underwriters closed a bought deal financing on June 2, 2010, pursuant to which the syndicate sold 9.2 million shares at $41.00 per share for gross proceeds of $375.2 million.
• Crescent Point issued 24.4 million shares to Shelter Bay shareholders at a price of $36.87 per share on the closing of the acquisition on July 2, 2010.
• Crescent Point issued 0.7 million shares to Private Company shareholders at a price of $36.18 per share on the closing of the acquisition on July 5, 2010.
• Crescent Point issued 2.2 million shares to Ryland shareholders at a price of $36.03 per share on closing of the acquisition on August 20, 2010.
CRESCENT POINT ENERGY CORP. 16
• Crescent Point issued 7.4 million shares pursuant to the DRIP program during the first nine months of 2010 for proceeds of $270.5 million.
Crescent Point’s total capitalization increased to $11.0 billion at September 30, 2010 compared to $8.6 billion at December 31, 2009, with the market value of the shares representing 88 percent of the total capitalization. The increase in capitalization is attributable to the increase in the number of shares outstanding and an increase in net debt as a result of the growth of the Company.
On October 13, 2010, the Company and a syndicate of underwriters closed a bought deal equity financing of 10.3 million Crescent Point common shares for gross proceeds of $375.2 million ($36.60 per share).
Critical Accounting Estimates
The preparation of the Company’s financial statements requires management to adopt accounting policies that involve the use of significant estimates and assumptions. These estimates and assumptions are developed based on the best available information and are believed by management to be reasonable under the existing circumstances. New events or additional information may result in the revision of these estimates over time. A summary of the significant accounting policies used by Crescent Point can be found in Note 2 to the December 31, 2009 consolidated financial statements.
New Accounting Pronouncements
As of January 1, 2010, the Company adopted the following CICA Handbook standards:
• “Business Combinations”, Section 1582, which replaces the previous business combinations standard. The standard requires assets and liabilities acquired in a business combination, contingent consideration and certain acquired contingencies to be measured at their fair values as of the date of acquisition. In addition, acquisition-related and restructuring costs are recognized separately from the business combination and are included in the statement of operations. The adoption of this standard impacts the accounting treatment of business combinations entered into after January 1, 2010.
• "Consolidated Financial Statements", Section 1601, which together with Section 1602 below, replace the former consolidated financial statements standard. Section 1601 establishes the requirements for the preparation of consolidated financial statements. The adoption of this standard has had no material impact on Crescent Point’s financial statements.
• "Non-controlling Interests", Section 1602, which establishes the accounting for a non-controlling interest in a subsidiary in consolidated financial statements subsequent to a business combination. The standard requires a non-controlling interest in a subsidiary to be classified as a separate component of equity. In addition, net earnings and components of other comprehensive income are attributed to both the parent and non-controlling interest. The adoption of this standard has had no material impact on Crescent Point’s financial statements.
Future Accounting Pronouncements
International Financial Reporting Standards (IFRS)
In 2008, the Accounting Standards Board confirmed that the transition date to International Financial Reporting Standards (“IFRS”) from Canadian GAAP will be January 1, 2011 for publicly accountable enterprises. Therefore, the Company will report its results in accordance with IFRS starting in 2011, with comparative IFRS information for the 2010 fiscal year.
The Company has assessed the potential impacts of this changeover and developed its implementation plan accordingly. We have implemented all required system changes and ongoing activities include training employees, refining and documenting policy choices, preparing draft calculations and financial statement disclosures, and executing the required changes to disclosure controls and internal controls over financial reporting. Regular reporting is provided to our executive management team and to the Audit Committee of our Board of Directors. Key metrics used by management, such as funds flow from operations, net debt, netbacks and reserve FD&A costs, will continue to be calculated on a consistent basis to monitor the business.
The quantitative impact on our future financial position and results of operations is not reasonably determinable now, however, we expect the highest impact will be in the following areas:
- Exploration and Evaluation assets (“E&E”):
• The Company’s undeveloped land balance as at December 31, 2009 will be the opening balance of E&E at January 1, 2010. This and any other exploratory assets will be separately disclosed on the balance sheet and in the notes to the financial statements.
• E&E assets will be assessed for impairment on January 1, 2010, and thereafter, when amounts are transferred to property, plant and equipment assets (“PP&E”) and when indicators exist. For impairment testing, E&E assets are expected to be combined with PP&E; the excess of carrying amount over recoverable amount is expensed in the period of impairment.

CRESCENT POINT ENERGY CORP. 17
- Property, Plant and Equipment (“PP&E”):
• The Company’s net book value of PP&E excluding E&E as at December 31, 2009 will be the opening cost of PP&E at January 1, 2010. This amount was allocated, based on reserve value, to Depletable Units (“DUs”), which consolidate into Cash Generating Units (“CGUs”).
• Depletion will be calculated at the DU level using the Company’s proved reserve base.
• A gain or loss must be calculated upon the sale of assets.
• Impairment of PP&E will be assessed at the CGU level. Impairment occurs when the net book value exceeds the recoverable amount; the recoverable amount will likely be calculated using a discounted cash flow model. The excess of carrying amount over recoverable amount is expensed in the period of impairment.
• PP&E will be assessed for impairment on January 1, 2010 and thereafter, when indicators exist.
- Goodwill:
• Impairment will be assessed annually at an operating segment level by combining the carrying amounts of E&E assets, PP&E and Goodwill and comparing this to the recoverable amount, which will likely be calculated using a discounted cash flow model. The excess of carrying amount over recoverable amount is expensed in the period of impairment.
- Asset Retirement Obligation:
• On January 1, 2010, the Company expects to value the asset retirement obligation using the risk free rate, which will increase the liability and retained deficit. Thereafter, any increases in the liability will be added to the cost of the related asset in the current period.
First-Time Adoption of IFRS (IFRS 1) provides entities adopting IFRS for the first time with a number of optional exemptions and mandatory exceptions, in certain areas, to the general requirement for full retrospective application of IFRS. The Company plans to take advantage of optional exemptions in two main areas:
- Value the opening cost of E&E and PP&E assets at the net book value determined under Canadian GAAP on January 1, 2010, rather than applying IFRS rules retrospectively. PP&E assets accumulated in the country cost centres shall be allocated pro-rata to DUs using reserve volumes or reserve values.
- Value past business combinations at the amounts determined under Canadian GAAP, rather than applying IFRS rules retrospectively. Note that on January 1, 2010, the Company adopted the Canadian Handbook Section 1582, which is aligned with IFRS 3, therefore there should be no differences in this area in 2010.

CRESCENT POINT ENERGY CORP. 18
Summary of Quarterly Results
2010 2009 2008 ($000, except per share amounts) (1) Q3 Q2 Q1 Q4 Q3 Q2 Q1 Q4 Oil and gas sales 393,499 330,224 358,730 327,500 264,936 225,822 163,607 211,264 Net income (loss) (1) (2) (16,636) 63,399 27,609 (4,024) 45,357 (67,262) (5,146) 361,411 Net income (loss) per share(3) (0.07) 0.29 0.13 (0.02) 0.28 (0.45) (0.04) 2.89 Net income (loss) per share - diluted (3) (0.07) 0.29 0.13 (0.02) 0.28 (0.45) (0.04) 2.84 Cash flow from operating activities (1) (2) 204,583 207,070 169,337 199,141 150,067 157,804 145,016 125,625 Cash flow from operating activities per share(3) 0.82 0.96
0.81
1.03
0.94 1.06 1.06 1.00
Cash flow from operating activities per share – diluted(3) 0.81 0.94
0.79
1.02
0.92 1.04 1.04 0.99
Funds flow from operations
(1) (2) 230,424 185,135 204,082 191,292 155,415 137,960 188,228 109,635 Funds flow from operations per share(3) 0.92 0.86 0.97 0.99 0.97 0.92 1.38 0.88 Funds flow from operations per share - diluted (3) 0.91 0.84
0.96
0.98
0.96 0.91 1.36 0.87
Working capital (deficit) (4)
(128,225) 150,637 144,113 148,190 166,274 183,931 220,195 187,694 Total assets 7,667,169 6,145,412 6,066,716 5,439,430 4,102,058 3,577,316 3,357,449 3,307,688 Total liabilities 2,402,972 1,804,035 2,108,184 1,460,952 1,511,578 1,458,235 1,111,793 1,462,876 Net debt (5)
1,340,196 691,505 976,018 370,937 741,287 681,419 391,295 730,932 Total long-term risk management liabilities 41,381 17,151
33,590
42,243
- 46,890 4,279 5,216
Weighted average shares - diluted (thousands) (3)
253,991 219,299
213,502
194,943
162,615 151,587 138,827 127,417 Capital expenditures (6)
1,796,250 189,625 732,554 1,207,950 638,551 381,173 206,026 95,115 Dividends declared 175,753 150,155 146,924 138,156 113,158 104,014 97,990 86,314 Dividends declared per share (3)
0.69 0.69 0.69 0.69 0.69 0.69 0.69 0.69
(1) The first quarter of 2009 net loss, cash flow from operating activities and funds flow from operations include a realized derivative gain of $69.0 million for the crystallization of various oil derivative contracts. The second quarter of 2009 net loss, cash flow from operating activities and funds flow from operations include a realized derivative gain of $3.5 million on the crystallization of various oil contracts and a bad debt provision of $11.4 million.
(2) The fourth quarter of 2008 net income and funds flow from operations include a bad debt provision of $19.4 million.
(3) Comparative amounts prior to July 2, 2009 are per trust unit.
(4) Working capital (deficit) is calculated as current assets less current liabilities, excluding risk management assets and liabilities, plus long-term investments.
(5) Net debt includes long-term debt, working capital and long-term investments, but excludes risk management assets, risk management liabilities and unrealized foreign exchange loss on translation of US dollar senior guaranteed notes.
(6) Capital expenditures excludes capitalized stock-based compensation and includes capital acquisitions. Capital acquisitions represent total consideration for the transactions including long-term debt and working capital assumed, and commencing January 1, 2010, excluding transaction costs.
Over the past eight quarters, the Company’s oil and gas sales have increased due to several corporate and property acquisitions completed and successful drilling program. Significant fluctuations in the Cdn$ WTI benchmark price and corporate oil differentials have also driven the fluctuations in oil and gas sales.
Net income has fluctuated primarily due to unrealized derivative gains and losses on oil and gas contracts, which fluctuate with the changes in forward market conditions, along with fluctuations in the future income tax expense (recovery).
Capital expenditures fluctuated through this period as a result of timing of acquisitions and the development drilling program. Funds flow from operations and cash flow from operating activities throughout the last eight quarters has allowed the Company to maintain stable monthly dividends.

CRESCENT POINT ENERGY CORP. 19
Internal Control Update Crescent Point is required to comply with Multilateral Instrument 52-109 “Certification of Disclosure in Issuers’ Annual and Interim Filings”. The certificate requires that Crescent Point disclose in the interim MD&A any changes in Crescent Point’s internal control over financial reporting that occurred during the period that has materially affected, or is reasonably likely to materially affect Crescent Point’s internal control over financial reporting. Crescent Point confirms that no such changes were made to internal controls over financial reporting during the third quarter of 2010.
Outlook
Crescent Point’s guidance for 2010 is as follows:
Production Guidance
Oil and NGL (bbls/d) 54,750
Natural gas (mcf/d) 37,500
Total (boe/d) 61,000
Funds flow from operations ($000) 865,000
Funds flow per share – diluted ($) 3.62
Dividends per share ($) 2.76
Payout ratio – per share – diluted (%) 76
Capital expenditures ($000) (1)
925,000
Wells drilled, net 331
Pricing
Crude oil – WTI (US$/bbl) 79.00
Crude oil – WTI (Cdn$/bbl) 81.44
Natural gas – Corporate (Cdn$/mcf) 4.00
Exchange rate (US$/Cdn$) 0.97
(1) The projection of capital expenditures excludes acquisitions, which are separately considered and evaluated.
Additional information relating to Crescent Point, including the Company’s renewal annual information form, is available on SEDAR at www.sedar.com.

CRESCENT POINT ENERGY CORP. 20
CONSOLIDATED BALANCE SHEETS
As at
(UNAUDITED) ($000) September 30, 2010 December 31, 2009
ASSETS
Current assets
Accounts receivable 151,402 141,887
Investments in marketable securities 815 1,092
Prepaids and deposits 5,428 8,861
Risk management asset (Note 17) 14,110 1,675
171,755 153,515
Long-term investments (Note 4) 46,161 229,755
Reclamation fund 2,236 3,422
Risk management asset (Note 17) 15,750 3,845
Other receivable (Note 6) 9,210 9,320
Property, plant and equipment (Note 7) 7,217,307 4,939,279
Goodwill (Note 8) 204,750 100,294
Total assets 7,667,169 5,439,430
LIABILITIES
Current liabilities
Accounts payable and accrued liabilities 307,707 210,515
Cash dividends payable 24,324 22,890
Risk management liability (Note 17) 25,079 20,080
357,110 253,485
Long-term debt (Note 9) 1,214,705 519,127
Risk management liability (Note 17) 41,381 42,243
Asset retirement obligation (Note 10) 173,146 139,365
Future income taxes 616,630 506,732
Total liabilities 2,402,972 1,460,952
SHAREHOLDERS’ EQUITY
Shareholders’ capital (Notes 11 & 12) 6,362,834 4,710,290
Contributed surplus (Note 13) 70,385 38,029
Deficit (Note 14) (1,168,078) (769,618)
Accumulated other comprehensive income (loss) (Note 14) (944) (223)
Total shareholders’ equity 5,264,197 3,978,478
Total liabilities and shareholders’ equity 7,667,169 5,439,430
See accompanying notes to the consolidated financial statements.
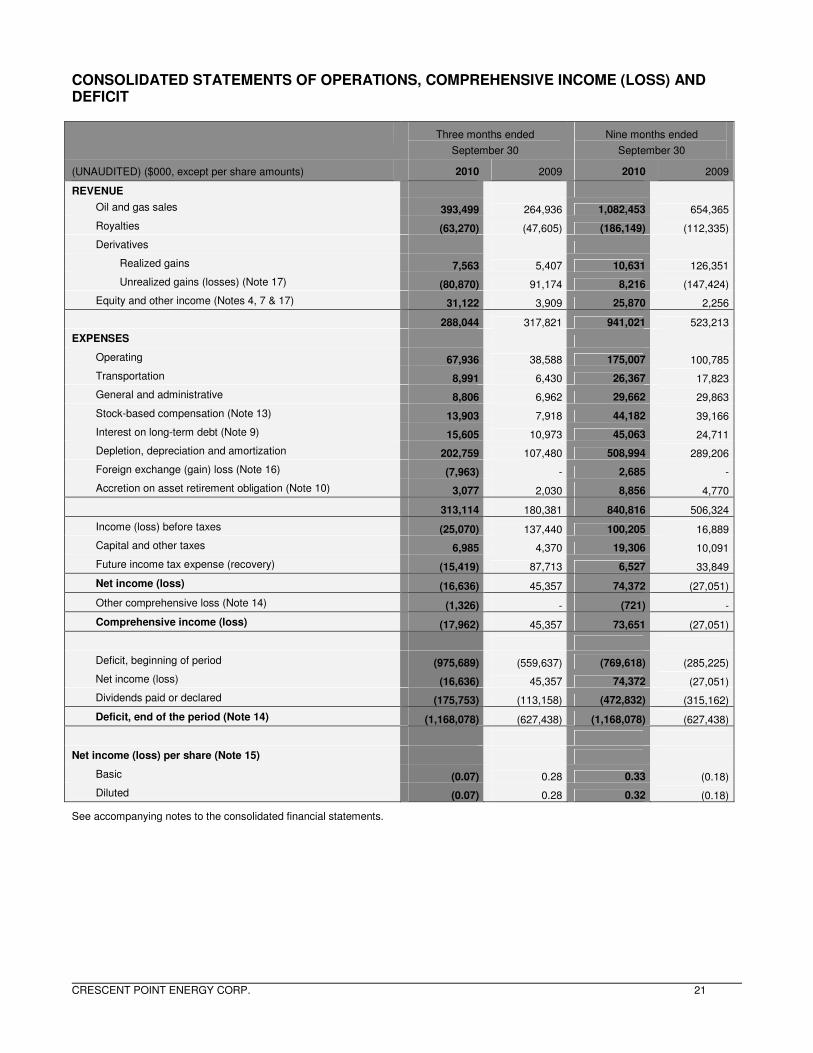
CRESCENT POINT ENERGY CORP. 21
CONSOLIDATED STATEMENTS OF OPERATIONS, COMPREHENSIVE INCOME (LOSS) AND DEFICIT
Three months ended
September 30
Nine months ended
September 30
(UNAUDITED) ($000, except per share amounts) 2010 2009 2010 2009
REVENUE
Oil and gas sales 393,499 264,936 1,082,453 654,365
Royalties (63,270) (47,605) (186,149) (112,335)
Derivatives
Realized gains 7,563 5,407 10,631 126,351
Unrealized gains (losses) (Note 17) (80,870) 91,174 8,216 (147,424)
Equity and other income (Notes 4, 7 & 17) 31,122 3,909 25,870 2,256
288,044 317,821 941,021 523,213
EXPENSES
Operating 67,936 38,588 175,007 100,785
Transportation 8,991 6,430 26,367 17,823
General and administrative 8,806 6,962 29,662 29,863
Stock-based compensation (Note 13) 13,903 7,918 44,182 39,166
Interest on long-term debt (Note 9) 15,605 10,973 45,063 24,711
Depletion, depreciation and amortization 202,759 107,480 508,994 289,206
Foreign exchange (gain) loss (Note 16) (7,963) - 2,685 -
Accretion on asset retirement obligation (Note 10) 3,077 2,030 8,856 4,770
313,114 180,381 840,816 506,324
Income (loss) before taxes (25,070) 137,440 100,205 16,889
Capital and other taxes 6,985 4,370 19,306 10,091
Future income tax expense (recovery) (15,419) 87,713 6,527 33,849
Net income (loss) (16,636) 45,357 74,372 (27,051)
Other comprehensive loss (Note 14) (1,326) - (721) -
Comprehensive income (loss) (17,962) 45,357 73,651 (27,051)
Deficit, beginning of period (975,689) (559,637) (769,618) (285,225)
Net income (loss) (16,636) 45,357 74,372 (27,051)
Dividends paid or declared (175,753) (113,158) (472,832) (315,162)
Deficit, end of the period (Note 14) (1,168,078) (627,438) (1,168,078) (627,438)
Net income (loss) per share (Note 15)
Basic (0.07) 0.28 0.33 (0.18)
Diluted (0.07) 0.28 0.32 (0.18)
See accompanying notes to the consolidated financial statements.

CRESCENT POINT ENERGY CORP. 22
CONSOLIDATED STATEMENTS OF CASH FLOWS
Three months ended
September 30
Nine months ended
September 30
(UNAUDITED) ($000) 2010 2009 2010 2009
CASH PROVIDED BY (USED IN) OPERATING ACTIVITIES
Net income (loss) (16,636) 45,357 74,372 (27,051)
Items not affecting cash
Equity and other income (Note 4, 7 & 17) (31,122) (3,909) (25,870) (2,256)
Future income tax (recovery) expense (15,419) 87,713 6,527 33,849
Stock-based compensation (Note 13) 13,903 7,918 44,182 35,661
Depletion, depreciation and amortization 202,759 107,480 508,994 289,206
Accretion on asset retirement obligation (Note 10) 3,077 2,030 8,856 4,770
Unrealized (gain) loss on foreign exchange (Note 16) (7,959) - 2,734 -
Unrealized (gains) losses on derivatives (Note 17) 80,870 (91,174) (8,216) 147,424
Asset retirement expenditures (Note 10) (410) (487) (1,514) (1,424)
Change in non-cash working capital
Accounts receivable 22,432 (4,996) 15,093 (4,623)
Prepaids and deposits 3,329 (2,887) 4,242 (4,766)
Accounts payable and accrued liabilities (50,241) 3,022 (48,410) (17,903)
204,583 150,067 580,990 452,887
INVESTING ACTIVITIES
Development capital and other expenditures (350,086) (114,985) (722,152) (237,804)
Capital acquisitions, net (Note 7) (3,765) (174,435) (553,995) (502,840)
Deposits on property, plant and equipment - 3,350 - -
Reclamation fund net contributions 2,600 1,061 1,186 711
Long-term investment (Note 4) 4,022 (1,106) 1,465 (1,074)
Change in non-cash working capital
Accounts receivable (3,626) (5,259) (11,718) (4,572)
Accounts payable and accrued liabilities 51,147 26,380 60,375 23,934
(299,708) (264,994) (1,224,839) (721,645)
FINANCING ACTIVITIES
Issue of shares, net of issue costs (8,250) 274,832 346,592 679,591
Increase (decrease) in long-term debt 175,028 (32,286) 498,180 (100,513)
Cash dividends (74,809) (113,158) (202,357) (315,162)
Change in non-cash working capital
Cash dividends payable 3,156 (14,461) 1,434 4,842
95,125 114,927 643,849 268,758
INCREASE IN CASH - - - -
CASH AT BEGINNING OF PERIOD - - - -
CASH AT END OF PERIOD - - - -
Supplemental cash flow information (Note 18)
See accompanying notes to the consolidated financial statements.

CRESCENT POINT ENERGY CORP. 23
NOTES TO CONSOLIDATED FINANCIAL STATEMENTS
September 30, 2010 (UNAUDITED)
1. STRUCTURE OF THE BUSINESS
Organization Structure
The principal undertakings of Crescent Point Energy Corp. and its predecessor Crescent Point Energy Trust (collectively the “Company” or “Crescent Point”) are to carry on the business of acquiring, developing and holding interests in petroleum and natural gas properties and assets related thereto through a general partnership and wholly owned subsidiaries.
Wild River Arrangement
On July 2, 2009, Crescent Point Energy Trust (“Crescent Point” or the “Trust”) and Wild River Resources Ltd. (“Wild River”) completed a plan of arrangement (the “Wild River Arrangement”) whereby the Trust unitholders exchanged their trust units for common shares in Wild River, a private company with properties in the Lower Shaunavon area of southwest Saskatchewan, on a one-to-one basis thereby effectively converting the Trust into a corporation. In addition, pursuant to the Wild River Arrangement, the shares of Wild River were consolidated on a 0.1512 for one basis prior to the exchange, the Board of Directors and management team of Wild River were replaced with Crescent Point’s existing Board of Directors and management team and Wild River changed its name to Crescent Point Energy Corp. As a result of the Wild River Arrangement, the Trust was dissolved and Crescent Point Energy Corp. received all of the assets and assumed all of the liabilities of the Trust.
After completion of the Wild River Arrangement, the former unitholders of the Trust owned approximately 97 percent of the Company and the former shareholders of Wild River owned approximately 3 percent. In accordance with Canadian generally accepted accounting principles (“GAAP”), the Wild River Arrangement was accounted for as a reverse take-over, whereby the Trust was deemed to be the acquirer of Wild River. These consolidated financial statements have been prepared on a continuity of interest basis, which recognizes Crescent Point Energy Corp. as the successor entity to the Trust. As a result, in these and future financial statements, Crescent Point will refer to common shares, shareholders and dividends which were formerly referred to as units, unitholders and distributions under the trust structure. Comparative amounts in these financial statements include the results of the Trust.
2. SIGNIFICANT ACCOUNTING POLICIES
These interim consolidated financial statements of the Company have been prepared by management in accordance with Canadian GAAP and follow the same accounting policies as the most recent annual audited financial statements, except as described below. The specific accounting policies used are described in the annual audited consolidated financial statements in the Company’s 2009 Annual Report. All amounts reported in these statements are in Canadian dollars unless noted otherwise; United States (“US”) dollars are denoted as “US$”.
3. CHANGES IN ACCOUNTING POLICIES
As of January 1, 2010, the Company adopted the following CICA Handbook standards:
• “Business Combinations”, Section 1582, which replaces the previous business combinations standard. The standard requires assets and liabilities acquired in a business combination, contingent consideration and certain acquired contingencies to be measured at their fair values as of the date of acquisition. In addition, acquisition related and restructuring costs are recognized separately from the business combination and are included in the statement of operations. The adoption of this standard impacts the accounting treatment of business combinations entered into after January 1, 2010.
• "Consolidated Financial Statements", Section 1601, which together with Section 1602 below, replace the former consolidated financial statements standard. Section 1601 establishes the requirements for the preparation of consolidated financial statements. The adoption of this standard has had no material impact on Crescent Point’s financial statements.
• "Non-controlling Interests", Section 1602, which establishes the accounting for a non-controlling interest in a subsidiary in consolidated financial statements subsequent to a business combination. The standard requires a non-controlling interest in a subsidiary to be classified as a separate component of equity. In addition, net earnings and components of other comprehensive income are attributed to both the parent and non-controlling interest. The adoption of this standard has had no material impact on Crescent Point’s financial statements.
The above CICA Handbook sections are converged with International Financial Reporting Standards ("IFRS"). Crescent Point will be required to report its results in compliance with IFRS beginning in 2011 and continues to execute its IFRS implementation plan accordingly.
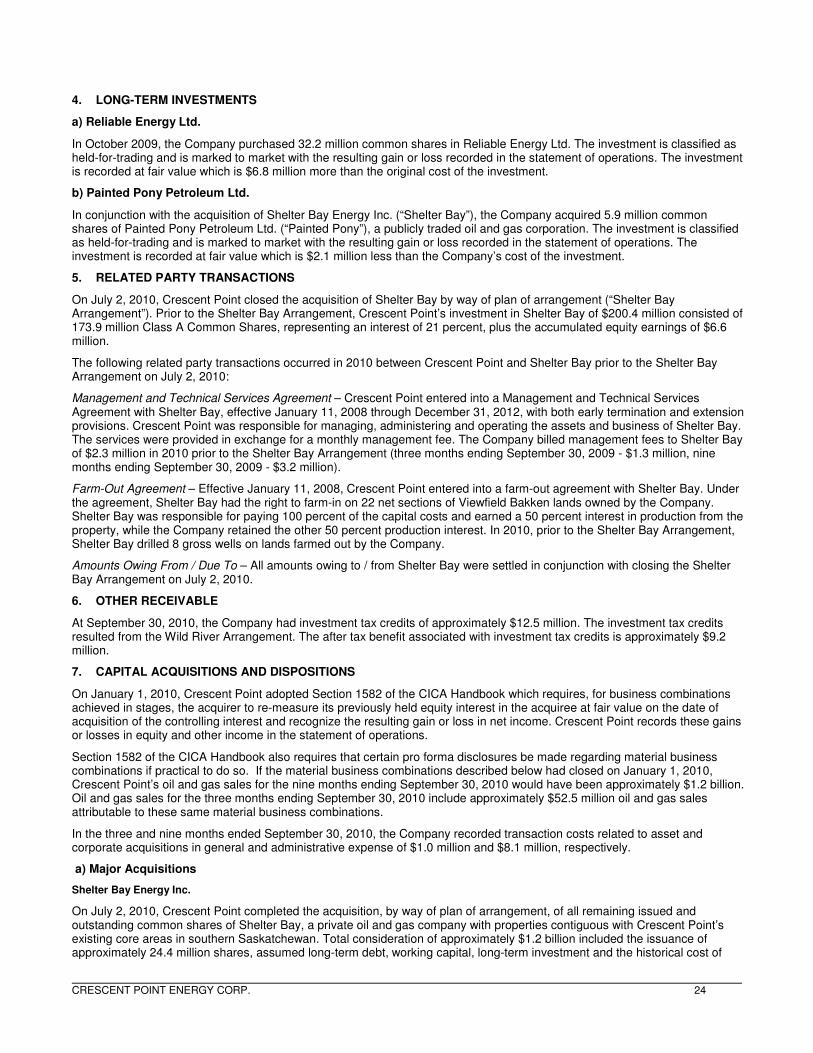
CRESCENT POINT ENERGY CORP. 24
4. LONG-TERM INVESTMENTS
a) Reliable Energy Ltd.
In October 2009, the Company purchased 32.2 million common shares in Reliable Energy Ltd. The investment is classified as held-for-trading and is marked to market with the resulting gain or loss recorded in the statement of operations. The investment is recorded at fair value which is $6.8 million more than the original cost of the investment.
b) Painted Pony Petroleum Ltd.
In conjunction with the acquisition of Shelter Bay Energy Inc. (“Shelter Bay”), the Company acquired 5.9 million common shares of Painted Pony Petroleum Ltd. (“Painted Pony”), a publicly traded oil and gas corporation. The investment is classified as held-for-trading and is marked to market with the resulting gain or loss recorded in the statement of operations. The investment is recorded at fair value which is $2.1 million less than the Company’s cost of the investment.
5. RELATED PARTY TRANSACTIONS
On July 2, 2010, Crescent Point closed the acquisition of Shelter Bay by way of plan of arrangement (“Shelter Bay Arrangement”). Prior to the Shelter Bay Arrangement, Crescent Point’s investment in Shelter Bay of $200.4 million consisted of 173.9 million Class A Common Shares, representing an interest of 21 percent, plus the accumulated equity earnings of $6.6 million.
The following related party transactions occurred in 2010 between Crescent Point and Shelter Bay prior to the Shelter Bay Arrangement on July 2, 2010:
Management and Technical Services Agreement – Crescent Point entered into a Management and Technical Services Agreement with Shelter Bay, effective January 11, 2008 through December 31, 2012, with both early termination and extension provisions. Crescent Point was responsible for managing, administering and operating the assets and business of Shelter Bay. The services were provided in exchange for a monthly management fee. The Company billed management fees to Shelter Bay of $2.3 million in 2010 prior to the Shelter Bay Arrangement (three months ending September 30, 2009 - $1.3 million, nine months ending September 30, 2009 - $3.2 million).
Farm-Out Agreement – Effective January 11, 2008, Crescent Point entered into a farm-out agreement with Shelter Bay. Under the agreement, Shelter Bay had the right to farm-in on 22 net sections of Viewfield Bakken lands owned by the Company. Shelter Bay was responsible for paying 100 percent of the capital costs and earned a 50 percent interest in production from the property, while the Company retained the other 50 percent production interest. In 2010, prior to the Shelter Bay Arrangement, Shelter Bay drilled 8 gross wells on lands farmed out by the Company.
Amounts Owing From / Due To – All amounts owing to / from Shelter Bay were settled in conjunction with closing the Shelter Bay Arrangement on July 2, 2010.
6. OTHER RECEIVABLE
At September 30, 2010, the Company had investment tax credits of approximately $12.5 million. The investment tax credits resulted from the Wild River Arrangement. The after tax benefit associated with investment tax credits is approximately $9.2 million.
7. CAPITAL ACQUISITIONS AND DISPOSITIONS
On January 1, 2010, Crescent Point adopted Section 1582 of the CICA Handbook which requires, for business combinations achieved in stages, the acquirer to re-measure its previously held equity interest in the acquiree at fair value on the date of acquisition of the controlling interest and recognize the resulting gain or loss in net income. Crescent Point records these gains or losses in equity and other income in the statement of operations.
Section 1582 of the CICA Handbook also requires that certain pro forma disclosures be made regarding material business combinations if practical to do so. If the material business combinations described below had closed on January 1, 2010, Crescent Point’s oil and gas sales for the nine months ending September 30, 2010 would have been approximately $1.2 billion. Oil and gas sales for the three months ending September 30, 2010 include approximately $52.5 million oil and gas sales attributable to these same material business combinations.
In the three and nine months ended September 30, 2010, the Company recorded transaction costs related to asset and corporate acquisitions in general and administrative expense of $1.0 million and $8.1 million, respectively.
a) Major Acquisitions
Shelter Bay Energy Inc.
On July 2, 2010, Crescent Point completed the acquisition, by way of plan of arrangement, of all remaining issued and outstanding common shares of Shelter Bay, a private oil and gas company with properties contiguous with Crescent Point’s existing core areas in southern Saskatchewan. Total consideration of approximately $1.2 billion included the issuance of approximately 24.4 million shares, assumed long-term debt, working capital, long-term investment and the historical cost of

CRESCENT POINT ENERGY CORP. 25
Crescent Point’s previously held equity investment of $200.4 million ($1.2 billion was allocated to property, plant and equipment). The goodwill recognized on acquisition is attributed to the expected future cash flows derived from unbooked possible reserves. The business combination was accounted for using the acquisition method of accounting.
The carrying value of Crescent Point’s investment in Shelter Bay on July 2, 2010 was $207.0 million, and for purposes of determining the purchase price allocation, the fair value is estimated at $237.3 million, resulting in a gain of $30.3 million.
($000)
Fair value of net assets acquired(1)
Long-term investment 36,633
Accounts receivable 16,152
Risk management assets 11,987
Property, plant and equipment 1,249,522
Goodwill 104,456
Accounts payable (45,771)
Long-term debt (137,687)
Asset retirement obligation (7,119)
Future income tax liability (91,356)
Total net assets acquired 1,136,817
Consideration
Crescent Point’s previously held equity interest 206,987
Gain on Crescent Point’s previously held equity interest 30,291
Shares issued (24,397,586 shares) 899,539
Total purchase price 1,136,817
(1) The above amounts are estimates, which were made by management at the time of the preparation of these financial statements based on information then available. Amendments may be made to these amounts as values subject to estimate are finalized.
Private Company
On July 5, 2010, Crescent Point completed the acquisition, by way of plan of arrangement, of all issued and outstanding common shares of a private oil and gas company with exploratory land in southern Alberta prospective for multi-zone light oil opportunities. Total consideration of approximately $95.6 million included the issuance of approximately 0.7 million shares, assumed long-term debt and working capital ($105.1 million was allocated to property, plant and equipment). The business combination was accounted for using the acquisition method of accounting.
($000)
Fair value of net assets acquired(1)
Accounts receivable 2,337
Property, plant and equipment 105,063
Accounts payable (22,159)
Long-term debt (49,018)
Asset retirement obligation (4,856)
Future income tax liability (4,574)
Total net assets acquired 26,793
Consideration
Shares issued (740,537 shares) 26,793
Total purchase price 26,793
(1) The above amounts are estimates, which were made by management at the time of the preparation of these financial statements based on information then available. Amendments may be made to these amounts as values subject to estimate are finalized.
Ryland Oil Corp.
On August 20, 2010, Crescent Point completed the acquisition, by way of plan of arrangement, of all remaining issued and outstanding common shares of Ryland Oil Corp. (“Ryland”), a public oil and gas company with properties primarily located in Crescent Point’s Flat Lake area in southeastern Saskatchewan and in North Dakota, United States. Total consideration of approximately $116.3 million included the issuance of approximately 2.2 million shares, assumed long-term debt, working capital and the historical cost of Crescent Point’s previously held equity investment of $7.6 million ($122.0 million was allocated to property, plant and equipment). The business combination was accounted for using the acquisition method of accounting.
The carrying value of Crescent Point’s investment in Ryland on August 20, 2010 was $7.8 million and for purposes of determining the purchase price allocation, the fair value is estimated at $7.6 million resulting in a loss of $0.2 million.

CRESCENT POINT ENERGY CORP. 26
($000)
Fair value of net assets acquired(1)
Accounts receivable 356
Property, plant and equipment 121,984
Accounts payable (22,376)
Long-term debt (8,145)
Asset retirement obligation (602)
Future income tax liability (5,088)
Total net assets acquired 86,129
Consideration
Crescent Point’s previously held investment 7,833
Loss on Crescent Point’s previously held investment (203)
Shares issued (2,178,719 shares) 78,499
Total purchase price 86,129
(1) The above amounts are estimates, which were made by management at the time of the preparation of these financial statements based on information then available. Amendments may be made to these amounts as values subject to estimate are finalized.
b) Major Property Acquisitions and Dispositions
Penn West Assets
On January 15, 2010 Crescent Point completed the acquisition of certain assets in southwest Saskatchewan from Penn West Energy Trust. Total consideration paid included Crescent Point’s 100 percent working interest in the Pembina Cardium play acquired through the Company’s arrangement with TriAxon Resources Ltd., a 50 percent working interest in Crescent Point’s Dodsland Viking play and $440.1 million cash including closing adjustments. The net addition recorded to property, plant and equipment was $443.6 million.
Southeast Saskatchewan Assets
On January 25, 2010 Crescent Point completed the acquisition of assets in southeast Saskatchewan for cash consideration of approximately $28.7 million ($30.7 million was allocated to property plant, plant and equipment).
Southwest Saskatchewan Assets
On March 23, 2010 Crescent Point completed the acquisition of assets in southwest Saskatchewan for cash consideration of approximately $67.7 million ($68.4 million was allocated to property, plant and equipment).
c) Minor Acquisitions, Dispositions and Purchase Price Adjustments
Minor property acquisitions, dispositions and purchase price adjustments during the nine months ended September 30, 2010 amounted to additions to property plant and equipment of $17.3 million ($20.6 million was allocated to property, plant and equipment).
8. GOODWILL
($000)
Balance, January 1, 2010 100,294
Shelter Bay acquisition 104,456
Balance, September 30, 2010 204,750
Goodwill acquired in the nine months ended September 30, 2010 is a result of the Shelter Bay acquisition. See Note 7 “Capital Acquisitions and Dispositions” for additional information.
9. LONG-TERM DEBT
The following table reconciles long-term debt:
(CDN$ ‘000) September 30, 2010 December 31, 2009
Bank credit facilities 896,957 519,127
Senior guaranteed notes
CDN$50.0 million (Matures March 24, 2015) 50,000 -
US$37.5 million (Matures March 24, 2015) 38,617 -
US$67.5 million (Matures March 24, 2017) 69,512 -
US$155.0 million (Matures March 24, 2020) 159,619 -
Total long-term debt 1,214,705 519,127

CRESCENT POINT ENERGY CORP. 27
a) Bank Credit Facilities
The Company has a syndicated unsecured credit facility with twelve banks and an operating credit facility with one Canadian chartered bank, for a total amount available under the combined facilities of $1.6 billion.
The credit facilities bear interest at the prime rate plus a margin based on a sliding scale ratio of the Company’s debt to EBITDA, adjusted for certain non-cash items. The syndicated unsecured credit facility matures on June 10, 2013 and can be extended upon agreement of Crescent Point and the lenders. The operating credit facility constitutes a revolving facility for a 364 day term which is extendible annually for a further 364 day revolving period. The current conversion date for the operating credit facility is June 10, 2011. The combined credit facilities have covenants based on the ratios of debt to EBITDA and debt to capital, adjusted for certain non-cash items; the Company is in compliance with all debt covenants at September 30, 2010.
The Company has letters of credit in the amount of $10.8 million outstanding at September 30, 2010.
b) Senior Guaranteed Notes
On March 24, 2010 the Company closed a private offering of senior guaranteed notes raising gross proceeds of US$260.0 million and CDN$50.0 million. The notes are unsecured and rank pari passu with the Company’s bank credit facilities and carry a bullet repayment on maturity. The terms and rates of the Company’s outstanding senior guaranteed notes are detailed below:
Principal Coupon Rate Interest Payment Dates Maturity Date
CDN$50.0 million 4.92% September 24 and March 24 March 24, 2015
US$37.5 million 4.71% September 24 and March 24 March 24, 2015
US$67.5 million 5.48% September 24 and March 24 March 24, 2017
US$155.0 million 6.03% September 24 and March 24 March 24, 2020
Concurrent with the issuance of the US$260.0 million senior guaranteed notes on March 24, 2010, the Company entered into cross currency interest rate swaps (‘‘CCIRS’’) with a syndicate of financial institutions. Under the terms of the CCIRS, the US dollar amount of the notes was fixed for purposes of interest and principal repayments at a notional amount of CDN$265.5 million. See additional information in Note 17 – “Financial Instruments and Risk Management”.
10. ASSET RETIREMENT OBLIGATION
The following table reconciles the asset retirement obligation:
($000)
Nine months ended
September 30, 2010
Year ended
December 31, 2009
Asset retirement obligations, beginning of period 139,365 68,754
Liabilities incurred 6,622 2,622
Liabilities acquired through capital acquisitions 19,817 65,206
Liabilities disposed through capital dispositions - (1,367)
Liabilities settled (1,514) (1,837)
Change in estimate - (1,226)
Accretion expense 8,856 7,213
Asset retirement obligations, end of period 173,146 139,365
11. SHAREHOLDERS’ CAPITAL
Crescent Point has an unlimited number of common shares authorized for issuance.
Number of
shares
Amount
($000)
Common shares, January 1, 2010 209,389,932 4,803,759
Issued for cash 9,150,000 375,150
Issued on capital acquisitions 27,316,842 1,004,831
Issued on exercised restricted shares (1) 570,967 14,227
Issued pursuant to the dividend reinvestment plans 6,456,458 236,636
Common shares, September 30, 2010 252,884,199 6,434,603
Cumulative share issue costs (net of tax) - (105,608)
To be issued pursuant to dividend reinvestment plans 912,972 33,839
Total shareholders’ capital, September 30, 2010 253,797,171 6,362,834
(1) The amount of shares issued on exercise of restricted shares is net of employee withholding taxes.

CRESCENT POINT ENERGY CORP. 28
12. CAPITAL MANAGEMENT
The Company’s capital structure is comprised of shareholders’ equity, long-term debt and working capital. The balance of each of these items is as follows:
($000) September 30, 2010 December 31, 2009
Long-term debt 1,214,705 519,127
Working (capital) deficiency (1) 128,225 (148,190)
Unrealized foreign exchange loss on translation of US dollar senior guaranteed notes (2,734) -
Net debt 1,340,196 370,937
Shareholders’ equity 5,264,197 3,978,478
Total capitalization 6,604,393 4,349,415
(1) Working (capital) deficiency is calculated as current liabilities less current assets, excluding risk management assets and liabilities, less long-term investments.
Crescent Point’s objective for managing capital is to maintain a strong balance sheet and capital base to provide financial flexibility, stability to dividends and to position the Company for future development of the business. Ultimately, Crescent Point strives to maximize long-term stakeholder value by ensuring the Company has the financing capacity to fund projects that are expected to add value to stakeholders and distribute any excess cash that is not required for financing projects.
Crescent Point manages and monitors its capital structure and short-term financing requirements using a non-GAAP measure, the ratio of net debt to funds flow from operations. Net debt is calculated as current liabilities plus long-term debt less current assets, less long-term investments, excluding risk management assets, risk management liabilities, and unrealized foreign exchange loss on translation of US dollar senior guaranteed notes. Funds flow from operations is calculated as cash flow from operating activities before changes in non-cash working capital, transaction costs and asset retirement expenditures. Crescent Point’s objective is to maintain a net debt to funds flow from operations ratio of approximately 1.0 times. This metric is used to measure the Company’s overall debt position and measure the strength of the Company’s balance sheet. Crescent Point monitors this ratio and uses this as a key measure in making decisions regarding financing, capital spending and dividend levels.
Crescent Point strives to provide stability to its dividends over time by managing risks associated with the oil and gas industry. To accomplish this, the Company maintains a conservative balance sheet with significant unutilized lines of credit and actively hedges commodity prices using a 3½ year risk management program and hedging up to 65 percent of after royalty volumes using a portfolio of swaps, collars and put option instruments. Concurrent with the issuance of the US$260.0 million senior guaranteed notes, the Company entered into CCIRS for purposes of fixing the interest and principal repayments at a notional amount of $265.5 million.
Crescent Point is subject to certain financial covenants on its long-term debt and is in compliance with all financial covenants as of September 30, 2010.
13. RESTRICTED SHARE BONUS PLAN
The Company has a Restricted Share Bonus Plan. Under the terms of the Restricted Share Bonus Plan, the Company may grant restricted shares to directors, officers, employees and consultants. Restricted shares vest at 33 1/3 percent on each of the first, second and third anniversaries of the grant date. Restricted shareholders are eligible for monthly dividends on their restricted shares, immediately upon grant.
A summary of the changes in the restricted shares outstanding under the plan is as follows:
Restricted shares, January 1, 2010 2,308,844
Granted 2,588,580
Exercised (880,820)
Forfeited (73,512)
Restricted shares, September 30, 2010 3,943,092
The Company calculated total stock-based compensation, net of forfeitures, of $58.5 million (2009 - $39.2 million), of which $14.3 million (2009 – nil) was capitalized.
A summary of the changes in the contributed surplus is as follows:
($000)
Contributed surplus, January 1, 2010 38,029
Stock-based compensation 59,619
Exercised restricted shares (26,156)
Forfeited restricted shares (1,107)
Contributed surplus, September 30, 2010 70,385

CRESCENT POINT ENERGY CORP. 29
14. DEFICIT AND ACCUMULATED OTHER COMPREHENSIVE INCOME (LOSS)
The deficit balance is composed of the following items:
($000)
Accumulated earnings 618,443
Accumulated dividends (1,786,521)
Deficit, September 30, 2010 (1,168,078)
The accumulated other comprehensive income (loss) balance is composed of the following items:
($000)
Accumulated other comprehensive loss, January 1, 2010 (223)
Change in cumulative translation adjustment (721)
Accumulated other comprehensive loss, September 30, 2010 (944)
15. PER SHARE AMOUNTS
The following table summarizes the weighted average shares used in calculating net income per share:
Three months ended September 30 Nine months ended September 30
2010 2009 2010 2009
Weighted average shares (1) 250,020,954 160,333,988 225,221,692 148,735,729
Dilutive impact of restricted shares (1) 3,969,824 2,280,800 3,857,117 2,361,236
Dilutive shares (1) 253,990,778 162,614,788 229,078,809 151,096,965
(1) Comparative amounts presented include trust units.
16. FOREIGN EXCHANGE
Three months ended September 30 Nine months ended September 30
($000) 2010 2009 2010 2009
Realized
Foreign exchange gain 47 - 91 -
Unrealized
Foreign exchange gain (loss) on translation of US dollar
senior guaranteed notes 7,959 - (2,734) -
Other foreign exchange loss (43) - (42) -
Foreign exchange gain (loss) 7,963 - (2,685) -
17. FINANCIAL INSTRUMENTS AND RISK MANAGEMENT
a) Carrying Value and Fair Value of Financial Instruments
The Company’s financial assets and liabilities are comprised of accounts receivable, investments in marketable securities, long-term investments, reclamation fund, risk management assets and liabilities, accounts payable and accrued liabilities, cash dividends payable and long-term debt. Risk management assets and liabilities arise from the use of derivatives.
Accounts Receivable and Reclamation Fund
Accounts receivable and reclamation fund are classified as loans and receivables which are reported at amortized cost. At September 30, 2010 and December 31, 2009 the carrying value of accounts receivable approximated their fair value.
Investments in Marketable Securities
Marketable securities with a quoted price in an active market are classified as held-for-trading and are reported at fair value, with changes in fair value recorded in equity and other income. During the three and nine months ended September 30, 2010 the Company recorded an unrealized loss on marketable securities of $0.1 million and $0.3 million, respectively. At September 30, 2010 the Company reported investments in marketable securities at a fair value of $0.8 million (December 31, 2009 - $1.1 million).
Long-term investments
Long-term investments with a quoted price in an active market are classified as held-for-trading and are reported at fair value, with changes in fair value recorded in equity and other income. During the three and nine months ended September 30, 2010, the Company recorded unrealized gains on long-term investments of less than $0.1 million and unrealized losses on long-term investments of $5.7 million, respectively. At September 30, 2010 the Company reported long-term investments in public companies at a fair value of $46.2 million (December 31, 2009 - $15.4 million).

CRESCENT POINT ENERGY CORP. 30
In August 2010, the Company sold its investment in a private oil and gas company and realized a gain of $1.1 million which is recorded in equity and other income.
Accounts Payable and Accrued Liabilities and Cash Dividends Payable
Accounts payable and accrued liabilities and cash dividends payable are classified as other financial liabilities and are reported at amortized cost. At September 30, 2010 and December 31, 2009 the carrying value of these accounts approximated their fair values.
Long-term debt
Bank Credit Facilities
The bank credit facilities are classified as other financial liabilities and are reported at amortized cost. At September 30, 2010 and December 31, 2009 the carrying value approximated their fair value.
Senior Guaranteed Notes
The senior guaranteed notes, which are classified as other liabilities, are carried at their amortized cost and translated to Canadian dollars at the period end exchange rate. The following table details the amortized cost of the notes and their fair values expressed in Canadian dollars:
Senior Guaranteed Notes Principal ($000)
Reported Amortized
Cost CDN$ Fair Value CDN$
CDN$50.0 million 50,000 51,966
US$37.5 million 38,617 41,039
US$67.5 million 69,512 75,335
US$155.0 million 159,619 176,811
317,748 345,151
Risk Management Assets and Liabilities
Risk management assets and liabilities arise from the use of derivatives. The Company has assessed the relative inputs used in the determination of the fair value of all its derivative financial instruments and has determined that a fair value classification of Level 2 is appropriate for each of the instruments. A level 2 assignment is appropriate where observable inputs other than quoted prices are used in the fair value determination. The Company’s derivative financial instruments are classified as held-for-trading and are reported at fair value with changes in fair value recorded through the statement of operations.
The following table summarizes the fair value as at September 30, 2010 and the change in fair value for the nine month period ended September 30, 2010.
($000)
Risk management asset, January 1, 2010 5,520
Acquired through capital acquisitions 11,987
Unrealized mark-to-market gain 12,353
Risk management asset, September 30, 2010 29,860
Less: current risk management asset, September 30, 2010 (14,110)
Long-term risk management asset, September 30, 2010 15,750
Risk management liability, January 1, 2010 62,323
Unrealized mark-to-market loss 4,137
Risk management liability, September 30, 2010 66,460
Less: current risk management liability, September 30, 2010 (25,079)
Long-term risk management liability, September 30, 2010 41,381
The physical power contracts have not been marked to market as the power acquired is for the Company’s own use. The unrealized loss on the physical contracts at September 30, 2010 is $0.7 million.
b) Risks Associated with Financial Assets and Liabilities
The Company is exposed to financial risks from its financial assets and liabilities. The financial risks include market risk relating to commodity prices, interest rates and foreign exchange rates, as well as credit and liquidity risk.
Market Risk
Market risk is the risk that the fair value or future cash flows of a derivative will fluctuate because of changes in market prices. Market risk is comprised of commodity price risk, interest rate risk and foreign exchange risk as discussed below.
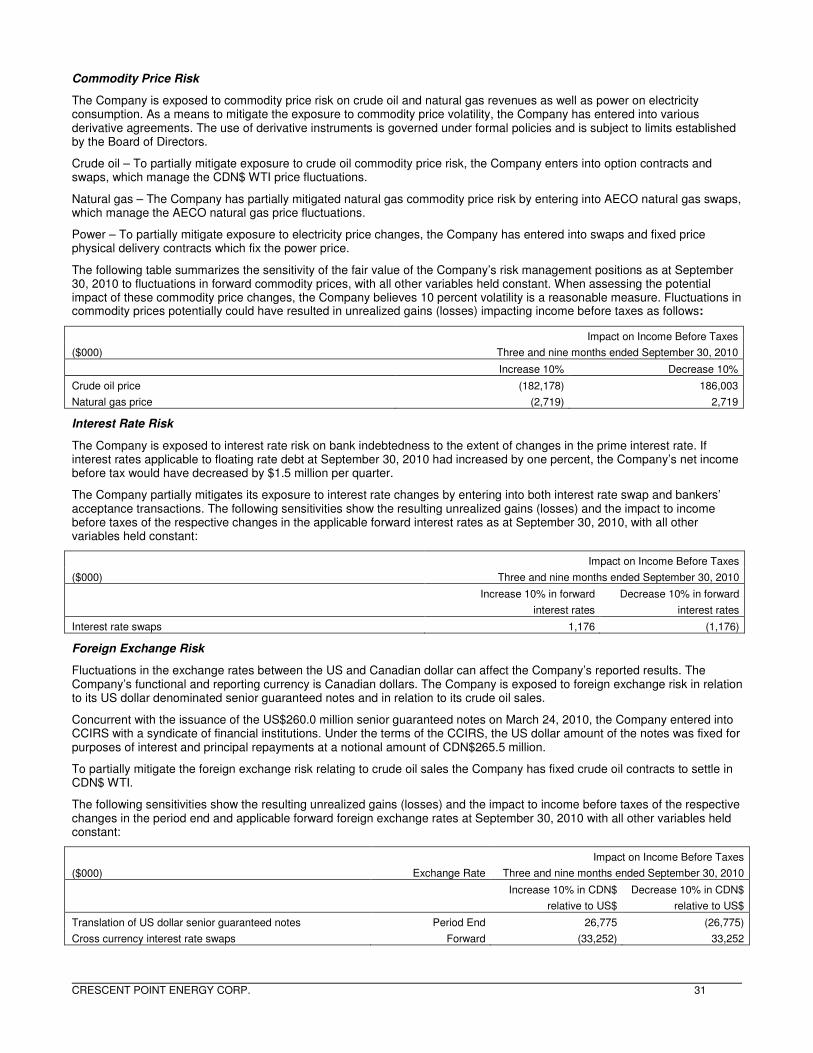
CRESCENT POINT ENERGY CORP. 31
Commodity Price Risk
The Company is exposed to commodity price risk on crude oil and natural gas revenues as well as power on electricity consumption. As a means to mitigate the exposure to commodity price volatility, the Company has entered into various derivative agreements. The use of derivative instruments is governed under formal policies and is subject to limits established by the Board of Directors.
Crude oil – To partially mitigate exposure to crude oil commodity price risk, the Company enters into option contracts and swaps, which manage the CDN$ WTI price fluctuations.
Natural gas – The Company has partially mitigated natural gas commodity price risk by entering into AECO natural gas swaps, which manage the AECO natural gas price fluctuations.
Power – To partially mitigate exposure to electricity price changes, the Company has entered into swaps and fixed price physical delivery contracts which fix the power price.
The following table summarizes the sensitivity of the fair value of the Company’s risk management positions as at September 30, 2010 to fluctuations in forward commodity prices, with all other variables held constant. When assessing the potential impact of these commodity price changes, the Company believes 10 percent volatility is a reasonable measure. Fluctuations in commodity prices potentially could have resulted in unrealized gains (losses) impacting income before taxes as follows:
Impact on Income Before Taxes
($000) Three and nine months ended September 30, 2010
Increase 10% Decrease 10%
Crude oil price (182,178) 186,003
Natural gas price (2,719) 2,719
Interest Rate Risk
The Company is exposed to interest rate risk on bank indebtedness to the extent of changes in the prime interest rate. If interest rates applicable to floating rate debt at September 30, 2010 had increased by one percent, the Company’s net income before tax would have decreased by $1.5 million per quarter.
The Company partially mitigates its exposure to interest rate changes by entering into both interest rate swap and bankers’ acceptance transactions. The following sensitivities show the resulting unrealized gains (losses) and the impact to income before taxes of the respective changes in the applicable forward interest rates as at September 30, 2010, with all other variables held constant:
Impact on Income Before Taxes
($000) Three and nine months ended September 30, 2010
Increase 10% in forward
interest rates
Decrease 10% in forward
interest rates
Interest rate swaps 1,176 (1,176)
Foreign Exchange Risk
Fluctuations in the exchange rates between the US and Canadian dollar can affect the Company’s reported results. The Company’s functional and reporting currency is Canadian dollars. The Company is exposed to foreign exchange risk in relation to its US dollar denominated senior guaranteed notes and in relation to its crude oil sales.
Concurrent with the issuance of the US$260.0 million senior guaranteed notes on March 24, 2010, the Company entered into CCIRS with a syndicate of financial institutions. Under the terms of the CCIRS, the US dollar amount of the notes was fixed for purposes of interest and principal repayments at a notional amount of CDN$265.5 million.
To partially mitigate the foreign exchange risk relating to crude oil sales the Company has fixed crude oil contracts to settle in CDN$ WTI.
The following sensitivities show the resulting unrealized gains (losses) and the impact to income before taxes of the respective changes in the period end and applicable forward foreign exchange rates at September 30, 2010 with all other variables held constant:
($000)
Exchange Rate
Impact on Income Before Taxes
Three and nine months ended September 30, 2010
Increase 10% in CDN$
relative to US$
Decrease 10% in CDN$
relative to US$
Translation of US dollar senior guaranteed notes Period End 26,775 (26,775)
Cross currency interest rate swaps Forward (33,252) 33,252

CRESCENT POINT ENERGY CORP. 32
Credit Risk
Credit risk is the risk that one party to a financial instrument will cause a financial loss for the other party by failing to discharge an obligation. A substantial portion of the Company’s accounts receivable are with customers in the oil and gas industry and are subject to normal industry credit risks. The Company monitors the creditworthiness and concentration of credit with customers of its physical oil and gas sales. The Company is authorized to transact derivative contracts with counterparties rated A (or equivalent) or better, based on the lowest rating of the three ratings providers. Should one of the Company’s financial counterparties be downgraded below the A rating limit, the Chief Financial Officer will advise the Audit Committee and provide recommendations to minimize the Company’s credit risk to that counterparty. The maximum credit exposure associated with accounts receivable and risk management assets is the total carrying value and the maximum exposure associated with the derivative instruments approximates their fair value.
To further mitigate credit risk associated with its physical sales portfolio, Crescent Point has secured credit insurance from a global credit insurance provider. This policy provides credit coverage for approximately 65 percent of the Company’s physical sales portfolio. Crescent Point believes this insurance policy is a prudent addition to its formal Credit Policy and its detailed credit processes and controls.
Liquidity Risk
The timing of cash outflows relating to the financial liabilities is outlined in the table below:
($000) 1 year 2 years 3 years > 3 years Total
Accounts payable and accrued liabilities 307,707 - - - 307,707
Cash dividends payable 24,324 - - - 24,324
Risk management liabilities 25,079 24,591 11,358 5,432 66,460
Long-term debt - - 896,957 317,748 1,214,705
Liquidity risk is the risk that the Company will encounter difficulty in meeting obligations associated with financial liabilities. The Company manages its liquidity risk through cash and debt management. As disclosed in Note 12, Crescent Point targets a net average debt to funds flow from operations ratio of approximately 1.0 times.
In managing liquidity risk, the Company has access to a wide range of funding at competitive rates through capital markets and banks. At September 30, 2010, the Company had available unused borrowing capacity on bank credit facilities of approximately $700.0 million. Crescent Point believes it has sufficient funding to meet foreseeable borrowing requirements.
Included in the Company’s bank credit facilities of $897.0 million at September 30, 2010 are obligations of $665.0 million of bankers’ acceptances, obligations of $242.0 million for borrowings under the operating and syndicated prime loans, partially offset by prepaid interest on banker’s acceptances of $4.6 million and prepaid credit facility renewal fees of $5.4 million. These amounts are fully supported and management expects that they will continue to be supported by revolving credit and loan facilities that have no repayment requirements other than interest.
c) Derivative Contracts
The Company entered into fixed price oil, gas, power, interest rate and cross currency interest rate contracts to manage its exposure to fluctuations in the price of crude oil, gas, power, and interest on debt.
The following is a summary of the derivative contracts in place as at September 30, 2010:
Financial WTI Crude Oil Derivative Contracts - Canadian Dollar(1)
Term
Volume
(bbls/d)
Average
Swap
Price
(CDN$/bbl)
Average
Collar
Sold
Call Price
(CDN$/bbl)
Average
Collar
Bought
Put Price
(CDN$/bbl)
Average
Bought
Put Price
(CDN$/bbl)
Average
Put
Premium
(CDN$/bbl)
2010 October - December 27,750 83.95 97.25 80.41 81.70 7.82
2011 27,500 82.13 101.90 82.75 88.29 9.51
2012 19,000 88.20 98.89 81.48 - -
2013 13,557 91.61 99.18 83.25 - -
(1) The volumes and prices reported are the weighted average volumes and prices for the period.

CRESCENT POINT ENERGY CORP. 33
Financial AECO Natural Gas Derivative Contracts – Canadian Dollar
Term
Average
Volume
(GJ/d)
Average
Swap Price
(CDN$/GJ)
2010 October - December 9,337 5.89
2011 9,000 5.97
2012 8,000 5.98
2013 January – March 3,000 5.27
Financial Interest Rate Derivative Contracts – Canadian Dollar
Term Contract
Notional
Principal
(CDN$)
Fixed Annual
Rate (%)
October 2010 – November 2010 Swap 75,000,000 4.35
October 2010 – November 2010 Swap 50,000,000 1.97
October 2010 – June 2011 Swap 75,000,000 3.89
October 2010 – May 2015 Swap 50,000,000 3.09
October 2010 – May 2015 Swap 25,000,000 3.50
October 2010 – May 2015 Swap 25,000,000 2.90
January 2011 – July 2015 Swap 50,000,000 3.63
July 2011 – June 2015 Swap 50,000,000 3.78
Financial Cross Currency Interest Rate
Derivative Contract – Canadian Dollar
Term Contract
Receive
Notional
Principal
(US$)
Fixed Annual
Rate (US %)
Pay
Notional
Principal
(CDN$)
Fixed Annual
Rate (CDN %)
October 2010 – March 2015 Swap 37,500,000 4.71 38,287,500 5.24
October 2010 – March 2017 Swap 67,500,000 5.48 68,917,500 5.89
October 2010 – March 2020 Swap 155,000,000 6.03 158,255,000 6.45
Concurrent with the issuance of the US$260.0 million senior guaranteed notes on March 24, 2010, the Company entered into CCIRS with a syndicate of financial institutions. Under the terms of the CCIRS, the Company pays fixed interest and principal amounts in Canadian dollars in exchange to receive fixed interest and principal amounts in US dollars; these US dollar proceeds will be used to settle the senior guaranteed note obligations. As a result, the amount of the notes was fixed for purposes of interest and principal repayments at a notional amount of CDN$265.5 million.
Physical Power Contracts – Canadian Dollar
Term Contract
Volume
(MW/h)
Fixed Rate
(CDN$/MW/h)
October 2010 – December 2010 Swap 3.0 80.75
January 2011 – December 2011 Swap 3.0 55.25
January 2012 – December 2012 Swap 3.0 58.00
18. SUPPLEMENTAL CASH FLOW INFORMATION
($000)
Three months ended
September 30
Nine months ended
September 30
2010 2009 2010 2009
Cash taxes (recovered) paid (408) 2,640 (1,000) 7,718
Cash interest paid 15,902 11,898 45,873 26,074

CRESCENT POINT ENERGY CORP. 34
19. SUBSEQUENT EVENTS
Equity Financing
On October 13, 2010, the Company and a syndicate of underwriters closed a bought deal equity financing of 10.3 million Crescent Point shares for gross proceeds of $375.2 million ($36.60 per share).
20. COMPARATIVE INFORMATION
Certain information for the previous period has been restated to conform to the current quarter presentation.

CRESCENT POINT ENERGY CORP. 35
Directors
Peter Bannister, Chairman (1) (3)
Paul Colborne (2) (4)
Ken Cugnet (3) (4) (5)
Hugh Gillard (1) (2) (5)
Gerald Romanzin (1) (3)
Scott Saxberg (4)
Greg Turnbull (2) (5)
(1) Member of the Audit Committee of the Board of Directors
(2) Member of the Compensation Committee of the Board of Directors
(3) Member of the Reserves Committee of the Board of Directors
(4) Member of the Health, Safety and Environment Committee of the Board of Directors
(5) Member of the Corporate Governance Committee
Officers
Scott Saxberg President and Chief Executive Officer
Greg Tisdale Chief Financial Officer
C. Neil Smith Vice President, Engineering and Business Development
Dave Balutis Vice President, Exploration
Brad Borggard Vice President, Corporate Planning
Derek Christie Vice President, Geosciences
Ryan Gritzfeldt Vice President, Engineering East
Ken Lamont Vice President, Finance and Treasurer
Tamara MacDonald Vice President, Land
Trent Stangl Vice President, Marketing and Investor Relations
Steve Toews Vice President, Engineering West
Head Office
Suite 2800, 111 – 5th Avenue S.W. Calgary, Alberta T2P 3Y6 Tel: (403) 693-0020 Fax: (403) 693-0070 Toll Free: (888) 693-0020
Banker
The Bank of Nova Scotia Calgary, Alberta
Auditor
PricewaterhouseCoopers LLP Calgary, Alberta
Legal Counsel
McCarthy Tétrault LLP Calgary, Alberta
Evaluation Engineers
GLJ Petroleum Consultants Ltd. Calgary, Alberta
Sproule Associates Ltd. Calgary, Alberta
Registrar and Transfer Agent
Investors are encouraged to contact Crescent Point’s Registrar and Transfer Agent for information regarding their security holdings:
Olympia Trust Company 2300, 125 – 9th Avenue S.E. Calgary, Alberta T2G 0P6 Tel: (403) 261-0900
Stock Exchange
Toronto Stock Exchange – TSX
Stock Symbol
CPG
Investor Contacts
Scott Saxberg President and Chief Executive Officer (403) 693-0020
Greg Tisdale Chief Financial Officer (403) 693-0020
Trent Stangl Vice President, Marketing and Investor Relations (403) 693-0020


![Financial Highlights: Fiscal Year 2019 Ended March 31, 2020 · Analysis of Operating Results and Financial Position (1) Analysis of Operating Results [Financial Highlights] (¥Billion)](https://img.dokumen.tips/doc/110x75/5f87cb83eec6bf3ef911a685/financial-highlights-fiscal-year-2019-ended-march-31-2020-analysis-of-operating.jpg)