Embed Size (px)
Citation preview
i
FINAL YEAR PROJECT – CCB 4612
ACTIVATION OF CHARCOAL BY PHOSPHORIC ACID
IMPREGNATION FOR HIGH YIELDING ACTIVATED CARBON
Prepared by,
Kanaheswaree Rajendran
14225
Supervisor,
Mr.Azry Borhan

ii
ACTIVATION OF CHARCOAL BY PHOSPHORIC ACID
IMPREGNATION FOR HIGH YIELDING ACTIVATED CARBON
Prepared by,
Kanaheswaree Rajendran
14225
Supervisor,
Mr.Azry Borhan
Dissertation submitted in partial fulfillment of the requirements for the
Bachelor of Chemical Engineering ( Hons )
Sept 2014
Universiti Teknologi PETRONAS,
Bandar Seri Iskandar,
31750 Tronoh,
Perak.

iii
CERTIFICATION OF APPROVAL
ACTIVATION OF CHARCOAL BY PHOSPHORIC ACID IMPREGNATION FOR
HIGH YIELDING ACTIVATED CARBON
Prepared by,
Kanaheswaree Rajendran
14225
A project dissertation submitted to the Chemical Engineering Programme
Universiti Teknologi PETRONAS
In partial fulfillment of the requirements for the
Bachelor of Chemical Engineering ( Hons )
Sept 2014
Approved by,
___________________
(Mr.Azry Borhan),
Universiti Teknologi PETRONAS,
Bandar Seri Iskandar,
31750 Tronoh,
Perak.

iv
CERTIFICATION OF ORIGINALITY
This is to certify that I am responsible for the work submitted in this
project, that the original work is my own except as specified in the
references and acknowledgements, and that the original work contained
herein have not been undertaken or done by unspecified sources or persons.
_________________________
( Kanaheswaree Rajendran)
Universiti Teknologi PETRONAS,
Bandar Seri Iskandar,
31750 Tronoh,
Perak

v
Contents
Topic Page
Abstract 1
1.0 Introduction 2
1.1 Background 2
1.2 Problem Statement 3
1.3 Objective 4
1.4 Scope of study 5
2.0 Literature Review 6
2.1 Charcoal 6
2.2 Activated carbon 7
2.3 Activating method 7
2.4 Adsorption 9
2.5 Material & Method selection 10
3.0 Methodology 13
3.1 Project flow 13
3.2 Experimental flow 14
3.3 Proposed experimental procedure 17
3.4 Gantt chart &key milestone 18
4.0 Results & Discussions 20
5.0 Conclusion & Recommendations 29
5.1 Conclusion 29
5.2 Recommendations 30
6.0 References 31
7.0 Appendices 34

vi
List of Tables
Table 2.5.1 : Chemical composition of the selected items 10
Table 2.5.2 : Activation Method 11
Table 2.5.3 : Earlier Researches and The Descriptions 12
Table 3.2.1: Gantt chart for FYP I 18
Table 3.2.2: Gantt chart for FYP II 18
Table 4.1.1: Elemental Composition of Carbon samples before and after the
carbonization process
19
Table 4.3: Surface Area & Porosity Analysis 22
List of Figures
Figure 1.1.1: The Figure shows a carbon dioxide molecule 2
Figure 1.2.1: The graph shows recent annual mean growth gate measured at
Mauna Loa, Hawaii
3
Figure 2.1.1: The Figure shows a kiln during combustion process 6
Figure 2.4.1: The Figure shows the difference between adsorption and
absorption.
9
Figure 4.1.1: The Figure above shows 0.25 mm pure sample’s image under
Field Emission Scanning Electron Microscope (FESEM) at
3000x magnification.
19
Figure 4.1.1: 0.25mm Pure Sample FESEM image 20
Figure 4.1.2: Sample A2 FESEM image 20
Figure 4.1.3: 3.00mm Pure Sample FESEM image 20

vii
Figure 4.1.4: Sample D1 FESEM image 20
Figure 4.3.1: Nitrogen Adsorption-Desorption Isotherm for pure sample 24
Figure 4.4.1: Weight Percentage of Carbon Dioxide Adsorbed 35
Figure 4.4.2: Adsorption Capacity of Carbon Dioxide on Activated Carbon
Derived from Charcoal
36

viii
ACKNOWLEDGEMENT
I would like to express my deepest gratitude to the Chemical Engineering
Department of Universiti Teknologi PETRONAS (UTP) for providing me the chance to
undertake this remarkable Final Year Project (FYP) course. My knowledge on Chemical
Engineering that I already learnt throughout these five years has been be tested by solving
the problem given for this project.
A very special note of thanks to my supervisor, Mr. Azry Borhan, who was
always willing to assist the group and provided good support throughout the project
completion. His excellent support, patience and effective guidance brought a great impact
to me.
Nevertheless, I would like to thank the FYP committee for arranging various
seminars as support and knowledge to assist the students in the project. The seminars
were indeed very helpful and insightful to me. I would also like to thank all lecturers
from Universiti Teknologi PETRONAS who had given me guidance throughout the
project.
Besides that, I would also like to take this opportunity to express my deepest
thanks to all relative third party members who had given me guidance indirectly to
complete this plant design project report. Last but not least, my heartfelt gratitude goes to
my family and friends for providing me continuous support throughout this project.

1
Abstract
The main aim of this research is to study the prospective of using charcoal as a
potential adsorbent for eliminating carbon dioxide from polluted air in the atmosphere.
This project works highlights on the constraints involved in the preparation of activated
carbon from charcoal such as activating agent, activating temperature, ratio of
impregnation. The carbonization process allows forming an active site for adsorption.
Micromeritics ASAP 2020 and Field Emission Scanning Electron Microscope (FESEM)
were used in identifying the best sample preparation method with the largest surface area
which directly contributes to the effectiveness of adsorbent in removing carbon dioxide
(CO2). The samples were also analyzed for its elemental composition before and after
carbonization using FESEM which results in 29.6 wt% and 49.2 wt% of carbon content
respectively. Sample A2 was identified to yield activated carbon with largest surface
area, SBET of 415.6512 m2/g and pore diameter, 17.7 nm which falls in mesopore
category. In addition, the activated carbons developed from charcoal are also verified for
their adsorption capacity with harmful greenhouse gas such as carbon dioxide using
HPVA II analyzer.

2
1.0 Introduction
1.1 Background
This project is basically about removing Carbon Dioxide (CO2) to reduce the level of
CO2 level in the atmosphere by activating carbon using charcoals. There are few
technologies were developed to reduce CO2 from atmosphere such as bio-energy with
carbon capture and storage, direct air capture, ocean fertilization and enhanced
weathering as well as adsorption[1]
. Any materials (animal, plant, or mineral origin) with
high concentration of carbon can be simply changed into activated carbon using chemical
or physical activation methods. The most common raw materials are wood, charcoal, nut
shells, fruit pits, brown and bituminous coals, lignite, peat, bone and paper mill waste
(lignin), synthetic polymers like PVC, are used for manufacturing of activated carbon [2]
.
Since earliest times, charcoal has been used for a large range of purposes especially as a
purifier. A wide range of organic compounds dissolved or suspended in gases and liquids
is been adsorbed easily by charcoal. Adsorbents are usually porous solids, and adsorption
occurs mainly on the pore walls inside particles which allow for remarkable adsorption
capacities [2]
. Activating charcoal also leads to activation of Carbon atom in charcoal
which eventually increases its effectiveness as a filter. Thus, charcoal was chosen as an
adsorbent for this project as it is easy to obtain from market, through chemical activation
using phosphoric acid. Chemical activation is preferred over physical activation owing to
the lower temperatures and shorter time needed for activating material [3]
. A few
parameters are taken into account to obtain a better result. The parameters that will be
studied in this experiment are the size of the particles used, impregnation time,
temperature, specific surface area, total pore volume and average pore diameter.
Figure 1.1.1: The Figure shows a carbon dioxide molecule

3
1.2 Problem statement
Carbon dioxide (CO2) is a naturally occurring chemical compound composed of 2 oxygen
atoms each covalently double bonded to a single carbon atom. It is a gas at standard
temperature and pressure and exists in Earth’s atmosphere in this state, as a trace gas at a
concentration of 0.04 per cent (400 parts per million, ppm) by volume, as of 2014 [[4]
.
Burning of carbon-based fuels since the industrial revolution has rapidly increased the
concentration of carbon dioxide, leading to global warming. Carbon dioxide now an
important greenhouse gas and it is also a major source of ocean acidification since it
dissolves in water to form carbonic acid which is a weak acid as its ionization in water is
incomplete [4]
.
Scientist at National Oceanic & Atmospheric Administration’s (NOAA)
Earth Research Laboratory calculates the Annual Greenhouse Gas Index (AGGI) each
year about 80 sites around the world [4].
Figure 1.2.1: The graph shows recent annual mean growth
gate measured at Mauna Loa, Hawaii [4]
Technologies were developed in order to reduce carbon dioxide concentration
from Earth’s atmosphere [1]
and to produce an eco-friendly environment by the scientist.
Technologies are such as bio-energy with carbon capture and storage, biochar (another

4
name for charcoal), direct air capture, ocean fertilization and enhanced weathering. One
of the most economically and environmentally preferred technology is adsorption
because the other technologies tends to result in negative emission where it removes
the greenhouse gas, carbon dioxide, permanently from Earth's atmosphere [5]
. Charcoal is
a form of carbon processed to have small, low-volume pores that increase the surface
area available for adsorption. Due to its high degree of micro porosity, just one gram of
activated carbon has a surface area in excess of 500 m2, as determined by gas adsorption.
An activation of charcoal increases the porosity [6]
and results in an efficient adsorption
process.
1.3 Objectives
The objectives of this project are:-
To prepare activated carbon from charcoal by chemical activation method.
Activation of carbon atoms in the charcoal can be done by impregnating it in
phosphoric acid and then heated in furnace at 200-500˚C for about 12 hours.
To investigate the effect of the size of the charcoal, impregnation ratio of
phosphoric acid, time and temperature effects on the porosity size of
activated carbon.
Crushed charcoal sample impregnated at different ratio of phosphoric acid and
time to find a better result in adsorption of carbon dioxide
To analyze the characterization of the pores of activated carbon by studying
their pore size and adsorption isotherms respectively.
Freundlich and Langmuir equation are the most popular empirical equations
which are used to express the mathematic relationship between the quantities of
impurity remaining in solution versus the quantity adsorbed. The nitrogen
adsorption-desorption isotherms were used to determine specific surface area and
total pore volume.

5
To test the prepared activated carbon
Prepared activated carbon was analyzed for its characteristics and abilities.
1.4 Scope of study
This project uses phosphoric acid as the activating medium for charcoal. The pores of
activated carbon are then tested for their characteristics with nitrogen (N2) and carbon
dioxide (CO2) gases. The experiment is repeated for different operating parameters:
Ratio of charcoal and phosphoric acid
Pore size of activated carbon
Carbon dioxide adsorption capacity

6
2.0 Literature review
2.1 Charcoal
When wood is "carbonized" or "pyrolysed" under controlled conditions in a closed space
such as a charcoal kiln remaining solid residue is charcoal. During carbonization or
pyrolysis, the process is carried out, away from the oxygen or air to prevent the wood to
ignite and burn down to ashes. The wood substance is forced to decompose without
oxygen and produces a few products especially charcoal [7]
.
The pyrolysis process might continue up to seven days. The size of the kiln and
the density and freshness of the wood determines the duration of the combustion. The
stage of combustion is detectable by checking the color and amount of the smoke. During
the pyrolysis process, the mud-worker is required to fill up the openings with clay in
order to guarantee that the trapped heat inside the kiln is suitable for manufacturing
charcoal [8]
.
Figure 2.1.1: The Figure shows a kiln during combustion process [8].

7
2.2 Activated Carbon
Activated carbon is a form of carbon treated to have small, low-volume pores that
increases the surface area available for adsorption or chemical reactions. Activated
carbon has a surface area in excess of 500 m2 per gram due to its high degree of micro
porosity, as analyzed by gas adsorption [6]
.
An activation level adequate for convenient application may be attained solely
from high surface area and chemical treatment often enhances adsorption properties [6]
.
The surface area of the pore surface developed within the matrix of the activated carbon
can be measured using nitrogen gas using Brunauer-Emmet-Teller (BET) method. Based
on the principle, greater surface area tends to have greater number of adsorptive sites [6]
.
The pore size distribution of an activated carbon can be determined and it is an
extremely useful way of understanding the performance characteristics of the material.
The International Union of Pure and Applied Chemistry (IUPAC) define the pore size
distribution as follows:
Micropores: r < 1nm
Mesopores: 1 < r < 25nm
Macropores: r > 25nm
• The macropores are used as the entrance to the activated carbon, the mesopores for
transportation, and the micropores for adsorption [6]
.
2.3 Activating Methods
Activated carbon is broadly used in various practices as a cost-effective and effective
adsorbent. The feed materials used and the method of activation differs the adsorption
property of an activated carbon. The use of cost-effective material in producing activated
carbon might generate a low cost product [9]
.
Activated carbon can be produced by chemical activation and physical activation.
Density and the size of the material is taken into consideration before choosing the
activation method. During physical activation method, the bulk of volatile matter is

8
eliminated from the raw material by carbonizing it at extremely high temperatures (400-
500˚C). Carbon is then subjected to oxidizing gases such as carbon dioxide or steam at
800-1000˚C for selective oxidation. There are high chances for carbon atom to be
oxidized by atmospheric oxygen and produces carbon dioxide, so the product should be
precisely handled during carbonizing and activating period. Steam and carbon dioxide act
as mild oxidizing agents at 800-1000˚C [2]
. The reaction of carbonizing and steam
activation method as follows:
Cx(H2O)y xC(s) + yH2O Carbonizing
C(s) + 2H2O CO2 + 2H2 Steam activation
C(s) + CO2 2CO Activation by CO2
While in chemical method, the carbonization process and activation processes are
carried out at the same time. Raw material is crushed and impregnated with chemical
agent in a proper ratio (ratio can be manipulated), dried and carbonized up to 800˚C in
vacuum or in the presence of inert gases to make sure that there is no air and oxygen
during the carbonization process. The residual impregnating agent is removed by
leaching with water once the carbonization has been completed.
An extremely active decolorizing carbon is obtained by a rapid process in high
yield at a relatively low reaction temperature around 350-500˚C with chemical agent
activation. This is to degrade the organic molecules during carbonization that avoid
deposition of hydrocarbon on the carbon surface [2]
. Powdered activated carbon has an
extremely high ratio of area to volume, and since adsorption is a surface related process,
so this rises its effectiveness, but also makes it slow to settle down and difficult to
remove once it is added. Most decolorizing carbons are prepared by chemical activation.
The yield and quality of the prepared carbon depends on the preparation variables
on were studied. The activation temperature, heating rate, activation time and
impregnation rate of the chemical agent was important in determining the quality of
activated carbon obtained [9]
.

9
2.4 Adsorption
Adsorption is the adhesion of atoms, ions, or molecules from a gas, liquid, or dissolved
solid to a surface [11]
. This process generates a film of the adsorbate on the surface of
the adsorbent while absorption is a different process where the fluid (the absorbate)
infuses or is dissolved by a liquid or solid (the absorbent) [11].
The term sorption
encompasses both processes, while desorption is the reverse of it. Activated charcoal is
good at trapping other carbon-based impurities ("organic" chemicals and toxins), as well
as things like chlorine. There are also some other chemicals are not attracted to carbon at
all such as sodium and nitrates, they just pass right through. This means that an activated
charcoal filter is only capable of removing certain impurities while ignoring other
impurities [10]
.
Figure 2.4.1: The Figure shows the difference between adsorption and absorption.

10
2.5 Materials & Methods
The materials that have been used in this project has been chose according the following
considerations:
Item Compositions
1. Banana peel Lignin 7 - 15%, 6-9% protein and 20-30% fibre [17]
.
2. Charcoal C > 96% -98%, O 1-2%, Mg, P, K, Na, maybe some Cl [16].
3. Sawdust Moisture 4.8%, ash 0.21, CH2OH 5.1%, Cellulose 58.2% and
lignin 28.4% [18]
.
4. Apple pulp Moisture 10-12%, ashes 3-5%, proteins 6-6.2% and pectin 9-
10% [19]
.
Table 2.5.1 : Chemical composition of the selected items
From the analysis above, banana peel has less than 50% of carbon. Sawdust has
carbon around 70% and apple pulp has 16% of carbon. While, charcoal has the highest
percentage of carbon and carbon is the adsorbing agent according to the previous
researches.
Physical activation method Material was carbonized in the range of
600-900˚C in absence of oxygen by using
inert gas such as Nitrogen. The raw
material is then oxidized by exposing to
steam or oxygen in the temperature range
of 600-1200˚C [3]
.
Chemical activation method The raw material is impregnated in strong

11
base, acid or salt and then carbonized at
lower temperature ranging 450-900˚C. It is
convicted that carbonizing process and
activating process occurs simultaneously
[3].
Table 2.5.2 : Activation Methods
From the table above, chemical activation method is preferred because it can be
achieved by using lower temperatures and in short period of time compared to physical
activation method [3]
.
No Author Raw
material
Experiment conditions BET surface
area (m2/g)
1. Krishnan, 2008 Sawdust 20% of K2CO3 solution was
mixed with grinded sawdust.
Carbonization was performed in
the presence of steam in furnace
at 600˚C [20]
.
683.3
2. Wu et al, 2004 Wood Wood was sealed in a ceramic
oven and heated up to 550˚C.
Steam generated from
deionized water was drizzled
into the oven for 3 hours at a
rate of 3cm3/min. The product
was placed in oven and heated
for an hour at 780˚C [21]
.
1064
3. Azry Borhan Rubber seed 10 g or rubber seed shell was 1001.66

12
shell impregnated in 100 mL of KOH
solution. It is then carbonized in
fixed bed activation to produce
activated carbon. Nitrogen gas
was flowed for 30 minutes in
the furnace with a temperature
of 500˚C [22]
.
4 Lua AC and
T.Yang
Pistachio
nut shell
With an impregnation ratio of
0.75 in ZnCl2, an activation
temperature of 400˚C, and a
hold time of 1 h for pistachio
nut shell [23]
.
1847.5
Table 2.5.3 : Earlier Researches and The Descriptions
From the earlier researches, it can be concluded that a few types of chemicals
such as KOH, NaOH, ZnCl2, K2CO3 and H2PO3 has been used to produce activated
carbon through chemical activation method. Inorganic chemical such as zinc chloride and
phosphoric acid and alkali metal hydroxide is used to degrade the organic molecules
during carbonization that prevents the deposition of hydrocarbon on the carbon surface.
Phosphoric acid is chosen to proceed this project since ZnCl2 releases chlorine gas and
into atmosphere and highly yieldable at a relatively low reaction temperature around 350-
500˚C [2]
.

13
3.0 Methodology
3.1 Project Flow
Literature Review
Preliminary research on the related topic regarding recent studies.
Understanding the concept of adsorption, activated carbon, charcoal and
carbon activation methods.
Identified the variables of the project.
Study on the procedure to use BET and FESEM.
Experiment
Design experiment to develop activated carbon by impregnating charcoal
for removal of carbon dioxide.
Prepare chemicals and equipments required for the experimental work.
One step activation process to be performed to activate carbon using
vertical tubular furnace
Thermal gravimetric analyzer will be used to study weight change of
charcoal with respect to temperature.
Micromeritics ASAP 2020 to be used for pore characterization.
Volumetric adsorption studies will be carried out for carbon dioxide and
nitrogen using HPVA II analyzer

14
3.2 Experiment Methodology
1. Materials
Commercial charcoal will be used as a raw material in this project. Phosphoric acid
will also be used to activate the carbon in the charcoal. Nitrogen gas and carbon
dioxide gas will be used to determine the adsorption value of the activated carbon [14]
.
2. Preparation of sample
Charcoal was crushed finely and sieved to obtain particles around 0.25 mm. The
sample was used as raw precursor [13]
. Sample was rinsed and dried in a furnace for
more than 24 hours to make sure there is no moisture in it. Dried sample was kept in a
air tight container.
Data Extraction
Conduct experiment, collect data and analyze the data.
Weight change of charcoal with respect to temperature.
Pore characterization using IUPAC classification and surface area calculation
using Brunauer-Emmett-Teller (BET) equation
Adsoprtion capacity of carbon dioxide and nitrogen
Results and discussions.
Conclusion
Conclude the findings.
Prepare interim report.

15
3. Activation of carbon
The charcoal was first soaked in different amounts of phosphoric acid for different
duration of time at room temperature. The impregnation ratio defined as:
Impregnation ratio = Weight of H3PO4 in solution
Weight of carbon
The chemical activation methods were conducted in a modified furnace with
continuous output power. After impregnation, charcoal was filtered from phosphoric
acid. There are three part in the apparatus used for the activation process which are
the gas inlet, tubular reactor, and condenser. The furnace was flushed with highly
purified nitrogen to maintain an inert condition in the furnace [13]
. The activation
process is estimated to accomplish at the 500˚C-600˚C for 4-5 hours.
4. Tools and equipments
No. Equipments Description
1. Beaker Impregnation of charcoal
2.
Conical flask
Mixing of phosphoric acid and
charcoal.
3.
Weighing balance
Weigh the weight of charcoal before
impregnating, after impregnating and
after drying.
4. Measuring cylinder Measure volume of phosphoric acid.
5. Filter funnel & filter paper Filter impregnated charcoal.
6. Furnace Carbonization of charcoal.
7. Grinder Grind charcoal to different sizes.
8. Oven Dry impregnated charcoal.
9.
Thermal gravimetric analyzer
Study of weight change of charcoal with
respect to temperature.
10. Micromeritics ASAP 2020 Pore characterization.
11. HPVA II analyzer Volumetric adsorption was studied.

16
5. Range of variables
a) Study of weight change of charcoal versus temperature.
Temperature (˚C) Weight of charcoal sample (g)
300
400
500
600
b) Study of surface area of pores formed with respect to impregnation ratio
c) Study of carbon dioxide adsorption capacity with respect to temperature
Temperature (°C) Carbon dioxide adsorption
capacity (% weight)
50
75
100
Impregnation
ratio
Surface area of pores formed
(m2)
1:1
1:2
1:3

17
3.3 Proposed Experiment Procedure
Referring to the previous research work done by S.M. Yakout, and G. Sharaf El-Deen in
their project, Characterization of activated carbon prepared by phosphoric acid activation
of olive stones, the procedures for this experiment are as follows [15]
:
1. Charcoal will be used as a precursor.
2. Grind, dry and sieve charcoal.
3. Obtain particle sizes comprised between1-2mm for the preparation of activated
charcoal.
4. Measure 50g of charcoal and impregnate with phosphoric acid with ratio of 1:1,
1:2, and 1:3 for 1,2,3 and 4 hours each.
5. Carry out carbonization process in the furnace and calibrate the temperature of the
furnace and nitrogen flow rate accordingly.
6. Cool down the system under nitrogen flow and wash the product obtained with
distilled water until normal pH is achieved.
7. Dry the product in the oven at 120˚C.
8. Measure active carbon characterization by using nitrogen adsorption/desorption
isotherms at an automatic adsorption instrument in relative pressure ranging from
0.1-0.5.
9. The mass change is charcoal is studied using AXSTAR TG/DTA 6300 thermal
gravimetric with respect to temperature. The samples were heated from 25°C to
900° at heating rate of 20°C per minute under the presence of Nitrogen at a flow
rate of 20mL/minute.
10. The pore structures of activated carbon are determined using Micromeritics ASAP
2020 with N2 adsorption-desorption.
11. Volumetric adsorption of carbon dioxide and nitrogen on the activated carbon
derived from charcoal is analyzed using HPVA II analyzer.
12. The adsorption took place at three distinct temperatures, 50°, 75°C and 100°C
with pressure interval of 0.1 bar.

18
3.4 Gantt Chart & Key Milestone
Table 3.2.1: Gantt chart for FYP I
Table 3.2.2: Gantt chart for FYP II
19
4.0 Results and Discussions
4.1 FESEM Imaging and Elemental Composition Analysis
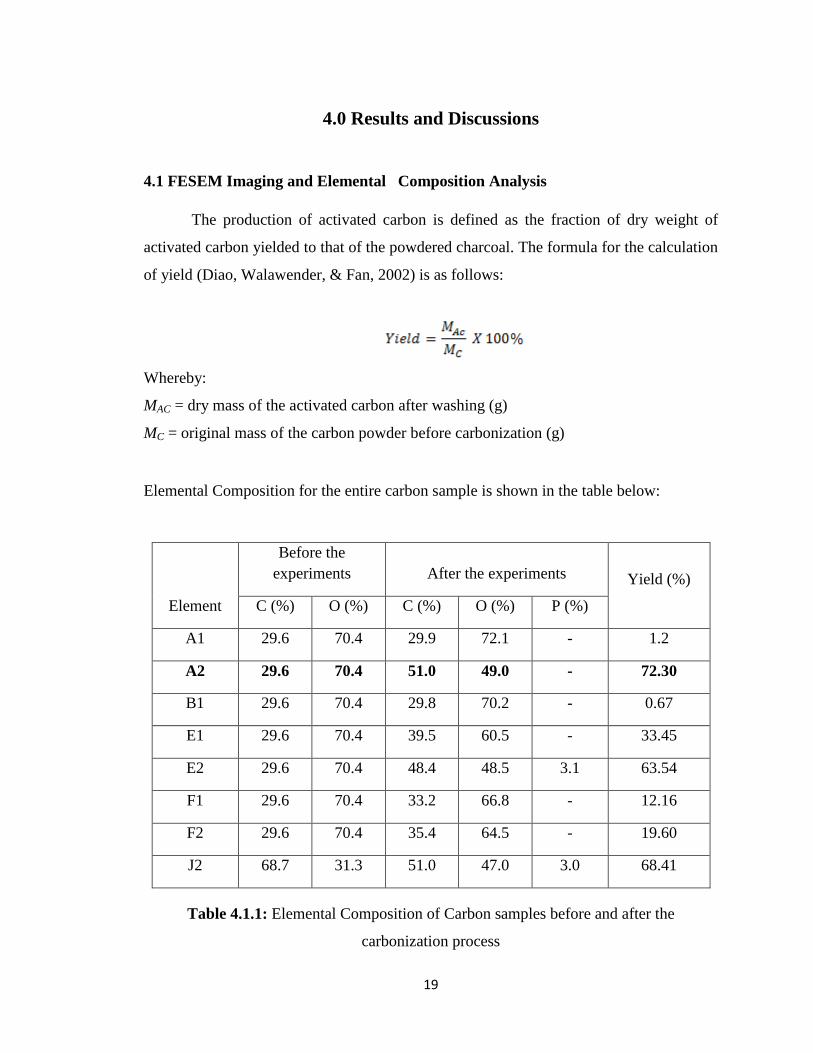
The production of activated carbon is defined as the fraction of dry weight of
activated carbon yielded to that of the powdered charcoal. The formula for the calculation
of yield (Diao, Walawender, & Fan, 2002) is as follows:
Whereby:
MAC = dry mass of the activated carbon after washing (g)
MC = original mass of the carbon powder before carbonization (g)
Elemental Composition for the entire carbon sample is shown in the table below:
Element
Before the
experiments After the experiments Yield (%)
C (%) O (%) C (%) O (%) P (%)
A1 29.6 70.4 29.9 72.1 - 1.2
A2 29.6 70.4 51.0 49.0 - 72.30
B1 29.6 70.4 29.8 70.2 - 0.67
E1 29.6 70.4 39.5 60.5 - 33.45
E2 29.6 70.4 48.4 48.5 3.1 63.54
F1 29.6 70.4 33.2 66.8 - 12.16
F2 29.6 70.4 35.4 64.5 - 19.60
J2 68.7 31.3 51.0 47.0 3.0 68.41
Table 4.1.1: Elemental Composition of Carbon samples before and after the
carbonization process

20
Based on the elemental composition of carbon before and after, A2 yields 51.0%
of carbon in the sample which results in a yield of 72.3% of carbon comparing with the
initial sample. The sample A2 was 0.25mm sample which was carbonized at 500 ˚C. The
ratio of sample: phosphoric acid for A2 is 1:10 and it yields a pore size of 17.7nm. The
amount of carbon element in the elemental composition of FESEM shows that the pore
size of the sample has become bigger which enables a bigger surface area for the sample
to increase the adsorption activity.
In sample E2 and J2, there are some traces of Phosphorus which proves that the
substance has been impregnated in a solution or material that contains Phosphorus, which
is Phosphoric acid.
Figure 4.1.1: 0.25mm Pure Sample
FESEM image
Figure 4.1.2: Sample A2 FESEM
image
Figure 4.1.3: 3.00mm Pure Sample
FESEM image
Figure 4.1.4: Sample D1 FESEM
image

21
Based on the FESEM imaging, Figure 4.1.1 and Figure 4.1.2 displays the passage
construction in charcoal sample with 0.25 mm size before and after the carbonization
process is being carried out at 500°C, which is essential in production of activated
carbon. The canal permits the charcoal to absorb the chemical activation agent to activate
pore development. Figure 4.1.1 and Figure 4.1.2 is the 3000 times magnification on pure
sample and sample A2 respectively. The image clearly shows that pores have already
been formed on the sample at 500°C and two hours of carbonization. Bigger pores are
observed on the surface morphology of sample A2 as shown in Figure 4.1.2.
Figure 4.1.3 and Figure 4.1.4 displays the passage construction in charcoal sample
before and after the carbonization process being carried out in sample sized 3.00 mm at
600°C. Figure 4.1.3 shows the pore formation in good condition but Figure 4.1.4 shows
the porous wall are broken slightly at 600°C of carbonization temperature for two hours.
It shows the effect of implying excessive heat during carbonization, which is 600°C for
two hours. This indicates that at 600°C of temperature, the heat is excessive for the
sample which results in the knocking and breaking of the porous formation in the sample
(Borhan & Kamil, 2012). In addition, the carbonization period is also too long which
deteriorates the formation of activated carbon.
22
4.2 Surface Area and Porosity Analysis
Sample
Label
Activation
Temperature
(°C)
Sample
Size
(mm)
Impregnation
ratio
SBET
(m2/g)
VT
(cm3/g)
D (nm)
Pure Sample - 0.25 - 1.4202 0.004343 7.695
A1 500 0.25 1:10 241.5382 0.14126 2.349
A2 500 0.25 1:10 415.5244 0.22812 2.347
B1 500 3.00 1:5 76.9645 0.04694 2.448
E1 500 0.25 1:1 1.4102 0.003759 10.065
E2 600 0.25 1:1 364.8818 0.200986 2.232
F1 500 3.00 1:1 0.0827 - -
F2 500 3.00 1:3 323.7159 0.15229 9.482
J2 600 0.25 1:3 365.2791 0.196245 2.134
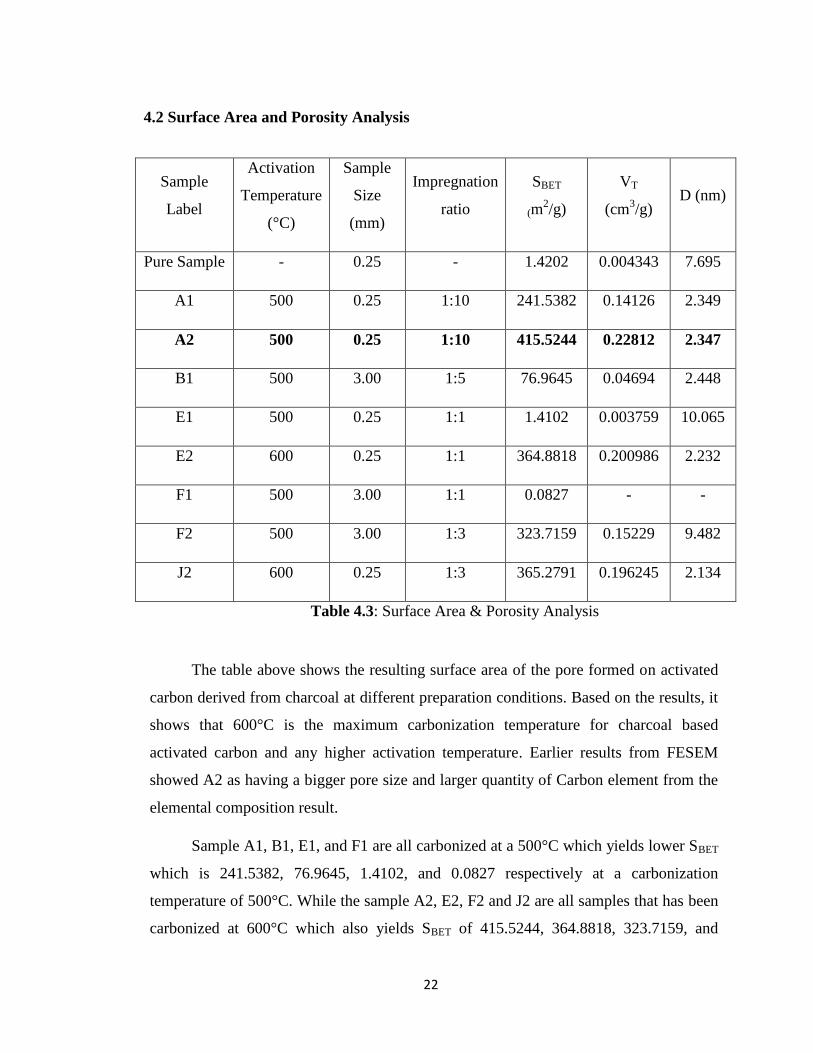
Table 4.3: Surface Area & Porosity Analysis
The table above shows the resulting surface area of the pore formed on activated
carbon derived from charcoal at different preparation conditions. Based on the results, it
shows that 600°C is the maximum carbonization temperature for charcoal based
activated carbon and any higher activation temperature. Earlier results from FESEM
showed A2 as having a bigger pore size and larger quantity of Carbon element from the
elemental composition result.
Sample A1, B1, E1, and F1 are all carbonized at a 500°C which yields lower SBET
which is 241.5382, 76.9645, 1.4102, and 0.0827 respectively at a carbonization
temperature of 500°C. While the sample A2, E2, F2 and J2 are all samples that has been
carbonized at 600°C which also yields SBET of 415.5244, 364.8818, 323.7159, and
23
365.2791 respectively at different impregnation ratio. It can be concluded that the
samples that have a bigger sample size yields lower BET surface area and lower total
pore volume. Sample that has a smaller size which is 0.25mm yields higher BET surface
area and higher total pore volume. Among all the samples, A2 yields the higher BET
surface area and highest total pore volume.
By comparing the impregnation ratio of the samples, the sample that has a lower
impregnation ratio yields lower BET surface area and lower total pore volume while the
samples that has higher impregnation ratio has higher BET surface are and higher total
pore volume. Therefore, it is suggested that higher impregnation ratio should be used for
charcoal to produce activated carbon.
It is also has been proved that all the samples that has been analyzed are at most
contains class of mesoporous. The highest pore size obtained was 17.7 nm from sample
A2. Even though, the rest of the samples yields pores that has size more than 2nm which
is also considered as mesopore but the biggest among all the samples are A2.
It can be concluded; 0.25mm charcoal sample that has been carbonized at 600°C
with a higher impregnation ratio yields the best activated carbon product.

24
4.3 Nitrogen Adsorption-Desorption Isotherm
Figure 4.3.1: Nitrogen Adsorption-Desorption Isotherm
Figure above shows the nitrogen adsorption-desorption analysis for selected
samples. This study is done to identify the correct adsorption isotherm type based on the
IUPAC classifications. In order to satisfy the adsorption analysis, the adsorption isotherm
should at least fit one or a combination of the six distinct isotherm graphs (Fletcher,
2008). As shown in Figure 4.3.1, pure charcoal sample is identified to follow the
isotherm similar to TYPE III where the adsorption is limited to the completion of a single
monolayer of adsorbate at the adsorbent surface and it is obtained when the amount of
gas adsorbed increases without limit as its relative saturation approaches unity.
Figure above also shows the adsorption-desorption curve for sample A2 which
exhibits the characteristics of Type II isotherms which are observed for the adsorption of
gases on mesoporous soilds whose pore sizes are not much larger than the molecular
diameter of the adsorbate. Complete filling of these narrow pores corresponds to the

25
completion of a molecular monolayer. Adsorption in all other types does not reach a limit
corresponding to the completion of a monolayer. This result is evident with BET surface
area analysis proving that the pores are in mesoporous group with pore diameter, 17.7 nm.

26
4.4 Carbon Dioxide Adsorption Analysis
Figure 4.4.1: Weight Percentage of Carbon Dioxide Adsorbed
Figure 4.4.1 shows the amount of carbon dioxide adsorbed in weight percentage
with increasing pressure. The adsorption test is carried out using HPVA II analyser at
optimum temperature of 25°C. The amount of carbon dioxide adsorbed increases with
increasing pressure for both the conventional charcoal (pure sample) and activated carbon
(sample A2), proving that activated carbon derived from charcoal is proficient in
removing carbon dioxide gas with mesoporous pore formation. The amount of carbon
dioxide, CO2 adsorbed onto the pure sample is 2.2843 weight percentages at standard
temperature and pressure, while the amount of carbon dioxide, CO2 adsorbed onto the
sample A2 is 8.1084 weight percentages. The result clearly shows that amount of carbon
dioxide adsorbed in the activated carbon produced was much higher than the pure
sample. Thus, the activated carbon produced is eligible to adsorb carbon dioxide
particles.
Sample A2 Pure sample

27
Figure 4.4.2: Adsorption Capacity of Carbon Dioxide on Activated Carbon
Derived from Charcoal
The adsorption isotherm in Figure 4.4.2 evidently has the similar shape to the
isotherm of weight of carbon dioxide adsorbed. The adsorption isotherm shows
decreasing trend with inclined temperature. Thus, carbon dioxide adsorption is clearly
ideal at lower temperature because it is an exothermic process, whereby heat is released
(I.A.A.C.Esteves, et.al, 2008).
Type I are encountered when adsorption is limited to, at most, only a few
molecular layers. This condition is encountered in chemisorption where the asymptotic
approach to limiting quantity that all of the surface sites are occupied. In the case of
physical adsorption, type I isotherms are encountered with microporous powders whose
pore size does not exceed a few adsorbate molecular diameters. A gas molecule, when
inside pores of these small dimensions, encounters the overlapping potential from pore
walls which enhances the quantity of gas adsorbed at low relative pressures. At higher

28
pressures, the pores are filled by adsorbed or condensed adsorbate leading to the plateu,
indicating little or no additional adsorption after the micropores have been filled. Physical
adsorption that produces the Type I isotherm indicates that exposed surface resides
almost exclusively within the micropores, which once filled with adsorbate, leave little or
no external surface for additional adsorption [25]
.
The effect of temperature on the amount of carbon dioxide, CO2 adsorbed onto
the activated carbon, decreases with increasing temperatures. In other words, the result
clearly illustrates that CO2 adsorption was most significant at lower temperature with
bigger adsorption capacity proving that physical adsorption has taken place [26]
.
Therefore, it is reasonable that adsorption test for carbon dioxide on banana peel based
activated carbon is studied at low temperature of 25°C.

29
5.0 Conclusion & recommendation
5.1 Conclusion
As a conclusion, this undertaking is significant as it manages elective methods for
removing carbon dioxide discharges in air. Adsorption utilizing activated carbon is made
to be one of the viable approaches to manage the current issue by utilizing conventional
charcoal as a part of regular courses particularly in dispensing with carbon dioxide.
Consequently, the examination in this task demonstrates that the charcoal is a suitable
antecedent to be adjusted into enacted carbon because of its high carbon content.
Chemical activation strategy is favored in this study with the utilization of phosphorus
acid. In conjunction with that, different readiness parameters have been considered
completely to study the impacts on surface area and pore distribution of the activated
carbon from charcoal. Along these lines, referring to the results, it is demonstrated that
littler molecule size is ideal to be used as artificially initiated carbon as it uncovered
bigger surface range among impregnation and actuation. Moreover, the impregnation
proportion ought to be genuinely low to hinder great pore development. Besides, the
carbonization temperature for utilizing charcoal as an indication should not be higher
than 600°c as any higher will realize the breakdown of the permeable arrangement in the
enacted carbon and cause the degeneration of powerful surface range for the adsorption
process. Test A2 turned out to be the best example among others with its remarkable BET
surface region and additionally nitrogen adsorption-desorption isotherm demonstrating
meso-porosity. Finally, activated carbon developed from charcoal additionally
demonstrated to relinquish carbon dioxide through adsorption.

30
5.2 Recommendation
The research can be enhanced to the following level, that is, to study the
adsorption and also desorption methodology utilizing the charcoal based on activated
carbon as adsorbent. As far as adsorption, there are adequate of parameters that can be
viewed as, for example, the measure of the adsorbent present, the ph of the arrangement,
and the temperature and contact time of the adsorption process. The specimen with the
most astonishing SBET from this task (test A2) will be delivered in bulk amount to direct
this study. The study on the adsorption methodology is remarkable in deciding the most
favorable environment for the carbon dioxide gas to be adsorbed on the reactive areas of
the charcoal based on activated carbon which will exceptionally build the adsorption limit
of the adsorbent. The time desired to achieve the adsorption balance can be determined
through this study. Adsorption equilibrium is attained when the rate of adsorption is
equivalent to the rate of desorption, in this way making any further adsorption
exceedingly impossible. On the other hand, study on desorption process also will be
helpful in discovering conservational way of removing harmful gases such carbon
dioxide. This research would be significant in the effort to reduce air pollution as well as
eliminating greenhouse gases in a safe method.
Also, various sorts of biomass or agroindustry wastes can likewise be inspected
on the attainability as precursor to be changed over into activated carbon. Activated
carbon produced using various antecedents will have distinctive inclination or adsorption
limit, dependent upon its particular planning conditions. Extra data can be acquired
through comparative examination with different crude materials. Consequently, the
investigation of creating adsorbent developed from rural waste would be an incredible
investigation to manage as it gives a finer option monetarily and earth to protect
contamination free environment.

31
6.0 Reference
[1] “Geoengineering the climate: science, governance and uncertainty”. The Royal
Society. 2009. Retrieved 2011-09-10. Accessed from:
https://royalsociety.org/~/media/Royal_Society_Content/policy/publications/2009/86
93.pdf
[2] A.Mohammas-Khah and R.Ansari. (Oct-Dec 2009). Activated Charcoal: Preparation,
characterization and Applications: A review article, International Journal of
ChemTech Research, Vol. 1, No. 4, pp 859-864.
[3] J.Romanos et al. (2012). Nanospace engineering of KOH activated carbon.
Nanotechnology, Vol 23, No 1, Accessed 2014-6-21, Retrieved from:
http://iopscience.iop.org/0957-4484/23/1/015401/pdf/0957-4484_23_1_015401.pdf
[4] National Oceanic & Atmospheric Administration (NOAA) – Earth System Research
Laboratory (ESRL), Accessed 214-06-21. Retrieved from:
http://www.esrl.noaa.gov/gmd/
[5] Obersteiner, M., Azar, C., Kauppi, P., Möllersten, K., Moreira, J., Nilsson, S., Read,
P., Riahi, K., Schlamadinger, B., Yamagata, Y., Yan, J., and van Ypersele, J. P.:
(2001) “Managing climate risk”
[6] Properties of Activated Carbon. CPL Caron Link. Accessed 2014-6-21. Retrieved
from http://www.activated-carbon.com/
[7] Simple technologies for charcoal making, (2013). Food and Agriculture Organization
of the United Station, Forestry Department. Retrieved from:
http://www.fao.org/docrep/X5328e/x5328e02.htm#1.4.1. what is charcoal
[8] M Kato, D M DeMarini, A B Carvalho, M A V Rego, A V Andrade, A S V Bonfim,D
Loomis. World at work: Charcoal producing industries in northeastern Brazil.
Occupational Environmental Medicine 2005. Volume 62. Pp 128-132.

32
[9] M. Soleimani, T. Kaghazchi. Agricultural Waste Conversion to Activated Carbon by
Chemical Activation with Phosphoric Acid (24 APR 2007). Chemical Engineering
& Technology. Volume 30. Issue 39. Pp 649-654
[10] What is activated charcoal and why is it used in filters?. (2000, April).
HowStuffWorks.com. [Online]. Available:
http://science.howstuffworks.com/environmental/energy/question209.htm
[11] Dr. D. Uhríková, CSc. Adsorption. Accessed 2014-06-22. Retrieved from:
https://www.fpharm.uniba.sk/fileadmin/user_upload/english/Physical_Chemistry/5-
Adsorption.pdf
[12] Glossary. The Brownfields and Land Revitalization Technology Support Center.
Retrieved 2014-06-21. Accessed from:
http://www.brownfieldstsc.org/glossary.cfm?lett=A
[13] N.A.Rashidi, S.Yusup, and A.Borhan. (2014). Novel low-cost activated carbon from
coconut shell and its adsorptive characteristics for carbon dioxide. UTP Institutional
Repository. [Online]. 594-595, pp. 240-244. Retrieved from:
http://eprints.utp.edu.my/10637/1/KEM.594-595.240.pdf
[14] C.Cui-Xia, H.Biao, L.Tao, W.Geng-Feng, Preparation of phosphoric acid activated
carbon from sugarcane bagasse by mechanochemical processing. Bioresources.com.
Accessed 2014-06-22, Retrieved from :
http://ojs.cnr.ncsu.edu/index.php/BioRes/article/view/BioRes_07_4_5109_Chen_Ph
osphoric_Acid_Sugarcane_Bagasse_Mechanochemical/1751
[15] S.M. Yakout, G. Sharaf El-Deen (2012). Characterization of activated carbon
prepared by phosphoric acid activation of olive stones, Arabian Journal of
Chemistry.
[16] The Naked Whiz’s (2001). Accessed 2014-06-22. Retrieved from:
http://www.nakedwhiz.com/lumpfaq.htm

33
[17] Happi Emaga, T. ; Bindelle, J. ; Agneesens, R. ; Buldgen, A. ; Wathelet, B. ; Paquot,
M., 2011. Ripening influences banana and plantain peels composition and energy
content. Trop. Anim. Health Prod., 43 (1): 171-177
[18] Shulga (2007). Lignocellulosic mulch, polycomplex, soil. BioResources 2(4), pg
572-582.
[19] K. mojsov, M. Petreska. J.Ziberoski. Biosynthesis of Pectinolytic enzymes by
Aspergillus on apple pulp.
[20] Krishnan, K.A., “Adsorption of nitrilotriacetic acid onto activated carbon prepared
by steam pyrolysis of sawdust: Kinetic and isotherm studies”, Colloids and Surfaces
A: Physicochemical and Engineering Aspects, 317 (2008), 344-351.
[21] Wu, F.C., Tseng, R.L., Juang, R.S., “Comparisons of porous and adsorption
properties of carbons activated by steam and KOH”, Journal of Colloid and Interface
Science 283 (2005) 49–56.
[22] A.Borhan, A.F. Kamil. Preparation and Characterization of Activated Carbon from
Rubber-seed shell by Chemical Activation (2012). Journal of Applied Sciences 12.
[23] A.C Lua. T.Yang. Characteristics of activated carbon prepared from pistachio-nut
shell by zinc chloride activation under nitrogen and vacuum conditions (2005).
[24] M. K. Lam, Z. Riduan. Production of activated carbon from sawdust using fluidized
bed reactor. International Conference on Environment (ICENV 2008).
[25] GAPP Applications(2014). Accessed 2014-22-12, Retrieved from http://www.app-
one.com.cn/eng/newsInfo.aspx?parentid=940&catid=944&newsid=11956
[26] Heidari.A., Younesi.H., Rashidi.A., Ghoreyshi.A., 2013, “Adsorptive removal of
CO2 on highly microporous activated carbons prepared from Eucalyptus
camaldulensis wood: Effect of chemical activation”, Journal of the Taiwan Institute
of Chemical Engineers, 45: 579 – 588.

34
7.0 Appendices
Figure 7.0.1 : Adsorption-desorption isotherm of N2
Figure 7.0.2 : Pore size distribution of activated carbon

35
Figure 7.0.3: Scanning Electron Microscope(SEM) studies
The surface morphologies of activated carbon produced was determined using SEM.
Figure 3(a) and (b) shows the SEM photograph of AC0.5-500-2 at 400x and 1000x
magnifications, respectively. Figure 4(a) and (b) shows the SEM photograph of AC1.0-
500-2 at 500x and 1000x magnifications, respectively. It is expected to obtain a result
similar like this image for this project as well [24]
.

36
Figure 7.0.4: Types of isotherms
BET Theory put forward by Brunauer, Emmett and Teller explained that multilayer
formation is the true picture of physical Adsorption. One of the basic assumptions of
Langmuir Adsorption Isotherm was that adsorption is monolayer in nature. Langmuir
adsorption equation is applicable under the conditions of low pressure.