Embed Size (px)
Citation preview

Mars
Final Technical
Pathfinder
for
Wheel
Ground
Report
Abrasion ExperimentTest
NASA Grant Number
NCC3-565 .-
Grant Duration
May 1, 1997 to June 30, 1998
Theo G. Keith, Jr.Principal Investigator
Mark W. SiebertGraduate Assistant
Department of Mechanical, Industrial and Manufacturing Engineering
University of ToledoToledo, Ohio 43606
December 1998
https://ntrs.nasa.gov/search.jsp?R=19990013984 2018-07-09T21:41:36+00:00Z

The NASA Mars Pathfinder Mission
Mark Siebert (Member, STLE)
Theo Keith (Member, STLE)
University of Toledo
Sidebar
The Mars Surveyor '98 is the next generation of spacecraft that will be sent to
Mars. Consisting of an orbiter (to be launched this December) and a lander (to be
launched in January 1999), the mission has a science theme of "Volatiles and Climate
History." The Mars 98 orbiter will provide detailed information about the surface and
climate of Mars. The Mars 98 lander will land near the southern polar cap on Mars. The
lander is equipped with a stereo camera, a robotic arm and instruments to measure the
martian soil composition. Two small microprobes are also piggybacking on the lander,
which will separate from the lander during entry into the martian atmosphere and punch
into the soil to determine if water ice is present. The microprobes will also measure soil
temperature and monitor local martian weather.
Abstract
The National Aeronautics and Space Administration (NASA) sent a mission to the
martian surface, called Mars Path.finder. The mission payload consisted of a lander and a
rover. The primary purpose of the mission was demonstrating a novel entry, descent, and
landing method that included a heat shield, a parachute, rockets, and a cocoon of giant air
bags. Once on the surface, the spacecraft returned temperature measurements near the
Martian surface, atmosphere pressure, wind speed measurements, and images from the
lander and rover. The rover obtained 16 elemental measurements of rocks and soils,
performed soil-mechanics, atmospheric sedimentation measurements, and soil
abrasiveness measurements.
Introduction
On July 4, 1997 America returned t9 the red planet after more than 20 years with
the landing of Mars Pathfinder. Before losing contact with the spacecra_ on September
27, 1997, the spacecraft returned pictures of martian sunrises, a rocky terrain, and the
Sojourner rover crawling from rock to rock.
Mars Pathfinder was the second launch of the Discovery program (the first was
Mars Global Surveyor (MGS) on November 7, 1996) of low cost planetary missions. One
of the mission objectives was to demonstrate a simple, low-cost system for placing a
science payload on the surface of Mars at one-tenth the Viking mission cost. The

Pathfinderspacecraftusedaninnovativemethodof directlyenteringthemartianatmosphere.It wasslowedbya heatshield,parachute,andthen rockets.Thespacecraftdescendedto thesurfaceof Marsandlandedusingacocoonof airbagsto cushiontheimpact.
Overthecourseof thespacecraft'slifetime, theMarsPathfinderreturnedabout2.3gigabitsof data,whichincluded16,500imagesfrom thelandercameraand550imagesfrom therovercamera,andabout8.5million temperature,pressure,andwindmeasurements.All the science objectives had been fulfilled when the mission was
declared over on November 4, 1997. One remaining objective was to complete a high
resolution 360°-image of the landing site called the "Super Pan," of which 83 percent wasreceived.
Sojourner explored about 250 square meters of the martian surface traveling about
100 meters in a total of 230 commanded maneuvers, performed 16 in-situ elemental
analyses of rocks and soil with the alpha proton x-ray spectrometer, and carried out many
soil mechanics and technology experiments. The rover returned data and images for 83
martian days, much longer than the projected thirty day lifetime for the lander and seven
day minimum for the rover. A martian day is about 24.6 Earth hours.
The most important achievement of Pathfinder may not have been the data
returned, but the new philosophy that the spacecraft was designed under. Pathfinder was
National Aeronautics and Space Administration's (NASA's) first big test of its "better,
faster, cheaper" mandate. NASA engineers had to come up with a new way to deliver a
spacecraft to the martian surface much cheaper than and more quickly than the Viking
program. Compared to the $1 billion price of one Viking mission (about $3 billion in
current dollars), the cost of Mars Pathfinder was $280 million including launch vehicle
and mission operations. One way that costs were cut was by using solar cells for lander
and rover power instead of the more expensive---and politically less appealing---
Radioisotope Thermoelectric Generators (RTGs) of the Viking missions.
Launch and Injection
The Path_6nder was mated to the Delta II launch vehicle during its assembly as
shown in Figure 1. The Pathfinder spacecraft was launched on December 4, 1996 on a
Delta II rocket from Kennedy Space Center. Once in Earth orbit, a solid-fuel rocket gave
the spacecraft the f'mal boost giving it the correct change in velocity to put the spacecraft
in orbit around the sun. After the solid-fuel rocket was spent, it was jettisoned. The Deep
Space Network (DSN) irtitiated spacecraft acquisition with the spacecraft using a 34
meter dish at Goldstone, California. As soon as acquisition had occurred, the spacecraft
broadcast telemetry at 40 bits per second. This telemetry is a combination of real-time
engineering data and stored data from launch, separation, and Earth/Sun acquisition.
During the seven month cruise, the DSN also located the spacecraft and received
telemetry so the four trajectory correction maneuvers (TCMs) could be made. TCMs are
velocity changes to reduce navigation guidance errors. The fifth TCM was unnecessary
since the spacecraft was on target to touchdown in the selected landing site.
Entry, Descent, and Landing

The spacecraft entered the atmosphere directly (without orbiting Mars like the
Viking I and II landers) [1 ]. The cruise stage of the spacecraft, consisting of the solar cells
and the hydrazine thrusters, separated 35 minutes before the spacecraft landed. Figure 2
illustrates the sequence of events in the entry, descent, and landing sequence. Pathfinder
used a Viking-derived heat shield to decelerate the spacecraft from 7470 m/s to 370 m/s,
using fi'iction with the martian atmosphere, and then released a parachute. Twenty
seconds after the parachute deployed, the heat shield separated. Using radar to sense the
height of the spacecraft, the airbags surrounding the lander were commanded to inflate at
355 m above the surface. At 98 m above the surthce the rockets ignited slowing the
spacecraft to about zero vertical speed. At about 21.5 m above the surface, the tether
connecting the probe to the retro-rockets was cut, letting the airbag-encased lander fall to
the surface and bounce 16 times before rolling to a stop. The airbags were deflated 20
minutes after landing, then retracted, and finally the petals were opened. This entry,
descent and landing (EDL) sequence marked the first time airbags were used for landing.
The novel landing system had some advantages over the conventional method of a
soft rocket-assisted touchdown. The airbag landing method reduced the rocket exhaust
contamination of the surface near the lander, since the spacecraft rolled to a stop far from
the separation between it and the rockets. That surface would later be analyzed by the
alpha proton X-ray spectrometer. Another advantage of the airbag landing method is that
the spacecraft would not likely get wedged between rocks, preventing the petals of the
lander from opening, since the diameter of the inflated airbags is larger than the lander
with the petals opened.
After the airbags were deflated, the lander came to rest on its base. The lander
could have touched down on any of the four faces of the tetrahedral-shaped lander which
would have required that the lander be righted by means of the petal movement. Figure 3
is a schematic of the lander and the rover and the location of some scientific instruments.
Because the lander did not have to right itself, a radio signal from the tow-gain antenna
was received only 97 minutes after landing on sol 1, the first martian "day" on Mars.
Commands were sent from Earth to unlatch the Imager for Mars Patl-fmder (IMP)
and the high-gain antenna on the lander. Stereo images from the camera were used to
determine if it was safe to deploy the rover ramps. On sol 2, the small, 10.5 kilogram
rover was deployed from the lander. The atmospheric structure investigation/meteorology
(ASI/MET) mast was also deployed, which consists of a suite of sensors to measure wind
speed and direction, and temperature of the atmosphere at three points above the surface.
Surface OperationsSome of the lander cameras images were used to plan the destinations for the
rover. Controllers on Earth sent "waypoint.s", or destinations for the semiautonomous
rover to go to, and then the rover found the best way to reach these waypoints itself. The
rover used two binocular cameras and a laser ranging device to search the terrain for
obstacles. The rover onboard computer processed this navigation data as well as
performed other computing and control functions. The round trip signal delav from E_:_hto Mars was at least 10 minutes---too long for rover controllers to inch the rover tbrward
and search for the terrain hazards themselves. The semi-autonomous capability of the
rover allowed the rover to maneuver without being constantly under driver command.

Semi-autonomouscapabilityis importantfor futurelong-rangemissions,includingtheMarssamplecollection.
The rover could not communicate directly with Earth but instead communicated
with Earth by means of a UHF radio link with the lander. High and low gain antennas on
the lander, in turn, sent data back to Earth and received commands for the lander and
rover to perform.
Imaging
Pictures from the IMP revealed a rocky plain about 16 percent covered by rocks.
Many characteristics of the landing site are consistent with being deposited by a
catastrophic flood. Remote-sensing from Viking orbiters showed similarity to the
Channeled Scabland in eastern and central Washington state. The rocks and pebbles at the
landing site appears to have been swept down and deposited by floods in the Ares and Tiu
regions near the Pathfinder landing site [1]. The number of impact craters in the tenon
indicates it formed at an intermediate time in Mars history: between 1.8 and 3.5 billion
years ago.Rocks from a few centimeters in size to 7 meters are seen in all directions from
the lander. Angular rocks are tilted in a downstream direction from the flood. Large rocks
are flat-topped which is consistent with deposition by a flood [2]. Also the undulations of
the terrain indicate the direction of flood waters. Figure 4 shows the rover on a rock tilted
in the direction that the flood waters are thought to have flowed.
Overall three types of rocks and four classes of soil were found at the landing site.
Most rocks are dark gray and are covered with yellow-brown dust. This dust appears to be
the same as in the atmosphere. Dust that settled from the atmosphere is also deposited
behind rocks in tails by the wind. Dirt covering the lower 5 centimeters of some rocks
suggests they have been exhumed by the wind. Some rocks appear to have been fluted by
wind-driven sand-sized particles.
Rover images showed sockets and pebbles in some rocks, suggesting that these
rocks are conglomerates. Conglomerates are usually formed in running water, which
rounds the pebbles in the conglomerate. Running water is also necessary to deposit these
pebbles in a sand or clay matrix. This evidence suggests a warmer and wetter planet in the
past in which liquid water flowed on the surface and a thicker atmosphere maintained a
higher surface temperature.
Atmospheric Conditions
The ASI/MET sensors measured air pressure, temperature, and wind speed. The
winds were light and variable compared to.the those encountered by the Viking landers.
The winds blew steadily from the south during the martian nights, but during the day they
rotated in a clockwise direction from south to west to north to east. Whirlwinds or dust
devils were detected repeatedly from mid-morning through the late afternoons.
Whirlwinds showed a marked temperature and pressure change as they passed over the
lander. At least one may have contained dust suggesting that these gusts are a mechanism
for mixing dust in the atmosphere.

Dustsuspendedin theatmospherewasconfirmedasthedominantabsorberofsunlight.Figure5 showsthescatteringof sunlightbysuspendeddust.Theatmosphericopacityisabout0.5.Opacityis ameasureof how muchlight is blockedbytheatmosphere.Theslightlyhigheropacityatnightandearlyin themorningmaybeduetofrozenwatervaporcloudsasshownin Fig. 6.Theskyhasapalepink color,similartowhatwasseenby theViking landers.Suspendeddustof about1micrometerinsizeandtheamountof watervaporin theatmosphereareconsistentwith measurementsmadebyViking. The amount of water vapor in the atmosphere would only result in a layer 0.01mm thick if all of it rained out.
Pathfinder measured regular pressure fluctuations twice a day, suggesting that
some dust was being mixed in the lower atmosphere. Atmospheric pressure underwent a
daily substantial variation of 0.2 to 0.3 mbar, which was primarily associated with the
large temperature changes in thin martian atmosphere. The mean martian atmospheric
pressure is about 6.7 mbar.
Atmospheric temperature was measured by four thermocouples: one designed to
measure temperature during parachute descent and three designed to measure surface
temperatures at 25, 50, and 100 cm above the base of the mast [3]. Pathfinder arrived in
the late northern martian summer. The martian surface temperatures followed a regular
daily cycle, with a maximum of-9 ° C in the day and a minimum of-76 ° C at night.
Temperatures can plunge 22 C degrees in a matter of minutes. Since the atmosphere is so
thin, the atmosphere warms near the surface and convects upward during certain times of
the day.
Alpha Proton X-ray SpectrometerThe APXS is an instrument on the rover which is able to determine the elemental
composition of rocks and surface material. The APXS uses a radioactive source which
produces alpha-particle radiation and then looks at the backscattered energy spectrum.
Before the Pathfinder mission the knowledge of the kinds of rocks present on
Mars was based on Viking results, and on the martian meteorites found on Earth, which
are all mafic igneous rocks rich in magnesium and iron and low in silica. Chemical
analyses of 8 rocks, along with the spectral images of rock colors (performed by rotating
filters in front of the lander imager cameras), confirmed that these rocks had different
compositions from the martian meteorites found on Earth [4].
The rocks that were analyzed by the rover's APXS, as shown in Fig. 7, were of
andesitic (high in silicon) origin. The high silica or quartz content of some rocks suggest
that they were formed as the crust of Mars was being recycled, or cooled and heated up,
by the underlying mantle. Analyses of rock.s with lower silica content appear to be rich in
sulfur, implying that they are covered with dust or weathered. Rover images show that
some rocks appear to have small air sacks or cavities, which would indicate that they may
be volcanic. The soil chemistry of Ares Vallis appears to be similar that of the Viking I
and II landing sites, which suggests global dust mixing. Soils, however, cannot have
formed from the analyzed rocks at the landing site because their compositions are
different. Soils are lower in silicon than the rocks and higher in iron, sulfur, and
magnesium.
Magnetic Properties of Airborne Dust
Magnetic dust in the martian atmosphere gradually covered most of the magnetic
targets on the lander. The magnetic targets have different magnetic field strengths to
attract different magnetic minerals in the dust. The dust covering the magnetic targets is
bright red with a magnetic strength similar to composite particles, meaning that they axe
composed of several materials. A small amount of the mineral maghemite in the dust has
been deposited as a stain or cement. This method of deposition is interpreted to mean that
that the iron was dissolved out of crustal materials in water, suggesting a once active
hydrologic cycle of Mars, and the maghemite may be a freeze-dried precipitate [5].
Doppler and Ranging ExperimentsThe radio communications with Pathfinder were used to measure the distance of
Pathfinder to the Earth, and to determine the rotation rate of Mars. Daily radio Doppler
tracking and less frequent two-way radio ranging during communications sessions with
the spacecraft determined the position of the lander in inertial space and the direction of
Mars' rotational axis. These results combined with the Viking results 20 years ago
improve the measurement of the precession rate by a factor of three. Precession is the
direction of the tilt of the axis of the planet. The difference between the two positional
measurements yields the precession rate. This rate is a function of the distribution of mass
within the planet, called the moment of inertia. From Pathfinder's data Mars must have a
dense core surrounded by a lighter mantle and the radius of Mars' metallic core must be
between 1300 kilometers and 2400 kilometers [6].
In addition to the precession rate, Pathfinder detected a seasonal change in the
rotation rate of Mars about its spin axis which is thought to have varied because of mass
exchange between the polar caps and the atmosphere. During the winter, part of the
atmosphere condenses at the poles. The waxing and waning of the martian polar ice caps
also results in seasonal changes of air pressure at the Pathf'mder and Viking landing sites.
At the Pathfinder landing site the yearly pressure cycle reached a minimum at sol 20,
meaning that the southern polar cap reached its maximum mass.
Pathfinder and Future Missions
The Path_finder mission demonstrated a low-cost system for placing science and
technology payloads on the martian surface. The lessons learned and the science returned
from Pathfinder will be applied to future missions. For example, the atmospheric pressure
data will be used to design future reentry heat shields and the elemental composition of
rocks and dust at the Pathfinder site will provide calibration data for the Mars Global
Surveyor thermal emission spectrometer.NASA Lewis Research Center designed and built technology experiments on the
rover. One evaluated the abrasiveness of martian dust [7], and another measured the
sedimentation rate of atmospheric dust [8]. Lewis' Plum Brook Station also tested the
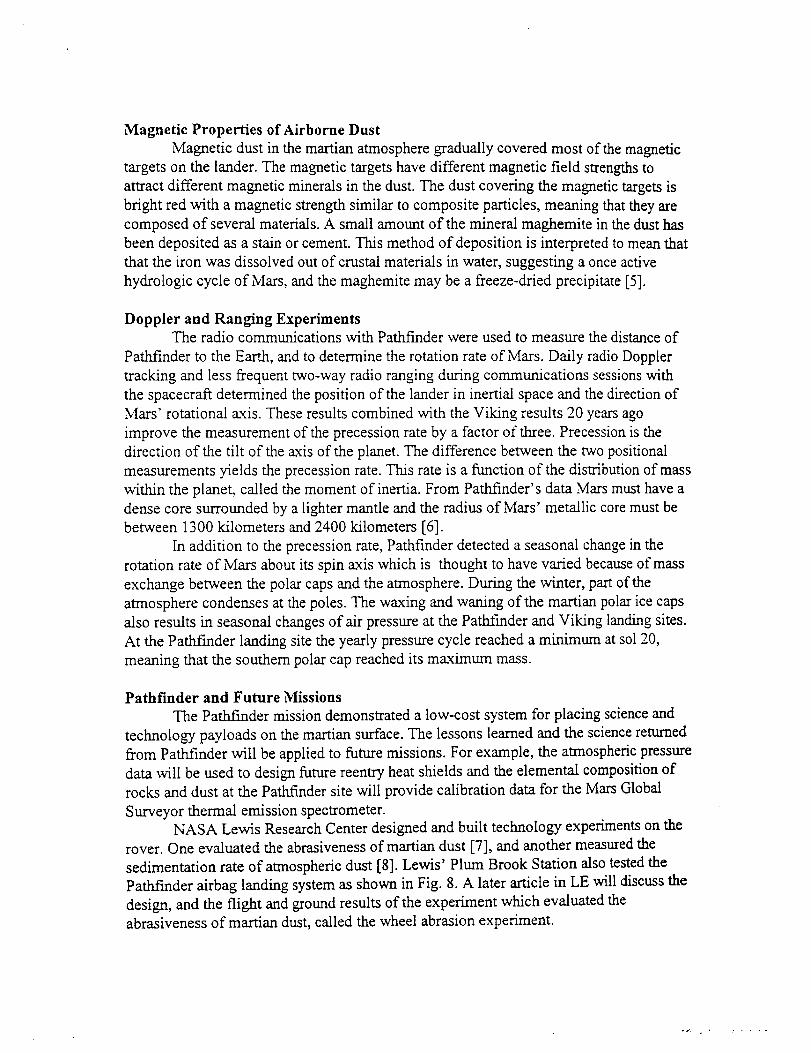
Pathfinder airbag landing system as shown in Fig. 8. A later article in LE will discuss the
design, and the flight and ground results of the experiment which evaluated the
abrasiveness of martian dust, called the wheel abrasion experiment.

Pathfinderwasthefirst of nineMarsmissionsto be launchedin the1996-2005time flamewhich comprisethelong-termMarsexplorationinitiative. Themissionswilltypically consistof orbiterandlanderpairslaunchedatevery26monthlaunchopportunity.Thenextorbiter-landerpair is scheduledto launchin December1998andJanuary1999,calledMarsSurveyor98which is describedin the italicizedsidebar.TheMars Surveyor2001LanderandRovermissionwill featureabackupof Sojournerrover.Therearealsoteststo producerocketpropellant,measureradiation,andalsoevaluatedustaccumulationandremovaltechnology.TheMarsSurveyor2001orbiterwillcharacterizethemineralogyandchemistryof thesurface.TheMarsSurveyor2003LanderandRoverwill gathersamplesfor possiblelaterreturn.TheMarsSurveyor2003Orbiter will provide communications for later missions. The Sample Return Mission will
feature a landing on Mars, and the collection of samples from previous missions, and a
return to Earth by 2008.
• ,... ....

Captions of Figures
Fig. 1---Pathfinder mated to Delta II launch vehicle. The Pathfinder lander and rover are
enclosed by the heat shield and backshell, called the aeroshell, at the top of the structure.
The graphite-epoxy aeroshell provides thermal protection and can withstand the forces
from a 16-g deceleration during atmospheric entry. The cruise stage is the white ring
beneath the backsheU and includes the hydrazine tanks covered in gold foil. Solar cells on
the cruise stage provide the spacecraft power during cruise.
Fig. 2---A series of entry, descent, and landing events was executed, resulting in a
successful landing on the martian surface.
Fig. 3---Mars Pathfinder lander. The three petals are covered with solar cells to power the
lander. The flat surface on top of the rover is covered with solar cells to power the rover.
Both the lander and rover have batteries to operate during low light.
Fig. 4---The rover wheel with the shiny surface forward is on top of the rock Wedge on
sol 47. Wedge is tilted in the direction flood waters are thought to have flowed.
Fig. 5---Lander image of sunset showing fan-shaped scattering of light from suspended
dust.
Fig. 6---True color image of the eastern sky on sol 39. The bright streaks are probably
water ice clouds, which have formed during the night.
Fig. 7---Image of Sojouner rover conducting elemental analysis of the rock Yogi with
alpha proton x-ray spectrometer (APXS).
Fig. 8---Testing of airbags at NASA's Lewis Plum Brook Station. The airbags were
dropped in this facility in order to simulate martian atmospheric pressure (0.7 percent of
Earth's).

References
1. Golombek,M. P.,etal.,"Overviewof theMars Path£mderMissionandAssessmentofLandingSitePredictions,"Science, 278, 5 December, pp. 1743-1748, (1997).
2. Smith, P. H., et al., "Results from the Mars Pathfinder Camera," Science, 278, pp.
1758-1765, (1997).
3. Schofield, J. T., et al., "The Mars Pathfinder Atmospheric Structure
Investigation/Meterology (ASUMET) Experiment," Science, 278, pp. 1752-1758, (1997).
4. R_ierder, R., et al., "The Chemical Composition of Martian Soil and Rocks Returned
by the Mobile Alpha Proton X-ray Spectrometer: Preliminary Results from the X-ray
Mode," Science, 278, pp. 1771-1774, (1997).
5. Hviid, S. F. et al., "Magnetic Properties Experiments on the Mars Pathfinder Lander:
Preliminary Results," Science, 278, pp. 1768-1770, (1997).
6. Folkner, W. M., et al., "Interior Structure and Seasonal Mass Redistribution of Mars
from Radio Tracking of Mars Patht-mder," Science, 278, pp. 1749-1752, (1997).
7. Hepp, A. F., Fatemi, N. S., Wilt, D. M., Ferguson, D. C., Hoffman, R., Hill, M. M.,
Kaloyeros, A. E., "Wheel Abrasion Experiment Metals Selection for Mars Pathfinder
Mission", NASA TM 107378, (1996).
8. Landis, G. A., et al., "Development of a Mars Dust Characterization Instrument,"
Planetary andSpace Science, Vol. 44, No. 11, pp. 1425-1433 (1996).
figurelsummary.bmp (401x600x16M bmp)

Fig. 1---Pathfinder mated to Delta II launch vehicle. The Pathfinder lander and rover are
enclosed by the heat shield -and backshell, called the aeroshell, at the top of the structure.
The graphite-epoxy aeroshell provides thermal protection and can withstand the forces
from a 16-g deceleration during atmospheric entry. The cruise stage is the white ring
beneath the backshell and includes the hyd'razine tanks covered in gold foil. Solar cells on
the cruise stage provide the spacecraft power during cruise.

f igor e 2 SuE_ai-y. h-rip.(5-76X45 8xl-6M-- bmp) ...........................
_t' CRUISE STAGE SEPARATIONL_dng - 3S _n
(1:30 IOn,7470 m/s) Landng - 5 rrm
PARACPLrTE DEPLOYMENT(9.4 _, 370 _s) Landing - 134 s
..._ HEAT SHIELD SEPARATION
Landing - 114 s
t LANDER SIBOARATION_RIDt_ DEPLOYMENT
Landng -94 s
RADAR GROUND AC_ON
(1.6 kin, 68 m._) L_mding - 28.7 sA_AG INFLATION
i_ (355m)l.andtng- 10.1 s/ ROCKET IGNITION
_-._- _ _ (gam,61_ ml,)L=-dng-6.1s,,..._,_ . BRIDLE CUT
_. _ _ (21.5 m) Lancing- 3.8 S
f-_ _ L_g +2Om_ ___,r._ e_
ROLL STOP 7"
Landing + 2 rainPETALS OPENED
Lar_fmg+ 87 rain

|4) CRUISE STAGE SEPARATIONLanding - 35 rain
ENTRY
(130 kin, 7470 m/s) Land_g - 5 rain
PARACHUTE DEPLOYMENT(9.4 kin, 370 m/s) Londrcj - 134 s
HEAT SHIELD SEPARATIONLanding - 114 s
LANDER SEPARATION_RIDLE DEPLOYMENTLand_g - 94 s
_1' ,,,,. RADAR GROUND ACQUISITION(1.6 kin, 68 m/s) Landing - 28.7 s
AIRBAG INFLATION
i_ (355 m) Landing - 10.1
/ V ROCKET IONIT1ON
- _ _ (98_, 61.2.vs)La_ing-6._
_ w (21.5 m) Landing - 3 8 s
. . 2 ..... _ 6 Landing + 20 rain Lan%+ 74 rnin
ROLL STOP 7"
Landing + 2 rain PETALS OPENEDLanding + 87 rain
Fig. 2---A series of entry, descent, and Ianding events was executed, resulting in a
successful landing on the martian surface.
V_nd sensor
Thermocoul_eS
Wndsocks_-_,,-_"-j O.Iv/
Imager for Mars Pathfinder _._/0MP) J L_'-gaJrt a,'_er_a
IMP fiat-field targets Magnetic targets
magnetic_ . AS//MET accelerometersNear-field
tarclets . : / _......p._ ASblv1ETpressure tube
High-gain./_,,,,,.,,._ __ _.___------._ _ _
antenna_ovar
IMP Photometric Instrument proton
Target electronics X-ray APXS deploymentassemblies spectrometer mechanism

figureSsun_ary.bmp (254x285x16M bmp)

Fig. 3---Mars Pathfinder lander. The three petals are covered with solar cells to power the
lander. The flat surface on top of the rover is covered with solar cells to power the rover.
Both the lander and rover have batteries to operate during low light.
Fig. 4---The rover wheel with the shiny surface forward is on top of the rock Wedge on
sol 47. Wedge is tilted in the direction flood waters are thought to have flowed.
Fig. 5---Lander image of sunset showing fan-shaped scattering of light from suspendeddust.

Fig. 6---True color image of the eastern sky on sol 39. The bright streaks are probably
water ice clouds, which have formed during the night.
Fig. 7---Lrnage of Sojouner rover conducting elemental analysis of the rock Yogi with
alpha proton x-ray spectrometer (APXS).

figure6s_.bmp (256x28-5xl6M bmp)
• _. "i_ +_-I+._, _++-...... ,-- . +

figure7sur_aary.bmp (446x314x16M bmp)

Fig. 8---Testing of airbags at NASA's Lewis Plum Brook Station. The airbags were
dropped in this facility in order to simulate martian atmospheric pressure (0.7 percent of
Earth's).

Mars Pathfinder Wheel Abrasion Experiment---Ground and Flight Results
Mark Siebert (Member, STLE)
Theo Keith (Member, STLE)
University of Toledo
Dale C. FergusonDavid M. Wilt
Joseph C. Kolecki
Aloysius F. Hepp
NASA Lewis Research Center
ABSTRACT
Mars Pathfinder conducted scientific and technology experiments with a rover and
a lander. One of the technology experiments carried by the rover was a tribologJcal
experiment, called the wheel abrasion experiment, designed to evaluate the abrasiveness
of martian surface material. The experiment was carried on one of the wheels of the
rover, Sojourner. Wear was detected by a photodetector through the reduction of
reflectance of three types of metal fills (A1, Pt, and Ni) on a black anodized substrate
attached to the wheel. The Pathfinder mission showed that significant wear occurred on
the metal wheel strips, with the most wear on the thinnest aluminum samples, and the
least on the thickest nickel and platinum samples. The depth of dig during a wheel
abrasion experiment showed that the dust is, in some places, very loose, and in other
places tightly packed. Laboratory tests showed that the surface simulants used for wear
testing in the ground tests adhered to the wheel and electrostatic charging of the wheeloccurred.
INTRODUCTION
The properties of martian dust are of interest to spacecraft designers. The low
pressure but high speed martian winds cart transport large amounts of dust during global
dust storms [1] which are visible, for example, with the Hubble Space Telescope. The
Viking missions and the Pathfinder mission also showed that the pinkish tint of the
martian atmosphere is a result of suspended dust. Further evidence of dust transport on
Mars is that the surface material from Viking Lander I and 2 sites, although 1000 km
apart, is virtually identical in elemental composition [2]. At the Path.finder landing site,
the measured compositions of the rocks _kas different from the dust, suggesting that the
dust was not formed from the analyzed rocks but rather was transported there.
One experiment on the Mars Pattff'mder determined how much dust is deposited
on solar arrays from atmospheric sedimentation [3]. The purpose of the Wheel Abrasion
Experiment (WAE), however, was to learn about different aspects of the dust. For
example, is the dust fine enough to infiltrate mechanisms? Is the dust so abrasive that
mechanisms could be at risk? Can the moving rover build up an electrostatic charge?
Can electrostatic charging of a moving rover play a role in attracting dust to surfaces? In

orderto helpanswerthesequestionaboutthemartiandust,theWAE wasincluded on the
Mars Pathfinder Sojourner rover [4].
The Mars Pathfinder, the first mission to land on Mars since Viking 21 years ago,
was part of the National Aeronautics and Space Administration (NASA) Discovery
Program. The Discovery Program is a series of planetary exploration missions to perform
science investigations in shorter time and lower cost than previous missions. The overall
goals of the Pathfinder mission were to demonstrate a simple, low-cost system for placing
science payloads on the surface of Mars at an order of magnitude lower cost than Viking
and to demonstrate NASA's commitment to low-cost planetary exploration by
completing the mission at a total cost of $280 million, including launch vehicles and
operations, and to demonstrate the usefulness of a microrover on the surface of Mars.
DESIGN PHILOSOPHY
A wheel wear experiment was first proposed as a possible Mars Pathfinder rover
technology experiment in late 1992. The ground rules established early in the Pathfinder
program were that the rover technology experiments should be small and tight-weight,
consume little spacecraft power, require as little telemetry as possible, and not be
necessary for the operation of the rover itself., so that failures of the technology
experiments would not lead to loss of the science mission. More specific requirements
include being able to withstand a 60 g landing load, to withstand the launch vibrational
environment, and to operate to -50 °C. In early 1993, the WAE was deemed satisfactory
from the standpoints of telemetry requirements, vehicle unobtrusiveness, and the go-
ahead was received for fia_rther development [5].
The initial concept of the wheel wear experiment was to measure how abrasive
the martian dust is by measuring wheel wear as the Sojourner wheel traverses the landing
site. Initial rough calculations based on analogies with Earth-bound tire wear showed that
in a few hundred meters of travel, hundreds of Angstroms of material wear should occur.
This small amount of wear, of course, would have no measurable effect on the operations
or appearance of the wheel themselves. An experiment would be necessary to allow
measurements to be made. Special wear strips would be necessary as well as a sensor to
detect wear.
Thin strips of fluorescent paint were initially thought to be the best material of
which to measure wear. A photodetector would be used measure the loss of thin films of
the fluorescing paint. Since solar UV impinges practically unimpeded onto the martian
surface, the fluorescent glow would stand out against the background. Fluorescent paints,
however, were ruled out early in th_ program for several reasons----even good
fluorescence would not add significantly to the reflected sunlight and depositing very
thin, but well calibrated thicknesses of paint would be difficult, and the wear rates of the
paints may not be similar to the wear rates of metals, which would be primarily used in
technology applications on the martian surface. It was therefore decided that very thin
(=<1000 /k) layers of pure metals would be deposited on a hard black substrate. The
changes in the reflected martian sunlight would be used to detect wear on the metal strips
by a photocell. Since the reflectivity of pure metals is much higher than the black

substrate,thewearof themetalcanbedetectedby a decreasein reflectedlight.Therightmiddlewheelof Sojourner'ssixwheelswaschosenfor theWAE.
Typically wearis measuredin the laboratoryby conductingsurfaceprofilometryof thetestspecimenbeforeandaftertheweartest,or by photographingthewearscarandthencalculatingwear,orbymeasuringweight loss.Sincethesemethodswerenotfeasibleon Mars becauseof the high mass of equipment required, another way had to be used.
The sensor, to detect changes in reflectance, is photovoltaic. A photovoltaic detector is
very linear over a wide range in brightness, is passive, provides an analog output
compatible with the Sojourner A/D converters, is easy to calibrate, and is highly reliable.
Also, the wispy clouds on Mars were unlikely to change the light input significantly.
After considering various telescopic collimators and honeycomb collimators, we
chose a three cell detector mounted on the WAE wheel strut, with each cell masked by
geometrical optics so that all three solar cells view only one metallic wear coupon at the
same time. The rover orientation and time of day were selected so that sunlight would be
approximately specularly reflected from the observed wheel strip into the detector, where
the electrical signal would be generated and read out by A/D converters on the rover.
FLIGHT HARDWARE
The flight hardware of the wheel abrasion experiment consisted of the
photodetector and the wear strips. The design of each of these components is discussed in
the following paragraphs.
A series of seven metals was examined for suitability for the metal coatings on the
wear strips [4]. The seven candidate metals were Ag, A1, Au, Cu, Ni, Pt, and W which
were chosen to represent a cross section of properties (melting point, hardness) and
applications (electronic and structural).. These metals were deposited by e-beam or
resistive evaporation on black anodized coupons for reflectance measurements. Metal
film thickness varied from 0.1 to 1.0 micrometer. Reflectance measurements were made
on a spectrophotometer with an integrating sphere to capture all reflected light.
Reflectance of the strips was measured from 400-1000 nm.
After reflectance measurements were made, an adhesion test of the metal films
was conducted. This was done to assure sticking of the metal film to the substrate and to
preclude apparent wear of the metal films by delamination. A strip of commercial
adhesive tape was attached to coupons of each of the candidate metals and removed. The
results of each test were graded by visual inspection. Peeling of under 10 percent was
considered excellent; peeling of 10 to 25 percent was considered good; peeling of 25 to
50 percent was considered fair, and any peeling greater than 50 percent was considered
unacceptable. Based on this criteria, the adhesion of the seven metal films ranged from
poor to excellent.
A gallium arsenide on germanium (GaAs/Ge) photodetector was chosen for the
WAE. Based on the optical response of the detector (band edge at 860 nm), an average
reflectance was determined for each metal in the range of 400-800 nm from the measured
range of 400-1000 nm. Four of the seven metals were eliminated because of poor
adhesion to substrate, tarnishing, low reflectance, or light absorption. The three metals

choseneachhadarelativelyflat reflectancevaluethroughoutthevisibleandnear-infraredspectrum,400-800nm. Aluminumwaschosenfor its high reflectivity, 0.71in the400-800 nm rangeandits softness,andnickel and platinumbecauseof goodreflectivityandadhesion.Thehardnessesof themetalschosenrangedfrom soft to hardto yielddifferentwearrates.On the Brinell hardness scale, aluminum is about 16, platinum about 64, and
nickel about 100 [6].
The flight hardware was built using three strips of 7075-T6 aluminum alloy that
were black anodized, resulting in an alumina surface impregnated with black dye. The
strips were 25 mm x 120 mmx 0.25 mm. Each metal was resistive-evaporation-deposited
in thicknesses of 200, 300, 450, 700, and 1000 ,_ on a single strip on top of the now black
metal strips. One strip was made for each deposited metal: A1, Pt, and Ni. The pattern of
metal (M) and bare spots (B) of each strip is: BMBMMBMM. The unique pattern
allowed each coupon to be identified by the photodetector output. Each metal abrasion
sample is adjacent to a black reference coupon, and the thinnest sample of each metal is
between two black reference samples. The strips are shown attached to the wheel of the
rover in Fig. 1.
The final photodetector design included three small GaAs/Ge solar cells wired in
parallel and connected to a load resistor [7]. A load resistor was included so the output
voltage is linear with incident light intensity. The load resistor was sized so that the
photodetector would not saturate in martian sunlight. Geometrical optics limited the field
of view to slightly smaller than one abrasion sample when viewed at an angle of
incidence of 30 ° and a separation distance of 19.2 mm (center of sample to front of
detector). The three apertures limited the field of view. Optical baffle plates between
each of the three photocells isolated them.
The photodetector was attached to the bogie which supports the center-right wheel
(Fig. 2). The photodetector maintained its angular position with respect to the wear strips
on the wheel during a wheel abrasion experiment. As the wheel mined in the martian
soil, the metal films were worn away exposing the black anodization. The photodetector
monitored the reflectance off the samples. Reduced reflectance ideally corresponds to
metal fikn wear.
A WAE calibration using prototype wheel and photodetector is shown in Fig. 3.
This calibration was performed by using flight spare wheel and wear strips hardware. The
light source of the calibration is a photographic test lamp which produced 25 percent
Mars [ight intensity on the wear strips. Several features are notable in the calibration data.
The black samples do not produce a zero output from the photodetector. The black
anodized samples has a low reflectance (<5 percent) up to 700 nm, where it begins to
reflect. At the band edge of the GaAs photocell (870 nm), the reflectance has increased to
>40 percent. This reflectance accounts for'the non-zero reference value.
FLIGHT WAE PROCEDURE
To perform a WAE on Mars, the Wheel Abrasion Command was sent to the rover
from Earth. In a WAE all wheels were locked except the wheel abrasion wheel which was
spun in the backward direction, digging into the martian surface, while photodetector data
was acquired. The WAEs were typically conducted with data acquisition while spinning

the wheel (2 revolutions),wheelspinningwithout dataacquisition(3 revolutions),andthendataacquisitionwhilespinningthewheel(2 revolutions).Thetotal numberof wheelrevolutionsin atypical WAEwasthereforeseven.The wheelrotationratewas1cm/sec;and five readingswereobtainedfrom eachcoatedsamplein eachwheel revolution.The
central, or peak, reading of each sample was, by design, unaffected by light reflected from
any adjacent samples.
The data returned by the WAE included the rover X and Y positions, rover
heading, X and Y accelerations, left and right bogies potentiometer telemetry, error flags,
wheel motor current, and photodetector voltage. The fight bogie arm potentiometer and
the differential potentiometer resistance was acquired at several intervals during a WAE
to reveal the angular positions of the WAE bogies. The intervals were usually at 0, 2, 5,
and 7 revolutions of a WAE. The depth of dig of the wheel abrasion wheel was then
calculated by trigonometric relations fi'om these potentiometer results.
Some WAEs were conducted with a "lift" WAE. A lift WAE was conducted by
driving the right front wheel back a _Aturn then driving the right rear wheel forward a _A
turn which elevates the center, wheel abrasion, wheel. The photodetector data was
acquired while the wheel is spun. The purpose of the lift WAE was to evaluate wear by
obtaining a "clean" signal from the wear strips. A lift WAE was conducted on sols 39 and53.
GROUND WAE PROCEDURE
Ground tests were conducted under simulated martian conditions for comparison
with flight data. A cylindrical vacuum chamber about 600 mm in diameter by 600 mm
long was modified to accommodate an appropriately loaded WAE wheel, a WAE
photodetector, and a circular tray for the wheel to roll in, and a light source of
approximately solar specmun to reflect from the wheel strips.
A variable speed electric motor, external to the vacuum chamber, rotated the
wheel which, in turn, drove the turntable filled with martian surface simulant. The wheel
was driven at 1.0 rpm which fell within the typical wheel speed of the rover on Mars: 0.6
to 1.2 rpm. The slip between the wheel and the surface simulant in the rotatable wore the
metal films. The slip was calculated to be 5 to 15 percent for the simulants tested, and
could be adjusted by means of an electromagnetic brake. The load on the wheel for the
ground tests equaled the average load on one wheel of the rover in martian gravity, 7.8 N.
A capacitively coupled electrostatic voltmeter measured the electrostatic charging
of the wheel in the dry conditions of the test facility. The electrostatic probe could be
raised or lowered while the test facility was under vacuum to view the ground plane. The
ground plane served as a reference to zero but the electrostatic voltmeter since the ground
plane was electrically connected to earth ground.
A xenon arc lamp was the light source, since it is spectrally similar to the sun. The
light was specularly reflected from the wear strips onto the photodetector. For the
laboratory tests, the photodetector was located the same distance from and had the same
orientation with respect to the wheel as on the flight experiment.
Before conducting the wear tests, the ground test facility was pumped down to
lxl0 3 Pa with a diffusion and mechanical pump and then backfilled with a simulated

martiangasmixture (inpercent:95.6,CO2;2.52,N2; 1.36, Ar; 0.336, 02; 0.153, CO; and
0.03, H20 [8]) to average martian surface atmospheric pressure 0.71 Pa (7 mbar) at room
temperature, 23°C. Five martian surface simulants were used for the ground testing. The
median grain sizes of these five simulants ranged from 6 to 2000 micrometers. The
simulants filled the cavity in the turntable. Each simulant was used in a separate wear test.
RESULTS AND DISCUSSION
Depth of Dig
The WAE depth of dig (DOD) was calculated based on the angles of the two
bogie arms at the start and end of the wheel abrasion sequence. The DOD is defined as
the movement of the WAE wheel in the +z direction (toward the bottom of the rover).
The formula is given by:
DOD = r_[sin(ao + a2)- sin(ao + (zt)] + r_[sin(13o - I32)- sin(13o - 13,)]
where: r_ = 20 cm
r_ = 12 cm
ao = 30 °
13o= 45 °
at = differential angle of bogie at start of sequence
a2 = differential angle of bogie at end of sequence
131= fight bogie angle at start of sequence
132= right bogie angle at end of sequence.
Figure 4 shows the DOD for all WAEs except sols 28, 39 and 53, since they were lift
WAEs. The dig data fall into three general categories: rock-like or very hard soil material
(sol 14 and 18), somewhat softer material (sols 4.1, 4.2, 5, 12, and 21) and loose soil (sol
23) [9]. Sol 14 was taken on a feature named Scooby Doo and sol 18 data was taken in
the vicinity of the feature named Cabbage Patch. There is no appreciable DOD after seven
revolutions at either location. The WAE in the softer material (sol 4.1, 4.2, 5, 12, and 21)
all exhibit a similar dig profile, digging 0.6 to 0.7 cm in the first two revolutions. The rate
of dig then begins to decrease with a final depth of 0.8 to 1.2 cm after seven revolutions.
The sol 5 experiment was conducted on the morning following the sol 4.2
experiment. Since the rover was not moved between these two experiments, the WAE
wheel began the sol 5 test in the hole left .by the sol 4.2 test. The dig rate in sol 5 follows
the profile established in the sol 4.2 test. The sol 23 WAE test was conducted in the
vicinity of a rock called Snowy. The wheel dug 1.5 cm in two wheel revolutions so the
material was very loose. The sol 4.2/5 and sol 23 data seem to indicate an asymptotic dig
depth of about 2 cm, perhaps because of the presence of a hard, crust-like material at that
depth. In preflight ground tests, the WAE wheel was able to dig greater than 3 cm in
loose surface simulant in a few revolutions, suggesting that dig depth on Mars was not
limited by rover mechanical characteristics, and that the martian dust is much more
compacted only a few centimeters beneath the surface than it is at the surface.

Dust Adhesion
The lander camera provided evidence of dust accumulation on the Sojourner rover
wheels [9]. Also, during WAEs, dust depressed the reflectance signals. Figure 5 shows
the rover on sol 3 before dust accumulation was first noticed on the wheels. Figure 6
shows severely depressed signals of some platinum coupons and all aluminum coupons of
the first WAE on sol 4. This signal reduction is a result of dust adherence rather than
metal film wear since a later WAE from sol 53, Fig. 7, shows Pt and A1 peak values
higher than in Fig. 6. The sol 22 end-of-day image, Fig. 8, shows fine red dust
concentrated around the wheel edges with additional accumulation in the wheel hubs.
Images on sol 4 of the rover illustrate the loss of black-white contrast on the wheel
abrasion experiment strips. Loss of contrast was also seen on test wheels in the laboratoryfrom dust adhesion.
In laboratory tests with five different soil types, grain sizes less than 25
micrometers resulted in severe wheel clogging. The mass of adhering dust to the wheel
was inversely related to grain size for the five simulants tested. Similar clogging may
also be seen in Fig. 8 on the martian surface. The smooth and reflective tracks of the
Sojourner wheels in the soil are produced in soils with a grain size of 40 micrometers or
less [ 10].
Abrasive Wear of Wheel Strips
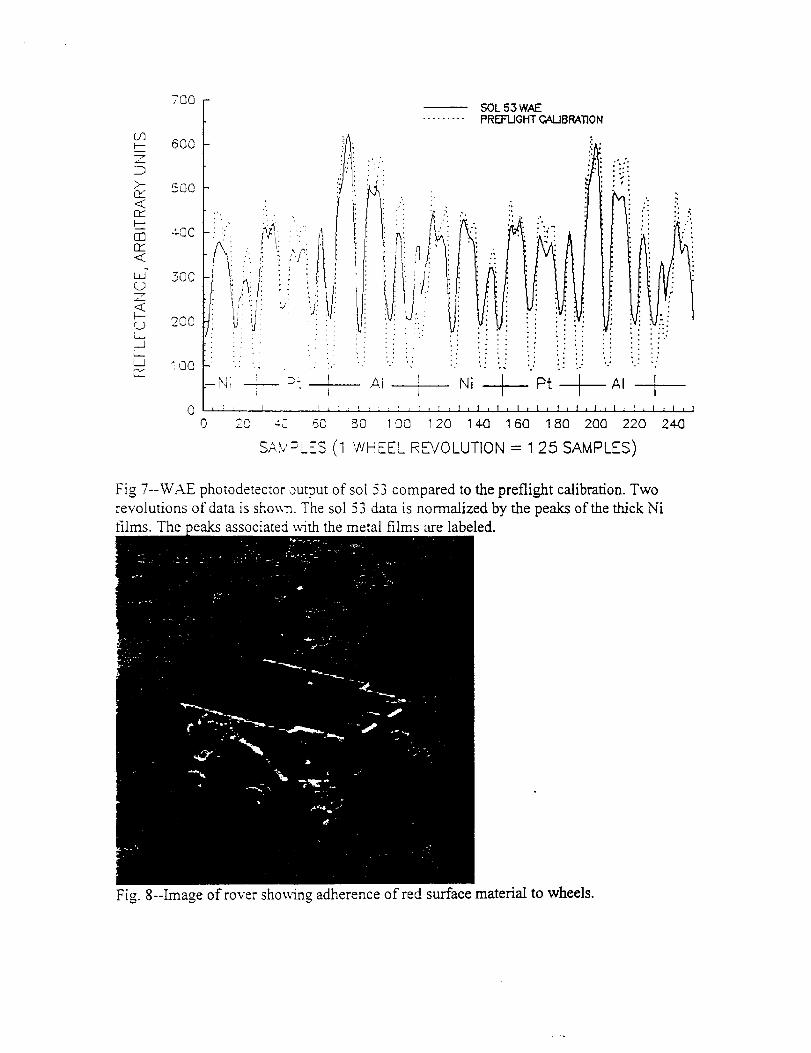
As the rover traversed the martian landscape, a total of eleven (11) WA_Es were
conducted as shown in Fig. 9. Ideally, Sojourner was pointed in the direction that would
result in the best specular reflection from the sun, and the change in the value of reflected
signal would indicate the amount of metal removed by abrasion from each sample. In
reality, inaccurate pointing and uneven dust coating of the wheel led to difficulties in
interpreting the data.
The total number of WAE wheel revolutions was 55. Of these, 16 revolutions
were performed on a hard or rocky surface, where the WAE strip was probably not
abraded, since the depth of dig was less than the height of the growsers on the wheel.
Thus, a total of 39 wheel revolutions were conducted in wheel abrasion experiments.
Complicating the interpretation of the results was a change in the reflectance due
to dust which stuck to the WAE wheel. The martian environment is extremely dry, and
the WAE wheel may have been subject to triboelectric charging (static electric charging
due to friction) during traverses [11]. Ground tests of a flight spare WAE wheel in a
simulated martian atmosphere showed thaf the wheel would pick up dust and develop an
electrostatic charge. When the wheel was grounded, the wheel potential fell dramatically
and some dust fell off the wheel. Ground tests also showed that the magnitude of
electrostatic charging increases as grain size decreases. Thus charging and dust adhesion
were anticipated to be possible problems with the data analysis.
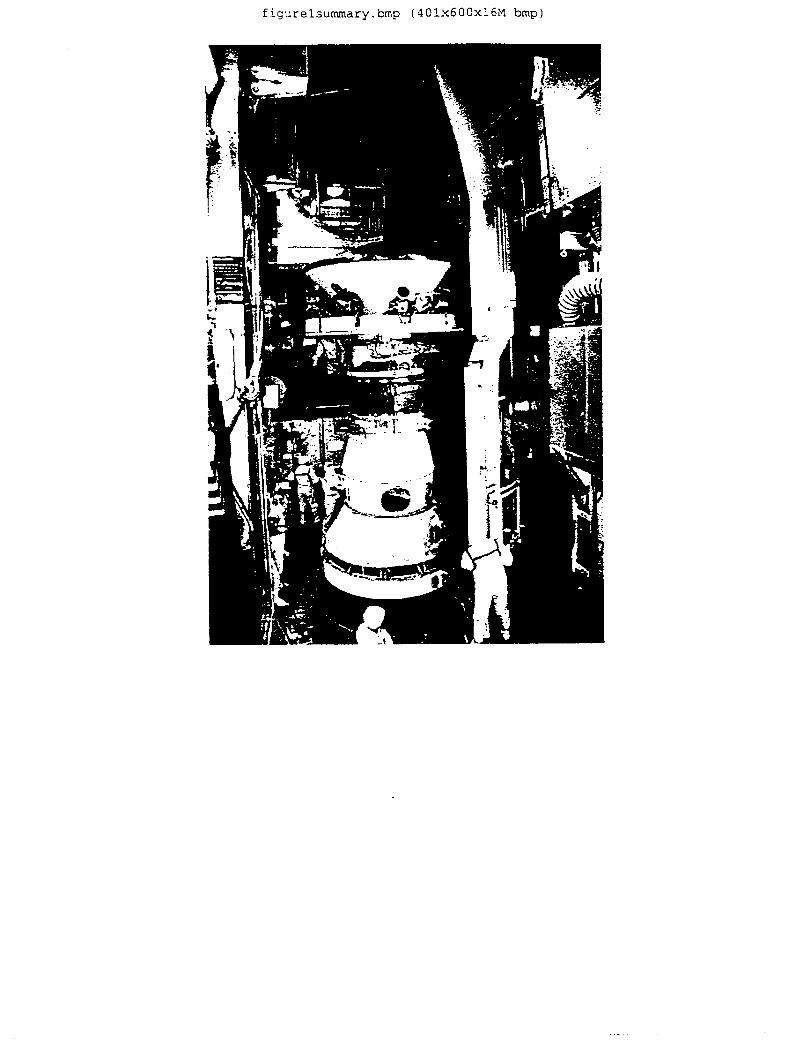
In Fig. 8, sol 53 WAE data is normalized to the calibration signal obtained before
flight. The data consisted of two complete wheel revolutions, with much consistency
between the two rotations [9]. The sol 53 data was then analyzed. In order to account for

thedustcoatingon thewheelstrips,thesol 53datawasdividedbythecalibrationsignal.The reasonfor taking this ratio is that an even coatingof dust on the samplesis notexpectedto changethe ratiosmuch,but it will reduceoverall reflectance.Ratiosof theblack referencesamplesto the calibration signal indicate the reflectivity of the blacksampleswhen coveredwith dust, comparedto dust free condition. Sincethe blackreferencesamplesarealuminumoxide(impregnatedwith ablackdye)theyareexpectedto wearlittle. Plottingtheratiosasa function of initial metal film thicknessfor the fivemetal thicknessesillustratethattheplatinum andthe nickel films havewornlittle whilethealuminumfilms exhibitwearinverselyrelatedto initial film thickness.
A similar analysis was performed with ground test data. Figure 10 shows the
photodetector signals of the strips from the ground tests conducted in a surface simulant
with a 25 micrometer median grain size. The composition of this simulant is similar to
martian soil [ I ]. Between the wear tests, the wheel strips were rinsed with distilled water
so the photodetector signals were "clean." The strips exhibited wear in the thinnest and
sorest metal, aluminum, just as in sol 53. Also the peaks from thicker platinum and
nickel films show little reduction at 32 revolutions, about the same number of wheel
abrasion wheel revolutions as on Mars (39), justifying the normalization used.
CONCLUSIONS
One of the Mars Pathfinder Sojourner technology experiments, the wheel abrasion
experiment, was designed to measure the abrasive properties of the martian surface
material. Abrasion of the metal films on the wheel strips is most pronounced in the
thinnest samples of the sorest metal samples, aluminum, in the flight and in the ground
tests. Lander images revealed adhesion of dust to the wheels. A grain size of less than 40
micrometers is inferred from the clogging of the dust in the wheel on Mars. Ground tests,
conducted using five simulants with grain sizes from 6 to 2000 micrometers in a
simulated martian environment, revealed electrostatic charging and adhesion of dust to
the wheel. The depth-of-dig of the wheel abrasion wheel on Mars shows that in some
WAEs the digging rate decreases at a depth of about 1-2 cm, suggesting a harder,
compacted material beneath the 1-2 cm of loose dust.

REFERENCES
1. Gaier, J.R., Perez-Davis, M.E., "Effect of Particle Size of Martian Dust on the
Degradation of Photovoltaic Cell Performance," NASA Technical Memorandum 105232,
p. 2, (1992).
2. Golombek, M. P., Cook, R. A., Economou, T., Folkner, W. M., Haldemann, A. F. C.,
Kallemeyn, P. H., Knudsen, J. M., Manning, R. M., Moore, H. J., Parker, T. J., Rieder,
R., Schofield, J. T., Smith, P. H., Vaughan, K. M., "Overview of the Mars Pathfinder
Mission and Assessment of Landing Site Predictions," Science, 278, 5 December, pp.
1743 - 1748, (I 997).
3. Jenkins, P. P., Landis, G. A., Scheiman,'D., Kraskowsld,. M., Oberle, L., Stevenson,
S., "Materials Adherence Experiment: Technology," 32 nd Intersociety Energy
Conversion Engineering Conference, Paper IECEC-97339, July 1997.
4. Hepp, A. F., Fatemi, N. S., Wilt, D. M., Ferguson, D. C., Hoffman, R., Hill, M. M.,
Kaloyeros, A. E., "Wheel Abrasion Experiment Metals Selection for Mars Pathfinder
Mission", NASA TM 107378, (1996).

5. Ferguson,D. C., "TheWheelAbrasionExperiment--How Abrasiveis theMartianDust?,"32ndIntersocietyEnergyConversionEngineeringConference,PaperIECEC-97341,July 1997.
6. CRC, Handbook of Chemistry and Physics, 43 _a Edition, Chemical Rubber Company,
Cleveland, OH, pp. 2164-2189, (1961).
7. Wilt, D. M., Jenkins, P. P., Scheiman, D. A., "Photodetector Development for the
Wheel Abrasion Experiment on the Sojourner Microrover of the Mars Pathfinder
Mission," 32 nd Intersociety Energy Conversion Engineering Conference, Paper IECEC-
97342, July 1997.
8. Kaplan, D., compiler, "Environment of Mars, 1988," NASA TM 100470, pp. 3-3 to 3-
8, (1988).
9. Ferguson, D. C., Kolecki, J. C., Siebert, M. W., Wilt, D. M., Matijevic, J. R.,
"Evidence for Martian Electrostatic Charging and Abrasive Wheel Wear from the Wheel
Abrasion Experiment on the Pathf'mder Sojourner Rover," Journal of Geophysical
Review, in press.
10. Sentman, D. D., "Electrostatic Fields in a Dusty Martian Environment," Sand and
Dust on Mars, CP-10074, p. 53, (1991).
11. Rover Team, "Characterization of the Martian Surface Deposits by the Mars
Pathfinder Rover, Sojourner," Science, 278, 5 December, pp. 1765-1768, (1997).

Figures
Fig. 1--The right center wheel of the rover is the wheel abrasion wheel. The piece of
amber tape on the bogie arm, near the wheel abrasion wheel, covers the apertures of the
photodetector.
Fig. 2--Schematic of wheel abrasion experiment. As the wheel rotates, the photodetector
views either metal films samples or black reference samples.
Fig. 3--Photodetector output of flight wheel abrasion wheel before conducting a wheel
abrasion experiment, called calibration data. The metal of the films is labeled under their
corresponding peaks. The numbers above the peaks represent the initial fi/m thickness in
Angstroms of AI. The film thicknesses for Pt and Ni have the same pattern as A1. The
single peak corresponds to the 200 Angstrom thick metal film.
Fig. 4--Depth of dig of wheel abrasion wheel versus wheel revolutions for the entireWAE data set when the WAE wheel was in contact with the surface. The curves are
labeled according to the sol in which the WAE was conducted.
Fig. 5m The rover on sol 3 before dust accumulation was first noticed on the wheels on
sol 4.

Fig. 6--Normalized sol 4.1 reflectance Signals, compared to preflight calibration of Fig.
3. Dust coverage starts with the 300 and 450/k thick platinum peaks and includes all the
aluminum peaks.
Fig 7--WAE photodetector output of sol 53 compared to the preflight calibration. Two
revolutions of data is shown. The sol 53 data is normalized by the peaks of the thick Ni
films. The peaks associated with the metal films are labeled.
Fig. 8--Image of rover showing adherence of red surface material to wheels.
Fig. 9--Locations of all WAEs by sol. Grid squares are 1 meter on a side.
Fig. 10--Photodetector output from the ground tests of wheel abrasion wheel at several
equivalent wheel sliding revolutions conducted with the 25 micrometer grain-size
simulant. The numbers in the legend represent the number of equivalent sliding
revolutions of the wheel. The output was normalized by the values of the black reference
coupons (the valleys).

figurelwae.bmp (939x618x16M bmp)

Fig. 1--The right center wheel of the rover is the wheel abrasion wheel. The piece of
amber tape on the bogie arm, near the wheel abrasion wheel, covers the apertures of the
photodetector.
BOGIE
LIGHT PATH
V) / GROVVSERS
%II
/
_EN.
REFERENCE
SAMPLE
Fig. 2--Schematic of wheel abrasion experiment.As the wheel rotates, the photodetector
views either metal films samples or black reference samples.

100
A
>E
v
p-
CuF-
0rv"o 50p-<3i,i
bJC30F--03-cu
I0
_A P_cq
|000 700
4-,'50 3OO, ,','Ivl _/3
2OO
NICKVI PLATINUM ALUMINUM --
0 , T , I , I I
IO0 200 300 400
ROTATIONAL ANGLE (o)
L
i
Fig. 3-Photodetector output of flight wheel abrasion wheel before wear experiments,
called calibration data. The metal of the films is labeled under their corresponding peaks.
The numbers above the peaks represent the initial film thickness in Angstroms of AI. The
film thicknesses for Pt and Ni have the same pattern as A1. The single peak corresponds
to the 200 Angstrom thick metal film.

-t
Eo
i1C_
T
0_Ld
23
21
12
18
14
2 4. 6 8 10 12
WHEEL REVOLUTION
14
Fig. 4--Depth of dig of wheel abrasion wheel versus wheel revolutions for the entire
WAE data set when the WAE wheel was in contact with the surface. The curves are
labeled according to the sol in which the WAE was conducted.

Fig. 5---The roveron sol 3 beforedustaccumulationwas first noticedon thewheelsonsol4.

1 600
ca 14-00I.--
Z'm>_ 1200n.,-.<
r_ 1000mc_< 800
z 600
,,, 4,00._JI.l_I.iJn.- 200
0
SOL 4.1WAE......... PREFLIGHT CALIBRATION
fl
r I
2n
I I
NICKEL I
, I , I
40 60
ii ..._.,,-! _-_/:
: " ": ;
, I _ I , I _ I
80 1 O0 1 20 1 40
SAMPLES (ONE WHEEL REVOLUTION = 125 SAMPLES)
Fig. 6---Normalized sol 4.1 reflectance signals, compared to preflight calibration data of
Fig. 3. Dust coverage starts with the 300 and 450 A thick platinum peaks and includes all
the aluminum peaks.

figure8wae.bmp (256x285x16M bmp)
7(30
O3_-- 600
>- 5QOry<rY
4-eor'r<
500(3Z<I--- ..-.,o 400L.
b_
LU 100p_
0
SOL 53 WAE......... PREFLIGHTC,,ALIBRATION
ii-',/.
,:':ii ," : :?!
.. ".
• i':.: ' " '_" i"::':
rl !Z i l
.-Ni" i" n; i' AI ,I Ni t Pt H I AI t
I i ; I I ! I ! ; I I I ; I I _ ' f r l , I , I , I , I , 1 , I , I , I t I , I , I I ]
0 20 "C 60 80 100 120 14-0 1B(] 180 20Q 220 24-(]
S,.-,.,,t='LES (1 WHEE'__ REVOLUTION = 1 25 SAMPLES)
Fig 7--WAE photodetector oumut of sol 53 compared to the preflight calibration. Two
revolutions of data is shown. The sol 53 data is normalized by the peaks of the thick Nifilms. The _eaks associated _ith the metal films are labeled.
Fig. 8--Image of rover sho_ving adherence of red surface material to wheels.

figure9wae.bmp (900xNOUx16M Dmp)
Fig. 9--Locations of all WAEs by sol. Grid squares are 1 meter on a side.
>E
)--
n).-
0r_0F--0I,I
0F--0"T13..
1 20
100
8O6of_ _ ii_
¢0
I
2O _J
0 , I0 5O
SLIDING REVOLUTIONS
0......... 4
........_I i :'. .
ii I ,
• u,_, I
I , I , f , I
.1 O0 1 50 200 250
ROTATI 0 NAL ANGLE (o)
/"1t_
, ,o,_
I.
i,
L_
, I
30O
_h
I
350

Fig. 10----Photodetector output from ground tests of wheel abrasion wheel at several
equivalent wheel sliding revolutions conducted with the 25 micrometer grain-size
simulant. The numbers in the legend represent the number of equivalent sliding
revolutions of the wheel. The output was normalized by the values of the black reference
coupons (the valleys).


![The Trove [multi]/1st... · PATHFINDER RPG CORE RULEBOOK , PATHFINDER RPG BESTI ARY , PATHFINDER RPG BESTIARY 2 , PATHFINDER RPG BESTIARY 3 , PATHFINDER RPG ADVANCED PLAYER S GUID](https://img.dokumen.tips/doc/110x75/60c7beb87d66ea6048574996/the-trove-multi1st-pathfinder-rpg-core-rulebook-pathfinder-rpg-besti-ary.jpg)