Embed Size (px)
Citation preview

- 1 -
DRAFT DELIBERATIVE DOCUMENT – FOR DISCUSSION PURP OSES ONLY - DO NOT RELEASE UNDER FOIA
FINAL REPORT: METHODOLOGY FOR ASSESSING ARMY
INSTALLATIONS’ ENVIRONMENTAL RESOURCE ELASTICITY AND MODEL OUTPUTS
Draft as of: August 19, 2004
Working Draft
DCN: 7794

2
PREFACE SPONSORSHIP This project was sponsored by the Army Environmental Policy Institute (AEPI) and The Army Basing Study Office (TABS). PROJECT TEAM The project was led by Steve Siegel of the Energy and Security Group (ESG). The primary project team consisted of Dave Dutton, Paul Booth and Dawn Wray from CALIBRE; Steve Bell of ESG; Phil Huber and James Wolf as consultants to ESG, and Stuart Foltz, Richard Scholze, William Taylor, Elizabeth Jenicek, Alan Anderson, and Deb Curtin from the Engineer Research Development Center’s Construction Engineering Research Laboratory (ERDC-CERL). ACKNOWLEDGEMENTS The project team would like to thank Rich Pedersen from the Center for Army Analysis; Dave Eady from the Army Environmental Policy Institute; and Colonel William Tarantino, Lieutenant Colonel Tom Crabtree and Lieutenant Colonel Greg Fleming from The Army Basing Study Office for their assistance and support throughout the project.
This report has been produced by CALIBRE Systems, Inc. under Contract No. DASW01-03-A-0010, Order No RE12-001.

3
Table of Contents
Page Executive Summary………………………………..……………………………. 4 I. Project Objective and Background……….………………………………… 9 II. Environmental Elasticity…………….………………………………………... 10
A. Figures of Merit Considered….....………………………………………….. 10 B. Resources Examined….…………………………………………………….. 11 C. Resource Capacity Restrictions…………………..………………………. 12
III. Methodology……………………………………………….………………….. 13
A. Installation Resource Elasticity Methodology (IREM) Model Description………………………………………….……………..... 13
B. Data Review Process………………………………………….……………. 18 IV. IREM Model Outputs and Results……………………………….………….. 21
A. Model results-- run as of July 6, 2004……………………………….……... 21 B. Results Analysis…………………………………………………………..… 25 C. Data limitations and assumptions…………………………………………... 25
V. Model Input into Military Value Analysis………………………………..… 27 VI. IREM Model Additional Capabilities……………………………………….. 28 Appendices
A. Resource Infrastructure and Processing Flows…………………………… 29 B. Calculations for Physical Capacity Threshold………………………..….. 35 C. Data Call 1 and 2 Questions Used………………………………………... 37 D. Current Data Condition of Installations Used for Analysis…………….… 56
Figures, Graphs and Tables
Table A. Personnel and Total Annual Costs at Capacity Threshold…….......... 5 Table B. Summary of Installation Resource Constraints………………..…… 7 Figure A. IREM Model Overview………………………………………..…... 15 Figure B. IREM Model Output Analysis……..………………………………. 16 Table C. Maximum Personnel and Total Annual Costs at Capacity
Threshold………………………………………………………........ 22 Graph A. Maximum Personnel and Total Annual Costs at Capacity Threshold
(all installations)……………………….……………………………. 23 Graph B. Maximum Personnel and Total Annual Costs at Capacity Threshold
(2 outliers removed and notional quadrants inserted)…………………………………………………………….. 24
Table D. Summary of Installation Resource Constraints…………………........ 25
4
EXECUTIVE SUMMARY
An assessment of both the capacity and the cost to provide the needed environmental resources to support personnel at an installation is a key component of the Army’s stationing process and military value analysis. This project developed a methodology to assess in a consistent, comprehensive way the relationships between capacity to support personnel and the costs for specified environmental resources. The results of applying the methodology are a reflection of the environmental elasticity of an installation: the overall ability to station personnel considering the physical capacity and costs of these resources. These results may then be used to assess the military value of the installation for its environmental attributes in a consistent, understandable fashion. Four environmental resources were examined. They are: 1) energy- both electricity and natural gas, 2) potable water, non-potable water and wastewater- both industrial and municipal, 3) solid waste disposal, and 4) maintained training land. The physical capacity of each resource is deemed the “capacity threshold” for that resource. At its capacity threshold, the resource can support a certain number of personnel depending on the usage per person of that resource. For an installation as a whole, the cap or amount of personnel that can be supported by the most constraining resource is the effective cap on personnel for the installation as a whole. The analysis proceeded in stages. First, the “capacity threshold” of each resource was determined - that is, what in physical terms is the limit of each resource without significant new investment in infrastructure. Second, the current usage and cost per person for each resource was assessed. Third, it was calculated how many personnel could be supported at the capacity threshold for each resource. Fourth, it was determined what the constraining resource for the installation as a whole was in terms of supporting personnel. Finally, it was determined what would be the total annual costs for all resources at the maximum level of personnel the installation could support. The potential capacity restriction was evaluated in terms of peak usage and peak physical limitations of the system - not a consumption limitation metric. Upon evaluating the resources, it was determined that the “constraining” resources in terms of physical limits that would be analyzed for peak restrictions were energy (electricity and natural gas), water (potable and non-potable) and wastewater (industrial and municipal). For energy, it is assumed that off- installation supply is unlimited but there are capacity threshold restrictions due to limits on distribution for electric substations and transmission lines and natural gas pipelines. For water supply and wastewater treatment, capacity threshold restrictions may be due to treatment plant size, distribution limits, or permit restrictions.
For solid waste, it is assumed that off-post disposal is unlimited and there is no capacity threshold limit; this project focused on the costs of disposal. For training land, other projects underway determine the capacity threshold and this project focused on the costs of maintaining the training land.
- 5 -
The data used for the analysis is from two data calls from installations conducted by the Army Basing Study Office (TABS). The data were evaluated and compared to reliable, certifiable secondary sources. The results presented in this report are from the data for all 88 installations specified for evaluation by TABS. However, 62 of the installations still had problems with the data used for analysis that were revealed either when input into the model or after the model runs. In scenarios conducted using these model results, these latter installations have been flagged and should undergo additional analysis. The methodology produces a metric for each installation that reflects an installation’s environmental elasticity: the overall ability of an installation to station personnel at its physical capacity limit for the capacity constrained resources of energy, and water and wastewater treatment in relation to the costs of four environmental resources -- energy, water and wastewater treatment, solid waste management, and maintenance of training land. The metric is a comparison between 1) the total costs for all resources at the maximum number of personnel that can be supported by these resources at an installation, and 2) the number of people that can be supported at this maximum level. These values are the primary inputs for an installation’s environmental elasticity into the military value assessment being conduced by TABS.
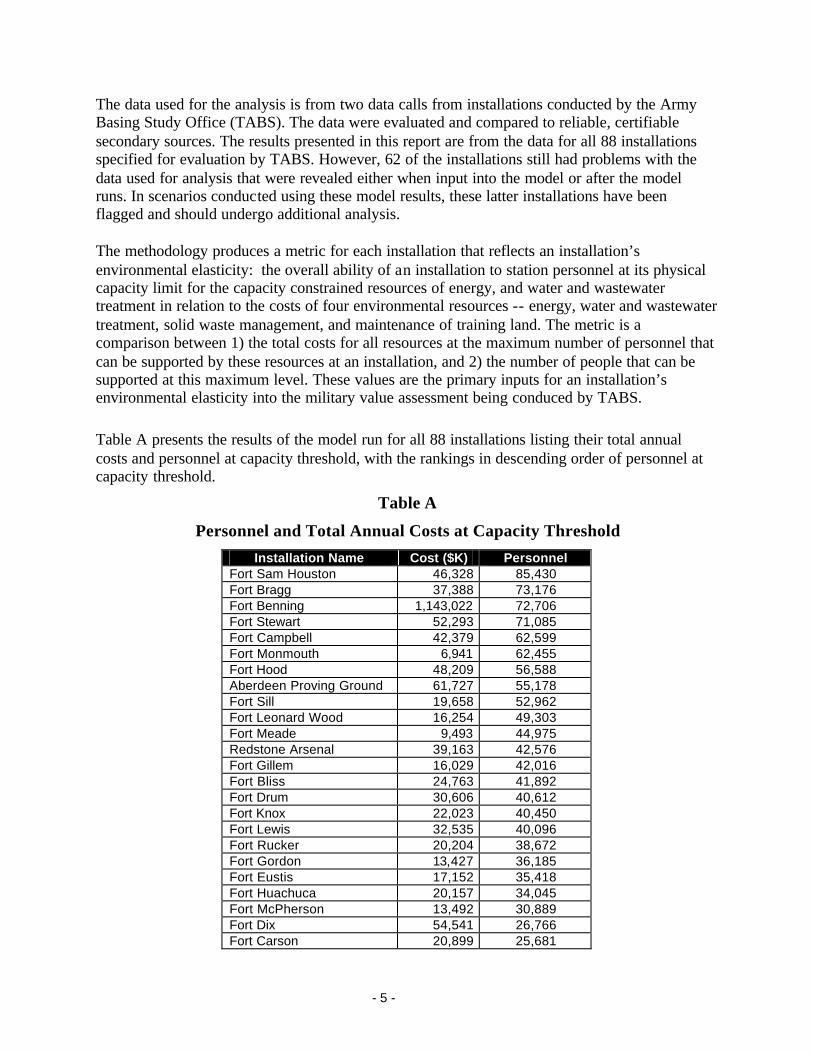
Table A presents the results of the model run for all 88 installations listing their total annual costs and personnel at capacity threshold, with the rankings in descending order of personnel at capacity threshold.
Table A
Personnel and Total Annual Costs at Capacity Threshold
Installation Name Cost ($K) Personnel Fort Sam Houston 46,328 85,430 Fort Bragg 37,388 73,176 Fort Benning 1,143,022 72,706 Fort Stewart 52,293 71,085 Fort Campbell 42,379 62,599 Fort Monmouth 6,941 62,455 Fort Hood 48,209 56,588 Aberdeen Proving Ground 61,727 55,178 Fort Sill 19,658 52,962 Fort Leonard Wood 16,254 49,303 Fort Meade 9,493 44,975 Redstone Arsenal 39,163 42,576 Fort Gillem 16,029 42,016 Fort Bliss 24,763 41,892 Fort Drum 30,606 40,612 Fort Knox 22,023 40,450 Fort Lewis 32,535 40,096 Fort Rucker 20,204 38,672 Fort Gordon 13,427 36,185 Fort Eustis 17,152 35,418 Fort Huachuca 20,157 34,045 Fort McPherson 13,492 30,889 Fort Dix 54,541 26,766 Fort Carson 20,899 25,681

6
Table A (continued)
Installation Name Cost ($K) Personnel Schofield Barracks 15,673 24,527 Fort Leavenworth 16,733 23,803 West Point Mil Reserve 24,458 20,763 White Sands Missile 21,566 17,925 Corpus Christi 32,098 16,847 Fort McNair 7,807 10,504 Fort Richardson 9,687 10,309 Fort McCoy 14,486 9,311 Fort Detrick 13,146 8,765 Fort Polk 6,589 8,676 Fort Lee 3,759 8,584 Fort Buchanan 6,535 6,842 Picatinny Arsenal 14,536 6,610 Watervliet Arsenal 27,358 6,221 Detroit Arsenal 3,762 6,145 Anniston Army Depot 15,341 6,102 Fort Wainwright 2,017 5,995 Rock Island Arsenal 2,626 5,856 Military Ocean Terminal 3,096 5,647 Fort Hamilton 5,399 5,552 Tobyhanna Army Depot 8,939 5,536 Lake City AAP 9,559 5,416 Presidio of Montery 2,078 5,091 Red River Army Depot 9,148 4,786 Charles E Kelly Spt Ctr 3,857 4,685 Tripler Army Medical Ctr 6,282 4,646 Carlisle Barracks 4,581 4,598 Yuma Proving Ground 2,397 4,194 Fort Shafter 3,079 4,129 Soldier Systems Ctr 4,597 4,067 Letterkenny Army Depot 4,242 3,743 Pine Bluff Arsenal 9,800 3,601 Sierra Army Depot 9,032 3,433 Dugway Proving Ground 2,362 2,758 US Army Garrison S 2,998 2,705 McAlester AAP 3,809 2,695 NTC and Fort Irwin 193,446 2,479 Lima Army Tank Plt 8,698 2,424 Fort AP Hill 3,762 2,140 Tooele Army Depot 1,766 1,969 Adelphi Laboratory 4,253 1,532 Fort Riley 790 1,428 Fort Belvoir 756 1,396 Blue Grass Army Depot 1,531 1,265 Fort Monroe 613 929 Milan AAP 2,474 928 Hawthorne Army Depot 792 805 Lone Star AAP 2,942 589 Kansas AAP 2,692 532

7
Table A (continued)
Installation Name Cost ($K) Personnel Fort Jackson 103 525 Scranton AAP 5,669 464 Mississippi AAP 5,566 289 Crane Army Amm 3,390 201 Umatilla Chem Depot 673 194 Radford AAP 657 188 Iowa AAP 240 143 Newport Chem Depot 28 56 Walter Reed AMC 120 54 Fort Myer 35 33 Pueblo Chem Depot 19 23 Holston AAP 90 9 Deseret Chem Depot 7 5 Riverbank AAP 8 3 Louisiana AAP 2 2
Table B shows which resource was the constraining resource for the installations studied. This table shows the constraining resource in the left column, the number of installations constrained by the resource in the middle column and the percentage of total installation in the right column. For example the table illustrates that over half of the installations studied were constrained by either electricity (31%) or potable water (26%) resources.
Table B. Summary of Installation Resource Constraints
Constraining Resource
Number of Installations
Percent of Installations
Studied Electricity 27 31% Potable Water 23 26% Municipal Waste Water 15 17% Natural Gas 13 15% Industrial Waste Water 6 7% Non-potable Water 4 5% Total 88 100%
The results developed in this project for personnel at capacity threshold and total annual costs at capacity threshold are the environmental elasticity inputs to the model for military value that will be developed by TABS. The Maximum value of 10 will be given to the installations with the largest populations at the lowest total annual costs. The Minimum value of 0 will be given to the installations with the smallest populations at the highest total annual costs.

8
In addition to the outputs required to conduct the Military Value Analysis, the IREM model has the ability to generate multiple outputs depending on the analytical requirement. This model can provide: an assessment of the costs and amount of additional personnel that may be added to an installation, traditional elasticity measurements for resources whose costs are not linear, derived unit resource costs, per person resource costs, specifications for which resource is restricting installation expansion, capacity factors for each resource, and assessments for other environmental resources. Given the availability of input data, the model has the capability to estimate the number of additional personnel that can be absorbed by an installation by increasing capacity through initiatives such as low cost efficiency or conservation programs. For example, an installation constrained by potable water may be able to increase its capacity to support additional personnel through various water conservation measures.

- 9 -
I. Project Objective and Background
An assessment of both the capacity and the cost to provide the needed environmental resources to support personnel at an installation is a key component of the Army’s stationing analysis process and military value analysis. The methodology developed assesses in a consistent, comprehensive way the relationships between capacity to support personnel (as benefits) and the costs for specified environmental resources. The results of applying the methodology are a reflection of the environmental elasticity of an installation: the overall ability to station personnel considering the physical capacity and costs of these resources. These results may then be used to assess the military value of the installation for its environmental attributes in a consistent, understandable fashion. Four environmental resources were examined in this project. They are: 1) energy- both electricity and natural gas, 2) water- both potable and non-potable and wastewater- both industrial and municipal, 3) solid waste disposal, and 4) maintained training land. The data for the analysis was from two data calls from installations conducted by TABS. The uses and limitations of the data are discussed in detail later in this report.

- 10 -
II. Environmental Elasticity A. Figures of Merit Considered The environmental resources at an installation affect stationing decisions and military value analysis in two primary ways. First, the physical capacity of the resources may put an effective cap on how many personnel may be stationed at an installation without significant new investment in infrastructure. Second, the costs of these resources will vary installation by installation so the total annual costs to station personnel will accordingly vary. The physical capacity of each resource is what is deemed the “capacity threshold” for that resource. At its capacity threshold, the resource can support a certain number of personnel depending on the usage per person of that resource. For an installation as a whole, the cap or amount of personnel that can be supported by the most constraining resource is the effective cap on personnel for the installation as a whole. The environmental elasticity of an installation could reflect many different attributes that might be relevant to the stationing process and military value analysis. Accordingly, many different figures of merit were initially considered and rejected. These included:
- The costs and ability of an installation to add personnel from the number currently stationed there.
- The cost per person of the evaluated resources up to the installations capacity threshold.
- A calculation of the total annual costs for all resources at the installation’s physical capacity threshold for the maximum number of personnel.
- A comparison of the percentage increase in total costs relative to the percentage increase in personnel from the current stationing to the capacity threshold level – a “classical elasticity” measure in percentage terms
- A comparison of the absolute amount of increase in costs relative to the absolute amount of increase in personnel from the current stationing to the capacity threshold level – another “classical” elasticity measure in absolute terms
- A calculation of the overall ability of an installation to station personnel in relation to the total costs per person of the resources.
Each of these was considered and rejected as the sole reflection of environmental elasticity. The costs and ability to add personnel was deemed less important than the overall ability of an installation to station personnel in terms of military value. The cost per person was deemed a relevant attribute, but one that would be better suited as an input to the total annual costs to station personnel. In addition, it did not reflect the number of additional or total personnel that could be stationed. Similarly, the total annual costs for all resources at the capacity threshold was

11
deemed very important, but as a single figure of merit it did not directly reflect the number of personnel that could be stationed. The percentage increase in costs relative to the percentage increase in personnel was rejected as a figure of merit because all installations had a value of 1 when the calculations were performed. This is the result, as is discussed more below, of the assumption that the costs of adding additional personnel at an installation is a liner extrapolation from the current costs per person of those stationed there. Similarly, the absolute increase in costs relative to the absolute increase in personnel was also rejected as a figure of merit. Because of the linearity assumption regarding costs, this figure just became the cost per person of adding more personnel. This figure of merit was not deemed sufficient because of the reasons stated above regarding cost per person limitations. It was decided that one “figure of merit” did not adequately reflect an installation’s environmental elasticity. Accordingly, it was decided to present the two most relevant figures and graph them to show their relationship. These are 1) the total number of personnel that can be stationed at an installations capacity threshold, and 2) the total annual costs that would be borne to support this number of personnel at that installation.
B. Resources Examined In this project, four environmental resources were determined to be of primary interest for the military value analysis. These are:
• Energy (both natural gas and electricity)
• Water (both potable and non-potable) and wastewater treatment (both municipal and industrial)
• Solid Waste (non- hazardous) and
• Maintained training land.
The objective was to determine first what the “capacity threshold” was for each of these resources- what in physical terms was the limit of these resources without significant new investment in infrastructure. Second, it was determined how many personnel could be supported at this threshold for each resource and what was the constraining resource for the installation as a whole in terms of supporting personnel. Finally, it was determined what would be the total annual costs for each resource at the maximum level of personnel the installation could support.

12
C. Resource Capacity Restrictions The potential capacity restriction was evaluated in terms of peak usage and peak physical limitations of the system - not a consumption limitation metric. Upon evaluating the resources, it was determined that the “constraining” resources in terms of physical limits that would be analyzed for peak restrictions were energy (electricity and natural gas), water (potable and non-potable) and wastewater (industrial and municipal). For energy, it is assumed that off- installation supply is unlimited but there are capacity threshold restrictions due to limits on distribution for electric substations and transmission lines and natural gas pipelines. For water supply and wastewater treatment, capacity threshold restrictions may be due to treatment plant size, distribution limits, or permit restrictions.
For solid waste, it is assumed that off-post disposal is unlimited and there is no capacity threshold limit; this project focused on the costs of disposal. For training land, other projects underway determine the capacity threshold and this project focused on the costs of maintaining the training land. The limitations of some of the assumptions made regarding the costs of these and the other resources are discussed below in the data limitations and assumptions section. Graphical representations of the infrastructure and processing for each of the resources examined are in Appendix A.

- 13 -
III. Methodology
A. Installation Resource Elasticity Methodology (IREM) Model Description
To construct the model used for the analysis, the project followed several stages:
• First, the analytical constructs needed to evaluate the concepts were developed- e.g. what precisely was meant to be evaluated by environmental elasticity, how to measure peak capacity, etc.
• Second, the data from the initial data call conduced by TABS was reviewed to determine what data was available and what additional data would be needed for the approach developed.
• Third, questions were drafted for a new data call based on the needed data and given to TABS.
• Fourth, an excel spreadsheet was developed to reflect the analytical constructs and easily manipulate the data collected.
• Fifth, data was “scrubbed and reviewed” as it was available to flag potential problems.
• Sixth, initial runs of the model were conduced- this flagged some additional data issues.
• Seventh, TABS sought confirmation or changes from installations where there were identified data issues.
• Eighth, the new data was run for the final presentation of results as of July 06, 2004.
• Ninth, this report presents that final data run and the issues remaining concerning the approach, methodology and results.
Throughout the project, there were ongoing meetings and consultations with TABS and the Army Environmental Policy Institute (AEPI). The four resources decided to be evaluated are: 1) Energy (electricity and natural gas), 2) Water (potable and non-potable) and Wastewater (municipal and industrial) treatment, 3) Solid Waste Management and 4) Maintenance of Training Land. Data used for this analysis is obtained from TABS data calls and other authoritative sources. The data reported from the TABS data calls are reviewed to identify potential anomalies. Those cases with anomalies are flagged to enable TABS to further examine and verify the reported data.
The physical capacity of these resources puts an effective cap on the total number of personnel that may be stationed at an installation without any additional investment. The physical capacity limit of each of these resources is determined based on information from data calls concerning plant sizes, permit limits, etc. Appendix B presents how the capacity threshold restrictions were calculated for each capacity constrained resource. Appendix C presents the questions in both TABS Data Call 1 and Data Call 2 that were used in this analysis.

Draft deliberative document – For discussion purposes only – Do not release under FOIA
14
The per person usage and costs for each of these resources at existing installations is computed based on existing stationing and cost data. The usage data is then used to calculate how many persons may be stationed at an installation until the physical “capacity threshold” for that resource is reached; the cost data is used to determine how much the resources needed for the population at the capacity threshold would cost the installation.
The methodology identifies the “capacity threshold” for energy, water and wastewater. For energy, it is assumed that off- installation supply is unlimited but there are capacity threshold restrictions due to limits on distribution for electric substations and transmission lines and natural gas pipelines. For water supply and wastewater treatment, capacity threshold restrictions may be due to treatment plant size, distribution limits, or permit restrictions.
For training land, other projects underway determine the capacity threshold. For solid waste, it is assumed that off-post disposal is unlimited and there is no capacity threshold limit.
To determine costs, a linear extrapolation of costs for additional personnel is utilized based on current per person usage and cost parameters until the capacity threshold is reached1. Once a capacity threshold for energy or water is reached, new cost parameters for personnel absorption are applicable.
The methodology produces a metric for each installation that reflects an installation’s environmental elasticity: the overall ability of an installation to station personnel at its physical capacity limit for the capacity constrained resources of energy, and water and wastewater treatment in relation to the costs of four environmental resources -- energy, water and wastewater treatment, solid waste management, and maintenance of training land. A comparison between the total costs for all resources at the maximum number of personnel that can be supported by these resources at an installation, and the number of people that can be supported at this maximum level is presented. These values are primary inputs into the military value assessment.
1 Individual contracts will not be examined to determine where cost rate increases may be imposed by contract due to increased usage.

Draft deliberative document – For discussion purposes only – Do not release under FOIA
15
A graphical representation of this process is as follows. This representation shows the key steps in the IREM model process from the raw data inputs on the left hand side through the model outputs on the right hand side.
Figure A
IREM Model Overview
IREM Model Overview
Generate Estimates of
Resource Current Cost Per
Person
Data C
alls 1&2
Military V
alue A
nalysis In
pu
ts
Generate Estimates of
Resource Usage Per Person
Evaluate Maximum Personnel
Supported by Each Resource
at Current Capacity
Calculate Total Cost for All
Resources at Installation
Capacity Threshold
Resources Evaluated: Electricity Natural Gas Water (potable and non-potable) Wastewater (industrial and municipal) *Solid waste *Training Land
*Not a constraining resource
Calculate Maximum
Personnel at Installation Capacity Threshold
Identify Constraining
Resource (Installation
Capacity Threshold)
Draft deliberative document – For discussion purposes only – Do not release under FOIA
16
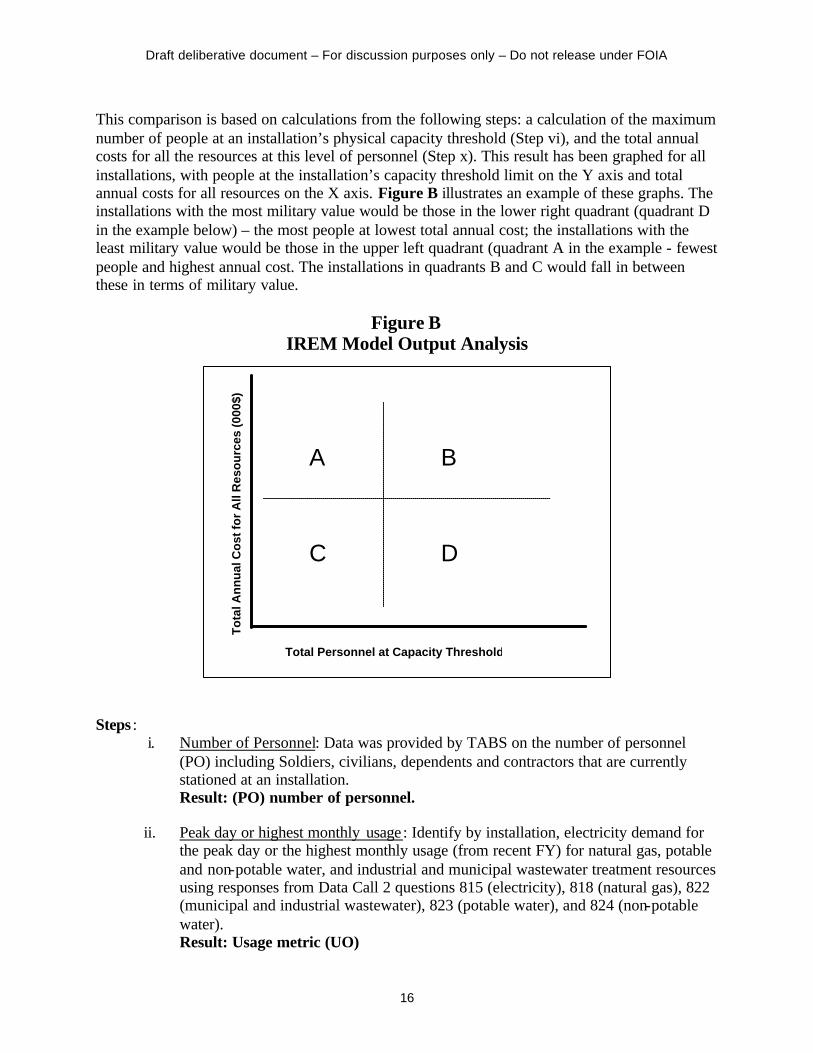
This comparison is based on calculations from the following steps: a calculation of the maximum number of people at an installation’s physical capacity threshold (Step vi), and the total annual costs for all the resources at this level of personnel (Step x). This result has been graphed for all installations, with people at the installation’s capacity threshold limit on the Y axis and total annual costs for all resources on the X axis. Figure B illustrates an example of these graphs. The installations with the most military value would be those in the lower right quadrant (quadrant D in the example below) – the most people at lowest total annual cost; the installations with the least military value would be those in the upper left quadrant (quadrant A in the example - fewest people and highest annual cost. The installations in quadrants B and C would fall in between these in terms of military value.
Figure B IREM Model Output Analysis
Steps : i. Number of Personnel: Data was provided by TABS on the number of personnel
(PO) including Soldiers, civilians, dependents and contractors that are currently stationed at an installation. Result: (PO) number of personnel.
ii. Peak day or highest monthly usage: Identify by installation, electricity demand for the peak day or the highest monthly usage (from recent FY) for natural gas, potable and non-potable water, and industrial and municipal wastewater treatment resources using responses from Data Call 2 questions 815 (electricity), 818 (natural gas), 822 (municipal and industrial wastewater), 823 (potable water), and 824 (non-potable water). Result: Usage metric (UO)
B A
D C
To
tal A
nn
ual
Co
st fo
r A
ll R
eso
urc
es (0
00$)
Total Personnel at Capacity Threshold

Draft deliberative document – For discussion purposes only – Do not release under FOIA
17
iii. Peak day or highest monthly usage per person: Calculate by installation, peak demand for electricity and highest monthly usage for natural gas, potable and non-potable water, and industrial and municipal wastewater treatment resources per person. Divide peak/highest usage by current population: UO/PO. Result: usage metric/ person
iv. Capacity threshold : Determine the capacity threshold in physical terms for the electricity, natural gas, potable and non-potable water, and industrial and municipal wastewater treatment resources using Data Call 1 questions 282 (industrial wastewater), 287 (non-potable water), 291 (potable water), 297 (municipal wastewater) and Data Call 2 questions 816 and 817 (electricity), and 819 (natural gas). Appendix XX explains how the capacity threshold is determined for each resource. Result: usage metric
v. Maximum number of personnel by resource at the resource’s capacity threshold : Calculate maximum number of personnel, by installation, which can be supported at the capacity threshold for electricity (PPE), natural gas (PPNG), potable (PPPW) and non- potable water (PPNPW), and industrial (PPIW) and municipal wastewater (PPMW) treatment. For each resource, divide the capacity threshold by peak usage per person: Step iv/Step iii. Result: number of personnel.
vi. Maximum number of personnel at installation at capacity threshold : Identify the maximum number of personnel the installation as a whole can support (PPIT) by selecting the lowest population from Step v. Result: number of personnel.
vii. Total annual costs for each resource from one of the recent FY: Identify for electricity, natural gas, potable and non-potable water, and industrial and municipal wastewater treatment resources, the year with the highest monthly usage or peak. For that year select the total annual costs by installation for these resources from Data Call 2 questions 815 (electricity: AOE), 818 (natural gas: AONG), 822 (industrial and municipal wastewater treatment: AOIW, AOMW), 823 (potable water: AOPW), and 824 (non-potable water: AONPW). For training land maintenance identify the annual cost from Data Call 2 question 821 (AOTL). For solid waste management select the year with the highest annual cost and identify that cost from Data Call 2 question 820 (AO SW). Result: dollars.
viii. Cost per person for each resource up to its capacity threshold: Calculate the cost per person for electricity (CPE), natural gas (CPNG), potable water (CPPW), non-potable water (CPNPW), industrial wastewater (CPIW), municipal wastewater (CPMW) , solid waste (CPS), and training land maintenance (CPTL) by installation at current stationing levels up to the capacity threshold for that resource. Divide total annual recent costs for each resource by current population: Step vii/PO. Result: $/person.

Draft deliberative document – For discussion purposes only – Do not release under FOIA
18
ix. Total cost per person up to installation’s capacity threshold: Calculate the total resource cost per person (CPIT) at the capacity threshold the installation as a whole can support. CPIT = CPE + CPNG + CPPW + CPNPW + CPIW + CPMW + CPSW + CPTL. Result: $/person
x. Total annual cost at an installation’s capacity threshold: Calculate the total annual cost for all resources at an installation’s capacity threshold (APIT). Multiply the total cost per person by the maximum number of persons that can be supported at an installation’s capacity threshold. APIT = (CPIT) x (PPIT). Result: dollars
xi. Review of Data Integrity: The data reported from the TABS data calls and preliminary results of applying the methodology are reviewed to identify potential anomalies. Those cases with anomalies are flagged to enable TABS to further examine and verify the reported data.
B. Data review process
There was a multi-step process used to review and “scrub” the data that came in from the data calls. The first focused on the inputs - the data was reviewed for completeness and reasonableness. The data was checked by comparing it with the reliable, certifiable secondary sources detailed below. The second stage focused on the outputs from the evaluation using the data – if the calculations produced a result where the personnel currently stationed at an installation exceeded what was determined to be the maximum at the capacity threshold – there a problem but the cause of it was not readily apparent. After going through these first two steps with the results from the initial data call, data was coded and flagged to TABS so that the data could be checked, changed or verified at the installation level. This initial data screen produced the following results: the data was coded using 1-5 based on the following criteria:
Data Used (0) – All cells contained data that were supported by alternative sources or that appeared reasonable relative to other reported values. Data Apparently Too High (1) or Too Low (2) – The reported value was 20 percent higher or lower than values shown in alternative sources.
Should Not Be Zero (3) – Based on an evaluation of alternative data sources, a data element contained a zero and should contain a value.
Scale Issue (4) – Based on an evaluation of alternative data sources, the value was reported with an incorrect unit of measure (i.e. millions instead of thousands).
Draft deliberative document – For discussion purposes only – Do not release under FOIA
19
Data Call1 does not agree with Data Call 2 (5) – For the same data element different data values were reported for Data Call #1 and Data Call #2.
The data was compared against available, defensible sources. The sources used for comparison were: IFS, ISR, DUERS, and ITAM.
IFS: Integrated Facilities System – This system is the official inventory for all Army real property. Data was used to validate existence or non-existence of utility systems and their relative size at individual installations.
ISR: Installation Status Report - This annual report provides a systematic process of evaluating the status of installations by measuring their performance against a set of Army-wide standards. It also assists in justifying and allocating resources, both now and in the future. The ISR consists of three parts: Infrastructure, Environment and Services. Only ISR Services was used for the data validation. System capacity data was used to compare the relative size of the system with the capacity data provided by the data calls. DUERS: Defense Utility and Energy Reporting System – This annual report provides information on energy usage by individual installation. This data was used for comparison with the data provided by the data calls.
ITAM: Integrated Training Area Management - ITAM establishes a systematic framework for decision-making and management of Army training lands. It integrates elements of operational, environmental, master planning, and other programs that identify and assess land use alternatives. There are four components of ITAM: Land Condition Trend Analysis (LCTA), Training Requirements Integration (TRI), Land Rehabilitation and Maintenance (LRAM), and Sustainable Range Awareness (SRA).
After this initial evaluation was completed, each installation’s data condition coded by a red, green, amber, or yellow was defined. While this coding is still contained in the IREM model, the final model outputs contain all installations regardless of data condition. Of the 88 installations reviewed, they were initially coded as follows:
§ 56 were coded red:. These installations had either a) missing cost, usage or capacity data and there was no defensible secondary source to use; or b) the reported data was significantly different then the expected range and no defensible secondary source was available.
§ 8 were coded green: These installations had both a) complete and apparently reasonable reported cost and usage data, and b) the capacity threshold analysis performed indicated no apparent problems with the data. (The threshold analysis concluded that more soldiers could be stationed at the capacity threshold than are currently there.)

Draft deliberative document – For discussion purposes only – Do not release under FOIA
20
§ 10 were coded amber: These installations had both a) reported data that appeared to have problems but could be addressed by changes to scale or use of defensible secondary sources, and b) the capacity threshold analysis performed indicated no apparent problems with the data.
§ 14 were coded yellow: These installations had a) reported data that appeared reasonable or b) defensible secondary sources were available for the reported data that appeared questionable or was missing but c) the installations failed the capacity threshold analysis - the analysis indicated that the personne l stationing capability at the capacity threshold would be lower than the current stationing. Some not readily apparent data problem is revealed by the analysis.
After this initial screening was done, the problems were reported to TABS who flagged these issues to the installations and sought confirmation, changes or explanation of the apparent data problems. The results of this new data inquiry were incorporated into the model and used for the final analysis. Note that there are no amber installations in the final assessment. After the data were refreshed, 6 installations were recoded green and 4 were recoded red. Based on the updated data, the state of the installations using the color coding system is:
§ 55 were coded “red”.
§ 26 were coded “green”:
§ 7 were coded “yellow”:
This is the state of the data for the final runs presented in this report in the next section. The date of the runs is July 6, 2004 and the data were pulled from Data Call 1 on June 23, 2004 and Data Call 2 June 9, 2004. Appendix D lists the installations with their color coding for data condition as of July 6, 2004.

Draft deliberative document – For discussion purposes only – Do not release under FOIA
21
IV. IREM Model Outputs and Results A. Model Results The IREM model is a Microsoft Excel spreadsheet model that uses data provided by TABS. The data used to generate the outputs in this analysis were pulled from the Data Call 1 (DC1) database on June 23, 2004 and from the Data Call 2 (DC2) database June 9, 2004. These results were generated for all installations where data was provided regardless of the current data condition. As noted, Appendix D details the color coding of the installations for their data condition used for this run. The model uses the data from DC1 and DC2 and:
1) Calculates each resource’s costs per person
2) Calculates each resource’s usage per person
3) Calculates the maximum number of personnel supported by each resource
4) Selects the constraining resource and determines the maximum personnel supported at the installation
5) Calculates the total cost per person for all resources
6) Calculates the total annual costs for the maximum number of personnel that the installation can support.
The outputs are generated for 88 installations and include the annual resource cost per person at an installation’s capacity threshold and the total the number of personnel at capacity threshold. These outputs may then be used to conduct further analysis. The following Table A shows the calculated the Maximum Number of Personnel at Capacity Threshold, and the Total Annual Costs at Capacity Threshold for each installation. These are sorted in descending order ranked by the maximum number of personnel.

- 22 -
Installation Name Cost ($K) Personnel Fort Sam Houston 46,328 85,430 Fort Bragg 37,388 73,176 Fort Benning 1,143,022 72,706 Fort Stewart 52,293 71,085 Fort Campbell 42,379 62,599 Fort Monmouth 6,941 62,455 Fort Hood 48,209 56,588 Aberdeen Proving Ground 61,727 55,178 Fort Sill 19,658 52,962 Fort Leonard Wood 16,254 49,303 Fort Meade 9,493 44,975 Redstone Arsenal 39,163 42,576 Fort Gillem 16,029 42,016 Fort Bliss 24,763 41,892 Fort Drum 30,606 40,612 Fort Knox 22,023 40,450 Fort Lewis 32,535 40,096 Fort Rucker 20,204 38,672 Fort Gordon 13,427 36,185 Fort Eustis 17,152 35,418 Fort Huachuca 20,157 34,045 Fort McPherson 13,492 30,889 Fort Dix 54,541 26,766 Fort Carson 20,899 25,681 Schofield Barracks 15,673 24,527 Fort Leavenworth 16,733 23,803 West Point Mil Res 24,458 20,763 White Sands Missile 21,566 17,925 Corpus Christi 32,098 16,847 Fort McNair 7,807 10,504 Fort Richardson 9,687 10,309 Fort McCoy 14,486 9,311 Fort Detrick 13,146 8,765 Fort Polk 6,589 8,676 Fort Lee 3,759 8,584 Fort Buchanan 6,535 6,842 Picatinny Arsenal 14,536 6,610 Watervliet Arsenal 27,358 6,221 Detroit Arsenal 3,762 6,145 Anniston Army Depot 15,341 6,102 Fort Wainwright 2,017 5,995 Rock Island Arsenal 2,626 5,856 Military Ocean Terminal 3,096 5,647 Fort Hamilton 5,399 5,552
Installation Name Cost ($K) Personnel Tobyhanna Army Depot 8,939 5,536 Lake City AAP 9,559 5,416 Presidio of Montery 2,078 5,091 Red River Army Depot 9,148 4,786 Charles E Kelly Spt 3,857 4,685 Tripler Army Medical Ctr 6,282 4,646 Carlisle Barracks 4,581 4,598 Yuma Proving Ground 2,397 4,194 Fort Shafter 3,079 4,129 Soldier Systems Ctr 4,597 4,067 Letterkenny Army Depot 4,242 3,743 Pine Bluff Arsenal 9,800 3,601 Sierra Army Depot 9,032 3,433 Dugway Proving Ground 2,362 2,758 US Army Garrison S 2,998 2,705 McAlester AAP 3,809 2,695 NTC and Fort Irwin 193,446 2,479 Lima Army Tank Plt 8,698 2,424 Fort AP Hill 3,762 2,140 Tooele Army Depot 1,766 1,969 Adelphi Laboratory 4,253 1,532 Fort Riley 790 1,428 Fort Belvoir 756 1,396 Blue Grass Army Depot 1,531 1,265 Fort Monroe 613 929 Milan AAP 2,474 928 Hawthorne Army Depot 792 805 Lone Star AAP 2,942 589 Kansas AAP 2,692 532 Fort Jackson 103 525 Scranton AAP 5,669 464 Mississippi AAP 5,566 289 Crane Army Amm 3,390 201 Umatilla Chem Depot 673 194 Radford AAP 657 188 Iowa AAP 240 143 Newport Chem Depot 28 56 Walter Reed AMC 120 54 Fort Myer 35 33 Pueblo Chem Depot 19 23 Holston AAP 90 9 Deseret Chem Depot 7 5 Riverbank AAP 8 3 Louisiana AAP 2 2
TABLE C Maximum Personnel and Total Annual Costs at Capacity Threshold
- 23 -
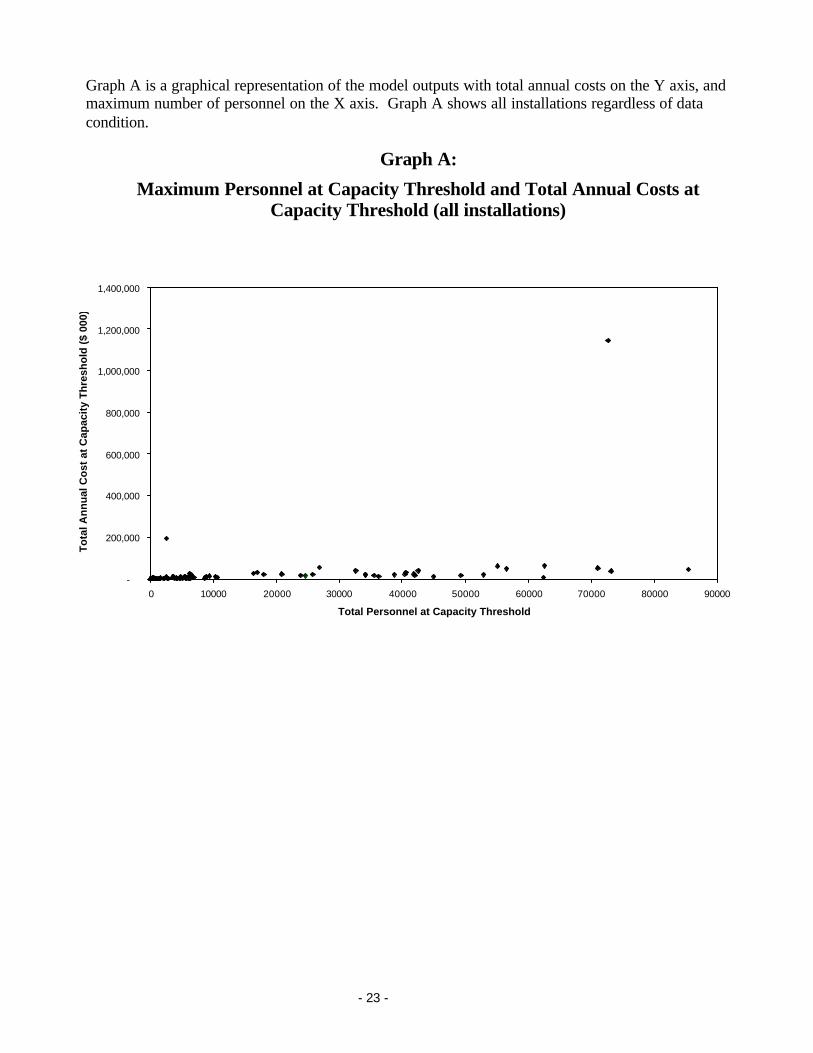
Graph A is a graphical representation of the model outputs with total annual costs on the Y axis, and maximum number of personnel on the X axis. Graph A shows all installations regardless of data condition.
Graph A:
Maximum Personnel at Capacity Threshold and Total Annual Costs at Capacity Threshold (all installations)
-
200,000
400,000
600,000
800,000
1,000,000
1,200,000
1,400,000
0 10000 20000 30000 40000 50000 60000 70000 80000 90000
Total Personnel at Capacity Threshold
To
tal A
nn
ual
Co
st a
t C
apac
ity
Th
resh
old
($
000)
Draft deliberative document – For discussion purposes only – Do not release under FOIA
24
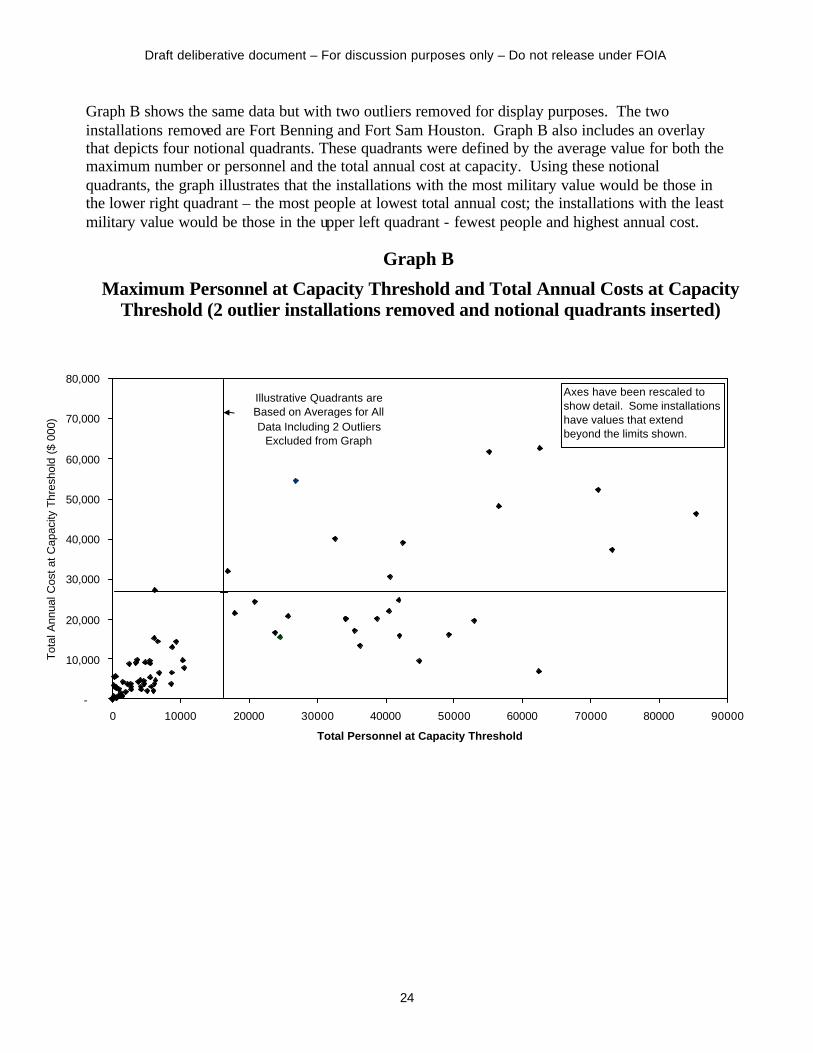
Graph B shows the same data but with two outliers removed for display purposes. The two installations removed are Fort Benning and Fort Sam Houston. Graph B also includes an overlay that depicts four notional quadrants. These quadrants were defined by the average value for both the maximum number or personnel and the total annual cost at capacity. Using these notional quadrants, the graph illustrates that the installations with the most military value would be those in the lower right quadrant – the most people at lowest total annual cost; the installations with the least military value would be those in the upper left quadrant - fewest people and highest annual cost.
Graph B
Maximum Personnel at Capacity Threshold and Total Annual Costs at Capacity Threshold (2 outlier installations removed and notional quadrants inserted)
-
10,000
20,000
30,000
40,000
50,000
60,000
70,000
80,000
0 10000 20000 30000 40000 50000 60000 70000 80000 90000
Total Personnel at Capacity Threshold
Tot
al A
nnua
l Cos
t at C
apac
ity T
hres
hold
($
000)
Illustrative Quadrants are Based on Averages for All Data Including 2 Outliers
Excluded from Graph
Axes have been rescaled to show detail. Some installations have values that extend beyond the limits shown.
Draft deliberative document – For discussion purposes only – Do not release under FOIA
25
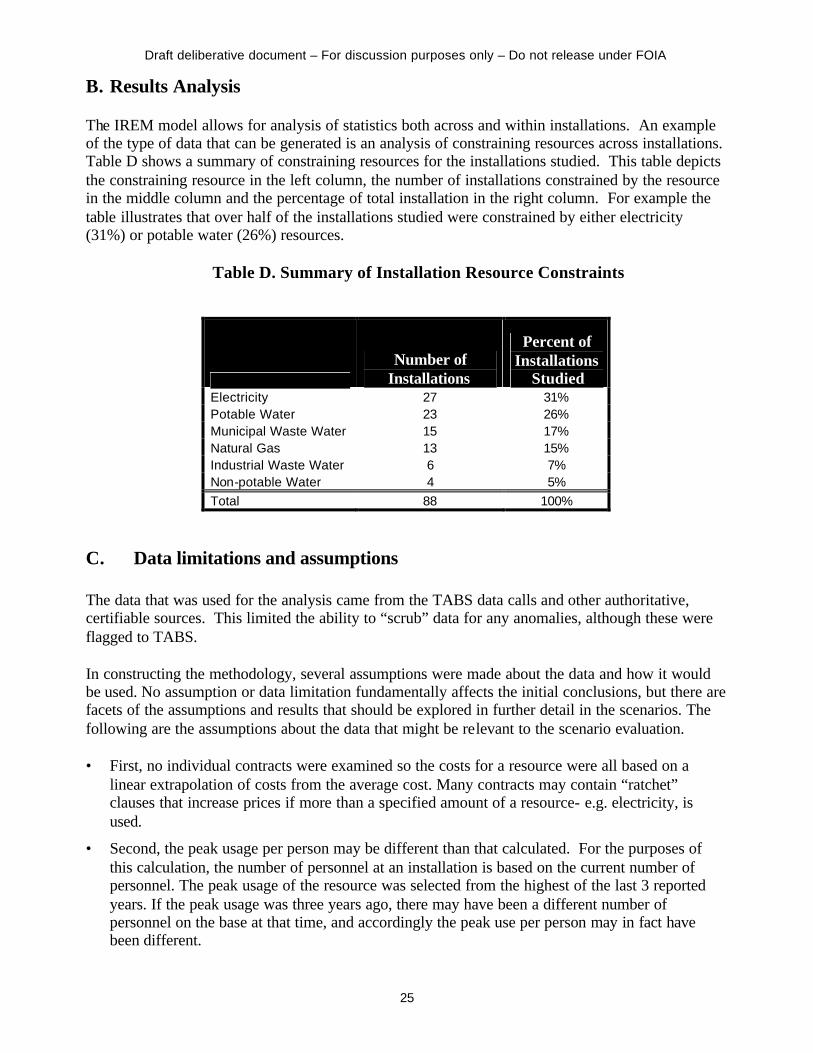
B. Results Analysis The IREM model allows for analysis of statistics both across and within installations. An example of the type of data that can be generated is an analysis of constraining resources across installations. Table D shows a summary of constraining resources for the installations studied. This table depicts the constraining resource in the left column, the number of installations constrained by the resource in the middle column and the percentage of total installation in the right column. For example the table illustrates that over half of the installations studied were constrained by either electricity (31%) or potable water (26%) resources.
Table D. Summary of Installation Resource Constraints
Number of Installations
Percent of Installations
Studied Electricity 27 31% Potable Water 23 26% Municipal Waste Water 15 17% Natural Gas 13 15% Industrial Waste Water 6 7% Non-potable Water 4 5% Total 88 100%
C. Data limitations and assumptions The data that was used for the analysis came from the TABS data calls and other authoritative, certifiable sources. This limited the ability to “scrub” data for any anomalies, although these were flagged to TABS. In constructing the methodology, several assumptions were made about the data and how it would be used. No assumption or data limitation fundamentally affects the initial conclusions, but there are facets of the assumptions and results that should be explored in further detail in the scenarios. The following are the assumptions about the data that might be relevant to the scenario evaluation. • First, no individual contracts were examined so the costs for a resource were all based on a
linear extrapolation of costs from the average cost. Many contracts may contain “ratchet” clauses that increase prices if more than a specified amount of a resource- e.g. electricity, is used.
• Second, the peak usage per person may be different than that calculated. For the purposes of this calculation, the number of personnel at an installation is based on the current number of personnel. The peak usage of the resource was selected from the highest of the last 3 reported years. If the peak usage was three years ago, there may have been a different number of personnel on the base at that time, and accordingly the peak use per person may in fact have been different.

Draft deliberative document – For discussion purposes only – Do not release under FOIA
26
In addition, the methodology assumes that the resource use per person for additional personnel remains the same as for existing personnel. This assumes that the type of function performed on the installation by the new or added personnel is consistent with that being performed currently.
• Third, the total annual costs may be different than that calculated. The methodology chose the costs from the peak year that was evaluated to determine cost per person for the resource. If that peak year was three years ago, there may have been significant rate increases since that time.
• Fourth, it was assumed for purposes of electricity, natural gas and water that the installation was “networked”. All substations that served an installation, or transmission lines or pipelines that came into it, were summed to determine the entire installation capacity threshold. It was assumed that these could serve anywhere on the installation.
• Fifth, for a few installations, there was an apparent “unconstrained” resource because no resource use, costs or capacity restriction was reported due to their relationship with a larger entity- such as another base. This other base was the reporting entity for the resource - and there may indeed be capacity restrictions on it.
• Sixth, the actual costs for some resources such as those for electricity, (MW), and natural gas, (MCF), reflect a blend of the costs for both peak use and consumption. In the analysis, all these costs were assigned to the peak usage. The costs presented therefore may not correspond to actual costs on billing information.
• Seventh, the hard capacity constraint presented is a real one. However, it is recognized that a small amount of additional personnel may be added by “stretching” the capacity of the resource to support additional personnel through low cost measures- such as additional efficiency improvements for electricity use; or perhaps obtaining additional permits for water use. The amounts and costs of this “stretch” capacity were not evaluated.
• Eighth, training land and solid waste were not considered as constrained resources. It is recognized that training land in particular is an environmental resource that is critically important to the Army that is realistically constrained. However, other projects underway are designed to address this. In addition, training land was only analyzed for maintenance costs, and the costs evaluated were only current expenditures - not the amount of money need to bring the land up to specified conditions. For solid waste, the assumption of a linear extrapolation of costs should be noted. If the material must be hauled much further than it currently is, costs may be higher than currently paid and a linear extrapolation would be incorrect.

Draft deliberative document – For discussion purposes only – Do not release under FOIA
27
V. IREM Model Input to Military Value Analysis
The results developed in this project are the environmental elasticity inputs to the model for military value that will be used by TABS. The calculated results and inputs to the military value model for each installation are the Maximum Number of Personnel at Capacity Threshold (PPIT), and the Total Annual Cost at Capacity Threshold (APIT). Value Function The value function plots Maximum Number of Personnel at Capacity Threshold and Total Annual Costs at Capacity Threshold into the matrix below resulting in a military value for the installation. The matrix below is illustrative – the actual breakpoint values for the columns and rows will be established after reviewing the output data.
The Maximum value of 10 will be given to the installations with the largest populations at the lowest total annual costs. The Minimum value of 0 will be given to the installations with the smallest populations at the highest total annual costs. The assessment of the function is determined by TABS and coordinated with the Army Environmental Policy Institute (AEPI). The value function will provides the military value of the installation with regards to the environmental elasticity. The scores will be normalized on a scale of zero to ten based on the value function.
Cost ($K) <=1000 <=20000 >20000>10000 Label 1 Label 2 Label 3<=10000 Label 4 Label 5 Label 6<=2500 Label 7 Label 8 Label 9
Capacity Threshold (Persons)

Draft deliberative document – For discussion purposes only – Do not release under FOIA
28
VI. IREM Model Additional Capabilities In addition to the outputs required to conduct the Military Value Analysis, the IREM Model has the ability to generate multiple outputs depending on the analytical requirement. This model can provide: § Additional Personnel Assessment (APA): The Additional Personnel Assessment Metric
measures an installation’s average resource cost per person at its capacity threshold compared to the number of additional personnel that can be added from the current population until the capacity threshold is reached.
§ Traditional Elasticity Measurements. The total annual costs at the capacity threshold
minus the total annual current costs divided by the number of personnel at the capacity threshold minus the current personnel. This metric was investigated but discarded since there is a linear relation between additional personnel and additional costs. This metric can be used and is useful for all non- linear input data.
§ Derived Unit Resource Costs. A calculation of the costs per physical unit for each
capacity constrained resource up to the resource’s individual physical capacity threshold. These measures show the derived costs for each (constrained) resource and the number of personnel supported at each resource's capacity threshold. The resource costs are expressed in terms of $ per resource metric (e.g., $/kW) for each installation.
§ Per Person Resource Costs. A calculation of the annual costs person for each capacity
constrained resource up to the resource’s individual physical capacity threshold § Resource Constraints and Capacity Factors. An indicator of the binding resource
constraint at each installation. This measure can shows the resource surpluses by installation (measured in units or people) and the percentage of the resource currently being utilized.
§ New Resource Assessments. This project evaluated only four specified resources – 1)
energy (electricity and natural gas); 2) water (potable and non-potable) and wastewater (industrial and municipal); 3) solid waste and 4) maintained training land. Only two of these - energy, and water and wastewater - were deemed to have capacity restrictions. The model may evaluate other resources - which could include a capacity constrained land resource or other resources such as regional air quality emission restrictions.
§ Stretch Capacity Assessment. The model also has the capability to estimate the number of
additional personnel that can be absorbed by an installation by stretching or increasing capacity through initiatives such as low cost efficiency or conservation programs. For example, an installation constrained by potable water may be able to increase its capacity to support additional personnel through various water conservation measures. No data was collected during the course of this project to calculate or analyze increases in resource capacities.

- 29 -
Appendix A Resource Infrastructure and Processing Process Flows

- 30 -

- 31 -

- 32 -

- 33 -

- 34 -

- 35 -
Appendix B
Calculations for Physical Capacity Thresholds
Energy
Electricity
1) Dedicated Substations
From Q 816: add the KW for all dedicated substations serving the whole installation.
From Q 816: add the KW for all transmission lines listed for each dedicated substation.
The lower of these numbers is the capacity limit of the dedicated substations serving the installation.
2) Non Dedicated Substations
From Q 817: for the year with the highest peak day, subtract the KW peak demand from the KW capacity rating for each substation listed. Add the differences for each non-dedicated substation listed.
3) Add results from 1) and 2) to determine the physical capacity threshold for electricity.
Natural Gas:
From Q819 sum the capacity of all the natural gas pipelines servicing the whole installation to determine the capacity threshold.
Water
Potable:
From Q 291 for each water source select the lowest of either design or permitted maximum daily production capacity. Add the selected maximum daily production capacity from each water source to establish the installation capacity threshold for potable water.
Non-potable:
From Q 287 sum the maximum daily production capacity from each water source to establish the installation capacity threshold for non-potable water.
Wastewater
Municipal (sanitary sewage):
From Q297 for each plant or system select the lowest of either design or permitted maximum daily treatment processing capacity. Add the selected maximum daily treatment processing capacity from each plant or system to establish the installation capacity threshold for municipal wastewater.

Draft deliberative document – For discussion purposes only – Do not release under FOIA
36
Industrial:
From Q282 for each plant or system select the lowest of either design or permitted maximum daily treatment processing capacity. Add the selected maximum daily treatment processing capacity from each plant or system to establish the installation capacity threshold for industrial wastewater.
- 37 -
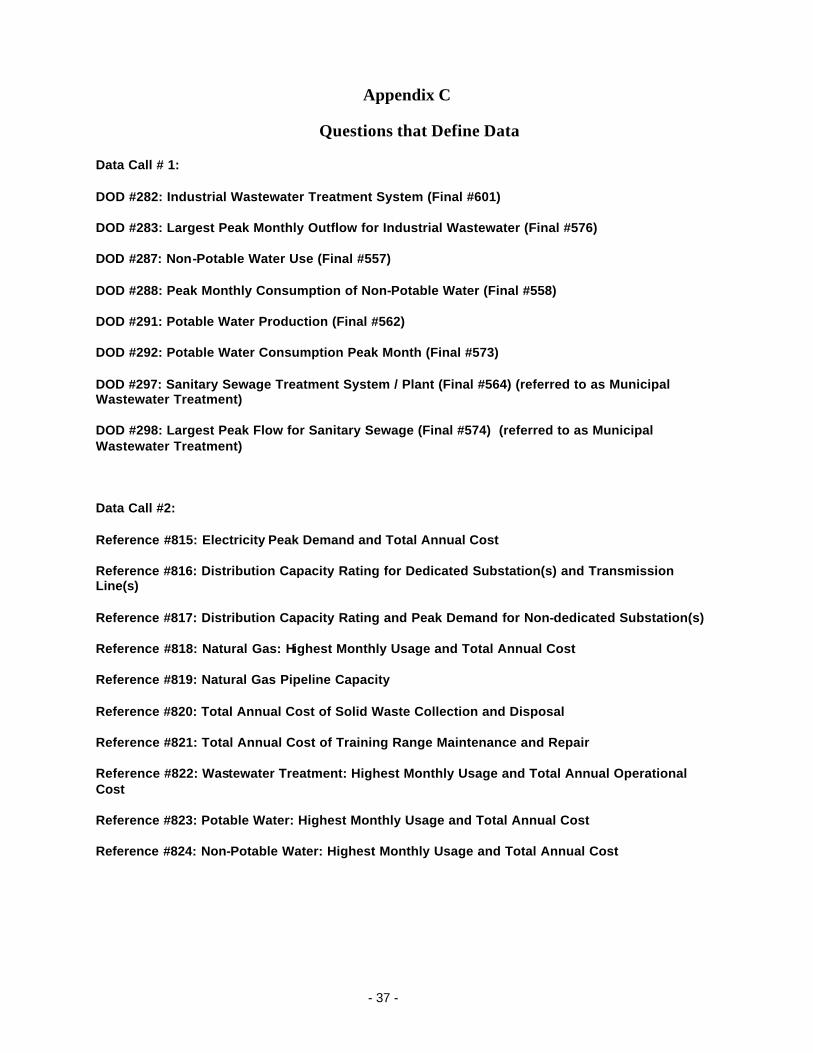
Appendix C
Questions that Define Data
Data Call # 1:
DOD #282: Industrial Wastewater Treatment System (Final #601)
DOD #283: Largest Peak Monthly Outflow for Industrial Wastewater (Final #576)
DOD #287: Non-Potable Water Use (Final #557)
DOD #288: Peak Monthly Consumption of Non-Potable Water (Final #558)
DOD #291: Potable Water Production (Final #562)
DOD #292: Potable Water Consumption Peak Month (Final #573)
DOD #297: Sanitary Sewage Treatment System / Plant (Final #564) (referred to as Municipal Wastewater Treatment)
DOD #298: Largest Peak Flow for Sanitary Sewage (Final #574) (referred to as Municipal Wastewater Treatment)
Data Call #2:
Reference #815: Electricity Peak Demand and Total Annual Cost
Reference #816: Distribution Capacity Rating for Dedicated Substation(s) and Transmission Line(s)
Reference #817: Distribution Capacity Rating and Peak Demand for Non-dedicated Substation(s)
Reference #818: Natural Gas: Highest Monthly Usage and Total Annual Cost
Reference #819: Natural Gas Pipeline Capacity
Reference #820: Total Annual Cost of Solid Waste Collection and Disposal
Reference #821: Total Annual Cost of Training Range Maintenance and Repair
Reference #822: Wastewater Treatment: Highest Monthly Usage and Total Annual Operational Cost
Reference #823: Potable Water: Highest Monthly Usage and Total Annual Cost
Reference #824: Non-Potable Water: Highest Monthly Usage and Total Annual Cost

Draft deliberative document – For discussion purposes only – Do not release under FOIA
38
DOD #282: Industrial Wastewater Treatment System (Final #601) JCSG: Environment Index: Environment and Encroachment: Environment: Water Resources: Industrial Wastewater Sub Group: Environmental Theme: Environment Question: If the installation has an industrial wastewater treatment system, complete the table for FY 2003: Amplification: permitted capacity = NPDES or other applicable permit Provide the peak monthly outflow/amount treated as derived in each applicable category (government owned plant/wells, privatized plant/wells, and/or publicly owned/commercial source). For treatment/processing purchased from off-base resources or accomplished from on-base privatized resources, “Permitted Daily Treatment/System Capacity ” is the maximum daily volume of industrial wastewater that can be treated/accepted without additional cost over the basic rate or without violating a permit. For industrial wastewater treated/processed by government-owned plants, “Maximum Daily treatment/System Capacity (Design)” is the maximum sustained volume of sewage the plant can process/treat per day. DO NOT consider manpower limitations; rather consider plant/physical limitations only. For off-base treatment facilities, "Maximum Daily Treatment/System Capacity (design)" the design capacity of the sewer at the service connection. Column Headings for this question Column names Data
Type Source/Reference Amplification
Name (System Identifier) (Text) string50 Location (List) (List Values: On Military Installation Govt Owned Plant, On Military Installation Govt Privatized Plant, Off Military Installation Publicly Owned Plant, Off Military Installation Commercial Source)
multiple choice
Peak Monthly Outflow/Treated (MGM) numeric Maximum Peak Daily Outflow/Treated (MGD) numeric Permitted Daily Treatment/System Capacity (MGD) numeric Maximum Daily Treatment/System Capacity (Design) (MGD)
numeric

- 39 -
DOD #283: Largest Peak Monthly Outflow for Industrial Wastewater (Final #576) JCSG: Environment Index: Environment and Encroachment: Environment: Water Resources: Industrial Wastewater Sub Group: Environmental Theme: Environment Question: For the period FY 1999-2003, provide the month, year and volume of largest peak monthly outflow of Industrial Wastewater. Source / Reference: Installation DUERS Report. For Air Force installations, an additional source may be AF Form 3552 Amplification: GENERAL NOTE: Include utilities data for the entire installation, including service to military family housing (MFH). Consult with the Maintenance Engineer and/or Utilities Engineer in the host Civil Engineer squadron for data. Example of how your grid will look Peak Date (MM/YY) Peak (MGM) Largest Peak Monthly Outflow
- 40 -
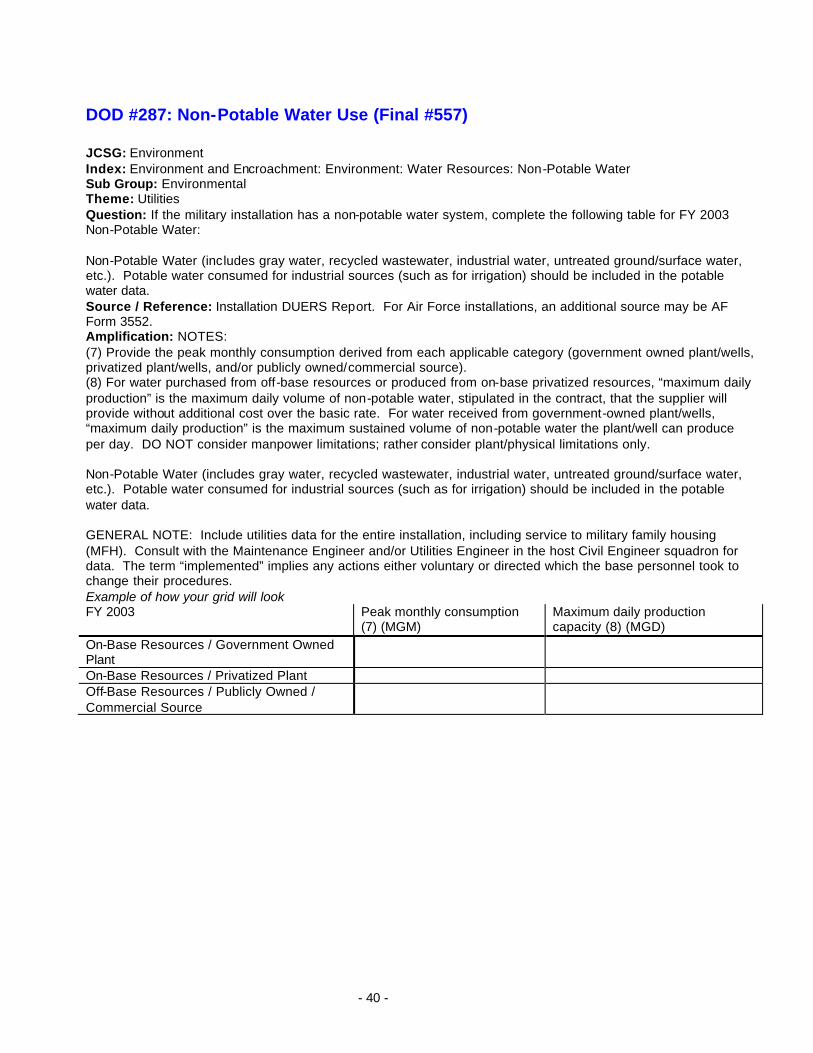
DOD #287: Non-Potable Water Use (Final #557) JCSG: Environment Index: Environment and Encroachment: Environment: Water Resources: Non-Potable Water Sub Group: Environmental Theme: Utilities Question: If the military installation has a non-potable water system, complete the following table for FY 2003 Non-Potable Water: Non-Potable Water (includes gray water, recycled wastewater, industrial water, untreated ground/surface water, etc.). Potable water consumed for industrial sources (such as for irrigation) should be included in the potable water data. Source / Reference: Installation DUERS Report. For Air Force installations, an additional source may be AF Form 3552. Amplification: NOTES: (7) Provide the peak monthly consumption derived from each applicable category (government owned plant/wells, privatized plant/wells, and/or publicly owned/commercial source). (8) For water purchased from off-base resources or produced from on-base privatized resources, “maximum daily production” is the maximum daily volume of non-potable water, stipulated in the contract, that the supplier will provide without additional cost over the basic rate. For water received from government-owned plant/wells, “maximum daily production” is the maximum sustained volume of non-potable water the plant/well can produce per day. DO NOT consider manpower limitations; rather consider plant/physical limitations only. Non-Potable Water (includes gray water, recycled wastewater, industrial water, untreated ground/surface water, etc.). Potable water consumed for industrial sources (such as for irrigation) should be included in the potable water data. GENERAL NOTE: Include utilities data for the entire installation, including service to military family housing (MFH). Consult with the Maintenance Engineer and/or Utilities Engineer in the host Civil Engineer squadron for data. The term “implemented” implies any actions either voluntary or directed which the base personnel took to change their procedures. Example of how your grid will look FY 2003 Peak monthly consumption
(7) (MGM) Maximum daily production capacity (8) (MGD)
On-Base Resources / Government Owned Plant
On-Base Resources / Privatized Plant Off-Base Resources / Publicly Owned / Commercial Source

- 41 -
DOD #288: Peak Monthly Consumption of Non-Potable Water (Final #558) JCSG: Environment Index: Environment and Encroachment: Environment: Water Resources: Non-Potable Water Sub Group: Environmental Theme: Utilities Question: For the period FY 1999-2003, provide the month, year and volume of largest peak monthly consumption of Non-Potable Water. Source / Reference: Installation DUERS Report. For Air Force installations, an additional source may be AF Form 3552. Amplification: Non-Potable Water (includes gray water, recycled wastewater, industrial water, untreated ground/surface water, etc.). Potable water consumed for industrial sources (such as for irrigation) should be included in the potable water data. GENERAL NOTE: Include utilities data for the entire installation, including service to military family housing (MFH). Consult with the Maintenance Engineer and/or Utilities Engineer in the host Civil Engineer squadron for data. The term “implemented” implies any actions either voluntary or directed which the base personnel took to change their procedures. Example of how your grid will look Peak Date (MM/YY) Volume (MG) Largest Peak Monthly Consumption
- 42 -
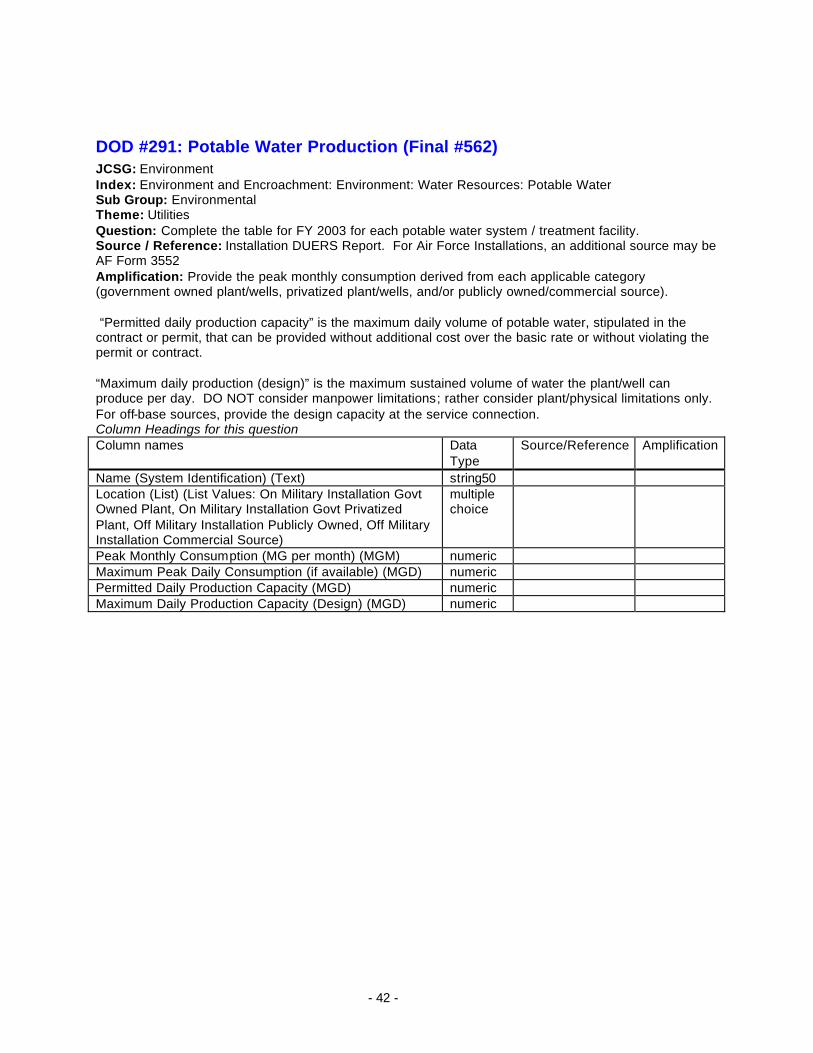
DOD #291: Potable Water Production (Final #562) JCSG: Environment Index: Environment and Encroachment: Environment: Water Resources: Potable Water Sub Group: Environmental Theme: Utilities Question: Complete the table for FY 2003 for each potable water system / treatment facility. Source / Reference: Installation DUERS Report. For Air Force Installations, an additional source may be AF Form 3552 Amplification: Provide the peak monthly consumption derived from each applicable category (government owned plant/wells, privatized plant/wells, and/or publicly owned/commercial source). “Permitted daily production capacity” is the maximum daily volume of potable water, stipulated in the contract or permit, that can be provided without additional cost over the basic rate or without violating the permit or contract. “Maximum daily production (design)” is the maximum sustained volume of water the plant/well can produce per day. DO NOT consider manpower limitations; rather consider plant/physical limitations only. For off-base sources, provide the design capacity at the service connection. Column Headings for this question Column names Data
Type Source/Reference Amplification
Name (System Identification) (Text) string50 Location (List) (List Values: On Military Installation Govt Owned Plant, On Military Installation Govt Privatized Plant, Off Military Installation Publicly Owned, Off Military Installation Commercial Source)
multiple choice
Peak Monthly Consumption (MG per month) (MGM) numeric Maximum Peak Daily Consumption (if available) (MGD) numeric Permitted Daily Production Capacity (MGD) numeric Maximum Daily Production Capacity (Design) (MGD) numeric

- 43 -
DOD #292: Potable Water Consumption Peak Month (Final #573) JCSG: Environment Index: Environment and Encroachment: Environment: Water Resources: Potable Water Sub Group: Environmental Theme: Utilities Question: For the period FY 1999-2003, provide the month, year and volume of largest peak monthly consumption of Potable Water. Source / Reference: Installation DUERS Report. For Air Force installation, an additional source may be AF Form 3552. Amplification: GENERAL NOTE: Include utilities data for the entire installation, including service to military family housing (MFH). Consult with the Maintenance Engineer and/or Utilities Engineer in the host Civil Engineer squadron for data. The term “implemented” implies any actions either voluntary or directed which the base personnel took to change their procedures. Example of how your grid will look Peak Date (MM/YY) Volume (MGM) Largest Peak Monthly Consumption

- 44 -
DOD #297: Sanitary Sewage Treatment System / Plant (Final #564) JCSG: Environment Index: Environment and Encroachment: Environment: Water Resources: Sanitary Sewage Treatment Sub Group: Environmental Theme: Utilities Question: Complete the following table for FY 2003 for each sanitary sewer system / treatment plant for the military installation. Source / Reference: Installation DUERS Report. For Air Force installations, also use AF Form 3552. Amplification: Provide the peak monthly outflow/amount treated as derived in each applicable category (government owned plant/wells, privatized plant/wells, and/or publicly owned/commercial source). Peak monthly outflow/treated equals the largest monthly total for the period of FY2003. “Permitted daily treatment/processing capacity” is the maximum daily volume of sanitary sewage, stipulated in the contract or permit, that may be treated/processed without additional cost over the basic rate and without violating the permit/contract. “Maximum daily treatment/processing capacity” is the maximum sustained volume of sewage the plant or system can process/treat/deliver per day. DO NOT consider manpower limitations; rather consider plant/physical limitations only. If the treatment plant is located off of the military installation, use the design capacity of the sanitary sewer at the service connection. Column Headings for this question Column names Data
Type Source/Reference Amplification
Name (Site ID) (Text) string50 Location (List) (List Values: On Military Installation Govt Owned Plant, On Military Installation Privatized Plant, Off Military Installation Publicly Owned Plant, Off Military Installation Commercial Source)
multiple choice
Peak Monthly Outflow/Treated (MG per mont) (MGM) numeric Maximum Peak Daily Outfllow/Treated (MGD) numeric Permitted Daily Treatment/Processing Capacity (MGD) numeric Maximum daily treatment/processing capacity (Design) (MGD)
numeric

- 45 -
DOD #298: Largest Peak Flow for Sanitary Sewage (Final #574) JCSG: Environment Index: Environment and Encroachment: Environment: Water Resources: Sanitary Sewage Treatment Sub Group: Environmental Theme: Environment Question: For the period FY 1999-2003, provide the month, year, and volume of largest peak monthly outflow of sanitary sewer wastewater. Source / Reference: Installation DUERS Report. For Air Force installation, an additional source may be AF Form 3552. Amplification: GENERAL NOTE: Include utilities data for the entire installation, including service to military family housing (MFH). Consult with the Maintenance Engineer and/or Utilities Engineer in the host Civil Engineer squadron for data. The term “implemented” implies any actions either voluntary or directed which the base personnel took to change their procedures. Example of how your grid will look Peak Date (MM/YY) Volume (MGM) Largest Peak Monthly Outflow

- 46 -
Reference #815: Electricity Peak Demand and Total Annual Cost JCSG: Army Function(s): Environmental Elasticity Question: What was the highest kW demand for electricity on the installation on the peak day during each of the fiscal years: FY01, FY02, and FY03? What was the total annual electric cost in Thousands of Dollars for FY01, FY02, and FY03? Source / Reference: Local records. Amplification: Report Actual Dollars paid to the utilites supplier, do NOT adjust for inflation. Do NOT include any costs associated with the utility privatization process, or electricity from on-site generation. Check here if this question is Not Applicable (N/A): o Please fill in the following table(s) Fiscal Years of Concern Peak Demand Day (KiloWatts)
numeric Total Annual Cost ($K) numeric
FY01 FY02 FY03

- 47 -
Reference #816: Distribution Capacity Rating for Dedicated Substation(s) and Transmission Line(s) JCSG: Army Function(s): Environmental Elasticity Question: What is the kW capacity rating for each dedicated substation servicing the installation? What is the kW capacity rating for each transmission line from a dedicated substation(s) to the installation? Source / Reference: Local Utility Amplification: A dedicated substation provides service solely to the installation. Dedicated Substations may be on or off the installation, regardless of ownership (Commercial or Installation). For substations with more than one transmission line, it is necessary to repeat the substation's name multiple times. This will provide a separate listing for each transmission line associated with that substation. Check here if this question is Not Applicable (N/A): o Please fill in the following table(s), adding rows as necessary Dedicated SubStation Name (Text) string75
Substation Capacity Rating (KiloWatts) numeric
Transmission Line Identification (Text) string50
Transmission Line Capacity Rating (KiloWatts) numeric

- 48 -
Reference #817: Distribution Capacity Rating and Peak Demand for Non-dedicated Substation(s) JCSG: Army Function(s): Environmental Elasticity Question: If the installation is serviced by any substation(s) other than a dedicated substation, what is the kW capacity rating of each of the substation(s)? What is the greatest single peak demand from all users (all electric customers, including the installation, served by that substation) over the three year period FY01 – FY03? Source / Reference: Local Utility Amplification: A non-dedicated substation services other customers in addition to the installation. Check here if this question is Not Applicable (N/A): o Please fill in the following table(s), adding rows as necessary SubStation Name (Text) string75
Capacity Rating (KiloWatts) numeric
Greatest Peak Demand Day (KiloWatts) numeric
- 49 -
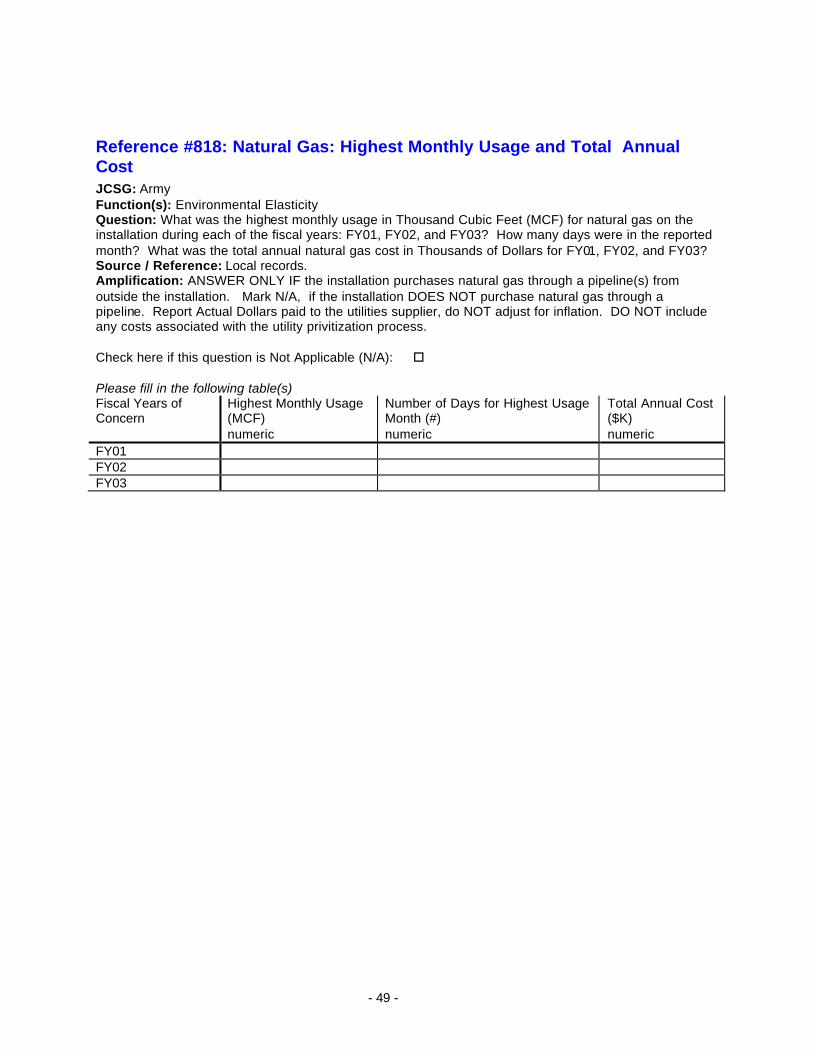
Reference #818: Natural Gas: Highest Monthly Usage and Total Annual Cost JCSG: Army Function(s): Environmental Elasticity Question: What was the highest monthly usage in Thousand Cubic Feet (MCF) for natural gas on the installation during each of the fiscal years: FY01, FY02, and FY03? How many days were in the reported month? What was the total annual natural gas cost in Thousands of Dollars for FY01, FY02, and FY03? Source / Reference: Local records. Amplification: ANSWER ONLY IF the installation purchases natural gas through a pipeline(s) from outside the installation. Mark N/A, if the installation DOES NOT purchase natural gas through a pipeline. Report Actual Dollars paid to the utilities supplier, do NOT adjust for inflation. DO NOT include any costs associated with the utility privitization process. Check here if this question is Not Applicable (N/A): o Please fill in the following table(s) Fiscal Years of Concern
Highest Monthly Usage (MCF) numeric
Number of Days for Highest Usage Month (#) numeric
Total Annual Cost ($K) numeric
FY01 FY02 FY03
Draft deliberative document – For discussion purposes only – Do not release under FOIA
50
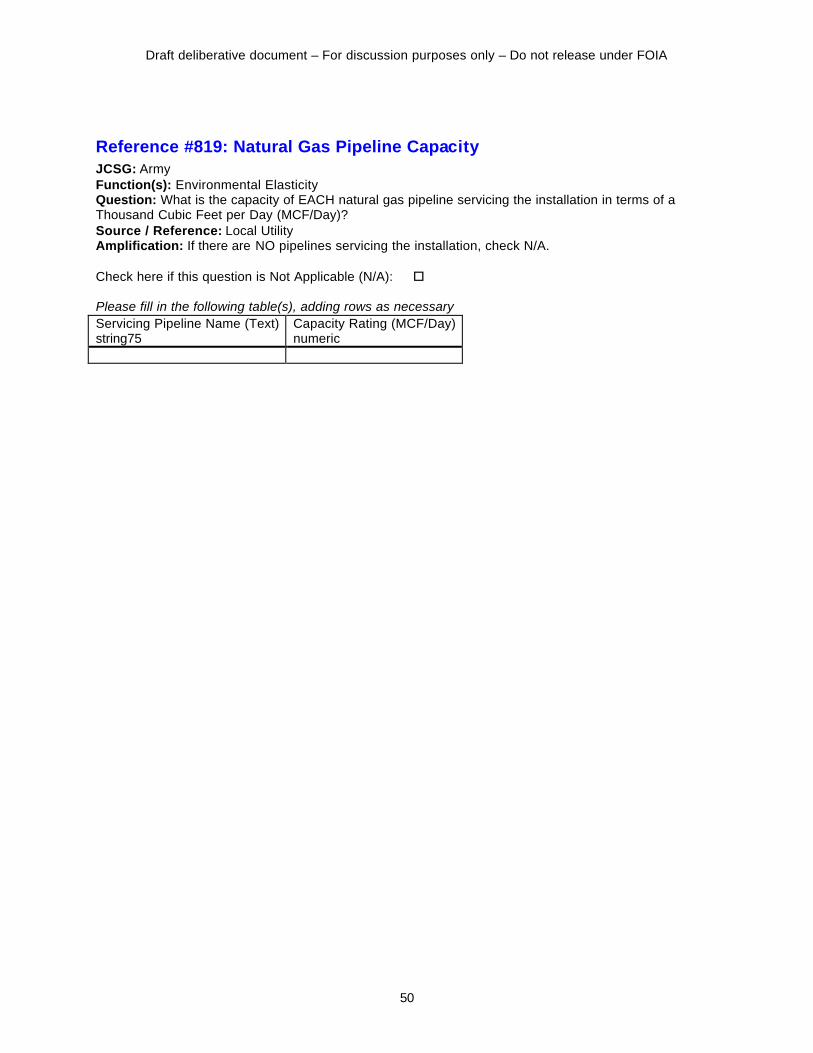
Reference #819: Natural Gas Pipeline Capacity JCSG: Army Function(s): Environmental Elasticity Question: What is the capacity of EACH natural gas pipeline servicing the installation in terms of a Thousand Cubic Feet per Day (MCF/Day)? Source / Reference: Local Utility Amplification: If there are NO pipelines servicing the installation, check N/A. Check here if this question is Not Applicable (N/A): o Please fill in the following table(s), adding rows as necessary Servicing Pipeline Name (Text) string75
Capacity Rating (MCF/Day) numeric

Draft deliberative document – For discussion purposes only – Do not release under FOIA
51
Reference #820: Total Annual Cost of Solid Waste Collection and Disposal JCSG: Army Function(s): Environmental Elasticity Question: What was the total annual cost for solid waste collection and disposal for each of the fiscal years: FY01, FY02, and FY03? Source / Reference: Local records. Amplification: Solid Waste refers to municipal waste, NOT hazardous waste, NOT construction debris, NOT demolition debris, and NOT recyclable waste. Costs include any contract costs as well as "in-house" costs such as maintaining and operating on-post sanitary landfills and installation collection and disposal costs, whether disposal is on or off post or both. Report Actual Dollars, do NOT adjust for inflation. Check here if this question is Not Applicable (N/A): o Please fill in the following table(s) Fiscal Years of Concern Total Annual Cost ($K)
numeric FY01 FY02 FY03

- 52 -
Reference #821: Total Annual Cost of Training Range Maintenance and Repair JCSG: Army Function(s): Environmental Elasticity Question: What was the total annual cost of Training Range maintenance and repair for fiscal year FY03? Source / Reference: Local records, LRAM and SRM Amplification: Training ranges include all areas owned or controlled by the installation which are used to conduct training, research and development, and test and evaluation of military hardware, personnel, tactics, munitions, explosives, or electronic combat systems. Include LRAM (or “LRAM equivalent”) and SRM maintenance and repair costs such as: Seeding, Grading, Clearing, Mowing, Berm Work, Vegetative Control, Erosion Control, Control Burning, and Pest Control. The costs DO NOT include maintenance for buildings or structures. Check here if this question is Not Applicable (N/A): o Please fill in the following table(s) Fiscal Years of Concern Total Annual Maintenance and Repair Cost ($K)
numeric FY03

Draft deliberative document – For discussion purposes only – Do not release under FOIA
53
Reference #822: Wastewater Treatment: Highest Monthly Usage and Total Annual Operational Cost JCSG: Army Function(s): Environmental Elasticity Question: What was the highest monthly usage in Million Gallons (MG) of domestic and industrial wastewater treatment on the installation during each of the fiscal years: FY01, FY02, and FY03? How many days were in the reported month? What was the total annual operational cost in Thousands of Dollars for FY01, FY02, and FY03? Source / Reference: Local records. Data Call-1, DoD #282 (Industrial Wastewater Treatment System), #297 (Sanitary Sewage Treatment System/Plant) Amplification: Report actual dollars, do NOT adjust for inflation. Costs include on or off-post treatment, by contract or in-house plant operations. DO NOT include any costs associated with the utility privitization process. Check here if this question is Not Applicable (N/A): o Please fill in the following table(s) Fiscal Years of Concern
Highest Monthly Domestic Wastewater Usage (MG) numeric
Number of Days for Highest Usage Month Domestic Wastewater (#) numeric
Annual Domestic Wastewater Cost ($K) numeric
Highest Monthly Industrial Wastewater Usage (MG) numeric
Number of Days for Highest Usage Month - Industrial Wastewater (#) numeric
Annual Industrial Wastewater Cost ($K) numeric
FY01 FY02 FY03

Draft deliberative document – For discussion purposes only – Do not release under FOIA
54
Reference #823: Potable Water: Highest Monthly Usage and Total Annual Cost JCSG: Army Function(s): Environmental Elasticity Question: What was the highest monthly usage in Million Gallons (MG) of POTABLE WATER on the installation during each of the fiscal years: FY01, FY02, and FY03? How many days were in the reported month? What was the total annual potable water cost in Thousands of Dollars for FY01, FY02, and FY03? Source / Reference: Local Records. Data Call-1, DoD #291 (Potable Water Production), #292 (Potable Water Consumption Peak Month) Amplification: Report actual dollars, DO NOT adjust for inflation. DO NOT include any costs associated with the utility privitization process. Potable water costs include the costs of potable water purchased from off-post potable water production and treatment. Check here if this question is Not Applicable (N/A): o Please fill in the following table(s) Fiscal Years of Concern
Highest Monthly Usage (MG) numeric
Number of Days for Highest Usage Month (#) numeric
Total Annual Cost ($K) numeric
FY01 FY02 FY03

Draft deliberative document – For discussion purposes only – Do not release under FOIA
55
Reference #824: Non-Potable Water: Highest Monthly Usage and Total Annual Cost JCSG: Army Function(s): Environmental Elasticity Question: What was the highest monthly usage in Million Gallons (MG) of NON-POTABLE WATER on the installation during each of the fiscal years: FY01, FY02, and FY03? How many days were in the reported month? What was the total annual non-potable water cost in Thousands of Dollars for FY01, FY02, and FY03? Source / Reference: Local Records. Data Call-1, DoD #287 (Non-Potable Water Use), #288 (Peak Monthly Consumption of Non-Potable) Amplification: Report actual dollars, DO NOT adjust for inflation. Check here if this question is Not Applicable (N/A): o Please fill in the following table(s) Fiscal Years of Concern
Highest Monthly Usage (MG) numeric
Number of Days for Highest Usage Month (#) numeric
Annual Cost ($K) numeric
FY01 FY02 FY03

Draft deliberative document – For discussion purposes only – Do not release under FOIA
56
Appendix D – Data Condition by Installation

- 57 -
Installation Name Model Output
Condition
Anniston Army Depot Green
Redstone Arsenal Green
Fort Rucker Red
Fort Richardson Red
Fort Wainwright Red
Fort Huachuca Green
Yuma Proving Ground Green
Pine Bluff Arsenal Green
NTC and Fort Irwin Red
Presidio of Monterey Yellow
Riverbank AAP Yellow
Sierra Army Depot Red
Fort Carson Green
Pueblo Chem Depot Red
Fort McNair Green
Walter Reed AMC Red
Fort Gillem Red
Fort McPherson Red
Fort Benning Green
Fort Gordon Red
Fort Stewart Green
Schofield Barracks Red
Fort Shafter Yellow Tripler Army Medical Center Green
Rock Island Arsenal Yellow
Crane Army Amm Red
Newport Chem Depot Red
Iowa AAP Yellow
Kansas AAP Green
Fort Leavenworth Red
Fort Riley Red
Blue Grass Army De Yellow
Fort Campbell Red
Fort Knox Red
Louisiana AAP Red
Fort Polk Red
Aberdeen Proving G Red
Adelphi Laboratory Red
Fort Detrick Green
Fort Meade Red
Soldier Systems Ctr Red
Detroit Arsenal Green
Installation Name Model Output
Condition
US Army Garrison Red
Mississippi AAP Red
Lake City AAP Red
Fort Leonard Wood Red
Fort Dix Red
Fort Monmouth Red
Picatinny Arsenal Red
White Sands Missile Green
Fort Drum Red
Fort Hamilton Red
Watervliet Arsenal Green
West Point Mil Res Red
Fort Bragg Green
Military Ocean Tml Red
Lima Army Tank Plt Red
McAlester AAP Green
Fort Sill Red
Umatilla Chem Depot Red
Carlisle Barracks Red
Letterkenny Army D Green
Charles E Kelly Sp Red
Scranton AAP Red
Tobyhanna Army Depot Green
Fort Jackson Red
Holston AAP Red
Milan AAP Green
Fort Bliss Green
Corpus Christi Arm Red
Fort Hood Green
Fort Sam Houston Red
Lone Star AAP Red Red River Army Depot Green
Deseret Chemical D Red
Dugway Proving Gnd Red
Tooele Army Depot Red
Fort Belvoir Red
Fort Eustis Green
Fort A P Hill Red
Fort Lee Red
Fort Monroe Red
Fort Myer Yellow
Radford AAP Red
Fort Lewis Red
Fort McCoy Red
Hawthorne Army Depot Green
Fort Buchanan Green