Embed Size (px)
Citation preview

AD-A265 352I,,,'l l 111111 II I'
CORROSION BEHAVIOR OFMETAL MATRIX COMPOSITES
I
FINAL REPORT FOR THE PERIODJuly 1, 1989 through September 1992
CONTRACT NO. r. 0014-89-J-3116
Principal Investigator
Harovel G. WheatMechanical Engineering
Center for Materials Science and EngineeringThe University of Texas at Austin
Austin, TX 78712 -.
DTICS ELECTEMAY 2 81993
Office of Naval Research EAtm: Dr. A. John Sedriks
JANUARY 1993
a 93-12493

iA',- C.ASSIFC.ATON OF !-1Ir ýIAGi
REPORT DOCUMENTATION PAGjE f~mApl~~
RE~pPOT SECURITY' C..ASS5 ,CA';ON 'b QSTR:C;vE NAAP~NrS
'~SEC,,R'Y CLA5ýIIQCAIACN ; OE6P '. 2 i.
PERoq~i;NG OQGANI2ATION REPORT %tjMqER(S S MON:T0RjNGOCA",,ZA!.0r g p .ý E';
aNAME OF PERFORMING ORGANIZATION 6b OFFCE SYvqOL. 74 NAME OF MO-II-OpIN G OGN:ZA-iO.,%The Uni vers ity of Texas at aI0chcab'C) Of ceo
Austin Ofc OfNaval ResearchADDRESS (COrY. Pa~re, 'I'd ZIP COde) 70 AOOR[SS(C,ry. Sr..rr jrvC ,:pCo~eMechanical- Enaineerina 800 N. tuincy StreetThe University of Texas at Austin Arlington, VA 22217-5000Austin, TX 787-12 ______________________
NME OF FIJNOINGISPONSORNr, 8b OFFICE SYVBC, 9 PROCJREMENT ASTRUMENT CEN7 FýCAr'Of. N,.%BEORGCANIZATION (it applicable)
,ffjce of Naval Research
AD Ri SS (C~tY. Strer, and ZIP Code) 10 SOURCE OF FUNDING NUBRPROGRAM PROJECT TASK TACPt -Ni7
Arlington, VA 22217-5000 ELEMENT N No NoCCESSCN 'N89-J- 3116I
LiE (Include Secvf~tY C`JaSs~f,CJt10n)
Corrosion Behavior of Metal Matrix Composites
PERSONAL AUTHOR ~S) anN..4ht
lyp w WEORT 13b tlME COvERED 14 DATE Of REPORT (yfjr,44onA. r y ? PCECOj
Final Report _ RO I fna 2 09092 1993/Jan)/29 7SUPPLEMENTARY NOTATION
COSATI COOES 18 SUBE C T T ERMS (Continue on 'eveie of ,,eCesse, and .dentsf'y by block nubr
FIELD GROUP ISUS-GROUP Corrosion, Copper Metal Matrix Composites, Graphite,
1 1 L ' Dispersion Strengthened Copper
ABSSRACT (Continue onA fieverSe of necessary ond odenrd'y by block nunm bed
A research program was conducted to assess the corrosion behavior of two categories of coppermetal matrix composites; commercially available composites and composites in development Thecommercially available composite studied was dispersion strengthened copper (2.7 vol%A120 3/Cu) which was found to possess comparable corrosion resistance to copper. In addition, itdid not appear to be susceptible to stress corrosion cracking when U-bend specimens were testedin 3.5 wt % NaGl or artificial seawater for a period of 4 months. Stress corosion cracking wasalso not observed under proof ring loading in 3.5 wt % NaCI for a period of 8 months at anapplied stress of 95% of the yield stress.
T'he composites in development studied were HEH-R GrP'ICu composites containing 1.2, 5, 15,* ~25 and 40 vol % graphite; 50 vol % Grf/Cu; and 70 vol % Wf/Cu. These composites experienced
varying degrees of galvanic corrosion during polarization. Benzotriazole, however, offersexcellent potential as a corrosion inhibitor for these composites.
S.YRISI,:ONi AVAIIA8iý1Y Of ABSTRACT 2'. .ABTRACT, SECý.R:Ty CI.ASS5%CAO\0
C~SIEO0NMIE SAME AS RP CD otcifa UnrestrictedNAME OF RESPONSIBLE INDIVIDUAL 22b TELEPHONE (include A ea Coe 22 .y ST%'sOA. J. Sedriks (2 02) 6 96 -44 01 1131 MF011-~ 1473, JUN 86 Sj"cý4Aoi~boc~ T ' .V.CATCIý' I~ "'ACE
S/N, 0102-ILF-CI'4-b603

1. INTRODUCTION
Metal matrix composites (MMCs) basically consist of a reinforcement incorporated into a
metallic matrix. By adding elemental, metallic or ceramic reinforcements in vawious forms,
including whiskers, particulates, and fibers to a metal matrix, a composite material is created that
may possess superior properties over the monolithic material. In fact, the most important reascn
to develop MMCs is that they can be tailored to meet the critical performance requirements for
advanced engineering applications. These requirements include high strength and stiffness, lo,.
densities, and low coefficients of thermal expansion. Although the incorporation of the second
phase into a matrix material can enhance the physical and mechanical properties of that materxd.
it could also significantly change the corrosion behavior (1, 2). Composites, by their nature,
combine materials having considerably different corrosion properties. With regard to corrosion
resistance, the dual natures of metal matrix composites make them susceptible to three adverse
processes (3); localized galvanic corrosion due to coupling of the metal and reinforcement:
crevice attack at the metal/reinforcement interface; and preferred localized attack at structural
and compositional inhomogeneities within the metal matrix.
The work described in this report focuses on aluminum metal matrix composites and
copper metal matrix composites. The work on SiC/6061 Al has been published (2) and is not
included in this report. The work on the effect of thermal history on the corrosion behavior of
Gr/Al is not complete and will be presented at the Corrosion/93 Poster Session sponsored by the
National Association of Corrosion Engineers (4).
There is increasing interest in the utilization of Cu metal matrix composites for marine
applications. Unfortunately, very limited corrosion studies of Cu metal matrix composites in
chloride environments have been performed to date (5).
The primary goal of this research has been to understand the corrosion behavior of metal
matrix composites in neutral chloride solutions. In particular, the effects of dissolved oxygen on
the reduction and oxidation kinetics, the effect of type and form of reinforcement, and the effect
I

of increasing the volume fraction of reinforcement have been investigated. Particular attention
has been given to the corrosion morphology, the corrosion mechanisms involved, and the
corrosion susceptibility of the copper composites.
The corrosion behavior of copper metal matrix composites that are either commercially
available or in development was studied in neutral open to air, aerated and deaerated 3.5 %kt%
sodium chloride solutions using electrochemical techniques, scanning electron microscopy
(SEM), energy dispersive x-ray spectroscopy (EDX), and in some cases a rotating disk
electrode, U-bend specimens, proof ring loading, corrosion inhibitors, ionic solution analysis :A
and Auger electron spectroscopy (AES). The materials under investigation were dispersion A-'-a
strengthened copper (AI203/Cu or DSCu); high energy-high rate (HEHR) consolidated
particulate graphite reinforced copper metal matrix composites consisting of 1.2, 5, 15, 25, and
40 vol% graphite; 50 vol% ± 30" angle-plied continuous P100 graphite fiber copper metal matrix
composites; and 70 vol% unidirectional continuous type 218-CS tungsten wire reinforced copper
metal matrix composites. Electrochemical techniques were used to determine the effects ofDi•t, ibi tio n
chloride on the corrosion behavior of the various composites.Availability Codes
Dit Avail a;-d ior
2. MATERIALS Spuciat
2.1 Commercially Available Composites
2.1.1 Dispersion Strengthened (DS) Copper
The DS copper was obtained from SCM Metal Products, Inc. DS Cu is produced from a
blend of pure copper and aluminum powders and the finely distributed (2.7 vol% A 1203)
particles are achieved by an internal oxidation process. Properties for DS Cu are given in Table
1. The properties are quite impressive. In fact, in a report to Naval Sea Systems Command,
Aylor (4) irdicated that of the following materials AI2 03/Cu, TiC/Cu, Si3N4/Cu, Si/Cu, B.ViCu
and Gr/Cu, dispersion-strengthened (DS) copper or (A1203Cu) was the most promising material
for high-strength marine applications. In addition, the material's sea water corrosion behavior in
2

low flow conditions was similar to that of pure copper, while the mechanical properties and
modules were significantly increased over pure copper.
2.2 Composites In Development
2.2.1 Particulate Graphite Reinforced Copper MMCs
The particulate graphite reinforced copper metal matrix composites were fabricated at the
Center for Electromagnetics at The University of Texas at Austin. High energy-high rate
(HEHR) consolidation techniques were utilized in this process. This process involves the
internal heating of a composite powder blend through the rapid discharge of a homopolar
generator (HPG). Details on the pulsed homopolar generator used in this novel processing
technique and information on the tribological properties of these composites are discussed
elsewhere (7,8). HEHR processing employs a 10 Megajoule homopolar generator that supplies a
100 kiloamp pulse to rapidly heat and solidify the composite powder compact. This short time a:
high temperature and the preferential heating and melting at the graphite-copper interface serve
to encapsulate the graphite reinforcement, thereby providing a highly dense composite product.
A schematic detailing the HEHR consolidation assembly is shown in Figure 1 and a typical HPG
consolidation pulse shape is shown in Figure 2. An in depth discussion on the fundamental
approaches to high energy-high rate processing has been described by Marcus et al, (9).
The Grp/Cu composites are processed in the following manner. A ceramic coating of
boron nitride is sprayed onto the electrodes, die, and backing ring contact surfaces to prevent
arcing during processing. The composite powder blend is loaded into a cold wall die made from
seamless stainless steel hydraulic tubing. The powder blend which is contained by electrodes in
the top and bottom, is compacted with the desired pressure (275 MPa for these specimens). The
HPG discharges a 100 kiloAmp pulse in 200 milliseconds to consolidate t he compact via
internal heating and welding of the powder particles. The pressure is maintained for five minutes
to permit conductive heat transfer through the electrodes to the large copper platens. The die is
unloaded and J;e consolidated Grp/Cu product removed. These processing parameters have been
3

developed and refined to optimize the tribological properties of these binderless Grp/Cu
composites.
Particulate reinforced graphite copper metal matrix composites are currently used as
sliding electrical contacts for generator parts in the automotive, utility, and aerospace industries
(10). Sliding electrical contacts transfer current between stationary and moving parts of
electrical machinery. Commercially available brushes incorporate low temperature binders such
as lead or tin to improve the strength and interfacial bonding of the brush material. These binders
decrease the conductivity of the electrical contact and tend to melt in high velocity-high current
applications, resulting in decreased conductivity and excessive wear of the electrical contact.
Sliding electrical contacts for high velocity-high current applications must demonstrate high
conductivity and wear resistance at high sliding interface temperatures (11). Therefore,
binderless graphite reinforced copper composites offer an attractive alternative for high velocity-
high current applications.
The composites studied were manufactured using dendritic copper powders (325 mesh)
and graphite flakes (230 mesh). Dendritic copper powders are used over spherical powders
because the dendritic powders increase the interfacial contact between the copper and the
graphite reinforcement. This increase in interfacial contact provides a more highly dense
microstructure due to more efficient and thorough interfacial heating. HEHR consolidation
techniques were utilized to fabricate 1.2, 5, 15, 25, and 40 volume percent Grp/Cu composites;
HEHR consolidated dendritic copper, conventionally processed powder metallurgy (P/Ni)
copper, and electrolytic tough pitch (ETP) copper specimens were also included in this study as
control specimens.. All specimens, with the exception of the ETP samples, were pressed at 275
NIPa during their respective processing techniques and manufactured as circular coupons 22 mm
in diameter. ETP copper was obtained from Farmers Copper.
4

2.2.2 Graphite Fiber Reinforced Copper MMCs
The angle-plied continuous fiber reinforced graphite/copper MMCs studied in this projet:
were manufactured at NASA Lewis Research Center in Cleveland, OH. All Grf/Cu composites
tested were manufactured using pitch based P-100 graphite fibers, 10 Prm in diameter, produced
by Amoco Performance Products.
Currently, processing and manufacturing of these composites is labor intensive. The
graphite fibers are cut from a spool and manually spread and positioned with a scalpel to insure
proper alignment. Commercially available Cu coated P-100 graphite fibers from American
Cyanamide Co. are utilized to manufacture the Grf/Cu composites. Liquid infiltration techniques
are used in this process. Essentially, copper coated graphite yarns are hand cut from a spool.
soaked in water, examined for defects, and manually positioned within an open-ended die.
Proper alignment and distribution of the fibers is essential. Multilayer, angle-plied or
unidirectional composites are manufactured in this manner simply by placing and orienting
layers of yams appropriately. The resulting sandwich structure is placed in a vacuum furnace
and heated to 399"K until the water has boiled and the pressure reaches 10-5 torr. The fiber
sandwich is then consolidated into the finished composite panel by hot pressing in an argon-3.75
% hydrogen atmosphere. The complete details of this consolidation technique and mechanical
and thermal properties are given by McDanels and Diaz (12). The excellent specific thermal
conductivity, high modulus of elasticity, and high tensile strength make Gif/Cu composites ideal
candidates for high heat flux structures such as space power radiator panels where component
density is a critical concern.
2.2.3 Tungsten Fiber Reinforced Copper MMCs
The unidirectional continuous fiber reinforced tungsten/copper MMCs studied in this
project were also manufactured at NASA Lewis Research Center in Cleveland, OH.
Commercially available Type 218CS tungsten filament wire from General Electric Corp., 180
p.m in diameter, was used as the reinforcement. Oxygen free, high conductivity
copper (99.994% Cu) was selected as the matrix material for the following reasons: it has a
5

melting point below the recrystallization temperature of tungsten, copper is insoluble in .uags-ct-
(13) and molten copper wets tungsten (14).
The Wf/Cu MMCs were manufactured using liquid phase infiltration techniques.
Continuous unidirectional tungsten fibers were placed in ceramic tubes to assure axial orientation
and infiltrated with copper. Clean slugs of copper were placed above the tungsten fiber bundles.
The ceramic tube and its contents were placed in a vacuum of a hydrogen furnace and heated at
1478"K for one hour. The copper melted and flowed over and around the tungsten wires -o for-,
a sound, dense MMC. After this time, the specimen rods were removed from the ceramic tubes
and stored in a dessicator. Details of this process and the mechanical properties of these
composites are discussed by McDanels et al (15,16). The ease of manufacturing these
composites allowed for the mechanical properties to be investigated over a wide range of \'oiume
percent reinforcement. A 70vol% Wf/Cu MMC was studied in particular.
Tungsten reinforced composites are ideal for high strength, high thermal conductivity
applications where component weight is not a limiting criteria. The density of tungsten is 19.26
g/cm 3 , resulting in a composite density of 16.16 g/cm 3 for a 70vol% Wf/Cu MMC. Due to the
high strength and conductivity of these composites, they offer potential as components in high
temperature aircraft and rocket engine turbines.
2.3 Microstructural Properties of MMCs
The nature of any surface prior to any electrochemical testing must be understood and
characterized in order to determine the types of corrosion initiation sites present. In particular,
the reinforcement/matrix interface must be examined to evaluate it as a potential initiation site
for localized galvanic corrosion or crevice corrosion. Variations in the surface can also affect the
continuity and integrity of a protective film and promote increased localized attack. Structural
flaws from processing, such as crevices or pores, can also result in increased localized corrosion.
These structural flaws can result from the incomplete wetting of the reinforcement by the molten
copper during processing and tend to create differential aeration cells, thus enhancing localized
6

corrosion. Considering these possibilities, the microstructural properties of copper MMCs must
be identified at the onset of corrosion testing.
Figures 3 through 6 show micrographs of ETP copper or the copper composites pricr to
electrochemical testing. (The micrograph of ETP Cu is included for comparison.)
2.3.1 ETP Cu
Figure 3 shows an SEM micrographs of the Cu surface prior to electrochemical testing.
2.3.2 Dispersion Strengthened (DS) Copper
A representative as-polished microstructure of DS Cu prior to electrochemical testing is
shown in Figure 4a. Dilute nitric acid solution was used to etch the polished DS Cu sample
surface to reveal the particles shown in Figure 4b.
2.3.3 Grp/Cu MMCs
A representative as-polished microstructure of one of the graphite particulate reinforced
copper composites, a 25 vol% Grp/Cu composite, prior to electrochemical testing is shown in
Figure 5a. The samples displays relatively uniform distribution of the graphite particles in the
copper matrix although graphite pullout resulting from metallurgical preparation is evident. The
dark areas in this figure are graphike particles and the brighter areas that are rough in appearance
are surface defects due to graphite pullout. Black areas at the graphite-copper interface are voids
where the molten copper did not completely wet the graphite reinforcement. These surface
defects and voids may set up differential aeration cells and act as preferential initiation sites for
localized corrosion.
The nature of the graphite-copper interface was investigated by heavily etching virgin
specimens in 50% NH4OH + 50% H20 2 . An SEM micrograph of such a heavily etched 25 volc%
Grp/Cu composite in shown in Figure 5b. Note the good mechanical bonding at the interface.
This microencapsulation of the graphite flake results from the rapid heating and cooling of the
copper matrix during HEHR processing. Tight microencapsulation of the graphite particle leads
to a more dense composite and provides fewer preferential anodic sites to participate in localized
corrosion processes. The as-processed residual porosity measurements for all Grp/Cu HEHR
7

consolidated composites and P/M (powder metallurgically prepared) copper control specmer:;•
are given in Table 2. These values are averages of measurements performed on at least ::re
different specimens using the water displacement method. All HEHR consolidated Gr;,,Cu
composites have less residual porosity than their F/M procez sed counterparts.
2.3.4 Grp'Cu MMCs
A representative as-polished, unetched microstructure of a 50 vol% Grt!Cu composilte
prior to electrochemical testing is shown in Figure 6. Note the uniform fiber distribution
throughout the panel, although a few areas of fiber clusters and strings of touching are obse,- c,.
The grain structure and the nature of the fiber-matrix interface were examined. Fiber-matrix
debonding does not occur. A sound, fully dense composite results from these consolidation
techniques.
2.3.5 Wr/Cu MMCs
A typical cross section of an as-polished unetched Wf/Cu composite is shown in Figure
The fibers are properly oriented and evenly distributed throughout the copper matrix. A fe%ý
regions of incomplete penetration of the molten copper into the tungsten tows wet ic noted. These
areas may act as initiation sites for localized corrosion. The interface i5 sound and voids are no,
observed.
3. EXPERIMENTAL PROCEDURE
All electrochemical tests were conducted on planar electrodes using an EG&G Model 2-3
Potentiostat/Galvanostat, EG&G model 342 software, a five iiouth flask, and a flat specimen
holder. The specimen holder exposed a 1.0 cm 2 surface area unless otherwise noted. For
example, in the case of the HEHR composites, the five mouth flask and flat specimen holder
were specially designed and manufactured to accommodate the 22 mm diameter of the HEHR
composite specimens. Potentials were measured using a saturated calomel electrode (SCE) with
a Luggin capillary equipped with a Vycor fitted tip. The tip was located approximately I mm
from the exposed specimen. Two graphite counter electrodes were used to assure current
symmetry.
8

Electrochemical tests were conducted in open to air, aerated and deaerated 3.5 wt7c NaC1
solutions prepared prior to each test using reagent grade sodium chloride and distilled water 'p11
7.0 - 0.2) Solutions were aerated or deaerated by sparging the solution for a period of 1 hour
preceding and during the test by using industrial grade oxygen or nitrogen, respectively. Typical
values of the dissolved oxygen concentration in aerated solutions were 10 ppm, whereas the
concentration in deaerated solutions was between 0.5 and 1.4 ppm.
Additional electrode preparation techniques are dikcussed in the particular subsection if
specimen geometry dictated special mounting techniques and electrical connections. Any
modifications required on the test equipment during testing are also discussed. In general, all
electrodes were sequentially polished from 180 to 600 grit surface finishes using SiC paper and
distilled water as the lubricant. The DS Cu samp) s were subsequently polished with alumina
powder. Specimens were rinsed in distilled water for 20 seconds, dried with a burst of laborator-,
air, and placed in a dessicator for storage.
Open circuit potentials were monitored as a function of time for all specimens. The
steady state corrosion potentials were designated as Ecorr. Average Econ- values were determinei
from the results of at least three runs on separate samples. It was found that between 2 and 5
hours were required for samples to reach steady state Ecorr values in the solutions. Therefore. the
samples were immersed in the solution for between 2 and 5 hours before beginning the tests. At
the end of Ecorr vs. time tests, samples were examined using SEM. Specific times will be noted
for the particular composite. During subsequent electrochemical tests, specimens were allov ed
to reach stable Forr values priox to conducting the particular electrochemical test. The corrosion
behavior of the copper control samples and the copper MMCs was determined using
electrochemical techniques such as potentiodynamic polariz .on, anodic and cathodic Tafel
plots, ',inear polarization, and in some cases, potentiostatic polarization techniques. Other
techniques such as the use of the rotating disk electrode, will be described in the different
subsections. Linear polarizaticn techniques were conducted at a scan rate of 0.1 mV/sec and 0.2
VN/sec, anodic and cathodic Tafel plots were conducted at a scan rate of 9.1 mV/sec and 0.2
9

mV/sec, and potentiodynamic polarization rests were performed at scan rate cf between 0.1, 1'
and 1 mV/sec. Specific scan rates will be noted.
The susceptibility to stress corrosion cracking of DS Cu was examined using U-bend
specimens and proof ring loading and the effectiveness of corrosion inhibitors such as
benzotriazole was examined for the Grp, Grf and Wf/copper composites. The specific procedures
will be described in the appropriate sections.
4. RESULTS AND DISCUSSION
4.1 Pure Copper
The open circuit corrosion potentials of the ETP Cu specimens approached a steady state
value in approximately 2 hours, with the values being -0.204 V vs SCE in aerated 3.5% NaCI
and -C.290 V vs SCE in deaerated 3.5% NaC1. As expected, the Ecorr values are more active in
the deaerated solution. This electronegative shift results from the inability of the electrode
surface to form a continuous protective oxide layer; insufficient dissolved oxygen is present in
the deaerated solutions to form such an oxide film.
SEM micrographs of the ETP Cu after 6 hours immersion in aerated anid deaerated 3.;,%
NaCI solutions are shown in Figures 8a and 8b. SEM micrographs of the HEHR Cu after
immersion under aerated and deaerated conditions are shown in Figures 9a and 9b for
comparison. EDX spectra revealed that only trace amounts of chlorine were found on the
electrode surfaces, regardless of the dissolved oxygen concentration.
Typical potentiodynamic polarization behavior of ETP Cu is shown in Figures 10a and
lOb. Scan rates were Im v/sec. The polarization curve is divided into four regions of behavior:
1) the apparent Tafel region; 2) the peak current and minimum current region; 3) the limiting
current region; and 4) the post-limiting current higher potential region. (It should be pointed out
that region 4 is not as steep at slower -can rates.) This is consistent with the behavior of pure
copper in chloride media as detailed by Lee and Nobe (17) and Milosev and Metikos-Hukovic
(18). The anodic polarization behavior is dependent on the mass transport reaction mechanisms
10

of the chloride ions. A model to explain the anodic polarization characteristics of Cu has ben
proposed (19) and is described below. Considering the anodic reaction in chloride media
Cu + CI-= CuC1- + e- (1)
CuCI- + C1- = CuC1- 2 (2)
the corrosion process involves at least three steps: (a) transport of chloride ions to the Cu /NaC-
solution interface, (b) reactions (1) and (2) at the interface, and (c) transport of the corrosion
products away from the interface or deposition of the products on the Cu surface. Each of these
reactions has its own rate-limiting step. At the lower applied potentials of region 1, the rate of
formation of the CuCI is slow in comparison to the transport rate to the interface of the CP- and
the rate of CuCI dissolution, equation (2). In this region, the CuCl is dissolved during the
corrosion process and the corrosion behavior is limited by the reaction rate in equation ( 1). As
higher potentials are reached in region 2, the rate of CuCI formation increases due to its
dependence on potential. Excess CuCI builds up on the surface of the copper when the rate of
CuCI formation surpasses its dissolution rate, equation (2). This hinders the transport of C1- to
the surface. The transport of Cl- becomes the rate limiting process at the peak current in region
2. As it becomes more difficult for the C1- to reach the metal surface, the rate of CuCI formation,
decreases while the dissolution of the Cur. continues at a rate that is independent of its film
thickness. This results in the limiting current behavior observed in region 3. At even higher
potentials, the rates of CuCl formation and dissolution become equal, resulting in region 4
behavior. Here the film thickness, CuCl formation and dissolution rates, and the current in this
region become constant.
4.2 Commercially Available Composites
4.2.1 Dispersion Strengthened Copper
4.2.1.1 Beh-,ior at Ecorr
Scanning electron micrographs that were obtained after Ecorr vs. time (6 hours)
experiments are shown in Figures 1 la and 1 lb. All cases seem to indicate the presence of a
surface film which appears to be evenly distributed over the surface.
II

In the case of DS Cu, it was found that about 5 hours were required for samples to reach
steady state Ecorr values in the solution. Therefore, the samples were immersed in the solution
for 5 hours before beginning the tests.
4.2.1.2 Polarization Tests
In the potentiodynamic tests, scanning ranges were set from Ecorr or -250 mV below
Ecorr to +800 mV vs. SCE and +250 mV above Ecorr or Ecorr to -1500 mV vs. SCE for anodic
and cathodic polarization, respectively. Tests were run at a scan rate of 0.1 and I mV/sec.
In subsequent experiments, potentiostatic tests were performed to determine the current
vs. time behavior of DS Cu in deaerated and aerated solution at applied potentials of -200, -80.(,
200, and 600 mV vs. SCE.
SEM studies were performed both before and after electrochemical testing for ETP Cu
and DS Cu samples. X-ray diffraction and ICP-AES techniques were used to study the corrosion
products to reveal the corrosion mechanism involved.
The shapes of the polarization curves were almost identical for ETP Cu and DS Cu under
all test conditions. Typical anodic polarization curves (determined at a scan rate of lmV/sec) for
DS Cu are shown in Figures 12a and 12b. In the potential range examined, there are again four
distinct regions: the apparent Tafel region (1), the peak current region (2), current minimum
region (3), and the higher potential region (4). This is similar to results observed by Lee and
Nobe (17). These four regions appeared in the test started from Ecorr to +800 mV and -250 mV
below F-On to +800 mV. Under the aerated condition, a secondary peak current appeared in
region 4, as seen in Figure 12b.
By carefully examining the polarization curves for both DS Cu and pure Cu, it is found
that in deaerated solutions the average transition potential of region 4 is slightly higher for DS
Cu (170mV vs SCE) than that for pure Cu (160mV vs SCE), as listed in Table 3. This can be
understood from the model discussed in the section on pure Cu. The transition potential of the
region 4 corresponds to initiation of the balance between the rates of CuCI formation and
dissolution. Compared to pure Cu, as shown in Figures 13 and 14, the corrosion surfaces of DS
12

Cu samples are more rough due to the dispersed fine alumina particles. The alumina particles on
the corroded sample surface make it difficult to cover the surface with CuCI film. In other
words, a thicker film is required to cover the surface to the extent of the smooth pure surface,
which means higher potential is required for the DS Cu to reach the region 4.
Table 3 also indicates that the transition potentials of region 4 for both Cu and DS Cu are
higher in aerated solutions than that in deaerated chloride solutions. In chloride media
containing dissolved oxygen, the electroreduction of the oxygen shifts the equilibrium of the
CuC1-2 reaction (combination of equation (1) and (2)):
Cu + 2CuCI- = CuCI-2 + e (3)
at the copper-solution interface so that a much higher interfacial concentration of CuCI>- is
obtained than in the absence of oxygen. This, then, leads to the increased dissolution rate of
CuCI (equation (2)) and thus higher transition potentials are required for the balance between the
formation and dissolution of the CuCl.
The typical cathodic polarization curves of Cu and DS Cu under deaerated condition are
shown in Figure15. Two cathodic peaks were observed. The second peak immediately follows
the first cathodic peak. Bjorndahl and Nobe (19) suggested that the cathodic peaks were caused
by CuCI reduction, equation (2), and the oxygen reduction reaction
02 + H20+ 4e- = 40H- (4)
4.2.1.3 Potentiostatic Tests
Potentiostatic tests were performed for 30 minutes after a 2 hour delay for both aerated and
deaerated conditions. For an applied potential of -200 mV vs. SCE, which is in Tafel region, the
current density oscillated between 0 and 1000 mA/cm 2 ; this is similar to behavior at the open
circuit potential. For applied potentials of -80, 0, 200 and 600 mV vs. SCE, the current density
increased to a value that depended on the applied potential and then leveled off. Under deaerated
conditions, the current density oscillated between 0 and 1000 mA/cm 2 for applied potentials of
-200 and -80 mV vs. SCE. The current density increases first and then leveled off for applied
potentials of 0 and 200 mV vs SCE. For an applied potential of 600 mV, which is in the plateau
13

current region, the current oscillations occurred and the oscillating amplitude changed %, ith time
Because the balance between the film formation and dissolution is dynamic, there is an
instability in the corrosion process. It is believed that this oscillation is due to the instability of
the surface film (20).
The corrosion surfaces were examined after the potentiostatic tests using SEM, X-ray and
ICP-AES. Figure 16 a-d shows the SEM micrographs of the corrosion surfaces under deaerated
conditions. It is clear that the corrosion is more serious at an applied potential of -80 mV vs SCE
(around peak current) than other applied potentials, and the corrosion surface is more uniform
and less corroded at 0 mV applied potential (around minimum current) than other applied
potentials. In our sample which was subjected to an applied potential of 600 mV vs. SCE under
deaerated conditions for 18 hours, the sample surface was covered by a thick film. The insoluble
corrosion products on that surface were identified by x-ray diffraction right after the test and
were determined to be copper chloride (CuCI).
4.2.1.4 Tafel Constants, Polarization Resistance, and Corrosion Rate
The anodic and cathodic Tafel constants, polarization resistance values, corrosion rates
and -corr values that were obtained for all test conditions are summarized in Table 4.
The experimental observations are the following:
1) The polarization resistance values for pure Cu are lower than those for DS Cu under all
conditions.
2) The Ecorr values are more active as the amount of oxygen decreases and they are slightly
more active for DS Cu than those for pure Cu.
3) The corrosion rates in aerated conditions are slightly higher than those in deaerated
conditions.
4) The polarization resistance values in aerated conditions are lower than those in deaerated
conditions.
The results concerning the effect of oxygen on the corrosion behavior of Cu are consistent
with the previous investigations (e.g., Bjorndaha and Nobe [ 191). They measured the rotation
14

disc rate, w, in aerated and deaerated conditions and determined the polarization rate, Rp using
Rp-1/wl/ 2). Their results indicate that the corrosion rate of copper in aerated chloride solution is
higher than that in deaerated solution. This can be explained based on the model introduced in
the section on pure copper.
From these observations, it seems that the DS Cu has comparable corrosion resistance to
Cu. It is noted that the Ecorr is more active for DS Cu than Cu. One possible reason for this is
that the DS Cu may have a higher initial susceptibility to corrode compared to pure Cu because
of the presence of A1203 particles. DS Cu may corrode in the interfacial area due to the residual
stresses or galvanic corrosion between the alumina particles and the copper matrix. In other
words, even though it may be easy to initiate corrosion in DS Cu, it may not necessarily have a
higher corrosion rate than Cu because corrosion rates depend on the corrosion process.
Therefore, DS Cu has comparable corrosion resistance to pure Cu after the protective film has
formed on the surface while its Ecorr is more active than that for Cu. This result was also
observed by Aylor (5) in tests of the marine exposures for Cu and DS Cu for I to 7 months. The
calculated corrosion rates based on the linear polarization testing showed that the corrosion rates
for DS Cu were initially higher than those for pure copper during the first month, but the rates for
the composites decreased to similar corrosion rates after 3.5 months.
Additional information on the corrosion behavior of DS Cu can be found in the work by
Sun (21).
4.2.1.5. Anodic Polarization Using Rotating Disk Electrode
Since it is known that for Cu in chloride media, both the anodic and the cathodic partical
reactions are affected by mass transport (22), a rotating disk electrode (RDE) was used to
determine polarization curves as a function of rotation rate. The EG&G PAR Model 616
Rotating Disk Electrode was used to control the rotation rate and provide automatic operation of
electrochemical experiments. A simple rotating disk electrode sample holder was designed and
fabricated for each sample to replace the rather expensive commercial sample holders. The DS
Cu samples (and ETP Cu samples for comparison) were machined into circular coupons that
15

were 1.6 cm in diameter and 0.32 cm thick and mounted in Bakelite in a similar way as in the
preparation of metallurgical smples. A hole was drilled into the Baketlite to connect the sample
to the rotating electrode electrically and mechanically, as shown in Figure 17. Note that samples
could be easily screwed on or off the stainless rod of the electrode. Each sample was then
sucessively ground using SiC papers followed by alumina powder polishing. They were
subsequently subjected to the procedure for anodic polarization that has been described
previously. In this case, however, the system was open to air and the rotation rates were 0, 1000,
3000, and 5000 rpm. The polarization curves are shown in Figure 17b-d and the polarization
resistance values and corrosion rates are shown in Table 5. It is not clear at this point why there
are variations between the Rp values determined in the static linear polarization test and the one
performed at 0 rpm using the RDE. Perhaps the differences arise from the differences in the
sample holders. This is being investigated. Polarization resistance values did decreases with
rotation rate as expected.
4.2.1.6. Stress Corrosion Testing Using U-Bend Specimens
Since it is known that copper and copper alloys are susceptible to stress corrosion cracking,
it was felt that stress corrosion cracking susceptibility should be examined. In order to
investigate this susceptibility for DS Cu, a number of tests were run on the DS Cu using
procedures outlined in ASTM G 30-79, Making and Using U-Bend Stress Corrosion Test
Specimens and ASTM G37-85, Use of Mattson's Solution of pH 7.2 To Evaluate The Stress-
Corrosion Cracking Susceptibility of Copper-Zinc Alloys.
Using the procedure outlined in ASTM G 30-79, eight (polished and bent) U-bend
specimens were placed in a glass tank containing 3.5% NaCl and one was removed and
microscopically examined for cracking every two weeks for 4 months. The U-bend specimens
were bent using a 3.18 cm diameter aluminum tube and they were assembled using stainless
steel, 7.62 cm bolts and nuts to induce stress and prevent springback of the legs and wire
bushings and faucet washers to insulate the DS Cu from the stainless steel. The solution was
covered with plastic to minimize evaporation and changed every month. Although a greenish
16

product developed on the surfaces, there was no evidence of stress corrosion cracking when the
samples were observed microscopically after being cleaned in 1% H2 SO4 , followed by distilled
water. The cracks that were observed immediately after exposure seemed to be confined to the
surface film. A micrograph of the most highly stressed region of a U-bend specimen that was
taken after 4 months exposure and subsequent cleaning is shown in Figure 18.
A modified version of the above procedure was subsequently performed, this time using
artificial seawater made with Ocean 50 Seamix manufactured by Jungle Laboratories
Corporation. Two tanks were used; one tank representing stagnant conditions and one tank in
which pumps were used to simulate flowing conditions. The velocity of the water under flowing
conditions was approximately 0.244 m/s. U-bend specimens were placed in each tank and
tensile specimens were placed on their sides in the stagnant tank only. These tensile specimens
were examined to determine if there were any changes in mechanical properties due to the
artificial seawater exposure. The solutions were replaced every week. Again, plastic sheets were
placed over each tank and taped down to retard evaporation of the water. There were no
significant changes in the mechanical properties after 4 months exposure and there was only
cracking of the surface film. A micrograph of the most highly stressed region of a U-bend
specimen after 4 months stagnant exposure and before cleaning is shown in Figure 19 . More
details can be obtained from the work done by Whitley (23).
Additional U-bend specimens were examined according to ASTM G 37-65 under stagnant
conditions. As before, no cracking was observed beneath the surface film for the 2 month period
during which they were exposed.
4.2.1.7 Stress Corrosion Testing Using Proof Ring Loading
Dispersion strengthened copper was also subjected to testing using the CORTEST proof
ring which was designed to permit testing of materials for H2 S service in accordance with NACE
Test Standard TM 01-77. The procedure was modified to accommodate 3.5 % NaCI as the
solution. The proof ring provides a sustained specimen load under a stress state of uniaxial
tension. Small tensile specimens having a gauge length of 1.59 cm. and a width of 0.953 cm.
17

were machined and the device was calibrated by CORTEST. Tests were conducted at a stress of
0.95 of the yield strength for a period of 8 months without any evidence of cracking. However,
on loading the sample to failure, it was observed that failure occurred outside the gauge length
which indicates that there must be some design problems associated with the specimen
configuration.
4.3 Composites In Development
4.3.1 Particulate Reinforced Grp/Cu MMCs
4.3.1.1 Behavior at Eco-
The open circuit corrosion potential, Econ- of the Grp/Cu electrodes changed rapidly after
immersion and approached a steady state value in approximately 2 hours. This is consistent with
the initial rapid formation of protection film. The galvanic series for sea water indicates
reversible potentials of +0.25 V vs. SCE for graphite and -0.337 V vs. SCE for Cu. Ecorr of
graphite is therefore substantially noble to copper. Therefore, one would expect the corrosion
potential of these Grp/Cu composites to become more noble as the volume fraction of graphite is
increased. This trend holds true for the specimens and the values are shown in Table 6. It should
be noted that in this case, the ETP Cu as well as the HEHR pure copper electrodes were used as
controls.
Typical micrographs after Ecorr vs. time tests for the HEHR pure copper and the IS and
40 vol% Grp/Cu composites are shown in Figures 20a-f. Regions of graphite pullout are evident
in the composites. However, they do not appear to have acted a3 preferential sites for localized
corrosion. Prolonged exposure results in increased graphite pullout as indicated in Figure 21
which shows a the micrograph for the 1.2 vol% Grp/Cu composite that was exposed to aerated
conditions for 10 hours.
18

4.3.1.2 Polarization Tests and Polarization Resistance
Typical potentiodynamic polarization curves for ETP Cu as well as 5 and 15 voli%
Grp/Cu are shown in Figures 22a, b and c. Scan rates were 0.2 mV/sec. The curves are
comparable and again the four regions of behavior are observed.
Potentiodynamnic polarization tests of the 25 and 40 vol% GrplCu specimens exhibited
small fluctuations in the anodic current density in the higher potential regions. This behavior, as
demonstrated in Figure 23a and 23b for a 25 vol% Grp/Cu electrode, occurs when a portion of
the composite would fall away from the sample surface, revealing an uncorroded surface to
participate in the corrosion process. The uncorroded surface acted as a new anodic site, resulting
in a momentary fluctuation in the current density. This phenomenon was observed in aerated and
deaerated solutions for the 15, 25, and 40 vol% Grp/Cu electrodes. The same data from the
polarization curve in Figure 23a, which is presented in a semi-log format, is plotted in linear
format in Figure 23b, thus emphasizing the jumps in anodic current density due to eyfoiiation of
the composite electrode.
The transition from region two behavior to region three L.,., ivior typically occurred
within a given potential range of -70 to -50 mV vs. SCE, regardless of the volume percent of
graphite reinforcement. Nonetheless, the volume percent of graphite reinforcement did alter the
nature of the peak current and minimum current region. The change in current density within
this region, defined as Airegion 2 = ina= - imin, was calculated for pure copper and Grp/Cu
electrodes in aerated and deaerated 3.5 wt% NaCl. Results are plotted as a function of graphite
content in Figure 24. In aerated and deaerated solutions, the Airegion 2 decreased with increasing
graphite content. This is due to two effects. One, as the volume percent of graphite increases,
there is less copper present in the electrode to participate in the expected polarization behavior of
copper. Also, as the volume percent of graphite increases, the contribution of the galvanic
current to the current density becomes more pronounced.
19

Examples of micrographs of a 5 and 15 vol% Grp/Cu MMCs after anodic polarization arc
shown in Figure 25. Note the galvanic attack at the graphite-copper interface and the unifomn
corrosion of the copper matrix.
Average polarization resistance values in aerated and deaerated sodium chloride for
HEHR 100% Cu and selected composites are given in Table 7. Note that the polarization
resistance decreases as the volume percent of graphite increases. This trend hold true in both
aerated and deaerated 3.5wt% NaCI solutions.
The results obtained are summarized below:
1) HEHR processing offers an attractive alternative to conventional powder metallurgy
techniques for the processing of metal matrix composites based on the following
characteristics: extremely fast processing minimizes time for internal oxidation; rapid
heating and cooling rates related to the high energy-high rate pulse; microencapsulation
of graphite particle through preferential heating at the graphite-copper interface; and a
dense product is achieved without requiring post-processing heat treatments.
2) Stable For values are more noble for Grp/Cu specimens immersed in aerated 3.5 wt%
NaCI solutions than in deaerated solutions. Fcor values become more noble as the
volume percent graphite increases.
3) Voids in the composite due to graphite pullout during electrode preparation or surface
defects do not act as initiation sites for localized corrosion phenomenon.
4) Negligible galvanic attack was observed in the 1.2, 5, and 15 vol% Grp/Cu composites at
their rest potential. Galvanic corrosion between the graphite reinforcement and the
copper matrix became more pronounced as the volume percent of graphite and the
exposure time increased.
5) Cracks emanating from the graphite-copper interface were detected in composites
immersed in deaerated and aerated NaC1 solutions for 10 hours.
6) The potentiodynamnic polarization curves generated for pure copper electrodes and
Grp/Cu electrodes are similar. The four regions of polarization behavior are observed.
20

The change in magnitude of the peak current and minimum current region decreased as
the volume percent of graphite increases because less copper is available to participate M
the anodic reactions..
7) For a given volume percent reinforcement, the corrosion mechanisms of the HEHR
composites are similar, independent of aeration or deaeration of the test solution. The
severity of the corrosion of the Grp/Cu metal matrix composites increased with increasing
graphite content.
8) All composite samples exhibited uniform corrosion and localized galvanic corrosion at
the graphite-copper interface, Copper is reduced and goes into solution. Localized
galvanic corrosion attacks the interface and small amount of exfoliation of the graphite
reinforcement. The graphite-copper interface is degraded and small amounts of graphite
fall away from the electrode surface. The majority of the graphite reinforcement remains
on the surface and is held in place through the accumulation of corrosion product.
4.3.2 Fiber Reinforced Graphite/Copper Composites
The 50vol% Grf/Cu MMCs were manufactured in panel form, approximately 7 x 30 x
0.2 cm. Panels were cut into one centimeter wide strips. Each composite strip was then
sectioned at one centimeter intervals, resulting in a final specimen size of 1 x 1 x 0.2 cm.
Electrodes were prepared in the following manner. Electrical leads were spot-welded onto the
backside of the copper foils of the samples. Specimens were then mounted in non-conductive
epoxy with their edge exposed. Typical electrode areas were 0.2 cm 2 . A coating of rubber
cement was applied to where the electrical lead exited from the back of the epoxy sample mount
to safeguard against any seepage of the electrolyte down the wire-epoxy interface. Electrodes
were stored in a desiccator until electrochemical testing or microstructural observations.
Electrochemical tests were conducted on the exposed edges of the Grf/Cu composite.
4.3.2.1 Behavior at Ecorr
Graphs of the open circuit potentials over time for Grf/Cu electrodes in aerated and
deaerated 3.5 wt% NaCI revealed that the electrodes reached stable Ecorr values in approximately
21

1-2 hours. The average open circuit potential value for the electrode immersed in the aerated 35
wt% NaCI was -4.200 mV vs. SCE, approximately 60 mV more noble than the electrodes
exposed in the deaerated solution. This is consistent with the results obtained for the particulate
reinforced graphite/copper composites and pure copper control specimens; insufficient dissolved
oxygen is present in deaerated solutions to form a continuous protective film on the electrode
surface. An SEM micrograph of a GrTf/Cu composite electrode after four hours immersion in
deaerated NaCI is shown in Figure 24. Negligible corrosive attack has occurred; this micrograph
is very similar to that of a virgin specimen. The interface shows no signs of localized galvanic
corrosion and scratches on the surface from metallurgical preparation remain evident.
4.3.2.2 Polarization Tests and Polarization Resistance
Grf/Cu electrodes were potentiodynamically polarized using two electrochemical
techniques: Tafel test polarization from Econ- to Econ- ±250 mV and potentiodynamic
polarization to 800 mV vs. SCE. Reported results are for a scan rate of 0.2mV/s. The corrosion
morphology of a Grf/Cu electrode after polariz- on to Ecof- +250 mV during the Tafel test is
examined in the SEM micrograph of Figure 27a. Deposition of corrosion product on local area
cathodes (i.e., the exposed graphite fibers) is evident. Some cracking and grain boundary
corrosion is also observed. A higher magnification micrograph, Figure 27b, is quite informative.
The protrusion of the graphite fibers from the matrix is apparent; the copper matrix (the anode)
has suffered from uniform corrosion, leaving the fibers intact. Degradation of the mechanical
bond at the graphite-copper interface has occurred.
The polarization behavior of these composites is somewhat similar in nature to that of
pure copper and quite similar to the Grp/Cu MMCs. A potentiodynamic polarization curve for a
Grf/Cu electrode in deaerated 3.5 wt% NaCI is seen in Figure 28. (A similar polarization curve
for an HEHR 100% Cu electrode is given for comparison.) The Tafel regions are similar to those
of pure copper but the current maximum and current minimum regions are different. This is
primarily due to the fact that there is only 50 vol% copper in the Grf/Cu composites. The higher
potential region in the Grf/Cu electrode polarization curve in Figure 28 approaches higher values
22

in the current density at a faster rate than the pure copper electrodes. This is due to accelerated
localized galvanic corrosion in the Grf/Cu composite.
SEM micrographs of a 50 vol% Grf/Cu composi:e electrode surface after
potentiodynamic polarization to E-rr+800 mV in deaerated NaCI are observed in Figures 29a
and 29b. The general corro3ion behavior is seen in Figure 29a and a higher magnification of the
lower right hand region of thin. micrograph is observed in Figure 29b. Note the selective severe
attacked of the copper matrix, accumulation of corrosion product on the noble graphite
reinforcement, and an area of localized galvanic corrosion at the graphite fiber-copper matrix
interface.
Grf/Cu electrodes were also polarized to similar potentials in aerated solutions to evaluate
the effect of dissolved oxygen in the electrolyte on the corrosion behavior of these composites.
The mode of attack in aerated solutions was significantly different from that observed in the
deaerated electrolytes. The typical corrosion morphology of these composites in aerated 3 5 wt .%
NaCl is shown in Figure 30a. Cracking of the copper matrix is observed. Cracks originate at the
graphite-copper interface and propagate through the matrix and run into other cracks or
interfaces. The nature of the graphite fiber-copper interface was examined at higher
magnifications in Figure 30b. Debonding has occurred at the fiber-matrix interfaces in the top
left and top right of this Figure. The copper matrix has experienced cracking and severe unifomi
corrosion. The region of accelerated galvanic corrosion observed in deaerated solutions is
absent.
A comparison of the anodic potentiodynamic curves for Grf/Cu electrodes in aerated and
deaerated 3.5 wt% NaCI is made in Figure 31. Tafel behavior is similar; however, the transition
to region 2 behavior occurs at a lower potential and a lower current density for the electrode in
the aerated solution. This behavior is explained by returning to the behavior of pure copper as
noted in section 4.1. As the applied potential increases in the Tafel region, the rate of CuCI
formation increases due to its dependence on potential. In aerated NaCI, the electroreduction of
the oxygen shifts the equilibriumof the CuC12 reaction, Excess CuCl builds up 0a the surface of
23

the Grf/Ci MMC when the rate of CuCl formatica surpasses its dissolution rate. This hinders the
transport of CI-, causing the current maximum to occur at lower Lpplied potentials and lo'xer
current densities. The behavior in the limiting current and higher potential regions are similar
but the current density is lower for the Grf/Cu MMC in the aerated electrolyte. Considering the
micrographs taken - Econ- +800 mV in aerated and deaerated NaCI, it is suggested that the
severity of the galvanic corrosion in the deaerated electrolyte results in the higher corrosion
current densities.
Average polarization resistance values were 1. l kf2/cm 2 and 2.8kf•/cm 2 in aerated and
deaerated NaC1 respectively. Additional information can be found in the work by Orth (24).
4.3.3 Fiber Reinforced Tungsten/Copper Composites
Wf/Cu composites were manufactured in cylindrical form. Electrodes were made by
sectioning the cylindrical MMC such that a smaller cylinder, approximately 1 cm in length, was
generated. Electrical leads were spot-welded onto the back side of the composites. Specimens
were then mounted in non-conductive epoxy with the circular electrode exposed. A coating of
rubber cement was applied to where the electrical lead exited from the back of the epoxy sample
mount to safeguard against any seepage of the electrolyte down the wire-epoxy interface. The
prepared electrode was stored in a desiccator.
4.3.3.1 Behavior at Ecorr
The Wf/Cu composites displayed behavior similar to the other composites at Ecorr; the
open circuit potential decreased as a function of time until it reached a steady state value in
approximately 11/2 hours. Average Ecor values for the Wf/Cu electrodes immersed in the
aerated 3.5 wt% NaC1 were approximately -0.250V vs. SCE. This is appro. imately 50 mV
more noble than their counterparts in the deaerated solutions. This is consistent with prior results
for the copper control specimens and the copper MMCs.
24

4.3.3.2 Polarization Tests and Polarization Resistance
Wf/Cu electrodes were potentiodynamically polarized using two electrochermic:al
techniques: Tafei test polarization from Econ. to Econ- ± 250 mV, and potentiodynaric
polarintion to 800 mV vs. SCE, both at a scan rate of 0.2mV/s.
A polarization diagram for a Wt/Cu electrode in aerated 3.5 wt% NaCi is gicen inFigure
32. Tafel behavior is similar to that of pure copper. A decrease in the anodic current dnr.si'v is
observed in Lt e current maximum and current minimum region. However, the magnitude of this
decrease is substantially less than in other copper MMCs. The corrosion current, at higher
applied potentials, is also less than that of the copper control and Gr/Cu electrodes.
An SEM micrograph of the Wf/Cu electrode surface after polarization is given in Figure
33a. Uniform corrosion of the copper matrix is observed. However, the attack is not as severe as
in the graphite copper composites. The noble tungsten reinforcement has not been damaged,
scratches from metallurgical preparation remain evident. The tungsten-copper interface is
examined in a higher magnification in Figure 33b. The interface has been degraded. Debondinr2
between the tungsten fiber and copper matrix is evident. An area of localized galvanic corrosion
is observed at the tungsten-copper interface. Note the deeper attack at the interface. Cracks
originate at the interface and propagate towards the matrix with some cracks growing together.
These cracks do not extend past the region of localized attack. Although the differences in the
open circuit potential developed between copper and tungsten is small, galvanic corrosion is still
a concern for these composites.
Polarization resistance values were found to be 1. lkf./cm' in aerated NaC1.
Additional information on the composites in development can be found in the work by
Orth (24).
4.3.4 Corrosion Inhibitors for Copper Metal Matrix Composites
The stability of copper and copper alloys in neutral aerated NaCI solution depends on the
nature of the corrosion product film, the constituents of this film, under certain conditions, being
a mix of cuprous oxide, cuprous hydroxychloride, and cupric oxide (25). When this protection iS
25

compromised, other means of protection must be found. Corrosion inhibitors offer excellent
potential for the protection of copper MMCs. They offer protection of the composite 'Aithout
affecting or degrading any of the enhanced properties that make these MMCs attractive (such as
high thermal conductivity and high electrical conductivity). For instance, chemical conversion
and chromate coatings may offer significant protection of the copper MMC, yet these coatings
are deleterious to the electrical and thermal conductivities of the copper MMCs, not to mention
the environmental harm that may result from working with such coatings. Inhibitors are readily
available, cost effective, and easy to use and monitor; however, corrosion inhibitors are only
applicable to closed circulating systems. Corrosion inhibitors are available that are very effective
in controlling corrosion of copper and copper base alloys. Many of these inhibitors may also be
effective in minimizing galvanic deposition of dissolved copper onto other metals (26).
Three specific corrosion inhibitors have been identified and extensively used for the
protection of copper and copper alloys: benzotriazole, totyltriazole, and mercaptobenzothiazole.
All of these inhibitors depend on the formation of an adherent protective film on the metal oxide
surface. Essentially, the inhibitor reacts with the metal surface to form a chemisorbed 3-
dimensional barrier. The rate of film growth is rapid and reaches a self-limiting thickness within
a short period of time (27).
Benzotriazole (C6H4 N3H) is considered as one of the most effective corrosion inhibitors
for copper and copper alloys in severe environments(28,29). Benzotriazole reacts with copper to
form a compact, chemisorbed, 3-dimensional barrier composed of polymeric multilaver film of
Cu-C6H4N3 (29,30). This section focuses on the effectiveness of benzotriazole as a corrosion
inhibitor for copper metal matrix composites. In particular, the ability of benzotriazole to
minimize galvanic corrosion has been investigated.
Benzotriazole has been evaluated as an inhibitor in 3.5 wt% NaCI solutions at a
concentration of 0.2 g/l. The effects of benzotriazole on the corrosion behavior of GrrICu,
Grf/Cu, and Wf/Cu were evPluated at: open circuit potential, during linear polarization, and
during anodic potentiodynamic polarization. Results for each of these categories are discussed in
26

subsections below. HEHR 100% Cu electrodes were used ad control specimens. Special
consideration is given to determining the effectiveness of benzotriazole as a corrosion inhibitor
capable of controlling and limiting galvanic corrosion.
4.3.4 Behavior at Ecorr
Benzotriazole is a corrosion inhibitor that forms a three dimensional polymer film on
copper surfaces. This is a time dependent process and was monitored by measuring the open
circuit potential as a function of time. As the benzotriazole chemisorbed onto the copper
surfaces, the open circuit potential became more noble. Figures 34a-d contain Ecor vs. time
curves in aerated 3.5 wt% NaCI +200 ppm benzotriazole for HEHR 100% Cu, 1.2 vol% ,Crp/Cu,
50 vol% Grf/Cu, and 70 vol% Wf/Cu electrodes, respectively. Steady state Ecorr values were
approximately -0.185, -0.185, -0.205 and -0.255 V vs. SCE for the HEHR 100% Cu, the 1.2
Vol% GrpWCu, the 50% vol% Grf/Cu and the 70 vol% Wf/Cu respectively.
4.3.4.2 Polarization Tests and Polarization Resistance
Typical anodic polarization curve for an HEHR 100% Cu electrode with and without 200
ppm benzotriazole solution are observed in Figure 35. Typical anodic polarization curves for 1.2
vol% Grp/Cu electrodes in 3.5 wt% NaCI solutions with and without 200 ppm benzotriazole are
given in Figure 36, and typical anodic potentiodynamic polarization curves obtained for the 50
vol% Grf/Cu MMCs in aerated 3.5 wt% NaCI with and without the benzotriazole are compared
in Figure 37. The benzotriazole provides excellent protection of the composite and also acts as a
superior deterrent to galvanic corrosion. From Fcof to IrOOmV vs SCE for pure Cu and from
Ecolr to 250 mV vs SCEfor the composites,, there is a reduction in the corrosion current in
excess of two orders of magnitude. Region 2 polarization behavior does not occur for the
50vol% Grf/Cu mmc electrode in the benzotriazole solution; the corrosion inhibitor prevents the
buildup and formation of CuCl2 until potentials greater than 250 mVsce are approached. This
probably results from the decreased amount of copper present to participate in the corrosion
process. The polarization curve for Grf/Cu electrode in the electrolyte containing the
benzotriazole does not intersect its counterpart in the solution without the added corrosion
27

inhibitor. Galvanic corrosion is reduced by the addition of benzotriazole to the electrolvte. The
corrosion morphologies of Grf/Cu electrodes exposed in the benzotriazole containing electrolytes
and polarized to 600 mVsec were analyzed using the SEM. Results indicate that the corrosion
performance is improved for specimens exposed to the corrosion inhibitor. A low magnification
SEM micrograph of a typical exposed surface is observed in Figure 38. Upon close examination
of this micrograph, it is noted that the scratches from metallurgical sample preparation remain
evident. The attack is localized in nature; it is concentrated in the regions where graphite
bundles were pl ced in layers during processing.
Typical anodic polarization curves generated from Wf/Cu electrodes with and without
benzotriazole are given in Figure 39. The benzotriazole provides a reduction in the corrosion
current of only one order of magnitude up to 150 mVsce. Apparently, benzotriazole does not
affect tungsten and since there is only 30 vol% copper in these specimens, the protection is
limited.
Polarization resistance values for the composites with and without benzotriazole are
given in Table 8. All values are substantially higher for the electrodes immersed in the
electrolytes containing the benzotriazole, indicating lower corrosion rates.
Benzotriazole offers excellent potential as a corrosion inhibitor for coppers MNLMCs. The
open circuit potentials of the copper control specimens and the Grp/Cu MMCs became more
noble when immersed in the NaCI solutions containing benzotriazole. The Ecorr of the Grf/Cu
and Wf/Cu composites are only slightly affected by the addition of benzotriazole. This is due to
the smaller volume percent of copper in these composites. Polarization resistance values for all
copper MMCs immersed in the NaCl-benzotriazole solutions increased over one order of
magnitude, indicating lower corrosion rates for the composites in the NaCI solutions containing
benzotriazole. The anodic polarization curves obtained in the NaCl + benzotriazole solutions
demonstrated a decrease in the corrosion current of 2 to 3 orders of magnitude over substantial
potential ranges. Improved performance was observed up to 200 mVsce for Wf/Cu specimens.
28

300 mVsce for Grp/Cu samples, 250 mVsce for Grf/Cu electrodes, and 100 mVsce for copper
control samples.
Typical anodic polarization curves comparing the electrochemical behavior of l-EHR
100% copper and 1.2 vol% Grp/Cu electrodes in aerated 3.5 wt% NaC1 + 200 ppm benzotriazole
are given in Figure 40. Galvanic effects are noted at the higher applied potentials where the
corrosion current is greater for the 1.2 voi% Gri/rCu composite. It is interesting to note that thc
benzotriazole offers a wider range of corrosion protection for the Grp/Cu composite than the pure
copper specimen. Benzotriazole appears to minimize galvanic corrosion until higher applied
potentials are reached.
The electrochemical behavior of HEHR 100% copper and 50 vol% Grf/Cu electrodes in
aerated 3.5 wt% NaCI + 200 ppm benzotriazole are compared in Figure 41. This is a very
interesting comparison. Note that the benzotriazole offers a wider range of corrosion protection
for the 50 vol% Grf/Cu composite than it does for the pure copper specimen. Even when the
driving force for corrosion is high enough to overcome the protective nature of the compact
chemisorbed polymeric multilayer film of Cu-C6H4N3, the corrosion current density is less than
that of the pure cooper specimen.
As a corrosion inhibitor, benzotriazole is effective in preventing corrosive attack of the
copper matrix and minimizing galvanic corrosion at the interface. It may be possible to expand
the potential applications of this inhibitor by utilizing high concentration benzotriazole solutions
as pre-treatment methods for copper MMCs.
29

5. CONCLUSIONS
A research program was conducted to assess the corrosion behavior of aluminum metal
matrix composites and copper metal matrix composites. The conclusions concerning the
aluminum metal matrix composites have been summarized in reference 2.
With respect to the copper metal matrix composites, two categories of composites were
studied: commercially available composites and composites in development.
The commercially available composite studied was dispersion strengthened copper which
was found to possess comparable corrosion resistance to copper. In addition, it did not appear to
be susceptible to stress corrosion cracking when U-bend specimens were tested in 3.5wt% NaCI
or artificial seawater for a period of 4 months. Stress corrosion cracking was also not observed
under proof ring loading in 3.5 wt% NaCI for a period of 8 months. The applied stress was 9517c
of the yield stress.
The composites in development studied were HEHR Grp/Cu composites containiag 1.2.
5, 15, 25 and 40 vol% graphite; 50 vol% Grf/Cu; and 70% vol% Wf/Cu.
The severity of the corrosion of the HEHR Grp/Cu composites increased with increasing
graphite and in the presence of dissolved oxygen. In addition, all of the composites in
development exhibited uniform corrosion and some localized galvanic corrosion at the
reinforcement-copper interface during polarization. This localized corrosion led to cracking and
exfoliation of the graphite reinforcement for the Grp/Cu NMMCs. Cracking was also observed at
the reinforcement-copper interface in the Grf/Cu and Wf/Cu MMCs.
Benzotriazole offers excellent potential as a corrosion inhibitor for these composites.
Polarization resistance values were much greater for the specimens immersed in NaC1-
benzotriazole solutions than their counterparts in 3.5 wt% NaC1 only. This suggest much lower
corrosion rates. Therefore the possibility of using benzotriazole as a pretreatment corrosion
inhibitor for these copper metal matrix composites is proposed.
30

6. ACKNOWLEDGMENTS
The authors are very grateful for the financial support provided by the Office of Naval
Research (N00014-89-J-3116). We are specially grateful for the assistance provided by Dr.
David Ellis of NASA Lewis Research Center, Bob Carnes of the Center For Electromagnetics at
The University Of Texas At Austin and P.C. Wang, formerly of The University of Texas at
Austin.
7. REFERENCES
1. R. C. Paciej and V. S. Agurwala, Corrosion, Vol. 42, No. 12, p. 718, 1986.
2. H. Sun, E. Koo, and H. G. Wheat, Corrosion, Vol. 47, No. 10, p. 742, 1991.
3. P. P. Trzaskoma, Journal of Metals, p. 21, Dec. 1988.
4. H. Sun, Corrosion/93 Poster Session, National Association of Corrosion Engineers, New
Ork .,as, LA 1993.
5 D. M. Aylor, "Development of Copper-base Metal Matrix Composites Materials,"
DTNSRDC/SME-85/10, David Taylor Naval Ship R&D Center, March, 1985.
6. SCM Metal Products, Inc., GlidCop, ed. SCM Metal Products, Cleveland, Ohio.
7. J. H. Gully, J. M. Weldon, and W. L. Noble, IEEE Transactions on Magnetics, Vol. 22, No.
6, p. 1623, 1985.
8. Z. Eliezer, C. Persad, M. J. Wang, and K. C. Owen, Wear, Vol. 120, p. 117, 1987.
9. H. L. Marcus, D. L. Bourell, Z. Eliezer, C. Persad, and W. F. Weldon, J Metals, Vol. 38, p.
6, 1986.
10. H. L. Marcus, W. F. Weldon, and C. Persad, Technical Report Contract No. N62269 85
C0222, The University of Texas at Austin, Austin, TX, February, 1987.
11. C. Persad and Z. Eliezer, Wear, Vol. 120, p. 117, 1987.
12. D. L. McDanels and J. 0. Diaz, "Exploratory Feasibility Studies of Graphite Fiber
Reinforced Copper Matrix Composites for Space Power Radiator Panels," NASA TM-
102328, Lewis Research Center, Cleveland, OH, September, 1989.
13. M. Hansen, Constitution of Binary Alloys, Second Edition, McGraw-Hill, 1958,
31

14. C. J. Smithels, Tungsten. Its Metallurgy. Properties, and Applications, Chem. Pub. Co.,
1953.
15. D. L. McDanels, R. W. Jech, and J. W. Weeton, "Stress Strain Behavior of Tungsten-Fiber
Reinforced Copper Composites," NASA Technical Note D-1881, Lewis Research Center,
Cleveland, OH, October, 1983.
16. D. L. McDanels, "Tungsten Fiber Reinforced Copper Matrix Composites, a Review."
NASA Technical Paper 2924, Lewis Research Center, September, 1989.
17. H. Lee and K. Nobe, J. Electrochem. Soc., Vol. 133, No. 10, p. 2035 1986.
18. I. Milosev and M. Metikos-Hukovic, J. Electrochem. Soc, Vol. 138, No. 1, pp. 6, 1991.
19. W. D. Bjorndahl and K. Nobe, Corrosion, Vol. 40, No. 2, p. 82, 1984.
20. H. Lee, K. Nobe, and A. Pearlstein, J. Electrochem. Soc., Vol. 132, No. 5, p.1031, 1985.
21. H. Sun and H. G. Wheat, submitted to Journal of Materials Science.
22. S. R. Sanchez and D. J. Schiffrin, Corr. Sci., Vol. 22, p. 585, 1982.
23. G.A. Whitley, Jr., "Stress Corrosion Cracking Susceptibility of Dispersion Strengthened
Copper," M. S. Thesis, The University of Texas at Austin, Austin, TX, May, 1991.
24. J. E. Orth, PhD. Dissertation, The University of Texas at Austin, May 1993.
25. R. R. North and M. J. Prior, Corr. Sci., Vol. 10, p. 197, 1970.
26. Personal communication with Dr. David Miller, Texaco Chemical Co., Austin Research
Laboratories, Austin, TX, May 1992.
27. Metals Handbook, Ninth edition, Vol. 13, No. 3, ASM International, Metals Pa.rk, OH, p.
497, 1987.
28 G. Lewis, Br. Corros. J., Vol. 16, No. 3, pp. 169-79, 1981.
29. T. Notoya and G. W. Poling, Corrosion, Vol. 32, No. 6, p. 216-25, 1976.
30. T. Notoya and G. W. Poling, Corrosion, Vol. 35, No. 5, p. 193-99, 1979.
32

List of Tables
Table 1. Properties of DSC vs ETP Copper (6)
Table 2. Residual Porosity Measurements
Table 3. The Transition Potentials of Region 4
Table 4. Tafel Constants, Rp, and mpy for Cu and DS Cu
Table 5. The Polarization Resistance, Corrosion Rate and Icorr for DS Cu and Cu
Table 6. Stable Ecorr Values in Aerated and Deaerated 3.5 wt % NaCI
Table 7. Effect of 02 on Polarization Resistance of Cu and Grp/Cu MMCs
Table 8. Effect of Benzotriazole on Polarization Resistance of Cu and Cu MMCs

Table 1. Properties of DSC vs ETe' Copper (6)
Ten.v]e Yield Elongsuorn Modulus of The-ma•Strength Strengh in 2 in. Hardness Densiry Elasticity Conducuvir/(KPSI) (KPSI) (%) (Rcckwell) b/•n3) (MPSI) (68cF.BTU
/fLhi.°F)
DSCGlidCop AL-60 75 bt, 13 Re = 81 -318 19 186UNS C15760
CopperETP 32 10 50 RF = 40 .322 17 226UNS CI 1000t-
-
Table 2. Residual Porosity Measurements
vol% Oraphite Pmeasured_. Ptheoretlca _ % residual porosity
P/M 100% Cu 8.05 8.96 10.2
HEHR 100% Cu 8.41 8.96 5.2
1.2 8.18 8.88 5.9
5 7.95 8.63 6.8
15 7.39 7.95 6.1
25 6.79 7.28 6.8
40 5.89 6.28 5.1
Table 3. The transition potentials of region 4 (mV vs SCE).
DS Cu Cu
ae erazec 170 60
3• . 2c1- 210

Table 4. Tafel Constant, R p, and MPY Values for Cu and DS Cu
Conditions Parameters Cu DS Cu
Tafel Anodic 41.49 72.57
(mv) Cathodic 181.62 108.95
Aerated Rl(K-OHMS cm 2) 4.28 6.66
Ecorr (mv) -204 -220
Corrosion Rate 1.90 1.51(MPY)
Tafel Anodic 61.84 56.31(my) Cathodic 115.44 101.38
Air Rp(K-OI-,S cm 2 ) 4.28 4.52
Ecorr (mv) -223 -247
Corrosion Rate 2.35 2.40_ _ _ _ _(MPY) ___ .35 _ __ _ 2.40__ __
Tafel Anodic 109.10 71.76
(mv) Cathodic 108.18 358.19
Rp(K-OHMS cm 2 ) 7.39 9.26Deacrated ......._ ___ .26Ecorr (my) -290 -298
Corrosion Rate 1.37 1.51(MPY) 1.371.51 _ j

TaIe 5 The polarization resistance, corr-o-,ý:on rate, a-,
values for DS Cu and Cu
rpm C 10C0 OC.
2RP (k-ohms cm 2 ) 21 67 1 51 O=29 05p
Cu Corr Rate (MPY) 0,47 6,68 7 79 9 6
I (pA/cm 2 ) 1 00 1438 16 77 2corr
R (k-ohms cm 2 ) 3259 1.71 1 45 144p
DS Cu Corr. Pate (MPY) 038 5.88 6.10 7 01
I (pgA/Cm 2 ) 0.82 1267 13.14 1508C orr
Table 6. Stable Ecor Values in Aerated and Deaerated 3.5 wt % NaCI Solutions(Values given in mV vs SCE)
Aerated Deaerated
vol% gr Solutions Solutions
PM 100% Cu -281 -291
HEHR 100% Cu -273 -284
1.2 -238 -254
5 -232 -252
15 -220 -245
25 -217 -233
40 -199 -212

Table 7
Effect of 0 2 on Polarization Resistance of Cu and Gr /Cu MMCs.p
(k-ohm/cm )
--------------------------------------------------------------------------
Aerated Deaerated
HEHR 100% Cu 1.4 7.2
1.2 Vol% Gr /Cu 1.6 1.1p
45Vo1% Gr /Cu 0.6 0.6p
4OVo1% Gr ICu 0.6 0.3p
------------------------------------------------------------------------------------------
Table 8
Effect of Benzotriazole on Polarization Resistance of Cu and Cu MMCs.
(k-ohm/cm 1)
Without with 200 ppm
Benzotriazole Benzotriazole
HEHR 100% Cu 1.8 15.0
1.2 Vol% Gr /Cu 1.6 5.1p
50 Vol% Gr/Cu 1.2 9.7
70 Vol% W/Cu 1.1 4.9
---- --- --- ---- --- --- --- ---- --- --- --- ---- --- --- ---- --- --- --- ---- --- --- ---

List of Figures
Figure 1. A schematic detailing the HEHR consolidation assembly,
Figure 2. Typical HPG consolidation pulse shape and duration.
Figure 3. SEM micrograph of as-polished ETP Copper.
Figure 4a. SEM micrograph of as-polished DS Copper.
Figure 4b. SEM micrograph of polished and etched DS Copper.
Figure 5a. SEM micrograph of an as-polished 25 vol % Grp/Cu MMC.
Figure 5b. SEM micrograph of a polished and etched 25 vol % GrpiCu MMC.
Figure 6. SEM micrograph of an as-polished 50 vol % Grf/C ,MMC demonstrating the alignmentand distribution of the reinforcement.
Figure 7. SEM micrograph of an as-polished 70 % Wf/Cu •MIC.
Figure 8a. SEM micrograph of ETP Copper after 6 hours immersion in aerated 3.5 wt % NaCG.
Figure 8b. SEM micrograph of ETP Copper after 6 hours immersion in deaerated 3.5 wt % NaCi.
Figure 9a. SEM micrograph of HEHR 100% Copper after 6 hours immersion in aerated 3.5 wt %NaCI.
Figure 9b. SEM micrograph of HEHR 100 % Copper after 6 hours immersion in deaerated 3.5wt % NaCI.
Figure 10a. Typical polarization curve for ETP Copper in aerated 3.5 wt % NaC1.(Scan rate = 1 mV/sec)
Figure 10b. Typical polarization curve for ETP Copper in deaerated 3.5 wt % NaC1.(Scan rate = 1 mV/sec)
Figure 1 Ia. SEM microgiaph of DS Copper after 6 hours immersion in aerated 3.5 w% NaC1.
Figure 11 b. SEM rnicrograph of DS Copper after 6 hours immersion in deacrated 3.5 w% NaCl.
Figure 12a. Typical anodic polarization curve for DS Copper in aerated 3.5 wt % NaCG.(Scan rate = 1 mV/sec)
Figure 12b. Typical anodic polarization curve for DS Copper in deaerated 3.5 wt % NaCl.(Scan rate = I mV/sec)
ig .e 13a. SEM micrograph of ETP Copper after anodic polarization in aerated 3.5 wt % NaCl..
Figure 13b SEM micrograph of DS Copper after anodic polarization in aerated 3.5 wt % NaCI.
Figure 14a. SEM micrograph of ETP Copper after anodic polarization in deaerated 3.5 ,wt %NaCI.
Figure 14t. SEM micrograph of DS Copper after anodic polarization in deaerated 3,5 wt % NaCI.
Figure 15a. Typical cathodic polarization curve for ETP Copper in deaerated 3.5 wt % NaC1.

Figure l5b. T'ptcal cathodic polanzauon curve for DS Copper in deaerated 3.5 w" % NaCi
Figure 16a. SEM micrographs of DS Copper after potentiostatic polarization at applied potenuals of(a) -200 mV vs SCE (b) -80 mV vs SCE (c) 0 mV vs SCE (d) 200 mV vs SCE (e) 600 mV vsSCE.
Figure 17a. Schematic representation of the rotating disk electrode assembly.
Figure l7b. Tpical anodic polarization curve for DS Cu in open to air 3.5 At % NaCI at1000 rpm
Figure 17c. Typical anodic polarization curve for DS Cu in open to air 3.5 wt % NaCI at3000 rpm.
Figuare 17d. Typical anodic polarizaton curve for DS Cu in open to air 3.5 wt % NaCI at5000 rpm.
Figure 18. SEM micrograph of the most highly stressed region of a U-bend specimen made fromDS Copper and exposed to 3.5 wt % NaCI for 4 months. The sample was cleaned in 1 t %H2SO 4 and then rinsed in distilled water.
Figure 19. SEM micrograph of the most highly stressed region of an exposed U-bend specimenmade from DS Copper and exposed to 3.5 wt % artificial seawater for 4 months. The specimenwas not cleaned prior to taking the micrograph.
Figure 20a. SEM micrograph of HEHR 100% Copper after 4 hours immersion in aerated 3.5wt % NaC1.
Figure 20b. SLM micrograph of HEHR 100% Copper after 4 hours immersion in deaerated 3.5wt % NaC1.
Figure 20c. SEM micrograph of a 15 vol % Grp/Cu MNUMC after 4 hours immersion in aerated 3.5wt % NaCI.
Figure 20d. SEM micrograph of a 15 vol % Grp/Cu MMC after 4 hours immersion in deaerated3.5 wt % NaCI.
Figure 20e. SEM micrograph of a 40 vol % Grp/Cu NMMC after 4 hours immersion in aerated 3.5wt % NaCI.
Figure 20f. SEM micrograph of a 40 vol % Grp/Cu MMC after 4 hours immersion in deaerated3.5 wt % NaCl.
Figure 21. SEM micrograph of a 1.2 vol % Grp/Cu MMC after 10 hours immersion in aerated 3.5wt % NaCI.
Figure 22a. Typical polarization curve for ETP Copper in aerated 3.5 wt % NaCI.(Scan rate was 0.2 mVsec)
Figure 22b. Typical polarization curve for a 5 vol % Gr'lyCu MMC in aerated 3.5 wt % NaCI.
(Scan rate was 0.2 mV/sec)
Figure 22c. Typical polarization curve for a 15 vol % Grp/Cu MMC in aerated 3.5 wt % NaCI.
(Scan rate was 0.2 mV/sec)
Figure 23a. Typical polarization curve for a 25 vol % GrpCu MMC in aerated 3,5 wt ,t % NaCI.(Scan rate was 0.2 mV/sec)

Figure 23b. Another plot of the data in Figure 23a in which the graph emphasizes the jumps inanodic current density due to exfoliation of the composite.
Figure 24. Difference between maximum and minimum current density in region 2 as a funcuon ofvol % graphite.
Figure 25a. SEM micrograph of a 5 vol % Grp.Cu M.MC after anodic rolanzation in deaerated 3 5wt % NaCI.
Figure 25b. SEM micrograph of a 25 vol % GrpiCu NMMC after anodic polarization in deaerated3.5 wt % NaC1.
Figure 26. SEM micrograph of a 50 vol % Grf/Cu -MMC after 5 hours immersion in ceaerated 3.5wt % NaCI..
Figure 27a. SEM micrograph of a 50 vol % Grf/Cu .•LMMC after an anodic Tafel test in deaerated3.5 wt % NaCl.
Figure 27b. A higher magnification of the composite in Figure 27a.
Figure 28. Typical polarization curves for HEHR 100% Copper and a 50 vol % Grf;Cu \ LMC in
deaerated 3.5 wt % NaCI. (Scan rates were 0.2 mV/sec.)
Figure 29a. SEM micrograph of a 50 vol % Grf/Cu ,4MC after anodic polarization to 800 mV vsSCE in deaerated 3.5 w% NaCI.
Figure 29b. Higher magnification of the composite in Figure 29a.
Figure 30a. SEM micrograph of a 50 v% Grf/Cu ,IMC after anodic polanzauon to 800 mV vsSCE in aerated 3.5 w% NaCI.
Figure 30b. Higher magnification of the composite in Figure 30a.
Figure 31. Typical anodic polarizatioLI curves for 50 vol %Grf/Cu MMCs in aerated and deaerated3.5 wt % NaC1. (Scan rates were 0.2 mV/sec)
Figure 32. Typical anodic polarization curve for a 70 vol % Wf/Cu ,MC in aerated 3.5 wt %NaCl.(Scan rate was 0.2 mV/sec)
Figure 33a. SEM micrograph of a 70 vol % Wf/Cu M.MC after anodic polarization to 800 roV vs
SCE in aerated 3.5 wt % NaCI.
Figure 33b. Higher magnification of composite in Figure 33a.
Figure 34a. Ecorr vs time curve for HEHR 100% Copper in aerated 3.5 wt % NaCI - 200 ppmbezotriazole.
Figure 34b. Ecorr vs time curve for a 1.2 vol % GrpCu MMC in aerated 3.5 wt % NaC1 200
ppm bezotriazole.
Figure 34c. Ecorr vs time curve for a 50 vol % GrfjCu MMC in aerated 3.5 wt % NaCl - 20-X) ppm
bezotriazole.

Figure 34d. Ecorr vs time curve for a 70 vol % Wf/Cu MNMC in aerated 3.5 wt % NaCI - 200 ppmbezotriazole.
Figure 35. Typical anodic polarization curves for HEHR 100% Copper in aerated 3 5 wt % NaCiwith and without 200 ppm bezotriazole.
Figure 36. Typical anodic polarization curves for 1.2 vol % GrpCu MMCs in aerated 3.5 At %NaCI with and without 200 ppm bezotriazole.
Figure 37. Typical polarization curves for a 50 vol % Grf!Cu .MMC in aerated 3.5 wi1 % NaCI withand without 200 ppm bezotriazole.
Figure 38. SEM micrograph of a 50 v% Grf/Cu NLMMC in aerated 3.5 wt % NaC1 - 200 ppmbezotriazole. Specimen was polarized to 600 mV vs SCE.
Figure 39. Typical polarization curves for a 70 vol % Wf/Cu ,,MC in aerated 3.5 w% NaC1 - 200ppm bezotriazole. (Scan rate was 0.2 mV/sec)
Figure 40. Anodic polarization curves comparing the electrochemical behavior of HEHR 100%Copper and a 1 2 vol % Grp,/Cu ,-MC in aerated 3.5 wt % NaCI , 206 ppm bezotnazole.(Scan rates were 0.2 mV/sec)
Figure 41. Anodic polarization curves comparing the electrochemical behavior of HEHR 100%Copper and a 50 vol % Grf/Cu .MvlC in aerated 3.5 wt % NaCi + 200 ppm bezotmazole.(Scan rates were 0.2 mV/sec)

-- -- ...
L7 ..... . . .. ...J
LeADh
MW mi
LCA
Figure 2. Typical HPG consolidation pulse shape and duration.
100

Figure 3. SEM micrograph of as-polished ETP Copper.

Figure 4a. SEM micrograph of as-polished DS Copper.
Figure 4b. SEM micrograph of polished and etched DS Copper.

e7
FMure :,a. SEM micro-raph of an polshed sn thed 25 vol % Grp CU NI IC.

-. w.
14 10 W.P.- .
NA MC-)
tp--
Figure 6. SEMI micrograph of' an as-polished 50 vol % Grf.'C MMC dtinonstratnn' the alicrnment
and distribution of the reinforcement.
Vwvt9
Hiourc 7. SEMI micrograph of ain as-polished 70 % \\."Cu %MC.

Figure Sa. SEM micrograph of ETP Copper after 6 hours immersion in aerated 3.5 wt %NaG.
Fig ure 8b. SENI micrograph of ETP Copper after 6 hours immersion in deaerated 3.5 t t NNaaC.

.U1t I
xx '.
Figure 9a. SEM micrograph of HEHR 100% Copper after 6 hours immersion in aerated 3.5 wt %NaCI.
Figure 9b. SEM micrograph of HEHR 100 % Copper after 6 hours immersion in deaerated 3.5wt % NaC1.

700
500
5;*300
"i 10 0 3)
-100- 2)
-300~ 1o11o,•I 10i 4o .o 5sod 100 101 0 10 10
I (uA/cm42)
Figure 10a. Typical polarization curve for ETP Copper in aerated 3.5 wt % NaCI.(Scan rate = 1 mV/sec)
700
500
300
EUw 100,
-100-
-300 .,, ,,,,._,..-V o -. o.....- o q;i101 100 1010 102 10 10~
I (uA/cmA2)
Figure 10b. Typical polarization curve for ETP Copper in deaerated 3.5 wt % NaCI.(Scan rate = I mV/sec)

Figure I Ia. SEM micrograph of DS Copper after 6 hours immersion in aerated 3.5 vv%- Nac,7i.
I/
Figure 11 b . SEM micrograph of 1)S Copper after 6 hours immersion in deaerated 3.5 w%; NaiCI.

700
500
-300EUi 10 0 -
-100- .- -a...-
-3W0
I (uA/cm'A2)
Figure 12a. Typical anodic polarization curve for DS Copper in aerated 3.5 wt % NaCI.(Scan rate = 1 mV/sec)
700
500o
-. 300-
EW100.
.100-
-300510.1 100 101 102 10 10 10~
I (uAIcm-2)
Figure I12b. Typical anodic polarization curve for DS Copper in deacrated 3'.5 wt %NaCI.(Scan rate = 1 mV/sec)

FPzurc I 3a. SEMt micrograph of ETP Copper after anodic polarization in aerated .x:%\.C
ArL- ., - aý . . .r4
IL -
.. , . .
f 12 1 IV hb. SEl micrograph of DS5 Copper after anodic polarization in aerated3. x NC

Fwur I4i. SM mcroraphof TP oppe afer nodi poanztionin eaea~ed3.5w4
F2-,r I .. ý SEI mliicrograph of 1)5 Copper after anodic polarization In deaerlated 3.5 %k i{\

S. • ,. 4.+• •..-- m°A" - -. .
~-600-
E
-1200'
*1500O-10 "' -l 1o0 10 1 2 103 1 od 105I (uA/cmA2)
Figure 15a. Typical cathodic polarization curve for ETP Copper in deaerated 3.5 wt % NaC1.
0-
-600
EwU-9 ,0 0 .
-1200
.15,00 -TO10 1o0 10~ o0 10 10 10
I (uA/cmA2)
Figure 15b. Typical cathodic polarization curve for DS Copper in deacrated 3.5 wt % NMCI.

tu
4
I Z,
ý44
UTMSE;25KU X2,00 0811
I-T
E25KV X200 000-8, .1 0: UTMS

(c)
(d)

AN IL
N
KC
;A N
!Wý .)L(VI
Figur 16a EM m crogr phs f DS opper afte pote nosttic p iar~ A l.n~rap h d p r~n:
IIf.EZ~J eflo I I talrSs5vlF
FI-gure 16a. ShENImticrogrprhsnttn of DSthper roafter doeniosk a e p~toi d fIv

400 4 "T7 7"
200 200
0 0
-200.-0
-600. .40j
- 1 0 1 2 3 4 -0 4ti £0 10t 10 10 t0 10 le 10 to 10 10 1t o O1( UA/CM,.2) N( U ,/Ct,,2)
b (c)
400
200
-00
-1 I• 1 2 3 4t0 10 I0 10 to 10 10
It UA/CM-2)
(d)
Figure 1 7b. Typical anodic polarization curve for DS Cu in open to air 3.5 wt % NaCi at1000 rpm
Figure 17c. Typical anodic polarization curve for DS Cu in open to air 3.5 wt % NaCI at3000 rpm.
Figure 17d. Typical anodic polarizaton curve for DS Cu in open to air 3.5 wt % NaCI at5000 rpm.

Figure 18. SEM micrograph of the most highly stressed region of a U-bend specimen made fr-omDS Copper and exposed to 3.5 wt % NaCI for 4 months. The sample was cleaned in I wAt 171H-1S0 4 and then rinsed in distilled water.
Fi~rc 9. -Mv micrograph of the most highly stressed region of an exposed U.-bend specimenmade from DS Copper and exposed to 3.5 wt %c artificial seawater for 4 months, The specimenwýas not cleaned prior to taking the micrograph.

.i-. --
Figure 20a. SEM micrograph of REH-R 100% Copper after 4 hours immersion in aerated 3.5wt % NaCI.
Figure 20b, SEM micrograph of HEHR 100% Copper after 4 hours immersion in deaerated 3.5wt % NaCI.

Figure 20c. SEM micrograph of a 15 vol % Grp/Cu MMC after 4 hours immersion in aerated 3.5wt % NaC1.
Figure 20d. SEM micrograph of a 15 vol % GrpiCu MMC after 4 hours immersion in deacrated3.5 wt % NaCI.

Figure 20e. SEM micrograph of a 40 vol % GrplCu MCMC after 4 hour-, immersion in aerated 3.5wt % NaCI.
Fi-IF. Z3.SMmcorp fa4 vlGpC M fe ousimrini ecae3.5 lie NC

-0
,.I .
750
sOGL
t- 250
1 000
2'502
10 to10 10 10 10 10 0 10
i(JLA/cm^l2)
F'ue2a. Tvpical polarization cu~rve for ETIP Copper in acrated 3.5 wt NaC].(Scan rate was 0.2 mVi'sec)

I000
750
5oo
250
0
-250 ° "
-500
10"1 100 101 101 103 104 I05 106
1 (pAI cm"2)
Figure 22b. Typical polarization curve for a 5 vol % Grp/Cu NLMC in aerated 3.5 wt % NaCI.(Scan rate was 0.2 mV/sec)
1000
750
500
250
0
-250
-500 "
-75 0' 1o o o o 04 5o o610 1 0 10 10 10 0 106
I (uA/cm^2)
Figure 22c. Typical polarization curve for a 15 vol % Grp/Cu MMC in aerated 3.5 wt % NaCI.(Scan rate was 0.2 mV/sec)

1000
750
Soo
.500
IOQI
0
-SOO
.250
.75 10 10 10 . I to 1 10
log I (pA/cmA2)
Figure 23a. Typical polarization curve for a 25 vol % Gr3/Cu NITMC in aerated 3.5 wt 7c NaCI(Scan rate was 0.2d mV/sec)
1000
750
> 00
.250
.500
-IS0
-10000 50000 100000 150000 200000
i LjA/cmAV)
Figure 23b. Another plot of the. data in Figure 23a in which the graph emphasizes the 'umps ianodic current density due to exfoliation of the composite.
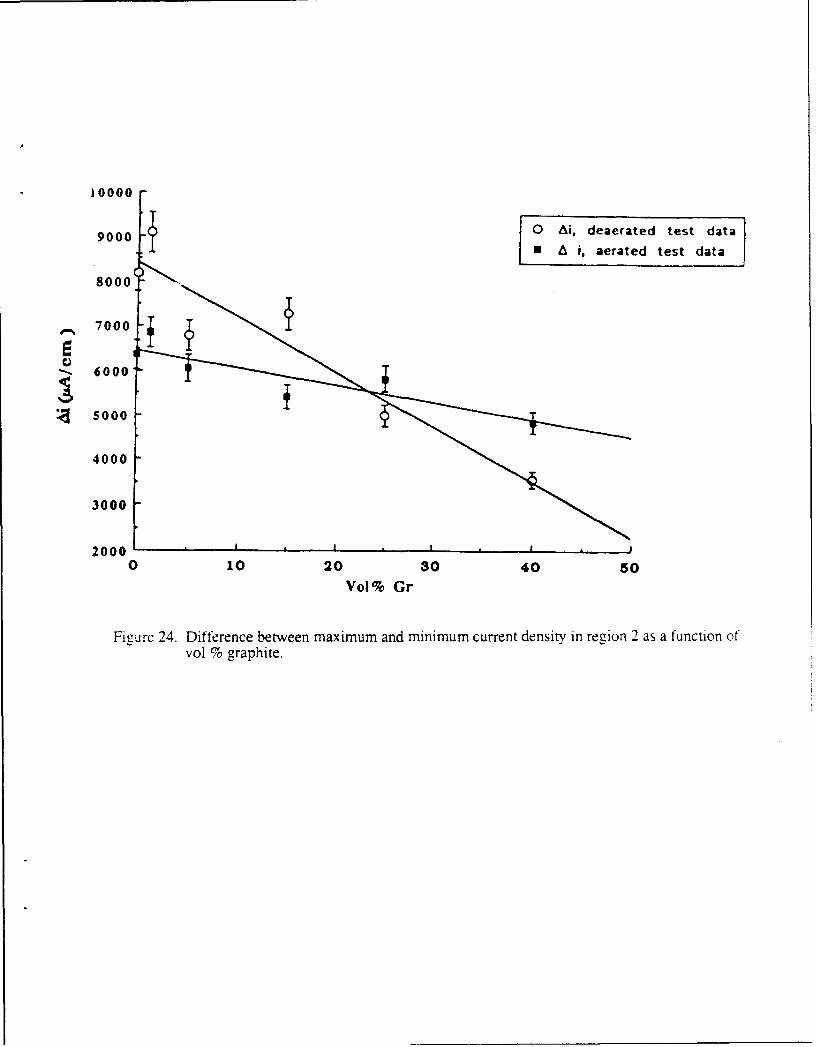
10000
9000 0 Ai, deaerated test data0• A i, aerated test data
8000.
,• 7000
- 6000
s5000
4000
3000
2000, , , , , ,0 10 20 30 40 50
Vol% Gr
Figure 24. Difference between maximum and minimum current density in region 2 as a function ofvol % graphite.

Fi,-urc 25,1. SEMt micn-wraph of a 5vol ý'i Grp'Cu NIMC after anodic rXkll~anza)Tl 1r dc1'c.wt NaCI.
£ r ~hSFNI ricro,-raph (A a 25 vol O rp CuI MMC a! tel 1*nodilc polaiz-t it' /a11 if crClt1C2

F-igire 26. SENI micrograph of a 50 vol %Grf/Cu NINIC after -5 hours immersion in decraeted 3
w~t %NaCL.
-7.
Fiuc ?.SF-M mnicrograph of a 50 -vol '7c GrfýCL \MMC after an anodic Tafl' tcst ini dcacr~lled
5wt l% NaCI.

Figure 27b. A higher magnification of the composite in Figure 27a.
1000
"750
500
250
__ 0
-500
HEHR 100% Cu ekctrode-750
-1000 5O0vol% Grifl C u clef•:frxie
-1250
-150010' 10 10 to 10 I10 1 0 101
I (uA/cm 2)
, 2,'. Typical p, 1,izauiwm cures fore I iIR I Copper and a 50 ,.,1% GI Cyr Cui MICdeaeraid 3.5 v.-t ", NaCi. (Scan ratce were 0.2 m\V cc.)

I12ir .2 d.SE\I micrograph of a 50 vol %7, (rf Cu MNIC after anodic polarization to SOOh m%SCE: in deacrated 3. %NaCi.
Fi~unic 29h. I f igher macnification of the composite in Figure 29a.,

Figure 30a. SEMi micrograph of a 50 v%( (irf Cu \.IMC after anodic polarizatinn to,"MOO ()\T11
SCE in aerated 3-5 w%v( NaGl.
Fig,,ure 30b. Higher magnification of the composite in Figure 30a.-

600
400
200
0
aerated electroyle
-200 + +
deaerated electrolyte
-400 0...... , ..... . .1o' 100 0o' 0o2 1o0 1 o
I .•A/cm"2)
Figure 31. Typical anodic polarization curves for 50 vol %Grf/Cu MMCs in aerated and deaerated- 3.5 wt % NaCI. (Scan rates were 0.2 mV/sec)
1000
750
500
S) 250Q
0
-250 G d
-500
-750 . . 0 1 2 o 3 . o1 0 " 2 1 0 " 1 1 0 0 i 0 1 0 2 1 0 3 1 0 4 1 0 5
I .iA/cmA 2)
Figure 32. Typical anodic polarization curve for a 70 vol % Wf/Cu MMC in aerated 3.5 w-t %NaCl.(Scan rate was 0.2 mV/sec)

Fiue ,Li, SENT m~crograp}1 (Aa 70 vol % Wf Cu NINIC after anodic pol.-nzat10n to SW n)\m%
SC E in aerated I.5 wt % NaCl.
F'cire33. f 112her rnainification of composmite In Figýure 33a.

)o Alo 660 so* 1#4 issi
9 .I
Ti~me (Ca,•) Ttwe [oe,.-)
(a) (b)
.114
Jigi
* ..* ,=9S a,=*seeI =,= ,,..=S* .... " .- .. _-,i...
Time CMrs) Ttwo .c.ij
(c) (d)
Figure 34a. Eco-. vs time curve for HEHR 100% Copper in aerated 3.5 wt % NaC1 - 200 ppm
bezotriazole.Figure 34b. EconT vs time curve for a 1.2 vol % Gr p/Cu MIMC in aerated 3.5 wt % NaCl - 200
ppm bezotriazole.Figure 34c. Ecorr vs time curve for a 50 vol % GrfiCu IMMC in aerated 3.5 wt % N:iC1 200 ppm
bezotriazole.Figure 34d. Ecorr vs time curve for a 70 vo! % WfiCu PANC in aerated 3.5 wt % NaCI 200 ppm
bezotriazole.

800 r
6100
HEHR 100% C;Uee
400 aerated 3 5 wt% %a(':200 PPmI btenZotAazu;.
200
-200 HERR 100% Cu electrode in+.46 aerated 3.5 wt% NaCI.
-400 '70 '',02 "10 ;0.S0
i (uA/cm^2)
Figure 35. Typical anodic polarization curves for HEHR 100% Copper in aerated 3.5 wt (7 NaCiwith and without 200 ppm bezotriazole.
"800
600
1.2 vol% Gr/,Cu electrodle III
400 aerated 3 5 At% NaCI.200 ppm benzotriaoke
> 200
.200 1.2 vol% G e/Cu electrode In
-20 aerated 3-5 wt% NaCI.
-400 Io( 10 "''25O 0 610' tO 0o toI~ o
I UpAA/cm^2)
Figure 36. Typical anodic polarization curves for 1.2 vol % Grp,/Cu MMCs in aerated 3.5 wt %,-
NaCl with and without 200 ppm bezorriazole.

800F
Gr/Cu MMC in aerated
400h O~~
W~
0GrC ICU aerated
000 "00ý3.5 wt% NaCL
.20 0 000 00 /
-400 40
I ~UA/czn^2)
Figure 37. Typical polarization curves for a 50 vol % Grf/Cu MIMC in aerated 3.5 wt % NaCI withand without 200 ppm bezotriazole.
hi r
~W
Figure 38. SEM micrograph of a 5Z i-b Grfi'Cu MMC in aerated 3.5 wt % NaCI 200 ppmbezotriazole. Specimen was polarized to 600 mV vs SCE.

800 r
600
400
W/Cu electrode In 3.5 wt% NaCIf 200 ppm benzotriazole. -
200
o r
W/Cu electrode in 3 5 wt% NaCI
-2000 O09
.40001 0 " 2 l O0I'O 1 0 1 t o 2 1 0 3 I1 0 5
I (U.A/lcm"2)
Figure 39. Typical polarization curves for a 70 vol % Wf/Cu MMC in aerated 3.5 w% NaCl - 200
ppm bezotriazole. (Scan rate was 0.2 mV/sec)
700
500
300 1.2 vol% GrlCu.
100"-HEHR 100% Cu.
.100
0 09
-300 1 0 01 "i0o2 "1'0'3 1o. 0 610' 100 to o2j o
I (uA/•Cm/2)
Figure 40. Anodic polarization curves comparing the electrochemical behavior of HEHR 100%
Copper and a 1.2 vol % Grp/Cu MMC in aerated 3.5 wt % NaCI +200 ppm bezotriazole.
(Scan rates were 0.2 mV/sec)

800
Soo -/
400 50 vol% Gr/Cu
polarizatlon curve
100% HEHR copperpolaruZaUon curve
-200 0 00
-4 100 11 ... ;1) 3 0. 05 106
i (UA/cm^2)
Figure 41. Anodic polarization curves comparing the electrochemical behavior of HEHR 100%Copper and a 50 vol % Grf/Cu MMC in aerated 3.5 wt % NaCI + 200 ppm bezotriazole.
(Scan rates were 0.2 mV/sec)