Embed Size (px)
Citation preview

Prepared By: Sarah Stone-Francisco, MPH
Gian Gonzaga, PhD Sarah E. Samuels, DrPH
Prepared for the Office of Women’s Health County of Los Angeles
Department of Health Services
Samuels & Associates 663 13th Street
Oakland, CA 94612 (510) 271-6799
www.samuelsandassociates.com
December 2003
LOS ANGELES COUNTY
OFFICE OF WOMEN’S HEALTH
Cervical Cancer Prevention & Education Initiative:
Analysis of Mass Media Campaign and Hotline
FINAL REPORT

Samuels & Associates 2
ACKNOWLEDGMENTS We would like to acknowledge the Los Angeles County Office of Women’s Health for their contribution to improving the health of Los Angeles County women. Particularly we would like to thank Ellen Eidem, M.S. for her leadership and devotion to the Cervical Cancer Prevention and Education Initiative. We would also like to thank Ricardo Contreras, M.P.H. for his assistance with all project aspects, especially for producing the maps. We also appreciate the assistance and expertise of Luci Kwak on all topics related to the media campaign and marketing. Suggested Citation: Stone-Francisco S, Gonzaga G, Samuels SE. Los Angeles County Office of Women’s Health Cervical Cancer Prevention and Education Initiative: Analysis of Mass Media Campaign and Hotline, Final Report. Samuels & Associates, 2003.

Samuels & Associates 3
INTRODUCTION After the OWH was created by the Los Angeles County Board of Supervisors, its advisory body, the Women’s Health Policy Council, selected cervical cancer as the first initiative because of the exceptionally high rates among women of color for a disease that is preventable. Although, the incidence and mortality of invasive cervical cancer have been greatly reduced in the last fifty years, in large part due to the introduction of diagnostic techniques such as the Papanicolaou (Pap) test (Kim, et al., 1978; Lawson, et al., 2000; Levi, et al., 1996), women of color suffer incidence rates of cervical cancer nearly two times higher than that of white women (Glanz, et al., 2003). Los Angeles County is one of the most ethnically diverse areas in the United States and the cervical cancer rates for women of color are even more severe. For example, the 1996-2000 incidence rate among Latinas in Los Angeles County was 18.3 per 100,000 in comparison to 8.1 per 100,000 among white women in Los Angeles County and 8.7 per 100,000 among all women in the US (Liu, et al., 2003; SEER, 2003). Latinas comprise the largest single racial/ethnic population in Los Angeles County, and are likely the group most at risk. But this problem extends to other racial/ethnic groups as well. Black non-Latina women in LA County, for example, had an incidence of 11.7 per 100,000, and for all Asian & Pacific Islander groups combined the incidence was 11.2 per 100,000 women during 1996-2000 (Liu, et al., 2003). The incidence among Korean women approaches that of Latinas at 15.7 per 100,000. To ameliorate these health disparities in Los Angeles County, the Los Angeles County Department of Health Services Office of Women’s Health (OWH) implemented the Cervical Cancer Prevention and Education Initiative (CCPEI) in 2002 after a successful pilot project in 2000. A multi-method intervention was designed to link women with limited financial means who were at high-risk of cervical cancer with free screenings. The intervention methods included a 2-year mass media campaign, several types of outreach efforts, and a group of community-based grantees who were well known in their communities. Funding for the CCPEI project, which included the media campaign and the outreach efforts, came from matched funds between The California Endowment and the LA County Board of Supervisors. Much of the outreach efforts were designed to educate women about cervical cancer and inform them about the hotline, where eligible women could schedule a free cervical cancer screening at a local clinic. The primary audience of the program was women with an income at or below 200% of the Federal Poverty Level who did not have insurance. Women with an income above this level were referred to a provider offering free or low-cost screening services, and women who had insurance or were eligible for Medi-Cal were encouraged to use their own provider. Eligible women without insurance were referred to a provider in the Clinical Provider Network developed by the Office of Women’s Health. This final comprehensive evaluation report analyzes the Office of Women’s Health hotline data collected between January 2002 and August 2003. Similar to the first report, the current work describes the women who called the hotline to make an appointment during the campaign. However, this report includes follow-up data on appointments and Pap test results.

Samuels & Associates 4
The emphasis of the campaign was to reach low income minority women who were most “at risk” for developing cervical cancer, that is, women who had not obtained Pap testing within three years, the maximum recommended time between Pap tests (Saslow, et al., 2002). This report focuses on describing the racial/ethnic and economic composition, testing frequencies, and how callers learned of the hotline for those women who scheduled appointments. This report also addresses the demographic composition of women who attended appointments compared to those who did not, and women who received normal Pap test results compared to those who did not. This final report analyzing data collected from the hotline is intended to provide a picture of three sets of women: 1) women who made an appointment through the hotline, 2) women who followed through with their appointment, and 3) women who received an abnormal Pap test result during the first 20 months of the 2-year project: from January 2002 to August 2003. However, campaign activities and the provision of cervical cancer screening will continue through December 2003. A cost analysis presents the amount of money spent on each media type per racial/ethnic group and how effective it was at getting women to make and attend screening appointments. Finally, a cost-benefit analysis presents the amount of money saved from early detection through cervical cancer screenings. THE MULTI-CULTURAL MEDIA, OUTREACH & EDUCATION CAMPAIGN Media Campaign A multifaceted multi-cultural 2-year media, outreach, and education campaign was launched in January 2002 to educate women about cervical cancer and promote the hotline. OWH hired marketing agencies through a competitive bidding process to design and implement comprehensive communication plans (a marketing plan including an emphasis on the media type, public relations and community outreach methods used). Each agency had a particular ethnic focus (Latina, African American, Asian (Korean, Chinese, Vietnamese, Filipina and Cambodian), and Armenian) to conduct media campaigns to reach the maximum number of low-income women at high-risk for cervical cancer in the Los Angeles County area. Each media campaign was tailored to the specific ethnic community through the content and type of media. For example, Acento Advertising secured Cristina Saralegui, a world-renowned Latina television personality as a spokesperson for the Latina campaign, which heavily emphasized television advertising. Advertisements and Public Service Announcements (PSA) were run, public relations efforts were conducted on ethnic-directed television, radio stations and print ads were circulated in ethnically addressed newspapers throughout the Los Angeles area. In combination, both paid and unpaid media elements were carried out during the entire year. However, due to the expense of paid media, unpaid media was capitalized upon to the fullest extent. Paid media during the first year of the two-year campaign ran primarily between January thru May and September through October 2002, with the heaviest paid components run during January, May, and October corresponding with Cervical Cancer Awareness Month, Women’s Health Month, and Breast Cancer Awareness Month, respectively. Paid media during the second year of the campaign ran primarily during January and from March through May. 1
1 Additional media and outreach activities were conducted during the remainder of the year in the African American, Armenian, and Filipino communities; however, overall, the majority of the paid media campaign had completed by May 2003.

Samuels & Associates 5
Outreach Office of Women’s Health staff and volunteers participated in 94 days of health fairs in areas likely to be populated by low income women of color throughout the first twenty months of the campaign. While the health fairs were conducted in predominantly Chinese, Latino, and African American areas, most health fairs drew many ethnic groups. These outreach efforts provided women in the community with education on a range of health issues, including breast and cervical cancer. Cervical cancer screening services were publicized through the distribution of flyers, magnets, 1-800-hotline half-sheets, and other educational materials. Moreover, these outreach efforts were often covered by a local news channel, which provided additional coverage of the campaign. The Women’s Health Mobile Van Outreach Program was piloted during Women’s Health Month in May 2002. The van visited locations throughout the community, such as parks, schools, churches, community centers, recovery homes, Latin American consulates, and other community locations. A range of services are provided on the van, including diabetes, hypertension, cholesterol, STD and cervical cancer screening as well as gynecological and breast examinations. This was done in an effort to provide services to women who would have been unable to go to a clinic due to time, transportation, childcare, and cost barriers. Any woman who received an abnormal Pap test result was followed up by a physician, and appointments were made in an attempt to find her a medical home. The OWH recruited many organizations interested in cervical cancer prevention throughout Los Angeles County to become Community Partners. Approximately 300 Community Partners ranged in organizational nature from health and women’s clinics or centers, adult schools, and individual physicians. All Community Partners agreed to participate in quarterly meetings in addition to some of the following activities: disseminate literature about cervical cancer and the OWH hotline, participate in health fairs, refer clients to the hotline and accept patients referred from the hotline. Therefore, in addition to the outreach activities of OWH staff and the mobile van, the message stressing the importance of regular cervical cancer screening was disseminated broadly by people and organizations throughout the community, evidenced by the fact that 750,000 pieces of literature in eight targeted languages have been distributed. Grantees In a separate grant provided by The California Endowment, 21 community-based organization grantees were funded by the Los Angeles Women’s Foundation (LAWF)2 to implement outreach and education activities. The purpose of these activities was to promote cervical cancer screening among hard to reach, high-risk populations with whom the organizations were closely connected. Some of the grantees utilized the hotline as their source of screening services. Other grantees had an in-house clinic or a pre-existing relationship with a provider in their community that they used to link women with the appropriate services. Hotline Women who called the hotline were offered an option to speak with an operator in Spanish, Vietnamese, Mandarin, Cantonese, Armenian, Korean, or English, and for a brief time Khmer. Uninsured women with an income below 200% of the Federal Poverty Level who lived in Los 2 The Los Angeles Women’s Foundation has been incorporated into the Women’s Foundation of California.
Samuels & Associates 6
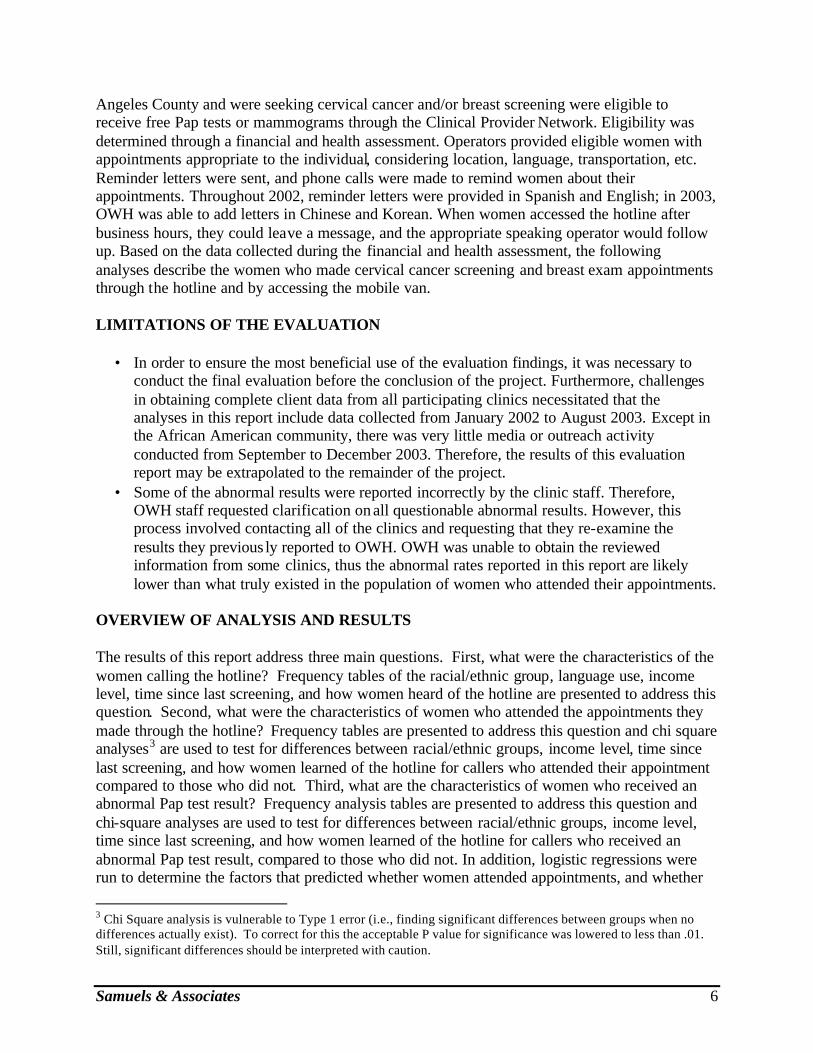
Angeles County and were seeking cervical cancer and/or breast screening were eligible to receive free Pap tests or mammograms through the Clinical Provider Network. Eligibility was determined through a financial and health assessment. Operators provided eligible women with appointments appropriate to the individual, considering location, language, transportation, etc. Reminder letters were sent, and phone calls were made to remind women about their appointments. Throughout 2002, reminder letters were provided in Spanish and English; in 2003, OWH was able to add letters in Chinese and Korean. When women accessed the hotline after business hours, they could leave a message, and the appropriate speaking operator would follow up. Based on the data collected during the financial and health assessment, the following analyses describe the women who made cervical cancer screening and breast exam appointments through the hotline and by accessing the mobile van. LIMITATIONS OF THE EVALUATION
• In order to ensure the most beneficial use of the evaluation findings, it was necessary to
conduct the final evaluation before the conclusion of the project. Furthermore, challenges in obtaining complete client data from all participating clinics necessitated that the analyses in this report include data collected from January 2002 to August 2003. Except in the African American community, there was very little media or outreach activity conducted from September to December 2003. Therefore, the results of this evaluation report may be extrapolated to the remainder of the project.
• Some of the abnormal results were reported incorrectly by the clinic staff. Therefore, OWH staff requested clarification on all questionable abnormal results. However, this process involved contacting all of the clinics and requesting that they re-examine the results they previous ly reported to OWH. OWH was unable to obtain the reviewed information from some clinics, thus the abnormal rates reported in this report are likely lower than what truly existed in the population of women who attended their appointments.
OVERVIEW OF ANALYSIS AND RESULTS The results of this report address three main questions. First, what were the characteristics of the women calling the hotline? Frequency tables of the racial/ethnic group, language use, income level, time since last screening, and how women heard of the hotline are presented to address this question. Second, what were the characteristics of women who attended the appointments they made through the hotline? Frequency tables are presented to address this question and chi square analyses3 are used to test for differences between racial/ethnic groups, income level, time since last screening, and how women learned of the hotline for callers who attended their appointment compared to those who did not. Third, what are the characteristics of women who received an abnormal Pap test result? Frequency analysis tables are presented to address this question and chi-square analyses are used to test for differences between racial/ethnic groups, income level, time since last screening, and how women learned of the hotline for callers who received an abnormal Pap test result, compared to those who did not. In addition, logistic regressions were run to determine the factors that predicted whether women attended appointments, and whether
3 Chi Square analysis is vulnerable to Type 1 error (i.e., finding significant differences between groups when no differences actually exist). To correct for this the acceptable P value for significance was lowered to less than .01. Still, significant differences should be interpreted with caution.

Samuels & Associates 7
they received an abnormal result. However, none of the logistic regressions were significant; therefore, they are not presented in the text. For most chi square analyses, only the five largest racial/ethnic groups (Mexican, Central American, Chinese, Korean, and African American) were used because the inclusion of other groups would magnify the possibility of finding spurious significant results. Although an emphasis in media, outreach, and education was made in the Armenian, Cambodian, Filipina, and Vietnamese populations, the number of appointments made for women in these communities was too small to include them in some specific analyses. SUMMARY OF KEY FINDINGS
• A significant number of women utilized the hotline to make cervical cancer screening
appointments. • The campaign was successful in reaching target audiences who were not receiving
recommended screenings for cervical cancer, particularly for Chinese and Korean women.
• Specific media sources were more successful than others for different racial/ethnic groups: television for Mexicans and Central Americans, newspaper and radio for Chinese and Koreans, and outreach for African Americans.
• Nearly two times the number of appointments were made in months when the paid media campaign was running than during months when the paid media campaign was not running.
• Specific media sources cost less than others per appointment made and attended for each racial/ethnic group. Those that seem most cost-effective were television for Latinas, Vietnamese, and Cambodians, radio for Chinese, newspaper for Koreans, and outreach for African Americans. However, all media sources proved to be expensive for reaching at-risk Filipina and Armenian women, and getting them to attend the appointment they made.
• Of the women who used the hotline as a method of scheduling appointments, over 50% had not been screened within the recommended guidelines, more than 95% were of the targeted racial/ethnic and economic groups, suggesting that the methods used to inform women of the hotline were appropriate for the intended populations.
• In the first twenty months of the initiative, cervical cancer screening and breast exam appointments were made for 11,376 women. Operators answered 25,600 calls for health services including cervical cancer screening.
• In the first year alone, there were approximately 20 million media impressions. • Approximately $1.6 million was estimated to be saved in future costs associated with
high grade cervical lesions or invasive cancers from the women screened in the campaign between January 2002 and August 2003.

Samuels & Associates 8
DESCRIPTION OF RESULTS WHAT WERE THE CHARACTERISTICS OF THE WOMEN WHO MADE APPOINTMENTS USING THE HOTLINE? Table 1. Ethnicity of the Hotline Callers who made an Appointment to be Screened
2002 Jan – August 2003 Total4
Ethnicity of Callers Number % of Total Callers
Number % of Total Callers
Number % of Total Callers
Latina (total) 4,270 63.2% 2,600 56.0% 6,870 60.4%
Mexican 2,676 39.6% 1,564 33.9% 4,240 37.3%
Central American 1,283 19.0% 826 17.9% 2,109 18.5%
South American 177 2.6% 110 2.4% 287 2.5%
Caribbean 79 1.2% 65 1.4% 144 1.3%
General/Other 55 0.8% 35 0.8% 90 0.8%
Asian (total) 1,957 29.0% 1,145 24.8% 3,102 27.3%
Chinese 856 12.7% 454 9.8% 1,310 11.5%
Korean 709 10.5% 406 8.8% 1,115 9.8%
Filipina 55 0.8% 136 2.9% 191 1.7%
Thai 146 2.2% 35 0.8% 181 1.6%
Vietnamese 103 1.5% 51 1.1% 154 1.4%
Cambodian 39 0.6% 10 0.2% 49 0.4%
General/Other 49 0.7% 53 1.2% 102 0.9%
African American 221 3.3% 497 10.8% 718 6.3%
Caucasian 174 2.6% 200 4.3% 374 3.3%
Armenian 92 1.4% 154 3.3% 246 2.2%
Pacific Islander/Other 8 0.1% 3 0.1% 11 0.1%
Other/Unknown 31 1.1% 24 0.4% 55 0.5%
Total 6,753 100.0% 4,623 100.0% 11,376 100.0%
Table 1 shows the results of the racial/ethnic breakdown of women who made hotline appointments from year one to year two. The primary difference between the two years of the campaign lies in the timing of the ethnic specific media components. Some marketing agencies
4 The total number of appointments made varies slightly from analysis to analysis due to missing data.

Samuels & Associates 9
did not begin rolling out their campaign elements until much later in the first year (2002), or even until the beginning of the second year (2003). Therefore, the only significant difference in the composition of the hotline callers who made an appointment between the two years is race/ethnicity. From the first to the second year, Latinas comprised considerably less of the total population of appointments made; this decrease comes most appreciably from the Mexican women. All groups of Asian women also comprised a smaller proportion of the total number of appointments made. African Americans, Caucasians, Armenians, and Filipinas all comprised a greater proportion of all hotline appointments made in the second year as compared to the first year, presumably because the African American, Armenian, and Filipina marketing campaigns were not fully implemented until the second year. Furthermore, the number of African American, Armenian, and Filipina women who made an appointment in the second year is appreciably greater, irrespective of the length of data collection periods (12 months vs. 8 months). Overall, Latinas comprised the majority (60.4%) of callers who made appointments. The largest sub-groups of Latinas were Mexican (37.3% of all appointments), and Central American (18.5%) women. The overall category of Asians comprised over one quarter (27.3%) of all of the hotline appointments, made up almost equally by Chinese (11.5% of all appointments) and Koreans (9.8% of all appointments). African American women comprised the third largest group with 6.3% of all appointments made. Of the remaining groups, Caucasians (3.3%), South Americans (2.5%), and Armenians (2.2%) were the largest. None of the other groups comprised more than 2% of the total number of hotline callers who made screening appointments.
Table 2. Income Level of Hotline Callers who Made an Appointment
Table 2 shows the income level of the women who called the hotline and made an appointment. For ease in interpretability, the income values were transformed into percentages of the Federal Poverty Level. As was expected, nearly all (98.5%) of the women who made appointments had an income at or below 200% of the Federal Poverty Level; other callers were referred to alternate screening sources. Furthermore, the vast majority (88.0%) were at or below 133% of the Federal Poverty Level.
Income Level of Callers Number %
At or below 133% FPL 10,006 88.0%
133%-200% FPL 1,190 10.5%
Above 200% FPL 171 1.5%
Total 11,367 100.0%

Samuels & Associates 10
Table 3. Preferred Language of Hotline Callers who made an Appointment
Table 3 shows the preferred language of women who called and made a screening appointment through the hotline. As expected, given that 60.4% of the women who called the hotline identified as Latina (Table 1), over half (52.2%) of the women who made appointments selected Spanish as their preferred language. English was the preferred language by approximately one quarter (23.9%) of all callers. Subsequently, Korean (9.2%), Mandarin (8.4%), Cantonese (3.3%), and Armenian (1.8%) were next most preferred languages. No other language was preferred by more than 1% of the callers who made appointments.
Table 4. Last Screening of Hotline Callers who made an Appointment. Table 4 displays the time since last screening of women who made appointments through the hotline. The emphasis of the campaign was to reach those most “at risk,” or those who had not had a Pap test in the last three years, the recommended maximum period between screenings (Saslow, et al., 2002). More than one quarter (28.3%) of the women who made appointments through the hotline fell into this category. Women who have not been screened in the past 2 years are considered overdue for a screening. More than half (51.0%) of the women who made appointments through the hotline were overdue for a cervical cancer screening appointment. A further analysis was done to test for differences between the racial/ethnic groups in the last time women had been screened. The pictorial results can be seen in Figure 1. The five largest racial/ethnic groups (African American, Chinese, Korean, Mexican, and Central American) were
Language of Callers Number %
Spanish 5,935 52.2%
English 2,714 23.9%
Korean 1,046 9.2%
Mandarin 955 8.4%
Cantonese 370 3.3%
Armenian 201 1.8%
Thai 73 0.6%
Vietnamese 57 0.5%
Other/Unknown 22 0.2%
Total 11,373 100.0%
Last Screening of Callers Number %
Less than 1 year 813 7.1%
1-2 years 4,549 40.0%
2-3 years 2,589 22.7%
3 or more years 2,418 21.3%
Never 795 7.0%
Unknown 212 1.9%
Total 11,376 100.0%

Samuels & Associates 11
used for this comparison because these five groups were large enough to make statistical comparisons. A chi-square test was done with racial/ethnic group and time of last screening as the two independent variables. A significant result was found (χ2 (16) = 527.22, p < .001) suggesting that there are real differences between these five racial/ethnic groups in the last time women had been screened. Figure 1. Percentage of Callers by Ethnic Groups and Time Since Last Screening
0
5
10
15
20
25
30
35
40
45
50
Less than 1year
1-2 years 2-3 years more than 3years
never
Per
cent
age
of G
roup
African American
Asian/Chinese
Asian/Korean
Mexican
Central American
Figure 1 depicts the differences in screening practices among the five major racial/ethnic groups that made appointments through the hotline. Asian/Chinese women were the women most likely to have never had a cervical cancer screening appointment : 18.7% compared to 7.0% in the total sample. Conversely, African American women were the most likely to have had a screening within the past year: 16.9% compared to 7.1% in the total sample. The majority of women who made appointments had their last screening 2 or more years ago.

Samuels & Associates 12
Table 5. How Women Reported Learning of the Hotline. Table 5 shows how callers who made appointments learned about the hotline. Since most of the Latina advertising occurred through television, it is expected that most (40.9%) of the women reported learning about the hotline through the television. However, outreach was also a significant source of referrals to the hotline (28.3%), with most of these respondents stating that they learned of the hotline through either a flyer (10.4%), or a health fair (9.7%). Newspapers (9.9%), friends (9.2%), and the radio (6.7%) were also significant sources promoting the hotline. Respondents also reported learning of the hotline through clinics (3.8%), churches (3.3%), and community-based organizations (CBO) (1.2%). Nearly half (48.6%) of the respondents referred from a CBO were referred by Thai Community Development Center.5
The intervention activities of the media agencies seemed to differ slightly between the two years of the campaign. For example, in the second year more women who made appointments identified health fairs and flyers as their source of learning of the hotline. This was in large part due to the outreach activities of the African American campaign that took place in the second year. Furthermore, multi- lingual hotline operators conducted outreach efforts into each of the targeted ethnic-specific communities.
5 This percentage is an underestimate of the total number of calls generated by the LAWF funded community-based organizations, which often times operated at churches, clinics, and health fairs and by using flyers. The data obtained by the hotline could not, however, distinguish whether callers reported learning of the hotline through a grant sponsored outreach event.
Sources of Media/Outreach Number %
Television 4,657 40.9%
Newspaper/Journal 1,122 9.9%
Friend 1,044 9.2%
Radio 757 6.7%
Outreach 3,221 28.3%
Flyers 1,189 10.4%
Health Fair 1,104 9.7%
Clinic 427 3.8%
Church 371 3.3%
Community-based Organizations 141 1.2%
Pilot Program Patient 51 0.4%
Other/Unknown 513 4.5%
Total 11,376 100.0%

Samuels & Associates 13
Figure 2. The Number of Appointments Made per Month
0
200
400
600
800
1000
1200
1400Ja
nFe
bM
arA
prM
ay Jun
Jul
Aug
Sep Oct
No
vD
ec Jan
Feb
Mar
Apr
May Jun
Jul
Aug
2002 2003
Num
ber
of A
ppoi
ntm
ents
Figure 2 shows the number of appointments made each month throughout the 20 months for which this report is covering. The majority of the appointments were made when the paid campaign months were the strongest: January through May and September through October during 2002, and Jan through May (excluding February) during 2003.6 During times when paid media was not running, unpaid media, such as Pub lic Service Announcements, were running. During months in which four or more marketing campaigns (of 7) were conducting paid campaign activities, the hotline made on average 724 appointments per month, compared to 379 appointments in months when less paid media campaign activities were conducted. On average, the number of appointments made through the hotline was 1.9 times greater during months when the bulk of the paid campaign was running than when significantly less paid media was running. 6 The month in which the heaviest paid media was run are represented by the black bars in Figure 2.

Samuels & Associates 14
A further analysis was done to test if there were differences between racial/ethnic groups in the source by which women had learned about the hotline. These results are presented pictorially in Figure 3. The five largest racial/ethnic groups (African American, Chinese, Korean, Mexican, and Central American) were used for this comparison. A chi square test was done with racial/ethnic group and source of hotline knowledge as the two independent variables. A significant result was found (χ2 (20) = 3611.32, p < .001) suggesting that there are true differences between these five racial/ethnic groups in the source from which women learned about the hotline. Figure 3. The Percentage of Women who Made Appointments by Ethnic Group and How they Learned about the Hotline
0
10
20
30
40
50
60
70
TV Newspaper Radio Friend Outreach Other
Per
cent
age
of G
roup
African American
Asian/Chinese
Asian/Korean
Mexican
Central American
Figure 3 shows the percentage of women who made appointments from each major racial/ethnic group, and how they learned of the hotline. As expected, television was reportedly the major source of Mexican and Central American callers. Newspapers/journals and the radio were most reported by Chinese and Korean women as their source of learning of the hotline. African American and Chinese women were more likely than other racial/ethnic groups to be referred to the hotline from a friend. Although all racial/ethnic groups had a significant proportion referred to the hotline through outreach, African American and Korean women were more likely than Chinese, Mexican, and Central American women to learn of the hotline from this source.

Samuels & Associates 15
WHAT WERE THE CHARACTERISTICS OF THE WOMEN WHO ATTENDED AN APPOINTMENT THEY MADE WITH THE HOTLINE? The data used to answer this question includes women who called the hotline, made an appointment for cervical cancer screening at a clinic and then the clinic returned the data on whether she made or did not make the appointment. In all cases, it was up to the clinic to report if a woman did not attend her screening appointment (no-show). Overall, 83% of records were provided to OWH. The implication here is that there are likely many more women that either did or did not show up to their appointment for which the clinics did not report the information to the OWH. Table 6. Ethnicity of the Hotline Callers who Attended Their Screening Appointment Table 6 shows the proportion of women that attended their screening appointment compared to those who did not attend their appointment within each racial/ethnic group. Nearly two-thirds (62.5%) of all Latinas attended their screening appointment. Slight variation shows that South American women attended their appointments slightly more proportionately (66.7%) than the Mexican (62.2%), Central American (62.2%), and
Show No Show Total
Ethnicity of Callers Number % of Total
Callers
Number
% of Total
Callers
Number
% of Total
Callers
Latina 2,853 62.5% 1,712 37.5% 4565 100.0%
Mexican 1,786 62.2% 1,085 37.8% 2871 100.0%
Central American 848 62.2% 515 37.8% 1363 100.0%
South American 122 66.7% 61 33.3% 183 100.0%
Caribbean 54 62.8% 32 37.2% 86 100.0%
General/Other 43 69.4% 19 30.6% 62 100.0%
Asian 1404 73.5% 507 26.5% 1911 100.0%
Chinese 730 76.4% 226 23.6% 956 100.0%
Korean 431 75.2% 142 24.8% 573 100.0%
Filipina 44 54.3% 37 45.7% 81 100.0%
Thai 56 55.4% 45 44.6% 101 100.0%
Vietnamese 83 72.8% 31 27.2% 114 100.0%
Cambodian 23 76.7% 7 23.3% 30 100.0%
General/Other 37 66.1% 19 33.9% 56 100.0%
African American 184 61.3% 116 38.7% 300 100.0%
Caucasian 102 57.6% 75 42.4% 177 100.0%
Armenian 40 57.1% 30 42.9% 70 100.0%
Pacific Islander/Other 6 85.7% 1 14.3% 7 100.0%
Other/Unknown 14 51.9% 13 48.1% 27 100.0%
Total 4,603 65.2% 2,454 34.8% 7057 100.0%

Samuels & Associates 16
Caribbean (62.8%) women. Approximately three-quarters of Chinese (76.4%), Korean (75.2%), Vietnamese (72.8%), and Cambodian (76.7%) women attended their appointments. However, only slightly more than half of Thai (55.4%) and Filipina (54.3%) women attended the screening appointments they made through the hotline: Thai and Filipina were the two racial/ethnic groups with the lowest attendance rate. However, Caucasian (57.6%) and Armenian (57.1%) women also had a lower than average attendance rate. Furthermore, a chi square test with the five largest racial/ethnic groups as the independent variable and attendance as the dependent variable revealed a significant effect (χ2 (4) = 94.47, p < .001) suggesting that there are true differences between race/ethnicity and attendance. Table 7. Income Level of Hotline Callers who Attended Their Screening Appointment vs. Those Who Did Not Table 7 shows the proportions of women who attended their appointments compared to those who did not according to income level. Approximately two-thirds of women with an income below 200% FPL attended their appointments. Women with an income in the 133%-200% FPL range were more likely to attend their appointments than those with an income at or below 133% FPL. Although the attendance rate for those with an income above 200% FPL is less than half (47.6%), this sample size is very small, thus interpretability is less reliable. A chi square analysis was performed using income level and attendance as the independent and dependent variables, respectively. No significant result was found (χ2 (2) = 9.28, p = ns) suggesting that there are no real differences between income levels and attendance rates.
Income Level of Callers Show % No Show % Total %
At or below 133% FPL 4,082 65.0% 2,202 35.0% 6284 100.0%
133%-200% FPL 499 68.4% 230 31.6% 729 100.0%
Above 200% FPL 20 47.6% 22 52.4% 42 100.0%
Total 4,601 65.2% 2,454 34.8% 7055 100.0%

Samuels & Associates 17
Table 8. Time Since Last Screening of Hotline Callers who Attended Their Screening Appointment vs. Those Who Did Not Table 8 shows the proportions of women who attended their appointments compared to those who did not according to when they were last screened for cervical cancer. Women who had most recently been screened were least likely (59.6%) to attend the screening appointment they made through the hotline. Women who were considered “at risk” for developing cervical cancer, that is women who had not been screened in three or more years, were the most likely (68.2%) to attend their appointment. A chi square analysis was performed using last screening of the callers and attendance as the independent and dependent variables, respectively. A significant result was found (χ2 (4) = 15.3, p < .01) suggesting that there are real differences between time since last screening and attendance rates. Table 9. How women reported learning of the Hotline, by Those who Attended Their Screening Appointment vs. Those who Did Not Attend Screening Appointment
Table 9 shows the proportions of women who attended their appointments compared to those who did not according to the way in which they reported learning of the hotline. Women who
Time Since Last Screening of Callers
Show
% No Show %
Total
%
Less than 1 year 124 59.6% 84 40.4% 208 100.0%
1-2 years 1,897 63.3% 1,099 36.7% 2996 100.0%
2-3 years 1,135 66.5% 572 33.5% 1707 100.0%
3 or more years 1,051 68.2% 489 31.8% 1540 100.0%
Never 372 66.2% 190 33.8% 562 100.0%
Total 4,579 65.3% 2,434 34.7% 7013 100.0%
Sources of Media/Outreach Show % No Show % Total %
Television 2,107 63.9% 1,190 36.1% 3297 100.0%
Newspaper/Journal 542 71.4% 217 28.6% 759 100.0%
Friend 467 64.9% 253 35.1% 720 100.0%
Radio 389 75.5% 126 24.5% 515 100.0%
Outreach 933 61.7% 578 38.3% 1511 100.0%
Other/Unknown 166 64.8% 90 35.2% 256 100.0%
Total 4,604 65.2% 2,454 34.8% 7058 100.0%

Samuels & Associates 18
learned of the hotline through the radio and newspaper showed the highest proportion of attendance, 75.5% and 71.4%, respectively. Television ads (63.9%) and friends (64.9%) were the sources for which the attendance rates were the next highest. Those who discovered the hotline through one of the many outreach efforts showed the lowest rate of attendance (61.7%). A chi square analysis was performed using the source through which women reported learning of the hotline and attendance as the independent and dependent variables, respectively. A significant result was found (χ2 (5) = 47.58, p < .001) suggesting that there are real differences in attendance rates between the various ways women learned of the hotline. WHAT WERE THE CHARACTERISTICS OF THE WOMEN WHO RECEIVED AN ABNORMAL RESULT? The data used to answer this question included women who made an appointment through the hotline, and attended a cervical cancer screening appointment at a clinic that returned the Pap test results to the Office of Women’s Health. The Pap test is a screening tool that detects cervical cancer and its precursors (cervical dysplasia). However it is not a perfect test given that it can miss some cases of cervical dysplasia or it may detect abnormalities that are later found to be benign. Consequently, the following percentages of abnormal rates do not represent the prevalence of cervical cancer among these popula tions; however, they do approximate which populations reached by this initiative are at highest risk of developing cervical cancer. Table 10. Ethnicity of the Hotline Callers who Received a Normal Pap Test Result vs. Those who Received an Abnormal Result Table 10 shows the proportions of women who received abnormal results compared to those who received normal results for the five major racial/ethnic groups. For these women, the overall abnormal Pap test rate was 6.7%. Among the major five racial/ethnic groups, Chinese women showed the highest abnormal rate of 9.0%, and Mexican women showed the lowest abnormal rate of 6.1%. A chi square analysis was performed using the five most represented racial/ethnic groups as the independent variable and abnormal rates as the dependent variable. A non-
7 Sample totals are less in this analysis because not all ethnicities are represented.
Ethnicity Normal % Abnormal % Total %
Mexican 1,679 93.9% 110 6.1% 1789 100.0%
Central American 769 93.6% 53 6.4% 822 100.0%
Chinese 615 91.0% 61 9.0% 676 100.0%
Korean 421 94.8% 23 8.8% 444 100.0%
African American 170 91.9% 15 8.1% 185 100.0%
Total 3,654 93.3% 262 6.7% 3916 100.0% 7
Samuels & Associates 19
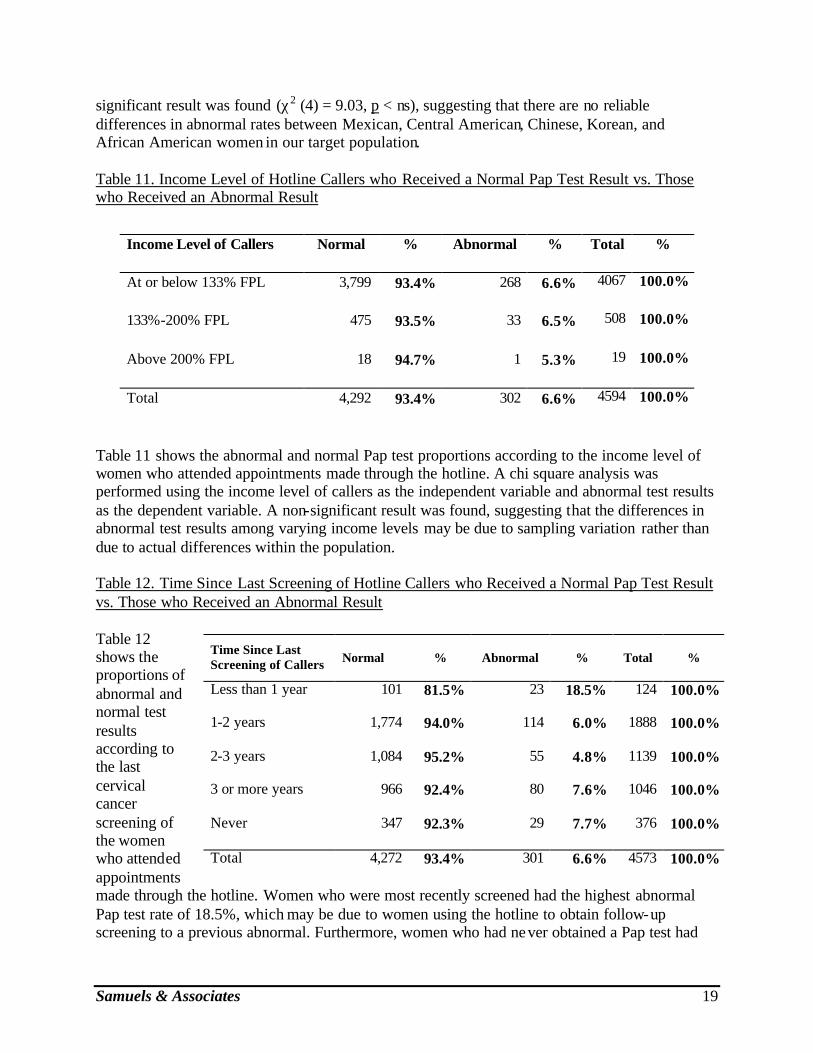
significant result was found (χ2 (4) = 9.03, p < ns), suggesting that there are no reliable differences in abnormal rates between Mexican, Central American, Chinese, Korean, and African American women in our target population. Table 11. Income Level of Hotline Callers who Received a Normal Pap Test Result vs. Those who Received an Abnormal Result
Table 11 shows the abnormal and normal Pap test proportions according to the income level of women who attended appointments made through the hotline. A chi square analysis was performed using the income level of callers as the independent variable and abnormal test results as the dependent variable. A non-significant result was found, suggesting that the differences in abnormal test results among varying income levels may be due to sampling variation rather than due to actual differences within the population. Table 12. Time Since Last Screening of Hotline Callers who Received a Normal Pap Test Result vs. Those who Received an Abnormal Result Table 12 shows the proportions of abnormal and normal test results according to the last cervical cancer screening of the women who attended appointments made through the hotline. Women who were most recently screened had the highest abnormal Pap test rate of 18.5%, which may be due to women using the hotline to obtain follow-up screening to a previous abnormal. Furthermore, women who had never obtained a Pap test had
Income Level of Callers Normal % Abnormal % Total %
At or below 133% FPL 3,799 93.4% 268 6.6% 4067 100.0%
133%-200% FPL 475 93.5% 33 6.5% 508 100.0%
Above 200% FPL 18 94.7% 1 5.3% 19 100.0%
Total 4,292 93.4% 302 6.6% 4594 100.0%
Time Since Last Screening of Callers
Normal
% Abnormal % Total %
Less than 1 year 101 81.5% 23 18.5% 124 100.0%
1-2 years 1,774 94.0% 114 6.0% 1888 100.0%
2-3 years 1,084 95.2% 55 4.8% 1139 100.0%
3 or more years 966 92.4% 80 7.6% 1046 100.0%
Never 347 92.3% 29 7.7% 376 100.0%
Total 4,272 93.4% 301 6.6% 4573 100.0%

Samuels & Associates 20
the second highest abnormal rate of 7.7%; and women who were well overdue for screening, that is, women who had not been screened in 3 or more years also had an above average abnormal rate of 7.6%. A chi square analysis was performed using the time since a woman’s last screening as the independent variable, and abnormal rates as the dependent variable. A significant result was found (χ2 (4) = 38.20, p < .001), suggesting that there are real differences in abnormal test rates between women who were screened at different times. Table 13. How women reported learning of the Hotline, by who Received a Normal Pap Test Result vs. Those who Received an Abnormal Result
Table 13 shows the proportions of abnormal and normal rates according to the source of media or outreach through which women reported learning about the hotline. Women who learned of the hotline from the radio (5.6%) and a friend (6.0%) showed the lowest abnormal rates. Comparatively, those who learned of the hotline through outreach showed the highest abnormal rate (7.1%). However, all of the abnormal rates were within 1% of the average abnormal rate. A chi square analysis using source of media or outreach as the independent variable, and abnormal rates as the independent variable found that the rates of abnormal Pap tests did not differ significantly among women who reported learning of the hotline through different sources.
WHICH ETHNIC SPECIFIC MEDIA ACTIVITIES WERE MOST EFFECTIVE AT GETTING WOMEN TO MAKE AND ATTEND THEIR APPOINTMENT? All callers were asked how they were referred to the hotline when they called in to make an appointment. By combining this data with the total dollar amount spent per racial/ethnic group on each media activity, one is able to assess which media types were most cost-effective. To answer this question, it was examined in three ways. Table 14 indicates the cost of each type of media for getting women to call in and make an appointment analyzed by racial/ethnic group. Table 15 presents the cost of each type of media for getting “at-risk” women to call in and make an appointment analyzed by racial/ethnic group. Table 16 indicates the amount of money spent on each ethnic-specific media for each appointment attended. For each of the three analyses, the average cost for each appointment made by a woman in a particular racial/ethnic group is
Sources of Media/Outreach Normal % Abnormal % Total %
Television 1,960 93.2% 142 6.8% 2102 100.0%
Newspaper/Journal 501 93.6% 34 6.4% 535 100.0%
Friend 440 94.0% 28 6.0% 468 100.0%
Radio 374 94.4% 22 5.6% 396 100.0%
Outreach 860 92.9% 66 7.1% 926 100.0%
Other/Unknown 160 93.6% 11 6.4% 171 100.0%
Total 4,295 93.4% 303 6.6% 4598 100.0%

Samuels & Associates 21
calculated using the total number of calls including those that were not attributed to a particular media activity. Table 14. Amount of Money Spent on Each Media Activity per Caller who Made an Appointment and Reported the Media as the Way they Learned of the Hotline
Campaign Activity
Chinese
($)
Korean
($)
Armenian
($)
Latina
($)
Filipina
($)
Vietnamese
($)
African American
($)
Cambodian
($)
Television 84.03 304.81 138.21 64.62 151.76 134.29 254.89 65.46
Newspaper/Journal 41.66 79.50 159.64 180.33 279.86 239.61 550.73 639.63
Radio 38.32 152.63 --- 96.32 --- 235.30 318.93 441.20
Billboards --- --- --- --- --- --- 729.36 ---
Outreach --- --- --- --- --- --- 63.49 ---
Average Cost 26.47 46.19 61.99 68.59 76.16 103.54 160.20 198.74
Table 14 shows the cost of each media type by appointment that was made. In each case the total amount spent on that media type was divided by the number of women who reported that media as the way in which they learned of the hotline. As expected, different media activities were more cost-effective at getting women of different racial/ethnic groups to call the hotline and make an appointment: radio and print for Chinese women, print for Korean women, television for Armenian, Latina, Filipina, Vietnamese, and Cambodian women, and outreach for African American women.
To obtain the average cost of the campaign for each racial/ethnic group, the amount spent on each ethnic-specific campaign was divided by the total number of women of that race/ethnicity who made an appointment. Thus, women who learned of the hotline through a friend or through the outreach efforts conducted directly by the OWH were taken into account. Overall, the average cost for Chinese women is lowest, presumably because many of the Chinese women learned of the hotline from a friend and from outreach that was conducted by LAWF or OWH and not as part of the media campaign. Similarly, many of the Korean women reported learning of the hotline through outreach, thus the average cost per appointment is lower than the cost per appointment for each individual media activity. The average cost for Armenian women is much lower than the cost of appointment per media activity because many of the Armenian women were brought into the system through the mobile van. Billboards were only used within the African American campaign, and they do not appear to be a cost-effective way of advertising free cervical cancer screening to low-income women, each appointment referred by a billboard essentially cost $729.36 in billboard spending, compared to $63.49 for each appointment referred by outreach.

Samuels & Associates 22
Table 15. Amount of Money Spent on Each Media Activity per At-risk Caller that Made an Appointment and Reported the Media as the Way they Learned of the Hotline
Campaign Activity
Chinese
($)
Korean
($)
Armenian
($)
Filipina
($)
Vietnamese
($)
Latina
($)
Cambodian
($)
African American
($) Television 197.71 1,490.20 431.20 531.15 239.39 234.06 209.47 802.44
Newspaper/Journal 93.39 217.81 343.85 659.67 768.69 622.64 1,279.25 1,835.75
Radio 86.61 376.48 --- --- 941.20 4,430.00 1,213.30 1,395.31
Billboards --- --- --- --- --- --- --- 5,105.50
Outreach --- --- --- --- --- --- --- 319.33
Average Cost 62.03 134.81 190.63 202.04 253.10 268.54 541.02 701.35
Table 15 shows the amount of money spent on each media component per appointment that was made by a woman who was “at-risk”, that is a woman who had not had a Pap test in the past three years, or had never had a Pap test. It cost the least to get “at-risk” Chinese women to make a cervical cancer screening appointment; and, it cost the most to get “at-risk” African American women to make an appointment. Again, radio was most cost effective at getting “at-risk” Chinese women to make an appointment. Newspapers/journals were most cost-effective at getting Korean and Armenian women to make an appointment. Television was most cost-effective for “at-risk” Vietnamese, Latinas, and Cambodians. Radio appears to be an ineffective way of motivating “at-risk” Latina women to make appointments, and all media types proved to be expensive for reaching “at-risk” Filipinas.
Table 16. Amount of Money Spent on Each Media Activity per Appointment Attended
Campaign Activity
Chinese
($)
Korean
($)
Latina
($)
Vietnamese
($)
Filipina
($)
Armenian
($)
Cambodian
($)
African American
($) Television 146.13 638.66 133.80 203.92 483.86 598.89 174.56 902.75
Newspaper/Journal 67.11 148.83 375.00 399.35 839.58 638.57 1,279.25 1,573.50
Radio 56.07 262.66 2,560.00 376.48 --- --- 970.64 875.49
Billboards --- --- --- --- --- --- --- 1,701.83
Outreach --- --- --- --- --- --- --- 264.14
Average Cost 46.91 114.95 158.67 183.28 202.04 363.10 423.40 580.91
Table 16 shows the amount of money spent on each media per appointment that was attended. Consistent with the other two cost analyses, it was least expensive to get each Chinese woman in

Samuels & Associates 23
for an appointment, and it was most expensive to get each African American woman in for an appointment. Radio was most cost-effective at getting Chinese women to attend their appointments. Television was most cost-effective at getting Latina, Vietnamese, and Cambodian women to make and attend an appointment. However, none of the media campaign activities were cost-effective for Filipinas or Armenians considering that television—the media that cost the least—still cost $480-600 per appointment attended. African American women were most effectively reached through outreach activities. Newspapers seem least cost-effective at bringing in Cambodian and African American women to make and attend an appointment. For Latina women, radio does not seem to be an effective method of drawing in women to make and keep cervical cancer screening appointments. HOW MUCH MONEY DID THE CERVICAL CANCER PREVENTION AND EDUCATION INITIATIVE SAVE THE STATE AND COUNTY? Applying a cost-benefit analysis to the campaign estimates both the number of cervical cancer test abnormalities that would progress to high grade lesions or cancer and approximates their associated financial costs to the health care system. This analysis expands the importance of not only the human factors associated with cervical cancer prevention but the cost savings as well. Approximately $1.6 million was saved in future costs associated with high grade cervical lesions or invasive cancers from the women screened in the campaign between January 2002 and August 2003. By screening, diagnosing and treating all precursors of cervical cancer early, both the State of California and the County of Los Angeles saved future health care costs associated with high grade lesions and cervical cancer. The savings were derived by applying cost data associated with each stage of cervical abnormality to the estimated percentage of each stage that progresses to a high grade lesion or invasive cancer. The abnormal cervical cancer screening test results returned to the OWH from the Clinical Provider Network were classified as ASCUS (atypical squamous cells of undetermined significance), AGUS (atypical glandular cells of undetermined significance), LSIL (low-grade squamous intraepithelial lesion), HSIL (high-grade squamous intraepithelial lesion), and cancer. The approximate dollar amount associated with the costs of diagnosis, treatment and follow-up of high-grade lesions were obtained from 1997 cost data in the federal report titled Evaluation of Cervical Cytology (McCrory, et al., 1999). The costs were applied to the percentage of abnormal cases that would progress over time from an early stage to a later stage of cervical cancer or its precursor. It was determined that an estimated additional $1.6 million would have had to be spent by the State and County if there had not been early screening, diagnosis and treatment.8 Since 1997 is the most current federal cost data available, and given the inflationary rate of
8 The same methodology was applied to the cervical cancer test results that were not returned by the CCPEI clinical network providers as to those that were returned. The percentage of abnormal cervical cancer screenings among "unreturned" Pap test results to the OWH was estimated to approximate the average abnormal test result rate (6.6%) found among CCPEI clients screened for whom Pap test results were returned. The known appointment follow-through rate (67%) was applied to the number of unreturned Pap test results to estimate the number of clients who would keep their appointment. It was then possible to estimate the number of abnormal test results in the "unreturned" Pap test result population.

Samuels & Associates 24
health care costs, the actual savings to the health care system for early detection would actually be substantially higher. DISCUSSION Who did the campaign reach? The campaign and outreach activities were successful at reaching their intended audiences: low income women of color who were overdue for a cervical cancer screening. More than 95% were women of color; three-quarters of all women who called spoke a language other than English as their preferred language. Nearly all (98.5%) of the hotline callers had an income below 200% of the Federal Poverty Level, which is nearly 60% higher than the proportion of LA County’s population with an income under 200% FPL (CHIS, 2001). More than half of the women who made appointments had not had a Pap test in the previous two years. Furthermore, 21.3% had not had a Pap test in the previous 3 years. (Comparatively, only 7.6% of women in LA County with the same income have not had a Pap test in the last 3 years (CHIS, 2001).) An additional 7.0% of the women who made an appointment through the hotline had never been screened. The media campaign and outreach activities of the Office of Women’s Health had seven racial/ethnic populations that were targeted with media campaigns. Those seven groups—African Americans, Armenians, Chinese, Latinas, Koreans, Filipinas, Vietnamese, and Cambodians—comprise the majority of the women who made appointments through the hotline. Over sixty percent of the women who made appointments were Latina, including 2,109 Central American women. Chinese and Korean women comprised over one-quarter of the callers who made appointments. The OWH hired ethnic-specific marketing firms to conduct focused campaigns in communities with the highest cervical cancer incidence rates. For each population, the type of media and outreach efforts implemented in each ethnic campaign were specifically tailored to that population reflecting the expertise of the marketing firm. The monies for each group, and type of media within each group were not evenly distributed. The results show that the tailoring of the campaigns and outreach activities across and within groups led to the success of each racial/ethnic group overwhelmingly citing a particular source of media. For example, a majority of Mexican and Central American women heard of the campaign on television. In contrast, Chinese and Korean women were more likely to hear of the campaign through the newspaper or through the radio. African American women overwhelmingly reported outreach as the primary source through which they learned of the hotline. Thus, it may be best to target each racial/ethnic group via different media sources: television for Latinas, newspapers and radio for Chinese and Koreans, and outreach for African Americans. The timing of the media and outreach campaigns varied for each population. The African American, Armenian, and Filipina marketing activities were not fully implemented until the second year of the campaign; therefore, both of these groups comprised more of the total number of callers in the second year as compared to the first. This contributes to the conclusion that ethnic-specific marketing campaigns were effective at getting women to make cervical cancer screening appointments in LA County. In the first year—when there was little to no marketing attention focused on those communities—comparatively few African American and Armenian women discovered and used the hotline. However, an increase in ethnic-specific advertising was

Samuels & Associates 25
followed by an increase in hotline use from these communities.9 Furthermore, it is likely that the effect of the African American-focused campaign had a reach beyond the African American community into the Caucasian community causing the increase in Caucasian women who called to make appointments, as there was no Caucasian-specific campaign, yet the African American campaign was in English. The hotline was also successful at reaching women in specific populations who were particularly at risk for cervical cancer or overdue for a screening. Chinese women were most likely to have never been screened; and Chinese and Korean women were most likely to have not had a screening in three or more years. Approximately 20% of African American, Mexican, and Central American women who made appointments had not been tested in three years or more. Future campaigns with a similar purpose in the African American and Latina populations may want to adjust the campaign and outreach methods or messages to reach higher risk populations. The African American women reached through this campaign were the most likely group to have been screened most recently, that is, within the last year. When combined with the 1-2 year group, 58.2% of African American women had been screened in the past 2 years. This still leaves 41.8% of African American women who were due or overdue for a screening; however, to make the most impact, messages should more specifically target those women who have not had a screening recently. Additionally, CHIS data supports the finding that African American women tend to be more current with cervical cancer screening than populations who have recently immigrated, such as Latinas, Asians and Pacific Islanders. The Latina women for whom data was available showed a lower than average abnormal rate: 6.1% for Mexicans and 6.4% for Central Americans. However, analyses of the Los Angeles County Cancer Surveillance Program data have found Latinas to have the highest cervical cancer incidence rate in Los Angeles County. Therefore, even though the campaign message and hotline system have been very effective at bringing low income Latinas into the health care system and linking them with free screening services, additional attention must be placed on reaching those truly at-risk populations. It is possible that perhaps television or the particular station that was chosen was not reaching the highest-risk populations. Future messages to Latina women could be improved by focusing more specifically on women who are at higher risk for cervical cancer, such as those who have the human papilloma virus (HPV), multiple sex partners, and those who smoke (Nold, 1998). Additional analyses are required to understand this phenomenon. What factors were related to a high appointment attendance? In order for women to receive a Pap test, they must follow-through with the appointment they made; however, often significant barriers lie in their way. For example, in the evaluation of the pilot project, women provided many reasons why they were unable to attend their appointment, such as transportation and child-care. The overall attendance rate was approximately two-thirds (65.2%). Several of the Asian groups showed an attendance rate considerably higher than this: Chinese (76.4%), Korean (75.2%), Vietnamese (72.8%), and Cambodian (76.7%). The UCLA Health Policy Research Center 9 The African American marketing firm also conducted extensive outreach activities as part of their campaign efforts.

Samuels & Associates 26
demonstrated that testing among Asian women is significantly lower than that for white women, especially when limited English language proficiency is also an issue (Ponce, et al., 2003). The higher than expected attendance rate could be attributable to three reasons 1) the media campaign educating women about the availability of services was done in a linguistically and culturally appropriate manner, 2) the hotline operators spoke women’s preferred language, and 3) women were linked with providers that spoke a similar language, thereby removing the negative effects of limited English proficiency. Especially in light of the significant barriers faced by women of color with low incomes, the campaign and hotline system were effective at getting women with the greatest need of obtaining cervical cancer screening to follow through with their appointments. In this sample, “at-risk” women (i.e. those who hadn’t been screened in at least 3 years) were the most likely to attend their appointment when compared to women who reported a shorter time since their last screening. This example is most clearly seen with Chinese and Korean women, who report the longest time between screenings. Newspapers and radio—the main source reported by Chinese and Korean women—showed the highest rate of attendance to appointments made through the hotline. Newspaper and radio were effective at linking “at-risk” women to call into the hotline and to follow-through with their appointment. Women who were most current on their cervical cancer screening, that is women who had been tested in the last year, were the least likely to attend the screening appointment they made through the hotline. Thus, not only is the hotline effective at getting women who have not tested in for screening, it may also be beneficial as a source for women who have had a previous abnormal Pap test to get follow-up testing and care. However, women who were using the hotline as a source of follow-up care could have contributed to the finding of the lowest attendance rate in the most recently tested category. Women who learned of the hotline through outreach were also less likely to attend their appointment than women who heard of the hotline through other ways. Thai and Filipina women had some of the lowest attendance rates with only slightly more than half of the women following through with their appointments. For Thai women, a low attendance rate could be due to the way they were brought into contact with the hotline. Thai CDC, a community-based LAWF grantee, was responsible for bringing most of the Thai women to the hotline. A staff member of Thai CDC initiated phone calls to translate the hotline information for their clients. This could have resulted in less comfort or confidence in being able to successfully navigate through the system, thus leading to a lower propensity to follow-through with the appointment. Additionally, without a Thai speaking hotline operator, if women wanted to call to reschedule their appointment due to a time conflict, they would not have been able to. Qualitative analysis with both Thai and Filipina women, such as that done with Latinas in the pilot study evaluation, could further elucidate the reasons so many of them were not able to attend their appointments. Who were the most “at-risk” for cervical cancer? The main objective of the multi-cultural media, outreach, and education campaign has been to reduce the morbidity and mortality of cervical cancer, particularly among low-income women of color. Therefore, the proportion of women who received abnormal Pap tests results is perhaps the most indicative single piece of evidence of the program’s effectiveness. The hotline was

Samuels & Associates 27
effective at getting women in for testing that were high-risk for developing cervical cancer. The hotline was able to get 372 women in for testing who had never been screened before. Data from those women showed an abnormal rate of 7.7%, which is higher than the sample average. Due to the media campaign and outreach efforts of the Los Angeles County Office of Women’s Health, 303 women with abnormal screening tests, were screened and referred for follow-up testing and treatment. The overall abnormal Pap test rate was 6.6%. These women may not have had this screening opportunity had it not been for the culturally and linguistically appropriate education and service provision of the Office of Women’s Health. Chinese and Korean women had the highest abnormal Pap test rates and were the most likely to attend their screening appointment. Furthermore, most of the media campaign monies for these groups were spent on radio and newspaper activities, consistent with the media sources that Chinese and Korean women responded to. Therefore, one can conclude that this campaign was highly effective at targeting “high-risk” Chinese and Korean women and at getting them in for screening. The medical community would benefit by learning more about the specific activities this campaign used to target Chinese and Korean women. Women who were most recently screened had the lowest appointment attendance rate, yet had the highest abnormal Pap test rate: nearly 20% of women who had been tested in the previous year received an abnormal test result. This finding further supports the likelihood that many women were using the hotline as a source of follow-up care to a previous abnormal result. Furthermore, women who had never been screened or who had not been screened in the last 3 years had a higher than average rate of abnormal results, which supports the necessity of this work. Had it not been for the education and service provision of the OWH multi-cultural media, outreach, and education campaign, it is possible that many of these women would have continued without a cervical cancer screening until it was possibly too late. CONCLUSIONS/LESSONS LEARNED The Cervical Cancer Prevention and Education Initiative Multi-Cultural Media, Outreach, and Education Campaign has been successful in reaching high-risk, low income women of color in LA County. This analysis of the data collected from the women who called the hotline throughout the 2-year program provides information on the characteristics of the women who called the hotline, what factors were related to women attending their screening appointments, and the utility of the media and outreach campaigns in getting high-risk women in for free screening. For the most part, those who called the hotline for appointments were low income, women of color from traditionally underserved communities and had not received regular cervical cancer screening. Prior to contacting the Los Angeles OWH, more than half of the women had not been screened during the recommended time period. A large majority of the women calling the hotline were Latina. Among Asian callers, Chinese and Korean women were most frequently represented. More African Americans called in the second year, when the African American campaign was fully rolled out. Each group learned about the hotline in different ways. Latinas were reached by television, Chinese and Korean women by radio, newspapers, and outreach; and African Americans through outreach efforts. Notably more calls were received when the paid media campaigns were underway.

Samuels & Associates 28
Several important conclusions and lessons learned can be drawn from these findings.
• Designing multi-media strategies allows for appropriate tailoring of media and community outreach to reach different racial/ethnic groups. Part of the success of this campaign can be attributed to the use of different media methods to promote the hotline to different racial/ethnic groups as well as employing ethnically-directed advertising firms that were familiar with which specific media outlets would reach each racial/ethnic population. Furthermore, combining and linking the outreach efforts of the mass media campaign and hotline with the community-based outreach creates maximal effect and increases the likelihood that women will seek recommended screening.
• It takes time and effort to establish a hotline that can manage the flow of calls and the
multiple languages required for this effort. Only a few languages were not accommodated on the hotline, such as Thai, Tagalog, and Khmer. The hotline operators faced many challenges in accommodating the women calling the hotline. In the first year, some calls were lost during the busiest times because of the long wait times, or the appropriate-speaking operator was not available. However, by applying the lessons learned toward program enhancement, the percentage of unanswered calls notably decreased throughout the course of the initiative. Furthermore, now that the system is established it would be wise to ensure sustainability of the hotline system for any number of multi- lingual purposes.
• Certain populations are at even higher risk for developing cervical cancer due to
differences in screening frequency and limited access to the health care system. The initiative aimed to reach this high-risk population. However, the data has shown that some women previously thought to be high-risk may be accessing the healthcare system and receiving regular screenings. From the hotline data we can conclude that the majority of African American women who were reached by this campaign are obtaining screening at the recommended frequency. It seems likely that African American women are able to navigate the public health care system better than other women of color that may have recently immigrated, and who may have limited English proficiency and less familiarity with typical health programs and the safety-net system. Identifying the highest-risk women of color population to target is important in ensuring the success future media campaign efforts.
• Women have also been calling the hotline for services other than cervical cancer screening
and mammography. Although 11,376 cervical cancer appointments were made through the hotline between January 2002 and August 2003, the operators answered over 25,600 calls, including women who called to reschedule an appointment, from women with a multitude of health care needs, including family planning. The hotline system has become a source for underserved women in LA County to seek free or low-cost health services.
• Chinese and Korean women were the least likely to have been screened recently, the most
likely to have an abnormal Pap test result, and the most likely to attend the appointment they made. Thus, this media campaign effort was successful at reaching “high-risk”

Samuels & Associates 29
women who were not in the system, particularly Chinese and Korean women. Ethnically focused media activities were effective at getting Chinese and Korean women who had not been screened, but who were likely to attend a screening appointment to do so through the OWH hotline. Furthermore, activities used to advertise to Chinese and Korean women were more cost-effective compared to media components focused on other ethnicities. Overall, the campaign targeting Chinese and Korean women was the most successful at getting high-risk women in for appointments at an effective cost.
• This multi-cultural media and outreach campaign was effective at getting low-income,
women of color to make appointments through the hotline: 11,376 women made appointments through the hotline in the first 20 months. The majority of the media campaign funding went toward the Latina campaign; subsequently, more than half of the women who called were Latina: 6870 appointments were made through the hotline for Latina callers. In conclusion, providing preventive services to underserved women, and allocating sufficient resources to increase awareness of those services has been an effective way of bringing women in for preventive health care.
Samuels & Associates 30
APPENDIX A MAPPING OF CLIENT LOCATION, PROVIDER LOCATION, AND LINGUISITC ISOLATION The thematic maps presented in this appendix speak to the fact that the location of hotline callers falls within linguistically isolated communities by selected language(s), thus indicating that the marketing media campaign and outreach activities were successful at reaching eligible populations in linguistically isolated10 communities throughout Los Angeles County. Applying Geographic Information Systems (GIS) technology to the mapping of the Cervical Cancer Prevention and Education Initiative (CCPEI) project data was a prime example of the complexity of resources involved in cleaning and managing the collected data that was not intended for mapping purposes but that had the potential to reveal spatial patterns if correctly prepared and analyzed. The steps used to map both client- and clinical provider network-level data were as follows:
1. Both clients’ and clinical providers’ street addresses were geographically coded
(geocoded)11 using the geocoding feature in ESRI’s ArcView® 3.2. The data used for this purpose came from an appointment database with 9,435 individual patient records that contained potentially “geocodable” data in the form of street addresses, city information, and zip codes. This project also utilized clinical providers’ address information (n=202) to correctly geocode the location of each clinic that participated in the Clinical Provider Network. A crucial step in the geocoding of street addresses was the use of Topologically Integrated Geographic Encoding and Referencing (TIGER) street centerline 2000 data for the entire County of Los Angeles available to the OWH from the Los Angeles County Department of Health Services Office of Health Assessment and Epidemiology. This street centerline file was used as a reference against which both the patient and clinic address files were matched.
2. The address matching rate for client-level street address data was almost 90%
(n=8,470). Client addresses using P.O. Box information and addresses where either street number or zip code were out of range 12 could not be geocoded. Nonetheless, 90 % of the addresses were able to be matched and geocoded, an indication of the robustness of the data used. Likewise, the address matching rate for the clinical provider data was 97%.
3. The 2000 Census Bureau data related to households classified as “linguistically
isolated” were employed and three thematic maps were created that display the percentage of linguistically isolated households by census tract and selected language(s) using the natural breaks classification method provided in ArcView® 3.2.
10 The Census Bureau defines a linguistically isolated household as one where no household member over the age of 14 speaks only English, or speaks English “very well.” 11 Geocoding of street addresses is an essential first step of any GIS related project. Without it, a point theme (i.e., client location map) could not be generated. 12 “Fake” addresses also fall into this category.

Samuels & Associates 31
This classification method is preferred as a way of minimizing the sum of the variance within each of the categories displayed. The natural breaks method finds groupings inherent in the data displayed and is the recommended choice if there are extreme value variations in categorical data to be displayed, such as there were with the proportion of women in each LA County census tract who are linguistically isolated.
The thematic maps created represent the location of providers in the Clinical Provider Network (CPN) and the census tracts that are linguistically isolated by selected language. These maps display the following information:
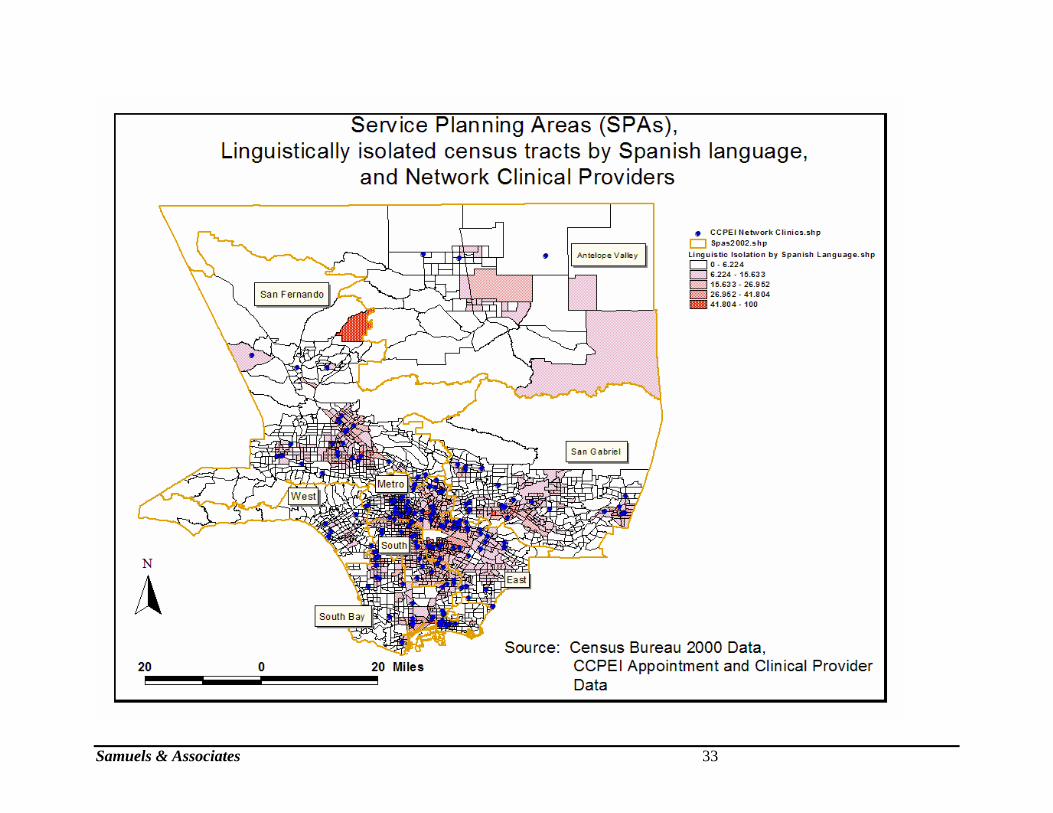
• Figure 1 displays Service Planning Areas (SPAs)13, the location of hotline callers, and the location of providers in Los Angeles County.
• Figure 2 displays the percentage of linguistically isolated households who speak Spanish, by census tract, and the location of providers.
• Figure 3 displays the percentage of linguistically isolated households who speak an Asian or Pacific Islander language, by census tract, and the location of providers.
• Figure 4 displays the percentage of linguistically isolated households who speak other Indo-European languages, including Armenian, by census tract, and the location of providers.
The following maps are to demonstrate the relationship between the location of ho tline callers and providers to whom they were referred, and between hotline callers’ location and the most linguistically isolated census tracts in Los Angeles County. Differences in English language proficiency and cultural perceptions can affect the provision of health services if misunderstood by either the service provider or the client seeking services. The thematic maps presented here demonstrate that the location of hotline callers fell within linguistically isolated communities by selected language(s).Thus, the media campaign and outreach activities were successful at reaching the populations eligible for this project in linguistically isolated communities throughout Los Angeles County. In conclusion, the media campaign and outreach activities successfully served the purpose of reaching their intended audience and linking low income women of color to culturally and linguistically appropriate health care services.
13 Political boundaries by which health services in the Los Angeles County Department of Health Services are provided.

Samuels & Associates 32
Samuels & Associates 33

Samuels & Associates 34

Samuels & Associates 35

REFERENCES Glanz K, Croyle RT, Chollette VY, Pinn V, W. Cancer-related health disparities in women. Am J Public Health 2003;93:292-298. Kim K, Rigal RD, Patrick JR, Walters JK, Bennett A, Nordin W, Claybrook JR, Parekh RR. The changing trends of uterine cancer and cytology: a study of morbidity and mortality trends over a twenty year period. Cancer 1978;42(5):2439-49. Lawson HW, Henson R, Bobo JK, Kaeser MK. Implementing recommendations for the early detection of breast and cervical cancer among low-income women. MMWR 2000; 49(RR02): 35-55. Levi F, La Vecchia C, Lucchini F, Negri E. Worldwide Trends in Cancer Mortality in the Elderly, 1955-1992. European Journal of Cancer 1996; 32A(4): 652-72. Liu L, Zhang J, Deapen D, Bernstein L, and Ross RK. Cancer in Los Angeles County: Incidence and Mortality by Race/Ethnicity 1988-2000. Los Angeles County Cancer Surveillance Program, University of Southern California, 2003. McCrory, DC, Matchar, DB, Bastian, L, Datta, S, Hasselblad, V, Hickey, J, Myers, E, Nanda, K. (1999) Evaluation of Cervical Cytology, Agency for Health Care Research and Quality Publication No. 99-E010. (Accessed December 4, 2003: http://www.ahcpr.gov) Nold JL. Cervical neoplasia. History-screening-diagnosis-treatment. S D J Med. 1998 Apr;51(4):113-9. Ponce N, Gatchell M, Brown ER. Cancer Screening Rates Among Asian Ethnic Groups. UCLA Health Policy Fact Sheet, November 2003. Saslow D, Runowicz CD, Solomon D, et al. American Cancer Society Guideline for the Early Detection of Cervical Neoplasia and Cancer. CA A Cancer Journal for Clinicians 2002;52:342-362. SEER (Surveillance, Epidemiology, and End Results) Program (www.seer.cancer.gov) SEER*Stat Database: Incidence - SEER 9 Regs Public-Use, Nov 2002 Sub (1973-2000), National Cancer Institute, DCCPS, Surveillance Research Program, Cancer Statistics Branch, released April 2003, based on the November 2002 submission.