Embed Size (px)
Citation preview

Final Pathogen TMDL for the Taunton River Watershed
June 2011 (Control Number: CN 0256.0)
Prepared as a cooperative effort by: Massachusetts DEP
1 Winter Street Boston, Massachusetts 02108
USEPA New England Region 1 1 Congress Street, Suite 1100 Boston, Massachusetts 02114
ENSR International
2 Technology Park Drive Westford, MA 01886
Taunton River Watershed

NOTICE OF AVAILABILITY
Limited copies of this report are available at no cost by written request to:
Massachusetts Department of Environmental Protection (MassDEP) Division of Watershed Management
627 Main Street Worcester, Massachusetts 01608
This report is also available from MassDEP at www.mass.gov/dep/water/resources/tmdls.htm.
A complete list of reports published by the Division of Watershed Management since 1963 is updated annually. This list, titled “Publications of the Massachusetts Division of Watershed Management (DWM) – Watershed Planning Program, 1963-(current year)”, is available at http://www.mass.gov/dep/water/priosres.htm.
DISCLAIMER
References to trade names, commercial products, manufacturers, or distributors in this report constituted neither endorsement nor recommendations by the Division of Watershed Management for use. Acknowledgement This report was developed by ENSR through a partnership with Resource Triangle Institute (RTI) contracting with the United States Environmental Protection Agency (EPA) and the Massachusetts Department of Environmental Protection Agency under the National Watershed Protection Program. Much of this document was prepared using text and general guidance from the previously approved Neponset River Basin, Palmer River Basin, Charles River Basin, Buzzards Bay Basin, Cape Cod Basin, and Narragansett/ Mount Hope Bay Basin Bacteria Total Maximum Daily Load documents.

Total Maximum Daily Loads for Pathogens within the Taunton River Watershed
Key Features: Pathogen TMDL for the Taunton River Watershed Location: EPA Region 1 Land Type: New England Coastal 303(d) Listings: Pathogens
Assonet River (MA62-20) Beaver Brook (MA62-09) Broad Cove (MA 62-50) Matfield River (MA62-32) Meadow Brook (MA62-38) Muddy Cove Brook (MA62-51) Rumford River (MA62-39 formerly part of MA62-15) Salisbury Brook (MA62-08) Salisbury Plain River (MA62-05, MA62-06); Segreganset River (MA62-55) Shumatuscacant River (MA62-33); Taunton River (MA62-02, MA62-03, MA62-04); Threemile River (MA62-56, MA62-57 formerly part of MA62-16) Trout Brook (MA62-07); Wading River (MA62-47, MA62-49 formerly part of MA62-17)
Data Sources: MassDEP “Taunton River Watershed 2001 Water Quality Assessment Report”
Data Mechanism: Massachusetts Surface Water Quality Standards; The Federal BEACH Act; Massachusetts Department of Public Health Bathing Beaches; Massachusetts Division of Marine Fisheries Shellfish Sanitation and Management; Massachusetts Coastal Zone Management
Monitoring Plan: Massachusetts Watershed Five-Year Cycle, Division of Marine Fisheries, Coastal Zone Management, Taunton River Watershed Association
Control Measures: Watershed Management; Stormwater Management (e.g., illicit discharge removals, public education/behavior modification); CSO & SSO Abatement; Other BMPs; No Discharge Areas; By-laws; Ordinances; Septic System Maintenance/Upgrades
Location of the Taunton River Watershed

Acronyms
7Q10 Seven Day Ten Year Low Flow AWRF Advanced Water Reclamation Facility BMP Best Management Practice cfs Cubic feet per second cfu colony forming units CSO Combined Sewer Overflow CWA Clean Water Act, Federal CWA § 303(d) Section 303 (d) of the CWA and the implementing regulations at 40 CFR
130.7 require states to identify those waterbodies that are not expected to meet surface water quality standards after the implementation of technology-based controls and to prioritize and schedule them for the development of a total maximum daily load (TMDL).
CZM Coastal Zone Management DFW Division of Fisheries and Wildlife DMF Division of Marine Fisheries DWM Division of Watershed Management EEA Energy and Environmental Affairs EMC Event Mean Concentration EPA United States Environmental Protection Agency EQIP Environmental Quality Incentive Program GIS Geographic Information System IDDE Illicit Discharge Detection and Elimination LA Load Allocation LID Low Impact Development LTCP Long Term CSO Control Plan MADPH Massachusetts Department of Public Health MassDEP Massachusetts Department of Environmental Protection MEP Maximum Extent Practicable MEPA Massachusetts Environmental Policy Act MGD Million Gallons per Day MHD Massachusetts Highway Department MOS Margin of Safety MPN Most Probable Number MSD Marine Sanitary Device MS4 Municipal Separate Storm Sewer Systems NDA No Discharge Area NPDES National Pollutant Discharge Elimination System NRCS Natural Resource Conservation Service ORW Outstanding Resource Water POTW Publically Owned Treatment Works SRF State Revolving Fund

Acronyms SSO Sanitary Sewer Overflows SWMP Stormwater Management Plan SWPP Stormwater Program Plan TMDL Total Maximum Daily Load TRWA Taunton River Watershed Association TSS Total Suspended Solids USACOE United States Army Corps of Engineers USGS United State Geological Survey WLA Waste Load Allocation WQS Water Quality Standards WWTP Waste Water Treatment Plant

Executive Summary
Purpose and Intended Audience This document provides a framework to address bacterial and other fecal-related pollution in surface waters of Massachusetts. Fecal contamination in surface waters is most often a direct result of the improper management of human wastes, excrement from barnyard animals, pet feces and agricultural applications of manure. It can also result from large congregations of birds such as geese and gulls. discharges of inadequately treated boat waste are of particular concern in coastal areas. Inappropriate disposal of human and animal wastes can degrade aquatic ecosystems and negatively affect public health. Fecal contamination can also result in closures of shellfish beds, beaches, swimming holes and drinking water supplies. The closure of such important public resources can erode quality of life and diminish property values. Who should read this document? The following groups and individuals can benefit from the information in this report:
a) towns and municipalities, especially Phase I and Phase II stormwater communities, that are required by law to address stormwater and/or combined sewage overflows (CSOs) and other sources of contamination (e.g., broken sewerage pipes and illicit connections) that contribute to a waterbody’s failure to meet Massachusetts Water Quality Standards for pathogens;
b) watershed groups that wish to pursue funding to identify and/or mitigate sources of
pathogens in their watersheds;
c) harbormasters, public health officials and/or municipalities that are responsible for monitoring, enforcing or otherwise mitigating fecal contamination that results in beach and/or shellfish closures or results in the failure of other surface waters to meet Massachusetts standards for pathogens;
d) citizens that wish to become more aware of pollution issues and may be interested in helping
build local support for funding remediation measures.
e) government agencies that provide planning, technical assistance, and funding to groups for bacterial remediation.
Major Bacteria Sources and Prioritized Areas During the last decade, municipalities have made significant investments and progress in controlling bacteria impacts to the various rivers, tributaries and estuary areas in the Taunton River watershed. A number of municipalities within the Taunton River watershed have implemented measures to address sewage discharges and CSO events. The City of Taunton made upgrades to its wastewater

treatment plant (WWTP) and as a result, the number of CSO events has significantly decreased. The City of Fall River has also been addressing CSOs and has a three phase CSO program which includes upgrades to the WWTP, a CSO tunnel to enlarge the storage capacity of the system, and partial sewer and catch basin separation. The City of Brockton received funding from the State Revolving Fund program to reduce sewer system overflows and discharge violations and the WWTP began a three phase facility-wide upgrade to improve effluent quality. The Town of Dighton has received funds from the Clean Water SRF to identify areas where the existing onsite sewage disposal systems are inadequate and to develop wastewater management recommendations (MassDEP 2005). The major sources of bacteria in the Taunton River watershed during dry weather include leaking sewer pipes, stormwater drainage systems (illicit connections of sanitary sewers to storm drains), and failing septic systems. Wet weather sources include stormwater runoff including municipal separate storm sewer systems (MS4), combined sewer overflows (CSOs), and sanitary sewer overflows (SSOs). Illicit connections, leaking sewer pipes, and sanitary sewer overflows must be detected (sources) and eliminated. The majority of these sources can be found through the implementation of an effective illicit detection and elimination program and by monitoring dry weather discharges in suspected areas. A comprehensive program needs to be conducted to find sources to bacteria hotspots in the stormwater systems of many communities. The Phase II Stormwater program, required in at least parts of all the communities in the Taunton River watershed creates a framework for implementing the measures needed to reduce bacteria related sources. In addition to identifying the loads necessary to meet water quality standards, this TMDL provides guidance for setting bacterial implementation priorities within the Taunton River Watershed. Table ES-1 below provides a prioritized list of pathogen-impaired segments that will require additional bacterial source tracking work and implementation of Best Management Practices (BMPs). Although ambient water quality data is available, limited source information and data are available in each impaired segment. As a result a simple scheme was used to prioritize segments based on ambient fecal coliform concentrations. High priority was assigned to those segments where either dry or wet weather concentrations (end of pipe or ambient) were equal to or greater than 10,000 cfu /100 mL. Medium priority was assigned to segments where concentrations ranged from 1,000 to 9,999 cfu/100mL. Low priority was assigned to segments where concentrations were observed less than 1,000 cfu/100 mL. MassDEP believes the higher concentrations are indicative of the potential presence or raw sewage and therefore they pose a greater risk to the public. It should be noted that in all cases, waters exceeding the water quality standards identified in Table ES-2 are considered impaired. Prioritization is also adjusted upward based on proximity of waters, within the segment, to sensitive areas such as Outstanding Resource Waters (ORW), or designated uses that require higher water quality standards than Class B or SB, such as public water supply intakes or restricted shellfish areas, respectively. Best practical judgment was used in determining this upward adjustment. Generally speaking, waters that were determined to be lower priority based on the numeric ranges listed above were elevated up one level of priority if that segment were adjacent to or immediately

upstream of a sensitive use. An asterisk * in the priority column of the specific segment in Table ES-1 would indicate this situation. Table ES-1. Bacteria Impaired Prioritized Segments.
Segment ID and Name Segment Description and Sampling Locations
Priority “Dry”a
Priority “Wet” a
Matfield River Subwatershed MA62-08 Salisbury Brook
Outlet of Cross Pond, Brockton to the confluence with Trout Brook forming the Salisbury Plain River, Brockton • Elmwood Avenue Brockton • Near Belmont Avenue, Brockton • Near Montgomery Street, Brockton • Near Chester Street, Brockton • Near Otis Street, Brockton
Low Medium Low High Medium
High High High High High
MA62-07 Trout Brook
Source northeast of Argyle Avenue and west of Conrail Line, Avon to the confluence with the Salisbury Brook forming the Salisbury Plain River, Brockton • Studley Avenue, Brockton • East Ashland Street, Brockton • Court Street, Brockton • Crescent Street, Brockton
Medium Low High High
Medium High Medium Medium
MA62-05 Salisbury Plain River
Confluence of Trout and Salisbury Brooks, Brockton to the Brockton AWRF discharge, Brockton • Near Plain Street, Brockton • Behind 1690 Main Street, Brockton
Medium Medium
High Medium
MA62-06 Salisbury Plain River
Brockton AWRF discharge, Brockton to the confluence with Beaver Brook forming the Matfield River, East Bridgewater • Near Belmont Street, West Bridgewater
Low
High
MA62-09 Beaver Brook
Outlet of Cleveland Pond, Abington to confluence with Salisbury Plain River, East Bridgewater East Ashland/Groveland Street, Brockton/Abington Crescent Street, Brockton Plymouth Street, Brockton
Low Low Low
Medium Medium High
MA62-38 Meadow Brook
Headwaters north of Pine Street, Whitman to confluence with Matfield River, East Bridgewater • West Union Street, East Bridgewater
Low
Medium

Segment ID and Name Segment Description and Sampling Locations
Priority “Dry”a
Priority “Wet” a
MA62-33 Shumatuscacant River
Wetland west of Vineyard Road, Abington to confluence with Poor Meadow Brook, Hanson • Near Summer Street, Abington • Near South Avenue, Whitman
downstream of Hobart Pond • Franklin Street, Whitman/Hanson • South Avenue, Whitman downstream of
South Avenue bridge
Low Low Low Low
Medium Medium Medium High
MA62-32 Matfield River
Confluence of Beaver Brook and Salisbury Plain River East Bridgewater to the confluence with the Town River and Taunton River, Bridgewater • Near West Union Street • Near Route 18/Route 106 intersections • Near High Street bridge
Low Medium Low
Medium Medium Medium
Threemile River Subwatershed MA62-39 Rumford River
Outlet Gavin Pond, Sharon to inlet of Norton Reservoir, Mansfield • Spring Street, Mansfield
Low
No Data
MA62-47 Wading River
Source in wetland north of West Street, Foxborough to Balcom Street, Mansfield • Near West Street, Mansfield
Medium*
MA62-49 Wading River
Balcom Street, Mansfield to confluence with Threemile River, Norton • Wading River at Walker Street, Norton • Wading River at Route 123, Norton • Hodges Brook at road crossing
upstream of the confluence with the Wading River
• Wading River near Route 140, Norton • Outlet of Chartley Pond, Norton
Low Low Low Low Low
MA62-56 Threemile River
Confluence of Wading and Rumford rivers, Norton to impoundment spillway behind 66 South Street (Harodite Finishing), Taunton • Harvey Street, Taunton • Near Route 44/Cohannet Street,
Taunton
Low Low1
MA62-57 Threemile River
Impoundment spillway behind 66 South Street (Harodite Finishing), Taunton to confluence with Taunton River, Taunton/Dighton • Somerset Avenue (Route 138, Dighton
Low1

Segment ID and Name Segment Description and Sampling Locations
Priority “Dry”a
Priority “Wet” a
Assonet River Subwatershed MA62-20 Assonet River
Tisdale Dam, Freetown to the confluence with the Taunton River, Freetown • Unnamed Tributary
Medium (Insufficient Data, restricted Shellfishing Use downstream )
Muddy Cove Brook Subwatershed MA62-51 Muddy Cove Brook
Outlet of small impoundment behind 333 Main Street (Zeneca, Inc.), Dighton to confluence Taunton River, Dighton
High* (Insufficient Data, restricted Shellfishing Use downstream )
Broad Cove Subwatershed MA62-50 Broad Cove
Located in Dighton and Somerset High* (Insufficient Data, restricted Shellfishing Use downstream )
Mainstem Taunton River MA62-02 Taunton River
Route 24 Bridge, Taunton/Raynham to Berkley Bridge, Dighton/Berkley • Near Longmeadow Road Bridge,
Taunton • Near Plain Street, Taunton • Near Center Street (Berkley Bridge),
Berkley
Medium1*
High1* Medium1*
MA62-03 Taunton River
Berkley Bridge, Dighton/Berkley to confluence with Assonet River at a line from Sandy Point, Somerset northeasterly to the southwestern tip of Assonet Neck, Berkley
High* (Insufficient Data, restricted Shellfishing Use downstream )
MA62-04 Taunton River
Confluence with Assonet River at a line from Sandy Point, Somerset northeasterly to the southwestern tip of Assonet Neck, Berkley to mouth at Braga Bridge, Somerset/Fall River
High* (Insufficient Data, restricted Shellfishing Use downstream )
Other Tributaries and Waterbodies MA62-55 Segreganset River
Approximately 250 feet north of Brook Street, Dighton to confluence with the Taunton River
High* (Insufficient Data, restricted Shellfishing Use downstream )
a In many cases the DMF sampling results that were used to develop Table ES-1 don’t differentiate whether the sampling was conducted during wet or dry weather.

*priority elevated due to proximity to sensitive use segment 1Data collected by the Taunton River Watershed Association (TRWA). A final Quality Assurance Project Plan for the TRWA has not been approved therefore their data are not quality assured. MassDEP believes that segments ranked as high priority in Table ES-1 are indicative of the potential presence of raw sewage and therefore they pose a greater risk to the public. Elevated dry weather bacteria concentrations could be the result of illicit sewer connections or failing septic systems. As a result, the first priority should be given to bacteria source tracking activities in those segments where sampling activities show elevated levels of bacteria during dry weather. Identification and remediation of dry weather bacteria sources is usually more straightforward and successful than tracking and eliminating wet weather sources. If illicit bacteria sources are found and eliminated it should result in a dramatic reduction of bacteria concentration in the segment in both dry and wet-weather. It may not be cost effective or even possible to identify all wet weather sources of bacteria. Therefore, segments that remain impaired during wet weather should be evaluated for stormwater BMP implementation opportunities starting with less costly non-structural practices first, (such as street sweeping, and/or managerial approaches using local regulatory controls), with ongoing evaluation of the success of those programs. If it is determined that less costly approaches are not sufficient to address the issue then appropriate structural BMP should be identified and implemented where necessary. Structural stormwater BMP implementation may require additional study to identify cost efficient and effective technology.
TMDL Overview The Massachusetts Department of Environmental Protection (MassDEP) is responsible for monitoring the waters of the Commonwealth, identifying those waters that are impaired, and developing a plan to bring them back into compliance with the Massachusetts Water Quality Standards (WQS). The Massachusetts Year 2008 Integrated List of Waters contains a list of impaired waters, Category 5 Waters "Waters requiring a TMDL" (formerly known as the “303d list”), which identifies impaired segments of rivers and streams, coastal waters, and lakes and the reason(s) for impairment. Once a water body is identified as impaired, the MassDEP is required by the Federal Clean Water Act (CWA) to develop a “pollution budget” designed to restore the health of the impaired body of water. The process of developing this budget, generally referred to as a Total Maximum Daily Load (TMDL), includes identifying the source(s) of the pollutant from direct discharges (point sources) and indirect discharges (non-point sources), determining the maximum amount of the pollutant that can be discharged to a specific water body to meet water quality standards, and assigning pollutant load allocations to the sources. A plan to implement the necessary pollutant reductions is essential to the ultimate achievement of meeting the water quality standards. Pathogen TMDL: This report represents a TMDL for pathogen indicators (e.g. fecal coliform, E. coli, and enteroccoci bacteria) in the Taunton River watershed. Certain bacteria, such as coliform, E. coli, and enteroccoci bacteria, are indicators of contamination from sewage and/or the feces of warm-blooded wildlife (mammals and birds). Such contamination may pose a risk to human health. Therefore, in order to prevent further degradation in water quality and to ensure that waterbodies

within the watershed meet state water quality standards, the TMDL establishes indicator bacteria limits and outlines corrective actions to achieve that goal. Sources of indicator bacteria in the Taunton River watershed were found to be many and varied. Most of the bacteria sources are believed to be stormwater related. Table ES-2 provides a general compilation of likely bacteria sources in the Taunton River watershed including failing septic systems, combined sewer overflows (CSO), sanitary sewer overflows (SSO), sewer pipes connected to storm drains, certain recreational activities, wildlife including birds along with domestic pets and animals and direct overland stormwater runoff. Note that bacteria from wildlife would be considered a natural condition unless some form of human inducement, such as feeding, is causing congregation of wild birds or animals. A discussion of pathogen related control measures and best management practices are provided in the companion document: “Mitigation Measures to Address Pathogen Pollution in Surface Water: A TMDL Implementation Guidance Manual for Massachusetts” (ENSR 2005). This TMDL applies to the 20 pathogen impaired segments of the Taunton River watershed that are currently listed on the CWA § 303(d) Integrated List of impaired waters. MassDEP recommends however, that the information contained in this TMDL guide management activities for all other waters throughout the watershed to help maintain and protect existing water quality. For these non-impaired waters, Massachusetts is proposing “pollution prevention TMDLs” consistent with CWA § 303(d)(3). The analyses conducted for the pathogen impaired segments in this TMDL would apply to the non-impaired segments, since the sources and their characteristics are equivalent. The waste load and/or load allocation for each source and designated use would be the same as specified herein. Therefore, the pollution prevention TMDLs would have identical waste load and load allocations based on the sources present and the designated use of the water body segment (see Table ES-2). This Taunton River watershed TMDL may, in appropriate circumstances, also apply to segments that are listed for pathogen impairment in subsequent Massachusetts CWA § 303(d) Integrated List of Waters. For such segments, this TMDL may apply if, after listing the waters for pathogen impairment and taking into account all relevant comments submitted on the CWA § 303(d) list, the Commonwealth determines with EPA approval of the CWA § 303(d) list that this TMDL should apply to future pathogen impaired segments. Since accurate estimates of existing sources are generally unavailable, it is difficult to estimate the pollutant reductions for specific sources. For the illicit sources, the goal is complete elimination (100% reduction). However, overall wet weather indicator bacteria load reductions can be estimated using typical stormwater bacteria concentrations. These data indicate that in general two to three orders of magnitude (i.e., greater than 90%) reductions in stormwater fecal coliform loading will be necessary, especially in developed areas. This goal is expected to be accomplished through stepwise implementation of best management practices, such as those associated with the Phase II control program for stormwater.

TMDL goals for each type of bacteria source are provided in Table ES-2. Municipalities are the primary responsible parties for eliminating many of these sources. TMDL implementation to achieve these goals should be an iterative process with selection and implementation of mitigation measures followed by monitoring to determine the extent of water quality improvement realized. Recommended TMDL implementation measures include identification and elimination of prohibited sources such as leaky or improperly connected sanitary sewer flows and best management practices to mitigate stormwater runoff volume. Certain towns in the watershed are classified as Urban Areas by the United States Census Bureau and are subject to the Stormwater Phase II Final Rule that requires the development and implementation of an illicit discharge detection and elimination plan. Combined sewer overflows will be addressed through the on-going long-term control plans. In most cases, authority to regulate non-point source pollution and thus successful implementation of this TMDL is limited to local government entities and will require cooperative support from local volunteers, watershed associations, and local officials in municipal government. Those activities can take the form of expanded education, obtaining and/or providing funding, and possibly local enforcement. In some cases, such as subsurface disposal of wastewater from homes, the Commonwealth provides the framework, but the administration occurs on the local level. Among federal and state funds to help implement this TMDL are, on a competitive basis, the Non-Point Source Control (CWA Section 319) Grants, Water Quality (CWA Section 604(b)) Grants, and the State Revolving (Loan) Fund Program (SRF). Most financial aid requires some local match as well. The programs mentioned are administered through the MassDEP. Additional funding and resources available to assist local officials and community groups can be referenced within the Massachusetts Non-point Source Management Plan-Volume I Strategic Summary (2000) “Section VII Funding / Community Resources”. This document is available on the MassDEP’s website at: http:/// http://www.mass.gov/dep/water/resources/nonpoint.htm. Table ES-2: Waste Load Allocations (WLAs) and Load Allocations (LAs) as Daily Concentrations (CFU/100mL).
Surface Water Classification Pathogen Source
Waste Load Allocation Indicator Bacteria
(CFU/100 mL)1
Load Allocation Indicator Bacteria
(CFU/100 mL)1
A, B, SA, SB (prohibited discharges)
Illicit discharges to storm drains 0 Not Applicable
Leaking sanitary sewer lines 0 Not Applicable
Failing septic systems Not Applicable 0

Surface Water Classification Pathogen Source
Waste Load Allocation Indicator Bacteria
(CFU/100 mL)1
Load Allocation Indicator Bacteria
(CFU/100 mL)1
A (Includes filtered
water supply)
& B
Any regulated discharge- including stormwater runoff4 subject to Phase I or II NPDES permits, NPDES wastewater treatment plant discharges 7,9, and combined sewer overflows6.
Either E. coli ≤geometric mean5 126 colonies per 100 ml; single sample ≤235 colonies per 100 ml;
or Enterococci geometric mean5
≤ 33 colonies per 100 ml and single sample ≤ 61 colonies per 100 ml
Not Applicable
Nonpoint source stormwater runoff4
Not Applicable
Either E. coli ≤geometric mean5 126 colonies per 100 ml; single sample ≤235 colonies per 100 ml;
or Enterococci geometric mean5≤ 33 colonies per 100 ml and single sample ≤ 61 colonies per 100 ml
SA (approved or conditionally approved for shellfishing)
Any regulated discharge - including stormwater runoff4 subject to Phase I or II NPDES permits, NPDES wastewater treatment plant discharges7,9, and combined sewer overflows6.
Fecal Coliform ≤ geometric mean, MPN, of 14 organisms per 100 ml nor shall 10% of the samples be ≥28 organisms per 100 ml
Not Applicable
Nonpoint Source Stormwater Runoff4
Not Applicable
Fecal Coliform ≤ geometric mean, MPN, of 14 organisms per 100 ml nor shall 10% of the samples be ≥28 organisms per 100 ml
SA & SB10 (Beaches8 and non-designated shellfish areas)
Any regulated discharge - including stormwater runoff4 subject to Phase I or II NPDES permits, NPDES wastewater treatment plant discharges7,9, and combined sewer overflows6.
Enterococci - geometric mean5 ≤ 35 colonies per 100 ml and single sample ≤ 104 colonies per 100 ml
Not Applicable
Nonpoint Source Stormwater Runoff4
Not Applicable Enterococci -geometric mean5 ≤ 35 colonies per 100 ml and single sample ≤ 104 colonies per 100 ml
SB (Restricted or conditionally restricted for shellfishing
w/depuration)
Any regulated discharge - including stormwater runoff4 subject to Phase I or II NPDES permits, NPDES wastewater treatment plant discharges7,9, and combined sewer overflows6.
Fecal Coliform ≤ median or geometric mean, MPN, of 88 organisms per 100 ml nor shall 10% of the samples be ≥260 organisms per 100 ml
Not Applicable
Nonpoint Source Stormwater Runoff4
Not Applicable
Fecal Coliform ≤ median or geometric mean, MPN, of 88 organisms per 100 ml nor shall 10% of the samples be ≥260 organisms per 100 ml

1 Waste Load Allocation (WLA) and Load Allocation (LA) refer to fecal coliform densities unless specified in table. 2 In all samples taken during any 6 month period 3 In 90% of the samples taken in any six month period; 4 The expectation for WLAs and LAs for stormwater discharges is that they will be achieved through the implementation of BMPs and other controls. 5 Geometric mean of the 5 most recent samples is used at bathing beaches. For all other waters and during the non-bathing season the geometric mean of all samples taken within the most recent six months, typically based on a minimum of five samples. 6 Or other applicable water quality standards for CSOs 7 Or shall be consistent with the Waste Water Treatment Plant (WWTP) National Pollutant Discharge Elimination System (NPDES) permit. 8 Massachusetts Department of Public Health regulations (105 CMR Section 445) 9 Seasonal disinfection may be allowed by the Department on a case-by-case basis. 10 Segments designated as CSO have a long term control plan in place that is compatible with water quality goals. Note: This table represents waste load and load allocations based on water quality standards, current as of the publication date of these TMDLs. If the pathogen criteria change in the future, MassDEP intends to revise the TMDL by addendum to reflect the revised criteria. Waste load allocation (WLA) as a concept in this document refers to pollutants discharged from pipes and channels that require a discharge permit (point sources). Load allocation refers to pollutants entering waterbodies through overland runoff (non point sources). A major difference between the two categories is the greater legal and regulatory control generally available to address point sources while voluntary cooperation added by incentives in some cases is the main vehicle for addressing non-point sources.

Table of Contents
EXECUTIVE SUMMARY ................................................................................................................... VI
Purpose and Intended Audience .......................................................................................................... vi
Major Bacteria Sources and Prioritized Areas ..................................................................................... vi
TMDL Overview.................................................................................................................................... xi
1.0 INTRODUCTION ........................................................................................................................ 1
1.1. Pathogens and Indicator Bacteria ................................................................................................. 3
1.2. Comprehensive Watershed-based Approach to TMDL Development .......................................... 4
1.3. TMDL Report Format .................................................................................................................... 6
2.0 WATERSHED DESCRIPTION ................................................................................................... 8
3.0 WATER QUALITY STANDARDS ............................................................................................ 12
4.0 PROBLEM ASSESSMENT ......................................................................................................... 16
5.0 POTENTIAL SOURCES ........................................................................................................... 32
6.0 PRIORITIZATION AND KNOWN SOURCES ........................................................................ 37
7.0 PATHOGEN TMDL DEVELOPMENT ..................................................................................... 44
7.1 – General Approach: Development of TMDL Targets .................................................................. 44
7.2 Waste Load Allocations (WLAs) and Load Allocations (LAs) As Daily Concentration (cfu/100mL). 45
7.3 – TMDL Expressed as Daily Load (cfu/Day) ................................................................................. 48
7.4 - Application of the TMDL To Unimpaired or Currently Unassessed Segments ........................... 52
7.5 – Margin of Safety ......................................................................................................................... 54
7.6 – Seasonal Variability .................................................................................................................... 55

8.0 IMPLEMENTATION PLAN ..................................................................................................... 56
8.1 Summary of Activities within the Taunton River Watershed ........................................................ 57
8.2 Illicit Sewer Connections, Failing Infrastructure and CSOs ......................................................... 57
8.3 Stormwater Runoff ....................................................................................................................... 63
8.4 Failing Septic Systems ................................................................................................................ 68
8.5 Wastewater Treatment Plants .................................................................................................... 68
8.6 Recreational Waters Use Management ...................................................................................... 69
8.7 Funding/Community Resources ................................................................................................. 69
8.8 Mitigation Measures to Address Pathogen Pollution in Surface Water: A TMDL Implementation Guidance Manual for Massachusetts .......................................................................................... 70
9.0 MONITORING PLAN .................................................................................................................. 71
10.0 REASONABLE ASSURANCES ............................................................................................... 72
10.1 Overarching Tools ....................................................................................................................... 72
10.2 Additional Tools to Address Combined Sewer Overflows (CSO’s) ............................................. 73
10.3 Additional Tools to Address Failed Septic Systems .................................................................... 75
10.4 Additional Tools to Address Stormwater ...................................................................................... 75
10.5 Financial Tools ............................................................................................................................ 77
11.0 PUBLIC PARTICIPATION ........................................................................................................ 80
12.0 REFERENCES .......................................................................................................................... 81
APPENDIX A .................................................................................................................................... 84

List of Tables Table ES-1. Bacteria Impaired Prioritized Segments. ...................................................................... viii Table ES-2: Waste Load Allocations (WLAs) and Load Allocations (LAs) as Daily Concentrations (CFU/100mL). ................................................................................................................................... xiii Table 2-1. Taunton River Watershed Basin Land Use as of 1999. ..................................................... 9 Table 4-1. Wachusett Reservoir Stormwater Sampling (as reported in MassDEP 2002b) original data provided in MDC Wachusett Stormwater Study (June 1997). ................................................... 17 Table 4-2. Lower Charles River Basin Stormwater Event Mean Bacteria Concentrations (data summarized from USGS 2002)1. ...................................................................................................... 17 Table 4-3. Taunton River Pathogen Impaired Segments (adapted from MassDEP 2005). .............. 18 Table 4-4. Salisbury Brook (Segment MA62-08) Bacteria Concentrations (ESS 2003). .................. 21 Table 4-5. Trout Brook (Segment MA62-07) Bacteria Concentrations (ESS 2003). ......................... 22 Table 4-6. Salisbury Plain River (Segment MA62-05) Bacteria Concentrations (ESS 2003). .......... 22 Table 4-7. Salisbury Plain River (Segment MA62-06) Bacteria Concentrations (ESS 2003). .......... 23 Table 4-8. Beaver Brook (Segment MA62-09) Bacteria Concentrations (ESS 2003). ...................... 23 Table 4-9. Meadow Brook (Segment MA62-38) Bacteria Concentrations (ESS 2003). ................... 24 Table 4-10. Shumatuscacant River (Segment MA62-33) Bacteria Concentrations (ESS 2003). ..... 24 Table 4-11. Matfield River (Segment MA62-32) Bacteria Concentrations (ESS 2003). ................... 25 Table 4-12. Rumford River (Segment MA62-39) Bacteria Concentrations. ...................................... 25 Table 4-13. Wading River (Segment MA62-47) Bacteria Concentrations. ....................................... 26 Table 4-14. Wading River (Segment MA62-49) Bacteria Concentrations ........................................ 26 Table 4-15. Threemile River (Segment MA62-56) Bacteria Concentrations..................................... 27 Table 4-16. Taunton River MA62-04 Segment (upstream of Mount Hope Bay MA61-06 Segment) RIDEM and MADMF Ambient 2006 Indicator Bacteria Data Summary. ............................................ 30 Table 5-1. Potential Sources of Bacteria in Pathogen Impaired Segments in the Taunton River Watershed. ........................................................................................................................................ 33 Table 5-2. Lower Charles River Basin Stormwater Event Mean Bacteria Concentrations (data summarized from USGS 2002) and Necessary Reductions to Meet Class B WQS. ......................... 36 Table 5-3. Stormwater Event Mean Fecal Coliform Concentrations (as reported in MassDEP 2002b; original data provided in Metcalf & Eddy, 1992) and Necessary Reductions to Meet Class B WQS. 36 Table 6-1. Bacteria Impaired Priority Segments. .............................................................................. 37 Table 7-1. Waste Load Allocations (WLAs) and Load Allocations (LAs) as Daily Concentrations (CFU/100mL). ................................................................................................................................... 46 Table 8-1. Tasks. ............................................................................................................................. 58

List of Figures Figure 1-1. Taunton River Watershed and Pathogen Impaired Segments. ........................................ 2 Figure 1-2. Relationships among Indicator Organisms (USEPA 2001). ............................................. 4 Figure 2-1. Taunton River Watershed Land Use as of 1999. ........................................................... 10 Figure 2-2. Taunton River Watershed Marine Beach Locations and Pathogen Impaired Segments. .......................................................................................................................................................... 11 Figure 7-1: TMDL by Classification and Uses as a function of flow (TMDL in CFU/Day). ................. 51

1
1.0 Introduction Section 303(d) of the Federal Clean Water Act (CWA) and Environmental Protection Agency’s (EPA's) Water Quality Planning and Management Regulations (40 CFR Part 130) require states to place waterbodies that do not meet established water quality standards on a list of impaired waterbodies and to develop Total Maximum Daily Loads (TMDLs) for listed waters and the pollutant(s) contributing to the impairment. In Massachusetts, impaired waterbodies are included in Category 5 of the “Massachusetts Year 2008 Integrated List of Water: Part 2- Final Listing of Individual Categories of Waters” (MassDEP 2008). Figure 1-1 provides a map of the Taunton River watershed with pathogen impaired segments indicated. As shown in Figure 1-1, many of the Taunton River waterbodies are listed as a Category 5 “impaired or threatened for one or more uses and requiring a TMDL” due to excessive indicator bacteria concentrations or were determined to be pathogen impaired in the “Taunton River Watershed 2001 Water Quality Assessment Report” (MassDEP WQA; MassDEP 2005). TMDLs are to be developed for water bodies that are not meeting designated uses under technology-based controls only. TMDLs determine the amount of a pollutant that a waterbody can safely assimilate without violating water quality standards. The TMDL process establishes the maximum allowable loading of pollutants or other quantifiable parameters for a water body based on the relationship between pollutant sources and instream conditions. The TMDL process is designed to assist states and watershed stakeholders in the stepwise implementation of water quality-based controls specifically targeted to identify sources of pollution in order to restore and maintain the quality of their water resources (USEPA 1999). TMDLs allow watershed stewards to establish measurable water quality goals based on the difference between site-specific instream conditions and state water quality standards. A major goal of this TMDL is to achieve meaningful environmental results with regard to the designated uses of the Taunton River watershed waterbodies. These include water supply, shellfishing, fishing, boating, and swimming. This TMDL establishes the necessary pollutant load to achieve designated uses and water quality standard and the companion document entitled; “Mitigation Measures to Address Pathogen Pollution in Surface Water: A TMDL Implementation Guidance Manual for Massachusetts” provides guidance for the stepwise implementation of this TMDL (ENSR 2005). Historically, water and sediment quality studies have focused on the control of point sources of pollutants (i.e., discharges from pipes and other structural conveyances) that discharge directly into well-defined hydrologic resources, such as lakes, ponds, or river segments. While this localized approach may be appropriate under certain situations, it typically fails to characterize the more subtle and chronic sources of pollutants that are widely scattered throughout a broad geographic region such as a watershed (e.g., roadway runoff, failing septic systems in high groundwater, areas of concentrated wildfowl use, fertilizers, pesticides, pet waste, and certain agricultural sources). These so called nonpoint sources of pollution often contribute significantly to the decline of water quality through their cumulative impacts. A watershed-level approach that uses the surface drainage

2
Figure 1-1. Taunton River Watershed and Pathogen Impaired Segments.

3
area as the basic study unit enables managers to gain a more complete understanding of the potential pollutant sources impacting a waterbody and increases the precision of identifying local problem areas or “hot spots” which may detrimentally affect water and sediment quality. It is within this watershed-level framework that the MassDEP commissioned the development of watershed based TMDLs.
1.1. Pathogens and Indicator Bacteria The Taunton River watershed pathogen TMDL is designed to support the reduction of waterborne disease-causing organisms, known as pathogens, in order to reduce public health risk. Waterborne pathogens enter surface waters from a variety of sources including sewage and the feces of warm-blooded wildlife. These pathogens can pose a risk to human health due to gastrointestinal illness through exposure via ingestion and contact with recreational waters, ingestion of drinking water, and consumption of filter-feeding shellfish. Waterborne pathogens include a broad range of bacteria and viruses that are difficult to identify and isolate. Thus, specific nonpathogenic bacteria have been identified that are typically associated with harmful pathogens in fecal contamination. These associated nonpathogenic bacteria are used as indicator bacteria as they are easier to identify and measure in the environment. High densities of indicator bacteria increase the likelihood of the presence of pathogenic organisms. Selection of indicator bacteria is difficult as new technologies challenge current methods of detection and the strength of correlation of indicator bacteria and human illness. Currently, coliform and fecal streptococci bacteria are commonly used as indicators of potential pathogens (i.e., indicator bacteria). Coliform bacteria include total coliform, fecal coliform and Escherichia coli (E. coli). Fecal coliform (a subset of total coliform) and E. coli (a subset of fecal coliform) bacteria are present in the intestinal tracts of warm blooded animals. Presence of coliform bacteria in water indicates fecal contamination and the possible presence of pathogens. Fecal streptococci bacteria are also used as indicator bacteria, specifically enterococci a subgroup of fecal streptococci. These bacteria also live in the intestinal tract of animals, but their presence is a better predictor of human gastrointestinal illness than fecal coliform since the die-off rate of enterococci is much lower (i.e., enterococci bacteria remain in the environment longer) (USEPA 2001). The relationship of indicator organisms is provided in Figure 1-2. The EPA, in the “Ambient Water Quality Criteria for Bacteria – 1986” document, recommends the use of E. coli or enterococci as potential pathogen indicators in fresh water and enterococci in marine waters (USEPA 1986). Massachusetts now uses E. coli and enterococci as indicator organisms of potential harmful pathogens in fresh water. The water quality standards (WQS) that apply for fresh water were revised in 2006. E. coli and enterococci replaced fecal coliform as the indicator organism for pathogens in fresh water. View the WQS at http://www.mass.gov/dep/service/regulations/314cmr04.pdf. Fecal coliform are still used by Massachusetts Division of Marine Fisheries (DMF) in their classification of shellfish growing areas. Enterococci or E. coli are used as the indicator organism for freshwater beaches and for marine beaches Enterococci are used, as required by the Federal Beaches Environmental Assessment and Coastal Act of 2000 (Beach Act), an amendment to the CWA.

4
The Taunton River watershed pathogen TMDL has been developed using fecal coliform as an indicator bacterium for shellfish areas; enterococci for bathing in marine waters and generally E. coli for fresh waters. For marine waters with both shellfishing and primary contact recreation uses, the shellfishing use is typically considered the more sensitive and fecal coliform standards are applied, Any future changes in the Massachusetts pathogen water quality standard will apply to this TMDL at the time of the standard change. Massachusetts believes that the magnitude of indicator bacteria loading reductions outlined in this TMDL will be both necessary and sufficient to attain present WQS and any future modifications to the WQS for bacteria. Figure 1-2. Relationships among Indicator Organisms (USEPA 2001).
1.2. Comprehensive Watershed-based Approach to TMDL Development Consistent with Section 303(d) of the CWA, the MassDEP has chosen to complete pathogen TMDLs for all waterbodies in the Taunton River watershed at this time, regardless of current impairment status (i.e., for all waterbody categories in the 2008 Integrated List). MassDEP believes a comprehensive management approach carried out by all watershed communities is needed to address the ubiquitous nature of pathogen sources present in the Taunton River watershed. Watershed-wide implementation is needed to meet WQS and restore designated uses in impaired segments while providing protection of desirable water quality in waters that are not currently impaired or not assessed.
Indicator Organism
Total Coliform Bacteria
Fecal Streptococci
Fecal Coliform Bacteria
Escherichia coli
Enterococci Streptococcus bovia
Streptococcus equinus
Streptococcus avium
Enterococcus faecalis
Enterococcus faecium

5
As discussed below, this TMDL applies to the 20 pathogen impaired segments of the Taunton River watershed that are currently listed on the CWA § 303(d) list of impaired waters and determined to be pathogen impaired in the “Taunton River Watershed 2001 Water Quality Assessment Report” (MassDEP WQA; MassDEP 2005) (see Figure 1-1; Table 4-3). MassDEP recommends however, that the information contained in this TMDL guide management activities for all other waters throughout the watershed to help maintain and protect existing water quality. For these non-impaired waters, Massachusetts is proposing “pollution prevention TMDLs” consistent with CWA § 303(d) (3). The analyses conducted for the pathogen impaired segments in this TMDL would apply to the non-impaired segments, since the sources and their characteristics are equivalent. The waste load and/or load allocation for each source and designated use would be the same as specified herein. Therefore, the pollution prevention TMDLs would have identical waste load and load allocations based on the sources present and the designated use of the water body segment (see Table ES-2 and Table 7-1). This Taunton River watershed TMDL may, in appropriate circumstances, also apply to segments that are listed for pathogen impairment in subsequent Massachusetts CWA § 303(d) Integrated List of Waters. For such segments, this TMDL may apply if, after listing the waters for pathogen impairment and taking into account all relevant comments submitted on the CWA § 303(d) list, the Commonwealth determines with EPA approval of the CWA § 303(d) list that this TMDL should apply to future pathogen impaired segments. Eight estuary and twelve river segments in the Taunton River watershed have been assessed by MassDEP as pathogen impaired. Pathogen impairment has been documented by the MassDEP in previous reports, including the MassDEP WQA, resulting in the impairment determination. In this TMDL document, an overview of pathogen impairment is provided to illustrate the nature and extent of the pathogen impairment problem. Additional data, not collected by the MassDEP or used to determine impairment status, will also be provided in this TMDL to illustrate the pathogen problem. Since pathogen impairment has been previously established only a summary is provided herein. The watershed based approach applied to complete the Taunton River pathogen TMDL is straightforward. The approach is focused on identification of sources, source reduction, and implementation of appropriate management plans. Once identified, sources are required to meet applicable WQS for indicator bacteria or be eliminated. This approach does not include water quality analysis or other approaches designed to link ambient concentrations with source loadings. For pathogens and indicator bacteria, water quality analyses are generally resource intensive and provide results with large degrees of uncertainty. Rather, this approach focuses on sources and required load reductions, proceeding efficiently toward water quality restoration activities. The stepwise implementation strategy for reducing indicator bacteria is an iterative process where data are gathered on an ongoing basis, sources are identified and eliminated if possible, and control measures including Best Management Practices (BMPs) are implemented, assessed and modified

6
as needed. Measures to abate probable sources of waterborne pathogens include everything from public education, to improved stormwater management, to reducing the influence from inadequate and/or failing sanitary sewer infrastructure. MassDEP believes that segments ranked as high priority in Table ES-1 are indicative of the potential presence of raw sewage and therefore they pose a greater risk to the public. Elevated dry weather bacteria concentrations could be the result of illicit sewer connections or failing septic systems. As a result, the first priority should be given to bacteria source tracking activities in those segments where sampling activities show elevated levels of bacteria during dry weather. Identification and remediation of dry weather bacteria sources is usually more straightforward and successful than tracking and eliminating wet weather sources. If illicit bacteria sources are found and eliminated it should result in a dramatic reduction of bacteria concentration in the segment in both dry and wet-weather. It may not be cost effective or even possible to identify all wet weather sources of bacteria therefore, segments that remain impaired during wet weather should be evaluated for stormwater BMP implementation opportunities starting with less costly non-structural practices first, (such as street sweeping, and/or managerial approaches using local regulatory controls), with ongoing evaluation of the success of those programs. If it is determined that less costly approaches are not sufficient to address the issue then appropriate structural BMP should be identified and implemented where necessary. Structural stormwater BMP implementation may require additional study to identify cost efficient and effective technology.
1.3. TMDL Report Format This document contains the following sections:
Watershed Description (Section 2) – provides watershed specific information Water Quality Standards (Section 3) – provides a summary of current Massachusetts
WQS as they relate to indicator bacteria Problem Assessment (Section 4) – provides an overview of indicator bacteria
measurements collected in the Taunton River watershed Identification of Potential Sources (Section 5) – identifies and discusses potential
sources of waterborne pathogens within the Taunton River watershed. Prioritization of Known Sources (Section 6) - provides guidance for setting
implementation priorities to identify and eliminate bacteria sources within the Taunton River watershed.
TMDL Development (Section 7) – specifies required TMDL development components including:
o Definitions and Equation o Loading Capacity o Load and Waste Load Allocations o Margin of Safety o Seasonal Variability
Implementation Plan (Section 8) – describes specific implementation activities designed to remove pathogen impairment. This section and the companion “Mitigation Measures to Address Pathogen Pollution in Surface Water: A TMDL Implementation Guidance

7
Manual for Massachusetts” document should be used together to support implementing management actions.
Monitoring Plan (Section 9) – describes recommended monitoring activities Reasonable Assurances (Section 10) – describes reasonable assurances the TMDL will
be implemented Public Participation (Section 11) – describes the public participation process, and References (Section 12) Appendix A – MassDEP Response to Public Comments

8
2.0 Watershed Description The Taunton River watershed, covering 562 square miles and including all or part of 40 cities and towns, is the second largest river watershed in Massachusetts. The watershed contains 94 square miles of wetlands and 12,883 acres of lakes. The area is known for having highly productive cranberry bogs. Development in the watershed is concentrated in the northern portion of the watershed and along the southern end of the Taunton River. Land use within the watershed is primarily undeveloped (Table 2-1; Figure 2-1). The landscape of the Taunton River watershed is characterized by low hills and flat areas. “The Taunton River has one of the flattest courses in the state, falling approximately 21 feet over its length; this level terrain creates extensive wetlands throughout the watershed” (MassDEP 2005). For most of its length, the River is a slow moving channel approximately 80 feet across. Downstream of the confluence with the Three Mile River, the Taunton widens into a broad tidal estuary. Significant natural and cultural resources exist in the Taunton River watershed that warrant special protection. The Hockomock Swamp and Canoe River Aquifer have been established as Areas of Critical Environmental Concern (ACECs). Projects within ACECs are subject to state agency jurisdiction and are reviewed in greater detail to avoid deleterious impacts to these sensitive environments. In addition, the Upper Taunton River is the subject of a congressionally authorized Wild and Scenic River Study. The Taunton River watershed waters are commonly used for primary and secondary contact recreation (swimming and boating), fishing, wildlife viewing, habitat for aquatic life, industrial cooling, shellfish harvesting (in approved or restricted areas), irrigation, agricultural uses, beachfront, and potable water. Information regarding swimming beaches can be obtained from the beach quality annual reports available for download at the Massachusetts Department of Public Health website http://mass.digitalhealthdepartment.com/public_21/index.cfm. Public and semi-public marine beach locations are provided on Figure 2-2.

9
Table 2-1. Taunton River Watershed Basin Land Use as of 1999.
Land Use Category % of Total Watershed Area Pasture 1.8 Urban Open 1.7 Open Land 3.3 Cropland 3.8 Woody Perennial 1.9 Forest 51.1 Wetland/Salt Wetland 3.0 Water Based Recreation <0.1 Water 3.8
General Undeveloped Land 70.5 Spectator Recreation <0.1 Participation Recreation 1.2 > 1/2 acre lots Residential 10.0 1/4 - 1/2 acre lots Residential 10.4 < 1/4 acre lots Residential 2.0 Multi-family Residential 0.6 Mining 0.6 Commercial 1.4 Industrial 1.6 Transportation 1.5 Waste Disposal 0.3
General Developed Land 29.5

10
Figure 2-1. Taunton River Watershed Land Use as of 1999.

11
Figure 2-2. Taunton River Watershed Marine Beach Locations and Pathogen Impaired Segments.

12
3.0 Water Quality Standards The Surface Water Quality Standards (WQS) for the Commonwealth of Massachusetts establish chemical, physical, and biological standards for the restoration and maintenance of the most sensitive uses (MassDEP 2000a). The WQS limit the discharge of pollutants to surface waters for the protection of existing uses and attainment of designated uses in downstream and adjacent segments. The Taunton River Watershed contains waterbodies classified as Class A, B, SA, and SB. According the Mass Water Quality Standards these waters should be suitable for the following uses: (1) habitat for fish, other aquatic life, wildlife, (2) primary and secondary contact recreation, (3) shellfish harvesting in approved/restricted areas, and (4) should have consistently good aesthetic value (A and SA should be excellent). The pathogen impairments associated with the waterbody’s of interest in this report affect primary contact recreation and shellfishing uses. A Long Term Control Plan is being implemented to address water quality in Taunton River segments (MA62-02, 62-03, 62-04) that receive effluent and CSO discharges from the City of Taunton. The Long Term CSO Control Plan (LTCP) and Facilities Management Plan which, when completed, will capture 48.3 million gallons of combined sewage from 19 CSO’s, thereby reducing CSO discharges to less than four untreated discharge events per year. Because the WQS were in transition during the development of statewide pathogen TMDLs, and were formally changed after the draft reports were produced, the new bacteria indicator standards are presented in Table ES-1, and 7-1, and can be accessed at the following web address link: http://www.mass.gov/dep/service/regulations/314cmr04.pdf. Fecal coliform, enterococci, and E. coli bacteria are found in the intestinal tract of warm-blooded animals, soil, water, and certain food and wood processing wastes. “Although they are generally not harmful themselves, they indicate the possible presence of pathogenic (disease-causing) bacteria, viruses, and protozoans that also live in human and animal digestive systems” (USEPA 2004b). These bacteria are often used as indicator bacteria since it is expensive and sometimes difficult to test for the presence of individual pathogenic organisms. Massachusetts revised its freshwater WQS in 2006 by replacing fecal coliform with E. coli and enterococci as the regulated indicator bacteria, as recommended by the EPA in the “Ambient Water Quality Criteria for Bacteria – 1986” document (USEPA 1986). The WQS can be accessed at: http://www.mass.gov/dep/service/regulations/314cmr04.pdf. The state had previously done so for public beaches through regulations of the Massachusetts Department of Public Health as discussed below. Up until January of 2007 Massachusetts used fecal coliform as the indicator organism for all waters except for marine bathing beaches, where the Federal BEACH Act requires the use of enterococci. Massachusetts adopted E. coli and enterococci for all fresh waters and enterococci for all marine waters, including non-bathing marine beaches. Fecal coliform will remain the indicator organism for shellfishing areas, however. Pathogens can significantly impact humans through ingestion of, and contact with recreational waters, ingestion of drinking water, and consumption of filter-feeding shellfish. In addition to contact recreation, excessive pathogen numbers impact potable water supplies. The amount of treatment (i.e., disinfection) required to produce potable water increases with increased pathogen

13
contamination. Such treatment may cause the generation of disinfection by-products that are also harmful to humans. Further detail on pathogen impacts can be accessed at the following EPA websites:
Water Quality Criteria: Microbial (Pathogen) http://www.epa.gov/waterscience/criteria/humanhealth/microbial/
Human Health Advisories: o Fish and Wildlife Consumption Advisories
http://www.epa.gov/ebtpages/humaadvisoriesfishandwildlifeconsumptionadvi.html o Swimming Advisories
http://www.epa.gov/ebtpages/humaadvisoriesswimmingadvisories.html Shellfish growing areas are classified by the Massachusetts Division of Marine Fisheries (DMF). The classification system is provided below (MassGIS 2005). Figure 1-1 provides DMF shellfish growing areas status as of September, 2009.
Approved – “Open for harvest of shellfish for direct human consumption subject to local rules and state regulations.” (MassGIS 2005) “The area is shown to be free of bacterial contaminants under a variety of climatological and hydrographical situations (i.e. assumed adverse pollution conditions).” (MassDEP 2002a) Conditionally Approved - "During the time area is approved it is open for harvest of shellfish for direct human consumption subject to local rules and state regulations.” (MassGIS 2005) “This classification category may be assigned for growing areas subject to intermittent and predictable microbiological contamination that may be present due to operation of a sewage treatment plant, rainfall, and/or season.” (MassDEP 2002a) Restricted – “Open for harvest of shellfish with depuration subject to local rules and state regulations or for the relay of shellfish.” (MassGIS 2005) “A classification used to identify where harvesting shall be by special license and the shellstock, following harvest, is subject to a suitable and effective treatment process through relaying or depuration. Restricted growing areas are mildly or moderately contaminated only with bacteria.” (MassDEP 2002a) Conditionally Restricted – “During the time area is restricted it is only open for the harvest of shellfish with depuration subject to local rules and state regulations.” (MassGIS 2005) “A classification used to identify a growing area that meets the criteria for the restricted classification except under certain conditions described in a management plan.” (MassDEP 2002a)
Management Closure – “Closed for the harvest of shellfish. Not enough testing has been done in the area to determine whether it is fit for shellfish harvest or not.” (MassDEP 2002a)

14
Prohibited – “Closed for harvest of shellfish.” (MassGIS 2005) “A classification used to identify a growing area where the harvest of shellstock is not permitted. Growing area waters are so badly contaminated that no reasonable amount of treatment will make the shellfish safe for human consumption. Growing areas must also be classified as Prohibited if there is no or insufficient information available to make a classification decision.” (MassDEP 2002a)
In general, shellfish harvesting may take place in areas DMF classifies as either approved or restricted. Massachusetts assessment and listing methodology as of the date of this report is to automatically assess waters as impaired for shellfishing if Division of Marine Fisheries (DMF) classifies waters as prohibited to shellfishing. DMF staff responsible for monitoring waterways in the Taunton River Watershed indicated that areas prohibited to shellfishing were due to high bacteria counts. In addition to the WQS, the Commonwealth of Massachusetts Department of Public Health (MADPH) has established minimum standards for bathing beaches (105 CMR 445.000) under the State Sanitary Code, Chapter VII (www.mass.gov/Eeohhs2/docs/dph/regs/105cmr445.pdf). These standards have been adopted by the MassDEP as state surface WQS for fresh water and these standards apply to this TMDL. The MADPH bathing beach standards are generally the same as those which were recommended in the “Ambient Water Quality Criteria for Bacteria – 1986” document published by the EPA (USEPA 1986). In the above referenced document, the EPA recommended the use of enterococci as the indicator bacterium for marine recreational waters and enterococci or E. coli for fresh waters. As such, the following MADPH standards have been established for bathing beaches in Massachusetts:
Marine Waters - (1) No single enterococci sample shall exceed 104 colonies per 100 mL for the purposes of beach closure decisions and the geometric mean of the most recent five enterococci levels within the same bathing season shall not exceed 35 colonies per 100 mL. Freshwaters - (1) No single E. coli sample shall exceed 235 colonies per 100 mL for the purposes of beach closure decisions and the geometric mean of the most recent five E. coli samples within the same bathing season shall not exceed 126 colonies per 100 mL; or (2) No single enterococci sample shall exceed 61 colonies per 100 mL (for beach closure decisions) and the geometric mean of the most recent five enterococci samples within the same bathing season shall not exceed 33 colonies per 100 mL.
The Federal BEACH Act of 2000 established a Federal standard for marine beaches. These standards are essentially the same as the MADPH marine beach standard (i.e., single sample not to exceed 104 cfu/100mL and geometric mean of a statistically sufficient number of samples not to exceed 35 cfu/100mL). The Federal BEACH Act and MADPH standards can be accessed on the worldwide web at www.epa.gov/waterscience/beaches/rules/act.html and www.mass.gov/dph/dcs/bb4_01.pdf, respectively. Figure 2-2 provides the location of marine bathing beaches, where the MADPH Marine Waters and the Federal BEACH Act standards would apply. A map of freshwater beaches is not available at this time. However, a list of beaches (fresh and marine) by community with indicator bacteria data can

15
be found in the annual reports on the testing of public and semi-public beaches provided by the MADPH. These reports are available for download from the MADPH website located at mass.digitalhealthdepartment.com/public_21/index.cfm for marine beaches or for both marine and freshwater beaches by entering “BEACH REPORTS” in the search box at the EEOH home page.

16
4.0 Problem Assessment
Pathogen impairment has been documented at numerous locations throughout the Taunton River watershed, as shown in Figure 1-1. Excessive concentrations of indicator bacteria (e.g., fecal coliform, enterococci, E. coli etc.) can indicate the presence of sewage contamination and possible presence of pathogenic organisms. The amount of indicator bacteria and potential pathogens entering waterbodies is dependent on several factors including watershed characteristics and meteorological conditions. Indicator bacteria levels generally increase with increasing development activities, including increased impervious cover, illicit sewer connections, and failed septic systems. Indicator bacteria levels also tend to increase with wet weather conditions as storm sewer systems overflow and/or stormwater runoff carries fecal matter that has accumulated to the river via overland flow and stormwater conduits. In some cases, dry weather bacteria concentrations can be higher when there is a constant source that becomes diluted during periods of precipitation, such as with illicit connections. The magnitude of these relationships is variable, however, and can be substantially different temporally and spatially throughout the United States or within each watershed. Tables 4-1 and 4-2 provide ranges of fecal coliform concentrations in stormwater associated with various land use types. Pristine areas are observed to have low indicator bacteria levels and residential areas are observed to have elevated indicator bacteria levels. Development activity generally leads to decreased water quality (e.g., pathogen impairment) in a watershed. Development-related watershed modification includes increased impervious surface area which can (USEPA 1997):
Increase flow volume, Increase peak flow, Increase peak flow duration, Increase stream temperature, Decrease base flow, and Change sediment loading rates
Many of the impacts associated with increased impervious surface area also result in changes in pathogen loading (e.g., increased sediment loading can result in increased pathogen loading). In addition to increased impervious surface impacts, increased human and pet densities in developed areas increase potential fecal contamination. Furthermore, stormwater drainage systems and associated stormwater culverts and outfall pipes often result in the channelization of streams which leads to less attenuation of pathogen pollution.

17
Table 4-1. Wachusett Reservoir Stormwater Sampling (as reported in MassDEP 2002b) original data provided in MDC Wachusett Stormwater Study (June 1997).
Land Use Category Fecal Coliform Bacteria1
cfu/100 mL Agriculture, Storm 1
110 - 21,200
Agriculture, Storm 2
200 - 56,400
“Pristine” (not developed, forest), Storm 1
0 - 51
“Pristine” (not developed, forest), Storm 2
8 - 766
High Density Residential (not sewered, on septic systems), Storm 1
30 - 29,600
High Density Residential (not sewered, on septic systems), Storm 2
430 - 122,000
1 Grab samples collected for four storms between September 15, 1999 and June 7, 2000 Table 4-2. Lower Charles River Basin Stormwater Event Mean Bacteria Concentrations (data summarized from USGS 2002)1.
Land Use Category Fecal Coliform (cfu/100 mL)
Enterococcus Bacteria (cfu/100 mL)
Number of Events
Single Family Residential 2,800 – 94,000 5,500 – 87,000 8
Multifamily Residential 2,200 – 31,000 3,200 – 49,000 8
Commercial 680 – 28,000 2,100 – 35,000 8 1 An Event Mean Concentration (EMC) is the concentration of a flow proportioned sample throughout a storm event. These samples are commonly collected using an automated sampler which can proportion sample aliquots based on flow. Pathogen impaired estuary segments represent 100% of the total estuary area assessed (7.9 square miles; MassGIS 2005). In total, there are 20 pathogen impaired segments (13 river and 8 estuary), each in need of a TMDL, that contain indicator bacteria concentrations in excess of the Massachusetts WQS for Class A, B, SA, or SB waterbodies (314 CMR 4.05)1, the MADPH standard for bathing beaches2, and/or the BEACH Act3. The basis for impairment listings is provided in the
1 or 2 See Table ES-2, or Table 7-1, or web address link: http://www.mass.gov/dep/service/regulations/314cmr04.pdf 3 BEACH Act - Marine bathing beaches: No single enterococci sample shall exceed 104 colonies per 100 mL and the geometric mean of the most recent five enterococci levels within the same bathing season shall not exceed 35 colonies per 100 mL.

18
2008 Integrated List of Waters (MassDEP 2008). Data presented in the WQA and other data collected by the MassDEP were used to generate the Integrated List. Three segments in the Taunton watershed were divided and assigned new segment numbers in the MassDEP WQA as follows:.
• Rumford River segment MA62-15 was divided into segments MA62-39 and MA62-40 (MA62-39 included in this report).
• Threemile River segment MA62-16 was divided into river segment MA62-56 and estuary segment MA62-57 (both included in this report).
• Wading River segment MA62-17 was divided into segments MA62-47 and MA62-49 (both included in this report).
A list of pathogen impaired segments is provided in Table 4-3 and includes the new segment numbers defined in the MassDEP WQA. Segments are listed and discussed in hydrologic order (upstream to downstream) in the following sections. Additional details regarding each impaired segment including discharges, use assessments and recommendations to meet use criteria are provided in the MassDEP WQA. Table 4-3. Taunton River Pathogen Impaired Segments (adapted from MassDEP 2005).
Segment ID Segment Name Segment Type
Segment Size1
Segment Description
Matfield River Subwatershed MA62-08 Salisbury Brook/
Class B River 2.5 Outlet of Cross Pond, Brockton to the confluence with
Trout Brook forming the Salisbury Plain River, Brockton MA62-07 Trout Brook/ Class B River 3.4 Source northeast of Argyle Avenue and west of Conrail
Line, Avon to the confluence with the Salisbury Brook forming the Salisbury Plain River, Brockton
MA62-05 Salisbury Plain River/ Class B
River 2.4 Confluence of Trout and Salisbury Brooks, Brockton to the Brockton AWRF discharge, Brockton
MA62-06 Salisbury Plain River/ Class B
River 2.3 Brockton AWRF discharge, Brockton to the confluence with Beaver Brook forming the Matfield River, East Bridgewater
MA62-09 Beaver Brook/Class B River 6.8 Outlet of Cleveland Pond, Abington to confluence with Salisbury Plain River (forming Matfield River), East Bridgewater
MA62-38 Meadow Brook/Class B
River 6.0 Headwaters north of Pine Street, Whitman to confluence with Matfield River, East Bridgewater
MA62-33 Shumatuscacant River/Class B
River 8.5 Wetland west of Vineyard Road, Abington to confluence with Poor Meadow Brook, Hanson
MA62-32 Matfield River/ Class B
River 6.7 Confluence of Beaver Brook and Salisbury Plain River East Bridgewater to the confluence with the Town River and Taunton River, Bridgewater
Threemile River Subwatershed MA62-39 Rumford River/Class
B River 8.0 Outlet Gavin Pond, Sharon to inlet of Norton Reservoir,
Mansfield MA62-47 Wading River/Class A River 4.2 Source in wetland north of West Street, Foxborough to
Balcom Street, Mansfield

19
Segment ID Segment Name Segment Type
Segment Size1
Segment Description
MA62-49 Wading River/Class B River 9.7 Balcom Street, Mansfield to confluence with Threemile River, Norton
MA62-56 Threemile River/Class B
River 12.8 Confluence of Wading and Rumford rivers, Norton to impoundment spillway behind 66 South Street (Harodite Finishing), Taunton
MA62-57 Threemile River/Class SB
Estuary 0.02 Impoundment spillway behind 66 South Street (Harodite Finishing), Taunton to confluence with Taunton River, Taunton/Dighton
Assonet River Subwatershed MA62-20 Assonet River/Class
SA Estuary 0.82 Tisdal Dam , Freetown to the confluence with the
Taunton River, Freetown Muddy Cove Brook Subwatershed
MA62-51 Muddy Cove Brook/Class SA
Estuary 0.01 Outlet of small impoundment behind 333 Main Street (Zeneca, Inc.), Dighton to confluence Taunton River, Dighton
Broad Cove Subwatershed
MA62-50 Broad Cove/Class SA Estuary 0.13 Dighton and Somerset
Mainstem Taunton River MA62-02 Taunton River/Class
SB, CSO Estuary 0.29 Route 24 Bridge, Taunton/Raynham to Berkley Bridge,
Dighton/Berkley MA62-03 Taunton River/Class
SB, CSO Estuary 0.92 Berkley Bridge, Dighton/Berkley to confluence with
Assonet River at a line from Sandy Point, Somerset northeasterly to the southwestern tip of Assonet Neck, Berkley
MA62-04 Taunton River/Class SB, CSO
Estuary 2.7 Confluence with Assonet River at a line from Sandy Point, Somerset northeasterly to the southwestern tip of Assonet Neck, Berkley to mouth at Braga Bridge, Somerset/Fall River
Other Tributaries and Waterbodies
MA62-55 Segreganset River/Class SA
Estuary 0.02 Approximately 250 feet north of Brook Street, Dighton to confluence with the Taunton River, Dighton
1 Units = Miles for river segments, square miles for estuaries An overview of the Taunton River watershed pathogen impairment is provided in this section to illustrate the nature and extent of the impairment. Since pathogen impairment has been previously established and documented on the 2008 Integrated List of Waters and in the MassDEP WQA, it is not necessary to provide detailed documentation of pathogen impairment herein. Data from the MassDEP WQA and other organizations were reviewed and are summarized by segment below for illustrative purposes. This TMDL is based on the current WQS using fecal coliform for shellfish areas, and E. coli for fresh water and enterococcus for either salt or fresh water bathing respectively, as the indicator organisms. The MassDEP has incorporated E. coli and enterococci as indicator organisms for all

20
waters other than shellfishing and potable water intake areas. Not all data presented herein were used to determine impairment listing, due to a variety of reasons (including data quality assurance and quality control). The MassDEP used only a subset of the available data to generate the Integrated List. Data from the Massachusetts Division of Marine Fisheries (DMF) were used, in part, as the basis for pathogen impairment for many of the estuarine areas (Figure 1-1). Numerous samples have been collected throughout the Taunton River watershed by the DMF. DMF has a well-established and effective shellfish monitoring program that provides quality assured data for each shellfish growing area. In addition, each growing area must have a complete sanitary survey every 12 years, a triennial evaluation every three years and an annual review in order to maintain a shellfishing harvesting classification with the exception of those areas already classified as prohibited. The National Shellfish Sanitation Program establishes minimum requirements for sanitary surveys, triennial evaluations, annual reviews and annual fecal coliform water quality monitoring and includes identification of specific sources and assessment of effectiveness of controls and attainment of standards. “Each year water samples are collected by the DMF at 2,320 stations in 294 growing areas in Massachusetts's coastal waters at a minimum frequency of five times while open to harvesting” (DMF 2002). Due to the volume of data collected by the DMF, these data are not provided herein. For the most recent indicator bacteria sampling data, please contact the local city or town shellfish constable or DMF's Shellfish Project. Data summarized in the following subsections can be found at:
MassDEP WQA 2005 – Taunton River Watershed 2001 Water Quality Assessment Report- the report is available at http://www.mass.gov/dep/water/resources/wqassess.htm#wqar.
City of Taunton 2003 – Annual Water Quality Report for the City of Taunton, Taunton River & Tributaries 2002.
Data for each impaired segment are summarized in a narrative or presented in tables. The summary data tables for each segment contain the data source and the dates data were collected (i.e., DWM 2001). The type of bacteria data is indicated in the column heading. Depending on the information available, the tables may display different fields. Data tables generally may contain:
“Site Description” – column provides a short narrative description of the sampling location “Geometric Mean” – column provides the geometric mean for the samples collected “Range” – indicates the range of values obtained for the samples collected “n” – provides the number of samples collected at that site over the time frame
The MADPH publishes annual reports on the testing of public and semi-public beaches for both marine and fresh waters. These documents provide water quality data for each bathing beach by community and note if there were overages of water quality criteria. There is also a list of communities that did not report testing results. These reports are available for download from the MADPH website either at mass.digitalhealthdepartment.com/public_21/index.cfm for marine beaches or for both marine and freshwater beaches by entering “BEACH REPORTS” in the search

21
box at the EEOH home page. Marine and freshwater beach status is highly variable and is therefore not provided in each segment description. The purpose of this section of the report is to briefly describe the impaired waterbody segments in the Taunton River watershed. For more information on any of these segments, see the “Taunton River Watershed 2001 Water Quality Assessment Report” on the MassDEP website: http://www.mass.gov/dep/water/resources/wqassess.htm#wqar. The following paragraphs provide a summary of available data by assessment segment. Matfield River Subwatershed
Salisbury Brook Segment MA62-08 This 2.5 mile Class B river segment extends from the outlet of Cross Pond, Brockton to its confluence with Trout Brook. The only National Pollutant Discharge Elimination System (NPDES) permitted discharge for this segment’s drainage area is general permit coverage under MS4 for Brockton (MAR041098). Environmental Science Services (ESS) sampled the river at five stations between June and November 2002 during both dry and wet weather. Results of this sampling are presented in Table 4-4. Table 4-4. Salisbury Brook (Segment MA62-08) Bacteria Concentrations (ESS 2003).
Fecal Coliform (cfu/100 ml) E. coli (cfu/100 ml)Station Description n Range (Wet) n Range (Dry) n Range (Wet) n Range (Dry)
Elmwood Avenue, Brockton 3 3800 -10,000 2 70 -140 3 1,800–10,000 2 70 - 140 Near Belmont Avenue, Brockton 2 1400 – 20,000 1 3800 2 1,400– 20,000 1 3,200 Near Montgomery St., Brockton 2 1,700 – 13,000 1 310 2 <100- 11,000 1 260 Near Chester Street, Brockton 3 2700 – 44,000 2 16,000-18,000 3 2,400– 11,000 2 13,500-15,000Near Otis Street, Brockton 3 4700 -20,000 2 1700 - 9000 3 3,300-18,000 2 800 – 5,000
Trout Brook Segment MA62-07 This 3.4 mile Class B, warm water fishery extends from the source northeast of Argyle Avenue and west of Conrail Line to the confluence with Salisbury Brook. Avon Custom Mixing Services Inc. (MA0026883) is authorized to discharge treated sanitary effluent and combined non-contact cooling water and stormwater to this segment. This facility has had occasional violations of its fecal coliform bacteria limits (Ahsan 2005 as cited in MassDEP 2005). Additionally, the City of Brockton (MAR041098) has general permit coverage under MS4. ESS sampled the river at four stations between June and November 2002 during both dry and wet weather. Results of this sampling are presented in Table 4.5 below.
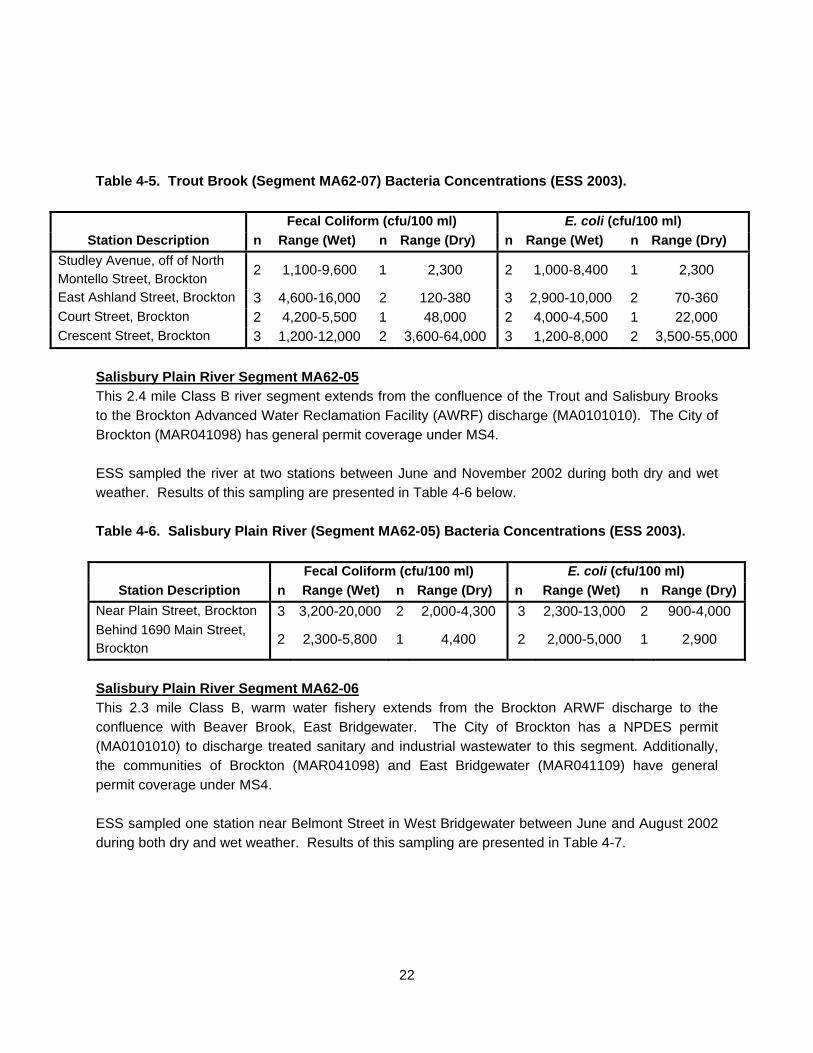
22
Table 4-5. Trout Brook (Segment MA62-07) Bacteria Concentrations (ESS 2003).
Fecal Coliform (cfu/100 ml) E. coli (cfu/100 ml)Station Description n Range (Wet) n Range (Dry) n Range (Wet) n Range (Dry)
Studley Avenue, off of North Montello Street, Brockton 2 1,100-9,600 1 2,300 2 1,000-8,400 1 2,300
East Ashland Street, Brockton 3 4,600-16,000 2 120-380 3 2,900-10,000 2 70-360 Court Street, Brockton 2 4,200-5,500 1 48,000 2 4,000-4,500 1 22,000 Crescent Street, Brockton 3 1,200-12,000 2 3,600-64,000 3 1,200-8,000 2 3,500-55,000
Salisbury Plain River Segment MA62-05 This 2.4 mile Class B river segment extends from the confluence of the Trout and Salisbury Brooks to the Brockton Advanced Water Reclamation Facility (AWRF) discharge (MA0101010). The City of Brockton (MAR041098) has general permit coverage under MS4. ESS sampled the river at two stations between June and November 2002 during both dry and wet weather. Results of this sampling are presented in Table 4-6 below. Table 4-6. Salisbury Plain River (Segment MA62-05) Bacteria Concentrations (ESS 2003). Fecal Coliform (cfu/100 ml) E. coli (cfu/100 ml)
Station Description n Range (Wet) n Range (Dry) n Range (Wet) n Range (Dry)Near Plain Street, Brockton 3 3,200-20,000 2 2,000-4,300 3 2,300-13,000 2 900-4,000 Behind 1690 Main Street, Brockton 2 2,300-5,800 1 4,400 2 2,000-5,000 1 2,900
Salisbury Plain River Segment MA62-06 This 2.3 mile Class B, warm water fishery extends from the Brockton ARWF discharge to the confluence with Beaver Brook, East Bridgewater. The City of Brockton has a NPDES permit (MA0101010) to discharge treated sanitary and industrial wastewater to this segment. Additionally, the communities of Brockton (MAR041098) and East Bridgewater (MAR041109) have general permit coverage under MS4. ESS sampled one station near Belmont Street in West Bridgewater between June and August 2002 during both dry and wet weather. Results of this sampling are presented in Table 4-7.

23
Table 4-7. Salisbury Plain River (Segment MA62-06) Bacteria Concentrations (ESS 2003).
Fecal Coliform (cfu/100 ml) E. coli (cfu/100 ml)Station Description n Range (Wet) n Range (Dry) n Range (Wet) n Range (Dry)
Near Belmont Street, West Bridgewater 3 400-14,000 2 65-600 3 400-14,000 2 62-600
Beaver Brook Segment MA62-09 This 6.8 Class B brook segment extends from the outlet of Cleveland Pond, Abington to the confluence with the Salisbury Plain River, East Bridgewater. The communities of Brockton (MAR041098), East Bridgewater (MAR041109), and Abington (MAR041026) have general permit coverage under MS4. Environmental Science Services (ESS) sampled the brook at three stations between June and September 2002 during both wet and dry weather. Results of this sampling are presented in Table 4-8. It should be noted that all extreme elevated bacteria counts were associated with wet weather sampling. Table 4-8. Beaver Brook (Segment MA62-09) Bacteria Concentrations (ESS 2003). Fecal Coliform (cfu/100 ml) E. coli (cfu/100 ml)
Station Description n Range - Wet n Range - Dry n Range - Wet n Range - DryEast Ashland/Groveland Street, Brockton/Abington 3 4,800-9,600 2 12-95 3 4,600-9,400 2 10-95
Crescent Street, Brockton 3 830-2,300 2 120-180 3 400-2,200 2 80-100 Plymouth Street, Brockton 3 5,300-16,000 2 140-240 3 5,000-13,000 2 140-240 Meadow Brook Segment MA62-38 This 6.0 mile Class B river segment extends from the headwaters north of Pine Street, Whitman through Forge Pond, and East Bridgewater to the confluence with the Matfield River in East Bridgewater. Equity Industrial GHEB Limited Partnership (MA0004103) was authorized to discharge process wastewater and treated sanitary waste to this segment, but since March of 1999, waste is collected in an 18,000-gallon tank and treated offsite. The permit was terminated by EPA 5/17/2006. The communities of East Bridgewater (MAR041109) and Whitman (MAR04071) have general permit coverage under MS4. ESS sampled the brook at one station between June and August 2002 during both dry and wet weather. Results indicated that the highest bacteria counts were observed during wet weather conditions. Sampling results are presented in Table 4-9 below.

24
Table 4-9. Meadow Brook (Segment MA62-38) Bacteria Concentrations (ESS 2003). Fecal Coliform (cfu/100 ml) E. coli (cfu/100 ml)
Station Description n Range - Wet n Range - Dry n Range - Wet n Range - DryWest Union Street, East Bridgewater 3 200-1,600 2 190-650 3 200-1,600 2 180-630
Shumatuscacant River Segment MA62-33 This 8.5 mile Class B river segment extends from a wetland just west of Vineyard Road, Abington to the confluence with Poor Meadow Brook in Hanson. The Abington/Rockland Joint Water Works (MAG640009) is authorized to discharge treated filter backwash water into a wetland adjacent to the river. The communities of Whitman (MAR04071), Hanson (MAR041037), and Abington (MAR041026) have general permit coverage under MS4. ESS sampled the river at four stations between June and November 2002 during both dry and wet weather. ESS found that the highest bacteria counts were observed during wet weather sampling conditions. Results of this sampling are presented in Table 4-10 below. Table 4-10. Shumatuscacant River (Segment MA62-33) Bacteria Concentrations (ESS 2003).
Fecal Coliform (cfu/100 ml) E. coli (cfu/100 ml)Station Description n Range - Wet n Range - Dry n Range - Wet n Range - Dry
Near Summer Street, Abington 3 270-3,000 2 200-350 3 270-1,400 2 180-350 Near South Avenue, Whitman downstream of Hobart Pond
2 100-4,000 1 130 2 100-3,900 1 130
Franklin Street, Whitman/Hanson
3 23-6,500 2 6-130 3 23-5,000 2 6-130
South Avenue, Whitman downstream of South Avenue bridge
2 5,500-60,000 1 150 2 100-21,000 1 150
Matfield River Segment MA62-32 This 6.7 mile Class B, warm water fishery extends from the confluence of Beaver Brook and the Salisbury Plain River, East Bridgewater to the confluence with the Town River and the Taunton River, Bridgewater. The drainage area for this segment contains 1,008 acres of cranberry bogs. The East Bridgewater Public Schools have a NPDES permit (MA0022446) to discharge treated effluent to an unnamed tributary of the Matfield River. The communities of East Bridgewater (MAR041109) and Bridgewater (MAR041097) have general permit coverage under MS4. ESS sampled the river at five stations in East Bridgewater between June and September 2002 during both dry and wet weather. Results of this sampling are presented in Table 4-11 below.

25
Table 4-11. Matfield River (Segment MA62-32) Bacteria Concentrations (ESS 2003). Fecal Coliform (cfu/100 ml) E. coli (cfu/100 ml)
Station Description n Range (Wet) n Range (Dry) n Range (Wet) n Range (Dry)Near West Union Street 3 410-3,900 2 55-640 3 410-3,700 2 51-560 Near Route 18/Route 106 intersections 3 290-18,000 2 110-1,230 3 290-5,000 2 110-1,230
Near High Street Bridge 3 200-2,300 2 43-190 3 200-2,200 2 40-120 Threemile River Subwatershed Rumford River Segment MA62-39 This 8.0 mile Class B river segment extends from the outlet of Gavins Pond to the inlet of Norton Reservoir, Mansfield. This section of the river was previously part of segment MA62-15. There are 23 acres of cranberry bogs in this segments drainage area. The former Gorham Silver Company is applying for a NPDES permit (MA0035700) to discharge to a wetland near this segment. The community of Mansfield (MAR041126) has general permit coverage under MS4. Between July and September 2001, the MassDEP Division of Water Management (DWM) collected bacteria samples from one station along this river segment during dry weather. Results of this effort are summarized in Table 4-12 below. Table 4-12. Rumford River (Segment MA62-39) Bacteria Concentrations.
Station Description n Fecal Coliform
(cfu/100ml) E. coli
(cfu/100ml) Enterococci (cfu/100ml)
MassDEP DWM 2001 Spring Street, Mansfield 3 25-190 15-100 30-710 Wading River Segment MA62-47 This 4.2 mile Class A river segment (filtered public water supply) extends from the source in a wetland north of West Street, Foxborough to Balcolm Street, Mansfield. This section of the river was previously part of segment MA62-17. There are 15 acres of cranberry bogs in this segment’s drainage area. The communities of Mansfield (MAR041126) and Foxboro (MAR041115) have general permit coverage under MS4. In August 2001, the MassDEP DWM collected one sample at one station along the river. Results of this effort are summarized in Table 4-13 below.

26
Table 4-13. Wading River (Segment MA62-47) Bacteria Concentrations. Station Description Fecal Coliform
(cfu/100ml) E. coli
(cfu/100ml) Enterococci (cfu/100ml)
MassDEP DWM 2001 Near West Street, Mansfield 590 300 450 Wading River Segment MA62-49 This 9.7 mile Class B, warm water fishery extends from Balcom Street, Mansfield to the confluence with the Threemile River, Norton. Approximately 15 acres of this cranberry acreage is located in the subwatershed for Segment MA62-47, which is in the upper portion of this watershed” (MassDEP 2005). There are three individual NPDES permitted discharges currently discharging to this segment:
• Sinclair Manufacturing Company (MAG250030) is authorized to discharge non-contact cooling water into Chartley Brook, a tributary of this segment.
• Tweave Inc. (MA0005355) is permitted to discharge treated process wastewater to the Wading River.
• Sun Chemical Corporation/GPI Division (MAG250244) discharges non-contact cooling water to a tributary of this segment.
Additionally, the communities of Mansfield (MAR041126) and Norton (MAR041145) have general permit coverage under MS4. The MassDEP DWM collected samples for bacteria from the Wading River and Hodges Brook (a tributary to this segment) at four stations between June and September 2001 and from the outlet of Chartley Pond (a tributary) in August and September 2001. All samples were collected during dry weather. Results are summarized in Table 4-14. Table 4-14. Wading River (Segment MA62-49) Bacteria Concentrations
Station Description n Fecal Coliform (cfu/100ml)
E. coli (cfu/100ml)
Enterococci (cfu/100ml)
MassDEP DWM 2001 Wading River at Walker Street, Norton 1 460 190 690 Wading River at Route 123, Norton 3 50-860 20-85 50-5,000 Hodges Brook at road crossing upstream of the confluence with the Wading River
2 130-740 38-290 230-1,000
Wading River near Route 140, Norton 3 55-110 25-50 33-190 Outlet of Chartley Pond, Norton 2 22-90 <5-17 <5-370 Threemile River Segment MA62-56 This 12.8 mile Class B, warm water fishery extends from the confluence of the Wading and Rumford rivers, Norton to the impoundment spillway behind 66 South Street (Harodite Finishing), Taunton. This section of the river was previously part of segment MA62-16. Approximately 100 acres of cranberry bogs are farmed in this in this subwatershed (MassDEP 2005). There are three individual NPDES permitted discharges to this segment:

27
• The Town of Mansfield (MA0101737) is authorized to discharge treated municipal and industrial wastewater.
• BIW Cable Systems (MA0028649) is authorized to discharge processed wastewater and wastewater from the electrical test tank.
• Harodite Finishing Co. (MAG250032) is authorized to discharge non-contact cooling water. Additionally, the communities of Norton (MAR041145) and Taunton (MAR041164) have general permit coverage under MS4. In July, August, and September 2001, the MassDEP DWM collected samples for bacteria from one station on this segment during dry weather. Results of this effort are summarized in Table 4-15 below. Table 4-15. Threemile River (Segment MA62-56) Bacteria Concentrations. Station Description n Fecal Coliform
(cfu/100ml) E. coli
(cfu/100ml) Enterococci (cfu/100ml)
MassDEP DWM 2001 Harvey Street, Taunton 3 130-220 24-110 76-350 The TRWA conducts fecal coliform sampling near Route 44/Cohannet Street, Taunton on a monthly basis. With the exception of one date in the 2002/2003 period, fecal coliform counts were relatively lower than what was found in the MassDEP sampling. A final Quality Assurance Project Plan (QAPP) for the TRWA has not been approved therefore their data are not quality assured. Threemile River Segment MA62-57 This 0.02 square mile Class SB1 segment extends from the impoundment spillway behind 66 South Street, Taunton to the confluence with Taunton River. This section of the river was previously part of segment MA62-16. Approximately 100 acres of cranberry are located entirely within the subwatershed for this segment. The communities of Norton (MAR041145), and Taunton (MAR041164) have general permit coverage under MS4. DMF shellfish growing areas status as of September 30, 2009 is prohibited (see Figure 1-1). It is proposed for re-classification by DMF as Class SB shellfishing (restricted). This segment was impaired in the 2001 WQA report for Shellfish Harvesting Use based on the DMF prohibited classification. DMF staff indicate that the prohibition was due to elevated bacteria counts. Assonet River Subwatershed Assonet River Segment MA62-20 This 0.82 square mile Class SA segment extends from the Tisdale Dam (north of Route 79/Elm Street intersection), Freetown to the confluence with the Taunton River, Freetown. There are 413
1 The WQA report shows the Class as B with evidence to suggest that it should be SB due to salinity.

28
acres of cranberry bogs in this subwatershed, however, 403 acres of this cranberry acreage is located in the subwatershed for segment MA62-42, MA62-44, and MA62-19 which are in the upper portion of this subwatershed” (MassDEP 2005). The community of Freetown (MAR0100382) has general permit coverage under MS4. DMF shellfish growing areas status as of September 30, 2009 is prohibited (see Figure 1-1). This segment was impaired in the 2001 WQA report for Shellfish Harvesting Use based on the DMF prohibited classification. DMF staff indicate that the prohibition was due to elevated bacteria counts. Limited water quality data included one bacteria sample was collected by DWM from an unnamed tributary (Station AS10T) to this segment of the Assonet River in September 2001. The fecal coliform count was 5 cfu/100mL. The DWM collected one sample from an unnamed tributary to this segment during dry weather in 2001, which had a fecal coliform count of 5 cfu/100 mL, an E. coli count of <5, and an enterococci count of 14 cfu/100mL. Muddy Cove Brook Subwatershed Muddy Cove Brook Segment MA62-51 This 0.01 square mile Class SA segment extends from the outlet of a small impoundment behind 333 Main Street (Zeneca, Inc.), Dighton, to the confluence of the Taunton River in Dighton. Zeneca, Inc. (MAR05B053) was discharging stormwater under a multisector general stormwater permit to this segment of Muddy Cove Brook, however, the permit has expired and a reapplication for a new multisector general stormwater permit is required. The community of Dighton (MAR041105) has general permit coverage under MS4. The DMF shellfish harvesting classification is prohibited in this water body (see Figure 1-1). There is no additional water quality information available for the segment. This segment was impaired in the 2001 WQA report for Shellfish Harvesting Use based on the DMF prohibited classification. DMF staff indicate that the prohibition was due to elevated bacteria counts. Broad Cove Subwatershed Broad Cove Segment MA62-50 This 0.13 square mile Class SA segment is located in Dighton and Somerset. The community of Somerset (MAR041159) has general permit coverage under MS4. DMF shellfish growing area classification as of September 2009 is prohibited (see Figure 1-1). There is no additional water quality information available for the segment. This segment was impaired in the 2001 WQA report for Shellfish Harvesting Use based on the DMF prohibited classification. DMF staff indicate that the prohibition was due to elevated bacteria counts. Mainstem Taunton River Taunton River Segment MA62-02 This 0.29 square mile Class SB, CSO, segment that extends from the Route 24 Bridge in Taunton/Raynham to the Berkely Bridge in Dighton/Berkely. Approximately 5,504 acres of cranberry

29
bogs in this subwatershed, however, 4,762 acres of this cranberry acreage is located in the subwatershed for Segment MA62-01 that is in the upper portion of this subwatershed (MassDEP 2005). DMF shellfish growing areas status as of September 2009 is prohibited (see Figure 1-1). There are two individual NPDES permitted discharges currently discharging to this segment:
• The City of Taunton (MA0100897) is authorized to discharge treated industrial and sanitary wastewater and stormwater. During wet weather, the City discharges wastewater and stormwater from one combined sewer overflow (CSO) outfall.
• The Taunton Municipal Lighting Plant (TMLP) (MA0002241) electric power generating facility is authorized to discharge blowdown from a cooling tower, traveling screen backwash water, and discharge of trash rack spray nozzles.
Additionally, the communities of Taunton (MAR041164), Dighton (MAR041105), and Berkeley (MAR041092) have general permit coverage under MS4. This segment was impaired in the 2001 WQA report for Shellfish Harvesting Use based on the DMF prohibited classification. DMF staff indicate that the prohibition was due to elevated bacteria counts. Taunton River Segment MA62-03 This 0.92 square mile Class SB, CSO, segment extends from the Berkely Bridge, Dighton/Berkley to the confluence with the Assonet River at a line from Sandy Point, Somerset northeasterly to the southwestern tip of Assonet Neck, Berkley. There are 5,505 acres of cranberry bogs in this subwatershed, however, 5,504 acres of this cranberry acreage is located in the subwatershed for segments MA62-01 and MA62-02 that are in the upper portion of this subwatershed” (MassDEP 2005). The communities of Dighton (MAR041105) and Berkeley (MAR041092) have general permit coverage under MS4. DMF shellfish growing area classification as of September 2009 is prohibited (see Figure 1-1). There is no additional water quality information available for the segment. This segment was impaired in the 2001 WQA report for Shellfish Harvesting Use based on the DMF prohibited classification. DMF staff indicate that the prohibition was due to elevated bacteria counts. Taunton River Segment MA62-04 This 2.65 square mile Class SB, CSO, segment extends from the confluence with the Assonet River at a line from Sandy Point, Somerset northeasterly to the southwestern tip of Assonet Neck, Berkley to the mouth at Braga Bridge, Somerset/Fall River. There are 5,917 acres of cranberry bogs in this subwatershed, however, 5,505 acres of this cranberry acreage is located in the subwatershed for segments MA62-01, MA62-02, and MA62-03 that are in the upper portion of this subwatershed” (MassDEP 2005). There are four individual NPDES permitted discharges to this segment:
• Somerset Power LLC and Somerset Operations Inc. (MA0001856) are authorized to discharge condenser cooling water, treated wastewater, and stormwater runoff to this segment.
• Fall River Marine Terminal LLC (MA0004871) is permitted to discharge groundwater remediation wastewater, stormwater, and contact water.
• The Town of Somerset (MA0100676) is authorized to discharge treated municipal wastewater.

30
• The City of Fall River (MA0100382) is authorized to discharge from four CSO outfalls to this segment of the Taunton River.
Additionally, the communities of Somerset (MAR041159) and Fall River (MAR041113) have general permit coverage under MS4. The Town of Somerset operates a town beach, Pierce Beach, along this segment of the Taunton River. The beach is tested weekly for bacteria. In 2002 no postings were reported (MA DPH 2003). According to the Board of Health, the beach was posted twice for a total of four days in 2003 and was posted for three separate days in 2004 (Somerset BOH 2005). The Rhode Island Department of Environmental Management (RIDEM), in cooperation with the Massachusetts Division of Marine Fisheries (MADMF), conducted an ambient water quality investigation for bacteria in 2006 to support a Rhode Island TMDL evaluation of Mount Hope Bay and the Kickemuit River in Rhode Island. Part of the study was to also monitor (by MADMF) adjoining Massachusetts Waters in Mount Hope Bay, MA 61-06, and MA61-07 and in the adjoining Taunton River MA62-04 segment. For the Massachusetts waters, there were 5 sampling days between June 1-6, 2006: June 1, just before a major rain event; June 3, during the first part of the rain event; June 4, during the last part of the rain event (total rain ~2.50”); June 5, just after the conclusion of the rain event; and June 6, one day after the rain event. Within the Taunton River segment (MA62-04), the RIDEM and MADMF had 8 sampling stations, stretching from the Braga Bridge in Somerset at the southern end of the segment, to just south of the junction of the Taunton and Assonet Rivers at the northern end of the segment. These were sampled 5 times between June 1-5 (see Table 4-16 below). Fecal coliform levels ranged between 3- 1,500 CFU/100mL. There were notable bacteria elevations, particularly in the southern half of the segment on June 3 and 5, during and just following a June 3-4 heavy rain event. Table 4-16. Taunton River MA62-04 Segment (upstream of Mount Hope Bay MA61-06 Segment) RIDEM and MADMF Ambient 2006 Indicator Bacteria Data Summary.
Stations
Range of Fecal Coliform
CFU/100mL. (No. of Samples)
Geometric Mean
90th Percentile
8 stations, sampled 5 times, June 1-6, 2006
3- 1,500 (40) 133 (5) 460
DMF shellfish growing areas classification as of September 2009 is prohibited (see Figure 1-1). Other Tributaries Segreganset River Segment MA62-55 This 0.02 square mile Class SA segment extends from approximately 250 feet north of Brook Street in Dighton to the confluence with the Taunton River in Dighton. There are no NPDES discharges along this segment of the Segreganset River, however, the community of Dighton (MAR041105), has general permit coverage under MS4. DMF shellfish growing area classification as of September

31
2009 is prohibited (see Figure 1-1). There is no additional water quality information available for the segment. This segment was impaired in the 2001 WQA report for Shellfish Harvesting Use based on the DMF prohibited classification. DMF staff indicate that the prohibition was due to elevated bacteria counts.

32
5.0 Potential Sources The Taunton River watershed has 20 segments, located throughout the watershed, that are listed as pathogen impaired and which require TMDLs. Sources of indicator bacteria in the Taunton River watershed are many and varied. A significant amount of work has been done in the last decade to improve the water quality in the Taunton River watershed. Largely through the efforts of the Division of Marine Fisheries (DMF), the ESS Group Inc, and MassDEP field staff, numerous point and non-point sources of fecal contamination have been identified. Table 5-1 summarizes the river segments impaired due to measured indicator bacteria densities and identifies some of the suspected and known sources identified in the WQA. Some dry weather sources include:
leaking sewer pipes, stormwater drainage systems (illicit connections of sanitary sewers to storm drains), failing septic systems, recreational activities, wildlife including birds, and inadequately treated boat wastes.
Some wet weather sources include:
wildlife and domesticated animals (including pets), stormwater runoff including municipal separate storm sewer systems (MS4), combined sewer overflows (CSOs), and sanitary sewer overflows (SSOs).
It is difficult to provide accurate quantitative estimates of indicator bacteria contributions from the various sources in the Taunton River watershed because many of the sources are diffuse and intermittent, and extremely difficult to monitor or accurately model. Therefore, a general level of quantification according to source category is provided (e.g., see Tables 5-2 and 5-3). This approach is suitable for the TMDL analysis because it indicates the magnitude of the sources and illustrates the need for controlling them. Additionally, many of the sources (failing septic systems, leaking sewer pipes, sanitary sewer overflows, and illicit sanitary sewer connections) are prohibited, because they indicate a potential health risk and, therefore, must be eliminated. However, estimating the magnitude of overall indicator bacteria loading (the sum of all contributing sources) is achieved for wet and dry conditions using the extensive ambient data available that define baseline conditions (see segment summary tables and MassDEP 2005). A brief overview of potential sources of bacteria and ways to mitigate them is provided in the following sections.

33
Table 5-1. Potential Sources of Bacteria in Pathogen Impaired Segments in the Taunton River Watershed. Segment Segment Name Potential Sources Matfield River Subwatershed MA62-08 Salisbury Brook MS4s, illicit connections to storm sewers, high density
urban areas MA62-07 Trout Brook MS4s, illicit connections to storm sewers, high density
urban areas MA62-05 Salisbury Plain River MS4s, illicit connections to storm sewers, high density
urban areas MA62-06 Salisbury Plain River MS4s, high density urban areas MA62-09 Beaver Brook MS4s, high density urban areas MA62-38 Meadow Brook MS4s, high density urban areas, waterfowl and waste
from pets MA62-33 Sumatuscacant River MS4s, high density urban areas, waterfowl and waste
from pets MA62-32 Matfield River Municipal point sources, MS4s Threemile River Subwatershed MA62-39 Rumford River Unknown MA62-47 Wading River Unknown MA62-49 Wading River Unknown MA62-56 Threemile River Unknown MA62-57 Threemile River MS4s Assonet River Subwatershed MA62-20 Assonet River MS4s, septic systems, marina/boating pumpout releases Muddy Cove Brook Subwatershed MA62-51 Muddy Cove Brook MS4s Broad Cove Subwatershed MA62-50 Broad Cove MS4s Mainstem Taunton River MA62-02 Taunton River MS4s, CSOs, septic systems MA62-03 Taunton River MS4s, CSOs, septic systems, marina/boating releases MA62-04 Taunton River MS4s, CSOs, septic systems, marina/boating releases Other Tributaries MA62-55 Segreganset River MS4s MS4 = Municipal Separate Stormwater Sewer System – community stormwater drainage system Sources were identified in the MassDEP WQA.

34
Sanitary Waste Leaking sewer pipes, illicit sewer connections, sanitary sewer overflows (SSOs), combined sewer overflows (CSOs) and failing septic systems represent a direct threat to public health since they result in discharge of partially treated or untreated human wastes to the surrounding environment. Quantifying these sources is extremely speculative without direct monitoring of the source because the magnitude is directly proportional to the volume of the source and its proximity to the surface water. Typical values of fecal coliform in untreated domestic wastewater range from 104 to 106 MPN/100mL (Metcalf and Eddy 1991). Illicit sewer connections into storm drains result in direct discharges of sewage via the storm drainage system outfalls. The existence of illicit sewer connections to storm drains is well documented in many urban drainage systems, particularly older systems that may have once been combined. The EPA, MassDEP and many communities have been active in the identification and mitigation of these sources. It is probable that numerous illicit sewer connections exist in storm drainage systems serving the older developed portions of the Taunton River watershed. Monitoring of storm drain outfalls during dry weather is needed to document the presence or absence of sewage in the drainage systems. Approximately 51.6 percent of the Taunton River watershed is classified as Urban Areas by the United States Census Bureau and is therefore subject to the Stormwater Phase II Final Rule that requires the development and implementation of an illicit discharge detection and elimination plan. See Section 8.0 of this TMDL for information regarding illicit discharge detection guidance. Septic systems designed, installed, operated and maintained in accordance with 310 CMR 15.000 (Title 5), are not significant sources of fecal coliform bacteria. Studies demonstrate that wastewater located four feet below properly functioning septic systems contain on average of less than one fecal coliform bacteria organism per 100 mL (Ayres Associates 1993). Failed or non-conforming septic systems, however, can be a major contributor of fecal coliform to the Taunton River watershed. Wastes from failing septic systems enter surface waters either as direct overland flow or via groundwater. Wet weather events typically increase the rate of transport of pollutant loadings from failing septic systems to surface waters because of the wash-off effect from runoff and the increased rate of groundwater recharge. Recreational use of waterbodies is a source of pathogen contamination. Swimmers themselves may contribute to bacterial impairment at swimming areas. When swimmers enter the water, residual fecal matter may be washed from the body and contaminate the water with pathogens. In addition, small children in diapers may contribute to contamination of the recreational waters. These sources are likely to be particularly important when the number of swimmers is high and the flushing action of waves or tides is low. Another potential source of pathogens is the discharge of sewage from vessels with onboard toilets. These vessels are required to have a marine sanitation device (MSD) to either store or treat sewage. When MSDs are operated or maintained incorrectly they have the potential to discharge untreated or inadequately treated sewage. For example, some MSDs are simply tanks designed to hold sewage

35
until it can be pumped out at a shore-based pump-out facility or discharged into the water more than 3 miles from shore. Uneducated boaters may discharge untreated sewage from these devices into near-shore waters. In addition, when MSDs designed to treat sewage are improperly maintained or operated they may malfunction and discharge inadequately treated sewage. Finally, even properly operating MSDs may discharge sewage in concentrations higher than allowed in ambient water for shellfishing, or primary and secondary contact recreational activities. Vessels are most likely to contribute to bacterial impairment in situations where large numbers of vessels congregate in enclosed environments with low tidal flushing. Many marinas and popular anchorages are located in such environments. Wildlife and Pet Waste Animals that are not pets can be a potential source of pathogens. Geese, gulls, and ducks are speculated to be a major pathogen source, particularly at lakes and stormwater ponds where large resident populations have become established (Center for Watershed Protection 1999). In coastal areas, the Division of Marine Fisheries, in their shoreline survey work, has observed increased populations of various birds, particularly of the migratory kind. Household pets such as cats and dogs can be a substantial source of bacteria – as much as 23,000,000 colonies/gram, according to the Center for Watershed Protection (1999). A rule of thumb estimate for the number of dogs is approximately 1 dog per 10 people, producing an estimated 0.5 pound of feces per dog per day. Using the population estimate (700,000) provided on the Executive Office of Environmental Affairs website for this watershed, 35,000 pounds of feces are produced per day in the Taunton River watershed. Uncollected pet waste is then flushed from the parks, beaches and yards where pets are walked and transported into nearby waterways during wet-weather. Stormwater Stormwater runoff is another significant contributor of pathogen pollution. As discussed above, during rain events fecal matter from domestic animals and wildlife are readily transported to surface waters via the stormwater drainage systems and/or overland flow. The natural filtering capacity provided by vegetative cover and soils is dramatically reduced as urbanization occurs because of the increase in impervious areas (i.e., streets, parking lots, etc.) and stream channelization in the watershed. Extensive stormwater data have been collected and compiled both locally and nationally (e.g., Tables 4-1, 4-2, 5-2 and 5-3) in an attempt to characterize the quality of stormwater. Bacteria are easily the most variable of stormwater pollutants, with concentrations often varying by factors of 10 to 100 during a single storm. Considering this variability, stormwater bacteria concentrations are difficult to accurately predict. Caution must be exercised when using values from single wet weather grab samples to estimate the magnitude of bacteria loading, because it is often unknown whether the sample is representative of the “true” mean. To gain an understanding of the magnitude of bacterial loading from stormwater and avoid overestimating or underestimating bacteria loading, event mean concentrations (EMC) are often used. An EMC is the concentration of a flow proportioned sample throughout a storm event. These samples are commonly collected using an automated sampler which can proportion sample aliquots based on flow. Typical stormwater event

36
mean densities for various indicator bacteria in Massachusetts watersheds and nationwide are provided in Tables 5-2 and 5-3. These EMCs illustrate that stormwater indicator bacteria concentrations from certain land uses (i.e., residential) are typically at levels sufficient to cause water quality problems. Table 5-2. Lower Charles River Basin Stormwater Event Mean Bacteria Concentrations (data summarized from USGS 2002) and Necessary Reductions to Meet Class B WQS.
Land Use Category Fecal Coliform
EMC (cfu/100 mL)
Number of
Events Class B WQS1 Reduction to
Meet WQS (%)
Single Family Residential 2,800 – 94,000 8 10% of the
samples shall not exceed 400
cfu/100 mL
2,400 – 93,600 (85.7 – 99.6)
Multifamily Residential 2,200 – 31,000 8 1,800 – 30,600 (81.8 – 98.8)
Commercial 680 – 28,000 8 280 – 27,600 (41.2 - 98.6)
1 Former Class B Standard: Shall not exceed a geometric mean of 200 cfu/100mL in any set of representative samples, nor shall 10% of the samples exceed 400 cfu/100/mL. Used 400 to illustrate required reductions since a geometric mean of the samples were not provided. Table 5-3. Stormwater Event Mean Fecal Coliform Concentrations (as reported in MassDEP 2002b; original data provided in Metcalf & Eddy, 1992) and Necessary Reductions to Meet Class B WQS.
Land Use Category Fecal Coliform1
cfu/100 mL Class B WQS2 Reduction to Meet WQS
(%) Single Family Residential 37,000 10% of the
samples shall not exceed 400 cfu/100 mL
36,600 (98.9) Multifamily Residential 17,000 16,600 (97.6) Commercial 16,000 15,600 (97.5) Industrial 14,000 13,600 (97.1) 1 Derived from NURP study event mean concentrations and nationwide pollutant buildup data (USEPA 1983). 2 Former Class B Standard: Shall not exceed a geometric mean of 200 cfu/100 mL in any set of representative samples, nor shall 10% of the samples exceed 400 cfu/100 mL. Used 400 to illustrate required reductions since a geometric mean of the samples were not provided.

37
6.0 Prioritization and Known Sources This section is intended to provide guidance for setting implementation priorities to identify and eliminate bacteria sources within the Taunton River Watershed and to briefly describe on-going efforts within the watershed. Guidance is provided by prioritizing both impaired segments as well as specific sources where known. Table 6-1 provides a prioritized list of pathogen-impaired segments that will require additional bacterial source tracking work and implementation of structural and non-structural Best Management Practices (BMP’s). Since limited source information and data may be available in each impaired segment a simple scheme was used to prioritize segments based on fecal coliform and E.coli concentrations. High priority was assigned to those segments where either dry or wet weather concentrations were equal to or greater than 10,000 cfu /100 ml. Medium priority was assigned to segments where concentrations ranged from 1,000 to 9,999 cfu/100ml. Low priority was assigned to segments where concentrations were observed less than 1,000 cfu/100 ml. MassDEP believes the higher concentrations are indicative of the potential presence or raw sewage and therefore they pose a greater risk to the public. It should be noted that in all cases waters exceeding the water quality standards identified in Table ES-2 or 7-1 are considered impaired. Also, prioritization is adjusted upward based on proximity of waters, within the segment, to sensitive areas such as Outstanding Resource Waters (ORW’s), or designated uses that require higher water quality standards than Class B, such as public water supply intakes, public swimming areas, or shellfish areas. Best professional judgment was used in determining this upward adjustment. Generally speaking, waters that were determined to be lower priority based on the numeric range identified above were elevated up one level of priority if that segment were adjacent to or immediately upstream of a sensitive use. An asterisk * in the priority column of the specific segment would indicate this situation. Table 6-1. Bacteria Impaired Priority Segments.
Segment ID Segment Name
Segment Size
Segment Description/Sampling Locations
Priority ”Dry”
Priority “Wet”
Matfield River Subwatershed
MA62-08 Salisbury Brook 2.5
miles
Outlet of Cross Pond, Brockton to the confluence with Trout Brook forming the Salisbury Plain River, Brockton • Elmwood Avenue Brockton • Near Belmont Avenue, Brockton • Near Montgomery Street, Brockton • Near Chester Street, Brockton • Near Otis Street, Brockton
Low Medium Low High Medium
High High High High High

38
Segment ID Segment Name
Segment Size
Segment Description/Sampling Locations
Priority ”Dry”
Priority “Wet”
MA62-07 Trout Brook 3.4
miles
Source northeast of Argyle Avenue and west of Conrail Line, Avon to the confluence with the Salisbury Brook forming the Salisbury Plain River, Brockton • Studley Avenue, Brockton • East Ashland Street, Brockton • Court Street, Brockton • Crescent Street, Brockton
Medium Low High High
Medium High Medium Medium
MA62-05 Salisbury Plain River 2.4
miles
Confluence of Trout and Salisbury brooks, Brockton to the Brockton AWRF discharge, Brockton • Near Plain Street, Brockton • Behind 1690 Main Street, Brockton
Medium Medium
High Medium
MA62-06 Salisbury Plain River 2.3
miles
Brockton AWRF discharge, Brockton to the confluence with Beaver Brook forming the Matfield River, East Bridgewater Near Belmont Street, West Bridgewater
Low
High
MA62-09 Beaver Brook 6.8
miles
Outlet of Cleveland Pond, Abington to confluence with Salisbury Plain River, East Bridgewater East Ashland/Groveland Street, Brockton/Abington Crescent Street, Brockton Plymouth Street, Brockton
Low Low Low
Medium Medium High
MA62-38 Meadow Brook 6.0
miles
Headwaters north of Pine Street, Whitman to confluence with Matfield River, East Bridgewater • West Union Street, East Bridgewater
Low
Medium
MA62-33 Shumatuscacant River 8.5
miles
Wetland west of Vineyard Road, Abington to confluence with Poor Meadow Brook, Hanson • Near Summer Street, Abington • Near South Avenue, Whitman
downstream of Hobart Pond • Franklin Street, Whitman/Hanson • South Avenue, Whitman downstream of
South Avenue bridge
Low Low Low Low
Medium Medium Medium High

39
Segment ID Segment Name
Segment Size
Segment Description/Sampling Locations
Priority ”Dry”
Priority “Wet”
MA62-32 Matfield River 6.7
miles
Confluence of Beaver Brook and Salisbury Plain River East Bridgewater to the confluence with the Town River and Taunton River, Bridgewater • Near West Union Street • Near Route 18/Route 106 intersections • Near High Street bridge
Low Medium Low
Medium Medium Medium
Threemile River Subwatershed
MA62-39 Rumford River 8.0 miles
Outlet Gavin Pond, Sharon to inlet of Norton Reservoir, Mansfield
• Spring Street, Mansfield Low
No Data
MA62-47 Wading River 4.2
miles
Source in wetland north of West Street, Foxborough to Balcom Street, Mansfield • Near West Street, Mansfield
Medium*
MA62-49 Wading River 9.7
miles
Balcom Street, Mansfield to confluence with Threemile River, Norton • Wading River at Walker Street, Norton • Wading River at Route 123, Norton • Hodges Brook at road crossing
upstream of the confluence with the Wading River
• Wading River near Route 140, Norton • Outlet of Chartley Pond, Norton
Low Low Low
Low Low
MA62-56 Threemile River 12.8 miles
Confluence of Wading and Rumford rivers, Norton to impoundment spillway behind 66 South Street (Harodite Finishing), Taunton • Harvey Street, Taunton • Near Route 44/Cohannet Street,
Taunton
Low Low1
MA62-57
Threemile River
0.02
sq. mi.
Impoundment spillway behind 66 South Street (Harodite Finishing), Taunton to confluence with Taunton River, Taunton/Dighton • Somerset Avenue (Route 138, Dighton
Low1
Assonet River Subwatershed

40
Segment ID Segment Name
Segment Size
Segment Description/Sampling Locations
Priority ”Dry”
Priority “Wet”
MA62-20
Assonet River
0.82
sq. mi.
Tisdale Dam , Freetown to the confluence with the Taunton River, Freetown • Unnamed Tributary
Medium (Insufficient Data, restricted Shellfishing Use downstream )
Muddy Cove Brook Subwatershed
MA62-51 Muddy Cove Brook 0.01
sq. mi.
Outlet of small impoundment behind 333 Main Street (Zeneca, Inc.), Dighton to confluence Taunton River, Dighton
High (Insufficient Data, restricted Shellfishing Use downstream )
Broad Cove Subwatershed
MA62-50 Broad Cove 0.13
sq. mi. Located in Dighton and Somerset
High (Insufficient Data, restricted Shellfishing Use downstream )
Mainstem Taunton River
MA62-02 Taunton River 0.29
sq. mi.
Route 24 Bridge, Taunton/Raynham to Berkley Bridge, Dighton/Berkley • Near Longmeadow Road Bridge,
Taunton • Near Plain Street, Taunton • Near Center Street (Berkley Bridge),
Berkley
Medium1*
High1*+ Medium1*
MA62-03 Taunton River 0.92
sq. mi.
Berkley Bridge, Dighton/Berkley to confluence with Assonet River at a line from Sandy Point, Somerset northeasterly to the southwestern tip of Assonet Neck, Berkley
High* (Insufficient Data, restricted Shellfishing Use downstream )
MA62-04 Taunton River 2.7
sq. mi.
Confluence with Assonet River at a line from Sandy Point, Somerset northeasterly to the southwestern tip of Assonet Neck, Berkley to mouth at Braga Bridge, Somerset/Fall River
High* (Insufficient Data, restricted Shellfishing Use downstream )
Other Tributaries
MA62-55
Segreganset River 0.02
sq. mi. Approximately 250 feet north of Brook Street, Dighton to confluence with the Taunton River, Dighton
High* (Insufficient Data, restricted Shellfishing Use downstream )
*Use elevated due to proximity to sensitive use segment 1Data collected by TRWA. A final Quality Assurance Project Plan for the TRWA has not been approved therefore their data are not quality assured.

41
As previously noted MassDEP believes that segments ranked as high priority in Table 6-1 are indicative of the potential presence of raw sewage and therefore pose a greater risk to the public. Elevated dry weather bacteria concentrations could be the result of illicit sewer connections or failing septic systems. As a result, the first priority should be given to bacteria source tracking activities in those segments where sampling activities show elevated levels of bacteria during dry weather. Identification and remediation of dry weather bacteria sources is usually more straightforward and successful than tracking and eliminating wet weather sources. If illicit bacteria sources are found and eliminated it should result in a dramatic reduction of bacteria concentration in the segment in both dry and wet-weather. Segments that remain impaired during wet weather should be evaluated for stormwater BMP implementation opportunities starting with less costly non-structural practices first (such as street sweeping, and/or managerial approaches using local regulatory controls with ongoing evaluation of the success of those programs. If it is determined that less costly approaches are not sufficient to address the issue then appropriate structural BMPs should be identified and implemented where necessary. Structural stormwater BMP implementation may require additional study to identify cost efficient and effective technology. Ongoing Efforts The City of Fall River, which has four combined sewer outfalls that discharge to the Taunton River, Segment MA62-04. The City of Fall River has a $ 150 million long- term CSO construction and control plan well underway. Already accomplished has been a major upgrading of the Fall River Water Pollution Control Facility, and construction of a CSO storage tunnel which has increased the peak hydraulic capacity of the treatment facility for combined dry and wet-weather flow to 106-million gallons per day. Also, well under way is a partial (sewer and catch basin) separation program, which is expected to be fully completed in 2018. The Long Term Control Plan (LTCP) calls for control of the 4 CSO discharges within this segment, as well as the remaining 8 CSO discharges further downstream into Mount Hope Bay. The Taunton Wastewater Treatment Facility collects and treats municipal wastewater from a portion of the surrounding municipal area. The facility provides advanced treatment and one stage ammonia-nitrogen removal. During springtime, high ground water conditions create flows to the plant that can reach 22.4 mgd, from a dry weather average flow of 6.5 mgd. The treatment facility is currently permitted to discharge 8.5 mgd. An EPA Enforcement Order, dated 9/2008, required the City of Taunton to identify all combination manholes and create a schedule to completely separate the combined flows in order to control unauthorized discharges of sanitary sewage to storm drains, or stormwater to the sanitary sewers. There is a single CSO in the City of Taunton, located on West Water Street (Outfall 004). The City of Taunton has been subject to several enforcement actions for high flow related effluent violations, including EPA administrative orders No. 94-31 issued in 1994, No. 96-04 issued in 1996, No. 08-042 issued in 2008, and a MADEP order issued in 2005. The overflows are associated with heavy rainfall events and are due primarily to infiltration and inflow (I/I) into the system. The City is under certain mandates and timelines to resolve I/I issues such as removing unauthorized sump pumps and roof leader drains, fixing failing infrastructure to prevent infiltration, and repairing cross connections going between sewer connections and stormwater

42
conveyances. The long- term CSO Plan for Taunton is total elimination of flows from this CSO by October 2013. The City of Brockton has a NPDES permit to discharge treated sanitary and industrial wastewater from the Brockton Advanced Water Reclamation Facility into the Salisbury Plain River. The City received funding through the 2003 SRF Program to rehabilitate its aging collection system and its treatment facility. The project objective is to eliminate the environmental and public health issues associated with sewer system overflows and discharge violations at the treatment facility. The Town of Dighton received funding in 2003 from the Clean Water SRF to identify areas of the community where existing on-site sewage disposal systems are inadequate for wastewater disposal and to develop recommendations for wastewater management to protect ground water and surface waters including the Threemile River, Taunton River and Muddy Cove. Wheaton College is authorized to discharge sanitary wastewater and cooling water (MA0026182) into the Rumford River (Segment MA62-40). MassDEP issued an Administrative Consent Order to Wheaton College in December 2004 establishing timelines to develop, permit, and construct enhancements to its wastewater treatment facility. Illicit sewer connections were discovered in 2003 along the Mill River in the Weir Street area in the City of Taunton. Several homes and businesses had their wastewater systems hooked up to stormwater drain pipes instead of sewer pipes. An engineering firm was contracted by the City of Taunton to characterize the sewage leak to the Mill River. Twenty-five illicit connections were verified along Weir, High and Winthrop Streets and a rehabilitation project was undertaken to correct the illicit connections. Working with the Massachusetts Water Pollution Abatement Trust, MassDEP administers a revolving fund known as the Community Septic Management Program. This loan program offers three options from which a local government can provide low interest loans to eligible homeowners for septic system improvement. Some of the municipalities in the Taunton River Watershed participating the Community Septic Management Program are Berkley, Bridgewater, East Bridgewater, Halifax, Hanson, Lakeville, Middleboro, Norton, Raynham, Taunton, West Bridgewater, Whitman and Wrentham. The Southeast Regional Office (SERO) of MassDEP has undertaken several enforcement related activities to reduce bacterial contamination in the Taunton River watershed including the following: • The Massachusetts Highway Department Maintenance Facility, East Main Street, Route 123,
Facility #103, Norton. This facility currently has an outdated subsurface sewage disposal system and will be constructing an upgraded system which proposes to dispose of an average of 225 gallons per day. This site lies in close proximity to Route 495 and any surface water runoff from this site would flow to the Canoe River.

43
• Landsdowne Condominiums, 41 Foundry Street, Easton. This facility is defined by Title 5 as a "large system". An individual subsurface sewage disposal system was designed and repaired in accordance with Title 5 provisions, and a certificate of compliance was granted to this facility in 2003. Prior to the upgrade, there was at least one incidence where the disposal system hydraulically failed, causing flow to the ground surface. Based on the topographical elevation, any surface water runoff from this site would make its way into either Little Cedar Swamp (and then into Hockomock swamp wildlife management area) or directly into Hockomock swamp, and potentially the Hockomock River.
• City of Taunton sewerage system. A phase II Sewer System Evaluation Survey Report was
submitted in November 2005 in response to recent enforcement. The report presents the results of fieldwork and analysis to develop cost effective measures for reducing infiltration/inflow within certain areas of the city's sewer system. In addition construction commenced in August 2005 on Phase I sewer rehabilitation, the scope of which included elimination of illicit sewer connections in select subsystems. For those select subsystems where illicit sewer connections were eliminated, based on the topographical elevation, any surface water runoff from this site would make its way into either the Mill River, the Three Mile River or Cobb Brook.
Guidance for developing specific bacterial implementation controls can be retrieved from the companion pathogen TMDL Document, “Mitigation Measures to Address Pathogen Pollution in “Surface Waters: A TMDL Implementation Guidance Manual (ENSR 2005)”.

44
7.0 Pathogen TMDL Development Section 303 (d) of the Federal Clean Water Act (CWA) requires states to identify waters that do not meet the water quality standards on a list of impaired waterbodies. The 2008 integrated List identifies 20 segments within the Taunton River Watershed for use impairment caused by excessive indicator bacteria concentrations. The CWA requires each state to establish Total Maximum Daily Loads (TMDLs) for listed waters and the pollutant contributing to the impairment(s). TMDLs determine the amount of a pollutant that a waterbody can safely assimilate without violating the water quality standards. Both point and non-point pollution sources are accounted for in a TMDL analysis. EPA regulations require that point sources of pollution (those discharges from discrete pipes or conveyances) subject to NPDES permits receive a waste load allocation (WLA) specifying the amount of a pollutant they can release to the waterbody. Non-point sources of pollution (all sources of pollution other than point) receive load allocations (LA) specifying the amount of a pollutant that can be released to the waterbody. In the case of stormwater, it is often difficult to identify and distinguish between point source discharges that are subject to NPDES regulation and those that are not. Therefore EPA has stated that it is permissible to include all point source stormwater discharges in the WLA portion of the TMDL. MassDEP has taken this approach. In accordance with the CWA, a TMDL must account for seasonal variations and a margin of safety, which accounts for any lack of knowledge concerning the relationship between effluent limitations and water quality. Thus:
TMDL = WLAs + LAs + Margin of Safety (MOS)
Where: WLA = Waste Load Allocation which is the portion of the receiving water’s loading capacity that is allocated to each existing and future point source of pollution. LA = Load Allocation which is the portion of the receiving water’s loading capacity that is allocated to each existing and future nonpoint source of pollution (and point sources not subject to NPDES permits).
MOS = Margin of Safety which in this TMDL is implicit in that it is incorporated into the TMDL analysis through conservative assumptions (see section 7.5).
7.1 – General Approach: Development of TMDL Targets For this TMDL the MassDEP developed two types of daily TMDL targets. First, MassDEP set Daily concentration TMDL targets for all potential pathogen sources by category (i.e., stormwater, NPDES, etc) and surface water classification. Expressing a loading capacity for bacteria in terms of concentrations set equal to the Commonwealth’s adopted criteria, as provided in Table 7-1, provides the clearest and most understandable expression of water quality goals to the public and to groups

45
that conduct water quality monitoring. MassDEP recommends that the concentration targets be used as the primary guide for implementation (See Section 7.2). Second, MassDEP estimated the total maximum daily load for each river or stream segment as a function of flow. Expressing the loading capacity for bacteria in terms of loadings (e.g., numbers of organisms per day, cfu/day), although valid as a TMDL, is more difficult for the public to understand because the “allowable” loading number varies with flow over the course of the day and season. Also, the loading numbers are very large (i.e. billions or trillions of bacteria per day) and therefore difficult to interpret as they do not relate directly to the State Water Quality Standards or public health criteria (See Section 7.3). Each methodology is described in greater detail in the following sections. Each approach assures loading capacities for each segment and its use will meet appropriate indicator bacteria Water Quality Standards.
7.2 Waste Load Allocations (WLAs) and Load Allocations (LAs) As Daily Concentration (cfu/100mL).
To ensure attainment with water quality standards throughout the waterbody, MassDEP emphasizes the simplest and most readily understood way of meeting the TMDL is to have a goal of bacteria sources not exceeding the WQS criteria at the point of discharge. This is also an implicit conservative approach with respect to the MOS. Sources of indicator bacteria in the Taunton River Watershed are varied; however data indicate that most of the bacteria sources are likely stormwater related. (Sections 4, 5 and 6 of this document discuss in more detail the types of sources identified as well as their prioritization for implementation). Point sources within the Taunton River Watershed include five major wastewater treatment plants (WWTPs), including: Brockton AWRF (MA0101010), Mansfield WWTP (MA0101737) Taunton WWTP including one CSO (MA0100897), Somerset WWTP (MA0100676), Fall River WWTP, 5 CSOs (MA0100382_. Also included are other NPDES-permitted wastewater discharges are: process, non-contact cooling water, power plant cooling, or other industrial wastewaters. NPDES wastewater discharge WLAs are set at the water quality standards. In addition, there are numerous stormwater discharges from storm drainage systems throughout the watershed, (many covered under the EPA Phase II MS4 Program), in the communities of: Brockton, East Bridgewater, Bridgewater, Abington, Whitman, Hanson, Mansfield Norton, Foxboro, Taunton, Freetown, Dighton, Somerset, Berkeley, and Fall River. All piped discharges are, by definition, point sources regardless of whether they are currently subject to the requirements of NPDES permits. Therefore a WLA set equal to the WQS criteria will be assigned to the portion of the stormwater that discharges to surface waters via storm drains. For any illicit sources, including illicit discharges to stormwater systems and sewer system overflows (SSO’s), the goal is complete elimination (100% reduction). Source categories representing discharges of untreated sanitary sewage to receiving waters are prohibited, and therefore, assigned WLAs and LAs equal to zero. The specific goal for controlling combined sewer overflows (CSO’s) is meeting water quality standards.

46
Table 7-1 presents the TMDL indicator bacteria WLAs and LAs for the various source categories as daily concentration targets for the Taunton River Watershed. WLAs and LAs are presented by source categories with respect to the applicable water quality standards for each water quality classification. The full version of the water quality standards can be accessed at: http://www.mass.gov/dep/service/regulations/314cmr04.pdf. It is recommended that these concentration targets be used to guide implementation. The goal to attain WQS at the point of discharge is environmentally protective, and offers a practical means to identify and evaluate the effectiveness of control measures. In addition, this approach establishes clear objectives that can be easily understood by the public and others responsible for monitoring activities. Success of the control efforts and subsequent conformance with the TMDL can be determined by documenting that a sufficient number of valid bacteria samples from the receiving water meet the appropriate bacteria indicator criteria (WQS) for the segment’s water quality classification. Table 7-1. Waste Load Allocations (WLAs) and Load Allocations (LAs) as Daily Concentrations (CFU/100mL).
Surface Water Classification Pathogen Source
Waste Load AllocationIndicator Bacteria
(CFU/100 mL)1
Load AllocationIndicator Bacteria
(CFU/100 mL)1
A, B, SA, SB (prohibited discharges)
Illicit discharges to storm drains 0 Not Applicable
Leaking sanitary sewer lines 0 Not Applicable
Failing septic systems N/A 0
A (Includes filtered
water supply)
& B
Any regulated discharge- including stormwater runoff4 subject to Phase I or II NPDES permits, NPDES wastewater treatment plant discharges 7,9, and combined sewer overflows6.
Either: E. coli ≤geometric mean5 126 colonies per 100 ml; single sample ≤235 colonies per 100 ml;
or Enterococci geometric mean5 ≤ 33 colonies per 100 ml and single sample ≤ 61 colonies per 100 ml
Not Applicable
Nonpoint source stormwater runoff4
Not Applicable
Either: E. coli ≤geometric mean5 126 colonies per 100 ml; single sample ≤235 colonies per 100 ml;
or Enterococci geometric mean5≤ 33 colonies per 100 ml and single sample ≤ 61 colonies per 100 ml
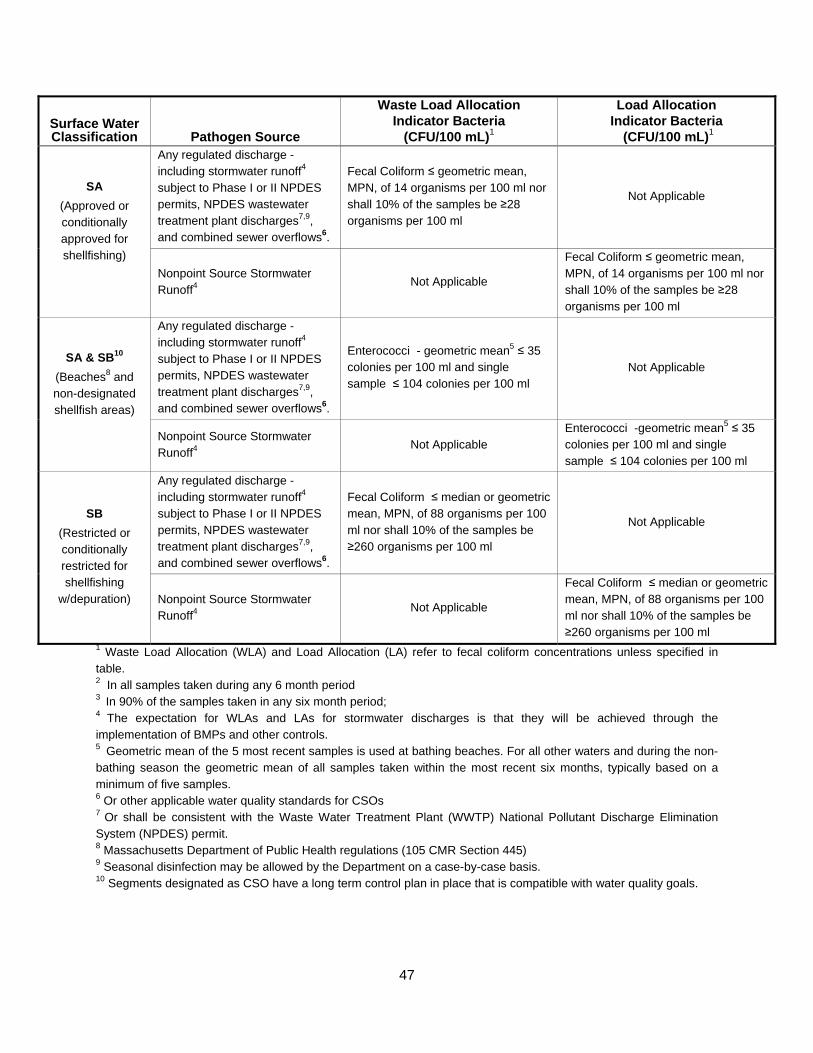
47
Surface Water Classification Pathogen Source
Waste Load AllocationIndicator Bacteria
(CFU/100 mL)1
Load AllocationIndicator Bacteria
(CFU/100 mL)1
SA (Approved or conditionally approved for shellfishing)
Any regulated discharge - including stormwater runoff4 subject to Phase I or II NPDES permits, NPDES wastewater treatment plant discharges7,9, and combined sewer overflows6.
Fecal Coliform ≤ geometric mean, MPN, of 14 organisms per 100 ml nor shall 10% of the samples be ≥28 organisms per 100 ml
Not Applicable
Nonpoint Source Stormwater Runoff4
Not Applicable
Fecal Coliform ≤ geometric mean, MPN, of 14 organisms per 100 ml nor shall 10% of the samples be ≥28 organisms per 100 ml
SA & SB10 (Beaches8 and non-designated shellfish areas)
Any regulated discharge - including stormwater runoff4 subject to Phase I or II NPDES permits, NPDES wastewater treatment plant discharges7,9, and combined sewer overflows6.
Enterococci - geometric mean5 ≤ 35 colonies per 100 ml and single sample ≤ 104 colonies per 100 ml
Not Applicable
Nonpoint Source Stormwater Runoff4
Not Applicable Enterococci -geometric mean5 ≤ 35 colonies per 100 ml and single sample ≤ 104 colonies per 100 ml
SB (Restricted or conditionally restricted for shellfishing
w/depuration)
Any regulated discharge - including stormwater runoff4 subject to Phase I or II NPDES permits, NPDES wastewater treatment plant discharges7,9, and combined sewer overflows6.
Fecal Coliform ≤ median or geometric mean, MPN, of 88 organisms per 100 ml nor shall 10% of the samples be ≥260 organisms per 100 ml
Not Applicable
Nonpoint Source Stormwater Runoff4
Not Applicable
Fecal Coliform ≤ median or geometric mean, MPN, of 88 organisms per 100 ml nor shall 10% of the samples be ≥260 organisms per 100 ml
1 Waste Load Allocation (WLA) and Load Allocation (LA) refer to fecal coliform concentrations unless specified in table. 2 In all samples taken during any 6 month period 3 In 90% of the samples taken in any six month period; 4 The expectation for WLAs and LAs for stormwater discharges is that they will be achieved through the implementation of BMPs and other controls. 5 Geometric mean of the 5 most recent samples is used at bathing beaches. For all other waters and during the non-bathing season the geometric mean of all samples taken within the most recent six months, typically based on a minimum of five samples. 6 Or other applicable water quality standards for CSOs 7 Or shall be consistent with the Waste Water Treatment Plant (WWTP) National Pollutant Discharge Elimination System (NPDES) permit. 8 Massachusetts Department of Public Health regulations (105 CMR Section 445) 9 Seasonal disinfection may be allowed by the Department on a case-by-case basis. 10 Segments designated as CSO have a long term control plan in place that is compatible with water quality goals.

48
Note: this table represents waste load and load allocations based on the 2007 water quality standards. If the bacteria criteria change in the future, MassDEP intends to revise the TMDL by addendum to reflect the revised criteria. Potential Sources of Bacterial Contamination Some insight on potential sources of bacteria is gained using dry or wet weather bacteria concentrations as a benchmark for reductions. Where a segment is identified as having high dry weather concentrations, sources may include permitted discharges, failing septic tanks, illicit sanitary sewers connected to storm drains, and/or leaking sewers. Where elevated levels are observed during wet weather potential sources may include flooded septic systems, surcharging sewers (combined sewer overflows or sanitary sewer overflows), and/or stormwater runoff. In urban areas, sources of elevated bacteria concentrations can include runoff in areas with high populations of domestic animals or pets. In agricultural areas sources may include runoff from farms, poorly managed manure piles or areas where wild animals or birds congregate. Other potential sources include sanitary sewers connected to storm drains that result in flow that is retarded until the storm drain is flushed during wet weather.
7.3 – TMDL Expressed as Daily Load (cfu/Day) Flow in rivers and streams is highly variable, and nearly all of us are familiar with seeing the same river as a raging torrent and at another time as just a trickle. In many areas, seasonal patterns are evident. A common pattern is high flow in the spring when winter snow melts and spring rains swell rivers. Summer time generally is a period of low flows except for the extreme events of heavy rainfall storms up the scale to hurricanes. Across the United States, the US Geological Survey (USGS) and others maintain a network of stream gages that measure these flows on a continuous basis thus providing quantitative values to the qualitative scenes described above. These flow measurements are reported in terms of a volume of water passing the gage in a given time period. Often the reported values are in cubic feet per second. A cubic foot of water is 7.48 gallons, and flows can range from less than a cubic foot per second to many thousands of cubic feet per second depending on the time of year and the size of the river or stream. The size of the river or stream and the amount of water that it usually carries is determined by the area of land it drains (known as a watershed), the type of land in the watershed, and the amount of precipitation that falls on the watershed. A common way that USGS reports flow is the cubic feet per second (cfs) averaged over a day since flow can vary even over the course of a day. In addition to quantity, there is of course a quality aspect to water. Most chemical constituents are measured in terms of weight per volume, generally using the metric system with milligrams (mg) per liter (L) as the units. A milligram is one thousandth of a gram, 28 of which weigh one ounce. A liter is slightly more than a quart, so there are 3.76 L in a gallon. The total amount of material is called mass and is the quantity in a given volume of water. For instance, if a liter of water had 16 milligrams of salt and one evaporated all of the water, the 16 milligrams of salt would remain. A volume of two liters with the same 16 mg/L of salt would yield 32 milligrams of salt upon evaporation of the water. So, the total amount of material in a volume of water is the combination of the amount

49
(volume) of water and the concentration of the substance being assessed. These two characteristics, in compatible units, are multiplied to determine the quantity of the material present. In the case of a river or stream, the total amount of material passing a gaging station in a day is the total volume multiplied by the concentration of the chemical being assessed. This quantity often is referred to as “load”, and if the time frame is a day, the quantity is called the “daily load”. If a year is used as the time frame it is called a “yearly” or “annual” load. Bacteria also can be discussed in terms of concentrations and loads. However, the common way of expressing concentrations of bacteria is in terms of numbers rather than weight (although one could use weight). Bacteria standards for water are written in terms of concentrations, and while the method of determining the concentrations can be by direct count or estimated through the outcome of some reaction, it is numbers that are judged to be in a given volume of water. Once again, the load is determined by the concentration multiplied by the volume of water. As can be seen, changes in concentration and/or changes in flow result in changes in the loads. Also, maximum loads can increase and if flow increases in proportion, the concentration will remain the same. For instance, if the total number of bacteria entering a section of stream doubles, but the flow also doubles, the concentration remains the same. This means that as flow increases, allowable load can increase so that concentration remains constant (or lower if dilution occurs) while continuing to meet the water quality criterion. In its simplest application, this is the concept of the flow duration curve approach. At each given flow, the maximum load that can enter and still meet the concentration criterion is set. If the numbers of bacteria entering are higher than this allowable number, then a reduction is needed. The conditions that result in the largest percent reduction needed, if achieved, will also cause the other overages to be met assuming similar processes are causing the violations. As a practical matter, determining the flow at each sampling point is resource intensive, expensive and generally is not done. Given this, however, some estimates of flow can be derived from USGS gages in the watershed or in nearby similar watersheds if there is no gage in the impaired stream. The pollutant loading that a waterbody can safely assimilate is expressed as either mass-per-time, toxicity or some other appropriate measure (40 CFR § 130.2). Typically, TMDLs are expressed as total maximum daily loads. Expressing stormwater pathogen TMDLs in terms of daily loads is difficult to interpret given the very high numbers of indicator bacteria and the magnitude of the allowable load being dependent on flow conditions and, thereby, varying as flow rates change. For example, a very high load of indicator bacteria is allowable if the volume of water that transports indicator bacteria is also high. Conversely, a relatively low load of indicator bacteria may exceed the water quality standard if flow rates are low. Given the intermittent nature of stormwater related discharges, MassDEP believes it is appropriate to express stormwater-dominated indicator bacteria TMDLs proportional to flow for flows greater than 7Q10. This approach is appropriate for stormwater TMDLs because of the intermittent nature of stormwater discharges. However, the WLAs for continuous discharges are not set based on the receiving water’s proportional flow, but rather, are based on the criteria multiplied by the permitted effluent flow (applying the appropriate conversion factor). Because the water quality standard is also expressed in terms of the concentration of organisms per 100 mL, the acceptable in-stream daily load or TMDL is the product of that flow and the criterion.

50
In recognition that bacteria loads from stormwater are flow dependent, the total TMDL can be calculated as a function of flow, and allocated to different source categories, as shown in the following equation:
TMDL = WQS x QT = WLA + LA + MOS + NB
Where:
WLA = allowable load for point source categories (including piped stormwater) LA = allowable load for nonpoint source categories
QT = stream flow on any given day when >7Q10 MOS = margin of safety NB = natural background conditions WQS = Massachusetts Water Quality Standard criterion
The WQS criteria for bacteria are presented in Table 7.1. The complete version of the 2007 bacteria standards is located at: http://www.mass.gov/dep/service/regulations/314cmr04.pdf 7.3.1 Calculating the TMDL as Daily Loads (cfu/Day) Mass DEP evaluated the list of impaired waterbodies in the Taunton River watershed and determined that all the identified segments are inland river flow dominated and therefore, the appropriate approach for estimating daily load is based on flow and the criterion for bacteria concentration in the river (WQS). This approach is used in the Tauton River TMDL for both fresh waters and tidally influenced portions of the river system. Once the flow is estimated the total maximum daily load of bacteria in numbers per day is derived by multiplying the estimated flow by the criterion for the indicator bacteria (WQS) and by a conversion factor. The actual allowable load of bacteria, in numbers of bacteria per day, varies with flow at or above 7Q10 in each segment as presented in Figure 7-1. This approach sets a target for reducing the loads so that water quality criteria for indicator bacteria are met at all flows equal to or greater than 7Q10. The equation used is: Equation 1:
TMDL (cfu/day) = Flow (cfs) × Bacteria Criterion (cfu/100ml) × 2.45×10⁷ 3ft*day
ml*sec
Figure 7.1 (based on Equation 1), shows the TMDL as the number of indicator bacteria per day as a function of flow by Classification and uses: A, B, SA, and SB.
7.3.2 – Stormwater Contribution Part of the stormwater flow comes from point sources (piped discharges) and is included in the waste load allocation (WLA), and part comes from non-point sources and is included in the load allocation (LA) of the TMDL. The fraction of the runoff load attributed to the waste load allocation is

51
estimated from the fraction of the watershed that has impervious cover because stormwater from impervious cover is more likely to be diverted, collected and conveyed to the receiving water by stormwater collection systems (pipes) than non-impervious areas. Figure 7-1: TMDL by Classification and Uses as a function of flow (TMDL in CFU/Day).

52
For example, based on information from MassGIS and the algorithm within it, the extent of impervious cover in the Salisbury Brook watershed (segment MA62-08) was determined as 30.6% impervious and 69.4% pervious. Thus, 30.6% of the acceptable bacteria load at a given flow is assigned as waste load allocation while 69.4% of the total load represents the load allocation. Therefore, in a segment for which the average daily flow is 10 cfs, the allowable bacteria load for that day and location or segment is 3.087x10¹⁰ E. coli/ day (from Figure 7-1). A flow rate of 10 cfs in Salisbury brook corresponds to a waste load allocation is 9.45x10⁹ bacteria per day1 (i.e., (0.306) x (3.087x1010bacteria/day) and the load allocation is 2.14x10¹⁰ bacteria per day (i.e., (0.694) x (3.087x1010 bacteria/day). Also as previously indicated, the allowable stormwater load for bacteria varies with receiving water flow. In order to calculate the allowable daily load, flow must be taken into account. To estimate the frequency of flow for a given location or segment, flows at a gage in the watershed or nearby watershed can be prorated based on drainage area. The USGS also has a web-based application at water.usgs.gov/osw/streamstats/ungaged.html for Massachusetts that incorporates flow estimations that are unmeasured with gages. The bacteria TMDL allocation between WLAs and LAs by segment and at selected flows is developed and presented in Table 7-3 where:
WLA: (Impervious area of segment) x (Allowable Load @ a specific flow) LA: (Pervious area of segment) x (Allowable Load @ a specific flow)
WLAs and LAs are identified for all known source categories including both dry and wet weather sources for Class A and Class B segments within the watershed. Illicit dry weather discharges are illegal and therefore are not given a WLA. POTW discharges, which discharge continuously in both dry and wet weather, are given WLAs that do not vary with the receiving water flow, but rather, are based on meeting WQS at the end-of-pipe.
7.4 - Application of the TMDL To Unimpaired or Currently Unassessed Segments This TMDL applies to the 20 pathogen impaired segments of the Taunton River Watershed that are currently listed on the CWA § 303(d) list of impaired waters. MassDEP recommends however, that the information contained in this TMDL guide management activities for all other waters throughout
1 Note that the example waste load allocation includes the contribution from any point source stormwater discharges and CSO discharges. For discussion of the WLAs for POTWs, see Section 7.4.3. For the purposes of this TMDL the stormwater contribution is estimated from the amount of flow contributed from impervious surfaces.

53
Table 7-3. WLA and LA TMDL Allocations by Segment and Selected Flow in E. coli or Fecal Coliform CFU/Day.

54
the watershed to help maintain and protect existing water quality. For these non-impaired waters, Massachusetts is proposing “pollution prevention TMDLs” consistent with CWA § 303(d) (3)1. The analyses conducted for the pathogen-impaired segments in this TMDL would apply to the non-impaired segments, since the sources and their characteristics are equivalent. The concentration waste load and/or load allocation for each source and designated use would be the same as specified in this TMDL. Therefore, the pollution prevention TMDLs would have identical waste load and load allocations based on the sources present and the designated use of the water body segment (see Table 7.1). Any discharge would need to be consistent with the applicable waste load allocations, as well as the antidegradation provision of the Massachusetts Water Quality Standards (Section 4.04 in MassDEP 2007). Any new construction that complies with state stormwater standards and permits is presumed to comply with antidegradation requirements of the state water quality standards. This Taunton River Watershed TMDL may, in appropriate circumstances, also apply to segments that are listed for pathogen impairment in subsequent Massachusetts CWA § 303(d) Integrated List of Waters. For such segments, this TMDL may apply if, after listing the waters for pathogen impairment and taking into account all relevant comments submitted on the CWA § 303(d) list, the Commonwealth determines with EPA approval of the CWA § 303(d) list that this TMDL should apply to future pathogen impaired segments.
7.5 – Margin of Safety This section addresses the incorporation of a Margin of Safety (MOS) in the TMDL analysis. The MOS accounts for any uncertainty or lack of knowledge concerning the relationship between pollutant loading and water quality. The MOS can either be implicit (i.e., incorporated into the TMDL analysis through conservative assumptions) or explicit (i.e., expressed in the TMDL as a portion of the loadings). This TMDL uses an implicit MOS, through inclusion of several conservative assumptions. First, the TMDL does not account for mixing in the receiving waters and assumes that zero dilution is available. Realistically, influent water will mix with the receiving water and become diluted lowering instream bacteria concentrations, provided that the receiving water concentration 1 CWA Section 303(d)3: For the specific purpose of developing information, each State shall identify all waters within its boundaries which it has not identified under paragraph (1)(A) and (1)(B) of this subsection and estimate for such waters the total maximum daily load with seasonal variations and margins of safety, for those pollutants which the Administrator identifies under section 304(a)(2) as suitable for such calculation and for thermal discharges, at a level that would assure protection and propagation of a balanced indigenous population of fish, shellfish and wildlife.

55
does not exceed the TMDL concentration standard. Second, the goal of attaining standards at the point of discharge does not account for losses due to die-off and settling of indicator bacteria that are known to occur. Third, the TMDL assumes that all the runoff from impervious areas throughout the contributing watershed actually makes it to the impaired segment, which is generally not the case especially in large watersheds where impervious surfaces are not continually connected.
7.6 – Seasonal Variability
In addition to a Margin of Safety, TMDLs must also account for seasonal variability. Pathogen sources to Taunton River waters arise from a mixture of continuous and wet-weather driven sources, and there may be no single critical condition that is protective for all other conditions. This TMDL has set WLAs and LAs for all known and suspected source categories equal to the Massachusetts WQS independent of seasonal and climatic conditions. This will ensure the attainment of water quality standards regardless of seasonal and climatic conditions. Controls that are necessary will be in place throughout the year, protecting water quality at all times. However, for discharges that do not affect shellfish beds, intakes for water supplies and where primary contact recreation does not take place, seasonal disinfection is permitted for NPDES point source discharges.

56
8.0 Implementation Plan Setting and achieving TMDLs should be an iterative process, with realistic goals over a reasonable timeframe and adjusted as warranted based on ongoing monitoring. The concentrations set out in the TMDL represent reductions that will require substantial time and financial commitment to be attained. A comprehensive control strategy is needed to address the numerous and diverse sources of pathogens in the Taunton River watershed. Elevated dry weather bacteria concentrations could be the result of illicit sewer connections, leaking sewer pipes, sanitary sewer overflows, or failing septic systems. These sources are illegal and must be eliminated, so first priority overall should be given to bacteria source tracking activities to investigate potential illicit bacteria sources in segments impaired by bacteria during dry weather. Tracking and remediation of dry weather bacteria sources is usually more straightforward and successful than tracking and eliminating wet weather sources. If illicit bacteria sources are found and eliminated it should result in a dramatic reduction of bacteria concentration in the segment in both dry and wet weather. A comprehensive program is needed to ensure illicit sources are identified and that appropriate actions will be taken to eliminate them. Guidance can be found in the following references: A Center for Watershed Protection Manual entitled: Illicit Discharge Detection and Elimination: A Guidance Manual for Program Development and Technical Assessments which can be found at: http://www.cwp.org/Resource_Library/Controlling_Runoff_and_Discharges/idde.htm Practical guidance for municipalities is provided in a New England Interstate Water Pollution Control Commission publication entitled ‘Illicit Discharge Detection and Elimination Manual, A Handbook for Municipalities’ available at: http://www.neiwpcc.org/iddemanual.asp. Stormwater runoff represents another major source of pathogens in the Taunton River watershed, and the current level of control is inadequate for standards to be attained in several segments. Improving stormwater runoff quality is essential for restoring water quality and recreational uses. It may not be cost effective or even possible to track and identify all wet weather sources of bacteria, therefore, segments impaired during wet weather should be evaluated for stormwater BMP implementation opportunities starting with intensive application of less costly non-structural practices (such as street sweeping, and/or managerial strategies using local regulatory controls). Periodic monitoring to evaluate the success of these practices should be performed and, depending on the degree of success of the non-structural stormwater BMPs, structural controls may need to be identified and implemented to meet water quality standards. Structural stormwater BMP implementation may require additional study to identify cost efficient and effective technology. This adaptive management approach to controlling stormwater contamination is the most practical and cost effective strategy to reduce pathogen loadings as well as loadings of other stormwater pollutants (e.g., nutrients and sediments) contributing to use impairment in the Taunton River Watershed. For these reasons, a basin-wide implementation strategy is recommended. The strategy includes a mandatory program for implementing stormwater BMPs and eliminating illicit sources. The “Mitigation Measures to Address Pathogen Pollution in Surface Water: A TMDL Implementation Guidance Manual for Massachusetts” was developed to support implementation of pathogen

57
TMDLs. TMDL implementation-related tasks are shown in Table 8-1. The MassDEP working with EPA and other team partners shall make every reasonable effort to assure implementation of this TMDL. These stakeholders can provide valuable assistance in defining hot spots and sources of pathogen contamination as well as the implementation of mitigation or preventative measures.
8.1 Summary of Activities within the Taunton River Watershed There are two not-for-profit active stewards of the Taunton River: the Taunton River Watershed Alliance and the Taunton River Stewardship Program. “The Taunton River Watershed Alliance (TRWA) is a non-profit alliance of concerned individuals, businesses, and organizations dedicated to protecting and restoring the Taunton River Watershed – its tributaries, wetlands, floodplains, river corridors and wildlife. TRWA conducts water quality monitoring at sites along the Taunton River and its tributaries with volunteers playing a critical role in water quality sampling” (MassDEP 2005). TRWA is also involved in community education, land acquisition, and shoreline survey efforts to restore and protect the Taunton River’s resources (TRWA 2004). The Taunton River Stewardship Program is dedicated to promoting the preservation of the upper Taunton River corridor. The efforts of the Stewardship Program and their partners have protected 695 acres in the watershed (MassDEP 2005). Data supporting this TMDL indicate that indicator bacteria enter the Taunton River watershed from a number of contributing sources, under a variety of conditions. Activities that are currently ongoing and/or planned to ensure that the TMDL can be implemented include and are summarized in the following subsections. The “Mitigation Measures to Address Pathogen Pollution in Surface Water: A TMDL Implementation Guidance Manual for Massachusetts” provides additional details on the implementation of pathogen control measures summarized below as well as additional measures not provided herein, such as by-law, ordinances and public outreach and education.
8.2 Illicit Sewer Connections, Failing Infrastructure and CSOs Elimination of illicit sewer connections, repairing failing infrastructure, and controlling impacts associated with CSOs are of extreme importance. A number of municipalities within the Taunton River watershed have implemented measures to address sewage discharges and CSO events. The City of Taunton The Taunton Wastewater Treatment Facility collects and treats municipal wastewater from a portion of the surrounding municipal area. The Facility provides advanced treatment and one stage ammonia-nitrogen removal. Portions of the collection system are over 100 years old, and are subject to large amounts of inflow and infiltration. During springtime high ground water conditions, flows to the plant may reach 22.4 mgd, from a dry weather average flow of 6.5 mgd (2004 M&E Sewer System Evaluation Survey). The treatment facility is currently permitted to discharge 8.5 mgd. At least 300 manhole covers in the system had holes drilled in them so that they would act as catch basins during storm events, and an additional 33 manholes have combined drainage and sanitary pipelines within the same system (August 28, 2006 letter from Veolia Water).

58
Table 8-1. Tasks.
Task Organization Writing TMDL MassDEP
TMDL public meeting MassDEP
Response to public comment MassDEP
Organization, contacts with volunteer groups MassDEP/ Taunton River Watershed Alliance TRWA)
Development of comprehensive stormwater management programs including identification and implementation of BMPs
Taunton River Basin Communities
Illicit discharge detection and elimination Taunton River Basin Communities
Leaking sewer pipes and sanitary sewer overflows
Taunton River Basin Communities
CSO management Taunton River Basin Communities
Inspection and upgrade of on-site sewage disposal systems as needed
Homeowners and Taunton River Basin Communities (Boards of Health)
Organize implementation; work with stakeholders and local officials to identify remedial measures and potential funding sources
MassDEP and Taunton River Basin Communities, TRWA
Organize and implement education and outreach program
MassDEP and Taunton River Basin Communities, TRWA
Write grant and loan funding proposals Taunton River Basin Communities and Planning Agencies with guidance from MassDEP, TRWA
Inclusion of TMDL recommendations in Executive Office of Energy and Environmental Affairs (EEA) Watershed Action Plan
EEA
Surface Water Monitoring MassDEP, TRWA
Provide periodic status reports on implementation of remedial activities
Taunton River Basin Communities

59
As of the date of this report there is a significant effort underway to eliminate and combine 64 combined manholes into a single manhole, which under normal conditions would be a separated sewer, except in heavy rainfalls. An EPA Enforcement Order, dated 9/2008, requires the City of Taunton to identify all combination manholes and create a schedule to completely separate the combined flows in order to control unauthorized discharges of sanitary sewage to storm drains, or stormwater to the sanitary sewers. The corrective action plan includes monitoring of combination manholes, TV camera inspections, dye- testing, maintenance of records for all overflow events, and a corrective action implementation schedule. Also, the Enforcement Order requires dye- testing and inspection of the entire stormwater drainage system for correction of any sewage inputs or illicit connections, as well as the removal of illicit inflow/ infiltration inputs (e.g., sump pumps and roof leaders) into the system. There is a single CSO in the City of Taunton, located on West Water Street (Outfall 004). The City of Taunton has been subject to several enforcement actions for high flow related effluent violations, including EPA administrative orders No. 94-31 issued in 1994, No. 96-04 issued in 1996, No. 08-042 issued in 2008, and a MADEP order issued in 2005. RIDEM‘s Shellfish Program staff are notified when overflows occur from the West Water Street outfall. The overflows are associated with heavy rainfall events and are due primarily to infiltration and inflow (I/I) into the system. Infiltration is groundwater that enters the collection system through physical defects such as cracked pipes, or deteriorated joints. Inflow is extraneous flow entering the collection system through point sources such as roof leaders, yard and area drains, sump pumps, manhole covers, tide gates, and cross connections from stormwater systems. Significant I/I in a collection system may displace sanitary flow, reducing the capacity and the efficiency of the treatment works, causing bypasses to secondary treatment and overflows into the Taunton River. The City is under certain mandates and timelines to resolve I/I issues, such as removing unauthorized sump pumps and roof leader drains, fixing failing infrastructure to prevent infiltration, and repairing cross connections going between sewer connections and stormwater conveyances. The long- term CSO Plan for Taunton is total elimination of flows from this CSO by October 2013. The City of Fall River The City of Fall River presently operates a combined wastewater/stormwater collection and treatment system, transporting both sanitary and stormwater flows from approximately 75% of the sewered areas of the City. These facilities serve about 90,000 residents and have the capacity to collect, transport and treat (secondary) dry-weather daily flow of 50-million gallons per day. The present peak hydraulic capacity for combined dry and wet-weather flow is 106-million gallons per day (primary, chlorination, dechlorination). The collection system consists of 179-miles of sewer pipeline, 13-pumping stations, 4,500 manholes, 5,000 catch basins and 19 Combined Sewer Overflow (CSO) outfalls. The system until recently has historically discharged approximately 1.5 billion gallons per year of untreated and/or partially treated sewage to Mt. Hope Bay (Burns 2001). Water quality studies conducted by the U.S. Food and Drug Administration (FDA) in 1987 and Applied Science Associates (ASA) Inc. confirmed in 1990 that CSO's represent the largest source of

60
sewage contamination in Mount Hope Bay - potentially masking all other inputs of fecal contaminants. During one wet weather event monitored by the FDA, CSO's accounted for 96% of total fecal coliform loading to Mount Hope Bay (Dixon et al. 1990). As a result of a Federal Court Order, the City has prepared a Long Term CSO Control Plan (LTCP) and Facilities Management Plan which, when completed, would capture 48.3 million gallons of combined sewage from 19 CSO’s, thereby reducing CSO discharges to less than four untreated discharge events per year. The CSO Abatement Program includes expansion of the Regional Wastewater Treatment Plant primary treatment and disinfection capacity to 106-million gallons per day (completed), and construction of an 85-million gallon rock tunnel with surface piping and partial sewer separation of selected CSO areas along the waterfront (completed). The 20 foot diameter storage tunnel and nine connecting shafts are, at the time of this report, online and operational and receiving flow from six (6) of the combined sewer overflows located in the southern portion of the City. Upgrades are currently underway at the Cove and Central Street Pump Stations. At present, the Central Street Pump Station is the largest pump station, which conveys water through the Main Interceptor South (60 inch diameter) to the WWTF. When the Central Street Pump Station fails, it overflows to the City Pier CSO, which currently discharges (untreated) to the Taunton River. Beginning in March of 2009, the City began a yearlong evaluation and assessment of the operation of the South /Central Tunnel System and the Cove Street CSO Screening and Disinfection Facility. This information, along with the monitoring program described below, will provide the data needed to develop the scope of work needed for construction of the remaining screening and disinfection facilities.
It is difficult to quantitatively assess water quality improvements that will be realized as a result of the recently completed LTCP upgrades. However, it is anticipated that water quality improvements are likely to be significant. Ongoing efforts under the Long Term Control Plan (LTCP) for the City (under the Court Order) are to conduct an extensive water quality monitoring study during 2010- 2011 in Mount Hope Bay adjacent to the City of Fall River, to determine the level of improvements that have occurred from the construction activity thus far, as well as be a guide for modifying the type and level of future upgrade and improvement efforts in the LTCP (specifically, the Phase IIB.2 North End CSOs) that will be necessary in the future. Planned efforts (2010- 2016) currently underway include: (1) Upgrading the capacity at the Central Street Pump Station to 30 mgd, to better control flow to the two overflow chambers (part of the City Pier CSO into the Taunton River); (2) North End CSO Rehabilitation and Separation Project involving a feasibility study of alternatives, leading to construction of screening and disinfection facilities of the CSOs in the Northern part of the City (Alton Street, Cove Street, President Avenue, City Pier, and Canal Street); (3) Increasing resources and the effectiveness of the Sewer Department in performing continuous collection system cleaning and inspections (including maximization of system storage and conveyance capacity), and (4) carrying out the components of the other nine minimum controls, including street sweeping and catch basin cleaning. These efforts along with the anticipated construction of disinfection facilities will eliminate all untreated CSO discharges from the central and northern portions of the City. Sewer Separation work during the 2015 - 2018 timeframe will continue in the central and northern parts of the City, while the Tunnel storage capacity and further separation work during the same time

61
period in the Southern portion of the City will eliminate CSO problems (except possibly intermittent flows in a greater than 3 month storm) from six past CSO flows in the Southern portions of the City (Mt. Hope Ave.; Charles St.; Birch St.; Riverview St.; Middle St.; William St). Ultimately under the LTCP, all CSOs will be controlled or treated within the three month storm (1.72 inches). With past and future anticipated infrastructure improvement efforts at the Taunton, Brockton, and Fall River WWTPs, including controls on most all CSOs, public concern about bacteria pollution loadings coming from the Taunton Basin into Mount Hope Bay should be much alleviated in the future. In particular, recent years have seen concerns raised by State of Rhode Island RIDEM officials, as well as various groups and citizens in that State, about the bacteria pollution effects from the Taunton River on the RI portions of Mount Hope Bay. The technological and infrastructure improvements that have been outlined within this report at these three major WWTPs, including substantial progress in controlling CSOs, should substantially reduce bacteria related pollution in the Taunton River mainstem, and thereby reduce the bacteria pollution loadings going into the downstream areas in both the MA and RI portions of Mount Hope Bay. Additionally, with respect to background levels of instream bacteria pollution in the Taunton mainstem affecting downstream MA and RI water bodies in Mount Hope Bay, margin of safety factors lowering pollution loadings should be considered such as: (1) time and travel/ distance from various WWTP and CSO discharge points to more distant, downstream water bodies, (2) natural dilution; and (3) decay of bacteria organisms in marine waters. These processes, plus the WWTP infrastructure improvements are consistent with the principal goal of this TMDL: that waters in the segments of the Taunton River mainstem (MA62-02, MA62-03, MA62-04), as well as the adjoining MA and RI Mount Hope Bay segments downstream, will meet their Class SB Water Quality Standard Targets at all times. EPA’s Phase II rule specifies an MS4 community must develop, implement, and enforce a stormwater management program that is designed to reduce the discharge of pollutants to the maximum extent practicable, protect water quality, and satisfy the applicable water quality requirements of the Clean Water Act. Illicit discharge detection and elimination (IDDE) is one of the six minimum control measures that must be included in the stormwater management program. The other control measures are:
• Public education and outreach on stormwater impacts • Public involvement and participation • Construction site stormwater runoff control • Post-construction stormwater management in new development and redevelopment • Pollution prevention and good housekeeping for municipal operations
As part of their applications for Phase II permit coverage, MS4 communities must identify the best management practices they will use to comply with each of these six minimum control measures and the measurable goals they have set for each measure. In general, a comprehensive IDDE Program must contain the following four elements:

62
1) Develop (if not already completed) a storm sewer system map showing the location of all outfalls, and the names and location of all waters of the United States that receive discharges from those outfalls. 2) Develop and promulgate municipal regulations that require the municipality to comply with Phase II regulations including prohibition of illicit discharges and appropriate enforcement mechanisms. 3) Develop and implement a plan to detect and address illicit discharges, including illegal dumping, to the system. EPA recommends that the plan include the following four components: locating priority areas; tracing the source of an illicit discharge; removing the source of an illicit discharge; and program evaluation and assessment. 4) Inform public employees, businesses, and the general public of the hazards associated with illegal discharges and improper disposal of waste. IDDE outreach can be integrated into the broader stormwater outreach program for the community. Fulfilling the outreach requirement for IDDE helps the MS4 community to comply with this mandatory element of the stormwater program.
Communities that are not covered under the Phase II rule (i.e., not designated as MS4 communities) are encouraged to implement a program for detecting and eliminating sewage discharges to storm sewer systems, including illicit sewer connections. Implementation of the Phase II rule (USEPA 2000), whether voluntarily or mandated will help communities achieve bacteria TMDLs. Guidance for implementing an illicit discharge detection and elimination program is available from several documents. EPA New England developed a specific plan for the Lower Charles River to identify and eliminate illicit discharges (both dry and wet weather) to their separate storm sewer systems (USEPA 2004b). Although originally prepared for the Charles River watershed, it may be applicable to other watersheds throughout the Commonwealth. However it represents just one of the approved methodologies available. More generic guidance is provided in a document prepared for EPA by the Center for Watershed Protection and the University of Alabama, entitled ‘Illicit Discharge Detection and Elimination: A Guidance Manual for Program Development and Technical Assessments’, which can be downloaded from: http://www.cwp.org/Resource_Library/Controlling_Runoff_and_Discharges/idde.htm In addition, practical guidance for municipalities is provided in a New England Interstate Water Pollution Control Commission publication entitled, ‘Illicit Discharge Detection and Elimination Manual’, A Handbook for Municipalities available at: http://www.neiwpcc.org/iddemanual.asp. Implementation of the protocol outlined in these guidance documents satisfies the Illicit Discharge Detection and Elimination requirement of the NPDES program. A list of the municipalities in Massachusetts regulated by the Phase II Rule, as well as the Notices of Intent for each municipality can be viewed at: http://www.epa.gov/region01/npdes/stormwater/ma.html.

63
8.3 Stormwater Runoff Stormwater runoff can be categorized in two forms 1) point source discharges and 2) non-point source discharges (includes sheet flow or direct runoff). Many point source stormwater discharges are regulated under the NPDES Phase I and Phase II permitting programs when discharged to any water body in the United States. Municipalities that operate regulated municipal separate storm sewer systems (MS4s) must develop and implement a stormwater management plan (SWMP) which must employ, and set measurable goals for the following six minimum control measures:
1. public education and outreach particularly on the proper disposal of pet waste, 2. public participation/involvement, 3. illicit discharge detection and elimination, 4. construction site runoff control, 5. post construction runoff control, and 6. pollution prevention/good housekeeping.
Portions of towns in this watershed are classified as Urban Areas by the United States Census Bureau and are subject to the Stormwater Phase II Final Rule. This rule requires the development and implementation of an illicit discharge detection and elimination plan. The NPDES permit does not, however, establish numeric effluent limitations for stormwater discharges. Maximum extent practicable (MEP) is the statutory standard that establishes the level of pollutant reductions that regulated municipalities must achieve. The MEP standard is a narrative effluent limitation that is satisfied through implementation of SWMPs and achievement of measurable goals. Non-point source discharges are generally characterized as sheet flow runoff and are not categorically regulated under the NPDES program and can be difficult to manage. However, some of the same principles for mitigating point source impacts may be applicable. Individual municipalities not regulated under the Phase I or II should implement the exact same six minimum control measures minimizing stormwater contamination. In an effort to better manage community stormwater, municipal implementation of the EPA Phase I and II programs is being undertaken. Communities in the Taunton watershed are required to submit stormwater management plans and annual progress reports on their activities to prevent and control polluted runoff from their municipal drainage systems. Many watershed communities are in the process of conducting Illicit Discharge Detection and Elimination programs and have mapped the location of outfalls and prioritized areas for potential sources of illicit discharges. Following is a brief review of the various communities in the watershed and their progress. Further detailed and up-to-date information on these communities can be found on the EPA Stormwater Permit website at http://www.epa.gov/region01/npdes/stormwater/2003-permit-archives.html.

64
Abington – The Town of Abington has presented its Draft Comprehensive Stormwater Management Plan to the public. Educational brochures are distributed to target audiences and are available at various town offices. Approximately 98% of the Town’s drainage system has been mapped and funding is being sought for further development of GIS mapping of the Town. An Illicit Discharge Detection and Elimination Program Plan has been completed, with areas of the Town prioritized for investigation of potential sources of illicit discharges. The Town has been investigating infiltration/ inflow into its sewer system, and through this process has eliminated any illegal connections that have been found. Catch basin cleaning and street sweeping take place on an annual basis. Avon - Street sweeping and catch basin cleaning occur on an annual basis. A number of roadways in the Town of Avon have been reconstructed, resulting in new catch basins being installed. A handwritten map of the stormwater system is in place and GIS mapping is currently in progress. An outside engineer has conducted an assessment of wastewater discharges, with a long term plan to address future wastewater flows scheduled to be developed. Bridgewater – A construction bylaw is in the process of being developed by the Town of Bridgewater, and an illicit discharge bylaw has been adopted. Mapping of the stormwater outfalls is in progress. Catch basin cleaning is conducted on an annual basis. Brockton – The City of Brockton has purchased catch basin stencils which have been placed on 100 catch basins. A pooper-scooper ordinance was passed and the City has been taking actions to enforce it. Stormwater outfalls have been mapped with a prioritized list of outfalls developed based on dry weather screening. Screening and some monitoring was scheduled for 2007. As of the end of 2008, an illicit connection prevention ordinance with an accompanying guidance manual had been developed and submitted to the City Council for approval. The Highway Department has developed a list of illegal dumping areas and has instituted a protocol for reporting illegal dumping. Street sweeping occurs on an annual basis. East Bridgewater – A comprehensive Stormwater Management Program has been developed by the Town of East Bridgewater. The Town has been focusing on GIS mapping of the drainage system and receiving waters. Outfall mapping and water quality screening/testing have been conducted in the North River drainage basin. Model bylaws have been reviewed and areas for revision will be investigated. Semi-annual street sweeping and annual catch basin cleaning are conducted. Stenciling of catch basins in critical areas has begun and will continue. Easton – The Town of Easton has displayed educational material in a poster format and has prepared handouts which are available for distribution. All outfalls have been inspected and the information has been compiled into a report format. The existing storm drainage map has been revised to reflect changes as a result of newly constructed subdivisions. Erosion and sediment control requirements have been written into the stormwater management bylaw. In 2008, a booklet was produced which showed locations, (in GIS), and photographs of nine strategic locations recommended for future dry weather screening. A stream monitoring program has been instituted to establish base line conditions during dry weather. Ongoing street sweeping and catch basin cleaning are mentioned in the 2004 report.

65
Foxborough – The Town of Foxborough has formed a local stormwater committee. A stormwater bylaw was drafted and adopted at town meeting. This bylaw contains a section which prohibits illicit connections into Town stormwater conveyances. Mapping of the outfalls and the existing drainage system is continuing. All catch basins are cleaned on an annual basis and all new catch basins installed by the Foxborough Highway Department will include hoods, which have been successful in improving water quality. Street sweeping occurs annually with the downtown area swept on a monthly basis. The Town will contract out some street sweeping to ensure coverage throughout its jurisdiction. Halifax – Aerial photography has been completed, which will serve as the basis for GIS mapping of outfalls and catch basins. The Town of Halifax is reviewing applicable local regulations with regard to stormwater and illicit connections, and is consolidating them into a final draft report document. Street sweeping is conducted on a semiannual basis and catch basin cleaning is done annually. Lakeville – Informational meetings were held with Long Pond landowners regarding wastewater solutions, and this led the town meeting to consider and approve a $150,000 SRF loan for wastewater control planning purposes. An illicit discharge bylaw was developed and adopted at town meeting. Existing town bylaws and planning board rules and regulations were reviewed to determine the extent to which the Town of Lakeville would be able to regulate stormwater runoff. A bylaw dealing with construction site runoff activities was passed at town meeting. Mansfield – A comprehensive general bylaw that addresses illicit discharges to the municipal storm drain system as well as construction runoff and post construction maintenance was developed by the Town of Mansfield, and passed at town meeting in April, 2006. An educational pamphlet was developed and is being distributed. Stormwater information is published in the town’s annual report and on town’s web site. A stormwater map using GIS was created showing a total of 2,706 catch basins, 1,551 manholes and 389 outfalls. Many of these have had follow up inspections by the Town. A follow up dry weather screening effort commenced during 2007-8, with 11 outfalls tested and examined with TV cameras. In 2008, the street sweeping plan for the Town was modified and improved, and a catch basin cleaning schedule commenced, which was scheduled to include 25% of total catch basins in Town to be cleaned each year, aided with the service of a new vactor cleaning truck purchased by the Town. Middleborough – A stormwater management committee has been established by the Town. Although it has not been meeting frequently, it is expected that when the renewed permit is issued in 2010, the committee will be upgraded as a citizen’s advisory stormwater committee, which will meet more frequently. System-wide stormwater conveyance and outfall mapping is ongoing. As of the end of 2008, the mapping inventory of stormwater conveyances, outfalls, and catch basins had been completed for 297 out of a total of 380 streets in Town. Wet weather samples were taken at 10 outfalls in 2004. Spot outfall sampling has continued during the following years, 2005-8. Catch basin cleaning occurs two to three times a year and street sweeping is conducted twice a year.

66
Norton – The Town of Norton has formed a stormwater committee. An illicit discharge bylaw has been developed and was adopted at town meeting in 2006. Mapping of the stormwater conveyance and outfall system was completed in 2008. As of 2009, an illicit connection detection implementation plan had been developed and is being reviewed by appropriate Departments in Town. Stormwater information is provided on the town’s web site and stormwater tips are aired on the local cable channel. A stormwater hotline has been established through the Norton Highway Department. A bylaw for construction runoff is under development and review. A procedure for site review and an inspection protocol are also under development and review. Through an Eagle Scout project, 48 catch basins in the Canoe River watershed have been stenciled. Raynham – As of 2008, all the MS4 conveyances and outfalls had been mapped on GIS. All of the storm drains located in the Town of Raynham have been stenciled. Illicit discharge, erosion, and sediment control bylaws have been drafted and will be presented at town meeting. During 2008, no illicit connections to stormwater conveyances were found. Street sweeping and catch basin cleaning occur on an annual basis. Starting in 2008, dry weather screening routinely occurs during catch basin cleaning activities. Somerset – Stormwater messages are aired on local cable television, with similar information provided on the town web site. Storm drain stenciling priorities have been determined, with stenciling efforts actually under way. Base mapping has been completed, and GPS data collection of storm drainage system and outfalls has begun. The Town’s 2009 annual report to EPA indicated that development of an illicit connection control bylaw for the Town was being done through SRPEDD, and that a public hearing to adopt it has been planned to occur during calendar 2010. Street sweeping and catch basin cleaning occurs on an annual basis. Areas near the Lee and Taunton Rivers are targeted for street sweeping on a bi-annual basis. Taunton – Stormwater related information is posted on the city’s web site. The city has identified 25 illicit cross connections, which were removed under a Phase I Sewer Rehabilitation Project. Twelve cross-connected catch basins were separated from the sanitary sewer system. Approximately 600 homes have been surveyed to identify any possible sanitary discharges to the storm drains, and TV inspections of the sewer lines have been undertaken to identify any areas of inflow/ infiltration. Homes along Sabbatia Lake will be tied into the sewer system. A resident hotline is operated by the Taunton Water and Sewer Department. Pooper scooper and illicit connection ordinances were passed. GIS mapping of the storm and sewer systems has been completed and a prioritized list of outfalls was developed for future dry weather screening. Field investigations of these outfalls have begun. The 2009 annual report to EPA describes a program effort, begun in 2004, involving the City of Taunton Public Works Department, the Taunton River Watershed Alliance, and Veolia Water Inc., to sample and report high fecal coliform counts throughout the City area. An overall water quality report is being prepared, which will discuss principal bacteria results determined from the 2004-8 data. The report with its results will be presented to the Municipal Council in 2010. As of 2007-8, a formalized street sweeping and catch basin cleaning program had been put together and presented to the Public Works Department, which should result in more productive and efficient future efforts in these regards.

67
West Bridgewater – System wide and outfall mapping is 80% complete. All of West Bridgewater’s outfalls have been inspected and screened, with one illicit discharge found and removed. An illicit discharge bylaw has been adopted. Post development stormwater management, erosion and sediment control regulations have also been adopted. Catch basins are cleaned annually and streets are swept two to three times during the year. Whitman – Several ordinances have been passed by the Town of Whitman which include the following: pooper scooper- pet waste cleanup procedures, illicit connection, and long term maintenance of Best Management Practices put into place by the Town. As of 2009, there had been at least several airings about illicit connections on the local cable TV station. In 2008, an Inflow/ Infiltration (I/I) SRF funded project commenced, which investigated illicit sewer cross connections into storm lines via TV camera work in over 33,000 feet of sewer system lines in the Town. A construction site erosion and sediment control ordinance was drafted for review by Town Council and was approved at Town meeting. Outfall mapping has been completed, and a storm drain and sewer GIS map has been created. All outfalls were screened during dry weather and any outfalls that show signs of illicit connections were investigated. The Whitman DPW has established a resident hotline to report problems. Street sweeping takes place twice a year, with the downtown area being swept on a more frequent basis. All catch basins are cleaned over a two-year period. Wrentham – All outfalls located in the urbanized areas of Wrentham have been mapped. A drainage system data base was configured and linked to creation of a drainage map of the entire area. Fifteen outfalls, which discharge to a number of different water bodies, were sampled during two different wet weather events. The Town has an active educational program with the following in place: Non point source pollution related posters are displayed in all school and town buildings, stormwater messages are aired on the local cable access channel, and stormwater links with regularly updated information are available on town web site. A stormwater brochure was developed to target home owners and their role in preventing stormwater pollution. Several bylaws have been drafted and were presented at town meeting for acceptance. These included: a general illicit connection bylaw, construction site runoff bylaw, and post construction site bylaw. These were initially rejected at two Town meetings in 2007-8, but were redrafted and adopted at a Town meeting in March, 2009. These adoptions included the illicit connection part, which is to be formally regulated and managed by the local Board of Health. Street sweeping and catch basin cleaning occur at least annually. In addition to the above, the Massachusetts Department of Environmental Protection's proposed new "Stormwater Management Regulations," establish a statewide general permit program aimed at controlling the discharge of stormwater runoff from certain privately-owned sites containing large impervious surfaces.
The proposed regulations would require private owners of land containing five or more acres of impervious surfaces to apply for and obtain coverage under a general permit; implement nonstructural best management practices (BMPs) for managing stormwater; install low impact development (LID) techniques and structural stormwater BMPs at sites undergoing development or redevelopment; and submit annual compliance certifications to the Department.

68
Where the Department has determined that stormwater runoff is causing or contributing to violations of the Massachusetts Surface Water Quality Standards, the proposed regulations would allow MassDEP to impose the same requirements on certain private owners of land with less than five acres of impervious surfaces and require the owners of such land to design and implement the LID techniques and stormwater BMPs needed to address these violations.
8.4 Failing Septic Systems Septic system bacteria contributions to the Taunton River watershed may be reduced in the future through septic system maintenance and/or replacement. Additionally, the implementation of Title 5, which requires inspection of private sewage disposal systems before property ownership may be transferred, building expansions, or changes in use of properties, will aid in the discovery of poorly operating or failing systems. Because systems which fail must be repaired or upgraded, it is expected that the bacteria load from septic systems will be significantly reduced in the future. Regulatory and educational materials for septic system installation, maintenance and alternative technologies are provided by the MassDEP on the worldwide web at http://www.mass.gov/dep/water/wastewat.htm. In addition, communities should review internal data and information identifying specific areas where failures are observed and work with homeowners to upgrade their systems. Under the Title 5 Program, three programs have been developed to assist homeowners with wastewater management problems. The Homeowner Septic Loan Program provides low interest loans to homeowners to upgrade systems that will not pass Title 5 inspections. The Comprehensive Community Septic Management Program provides betterment loans to communities to target known or suspected failures or to develop a community-wide management plan. The third option allows homeowners to claim tax credits to septic upgrades. In the Taunton Watershed, the communities of Attleboro, Avon, Bridgewater, Carver, Dartmouth, Dighton, East Bridgewater, Easton, Foxborough, Halifax, Hanson, Holbrook, Kingston, Lakeville, Middleborough, Norton, Pembroke, Plymouth, Plympton, Sharon, Stoughton, Taunton, West Bridgewater, Weymouth, Whitman and Wrentham have participated in the Comprehensive Community Septic Management Program. Working with the Massachusetts Water Pollution Abatement Trust, MassDEP administers a revolving fund known as the Community Septic Management Program. This loan program offers three options from which a local government can provide low interest loans to eligible homeowners for septic system improvement. Currently there are a number of municipalities in the Taunton River Watershed participating in the Community Septic Management Program. They are Attleboro, Avon, Bridgewater, Carver, Dartmouth, Dighton, East Bridgewater, Easton, Foxborough, Halifax, Hanson, Holbrook, Kingston, Lakeville, Middleborough, Norton, Pembroke, Plymouth, Plympton, Sharon, Stoughton, Taunton, West Bridgewater, Weymouth, Whitman and Wrentham.
8.5 Wastewater Treatment Plants WWTP discharges are regulated under the NPDES program when the effluent is released to surface waters. Each WWTP has an effluent limit included in its NPDES or groundwater permit. Some NPDES permits are listed on the following website: www.epa.gov/region1/npdes/permits_listing_ma.html.

69
Information on groundwater permits is available at http://www.mass.gov/dep/water/laws/regulati.htm#wqual. Specific information on several major wastewater treatment facilities with any associated CSOs in the watershed (such as the Taunton WWTP, Fall River WWTF, and Brocton WWTF) is detailed in Section 6.0, Prioritization and Known Sources, Ongoing Efforts, and in Section 8.2, Illicit Sewer Connections, Failing Infrastructure and CSOs.
8.6 Recreational Waters Use Management Recreational waters receive pathogen inputs from swimmers and boats. To reduce swimmers’ contribution to pathogen impairment, shower facilities can be made available, and bathers should be encouraged to shower prior to swimming. In addition, parents should check, change and properly dispose of young children’s diapers when they are dirty. Options for controlling pathogen contamination from boats include:
petitioning the State for the designation of a No Discharge Area (NDA), supporting installation of pump-out facilities for boat sewage, educating boat owners on the proper operation and maintenance of marine
sanitation devices (MSDs), and encouraging marina owners to provide clean and safe onshore restrooms and
pump-out facilities. Sewage from boats has been identified as a potential source of bacteria in some segments of the Taunton River watershed. However, this watershed does not have any areas designated as no discharge areas (NDAs) for vessel sewage. This designation by the Commonwealth of Massachusetts and approved by the EPA would provide protection of this area by a Federal Law which prohibits the release of raw or treated sewage from vessels into navigable waters of the U.S. The law is enforced by the Massachusetts Environmental Police. Massachusetts State Representative Bill Strauss has introduced legislation that would clearly define the role of harbormasters and other coastal police officers in enforcing NDAs and would allow them to collect up to $2000 for violations in NDAs.(CZM 2010).
8.7 Funding/Community Resources A complete list of funding sources for implementation of non-point source pollution is provided in Section VII of the Massachusetts Nonpoint Source Management Plan Volume I (MassDEP 2000b) available on line at http://www.mass.gov/dep/water/resources/nonpoint.htm. This list includes specific programs available for non-point source management and resources available for communities to manage local growth and development. The State Revolving Fund (SRF) provides low interest loans to communities for certain capital costs associated with building or improving wastewater treatment facilities. In addition, many communities in Massachusetts sponsor low cost loans through the SRF for homeowners to repair or upgrade failing septic systems. State monies are also available through the Massachusetts Office of Coastal Management’s Coastal Pollutant Remediation, Coastal Nonpoint Source Pollution Control and Coastal Monitoring grant programs.

70
8.8 Mitigation Measures to Address Pathogen Pollution in Surface Water: A TMDL Implementation Guidance Manual for Massachusetts For a more complete discussion on ways to mitigate pathogen water pollution, see the “Mitigation Measures to Address Pathogen Pollution in Surface Water: A TMDL Implementation Guidance Manual for Massachusetts” accompanying this document.

71
9.0 Monitoring Plan The long term monitoring plan for the Taunton River watershed includes several components:
1. continue with the current monitoring of the Taunton River watershed (SERO BST, TRWA, and other stakeholders),
2. continue with MassDEP watershed five-year cycle monitoring, 3. monitor areas within the watershed where data are lacking or absent to determine if the
waterbody meets the use criteria, 4. monitor areas where BMPs and other control strategies have been implemented or
discharges have been removed to assess the effectiveness of the modification or elimination,
5. assemble data collected by each monitoring entity to formulate a concise report where the basin is assessed as a whole and an evaluation of BMPs can be made, and
6. add/remove/modify BMPs as needed based on monitoring results. The monitoring plan is an ever changing document that requires flexibility to add, change or delete sampling locations, sampling frequency, methods and analysis. At the minimum, all monitoring should be conducted with a focus on:
capturing water quality conditions under varied weather conditions, establishing sampling locations in an effort to pin-point sources, researching new and proven technologies for separating human from animal bacteria
sources, and assessing efficacy of BMPs.

72
10.0 Reasonable Assurances Reasonable assurances that the TMDL will be implemented include both application and enforcement of current regulations, availability of financial incentives including low or no-interest loans to communities for wastewater treatment facilities through the State Revolving Fund (SRF), and the various local, state and federal programs for pollution control. In addition, when developing the TMDL no point sources were assigned a less stringent WLA based on reductions from nonpoint sources. Stormwater NPDES permit coverage is designed to address discharges from municipal owned stormwater drainage systems. Enforcement of regulations controlling non-point discharges includes local enforcement of the state Wetlands Protection Act and Rivers Protection Act, Title 5 regulations for septic systems and various local regulations including zoning regulations. Financial incentives include Federal monies available under the CWA Section 319 Nonpoint Source program and the CWA Section 604 and 104b programs, which are provided as part of the Performance Partnership Agreement between MassDEP and the EPA. Additional financial incentives include state income tax credits for Title 5 upgrades, and low interest loans for Title 5 septic system upgrades through municipalities participating in this portion of the state revolving fund program. State monies are also available through the Massachusetts Office of Coastal Zone Management’s Coastal Pollutant Remediation, Coastal Nonpoint Source Pollution Control, and Coastal Monitoring grant programs. The primary goal of all three programs is to improve coastal water quality by reducing or eliminating nonpoint sources of pollution. A brief summary of many of MassDEP’s tools and regulatory programs to address common bacterial sources is presented below.
10.1 Overarching Tools Massachusetts Clean Water Act: The MA Clean Water Act (M.G.L. Chapter 21, sections 26-53) provides MassDEP with specific and broad authority to develop regulations to address both point and non-point sources of pollution. There are numerous regulatory and financial programs, including those identified in the preceding paragraph, that have been established to directly and indirectly address pathogen impairments throughout the state. Several of them are briefly described below. The MA Clean Water Act can be found at the following URL: http://www.mass.gov/legis/laws/mgl/gl-21-toc.htm. Surface Water Quality Standards (314 CMR 4.0): The MA Water Quality Standards (WQS) assign designated uses and establish water quality criteria to meet those uses. Water body classifications (Class A, B, and C, for freshwater and SA, SB, and SC for marine waters) are established to protect each class of designated uses. In addition, bacteria criteria are established for each individual classification. The MA Surface Water Quality Standards can be found at http://www.mass.gov/dep/water/laws/regulati.htm#wqual.

73
Ground Water Quality Standards (314 CMR 6.0): These standards consist of groundwater classifications, which designate and assign the uses for various groundwaters of the Commonwealth that must be maintained and protected. Like the surface water quality standards, the groundwater standards provide specific ground water quality criteria necessary to sustain the designated uses and/or maintain existing groundwater quality. The MA Ground Water Quality Standards can be found at http://www.mass.gov/dep/water/laws/regulati.htm#wqual. River Protection Act: In 1996 MA passed the Rivers Protection Act. The purposes of the Act were to protect the private or public water supply; to protect the ground water; to provide flood control; to prevent storm damage; to prevent pollution; to protect land containing shellfish; to protect wildlife habitat; and to protect the fisheries. The provisions of the Act are implemented through the Wetlands Protection Regulations, which establish up to a 200-foot setback from rivers in the Commonwealth to control construction activity and protect the items listed above. Although this Act does not directly reduce pathogen discharges it indirectly controls many sources of pathogens close to water bodies. More information on the Rivers Protection Act can be found on MassDEPs web site at http://www.mass.gov/dep/water/laws/laws.htm.
10.2 Additional Tools to Address Combined Sewer Overflows (CSO’s) CSO Program/Policy: Massachusetts, in concert with EPA Region 1, have established a detailed CSO abatement program and policy. CSO discharges are regulated by the Commonwealth in several ways. Like any discharge of pollutants, CSOs must have an NPDES/MA Surface Water Discharge Permit under federal and state regulations. Municipalities and districts seeking funding for wastewater treatment, including CSO abatement, must comply with the facilities planning process under 310 CMR 41.00. Entities obtaining funding or exceeding specific thresholds must also comply with the Massachusetts Environmental Policy Act (MEPA) regulations under 301 CMR 11.00. Each of these regulations contains substantive and procedural requirements. Because both MEPA and facilities planning require the evaluation of alternatives, these processes are routinely coordinated. All permits for a CSO discharge must comply with Massachusetts Surface Water Quality Standards under 314 CMR 4.00. The water quality standards establish goals for waters of the Commonwealth, and provide the basis for water quality-based effluent limitations in NPDES permits. Any discharge, including CSO discharges, is allowed only if it meets the criteria and the antidegradation standard for the receiving segment. EPA's 1994 CSO Control Policy revised some features of its 1989 version to provide greater flexibility by allowing a minimal number of overflows, which are compatible with the water quality goals of the Clean Water Act. MassDEP's 1995 regulatory revisions correspondingly decreased reliance on partial use designation as the sole regulatory vehicle to support CSO abatement plans1.
1MassDEP's 1997 CSO Policy was based on EPA's 1989 CSO Control Policy and established the goal of eliminating adverse impacts from CSOs, using partial use designation where removal or relocation was not feasible. The three month design storm was identified as the minimum technology-based effluent limitation, which would result in untreated overflows an average of four times a year. Abatement measures to meet these minimum standards were necessary for a CSO discharge to be eligible for partial use designation. A partial use designation indicates that COS’s remain with moderate impacts resulting in intermittent impairment of water quality goals. Presumably, all CSOs exceeding this standard required downgrading to Class C or SC status. No partial use designations or downgrades to Class C were actually made, but the process was perceived as administratively cumbersome.

74
In all cases, NPDES/MA permits require the nine minimum controls necessary to meet technology-based limitations as specified in the 1994 EPA Policy. The nine controls may be summarized as: operate and maintain properly; maximize storage, minimize overflows, maximize flows to Publicly Owned Treatment Works (POTW), prohibit dry weather CSO's, control solids and floatables, institute pollution prevention programs, notify the public of impacts, and observe monitoring and reporting requirements. The nine minimum controls may be supplemented with additional treatment requirements, such as screening and disinfection, on a case-by-case basis. The Department's goal is to eliminate adverse CSO impacts and attain the highest water quality achievable. Separation or relocation of CSOs is required wherever it can be achieved, based on an economic and technical evaluation. As untreated CSOs cause violations of water quality standards, and thus are in violation of NPDES permits, all of the state’s CSO permittees are under enforcement orders to either eliminate the CSO or plan, design, and construct CSO abatement facilities. Each long-term control plan must identify and achieve the highest feasible level of control. The process also requires the permittee to comply with any approved TMDL. As a result of a Federal Court Order the City of Fall River has prepared a Long Term CSO plan and Facilities Management Plan which would capture 48.3 million gallons of combined sewage from 19 CSO’s thereby reducing CSO discharges to less than four treated discharge events per year. Within the Taunton River MA62-04 Segment, there are currently four potential CSO discharges that are part of the Long Term CSO control plan. The CSO Abatement Program, as currently planned, includes expansion of the Regional Wastewater Treatment Plant primary treatment capacity to 106-million gallons per day through construction of an 85-million gallon rock tunnel (already completed) with surface piping and partial sewer separation of selected CSO areas along the waterfront. There is a single CSO in the City of Taunton, located on West Water Street (Outfall 004). The City of Taunton has been subject to several enforcement actions for high flow related effluent violations, including EPA administrative orders No. 94-31 issued in 1994, No. 96-04 issued in 1996, No. 08-042 issued in 2008, and a MADEP order issued in 2005. The overflows are associated with heavy rainfall events and are due primarily to infiltration and inflow (I/I) into the system. Significant I/I in a collection system may displace sanitary flow reducing the capacity and the efficiency of the treatment works causing bypasses to secondary treatment and overflows into the Taunton River. The long- term CSO Plan for Taunton is total elimination of flows from this CSO by October 2013. The City of Brockton has a NPDES permit to discharge treated sanitary and industrial wastewater from the Brockton Advanced Water Reclamation Facility into the Salisbury Plain River. The City received funding through the 2003 SRF Program to rehabilitate its aging collection system and its treatment facility. The project objective is to eliminate the environmental and publish health issues associated with sewer system overflows and discharge violations at the treatment facility.

75
10.3 Additional Tools to Address Failed Septic Systems Septic System Regulations (Title 5): The MassDEP has regulations in place that require minimum standards for the design of individual septic systems. Those regulations ensure, in part, protection for nearby surface and groundwaters from bacterial contamination. The regulations also provide minimum standards for replacing failed and inadequate systems. MassDEP has established a mandatory requirement that all septic systems must be inspected and upgraded to meet Title 5 requirements at the time of sale or transfer of the each property. Working with the Massachusetts Water Pollution Abatement Trust, MassDEP administers a revolving fund known as the Community Septic Management Program. This loan program offers three options from which a local government can provide low interest loans to eligible homeowners for septic system improvement. Working with the Massachusetts Water Pollution Abatement Trust, MassDEP administers a revolving fund known as the Community Septic Management Program. This loan program offers three options from which a local government can provide low interest loans to eligible homeowners for septic system improvement. Currently there are several municipalities in the Taunton River Watershed participating the Community Septic Management Program. They are Attleboro, Avon, Bridgewater, Carver, Dartmouth, Dighton, East Bridgewater, Easton, Foxborough, Halifax, Hanson, Holbrook, Kingston, Lakeville, Middleborough, Norton, Pembroke, Plymouth, Plympton, Sharon, Stoughton, Taunton, West Bridgewater, Weymouth, Whitman and Wrentham.
10.4 Additional Tools to Address Stormwater Stormwater is regulated through both federal and state programs. Those programs include, but are not limited to, the federal and state Phase I and Phase II NPDES stormwater program, and, at the state level, the Wetlands Protection Act MGL Chapter 130, Section 40), the state water quality standards, and the various permitting programs previously identified. Federal Phase 1 & 2 Stormwater Regulations: Existing stormwater discharges are regulated under the federal and state Phase 1 and Phase II stormwater program. In MA there are two Phase 1 communities, Boston and Worcester. Both communities have been issued individual permits to address stormwater discharges. In addition, 237 communities in Massachusetts, and all 40 communities in the Taunton River Watershed are covered by Phase II (the only exception is the Town of Plympton which was granted a waiver from the program by EPA). Phase II is intended to further reduce adverse impacts to water quality and aquatic habitat by instituting use controls on the unregulated sources of stormwater discharges that have the greatest likelihood of causing continued environmental degradation including those from municipal separate storm sewer systems (MS4s) and discharges from construction activity. The Phase II Final Rule, published in the Federal Register on December 8, 1999, requires permittees to determine whether or not stormwater discharges from any part of the MS4 contribute, either directly or indirectly, to a 303(d) listed waterbody. Operators of regulated MS4s are required to design stormwater management programs to 1) reduce the discharge of pollutants to the “maximum

76
extent practicable” (MEP), 2) protect water quality, and 3) satisfy the appropriate water quality requirements of the Clean Water Act. Implementation of the MEP standard typically requires the development and implementation of BMPs and the achievement of measurable goals to satisfy each of the six minimum control measures. Those measures include 1) public outreach and education, 2) public participation, 3) illicit discharge detection and elimination, 4) construction site runoff control, 5) post-construction runoff control, and 6) pollution prevention/good housekeeping. In addition, each permittee must determine if a TMDL has been developed and approved for any water body into which an MS4 discharges. If a TMDL has been approved then the permittee must comply with the TMDL including the application of BMPs or other performance requirements. The permittee must report annually on all control measures currently being implemented or planned to be implemented to control pollutants of concern identified in TMDLs. Finally, the Department has the authority to issue an individual permit to achieve water quality objectives. Links to the MA Phase II permit and other stormwater control guidance can be found at : http://www.mass.gov/dep/water/wastewater/stormwat.htm. A full list of Phase II communities in MA can be found at : http://www.mass.gov/dep/water/laws/p2help.htm
In addition to the Phase I and II programs described above the Massachusetts Department of Environmental Protection's proposed new "Stormwater Management Regulations," that would establish a statewide general permit program aimed at controlling the discharge of stormwater runoff from certain privately-owned sites containing large impervious surfaces.
The proposed regulations would require private owners of land containing five or more acres of impervious surfaces to apply for and obtain coverage under a general permit; implement nonstructural best management practices (BMPs) for managing stormwater; install low impact development (LID) techniques and structural stormwater BMPs at sites undergoing development or redevelopment; and submit annual compliance certifications to the Department.
Where the Department has determined that stormwater runoff is causing or contributing to violations of the Massachusetts Surface Water Quality Standards, the proposed regulations would allow MassDEP to impose the same requirements on certain private owners of land with less than five acres of impervious surfaces and require the owners of such land to design and implement the LID techniques and stormwater BMPs needed to address these violations. The MassDEP Wetlands regulations (310 CMR 10.0) direct issuing authorities to enforce the DEP Stormwater Management Policy, place conditions on the quantity and quality of point source discharges, and to control erosion and sedimentation. The Stormwater Management Policy was issued under the authority of the 310 CMR 10.0. The policy and its accompanying Stormwater Performance Standards apply to new and redevelopment projects where there may be an alteration to a wetland resource area or within 100 feet of a wetland resource (buffer zone). The policy requires the application of structural and/or non-structural BMPs to control suspended solids, which have associated co-benefits for bacteria removal. A stormwater handbook was developed to promote consistent interpretation of the Stormwater Management Policy and Performance Standards: Volume 1: Stormwater Policy Handbook and Volume 2: Stormwater Technical Handbook can be found along with the Stormwater Policy at http://www.mass.gov/dep/water/laws/policies.htm#storm.

77
10.5 Financial Tools Nonpoint Source Control Program: DEP has established a non-point source program and grant program to address non-point source pollution sources statewide. The Department has developed a Nonpoint Source Management Plan that sets forth an integrated strategy and identifies important programs to prevent, control, and reduce pollution from nonpoint sources and more importantly to protect and restore the quality of waters in the Commonwealth. The Clean Water Act, Section 319, specifies the contents of the management plan. The plan is an implementation strategy for BMPs with attention given to funding sources and schedules. Statewide implementation of the Management Plan is being accomplished through a wide variety of federal, state, local, and non-profit programs and partnerships. It includes partnering with the Massachusetts Coastal Zone Management on the implementation of Section 6217 program. That program outlines both short and long term strategies to address urban areas and stormwater, marinas and recreational boating, agriculture, forestry, hydromodification, and wetland restoration and assessment. The CZM 6217 program also addresses TMDLs and nitrogen sensitive embayments and is crafted to reduce water quality impairments and restore segments not meeting state standards. In addition, the state is partnering with the Natural Resource Conservation Service (NRCS) to provide implementation incentives through the national Farm Bill. As a result of this effort, NRCS now prioritizes its Environmental Quality Incentive Program (EQIP) funds based on MassDEP’s list of impaired waters. The program also provides high priority points to those projects designed to address TMDL recommendations. Over the past several years EQIP funds have been used throughout the Commonwealth to address water quality goals through the application of structural and non-structural BMPs. MassDEP, in conjunction with EPA, also provides a grant program to implement nonpoint source BMPs that address water quality goals. The section 319 funding provided by EPA is used to apply needed implementation measures and provide high priority points for projects that are designed to address 303d listed waters and to implement TMDLs. MassDEP has funded numerous projects and awarded approximately $10.2 million through 319 that were designed to address stormwater and bacteria related impairments. It is estimated that 75% of all projects funded since 2002 were designed to address bacteria related impairments. The 319 program also provides additional assistance in the form of guidance. The Department is in the process of updating the Massachusetts’ Nonpoint Source Management Manual that will provide detailed guidance in the form of BMPs by land use to address various water quality impairments and associated pollutants. Finally, it should be noted that the approach and process outlined for implementing this TMDL has been previously demonstrated with documented success. A previous TMDL, which utilized this approach was developed and approved by EPA for the Neponset River Watershed. The recommendations outlined in that TMDL were similar to the current proposal. Since the time of approval, MADEP worked closely with a local watershed group (Neponset River Watershed Association) to develop a 319 project to implement the recommendations of the TMDL. The total project cost was approximately $472,000 of which $283,000 was provided through federal 319 funds and the additional 40% provided by the watershed association and two local communities.

78
Other examples include the Little Harbor in Cohasset and the Shawsheen River. Similar TMDLs were developed in these areas. In Little Harbor, the TMDL was used as the primary tool to obtain local approval and funding to design and install sewers around Little Harbor and other additional areas of Town impacted by sewerage contamination. Presently, the Town is seeking additional state funding to construct the sewers. In the Shawsheen Watershed the TMDL was used to obtain a state grant to identify and prioritize specific stormwater discharges for remediation. In addition, MassDEP has received a grant to a conduct additional sampling and refine field and laboratory techniques that will allow us to differentiate between human and non-human sources that will be useful statewide. MassDEP and EPA Region 1 are also working on a compliance & enforcement strategy to address the worst sources. Additional information related to the non-point source program, including the Management Plan can be found at http://www.mass.gov/dep/water/resources/nonpoint.htm State Revolving Fund: The State Revolving Fund (SRF) Program provides low interest loans to eligible applicants for the abatement of water pollution problems across the Commonwealth. Since July 2002, the MassDEP has issued millions of dollars in loans for the planning and construction of CSO facilities and to address stormwater pollution. Loans have also been distributed to municipal governments statewide to upgrade and replace failed Title 5 systems. These programs all demonstrate the State’s commitment to assist local governments in implementing the TMDL recommendations. Additional information about the SRF Program can be found at http://www.mass.gov/dep/water/wastewater/wastewat.htm. Bacteria Source Tracking Program: Over the last several years MassDEP supported regional staff and provided analytical capabilities in three regions (Northeast, Southeast, and West) to work with communities to track, identify, and eliminate bacteria sources that contribute to water quality impairments. The specific strategy that MassDEP will use to find and eliminate bacterial sources will be based on the amount of source-specific data available in each watershed, the nature and extent of stormwater discharges in the watershed, and the nature and extent of water quality standard exceedances. It is MassDEPs goal to work closely with EPA, municipalities, and watershed associations to find and address significant pollutant contributors. To accomplish this MassDEP will consult our own internal databases, as well as local data that are available and review Phase II annual submittals to identify major violations. We will then use our designation authority where necessary (or EPA’s authority) to require quicker action than would otherwise be achieved under existing schedules or require additional controls if it is determined that Phase II activities are insufficient to solve the problem. In watersheds where data is insufficient, MassDEP will rely on our 5-year cycle monitoring program, watershed association data, and provide grant opportunities to collect the data necessary to quantify and qualify major sources. MassDEP’s regional monitoring staff assist with data collection activities. Once a significant source is found MassDEP will coordinate with the owner of the discharge to “go up the pipe” to identify remote connections and undertake additional controls as necessary. In summary, MassDEP’s approach and existing programs set out a wide variety of tools both MassDEP and communities can use to address pathogens, based on land use and the commonality

79
of pathogen sources (e.g., combined sewer overflows (CSOs), failing septic systems, stormwater and illicit connections, pet waste, etc.) Since there are only a few categories of sources of pathogens, the necessary remedial actions to address these sources are well established. MassDEP’s authority combined with the programs identified above provide sufficient reasonable assurance that implementation of remedial actions will take place.

80
11.0 Public Participation Two public meetings were held at 3 p.m. and 7pm. at the DEP-SERO, Lakeville on 8/10/2005 to present the Bacteria TMDL and to collect public comments. The public comment period began on July 23, 2005 and ended on August 26, 2005. The attendance list, public comments, and the MassDEP responses are attached as Appendix A.
81
12.0 References Ashan, M 2005. Personal Communication. Avon Custom Mixing Inc. facility information.
Massachusetts Department of Environmental Protection, Northeast Regional Office, Boston, MA.
Ayres Associates 1993. Onsite Sewage Disposal Systems Research in Florida. The Capacity of
Fine Sandy Soil for Septic Tank Effluent Treatment: A Field Investigation at an In-Situ Lysimeter Facility in Florida.
Center for Watershed Protection, 1999. Watershed Protection Techniques. Vol. 3, No. 1. CZM 2010. Personal Communication with the Office of the Massachusetts Coastal Zone
Management, Boston Massachusetts. DMF 2002. Massachusetts Division of Marine Fisheries. Programs and Projects. Shellfish
Sanitation and Management. Information from website, downloaded March 2005. http://www.mass.gov/dfwele/dmf/programsandprojects/shelsani.htm
ENSR 2005. Mitigation Measures to Address Pathogen Pollution in Surface Water: A TMDL
Implementation Guidance Manual for Massachusetts. www.mass.gov/dep/water/resources/impguide.pdf
ESS 2003. Matfield and Salisbury Plain River Watersheds Nonpoint Source Pollution Assessment
Report and Management Plan. Prepared for DEP/DWM. Wellesley, MA. MassDEP 2000a. 314 CMR 4.00: Massachusetts Surface Water Quality Standards. Massachusetts
Department of Environmental Protection Bureau of Waste Prevention. Available for download at http://www.mass.gov/dep/service/regulations/314cmr04.pdf
MassDEP 2000b. Nonpoint Source Management Plan Volume I Strategic Summary.
Massachusetts Department of Environmental Protection Bureau of Waste Prevention. Available for download at http://www.mass.gov/dep/water/resources/nonpoint.htm
MassDEP 2002a. Cape Cod Watershed Water Quality Assessment Report. Massachusetts
Department of Environmental Protection, Division of Water Management. Worcester, Massachusetts. Available for download at http://www.mass.gov/dep/water/resources/wqassess.htm#wqar
MassDEP 2002b. Final Total Maximum Daily Loads of Bacteria for Neponset River Basin.
Massachusetts Department of Environmental Protection, Bureau of Resource Protection, Division of Watershed Management. Report MA73-01-2002 CN 121.0. Boston, Massachusetts. Available for download at http://www.mass.gov/dep/water/resources/tmdls.htm

82
MassDEP 2003. Massachusetts Year 2002 Integrated List of Waters. Part 2 – Final Listing of
Individual Categories of Waters. Massachusetts Department of Environmental Protection, Bureau of Resource Protection, Division of Watershed Management. Boston, Massachusetts. Available for download at http://www.mass.gov/dep/water/resources/tmdls.htm
MassDEP 2005. Taunton River Watershed 2001 Water Quality Assessment Report. Massachusetts
Department of Environmental Protection, Division of Water Management. Worcester, Massachusetts. Available for download at http://www.mass.gov/dep/water/resources/wqassess.htm.
MassDEP 2005a. Massachusetts Year 2004 Integrated List of Waters. Part 2 – Final Listing of
Individual Categories of Waters. Massachusetts Department of Environmental Protection, Bureau of Resource Protection, Division of Watershed Management. Boston, Massachusetts. Available for download at: http://www.mass.gov/dep/water/resources/tmdls.htm.
MassDEP 2007. Massachusetts Year 2006 Integrated List of Waters. Final Listing of the Condition
of Massachusetts’ Waters Pursuant to Sections 303(d) and 305 (b) of the Clean Water Act. Massachusetts Department of Environmental Protection, Bureau of Resource Protection, Division of Watershed Management. Boston, Massachusetts. Available for download at:: http://www.mass.gov/dep/water/resources/tmdls.htm.
MassDEP 2008. Massachusetts Year 2008 Integrated List of Waters. Final Listing of the Condition
of Massachusetts’ Waters Pursuant to Sections 303(d) and 305(b) of the Clean Water Act. Massachusetts Department of Environmental Protection, Bureau of Resource Protection, Division of Watershed Management. Boston, Massachusetts. Available for download at http://www.mass.gov/dep/water/resources/tmdls.htm
MassGIS 2005. Office of Geographic and Environmental Information (MassGIS), Commonwealth of
Massachusetts Executive Office of Environmental Affairs. MassDEP 2002 Integrated List of Waters (305(b)/303(d)) as of 2005; Land Use as of 1999; Town Boundaries as of 2002. Census TIGER Roads as of 2003. Major Drainage Boundaries as of 2003. Designated Shellfish Growing Areas as of July 2000. Downloaded January 2005. http://www.mass.gov/mgis/laylist.htm
MDC-CDM. 1997. Wachusett Stormwater Study. Massachusetts District Commission and Camp,
Dresser, and McKee, Inc. Metcalf and Eddy 1991. Wastewater Engineering: Treatment, Disposal, Reuse. Third Edition. Metcalf and Eddy 1992. Casco Bay Stormwater Management Project.

83
Somerset BOH. 2005. Personal Communication. Pierce Beach posting information 2003 and 2004. Communication with Stella Tamul, Massachusetts Department of Environmental Protection, Division of Watershed Management, 11 March 2005. Board of Health. Somerset, MA.
TRWA 2004. Taunton River Watershed Alliance: Mission Statement. Taunton River Watershed
Alliance. Information from website, downloaded March 2005. http://www.trwaonline.org/mission.html
USEPA 1983. Results of the Nationwide Urban Runoff Program. Volume I. Final Report. Water
Planning Division. Washington, D.C. 159 pp. USEPA 1986. Ambient Water Quality Criteria for Bacteria – 1986. EPA 440/5-84-002. USEPA. 1997. Urbanization of Streams: Studies of Hydrologic Impacts. EPA 841-R-97-009 USEPA 1999. Regional Guidance on Submittal Requirements for Lake and Reservoir Nutrient
TMDLs. USEPA, New England Region. November 1999. USEPA 2001. Protocol for Developing Pathogen TMDLs. EPA 841-R-00-002 USEPA 2004a. Monitoring and Assessing Water Quality. Information from website, downloaded
December 2004. http://www.epa.gov/OWOW/monitoring/volunteer/stream/vms511.html USEPA 2004b. No Discharge Areas in Massachusetts. Information from website, downloaded
March 2005. http://www.epa.gov/region01/eco/nodiscrg/ma.html USEPA 2004c. Lower Charles River Illicit Discharge Detection & Elimination (IDDE) Protocol
Guidance for Consideration - November 2004 United States Environmental Protection Agency Region I New England
USGS 2002. Measured and Simulated Runoff to the Lower Charles River, Massachusetts, October
199-September 2000. 02-4129. United States Geological Survey. Northborough, Massachusetts.

84
Appendix A Public Participation
RESPONSE TO COMMENTS ON THE PATHOGEN TMDL FOR THE TAUNTON WATERSHED Public Meeting Announcement Published in the Monitor 7/23/2005 Date of Public Meeting 8/10/2005
Location of Public Meeting DEP-SERO, Lakeville
Times of Public Meeting 3 P.M. and 7 P.M. TAUNTON WATERSHED PATHOGEN TMDL PUBLIC MEETING ATTENDEES Date 8/10/2005 Time 3 PM Name Organization 1. Ben Bryant Coalition for Buzzards Bay 2. A. Antoniello DPW Scituate 3. Jason Burtner CZM 4. Mike Hill EPA 5. Bill Fitzgerald DPW Franklin/Citizen Taunton 6. Cathal O’Brien DPW Water Taunton 7. Lawrence Perry Lakeville Health Agent 8. Newton Newman Lloyd Center Dartmouth Date 8/10/2005 Time 7 P.M Name Organization 1. Sara Grady NSRWA/Mass Bays 2. Steve Silva EPA This appendix provides detailed responses to comments received during the public comment process. MassDEP received many comments/questions that were of a general nature (i.e. related to terminology, statewide programs, the TMDL development process and regulations, etc.) while others were watershed specific. Responses to both are presented in the following sections. General Comments: 1. Question: On the slide titled "components of a TMDL" what does "WLA" and "LA" stand for.

85
Response: Waste load allocation (WLA) refers to pollutants discharged from pipes and channels that require a discharge permit (point sources). Load allocation refers to pollutants entering waterbodies through overland runoff (non point sources). A major difference between the two categories is the greater legal and regulatory control generally available to address point sources while voluntary cooperation added by incentives in some cases is the main vehicle for addressing non-point sources. 2. Question: What is the Septic System Program? Response: Cities and Towns can establish a small revolving fund to help finance repairs and necessary upgrades to septic systems. The initial funding is from the Commonwealth’s State, Revolving Fund Program (SRF). These programs generally offer reduced interest rate loans to homeowners to conduct such improvements. Many communities have taken advantage of this effort and on Cape Cod Barnstable County has proposed its own version of this aid. A discussion of the septic system programs may be seen in the TMDL companion document “A TMDL Implementation Guidance Manual for Massachusetts” under Section 3.2. 3. Question: What is the WQS for non-contact recreation in terms of bacteria? Response: EPA does not have specific guidance for a bacteria criterion for secondary contact. The agency recommended that states use 5 times the swimming standard in the case of fecal coliform. Based on EPA’s recommendation Massachusetts adopted a class “C” standard of 1000 organisms per 100 ml. Class C waters are designated as a habitat for fish, other aquatic life and wildlife, and for secondary contact recreation such as fishing and boating. In 2007, the State of Massachusetts revised its standards for certain waters from fecal coliform to e-coli or enteroccoci 4. Question: On the topic of DNA testing for bacterial source tracking what is MassDEP doing or planning to do? Response: DNA testing is a promising but as yet not fully reliable tool in distinguishing between human and other sources of fecal bacteria. When perfected, this tool will be extremely valuable in helping target sources of pathogens and remedial actions. At the same time, one needs to recognize that even if the source of the bacteria is identified as non-human, any concentrations exceeding the criteria still impair the use, such as swimming or shellfishing, associated with those criteria. MassDEP is already working with our Wall Experiment Station to help develop reliable techniques to address this issue. Once developed MassDEP will include those techniques into our sampling programs however we hope local monitoring programs will also benefit from them. 5. Question: What is the current thought on e coli / entero bacteria survival and reproduction in the environment, especially in wetlands? Response: There are reports that indicator bacteria can survive in sediment longer than they can in water. This may be a result of being protected from predators. Also, there is some indication that reproduction may occur in wetlands, but until wildlife sources can be ruled out through, for example,

86
a reliable DNA testing, this possibility needs to be treated with caution. Also, die off of indicator bacteria tends to be more rapid in warm water than in cold. 6. Question: For the implementation phase of TMDLs who will do the regular progress reporting and who will pay for it? Response: In most cases, MassDEP is relying on existing programs for TMDL implementation. Reporting will also depend on the action being taken. Phase I and Phase II municipalities already do regular reporting and provide annual status reports on their efforts. Any additional information can be coupled with existing reporting requirements and monitoring results to determine the success and failure of implementation measures. For non-Phase II municipalities it gets more difficult and MassDEP may have to work directly with each community or possibly add communities with known impairments to the phase II list. The TMDL does not require volunteer groups, watershed organizations or towns to submit periodic reports - it is not mandatory. The MassDEP is relying on self interest and a sense of duty for communities to move ahead with the needed controls facilitated by some state aid. The MassDEP feels that the cooperative approach is the most desirable and effective but also believes that we possess broad regulatory authority to require action if and when it is deemed appropriate. . 7. Question: How does the Phase II program and TMDL program coordinate with each other? Response: The NPDES Stormwater Phase II General Permit Program became effective in Massachusetts in March 2003. The permit requires the regulated entities to develop, implement and enforce a stormwater management program (SWMP) that effectively reduces or prevents the discharge of pollutants into receiving waters to the Maximum Extent Practicable (MEP). Stormwater discharges must also comply with meeting state water quality standards. The Phase II permit uses a best management practice framework and measurable goals to meet MEP and water quality standards. A requirement of the permit is that if a TMDL has been approved for any water body into which the small municipal separate storm sewer system (MS4) discharges, the permittee must determine whether the approved TMDL is for a pollutant likely to be found in stormwater discharges from the MS4. If the TMDL includes a pollutant waste load allocation, best management practices (BMPs) or other performance standards for stormwater discharges, the permittee must incorporate into their SWMP the recommendations in the TMDL for limiting the pollutant contamination. The permittee must assess whether the pollutant reduction required by the TMDL is being met by existing stormwater management control measures in their SWMP or if additional control measures are necessary. As TMDLs are developed and approved, permittees’ stormwater management programs and annual reports must include a description of the BMPs that will be used to control the pollutant(s) of concern, to the maximum extent practicable. Annual reports filed by the permittee should highlight the status or progress of control measures currently being implemented or plans for implementation in the future. Records should be kept concerning assessments or inspections of the appropriate control measures and how the pollutant reductions will be met. 8. Question: Will communities be liable for meeting water quality standards for bacteria at the point of discharge?

87
Response: No. While this is the goal stated in the TMDL, compliance with the water quality standards is judged by in-stream measurements. For instance, in an extreme case, it could be possible for a community to meet this criterion in their storm drains and yet still be responsible for reducing the impacts of overland runoff if the in-stream concentrations of bacteria exceeded the water quality standard. So no matter how the TMDL is expressed, compliance is measured by the concentrations in the ambient water. This approach is also consistent with current EPA guidance and regulations. As stated in the 2002 Wayland/Hanlon memorandum, "WQBELs for NPDES-regulated stormwater discharges that implement WLAs in TMDLs may be expressed in the form of best management practices (BMPs) under specified circumstances. See 33 U.S.C. 1342(p)(3)(B)(iii); 40 C.F.R. 122.44(k)(2)&(3)" (Wayland/Hanlon memorandum, page 2). This memorandum goes on to state: "...because stormwater discharges are due to storm events that are highly variable in frequency and duration and are not easily characterized, only in rare cases will it be feasible or appropriate to establish numeric limits for municipal and small construction stormwater discharges. The variability in the system and minimal data generally available make it difficult to determine with precision or certainty actual or projected loadings for individual dischargers or groups of dischargers. Therefore, EPA believes that in these situations, permit limits typically can be expressed as BMPs, and that numeric limits will be used only in rare instances” (Wayland, Hanlon memorandum, November 22, 2002, page 4). The TMDL attempts to be clear on the expectation that an adaptive management approach utilizing BMPs will be used to achieve WQS as stated in the Wayland/Hanlon memorandum: "If it is determined that a BMP approach (including an iterative BMP approach) is appropriate to meet the stormwater component of the TMDL, EPA recommends that the TMDL reflect this." (Wayland, Hanlon memorandum, page 5). Consistent with this, the Massachusetts’ pathogen TMDLs state that an iterative approach using an illicit connection detection and elimination program and utilization of non-structural BMPs be used initially to meet WQS followed by structural BMPs where necessary. The actual WLA and LA for stormwater will still be expressed as both a concentration-based/WQS limit and daily load, which will be used to guide BMP implementation. The attainment of WQS, however, will be assessed through ambient monitoring. In stormwater TMDLs, the issue of whether WQSs will be met is an ongoing issue and can never be answered with 100% assurance. MassDEP believes that the BMP-based, iterative approach for addressing pathogens is appropriate for stormwater. Indeed, "the policy outlined in [the Wayland/Hanlon] memorandum affirms the appropriateness of an iterative, adaptive management BMP approach, whereby permits include effluent limits (e.g., a combination of structural and non-structural BMPs) that address stormwater discharges, implement mechanisms to evaluate the performance of such controls, and make adjustments (i.e., more stringent controls or specific BMPs) as necessary to protect water quality" (Wayland, Hanlon memorandum, page 5). A more detailed discussion / explanation of this response can be found in a memorandum titled “Establishing Total Maximum Daily Load (TMDL) Wasteload Allocations (WLAs) for Stormwater

88
Sources and NPDES Permit Requirements Based on Those WLAs” by Robert H. Wayland and James A. Hanlon of EPA (11/22/02). 9. Question: What are the regulatory hooks for this TMDL in regards to non-point sources? Response: In general, the MassDEP is pursuing a cooperative approach in addressing non-point sources of contamination by bacteria. A total of 237 cities and towns in Massachusetts do have legal requirements to implement best management practices under their general NPDES storm-water permits. In addition, failing septic systems are required to be corrected once the local Board of Health becomes aware of them, and at the time of property transfer should required inspections reveal a problem. Other activities, such as farming involving livestock, are the subject of cooperative control efforts through such organizations as the Natural Resources Conservation Service (NRCS) which has a long history of providing both technical advice and matching funds for instituting best management practices on farms. While MassDEP has broad legal authority to address non-point source pollution and enforcement tools available for use for cases of egregious neglect, it intends to fully pursue cooperative efforts which it feels offer the most promise for improving water quality. In addition to the above, the Massachusetts Department of Environmental Protection's proposed new "Stormwater Management Regulations," would establish a statewide general permit program aimed at controlling the discharge of stormwater runoff from certain privately-owned sites containing large impervious surfaces. The proposed regulations would require private owners of land containing five or more acres of impervious surfaces to apply for and obtain coverage under a general permit; implement nonstructural best management practices (BMPs) for managing stormwater; install low impact development (LID) techniques and structural stormwater BMPs at sites undergoing development or redevelopment; and submit annual compliance certifications to the Department. 10. Question: Why is there little mention in the draft TMDL reports on incorporation of LID (Low Impact Development) principles as a way through implementation to control Bacteria pollution? Response: Part of the Statewide TMDL project was to produce an accompanying TMDL implementation guidance document for all the TMDL reports, “Mitigation Measures to Address Pathogen Pollution in Surface Waters: A TMDL Implementation Guidance Document for MA”. There is an entire section in that document (Section D.4) that discusses LID principles and TMDL implementation in detail. 11. Question: What about flow issues and TMDL requirements? Response: TMDLs must be developed for each “pollutant” causing water quality impairments. Although “flow” can impact pollutant concentrations and loadings, flow is not a “pollutant” as defined in federal regulations and is therefore not subject to TMDL development. 12. Question: Is there a way that the TMDL can be integrated with grants, and can the grants be targeted at TMDL implementation?

89
Response: The 319 Grant program is a major funding program providing up to $2 million per year in grants in MA. TMDL implementation is a high priority in that program. In fact, projects designed to address TMDL requirements are given higher priority points during project evaluation. The 319 grant program RFP Includes this language: “Category 4a Waters: TMDL and draft TMDL implementation projects – The 319 program prioritizes funding for projects that will implement Massachusetts’ Total Maximum Daily Load (TMDL) analyses. Many rivers, streams and water bodies in the Commonwealth are impaired and thus do not meet Massachusetts’ Surface Water Quality Standards. The goal of the TMDL Program is to determine the likely cause(s) of those impairments and develop an analysis (the TMDL) that lists those cause(s).” Several comments were also directed towards the complications associated with applying for and reporting that are required elements state grant programs. The MassDEP is sympathetic to the paper work requirements of State and Federal grant programs. The MassDEP periodically reviews the body of requirements to assess what streamlining may be possible. At the same time, the MassDEP underscores that accountability for spending public funds continues to be an important and required component of any grant program. 13. Question: How will implementation of the TMDL address the major problem of post- construction run-off? Response: It is anticipated that proper design and implementation of stormwater systems during construction will address both pre and post-construction runoff issues and thus eliminate future problems. Post-construction runoff is also one of the six minimum control measures that Phase II communities are required to include in their stormwater management program in order to meet the conditions of their National Pollutant Discharge Elimination System (NPDES) permit. In short, Phase II communities are required to: a. Develop and implement strategies which include structural and/or nonstructural best management practices (BMPs); b. Have an ordinance or other regulatory mechanism requiring the implementation of post-construction runoff controls to the extent allowable under State or local law; c. Ensure adequate long-term operation and maintenance controls; d. Determine the appropriate best management practices (BMPs) and measurable goals for their minimum control measure. The general permit implementing the Phase II requirements also contains requirements for permittees that discharge into receiving waters with an approved TMDL. In summary, municipalities covered under Phase II are required to incorporate and implement measures and controls into their plans that are consistent with an established TMDL and any conditions necessary for consistency with the assumptions and requirements of the TMDL. 14. Question: How does a pollution prevention TMDL work?

90
Response: MassDEP recommends that the information contained in the pathogen TMDLs guide management activities for all other waters throughout the watershed to help maintain and protect existing water quality. For non-impaired waters, Massachusetts is proposing “pollution prevention TMDLs” which are also known as “preventative TMDLs” consistent with CWA s. 303(d)(3). Pollution prevention TMDLs encourage the Commonwealth, communities and citizens to maintain and protect existing water quality. Moreover it is easier and less costly in the long term to prevent impairments rather than retrofit controls and best management practices to clean up pollution problems. The goal of this approach is take a more proactive role to water quality management. The analyses conducted for the pathogen impaired segments in this TMDL would apply to the non-impaired segments, since the sources and their characteristics are equivalent. The waste load and/or load allocation for each source and designated use would be the same as specified in the TMDL documents. Therefore, the pollution prevention TMDLs would have identical waste load and load allocations based on the sources present and the designated use of the waterbody segment. The TMDLs may, in appropriate circumstances, also apply to segments that are listed for pathogen impairment in subsequent Massachusetts CWA s. 303(d) Integrated List of Waters. For such segments, this TMDL may apply if, after listing the waters for pathogen impairment and taking into account all relevant comments submitted on the CWA s. 303(d) list, the Commonwealth determines with EPA approval of the CWA s. 303(d) list that this TMDL should apply to future pathogen impaired segments. Pollution prevention best management practices form the backbone of stormwater management strategies. Operation and maintenance should be an integral component of all stormwater management programs. This applies equally well with the Phase II Program as well as TMDLs. A detailed discussion of this subject and the BMPs involved can be found in the TMDL companion document “Measures to Address Pathogen Pollution in Surface Waters: A TMDL Implementation Guidance Document for Massachusetts” in Section 3. 15. Comment: The TMDL methodology uses concentrations based on water quality standards to establish TMDL loads, not traditional “loads”. Response: Concentration-based limits are consistent with EPA regulations. Clean Water Act Section 130.2(i) states that “TMDLs can be expressed in terms of either mass per time, toxicity, or other appropriate measure”. The TMDL in this case is set at the water quality standard. Pathogen water quality standards (which are expressed as concentrations) are based on human health, which is different from many of the other pollutants. It is important to know immediately when monitoring is conducted if the waterbody is safe for human use, without calculating a “load” by multiplying the concentration by the flow – a complex function involving variable storm flow, dilution, proximity to source, etc. The goal to attain water quality standards at the point of discharge is conservative and thus protective, and offers a practical means to identify and evaluate the effectiveness of control

91
measures. In addition, this approach establishes clear objectives that can be easily understood by the public and individuals responsible for monitoring activities. MassDEP believes that it is difficult to provide accurate quantitative loading estimates of indicator bacteria contributions from the various sources because many of the sources are diffuse and intermittent, and flow is highly variable. Thus, it is extremely difficult to monitor and accurately model. Loadings for bacteria are less accurate than a concentration-based approach and do not provide a way to quickly verify if you are achieving the TMDL. Regardless, MassDEP has included a daily load for each segment in this TMDL in addition to the concentration-based approach. 16. Comment: There is concern with the “cookie-cutter” nature of the draft TMDL. Particularly the lack of any determination about the causes and contributions to pathogen impairment for specific river and stream segments. Response: The draft TMDL, although generic in nature, provides a framework and foundation for actions to address bacteria pollution statewide. The MassDEP feels the pathogen TMDL approach is justified because of the commonality of sources affecting the impaired segments and the commonality of best management practices used to abate and control those sources. Many existing programs such as the Federally mandated stormwater program and combined sewer overflow (CSO) Long-term Control Plans, once implemented, will dramatically reduce or eliminate many sources of bacteria and serve as an important first step in an adaptive management approach to eliminate sources. At the same time however MassDEP agrees that it will be important for not only the State, but more importantly local monitoring programs to develop and incorporate source identification and tracking programs to achieve long-term water quality goals. It should also be noted that based on public input MassDEP has conducted additional research to try to identify sources where information was available. Based on this additional information, MassDEP added additional tables to help identify and prioritize important segments and sources. Also, MassDEP revised Section 7 of this TMDL to include segment-by-segment daily load allocations necessary to meet water quality standards. All of the above noted actions were intended to provide additional guidance on potential sources and areas of concern and to help target future remediation activities. 17. Comment: While Table 8-1 of each TMDL lists the Tasks that the agencies (MassDEP/EPA) believe need to be achieved, it isn’t clear exactly how these tasks line up with and address the eight sources of impairment listed in Table 7-1. CZM recommends that the final TMDL be more specific and couple the Implementation Plan tasks with the known or expected sources of contamination. This would make the document more useful to a community. Response: All of the sources of impairments listed in Table 7-1 are addressed in either Table 8-1, the text of Section 8, or both. Because Table 7-1 and 8-1 serve slightly different purposes it was not intended that the tasks needed to align with and exactly address the eight sources of impairments.

92
18. Comment: While the text in sections 8.1-8.7 of each TMDL describe some actions that can address the sources in Table 7-1, the issue of failing infrastructure is only mentioned in a sub-section title and in the text, but not addressed in any detail. Response: Failing infrastructure is a very broad term, and is addressed, in part in such discussions as those on leaking sewer pipes, sanitary sewer overflows, and failed septic systems. It is outside of the scope of the TMDL documents to detail every possible type of infrastructure failure. Nonetheless, additional information is provided in the TMDL companion document titled: “Measures to Address Pathogen Pollution in Surface Waters: A TMDL Implementation Guidance Document for Massachusetts.” 19. Comment: There is a need for more specific information about what individual communities are currently doing and how much more effort is required (e.g., how many more miles of pipe need to be inspected for illegal connections in a specific community). Response: MassDEP and the EPA recognize that the municipalities have done, and are continuing to do, a tremendous amount of work to control bacterial contamination of surface waters. The TMDL provides some examples of that overall effort. The TMDL however is not designed nor intended to include an exhaustive listing of all the work required by each municipality to finalize this effort and provide a status of that work. However, some of the programs, such as Phase II Stormwater, require such status reports, and those will be very valuable in assessing priorities and future work. Phase II reports for each community are available through each City or Town and can be viewed at MassDEP. 20. Comment: There are no milestones to which individual communities should aim (e.g., all stormwater lines upstream of known contamination inspected for illegal connections in five years). As another example, Section 7.0 of each TMDL states that “The strategy includes a mandatory program for implementing stormwater BMPs and eliminating illicit sources” but it is not clear over what timeframe a community should be acting. Response: The timeframe for implementing corrective measures depends highly on the extent and source of the problem within each community, as such, it would be impossible to identify individual timelines within the TMDL. With that said however many timelines are established through the implementation of existing programs. For instance, the Phase II stormwater program required all communities to submit an application and plan in 2003. That plan must address the six minimum control measures and establish regulatory mechanisms to implement those measures by 2008. Status reports are developed annually to report their progress on achieving that goal. Actual implementation however will likely take many years. A second example would be the control of combined sewer overflows (CSO’s). Most municipalities are already under enforcement orders by EPA and/or MassDEP to develop and implement initial measures (commonly referred to as the Nine Minimum Controls (NMCs), and long-term control plans to address the issue. Since CSO discharges are defined as a point source under the Clean Water Act, an NPDES permit must be jointly issued by EPA and MassDEP for those discharges. The permit sets forth the requirements for implementation and assessment of the EPA mandated NMCs and the requirement for developing a

93
long-term CSO control strategy. Either the permit or an enforcement order will typically contain the schedules for completing that work. MassDEP recognizes that the addition of timelines in the TMDLs would appear to strengthen the documents, however, the complexity of each source coupled with the many types of sources which vary by municipality simply does not lend itself to the TMDL framework and therefore must be achieved through other programmatic measures. 21. Comment: Under “Control Measures” does “Watershed Management” include NPDES permitting? Response: “Watershed Management” is a general term used to assess and address water quality impacts associated with both point and nonpoint sources throughout an entire watershed. NPDES permitting is a primary tool used to address point source pollution such as permitted discharges from municipal wastewater treatment and industrial discharges. Stormwater is considered a point source if it comes from a pipe or other discrete conveyance system. Sheet flow of stormwater however is considered a nonpoint source. Additional tools used to address nonpoint sources include, but are not limited to, local education, and the use of best management practices like those outlined in this report. The Department also operates varies grant and loan programs to address both point and nonpoint sources of pollution. Application of these tools is considered part of the watershed management approach. 22. Comment: Absent from each report under “Who should read this document?” are the government agencies that provide planning, technical assistance, and funding to groups to remediate bacterial problems. Response: The introduction was edited to include these groups in a general sense. It is beyond the scope of the TMDL to provide an exhaustive list of agencies that provide funding and support. 23. Comment: For coastal watersheds the section that describes funding sources should include grant programs available through the Massachusetts Office of Coastal Zone Management. Response: Please refer to comment #22 above 24. Comment: Table ES-1 and the similar tables throughout the report do not list B (CSO) or as a surface water classification – this classification and its associated loadings allocations are missing. Although the footnote to the table refers to Long term CSO Control Plans, the relationship between the TMDL, LTCP, and the B (CSO) water classification are unclear. Response: The 1995 revisions to the MA Water Quality Standards created a B (CSO) water quality category by establishing regulatory significance for the notation “CSO” shown in the “Other Restriction” column at 314 CMR 4.06 for impacted segments. The B (CSO) designation was given, after public review and comment, to those waters where CSOs remain, but are compatible with water quality goals. A Partial Use Designation applies where total elimination of CSO’s was not

94
economically feasible and could lead to substantial and widespread economic and social impact and the impacts from remaining CSO discharges were minor. Although a high level of control must be achieved, Class B standards may not be met during infrequent, large storm events where the partial use designation applies. The goal of the TMDL and the long-term control plan is to minimize impacts to the maximum extent feasible, attain the highest water quality achievable, and to protect critical uses. Given this, the TMDL establishes in Table ES-1 (as well as other tables) the goal of meeting class B standards in CSO impacted waters, but recognizes that this criteria cannot be met at all times and therefore defers to the EPA and MassDEP approved long-term control CSO plan to define the infrequent occasions when the criteria may not be met. 25. Comment: The implementation of new bacteria water quality criteria into NPDES permits should be determined during the permit writing process rather than by the TMDL process – and that should be made clear in the TMDL document. Response: MassDEP agrees that implementation of new bacteria water quality criteria should be incorporated into the permitting process as well as the state Water Quality Standards. This is already the case. The criteria are also being included in the TMDL because it is a required element of the TMDL process. Readers / users of the bacteria TMDL reports should be aware that new water quality standards were recently developed in 2007 and are included in this final TMDL. 26. Comment: Coastal resources are significantly impacted from the stormwater run-off from Mass Highway roads. This goes beyond the control of municipalities to upgrade and is often beyond the capability of local groups to monitor. MHD (Massachusetts Highway Department) continues to evade stormwater standards and it is thus our opinion that MHD deserves special recognition, complete with implementation strategy to upgrade the drainage systems along its web of asphalt. Response: Mass Highway is included in the Stormwater Phase II Program, and as such will be responsible for completing the six minimum controls mandated by that program, i.e., public education and outreach, public involvement and participation, illicit discharge detection and elimination, construction site stormwater runoff control, post construction stormwater management, and good housekeeping in operations. 27. Comment: The current 303d list of impaired waters – is it the 2002 or the 2004 list ? Response: Since the draft of this report was produced, the final 2008 list. All of the pathogen TMDLs apply to the current 2008 303d list and all future EPA approved 303d lists. 28. Comment: Does the NPDES nondelegated state status of Massachusetts affect the TMDLs in any way? Response: No. The MassDEP and EPA work closely together, and the nondelegated status will not affect the TMDLs. The EPA has not written any of the pathogen TMDLs, but has helped fund them.

95
29. Comment: The TMDL report does not tell the watershed associations anything they didn’t already know. Response: True. The MassDEP is taking a cooperative approach and by working together as a team (federal, state, local, watershed groups) we can make progress in addressing bacterial problems – especially stormwater related bacterial problems. Establishment of the TMDL however provides higher priority points in MassDEP funding programs to issue grants and loans for qualified projects to address priority areas. 30. Comment: What will the MassDEP do now for communities that they have not already been doing? Response: Grants that can be used for implementation (such as the 319 grants) will be targeted toward TMDL implementation. Also, the more TMDLs a state completes and gets approved by EPA, the more funding it will receive from EPA and thus the more TMDL implementation it can initiate. 31. Comment: The State Revolving Fund (SRF) should support municipalities with TMDLs and Phase II status a lot more. Response: As with any grant/loan program, there are some very competitive projects looking for funds from the SRF. A lot of these are the traditional sewage treatment plants and sewering projects which are very expensive. The SRF currently does allocate funds to stormwater related projects as well, and additional priority points are awarded in the SRF program where a project addresses waters identified on the state 303d list as well as where TMDLs have been established by either MassDEP or EPA.. 32. Comment: Who will be doing the TMDL implementation? Response: Each pathogen TMDL report has a section on implementation which includes a table that lists the various tasks and the responsible entity. Most of the implementation tasks will fall on the authority of the municipalities. Probably two of the larger tasks in urban areas include implementing stormwater BMPs and eliminating illicit sources. The document “Mitigation Measures to Address Pathogen Pollution in Surface Water: A TMDL Implementation Guidance Manual for Massachusetts” was developed to support implementation of pathogen TMDLs. The MassDEP working with EPA and other team partners shall make every reasonable effort to assure implementation of the TMDLs. 33. Comment: Several watershed groups believe that active and effective implementation and enforcement is essential to carry out the objectives in the pathogen TMDLs. They define effective implementation as the MassDEP partnering with them and municipalities to identify funding opportunities to develop stormwater management plans, implement Title 5 upgrades, and repair failing sewer infrastructure. The groups define effective enforcement as active MassDEP application

96
of Title 5 regulations and implementation of Stormwater Phase II permitting requirements for Phase II municipalities. Response: The MassDEP has every intention of assisting watershed groups and municipalities with implementing the high priority aspects of the pathogen TMDLs, including identification of possible funding sources. With respect to Title 5 regulations and the Phase II program requirements, the MassDEP will continue to emphasize and assist entities with activities that lead to compliance with those program requirements. 34. Comment: The MassDEP Division of Watershed Management (DWM) should network implementation planning efforts in the coastal watersheds with the Coastal Zone Management’s (CZM) Coastal Remediation Grant Program and the EPA Coastal Nonpoint Source Grant Program. Also, the DWM should make the pathogen TMDL presentation to the Mass Bays Group, and network with them in regards to coordinating implementation tasks. Response: The MassDEP DWM has every intention to coordinate efforts wherever possible including those identified by the commenter. 35. Comment: Why are specific segments or tributaries of watersheds addressed in the Draft TMDL but not all of the segments? Response: In accordance with the EPA regulations governing TMDL requirements, only segments that are included on the state’s 303(d) list of impaired waterbodies (category 5 of the state Integrated List of Waters) need to be included in any TMDL. It should be noted, however, that addressing other segments which presently are not listed is appropriate as well. 36. Comment: When a TMDL is developed for waters impaired by both point and nonpoint sources, and the WLA is based on an assumption that nonpoint source reductions will occur, EPA’s 1991 TMDL Guidance states that the TMDL should provide reasonable assurances that nonpoint source control measures can achieve expected load reductions in order for the TMDL to be approvable. Response: Section 10.0, Reasonable Assurances, provides these assurances. This section has been drastically expanded in the Final version of the Draft Pathogen TMDL reports. The revised section 10.0 describes all of the appropriate state programs and their enabling statutes and relevant regulations which actively address nonpoint source pollution impacting waters of the Commonwealth. Many of these programs involve municipalities as a first line of defense mechanism, such as the Wetlands Protection Act (which includes the Rivers Protection Act).This expanded section also covers grant programs available to municipalities to control and abate nonpoint source pollution such as 319 grants, 604b grants, 104b(3) funds, 6217 coastal nonpoint source grants, low interest loans for septic system upgrades, state revolving fund grants, and many others. 37. Comment: The Draft TMDLs indicate that for non-impaired waters the TMDL proposes “pollution prevention BMPs”. The term is not defined in any state regulation and the origin of the term is unclear.

97
Response: An explanation of pollution prevention BMPs can be found in the pathogen TMDL companion document “Mitigation Measures to Address Pathogen Pollution in Surface Waters: A TMDL Implementation Guidance Manual for Massachusetts”. Section 3.1 of that manual describes pollution prevention as one of the six control measures for minimizing stormwater contamination under the EPA Phase I or II Stormwater Control Program. Control Measure #6, “Pollution Prevention / Good Housekeeping” involves a number of activities such as maintenance of structural and nonstructural stormwater controls, controls for reducing pollutants from roads, municipal yards and lots, street sweeping and catch basin cleaning, and control of pet waste. Also the term “pollution prevention” can include a far wider range of pollution control activities to prevent bacterial pollution at the source. For instance, under Phase I and II, minimum control measures #4 and #5, construction site and post construction site runoff controls, would encompass many pollution prevention type BMP measures. Proper septic system maintenance and numerous agricultural land use measures can also be considered pollution prevention activities. Further information may be found in Sections 3.0, 4.0, and 5.0 in the Guidance Manual. 38. Comment: EPA regulations require that a TMDL include Load Allocations (LAs) which identify the portion of the loading capacity attributed to existing and future nonpoint sources and to natural background. Load allocations may range from reasonably accurate estimates to gross allotments (40 C.F.R. s.130.2(g)). Where possible, load allocations should be described separately for natural background and nonpoint sources. The Draft TMDL makes no such allocation. Also, EPA regulations require that a TMDL include Waste Load Allocations (WLAs) which identify the portion of the loading capacity allocated to individual existing and future point sources. The Draft TMDL makes no such allocation. Because it makes no estimate of the TMDL, it makes no WLA for point sources. Response: This comment (and several others which addressed the same topic) relates to the establishment and allocation of an acceptable pollutant load so that water quality standards can be met and maintained. As touched upon elsewhere in this document, TMDLs can be expressed in a variety of ways so long as they are rational. Section 7 has been expanded to include load allocations in addition to the concentration based approach. However, MassDEP has chosen to use concentration as the primary metric for bacteria TMDLs for several reasons. First, there is a numeric standard that can be used. Second, and more important, bacteria, unlike some other pollutants, can increase with flow rather than decrease. As such, the bacteria load applicable at low flow (7Q10) would be very stringent if applied to higher flows. In essence, this TMDL recognizes that higher loads are likely at higher flows and therefore the emphasis is on meeting the in-stream water quality rather than on meeting a load established for low flows as is done for most other constituents. Hence the TMDL is based on concentration rather than loads of bacteria expressed either as pounds or as daily loads. Again, in contrast to many other pollutants, higher flows may not mean more dilution in the case of bacteria. This approach for bacteria still accepts that site specific information can result in site specific control strategies that modify the general TMDL framework presented provided that water quality standards for bacteria are achieved. Nonetheless, MassDEP has included load allocations in the final TMDL based on the annual average precipitation anticipated in the Taunton River area and an estimate of the average daily runoff based on long-term precipitation records (see revised Section 7).

98
Watershed Specific Comments from CZM 1. Comment: p. ii, Under “Control Measures,” does “Watershed Management” include NPDES permitting? If not, NPDES stormwater and point source permitting are certainly valuable bacterial control measures and should be included under “Control Measures.” Response: Please refer to Comment # 21 and its response in the General Comments Section just above. 2. Comment: p. iii, First Paragraph, Executive Summary, “Illicit discharges of boat waste” should be changed to “Discharges of inadequately treated boat waste” because people using small boats (those under 65’) with a Type I Marine Sanitation Device attached to the head can legally discharge waste with up to 1000 CFU/100 ml, well above the state standard for SA and SB waters. A similar change should be made to p. 28 (Section 5.0) where illicit boat discharges are mentioned as a dry weather source. Response: We have made the suggested changes. 3. Comment: p. iii, Absent from the “Who should read this document?” are the governmental agencies that provide planning, technical assistance, and funding to groups to remediate these problems. CZM recommends adding such language. Response: The following has been added to the document on p. iii: “(e) government agencies that provide planning, technical assistance, and funding to groups for bacterial remediation”. 4. Comment: p. vi, Table ES-1, It isn’t clear what the difference is between “Waste Load Allocation and “Load Allocation.” The distinction is not made until pp. 33 (Section 6). CZM suggests making this distinction earlier (e.g., in footnote 1 of Table ES-1). Response: Table ES-1 that you refer to in the Draft Report has been changed to Table ES-2 in the Final Report. For the definitions of Waste Load Allocation and Load Allocation, please refer to Comment #1 and its response in the General Comments Section just above. In direct response to your comment, we have added brief statement definitions of WLA and LA to the first paragraph, pp xiv, following the footnote explanations for Table ES-2. Additionally, these terms are defined and discussed in much greater detail in Section 7, Pathogen TMDL Development. 5. Comment: Please note that some figures did not display in the PDF format: Fig. 1-1, 2-1, 2-2, and Appendix A did not appear. Response: The final submittal have been checked to insure that figures are legible in both the pdf and word versions, and that the appendices are complete. 6. Comment: p. 31, Section 5.0, In the discussion of boat waste disposal, CZM suggests changing

99
“…MSDs may discharge sewage in concentrations higher than allowed in ambient water for fishing or shellfishing” to “MSDs may discharge sewage in concentrations higher than allowed in ambient water for shellfishing or primary and secondary contact recreational activities.” Swimming and other primary contact activities should be included as activities that may be impaired by boat sewage disposal. Response: We have made that change. 7. .Comment: pp. 33-39 Section 6.1, There is no discussion of load allocations to SB-CSO waters or waters that are under a variance. If a waterbody is currently under a variance from water quality standards for bacteria, will the TMDL standards on p. 34 nullify the variance? Regarding this issue, the following sentence from the bottom of p. 35 should probably be noted on p. 34 “The specific goal for controlling discharges from combined sewer overflows (CSOs) will be based on the site specific studies embodied in the Long Term Control Plan being developed by each community with combined sewers.” Response: Please note that Section 6 of the Draft Report has been changed to Section 7 in the Final Report. Also, this section in the Draft report has been reorganized in the Final Report, with Water Quality Standards information from the Draft Report (pp 34) incorporated into Table 7-1, ‘Waste Load Allocations (WLAs) and Load Allocations (LAs)’ in the Final Report. In Table 7-1, (also in Table ES-2 in the Executive Summary Section), under column “Surface Water Classification”, footnote SB10 refers to your comment above, “The specific goal for controlling discharges from combined sewer overflows (CSOs) will be based on the site specific studies embodied in the Long Term Control Plan”. Footnote SB10, in Table 7-1, denotes (at the bottom of the page): ‘SB segments designated as CSO, as having a long term control plan in place that is compatible with water quality goals’. Water bodies covered by this TMDL will not require a variance. Also, please refer to Comment # 24 and its response in the General Comments Section just above for further explanation on the variance issue of B (CSO). 8. Comment: p. 40, Section 6.3 “Seasonal Variability”, last sentence, The following sentence suggests that primary contact does not take place in winter months: “However, for discharges that do not affect shellfish beds, intakes for water supplies and primary contact recreation is not taking place (i.e., during the winter months) seasonal disinfection is permitted for NPDES point source discharges.” However, surfing occurs in many of the Commonwealth’s waters year-round. CZM suggests removing this sentence (i.e., the last sentence of Section 6.3) or editing it to: “However, for discharges that do not affect shellfish beds, intakes for water supplies and where primary contact recreation does not take place, seasonal disinfection is permitted for NPDES point source discharges.” Response: Please note that the section on “Seasonal Variability” is Section 7.6 of the Final Report. We will amend the last sentence of this section as you suggest by removing the part, ‘i.e., during the winter months’.

100
9. Comment: p. 42, Table 7-1, While this table lists the Tasks that the agencies (DEP/EPA) believe need to be achieved, it isn’t clear exactly how these tasks line up with and address the eight sources of impairment listed in Table 6-1. While some of the text in sections 7.1-7.7 describes some actions that can address the sources in Table 6-1, again there is no direct connection and some issues are not addressed at all (e.g., failing infrastructure is mentioned in the title of 7.3 but not addressed in the text). CZM recommends that the final TMDL be more specific and couple the Implementation Plan tasks with the known or expected sources of contamination. This would make the document more useful to a community. There is also a need for more specific information about what individual communities are currently doing and how much more effort is required (e.g., how many more miles of pipe need to be inspected for illegal connections in a specific community). In addition there are no milestones to which individual communities should aim (e.g., all stormwater lines upstream of known contamination inspected for illegal connections in five years). As another example, on p. 54 (Section 7.0) it is stated that “The strategy includes a mandatory program for implementing stormwater BMPs and eliminating illicit sources” but it is not clear over what timeframe a community should be acting. It would be helpful to the communities trying to implement this plan if the Department were to provide a short list of probable sources of impairment in each community for each of the impaired segments so that funds could be allocated to specific BMPs or other remedial actions in those segments. For example, Table 5-1 should be expanded to include the responsible communities and should be referenced in the Implementation section. Suggesting that more data be collected in certain areas would also be helpful. Response: With regard to issues raised in paragraph #1, (i.e., Tasks in Table 7-1 lining up with sources of impairment listed in Table 6-1), please refer to Comment # 17 and its response in the General Comments Section just above. Please note that the Table 7-1 and Table 6-1 that you refer to in the Draft Report, have been changed to Table 8-1 and Table 7-1 in the Final Report. With regard to specific milestones to be achieved, as well as the need to identify infrastructure, and implementation activities in specific communities mentioned in this comment, please see the next four paragraphs below. First, with regard to infrastructure and implementation activities, it should be pointed out that the overall Section 8, Implementation, in the Final Report submittal, has been significantly updated and enhanced from the original Draft Report submittal. Specifically, considerable discussion has been added in Section 8, Subsection 8.2, on the infrastructure accomplishments of both the Cities of Taunton and Fall River in regards to improvements at the overall Wastewater Treatment facilities, as well as development and implementation of Long Term Control Plans for Combined Sewer Overflow discharges (CSOs) for both municipalities. These two municipalities contributed significant bacteria loadings to the Taunton River in the past, and the recent infrastructure improvement programs have no doubt considerably lowered overall bacteria pollution loadings to the Taunton mainstem. Subsection 8.2 also discusses the concept of Illicit Discharge Detection and Elimination (IDDE), including EPA and MassDEP policies, and protocols, as well as suggested steps for municipalities to

101
more effectively activate effective control plans in this regard. Subsection 8.2 also outlines the EPA Phase II Stormwater (MS4) Program components. Subsection 8.3 on Stormwater Runoff contains detailed updates of the implementation activities and accomplishments for each MS4 community included under the Phase II Stormwater program. Additionally, Section 10, Reasonable Assurances, provides supportive information on financial resources and tools available for addressing pollution problems once these are identified in the communities. In addition to being more specific and detailed on implementation activities, please refer to Comments # 19 and #20 and their responses in the General Comments Section just above. As the text in the General Comments Section, # 19 suggests, it is impossible for this TMDL to identify all significant underlying bacteria water quality problems, and thereby, all the work that would be necessary to resolve all these problems for every community in the watershed. As already indicated, the Final TMDL version has added considerable information (in Section 8), as well as additional water quality data and information (in Section 4), to better identify specific pollution problems and their magnitude in the various communities. With this added information, and the detailed discussion of resources and tools available to communities to address pollution problems in Section 10, Reasonable Assurances, proper identification and resolution of bacteria pollution problems should be made more expeditiously in the communities. Also note that Section 7.0 that you refer to in the Draft Report has been changed to Section 8.0 in the Final Report. With regard to the concern that more data should be gathered in certain areas, please refer to Section 9, ‘Monitoring Plan’, of the Final Report. This outlines suggestions for future monitoring efforts and what the monitoring goals should be. Also, available data utilized for this particular TMDL report is outlined in Section 4, ‘Problem Assessment’, along with suggested references where additional data and information for the watershed can be accessed. Additionally, in Section 8, ‘Implementation’, Table 8-1 outlines possible organizations besides MassDEP who could potentially gather data. Other parts of Section 8 suggest the need for additional monitoring following the incorporation of pollution reduction implementation BMPs in specific communities in the watershed. 10. Comment: p. 45, Section 7.7, last sentence, please change this sentence to read “Massachusetts State Representative Bill Strauss has introduced legislation that would clearly define the role of harbormasters and other coastal police officers in enforcing NDAs and would allow them to collect up to $2000 for violations in NDAs.” Response: We have made that change. Please note that Section 7.6, ‘Recreational Waters Use Management’ (not Section 7.7 as you suggest) in the Draft Report has been changed to Section 8.6 in the Final Report. 11. Comment: p. 47, Section 8, item 5, It isn’t clear who is expected to collate the data collected throughout the Taunton River watershed and where the data would be stored. Is the Department expected to fill this role? Response: Item #5 refers to MassDEP collecting data for Water Quality Assessment and related planning purposes. MassDEP does not anticipate fulfilling the role of gathering, storing, and putting

102
into a report format all other water quality data in the watershed gathered by other organizations and entities besides MassDEP. MassDEP periodically monitors (on a five year rotating basis) the Waters of the Commonwealth. The MassDEP generated data will be stored in its own specifically developed database. Data that are generated outside of MassDEP are generally utilized for assessment purposes, subject to properly developed QAPPs. 12. Comment: p. 47, Section 9, After the sentence “Financial incentives include Federal monies available under the CWA Section 319 NPS program and the CWA Section 604 and 104b programs, which are provided as part of the Performance Partnership Agreement between MADEP and the EPA” CZM requests that the Department add: “State monies are also available through the Massachusetts Office of Coastal Zone Management’s Coastal Pollutant Remediation, Coastal Nonpoint Source Pollution Control, and Coastal Monitoring grant programs. The primary goal of all three programs is to improve coastal water quality by reducing or eliminating nonpoint sources of pollution.” Response: We have added those two sentences to that paragraph in the Final Report. Please note that Section 9, Reasonable Assurances in the Draft Report has been changed to Section 10 in the Final Report. It has also been significantly expanded.