Embed Size (px)
Citation preview

0

1
Index
Chapters No. Contents Page
No.
1 General Information of District 3
1.1 Introduction and Historical Background 4
1.2 Location 5
1.3 Demographic profile 7
1.4 Livestock 9
1.5 Agro-ecology, Climate, Hydrology, and Topography 11
1.6 Rainfall and Run off 13
1.7 Soil profile 14
1.8 Block wise Soli type 16
1.9 Land Use Pattern 17
1.10 Soil Erosion and Runoff Status 19
2 Pradhan Mantri Krishi Sinchayee Yojana 20
2.1 Introduction 21
2.2 Background 21
2.3 The Objectives of PMKSY 22
2.4 Strategy 22
2.5 Methodology 23
2.6 Steps followed 23
3 District Water Profile 25
3.1 Area wise, Crop wise irrigation status 26
3.2 Production & Productivity of Major Crops 30
3.3 Irrigation based Classification 31
3.4 Source wise Irrigated area 32
4 Water Availability 33
4.1 Status of water availability 34
4.2 Status of ground water availability 36
4.3 Status of command Area 37
4.4 Existing type of Irrigation 38
5 Water requirement and demand 39
5.1 Domestic water demand 40
5.2 Crop water requirement 42
5.3 Livestock water demand 47
5.4 Industrial water demand 48
5.5 Total water demand of the district for various sectors 49
5.6 Water Budget 50
6 Block wise Strategic Action Plan for Irrigation 51
6.1 Rajgarh 52
6.2 Khilchipur 53
6.3 Jirapur 54
6.4 Biaora 55

2
6.5 Narsinghgarh 56
6.6 Sarangpur 57
7 Strategic Action Plan for Irrigation of District Rajgarh 58

3
CHAPTER-1
General Information of the District

4
1 GENERAL DESCRIPTION OF DISTRICT:
1.1 Introduction and Historical Background
The District takes its name from the headquarters town Rajgarh. Rajgarh
District was constituted after the formation of Madhya Bharat in May, 1948. Prior to this
the area of the present District was parceled out among the States of Rajgarh,
Narsinghgarh, Khilchipur, Dewas (Senior) Dewas (Junior) and Indore. Rajgarh was the
headquarters of a mediatised State, ruled by the Umath Rajputs and branch of the great
Paramar clan; they enjoyed a Sanad Estate under the Sultans of Delhi and Mughal
emperors in succession. The first capital was Duparia, now in Shajapur District. Later on it
was shifted to Dungarpur (19 Km from Rajgarh) and then to Ratanpur (19 Km. west of
Narsinghgarh) and back. In order to avoid disturbance by the frequently passing Mughal
armies, the Ruler of the Estate, Mohan Singh, acquired the present side, originally known
as Jhanjhanipur from the Bhils in A.D. 1640. Finally he shifted the headquarters in the
year1645, giving the place its present name.
During the reign of Akbar (A.D. 1556-1605) a Khilat and a Sanad were
granted to Udaji of Tatanpur. At that time, Sarangpur was a Sarkar in the Subah of Malwa.
Its jurisdiction extended from the western part of present Sehore District to the eastern part
of Ujjain District. Among its twenty four mahals many have retained their original names
and are identified as Ashtah, Talain (Talen), Agra (Agar), Bajilpur (Bijilpur), Bhorsah,
Khilchipur, Jirapur, Sarangpur, Sondarsi (Sundarsi), Sosner (Sunner) Sajapur, Kayatha and
Navgam (Tarana). In 1908, Rajgarh State was divided in to seven Parganas, namely
Newalganj, Biaora, Kalipith, Karanwas, Kotra, Seogarh and Talen. Narsinghgarh State
was divided into four Parganas, namely Huzur (Narsinghgarh), Pachor, Khujner and
Chhapera. The Parganas were place in the charge of a Tahsildar each for revenue matters
and magisterial work. Khilchipur State was divided into three Paraganas. Sarangpur was as
now, the tahsil headquarters of Dewas (Senior) and Dewas (Junior) States. Jirapur was a
tahsil of Mahidpur District of former Indore State. It has now been abolished and merged
in Khilchipur tahsil.
In 1645 with the permission of Rajmata, Deewan Ajab Singh defeated the
Bhils in the hilly region of Rajgarh and he constructed a Palace in 1745 which was having
five main gates namely, Itwaria, Bhudwaria, Surajpol, Panradia and Naya Darwaja. And it
constitutes three very ancient temple namely Raj Rajeshwar Temple, Chaturbhujnathji
Temple and Narsingh Temple, and in which Rajmata and his 15 year old son Rawat
Mohan singh was living safely. In Jhanjharpur which was capital and it is having a palace
due to which this place is known as Rajgarh and it had become famous.

5
1.2 Location
Rajgarh District is located in the Northern part of Malwa Plateau. It forms the
North Western part of Division of Bhopal Commissioner. Rajgarh District extends between the
parallels of Latitude 23027' 12" North and 24
017' 20" North and between the meridians
of Longitude 76011' 15" and 77
014' East. It has a Quadrangular shape with the Northern and
Western sides longer than the Southern and Eastern sides respectively. The zigzag boundaries of
the District resemble a pear. Rajgarh District is bounded by Shajapur District in the South as well
as west. The District of Sehore, Bhopal, Guna and Jhalawar (Rajasthan) enclose it from the
South-East, East, North-East, and North directions respectively. The district headquarters is
situated at the bank of river Nevaj and linked with National Highway No. 12. (the Jaipur
Jabalpur Road) There are six development blocks and seven Tahasils in the district. The total
Geographical area of the District is 6,154 sq.km. with a population of 15,45,814 according to
census 2011. It is one of the small districts of Madhya Pradesh both in respect of area and
population. It is 145 KMs from the State capital Bhopal.
Table 1.2.1 Block wise GPS Locations
S. no. Block Latitude Longitude
1 Rajgarh 23042' - 24
010' 76
032' - 76
055'
2 Khilchipur 23055' - 24
018' 76
026' - 76
042'
3 Jirapur 23051' - 24
014' 76
011' - 76
030'
4 Biaora 23048' - 24
005' 76
045' - 77
010'
5 Narsinghgarh 23028' - 23
046' 76
045' - 77
010'
6 Sarangpr 23029' - 23
052' 76
002' - 76
047'

6
Rivers in Rajgarh district:
Entire district area comes under Chambal River basin. There are two major rivers
Parvati and Kalisindh flow through the district. River Parvati flows independently and falls in
Chambal River, on other hand river Kalisindh, Nevaj, Ghodapachad, Ajnar, Dudhi, Chapi and
Ghadganga are tributaries.
Table 1.2.2 Rivers in Rajgarh district S.
No.
Name of River Catchment area in
Squire Kilometres
Percent of
Catchment area
Length of River in
Kilometres
1 Parvati 720 11.77 83.20
2 Kalisindh 990 16.19 99.20
3 Nevaj 2350 38.42 142.40
4 Ghodapachad 385 6.30 33.80
5 Ajnar 494 8.08 72.00
6 Chapi 586 9.58 41.82
7 Gadganga 591 9.66 48.00
Ongoing Major Irrigation projects:
There are two major Irrigation Projects named Kundaliya and Mohanpura
multipurpose projects. These projects are under construction. Kundaliya project is on river
Kalisindh and Mohanpura is getting constructed on river Nevaj. Once complete will provide
irrigation to area of 1.95 lakh hectare.
Ongoing Minor Irrigation projects:
At present Bankpura and Mundla two Minor Irrigation projects are under
construction. The Bankpura Minor Irrigation project is getting constructed on river Ghodapachad
and Mundla Minor Irrigation project is getting constructed on river Ajnar. On completion the
Irrigated area will be 3980 ha. through these projects. Bankpura project also provide the facility
of 4.5 MCM water for drinking supply and 5 MCM water for Industrial use.

7
1.3 Demographic Profile
District Rajgarh has total population 1545814 as per census 2011. The literacy
level in the district is 61.21%. The total SC and ST population comes in tune of 22.60% in the
district as per census 2011. Table 1.3 Demographic profile (Sources : Census 2011)
S.no. Indicators Status
1 Total Population 1545814
Male 790212
Female 755602
SC 295718
ST 53751
Urban 276457
Rural 1269357
Sex ratio 971
Population Growth 26.24%
Population Density 251/sq km
2 Literacy Total 61.21%
Male Literacy 69.53%
Female Literacy 37.37%

8
Fig. 1.3

9
1.4 Livestock
Livestock is very important source of income district. Rural economy in the district is highly dependent upon its
livestock. Indigenous cow and Descriptive buffalo is the main source of Milk in the area. In totality the higher number of milk
producing animals (939944) as compared to other meat producing and small animals (195345) can easily be seen in the district. On the
other hand in the areas of low agricultural production like block Khilchipur, Rajgarh and Jirapur the small animals especially Goat
rearing is very much in trend. Poultry farming is done in the areas where there is a good market available. Poultry in increasing as an
alternate to the crop farming in the areas of block Rajgarh, Narshinghgarh and Sarangpur. Being close to Bhopal Poultry farming is
done in Narsinghgarh most. Other Small animals like Ducks, Pigs and Sheep are other lives stock available in a small quantity in the
district.
Table 1.4 Livestock of district S.
no.
Name of Block Small Animals Large Animals Any
other
milch
or
meat
animal
Nos.
Draft
animal
(Baffallo/
yak/
Bulls/ any
other
Nos.
Poultry
Nos.
Duc
ks.
Nos.
Pigs
Nos.
Goat
Nos.
Sheep
Nos.
Indigenous
cow Nos.
Hybrid
Cow
Nos.
Descriptive
Buffalo
Nos.
Hybrid
Buffalo
Nos.
1 Rajgarh 6465 9 766 31035 208 81977 380 82921 0 0 147
2 Khilchipur 454 0 294 22932 951 67713 124 74036 0 0 886
3 Jirapur 616 0 270 31065 109 40161 13 73946 0 0 355
4 Biaora 1899 1 253 22402 17 61236 512 91735 0 0 22
5 Narshinghgarh 9214 3 1139 23606 8 60086 8471 116303 0 0 83
6 Sarangpur 4603 0 1055 35955 16 67642 2895 109793 0 0 91

10
Fig. 1.4 Livestock in Rajgarh District:

11
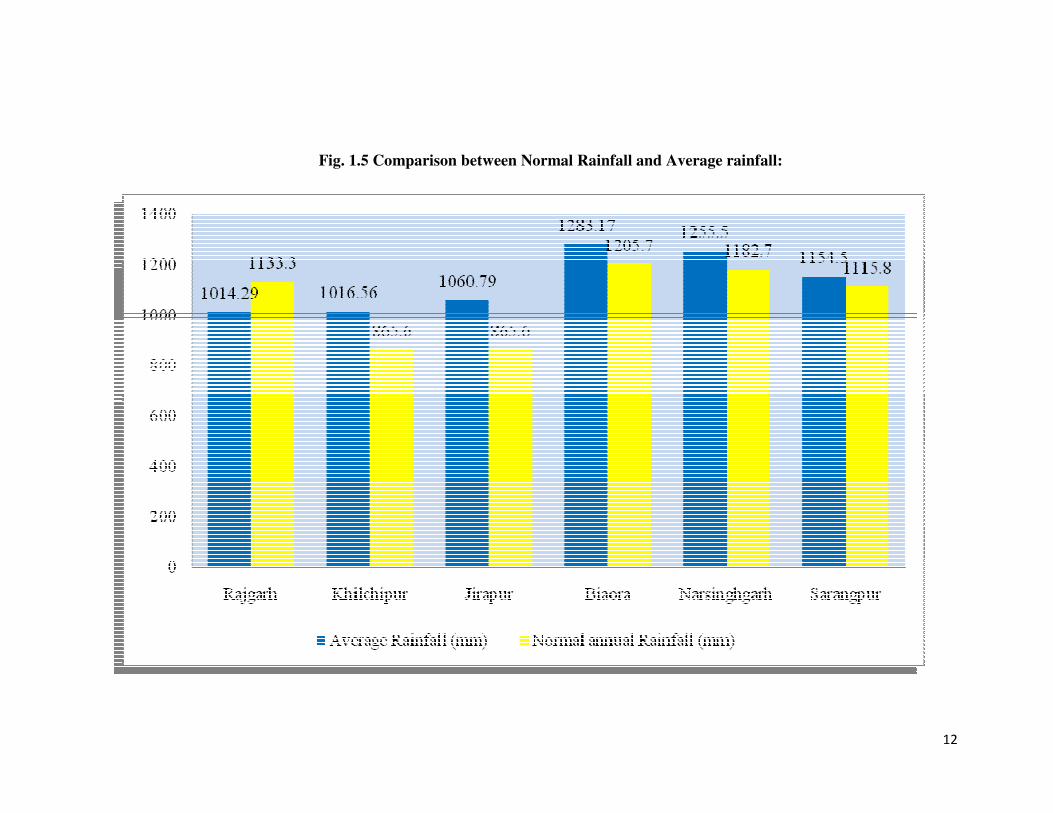
1.5 Agro-ecology, Climate, Hydrology, and Topography
The district is part of central high land of Malva plateau with Basalt rocks. The Average rainfall in the district is 1107
mm. Comparison of Average rainfall for last 10 years with the normal rainfall shows that in block Rajgarh the average rainfall is less
than Normal rainfall. In other blocks average rainfall is more than normal rainfall. The average number of rainy-days in the district is
51. In summer season the temperature reaches up to maximum 43° C and goes minimum 23°C. In winter the maximum temperature
remains up to 35°C and Minimum touches 7° C. The rainy seasons are quite humid and maximum temperature reaches up to 44° C
and Minimum 19°C in the district.
Table 1.5 Block wise Agro climatic Zone, Normal & Average Rainfall and Temperature
S.
no.
Block Agro
Climatic
Zone
Block
Area
Normal
annual
Rainfall
(mm)
Average
Rainfall
(mm)
No.
Of
Rainy
Days
(no.)
Average temperature (°C)
Summer (April-
May)
Winter (Oct-Mar) Rainy (June-Sept)
Min. Max. Mean Min. Max. Mean Min. Max. Mean
1 Rajgarh Malva
Plateau
110510 1133.3 1014.29 51 27 42 34.5 7 34 20.5 20 44 32
2 Khilchipur 79214 865.6 1016.56 49 24 42 33 7 35 21 22 44 33
3 Jirapur 84534 865.6 1060.79 49 24 41 32.5 8 34 21 23 43 33
4 Biaora 114764 1205.7 1283.17 51 24 42 33 8 34 21 22 44 33
5 Narsinghgarh 134863 1182.7 1255.5 52 23 43 33 8 34 21 19 43 31
6 Sarangpur 92224 1115.8 1154.5 52 24 43 33.5 9 35 22 19 43 31
12
Fig. 1.5 Comparison between Normal Rainfall and Average rainfall:

13
1.6 Rainfall and Run off
The following table shows the position of block wise rainfall in the district. There is 6249.132 MCM water available
for the district as rainfall and 3749.479 MCM water is lost. Out of this rainfall only 2499.653 is available for harvesting in the district.
Table 1.6 Rainfall and Run off
S.no. Block Geographical
Area (ha.)
Rainfall
(mm.)
Total Rain water available Water Loses
(MCM)
Availability of
water for
Harvesting
(MCM)
Remark
Ha. mt. MCM
1 Rajgarh 110510 1014.29 112089.2 1120.892 672.5351 448.3568
2 Khilchipur 79214 1016.56 80345.97 803.4597 482.0758 321.3839
3 Jirapur 84534 1060.79 85741.99 857.4199 514.4519 342.968
4 Biaora 114764 1283.17 116404 1164.04 698.4239 465.6159
5 Narsinghgarh 134863 1255.5 136790.2 1367.902 820.7412 547.1608
6 Sarangpur 92224 1154.5 93541.88 935.4188 561.2513 374.1675
Total 616109 624913.2 6249.132 3749.479 2499.653
Fig. 1.6 Block wise total rainfall, water loss and available water for harvesting.

14
1.7 Soil Profile
Rajgarh district is situated on the
Northern East part of the Malwa region. The district can
be distributed into three major parts according to soil
type. The soil types are Medium to Deep Black Soil,
Shallow Black soil and Gravelled mixed. 54% of the
area is having Medium to deep black soil covering the
blocks Sarangpur, Narsinghgarh, Biaora, and parts of
Rajgarh, Khilchipur and Jirapur. Shallow black soil
covers 17% area in the district. Gravelled Mixed soil
covers area of 29% in mostly Rajgarh, Khilchipur and
Jirapur.
Slope up to 8-25% is found in the areas
specially covered by Gravelled Mixed soil which is 13%
of the total district area. 17% of the land is having 3-8%
slope which is also found in the areas of Gravelled
Mixed soil. 70% of the area in the district is having 0-
3% slop which is mostly covered by Medium to deep
black soil.
Table 1.7 Soil type and land slope
Soil Type Land Slope
Major Soil
Classes
Area (ha) 0-3%(ha) 3-8%(ha) 8-25%(ha) >25%(ha)
Medium to
Deep Black
Soil
328250.00 328250.00 0.00 0.00 0.00
Shallow
Black Soil
101820.00 94820.00 0.00 0.00 0.00
Gravelled
Mixed
178960.00 0.00 100000.00 78960.00 0.00
District Total 609030.00 423070.00 100000.00 78960.00 0.00

15
Fig. 17

16
1.8 Block wise area based on Soil type
Following table shows block wise distribution of soil in the district. The data shows that Medium
to Deep Black soil covers a very large part of block Sarangpur and Narsinghgarh 80% and 70%
respectively, Shallow Black Soil is found 15% in Sarangpur and 25% in Narsinghharh and only
5-5 percent Gravelled Mixed soil is found in the two blocks. In block Jirapur and Biaora Shallow
Black Soil is found up to 70%, Medium to Deep Black Soil is only 10- 10 percent and Gravelled
Mixed is found 20-20 percent in Jirapur and Biaora blocks. In block Rajgarh and Khilchipur
Gravelled Mixd soil covers 60% and 70% of the area respectively, whereas Shallow Black Soil
covers 35% in Rajgarh and 30% in Khilchipur, Medium to Deep Black Soil has cover of only 5%
in Rajgarh block but Medium to Deep Black Soil is not found in Khilchipur Block.
Table 1.8 Soil type in percent
S.
no.
Type of
Soil
Rajgarh Khilchipur Jirapur Biaora Narsinghgarh Sarangpur
1 Medium to
Deep Black
Soil
5 0 10 10 70 80
2 Shallow
Black Soil
35 30 70 70 25 15
3 Gravelled
Mixed
60 70 20 20 5 5
Total 100% 100% 100% 100% 100% 100%
Fig 1.8 Block wise Soil type

17
1.9 Land Use Pattern
There are 1728 villages in the district with total geographical area of 616109 hectares. The area
under forest is 17627 hectares, waste land is 83936 hectares and area under other uses is 75435
hectares.
The gross cropped area in the district is 785002 hectares out of which the net sown area is
439102 hectares and the area sown more than once is 345900 hectares. The cropping intensity is
178.8%. The largest gross cropped area is found in block Narsinghgarh with 205053 hectares and
on the other hand the Gross cropped area is block Khilchipur only 87211 hectares which is
117842 hectares less then Gross cropped area in block Narsinghgarh.
The Cropping intensity in Narsinghgarh and Sarangpur blocks is highest with 191.5% and
182.8% respectively in the district. And Rajgarh block is lowest at 162.7% Cropping intensity at
compared with other blocks in the district.
Block Narsinghgarh has the largest forest cover of 7033 hectare, block Jirapur and Sarangpur has
no forest. After Narsinghgarh block Biaora has 6121 hectares of forest Rajgarh and Khilchipur
block have 3034 hectare and 1439 hectare forest area respectively.
In block Rajgarh 20765 hectare land is used under other uses.
Table 1.9 Land use Pattern S.
no.
Block No. Of
Village
Total
Geographical
Area Ha.
Area Under Agriculture Cropping
intensity
in %
Area
Under
Forest
Ha.
Area
under
waste
land
Ha.
Area
under
other
uses
Ha.
Gross
Cropped
Area (1)
Net
Sown
Area
(2)
Area
Sown
more
than
once
(1-2)
1 Rajgarh 388 110510 109496 67296 42200 162.7 3034 14508 20765
2 Khilchipur 335 79214 87211 50211 37000 173.7 1439 18281 7304
3 Jirapur 220 84534 102818 58618 44200 175.4 00 14760 14463
4 Biaora 287 114764 139161 78661 60500 176.9 6121 15513 14021
5 Narsinghgarh 260 134863 205053 107053 98000 191.5 7033 11774 8992
6 Sarangpur 238 92224 141263 77263 64000 182.8 00 9100 9890
Total 1728 616109 785002 439102 345900 178.8 17627 83936 75435

18
Fig 1.9 Land Use Pattern

19
1.10 Soil erosion and runoff status
Table 1.10 Soil Erosion and Runoff status S.
no.
Block Longitude Latitude Soil
Erosion
(Tone/ha.)
Peak Rate
(cum/ha.)
Runoff Drought
Frequency Frequency
of peak
(no. In
months)
Total
Runoff
Volume of
Rainy
season (ha-
m)
Time of return of Maximum
flood
5 Years 10
Years
In Years
1 Rajgarh 23.42N 76.32E 15 to 20 20.43 to 25.76 4 70.81 to
337.20
0 Yes 10 10 Years
2 Khilchipur 23.55N 76.26E 15 to 20 20.43 to 25.76 4 70.81 to
337.20
0 Yes 10 10 Years
3 Jirapur 23.51N 76.11E 15 to 20 20.43 to 25.76 4 70.81 to
337.20
0 Yes 10 10 Years
4 Biaora 23.48N 76.45E 11.70 to
12.60
20 to 24 4 113.4 to
720.48
0 Yes 10 10 Years
5 Narsinghgarh 23.28N 76.44E 11.70 to
12.60
20 to 24 4 113.4 to
720.48
0 Yes 10 10 Years
6 Sarangpur 23.29N 76.02E 11.70 to
12.60
20 to 24 4 113.4 to
720.48
0 Yes 10 10 Years
11.70 to
12.60
20 to 24 4 113.4 to
720.48

20
CHAPTER-2
Pradhan Mantri Krishi Sinchayee Yojana

21
2.1 Introduction
All the living creatures on our planet earth are formed by five elements, Water,
Earth, Fire, Air and Space (sky). In human life all these elements are essential, but in the present
context unplanned exploitation of nature is disturbing the natural balance. Erosion in the farm
land, dropping water table, and shrinking surface water sources has became alarming.
Rajgarh is one of the backward districts of the state of Madhya Pradesh. District
shares its borders with district Guna, Sehore and Shajapur of Madhya Pradesh and district
Jhalawad of Rajasthan State. Most of the population lives in rural areas depending upon
agriculture and agricultural labour work for their livelihood. Rajgarh is distributed into two
entirely opposite soil patterns. On one hand Biaora, Narshinghgarh and Sarangpur blocks are
highly productive in Agriculture and on other, parts of Rajgarh, Khilchipur and Zirapur are
becoming deserted and produce single crop. There is a huge population pressure on Agriculture.
2.2 Background
In the district most of the farmers are marginalised and small farmers with small
land holdings. In the absence of proper monsoon there remains an uncertainty of harvest. In such
conditions these poor farmers go for seasonal migration, which is very common in the dry and
deserted areas of the district. The locals call this migration ‘Lavni’ which becomes main source
of arranging grains, arranging money for marriages, Loans payoffs, and to meet the educational
and health expenses.
Forest Green cover is disappearing from the district very fast and soil erosion is
increasing. The major area of district is rain fed agricultural land. As compared to other districts
of the state Rajgarh is quite backward in availability of Natural resources.
In the absence of adequate and scientific water and land management initiatives
the agriculture in this area has became less productive and less profitable. There is immediate
need of introduction of developed, easy and affordable agriculture and irrigation technologies
especially the technologies which are adaptable and sustainable.
There are evidences that suggest that, assessed or protective irrigation programs
encourages farmers to invest more in farming technology and inputs leading to productivity
enhancement and increased farm income.
Concerned over the slow pace of growth in Agriculture and allied sectors, the
Govt. of India have launched ‘Pradhan Mantri Krishi Sinchayee Yojana’ (PMKSY) to ensure
access to means of protective irrigation to all Agriculture farms in the counting to produce “ per
drop more crop” thus bringing much desired rural prosperity.

22
2.3 The Objectives of PMKSY
The major objective of PMKSY is to achieve convergence of investments in
irrigation at the field level, expand cultivable area under assured irrigation, improve on-farm
water use efficiency to reduce wastage of water, enhance the adoption of precision-irrigation and
other water saving technologies “ per drop more crop” enhance recharge of aquifers and
introduce sustainable water conservation practices by exploring the feasibility of reusing treated
municipal waste water for peri-urban agriculture and attract greater private investment in
precision irrigation system. Other outlined objectives of PMKSYare:
� Achieve convergence of investments in irrigation at the field level (preparation of district level
and, if required, sub district level water use plans).
� Enhance the physical access of water on the farm and expand cultivable area under assured
irrigation (Har Khet ko pani).
� Integration of water source, distribution and its efficient use, to make best use of water through
appropriate technologies and practices.
� Improve on-farm water use efficiency to reduce wastage and increase availability both in
duration and extent.
� Enhance the adoption of precision-irrigation and other water saving technologies (More crop per
drop).
� Enhance recharge of aquifers and introduce sustainable water conservation practices.
� Ensure the integrated development of rainfed areas using the watershed approach towards soil
and water conservation, regeneration of ground water, arresting runoff, providing livelihood
options and other NRM activities.
� Promote extension activities relating to water harvesting, water management and crop alignment
for farmers and grass root level field functionaries.
� Explore the feasibility of reusing treated municipal waste water for peri-urban agriculture.
� Attract greater private investments in irrigation.
This will in turn increase agricultural production and productivity and enhance farm income.
2.4 Strategy
To achieve above objectives, PMKSY will strategize by focussing on end-to-end
solution in irrigation supply chain, viz. water sources, distribution network, efficient farm level
applications, extension services on new technologies & information etc. Broadly, PMKSY will
focus on -
1- Creation of new water sources; repair, restoration and renovation of defunct water sources;
construction of water harvesting structures, secondary & micro storage, groundwater
development, enhancing potentials of traditional water bodies at village level.
2- Developing/augmenting distribution network where irrigation sources (both assured and
protective) are available or created.

23
3- Promotion of scientific moisture conservation and run off control measures to improve ground
water recharge so as to create opportunities for farmer to access recharged water through shallow
tube/dug wells.
4- Promoting efficient water conveyance and field application devices within the farm viz,
underground piping system, Drip & Sprinklers, pivots, rain-guns and other application devices
etc.
5- Encouraging community irrigation through registered user groups/farmer producers’
organisations/NGOs.
6- Farmer oriented activities like capacity building, training and exposure visits, demonstrations,
farm schools, skill development in efficient water and crop management practices (crop
alignment) including large scale awareness on more crop per drop of water through mass media
campaign, exhibitions, field days, and extension activities through short animation films etc.
2.5 Methodology
District Irrigation Plan (DIP) prepared by the Distinct Level irrigation Committee
followed the methodology suggested by guidelines prescribed by Govt. of India. DLIC followed
the Participatory Planning process and Participatory Rural Appraisal tools to involve Gram
Panchayat (G.P.) and the committee in the grassroots planning process. A Road map was
developed to achieve the desired result in the allocated time frame, Block wise separate teams
were constituted comprising of civil Engineers and field level staff of concerning departments.
The teams take lead in consultation coordination, collection of information from all possible
sources collecting the data set and information to derive certain definitive appraisal of the current
situation and comprehending the proposals to be included in the final plan with active support
from the Gram Panchayat Elected representatives and other Public representatives.
A District Level Irrigation Committee (DLIC) headed by District Collector with
the members of head of the concerning departments, leading NGOs and progressive farmers
taken the responsibility of orientation Training cum Workshop in the entire Planning process.
The DLIC have conducted one district Level training cum workshop and one Block level training
cum workshop in each block with officials and functionaries of concern departments. The DLIC
conducted a series of internal meetings to built the capacity of core members and get feedback
during preparing the plan.
2.6 Steps followed in Developing District Irrigation Plan (DIP)
2.6.1 Consultation Meeting and Orientation Training
The internal consultation meeting cum orientation training of all the members
involved in the developing (DIP) were organizes at district as well as block level. The
participants were given through understanding of PMKSY guidelines, the scope of planning
exercise the process to be followed along with the planning tools to be used. The orientation
24
module included the principals of participatory planning process, mechanism to collect most
relevant information both from secondary and primary surveys, developing the information base
using village level survey, especially focus group discussions (FGD) for developing the vision of
the district. Collection of data from Gram Panchayat, Block, and District and finalize the Action
Plan for the district.
2.6.2 Collection of Primary Information
The team members visited each village carrying out the interactive process of
appraisal with the local communities. Active involvement of local leadership to acquire the
desired information as per prescribed schedules is ensured. This process helped in public
awareness generation for the priorities, identifying critical issues, available options/alternatives,
community’s aspiration, indigenous knowledge, and communities conduct to drive their
livelihood.
2.6.3 Collection of Secondary Data
The operational task team started desk review and developed check list of reports
of the concerning department for collection, compilation and analysis of the secondary data.
Efforts were made to collect the published and authentic records from the concern departments
for preparing the District Irrigation Plan. SREP from ATMA and CDAP from departments of
Agriculture & Farmer welfare have been collected for reference and review to incorporate the
key findings in terms of specific needs under each agrological situation.
2.6.4 Reconnaissance Survey
To explore available resources and need of district, a team of experts in irrigation
and watershed management systems visited the district. The team has done visual observation
and rapid appraisal with the rural communities. Farmer group discussions were conducted to
understand their aspirations and prepare the prospective district vision for irrigation and
agriculture.
2.6.5 Processing and Analysis
All the collected information from both primary & secondary sources, desk
review and research notes were analysed and standardized. The analysed data have been used in
developing the vision document, strategy and Action Plan for the district.

25
CHAPTER-3
District water profile

26
3.1 Area wise, crop wise irrigation status
Cereals, Pulses and Oil seed Crop
Maize, Soybean, Gram, Wheat, Mustard, Peanut, Sesame, Pigeon pea, Mung,
Urad etc. are produced in the district. In the Kharif season total area cropped in the district is
433891 ha. that is entirely rainfed. In the Rabi season 257110 ha. is sown on the irrigated land.
Very little area is sown for the crops in the summer season on the irrigated land.
Horticulture and Plantation Crop
Orange production in the district is touching new heights. Orange is becoming
every farmer choice as a promising crop day by day. Mango, Guava, and Pomegranate are also
grown in the district. Sita fal (custard fruit), Jamun and Bere are mostly grown in forests region
specially Block Narsinghgarh is largest producer of these fruits in the District. The total area
covered for fruit plantation is 20008 ha.
In horticulture and plantation crop vegetable like Onion, Garlic, Cauliflower,
Potato, Brinjal etc are grown on the Irrigated and Rainfed areas as per the cropping season on
4471 ha in Kharif season, and on 7708 ha in Rabi season. Vegetable are grown in summers on
5018 ha area on irrigated land.
The district is one of the largest producer of Coriander in the State, with this other
spices are also grown in on small patches. Floriculture is done on the small patches in the
district. Most of the production is consumed in the district itself.

27
Table 3.1.1 Cereals, Pulses and Oil seed Crop
Crop
Type
Kharif (Aria in Ha) Rabi (Area in Ha) Summer (Area in Ha) Total (Area in Ha)
Irrigated Rainfed Total Irrigated Rainfed Total Irrigated Rainfed Total Irrigated Rainfed Total
Cereals 00 00 00 127400 00 127400 00 00 00 127400 00 127400
Coarse
cereals
00 74441 74441 00 00 00 00 00 00 00 74441 74441
Pulses 00 17460 17460 122910 00 122910 433 00 433 123343 17460 140803
Oil Seed 00 341990 341990 6800 00 6800 00 00 00 6800 341990 348790
Total 00 433891 433891 257110 00 257110 433 00 433 257543 433891 691434
Fig. 3.1.1

28
Table 3.1.2 Horticulture and Plantation Crop
Crop
Type
Kharif (Aria in Ha) Rabi (Area in Ha) Summer (Area in Ha) Total (Area in Ha)
Irrigated Rainfed Total Irrigated Rainfed Total Irrigated Rainfed Total Irrigated Rainfed Total
Fruit 00 00 00 00 00 00 00 00 00 19338 670 20008
Vegetable 00 4471 4471 7708 00 7708 5018 00 5018 12225 4471 17197
Spices 00 596 596 55466 00 55466 00 00 00 55466 596 56062
Flower 00 160 160 135 00 135 06 00 06 141 160 301
Total 00 5227 5227 63309 00 63309 5024 00 5024 87170 5897 93568
Fig 3.1.2
29
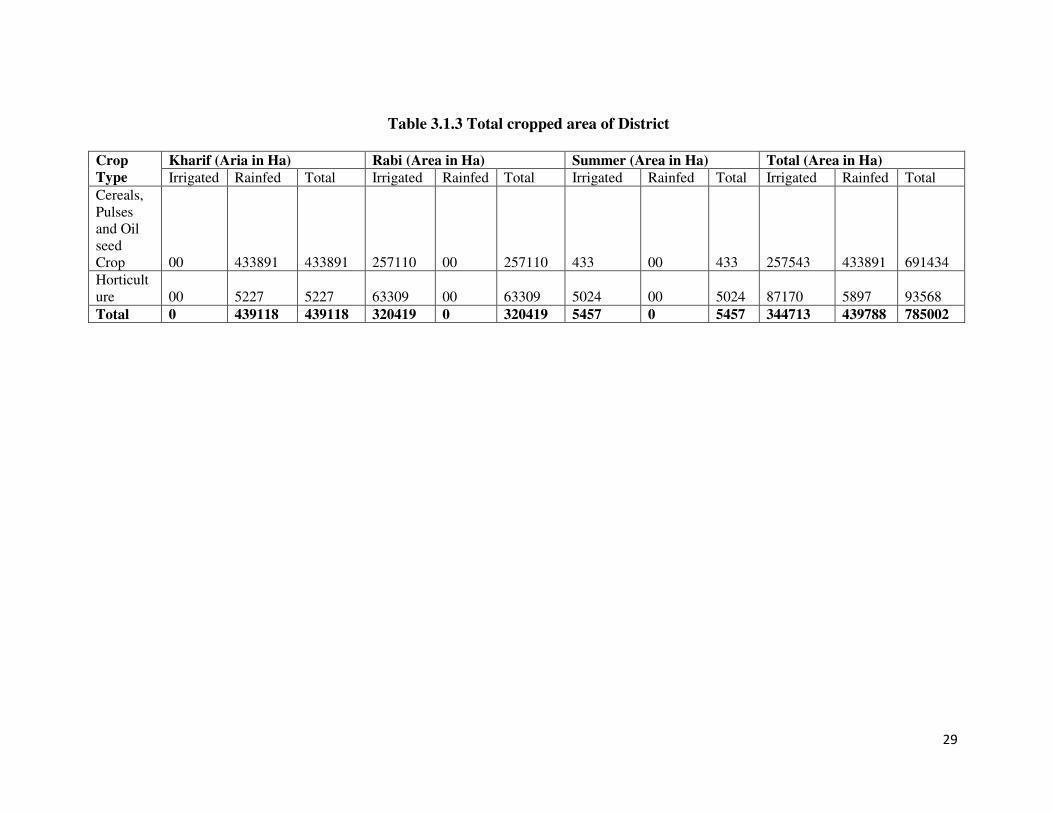
Table 3.1.3 Total cropped area of District
Crop
Type
Kharif (Aria in Ha) Rabi (Area in Ha) Summer (Area in Ha) Total (Area in Ha)
Irrigated Rainfed Total Irrigated Rainfed Total Irrigated Rainfed Total Irrigated Rainfed Total
Cereals,
Pulses
and Oil
seed
Crop 00 433891 433891 257110 00 257110 433 00 433 257543 433891 691434
Horticult
ure 00 5227 5227 63309 00 63309 5024 00 5024 87170 5897 93568
Total 0 439118 439118 320419 0 320419 5457 0 5457 344713 439788 785002

30
3.2 Production & productivity of major crops
The Major crops grown in the Kharif season are Soybean, Maize, Peanut, Sesame, and Pigeon peas. The Chavli beans
are also grown in this season as multi crop with Maize. This entire cropping season is rainfed and covers area of 433892 ha with
production of 454284 Mt./year or 1047 Kgs/ha costing Rs. 20544/ha.
In the Rabi season Gram, Wheat, Mustard, Pigeon pea, etc. are grown on the irrigated area covering 257100 ha. land,
with production 602128.2 Mt. /year or 2342 Kgs/ha costing Rs 25724/ha.
In Horticulture the total area covered is 93568 ha. with production 83232 Mt. /year on rainfed area and 459865
Mt./year on irrigated land.
Table 3.2 Production & productivity of major crops
Season
Crop Sown (Area in ha) Rainfed Irrigated Total
Cer
eals
Co
arse
Cer
eals
pu
lse
oil
see
d
Fib
re
An
y o
ther
cro
ps
Are
a h
a.
Pro
du
ctio
n
Mt/
Yea
r
Pro
du
ctiv
ity
or
yie
ld
Kg
s/H
a.
Co
st o
f
Cu
ltiv
atio
n
Rs.
/h
Pro
du
ctio
n
Mt.
/Yea
r
Pro
du
ctiv
ity
or
yie
ld
Kg
s/H
a.
Co
st o
f
Cu
ltiv
atio
n
Rs.
/h
Pro
du
ctio
n
Mt.
/Yea
r
Pro
du
ctiv
ity
or
yie
ld
Kg
s/H
a.
Co
st o
f
Cu
ltiv
atio
n
Rs.
/h
Kharif - 74441 17460 341990 - - 433892 454284 1047 20544 0 0 0 454284 1047 20544
Rabi 127400 - 122910 6800 - - 257100 0 0 0 602128 2342 25742 602128 2342 25742
Summe
r - - 433
- - -
433 2165 500 21500 0 0 0 2165 500 21500
Horticu
ltural
&
Plantati
on
Crops 93568 83232 27238 - 459865 26714 - 543097 53954 -
Total 127400 74441 140803 348790 - - 785002 539681 28785 42044 1061993 29056 25742 1601674 57843 67786

31
3.3 Irrigation based Classification
In the district gross irrigated area is 345900 ha., the net irrigated area is 52014 ha.,
partly irrigated area is 293886 ha., and unirrigated or totally rainfed area is 93202 ha. This data
shows that out of gross irrigated area, net irrigated area is only 15% and remaining is the
partially irrigated or protective irrigated area is 85%.
Table 3.3 Irrigation based classification
Name of the
Block
Total Geograp
hical Area
Total
Agriculture
Area
Irrigated (Area in ha) Rainfed (Area in ha)
Gross Irrigated
Area
Net Irrigated
Area
Partially Irrigated/
Protective Irrigated
Unirrigated or
Totally rainfed
Rajgarh 110510 67296 42200 13570 28630 25096
Khilchipur 79214 50221 37000 5762 31238 13211
Jirapur 84534 58618 44200 8511 35689 14418
Biaora 114764 78661 60500 9344 51156 18161
Sarangpur 92224 77263 64000 4941 59059 13273
Narsinghgarh 134863 107053 98000 9886 88114 9053
Total 616109 439112 345900 52014 293886 93212
Fig. 3.3

32
3.4 Source wise irrigated area of District
Table 3.4 source wise irrigated area
S. no. Source of irrigation Unit Area in Ha. Percent
Kharif Rabi
1 Well Ha. - 164377 47.52
2 Tube well Ha. - 43844 12.68
3 Tank Ha. - 32667 9.44
4 River and stream Ha. - 85665 24.77
5 Canal Ha - 19347 5.59
Fig. 3.4

33
CHAPTER-4
Water availability

34
4. Water availability
The average rainfall in the district in 1107 mm. The average number of rainy days
in the district is 51. Despite the great network of rivers and numerous seasonal streams the
majority of the cultivation area is rainfed only. The district lies in the part of the Chambal and
Betva basin. The major rivers in the district are Kalisindh, Nevaj and Parvati. The catchment area
of the Kalisindh River is 4900 Sq.Kms and Nevaj River is 3825 Sq.Kms. The Major tributaries
are Ghodapachad, Ghadganga, Ajnar, and Chhapi. .
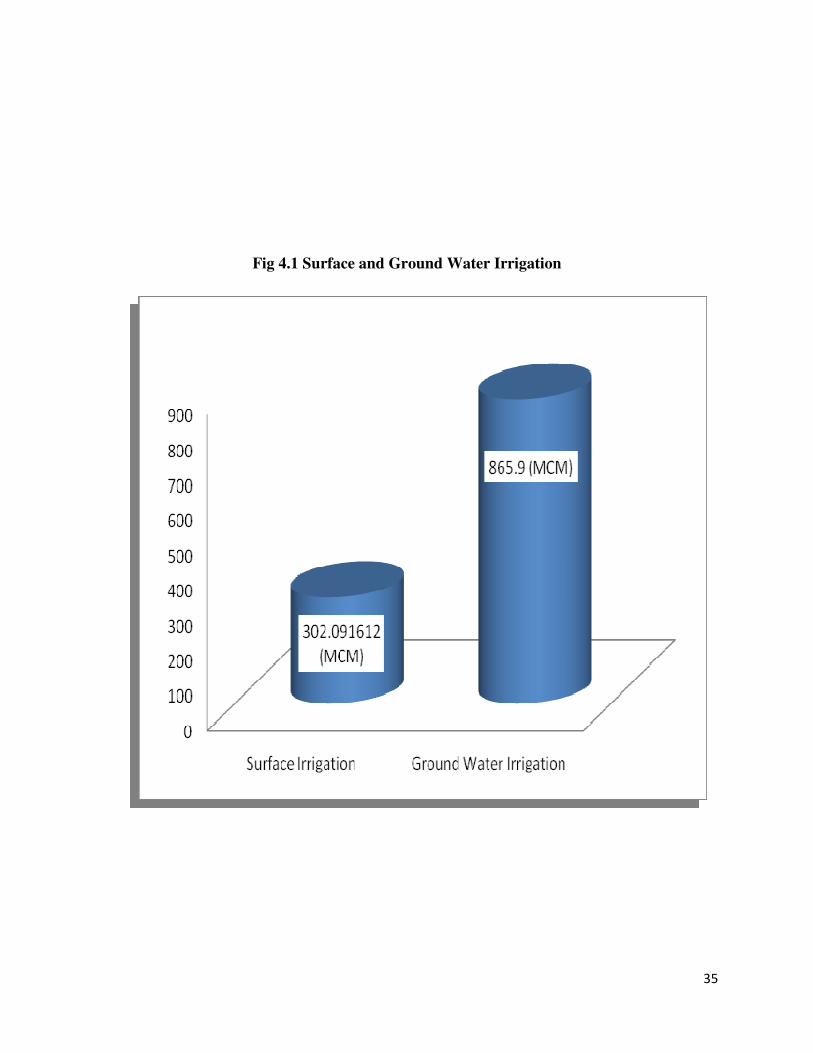
4.1 Status of water availability
The total water availability for irrigation in the district is 1140.51 Million Cubic
Meter of which 286.03 MCM is available from Surface irrigation which comprising of Canal
82.06 MCM, Minor Irrigation tanks 151.02 MCM and Lift Irrigation 41.53 MCM.
And through Ground water sources it is 865.9 MCM, including open well 692.72 MCM and deep
tube well 173.18 MCM .
Table 4.1 Surface and Ground Water Irrigation
SNO. SOURCES KHARIF RABI
(MCM)
SUMMER
(MCM)
TOTAL
1 Surface Irrigation I. canal(major & medium irrigation) - 82.06 - 82.06
II. Minor irrigation tanks - 151.02 - 151.02
III. Lift irrigation / diversion - 41.53 - 41.53
IV. Various Water Bodies Including
Rain water Harvesting - 27.481612 - 27.481612
V. Treated Eflluent Received from
STP - - - -
VI. Untreated effluent - - - -
VII. Perrinial Source of water - - - -
2 Ground Water Irrigation - - - -
I. Open Well - 692.72 - 692.72
II. Deep Tube Well - 173.18 - 173.18
III. Medium Tube Well - - - -
IV. Shallow Tubewell - - - -
Total - 1167.99 1167.99
35
Fig 4.1 Surface and Ground Water Irrigation

36
4.2 Status of Ground water availability
The Draft-Recharge Gap for ground water shows that the district has two blocks
which fall under the safe category, these are Rajgarh, and Jirapur with Draft-Recharge gap of
56.39 MCM, and 36.15 MCM respectively. On the other hand Khilchipur, Sarangpur and
Narsinghgarh are under semi-critical category with Draft-recharge gap of 27.96 MCM, 18.2
MCM and 27.48 MCM respectively.
Table 4.2 Block wise Draft-Recharge Gap
Status of Block As per Central Ground Water Board
Notification
Ground Water (MCM)
Block critical Semi-
critical
Safe Draft Recharge Gap
Rajgarh - - Safe 109.70 166.09 56.39
Khilchipur - Semi-
critical
- 102.95 130.91 27.96
Jirapur - - Safe 76.50 112.65 36.15
Sarangpur - Semi-
critical
- 126.68 144.88 18.20
Biaora - Semi-
critical
- 123.44 166.62 43.18
Narsingarh - Semi-
critical
- 191.98 219.46 27.48
Fig. 4.2

37
4.3 Status of Command Area
The following data gives block wise data of canal command, and information on
total developed and undeveloped command.
Table 4.3 Status of command area
S.n Name of Block
Information on
developed canal
command (Ha.)
Information on developed of
other services command
(Ha.)
Total Area Ha.
1 Rajgarh 13570 28630 42200
2 Khilchipur 5762 31238 37000
3 Jirapur 8511 35689 44200
4 Biaora 9344 51156 60500
5 Sarangpur 4941 59059 64000
6 Narsinghgarh 9886 88114 58000
Total 52014 293886 345900
Fig. 4.3 Block wise developed and undeveloped command area

38
4.4 Existing type of Irrigation
Looking at the existing type of irrigation and the command area it shows that the
open well are most commonly used means of irrigation in the district. The command area of
open wells is 164377 ha. In comparison with this, there are only 60 Govt. Canals with 19347 ha
command area. Electricity pumps and diesel pumps are other largely used means of irrigation in
the district. 181 Govt. Reservoir/Minor irrigation and 12200 tube wells have 32667 ha. and
42844 ha command area respectively.
Table 4.4 Existing type of irrigation
S.no. Type of Source Nos. Command Area ha
1 Govt. Canal 60 19347
2 Community Ponds - 0
3 Govt. Reservoir /Minor irrigation 181 32667
4 Tube well 12200 43844
5 Open well 89209 164377
6 Electricity Pump/ Diesel Pump 84641 85665
Total - 345900

39
CHAPTER-5
Water Requirement and Demand

40
Water Requirement and Demand
This chapter deals with Crop water requirement for domestic, Irrigation,
Livestock and Industrial purposes.
5.1 Domestic Water Demand:
Total Population for District Rajgarh in 2011 was 15,45,814, as per growth rate,
projected population in 2016 is 17,25,901 and in 2020 it will be 1869970. Average per capita
domestic water requirement is 135 liters per day. Based on this information gross water demand
for whole district in current year is 51.419764 MCM per annum. The projected gross water
demand in year 2020 will be 55.712085 MCM per annum. With the increase in population the
use of water also increases substantially. Due to modern living standards water usage per capita
has increased multifold. People have also started using water filtration techniques like R.O.
devices which consumes more water.
Table 5.1 Domestic water demand
Block Population
2011
Population
2016
Population 2020 Gross water demand (MCM)
In 2016 In 2020
Rajgarh
Rural 199276 222492 241064 5.684662 6.15919
Urban 40511 45231 49006 2.228734 2.414778
Biaora
Rural 220887 246620 267207 6.30115 6.827139
Urban 59689 66643 72206 3.283822 3.55794
Khilchipur
Rural 163636 182700 197950 4.667975 5.057634
Urban 27429 30624 33181 1.509021 1.634987
Jirapur
Rural 168475 188102 203804 4.806015 5.207198
Urban 31200 34835 37743 1.716485 1.859769
Narsinghgarh
Rural 262448 293023 317483 7.48674 8.1117
Urban 49811 55613 60255 2.7403 2.9691
Sarangpur
Rural 254635 284300 308032 7.26386 7.8702
Urban 67817 75718 82039 3.731 4.04245
Total 1545814 1725901 1869970 51.419764 55.712085

41
Fig 5.1

42
5.2 Crop Water Requirement:
Crop Water Demand
Water requirement of a crop is the quantity of water needed for normal growth
and yield and may be supplied by precipitation or by irrigation or by both. Water is needed
mainly to meet the demands of evaporation (E), transpiration (T) and metabolic need of the
plant, all together known as Consumptive Use (CU), CU = E + T + Water needed for
Metabolic Purposes Water requirement is a demand whereas the supply consists of
contribution from irrigation water, effective rainfall (ER) and soil profile contribution
including that from shallow water table. The water requirement of any crop is dependent
upon (i) Crop factors- variety, growth, stage, duration, plant population and growing season,
(ii) Soil factors- texture, structure, depth, topography, (iii) Climate factor- temperature,
relative humidity, wind velocity, (iv) Crop management practices- fillage, fertilization,
weeding, etc. Water requirement of a crop varies from area to area and even sometimes from
field to field on a farm depending on the above mentioned factors.
Total crop water demand for 2016 is 2022 MCM. Existing surface water
availability is 219 MCM. Hence 1803 MCM potential is to be created for 2016. To
accommodate more crops and increase the productivity of crops, efficient water management
techniques like Drip, Sprinkler, rain-gun, plastic mulch, pipelines and micro-sprinkler will be
promoted. Major percentage of crop water demand is for wheat crops only.
Fig. 5.2 total crop water demand, existing water availability and potential to be created

43
Table 5.2.1 Crop wise water requirement Block- Rajgarh
Block Name of
Crop
Sown
Area
(ha.)
Irrigated
Area
(ha.)
Crop
Water
Demand
(MM)
Water
potential
required
(MCM)
Existing
water
potential
(MCM)
Water
Potential
to be
created
(MCM) Rajgarh Wheat 23735 7142 609.6 144.68856 36.067 108.62156
Barley 20 0 508 0.1016 0 0.1016
Chickpeas 13700 4071 152.4 20.8788 6.2042 14.6746
Masoor 1300 680 152.4 1.9812 1.03632 0.94488
Peas 300 180 152.4 0.4572 0.27432 0.18288
Mustered 300 220 152.4 0.4572 0.33528 0.12192
Horticulture
Fruits 3865 0 1270 49.0855 0 49.0855
Vegetables 2845 1257 635 18.06575 7.98195 10.0838
Spices 6985 0 508 35.4838 0 35.4838
Flower 65 20 762 0.4953 0.1524 0.3429
Total 53115 13570 271.69491 52.05147 216.64344
Table 5.2.2 Crop wise water requirement Block- Khilchipur
Block Name of
Crop
Sown
Area
(ha.)
Irrigated
Area
(ha.)
Crop
Water
Demand
(MM)
Water
potential
required
(MCM)
Existing
water
potential
(MCM)
Water
Potential
to be
created
(MCM) Khilchipur Wheat 23500 3040 609.6 143.256 18.53184 124.72416
Barley 20 12 508 0.1016 0.06096 0.04064
Chickpeas 9000 1510 152.4 13.716 2.30124 11.41476
Lentil 1519 450 152.4 2.31495 0.6858 1.62915
Peas 300 110 152.4 0.4572 0.16764 0.28956
Mustard 600 190 152.4 0.9144 0.28956 0.62484
Horticulture
Fruits 2681 0 1270 34.0487 0 34.0487
Vegetables 2028 430 635 12.8778 2.7305 10.1473
Spices 6065 0 508 30.8102 0 30.8102
Flower 33 20 762 0.25146 0.1524 0.09906
Total 45746 5762 238.74831 24.91994 212.82837

44
Table 5.2.3 Crop wise water requirement Block- Jirapur
Block Name of
Crop
Sown
Area
(ha.)
Irrigated
Area
(ha.)
Water
Demand
(MM)
Water
potential
required
(MCM)
Existing
water
potential
(MCM)
Water
Potential
to be
created
(MCM) Jirapur Wheat 26000 4511 609.6 158.496 27.499056 130.996944
Barley 28 0 508 0.14224 0 0.14224
Chickpeas 12200 2200 152.4 018.5928 3.3528 15.2400
Masoor 900 350 152.4 1.3716 0.5334 0.39624
Peas 305 250 152.4 0.46482 0.381 0.08382
Mustered 3580 1045 152.4 5.45592 1.59258 3.86334
Horticulture
Fruits 3381 0 1270 42.9387 0 42.9387
Vegetables 1171 150 635 7.43585 0.9525 6.48335
Spices 10740 0 508 54.237 0 54.237
Flower 16 05 762 0.12192 0.0381 0.0382
Total 58321 8511 289.25685 34.349436 257.907414
Table 5.2.4 Crop wise water requirement Block- Biaora
Block Name of
Crop
Sown
Area
(ha.)
Irrigated
Area (ha.)
Water
Demand
(MM)
Water
potential
required
(MCM)
Existing
water
potential
(MCM)
Water
Potential
to be
created
(MCM) Biaora Wheat 32000 5500 609.6 195.072 33.528 161.544
Barley 40 25 508 0.2032 0.127 0.0762
Chickpeas 22054 2500 152.4 33.61029 03.81 29.80029
Masoor 1550 680 152.4 2.3622 1.03632 1.32588
Peas 650 220 152.4 0.9906 0.33528 0.65532
Mustered 350 100 152.4 0.5334 0.1524 0.381
Horticulture
Fruits 3930 0 1270 49.911 0 49.911
Vegetables 3808 300 635 24.1808 1.905 22.2758
Spices 14230 0 508 72.2884 0 72.2884
Flower 48 19 762 0.36576 0.14478 0.22098
Total 78660 9344 379.51765 41.03878 342.47887

45
Table 5.2.5 Crop wise water requirement Block- Narsinghgarh
Block Name of
Crop
Sown
Area
(ha.)
Irrigated
Area
(ha.)
Water
Demand
(MM)
Water
potential
required
(MCM)
Existing
water
potential
(MCM)
Water
Potential
to be
created
(MCM) Narsinghgarh Wheat 57000 5700 609.6 347.472 34.7472 312.7248
Barley 50 0 508 0.254 0 0.254
Chickpeas 35500 2300 152.4 54.102 3.5052 50.5968
Masoor 2050 950 152.4 3.1242 1.4478 1.6764
Peas 705 400 152.4 1.07442 0.6096 0.46482
Mustered 200 126 152.4 0.3048 0.192024 0.112776
Horticulture
Fruits 3129 0 1270 39.7383 0 39.7383
Vegetables 2410 375 635 15.3035 2.38125 12.92225
Spices 5924 0 508 30.09392 0 30.09392
Flower 85 35 762 0.6477 0.2667 0.381
Total 107053 9886 492.11484 43.149774 412.965066
Table 5.2.6 Crop wise water requirement Block- Sarangpur
Block Name of
Crop
Sown
Area
(ha.)
Irrigated
Area
(ha.)
Water
Demand
(MM)
Water
potential
required
(MCM)
Existing
water
potential
(MCM)
Water
Potential
to be
created
(MCM) Sarangpur Wheat 28000 3400 609.6 170.688 20.7264 149.9616
Barley 50 0 508 0.254 0 0.254
Chickpeas 26000 960 152.4 39.624 1.46304 38.16096
Masoor 5000 280 152.4 7.62 0.42672 7.19328
Peas 700 96 152.4 1.0668 0.146304 0.920496
Mustered 300 80 152.4 0.4572 0.12192 0.33528
Horticulture
Fruits 3091 0 1270 39.2557 0 39.2557
Vegetables 3899 110 635 24.75865 0.6985 24.06015
Spices 6242 0 508 31.70936 0 31.70936
Flower 51 15 762 0.38862 0.1143 0.27432
Total 73333 4941 315.82233 23.697184 364.125146

46
Table 5.2.7 Crop water demand for district
Block Name of
Crop
Sown
Area
(ha.)
Irrigate
d Area
(ha.)
Water
potential
required
(MCM)
Existing
water
potential
(MCM)
Water
Potential to
be created
(MCM)
Rajgarh All
Crops
53115 13570 268 52 216
Khilchipur 45746 5762 237 25 212
Jirapur 58321 8511 291 34 257
Biaora 78660 9344 383 41 342
Sarangpur 73333 4941 336 24 412
Narsinghgarh 107053 9886 407 43 364
Total 416228 52014 2022 219 1803

47
5.3 Livestock Water Demand:
Table 5.3 shows district water demand for livestock for current year and for
2020. Number of livestock as per Animal census is 1136873. Estimation is done based on
livestock water demand which is different for each animal. We have taken 115 liters per
livestock per day for Pigs, 15 liters per livestock per day for Goats, 135 liters per livestock
per day for Cow, 135 liters per livestock per day for Buffalo. Current structures are not
sufficient for meeting the demand for livestock.
Table 5.3 Block wise Livestock water demand
Block Total no. of
livestock
Present Water
Demand (MCM)
Water Demand
in 2020 (MCM)
Water Potential to
be created (MCM)
Rajgarh 203908 18.6 2.79 1.43
Khilchipur 167390 1.52 2.29 0.62
Jirapur 146535 1.34 2.01 0.72
Biaora 178077 1.62 2.43 6.5
Sarangpur 198239 1.81 2.71 1.06
Narsinghgarh 1242724 2.21 3.31 9.6
Total 1136873 10.37 15.54 10.89
Fig 5.3 Livestock water demand for present & in 2020, existing potential and potential to be
created

48
5.4 Industrial water demand
In view of the industrialization of the district it shows that Narsinghgarh block has
largest number of Industries functioning. There are very few industries working in Jirapur,
Biaora and Sarangpur Blocks. There is no industry functioning in block Rajgarh and Khilchipur.
In this sequence the water demand for industries is highest in Narsinghgarh with 2.5 MCM
which will to grow up to 7 MCM in 2020. The present Industrial water demand in the district is
2.87 MCM which is anticipated to grow up to 20.16 MCM in 2020.
Table 5.4 Block wise Industrial water demand
Block
Total no.
of
Industry
Present Water
Demand (MCM)
Water Demand in
2020 (MCM)
Water Potential to be
created(MCM)
Rajgarh - - 4 4
Khilchipur - - 2 2
Jirapur - 0.09 2 1.91
Biaora - 0.15 6 5.85
Narsinghga
rh - 2.5 7 4.5
Sarangpur - 0.1 2 1.90
Total 2.84 23 20.16

49
5.5 Total water demand of the district for various sectors
Overall water demand for the district is 1885 MCM including Domestic, Crop,
Lives and Industries. Out of this demand as compared to any other block of the district, block
Sarangpur is having highest water demand, for Domestic it is 7 MCM, for Crop it is 412 MCM,
for Livestock it is 1.81 MCM and for industries it is 4.5 MCM.
Table 5.6 Block wise total water demand for various sectors S.No.
Block Components Total (MCM)
Domestic Crop Livestock Industry Power
generation
1 Rajgarh 8 216 1.86 4 - 230
2 Khilchipur 6 212 1.52 2 - 222
3 Jirapur 7 257 1.34 1.91 - 267
4 Biaora 10 342 1.62 5.85 - 359
5 Sarangpur 7 412 1.81 4.5 - 425
6 Narsinghgarh 14 364 2.21 1.90 - 382
Total 51 1803 10.36 20.16 1885
Fig. 5.6

50
5.6 Water Budget
To prepare Water budget for the district, first we calculated the village-wise water
demand and its availability, thus we reached out to Block-wise demand and its availability. Total
water availability, we calculated on the basis of surface and ground water availability. The
highest available water is in Narsinghgarh block with 246 MCM and still it is having the widest
gap of 303 MCM. All the blocks have deficiency of water and to compete with it, many
structures needs to be constructed, which includes Check Dam, Percolation tank, Stop Dam, etc.,
so that rain-water runoff is collected and used in irrigation purposes. Every drop of water is
precious that is why advance agricultural techniques like Drip, Sprinkler, Mulching, etc needs to
be promoted. Following table gives block wise data of water availability, water demand and
water gap for current year and projected in the year 2020. The overall present gap is 717 MCM
and projected gap in 2020 will be 1113 MCM.
Table 5.6 water availability and demand in the district Name of
Block
Existing water availability Water Demand (MCM) Water Gap (MCM) Surface
water
Ground
water
Total (MCM) Present Projected
(2020)
Present Projected
(2020)
Rajgarh 80 146 226 230 264 4 38
Khilchipur 31 122 152 222 255 69 102
Jirapur 45 115 159 267 302 103 142
Bioara 71 153 224 359 402 125 178
Sarangpur 26 133 159 425 348 143 189 Narsinghgarh 49 198 246 382 710 303 463
Total 302 866 1168 1885 2281 717 1113
Fig. 5.6

51
CHAPTER-6
Strategic action plan for irrigation
52
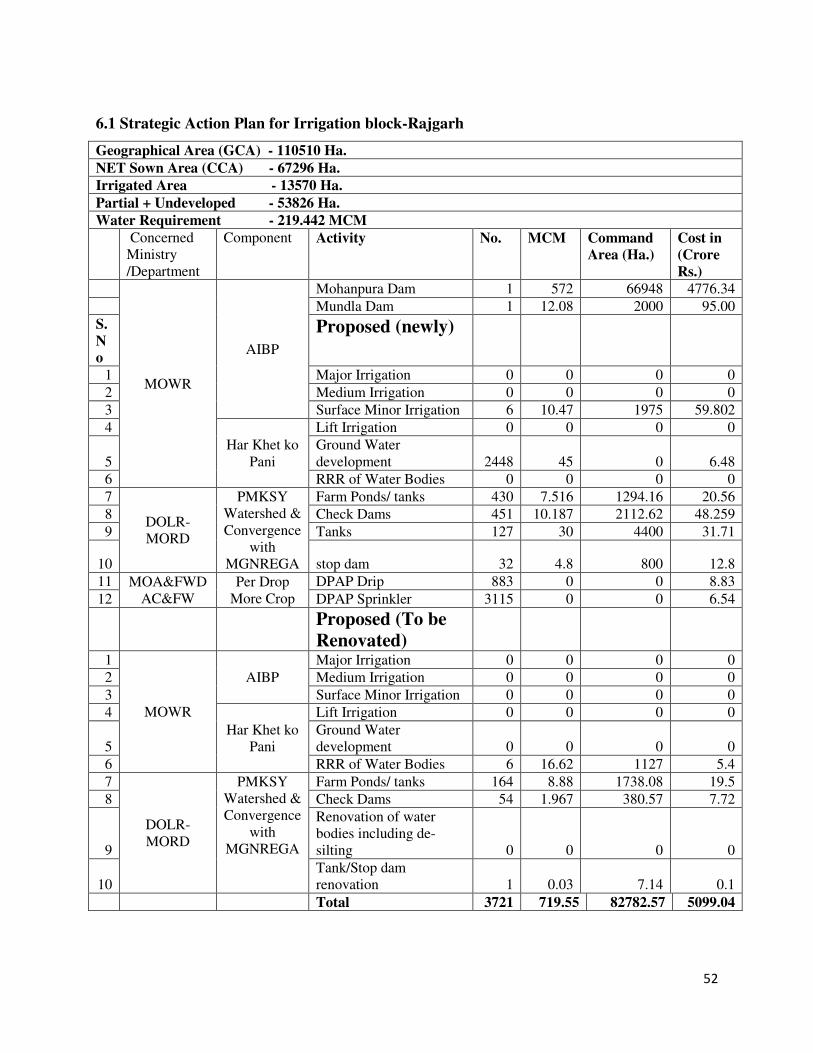
6.1 Strategic Action Plan for Irrigation block-Rajgarh
Geographical Area (GCA) - 110510 Ha.
NET Sown Area (CCA) - 67296 Ha.
Irrigated Area - 13570 Ha.
Partial + Undeveloped - 53826 Ha.
Water Requirement - 219.442 MCM
Concerned
Ministry
/Department
Component Activity No. MCM Command
Area (Ha.)
Cost in
(Crore
Rs.)
MOWR
AIBP
Mohanpura Dam 1 572 66948 4776.34
Mundla Dam 1 12.08 2000 95.00
S.
N
o
Proposed (newly)
1 Major Irrigation 0 0 0 0
2 Medium Irrigation 0 0 0 0
3 Surface Minor Irrigation 6 10.47 1975 59.802
4
Har Khet ko
Pani
Lift Irrigation 0 0 0 0
5
Ground Water
development 2448 45 0 6.48
6 RRR of Water Bodies 0 0 0 0
7
DOLR-
MORD
PMKSY
Watershed &
Convergence
with
MGNREGA
Farm Ponds/ tanks 430 7.516 1294.16 20.56
8 Check Dams 451 10.187 2112.62 48.259
9 Tanks 127 30 4400 31.71
10 stop dam 32 4.8 800 12.8
11 MOA&FWD
AC&FW
Per Drop
More Crop
DPAP Drip 883 0 0 8.83
12 DPAP Sprinkler 3115 0 0 6.54
Proposed (To be
Renovated)
1
MOWR
AIBP
Major Irrigation 0 0 0 0
2 Medium Irrigation 0 0 0 0
3 Surface Minor Irrigation 0 0 0 0
4
Har Khet ko
Pani
Lift Irrigation 0 0 0 0
5
Ground Water
development 0 0 0 0
6 RRR of Water Bodies 6 16.62 1127 5.4
7
DOLR-
MORD
PMKSY
Watershed &
Convergence
with
MGNREGA
Farm Ponds/ tanks 164 8.88 1738.08 19.5
8 Check Dams 54 1.967 380.57 7.72
9
Renovation of water
bodies including de-
silting 0 0 0 0
10
Tank/Stop dam
renovation 1 0.03 7.14 0.1
Total 3721 719.55 82782.57 5099.04

53
6.2 Strategic Action Plan for Irrigation block-Khilchipur
Geographical Area -79214 Ha.
NET Sown Area - 50221 Ha.
Irrigated Area - 5762 Ha.
Partial + Undeveloped – 44449 Ha.
Water Requirement - 231 MCM
Concerned
Ministry
/Department
Component Activity No. MCM Comma
nd Area
(Ha.)
Cost in
(Crore
Rs.)
MOWR
AIBP
From Mohanpura 0 0 38300
Proposed (newly)
1 Major Irrigation 0 0 0 0
2 Medium Irrigation 0 0 0 0
3 Surface Minor Irrigation 8 8.157 1535 41.6
4
Har Khet
Ko Pani
Lift Irrigation 0 0 0 0
5
Ground Water
development 436 5 0 1.16
6 RRR of Water Bodies 0 0 0 0
7
DOLR-MORD
PMKSY
Watershed
&
Convergenc
e with
MGNREG
A
Farm Ponds/ tanks 394
28.93
4 7912.93 30
8 Check Dams 241 4.724 1272.74 31.07
9 Stop dam 197 8.71 3816.15 44.05
10 Tanks 105 13.78 3244.29 45.42
11 MOA&FWDAC
&FW
Per Drop
More Crop
DPAP Drip 261 0 0 2.61
12 DPAP Sprinkler 687 0 0 1.44
Proposed (To be
Renovated)
1
MOWR
AIBP
Major Irrigation 0 0 0 0
2 Medium Irrigation 0 0 0 0
3 Surface Minor Irrigation 0 0 0 0
4
Har Khet
Ko Pani
Lift Irrigation 0 0 0 0
5
Ground Water
development 0 0 0 0
6 RRR of Water Bodies 4 8.22 1582 5.48
7
DOLR-MORD
PMKSY
Watershed
&
Convergenc
e with
MGNREG
A
Farm Ponds/ tanks 60
12.59
5 4341.42 5.27
8 Check Dams 133 4.002 1396.57 8.17
9
Renovation of water
bodies including de-silting 46 1.31 328.57 4.6
10 Tank/Stop dam renovation 6 0.148 38.57 0.6
Total 1630 95.58 63768.24 221.47

54
6.3 Straegic Action Plan for Irrigation block-Jirapur
Geographical Area -84534 Ha.
NET Sown Area - 58618 Ha.
Irrigated Area - 8511 Ha.
Partial + Undeveloped -50107 Ha.
Water Requirement - 254.441 MCM
Concerned Ministry
/Department Component Activity No. MCM Command
Area
(Ha.)
Cost in
(Crore
Rs.)
MOWR
AIBP
From Kundaliya 1 552.75 35000 3448
Proposed (newly)
1 Major Irrigation 0 0 0 0
2 Medium Irrigation 0 0 0 0
3 Surface Minor Irrigation 8 6.95 1530 40.28
4
Har Khet Ko
Pani
Lift Irrigation 0 0 0 0
5
Ground Water
development 0 0 0 0
6 RRR of Water Bodies 0 0 0 0
7
DOLR-MORD
PMKSY
Watershed
&
Convergence
with
MGNREGA
Farm Ponds/ tanks 85 7.041 1148.76 122.038
8 Check Dams 272 13.586 2420.22 39.31
9 Tanks 72 4.3 786.42 18.69
10 stop dam 136 4.64 887.21 31.4
11 MOA&FWDAC&FW
Per Drop
More Crop
DPAP Drip 3211 0 4816.5 32.11
12 DPAP Sprinkler 518 0 518 1.08
Proposed (To be
Renovated)
1
MOWR
AIBP
Major Irrigation 0 0 0 0
2 Medium Irrigation 0 0 0 0
3 Surface Minor Irrigation 0 0 0 0
4
Har Khet Ko
Pani
Lift Irrigation 0 0 0 0
5
Ground Water
development 0 0 0 0
6 RRR of Water Bodies 1 0.8 199 0.6
7
DOLR-MORD
PMKSY
Watershed
&
Convergence
with
MGNREGA
Farm Ponds/ tanks 312 11.012 2038.21 30.42
8 Check Dams 141 2.88 623.96 12.25
9
Renovation of water
bodies including de-silting 18 0.51 128.57 1.8
10 Tank/Stop dam renovation 2 0.032 11.42 0.2
Total 1048 604.501 50108.27 3778.178

55
6.4 Strategic Action Plan for Irrigation block-Biaora
Geographical Area - 114764 Ha.
NET Sown Area – 78661 Ha.
Irrigated Area – 9344 Ha.
Partial + Undeveloped - 69317 Ha.
Water Requirement - 338.478 MCM
Concerned Ministry
/Department
Component Activity No. MCM Command
Area
(Ha.)
Cost in
(Crore
Rs.)
MOWR
AIBP
Bankpura 1 26 1990 93.00
Semlapar Barrage 1 0.6 315 6.77
Proposed (newly)
1
Major Irrigation (Parvati,
Rinsi) 0 0 10000 0
2 Medium Irrigation 0 0 0 0
3 Surface Minor Irrigation 4 2.33 855 17.3
4 Har Khet ko
Pani
Lift Irrigation 0 0 0 0
5 Ground Water development 0 0 0 0
6 RRR of Water Bodies 0 0 0 0
7
DOLR-MORD
PMKSY
Watershed &
Convergence
with
MGNREGA
Farm Ponds/ tanks 84 1.628 290.03 11.18
8 Check Dams 394 0.936 639.66 37.57
9 Tanks 163 8.951 2362.14 37.07
10 stop dam 351 8.367 4536.28 53.75
11 MOA&FWDAC&FW
Per Drop
More Crop
DPAP Drip 3812 0 6099.26 38.12
12 DPAP Sprinkler 39868 0 39868 83.72
Proposed (To be Renovated) No. MCM Command
Area
Cost
1
MOWR
AIBP
Major Irrigation 0 0 0 0
2 Medium Irrigation 0 0 0 0
3 Surface Minor Irrigation 0 0 0 0
4 Har Khet ko
Pani
Lift Irrigation 0 0 0 0
5 Ground Water development 3 0 0 0.11
6 RRR of Water Bodies 0 0 0 0
7
DOLR-MORD
PMKSY
Watershed &
Convergence
with
MGNREGA
Farm Ponds/ tanks 144 1.98 897.42 8.29
8 Check Dams 306 2.163 714.82 16.715
9
Renovation of water bodies
including de-silting 69 2.17 454.27 6.36
10 Tank/Stop dam renovation 42 1.308 295.71 4.2
Total 1562 56.433 69317.59 414.155

56
6.5 Strategic Action Plan for Irrigation block-Narsinghgarh
Geographical Area - 134863 Ha.
NET Sown Area - 107053 Ha.
Irrigated Area - 9886 Ha.
Partial + Undeveloped - 97167 Ha.
Water Requirement - 448.965 MCM
S.No. Concerned Ministry
/Department
Component Activity No. MCM Command
Area
(Ha.)
Cost in
(Crore
Rs.)
MOWR
AIBP
Barrage 6 2.95 1125 13.5
Proposed (newly)
1
Major Irrigation(Parvati,
Rinsi) 1 180 20000 2400
2 Medium Irrigation 0 0 0 0
3 Surface Minor Irrigation 23 5.7 1737 40.66
4 Har Khet Ko
Pani
Lift Irrigation 0 0 0 0
5 Ground Water development 0 0 0 0
6 RRR of Water Bodies 0 0 0 0
7
DOLR-MORD
PMKSY
Watershed
&
Convergence
with
MGNREGA
Farm Ponds/ tanks 106 6.122 1542.44 23.72
8 Check Dams 600 2.498 840.63 70.61
9 Tanks 12 1 221.43 3.1
10 stop dam 388 19.616 4916.43 59.38
11 MOA&FWDAC&FW
Per Drop
More Crop
DPAP Drip 5444 0 8166 54.44
12 DPAP Sprinkler 53883 0 53883 113.15
Total
Proposed (To be
Renovated)
1
MOWR
AIBP
Major Irrigation 0 0 0 0
2 Medium Irrigation 0 0 0 0
3 Surface Minor Irrigation 0 0 0 0
4 Har Khet Ko
Pani
Lift Irrigation 0 0 0 0
5 Ground Water development 0 0 0 0
6 RRR of Water Bodies 1 6.19 1120 5.51
7
DOLR-MORD
PMKSY
Watershed
&
Convergence
with
MGNREGA
Farm Ponds/ tanks 202 6.25 1642.85 21.61
8 Check Dams 455 5.19 1701.57 25.89
9
Renovation of water bodies
including de-silting 7 0.23 50 0.7
10 Tank/Stop dam renovation 31 1 221.42 3.1
Total 1832 236.746 97167.77 2835.37

57
6.6 Strategic Action Plan for Irrigation block-Sarangpur
Geographical Area - 92224
NET Sown Area - 77263
Irrigated Area - 4941
Partial + Undeveloped -72332
Water Requirement -292.125 MCM
Concerned Ministry
/Department
Component Activity No. MCM Command
Area (Ha.)
Cost
in
(Crore
Rs.)
MOWR
AIBP
From Kundaliya 0 0 35000 0
From Mohanpura 0 0 17752 0
Proposed (newly)
1 Major Irrigation 0 0 0 0
2 Medium Irrigation 0 0 0 0
3 Surface Minor Irrigation 21 4.713 1348 12.29
4
Har Khet ko
Pani
Lift Irrigation 0 0 0 0
5
Ground Water
development 0 0 0 0
6 RRR of Water Bodies 0 0 0 0
7
DOLR-MORD
PMKSY
Watershed
&
Convergence
with
MGNREGA
Farm Ponds/ tanks 66 1.225 220.5 9.9
8 Check Dams 920 2.779 651.71 105.38
9 Tanks 67 1.33 449.91 7.02
10 stop dam 270 1.56 547 24.6
11 MOA&FWDAC&FW
Per Drop
More Crop
DPAP Drip 4694 0 7041 46.94
12 DPAP Sprinkler 5898 0 5898 12.38
Proposed (To be
Renovated)
1
MOWR
AIBP
Major Irrigation 0 0 0 0
2 Medium Irrigation 0 0 0 0
3 Surface Minor Irrigation 0 0 0 0
4 Har Khet ko
Pani
Lift Irrigation 0 0 0 0
5
Ground Water
development 0 0 0 0
6 RRR of Water Bodies 1 1.87 380 0.65
7
DOLR-MORD
PMKSY
Watershed
&
Convergence
with
MGNREGA
Farm Ponds/ tanks 346 6.34 1828.89 25.71
8 Check Dams 344 3.336 1165.45 26.07
9
Renovation of water
bodies including de-
silting 4 0.13 28.57 0.4
10
Tank/Stop dam
renovation 3 0.1 21.43 0.3
Total 2042 23.383 72332.46 271.64

58
CHAPTER-7
Strategic action plan for district irrigation

59
7 Strategic Action Plan For District
Total Geographical Area =616109 Ha.
Cultivated Area =439102 Ha.
Irrigated Area =52014 Ha.
Partially + Undeveloped Area = 387088 Ha.
S.
No
.
Concerned
Ministry
/Department
Component Activity No. MCM Comman
d Area
(ha.)
Cost Rs.
Crore
1
MOWR
AIBP
On going 11 1166.38 198430 8433
5 Proposed (newly)
6
Major
Irrigation(Parvati,Rinsi) 1 180 30000 2400
7 Medium Irrigation 0 0 0 0
8
Surface Minor
Irrigation 70 38.32 8980 212
9
Har Khet Ko
Pani
Lift Irrigation 0 0 0 0
10
Ground Water
development 2884 50 0 8
11 RRR of Water Bodies 0 0 0 0
12
DOLR-
MORD
PMKSY
Watershed &
Convergence
with
MGNREGA
Farm Ponds/ tanks 1165 52.466 12408.82 217
13 Check Dams 2878 34.71 7937.58 332
14 Tanks 546 59.361 11464.19 143
15 stop dam 1374 47.693 15503.07 226
16 MOA&FWD
AC&FW
Per Drop
More Crop
DPAP Drip 17161 0 26122.76 183
17 DPAP Sprinkler 100167 0 100167 218
18 Total 126257 1677 411013.42 12372.13
19
Proposed (To be
Renovated)
20
MOWR
AIBP
Major Irrigation 0 0 0 0
21 Medium Irrigation 0 0 0 0
22
Surface Minor
Irrigation 0 0 0 0
23 Har Khet Ko
Pani
Lift Irrigation 0 0 0 0
24
Ground Water
development 3 0 0 0.11
25 RRR of Water Bodies 13 33.7 4408 18
26
DOLR-
MORD
PMKSY
Watershed &
Convergence
with
MGNREGA
Farm Ponds/ tanks 1228 47.24 12486.87 110.8
27 Check Dams 1433 19.538 5982.94 96.815
28
Renovation of water
bodies including de-
silting
144 4.35 989.98 13.86
29
Tank/Stop dam
renovation 85 2.618 595.69 8.5
Total 2906 107.446 24463.48 247.725
30 Grant Total 11835 1737 435476.9 12620

60
Fig. 7.1
61
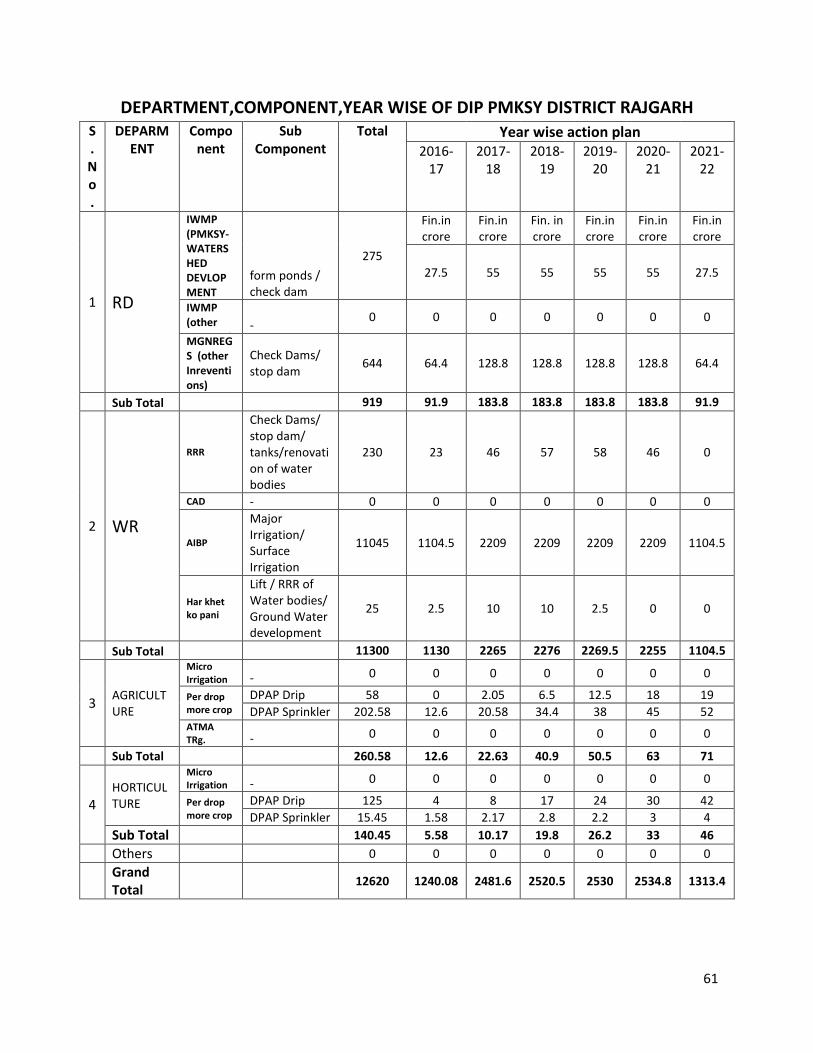
DEPARTMENT,COMPONENT,YEAR WISE OF DIP PMKSY DISTRICT RAJGARH S
.
N
o
.
DEPARM
ENT
Compo
nent
Sub
Component
Total Year wise action plan
2016-
17
2017-
18
2018-
19
2019-
20
2020-
21
2021-
22
1 RD
IWMP
(PMKSY-
WATERS
HED
DEVLOP
MENT
form ponds /
check dam
275
Fin.in
crore
Fin.in
crore
Fin. in
crore
Fin.in
crore
Fin.in
crore
Fin.in
crore
27.5 55 55 55 55 27.5
IWMP
(other
Inreventi-
0 0 0 0 0 0 0
MGNREG
S (other
Inreventi
ons)
Check Dams/
stop dam 644 64.4 128.8 128.8 128.8 128.8 64.4
Sub Total 919 91.9 183.8 183.8 183.8 183.8 91.9
2 WR
RRR
Check Dams/
stop dam/
tanks/renovati
on of water
bodies
230 23 46 57 58 46 0
CAD - 0 0 0 0 0 0 0
AIBP
Major
Irrigation/
Surface
Irrigation
11045 1104.5 2209 2209 2209 2209 1104.5
Har khet
ko pani
Lift / RRR of
Water bodies/
Ground Water
development
25 2.5 10 10 2.5 0 0
Sub Total 11300 1130 2265 2276 2269.5 2255 1104.5
3 AGRICULT
URE
Micro
Irrigation - 0 0 0 0 0 0 0
Per drop
more crop
DPAP Drip 58 0 2.05 6.5 12.5 18 19
DPAP Sprinkler 202.58 12.6 20.58 34.4 38 45 52 ATMA
TRg. - 0 0 0 0 0 0 0
Sub Total 260.58 12.6 22.63 40.9 50.5 63 71
4
HORTICUL
TURE
Micro
Irrigation - 0 0 0 0 0 0 0
Per drop
more crop
DPAP Drip 125 4 8 17 24 30 42
DPAP Sprinkler 15.45 1.58 2.17 2.8 2.2 3 4
Sub Total 140.45 5.58 10.17 19.8 26.2 33 46
Others 0 0 0 0 0 0 0
Grand
Total 12620 1240.08 2481.6 2520.5 2530 2534.8 1313.4

62