Embed Size (px)
Citation preview

European Centre for Disease Prevention and Control, 171 83 Stockholm, Sweden www.ecdc.europa.eu
Final Annual Accounts 2013 of the European Centre for Disease Prevention and
Control
Ninth Financial Year – 2013
Stockholm, June 10th 2014
Final Annual Accounts 2013
I
Table of Contents Page
Final Annual Accounts 2013
1. Annual Accounts – Certification ……………………………………………………………… 1 2. Annual Accounts – Presentation……………………………………………………………… 2 3. Accounting Principles, Rules and Methods………………………………………………… 3 4. Financial Statements……………………………………………………………………………… 6 4.1. Balance Sheet ………………………………………………………………………… 6 4.2. Economic Outturn Account………………………………………………………… 7 4.3. Cash Flow Statement………………………………………………………………… 8 4.4. Statement of Changes in Capital………………………………………………… 9 4.5. Notes to the Financial Statements……………………………………………… 10-19 5. Report on the Budget Implementation …………………………………………………… 20 5.1. Budget Execution …………………………………………………………………… 20 5.2. Explanatory notes to the Budget ……………………………………………… 21-24 Annexes Annex 1 – Budget Execution /Fund source C1 – Current year appropriations …… 25-29 – Budget Execution /Fund source C4 & C5 – Current year appropriations 30 Annex 2 – Budget Execution /Fund source C8 – Appropriations carried over …… 31-34 Annex 3 – Budget Execution/Fund source R0 – External Assigned Revenue……… 35
Report on budget and financial Management 2013………………………………… 36-45
Final Annual Accounts 2013
1
1. Final Annual Accounts – Certification The annual accounts of the European Centre for Disease Prevention and Control for the year 2013
have been prepared in accordance with the Financial Regulation applicable to the general budget of the European Union and the accounting rules adopted by the Commission's Accounting Officer, as are
to be applied by all the institutions, agencies and joint undertakings.
I acknowledge my responsibility for the preparation and presentation of the annual accounts of the
European Centre for Disease Prevention and Control in accordance with article 50 of ECDC’s Financial Regulation.
I have obtained from the authorising officer, who certified its reliability, all the information necessary for the production of the accounts that show the European Centre for Disease Prevention and
Control's assets and liabilities and the budgetary implementation.
I hereby certify that based on this information, and on such checks as I deemed necessary to sign off
the accounts, I have a reasonable assurance that the accounts present a true and fair view of the financial position of the European Centre for Disease Prevention and Control in all material aspects .
Stockholm, June 10 th 2014
Van Brabant Anja
Accounting Officer of ECDC
Final Annual Accounts 2013
2
2. Annual Accounts – Presentation The annual accounts of the European Centre for Disease Prevention and Control include the financial
statements and the report on implementation of the budget. They are accompanied by the report on budget and financial management during the year.
The financial statements comprise the balance sheet and the economic outturn account at 31 December, the cash-flow table and the statement of changes in capital.
The objectives of financial statements are to provide information about the financial position,
performance and cash flows of an entity that is useful to a wide range of users. For a public sector
entity such as the European Centre for Disease Prevention and Control, the objectives are more specifically to provide information useful for decision making, and to demonstrate the accountability
of the entity for the resources entrusted to it.
If they are to present a true and fair view, financial statements must not only supply relevant
information to describe the nature and range of the activities, explain how it is financed and supply definitive information on its operations, but also do so in a clear and comprehensible manner which
allows comparisons between financial years. It is with these goals in mind that the present document has been drawn up.
The accounting system of the European Centre for Disease Prevention and Control comprises budget
accounts and general accounts. These accounts are kept in euro on the basis of the calendar year.
The budget accounts give a detailed picture of the implementation of the budget. They are based on the modified cash accounting principle.1 The general accounts allow for the preparation of the
financial statements as they show all revenues and expenses for the financial year and are designed to establish the financial position in the form of a balance sheet at 31 December.
The annual accounts are drawn up in accordance with Article 92 of the Financial Regulation of the European Centre for Disease Prevention and Control adopted by the Management Board on 19th
December 2013.
According to Article 98 of this Financial Regulation, the Centre’s accounting officer shall send to the
Commission’s accounting officer by no later than 1 March of the following year its Provisional Annual
Accounts, together with the report on budgetary and financial management during the year, referred to in Article 92 of this regulation.
The Accounting Officer shall send the final accounts, together with the opinion of the management board, to the accounting officer of the Commission, the Court of Auditors, the European Parliament
and the Council, by 1 July of the following financial year.
The final accounts of ECDC will be published in the Official Journal of the European Communities
together with the statement of assurance given by the Court of Auditors by 15th of November of the following year in accordance with Article 99 of ECDC’s Financial Regulation.
1 This differs from cash-based accounting because of elements such as carryovers.

Final Annual Accounts 2013
3
3. Accounting principles, rules and methods The Annual Accounts of the Centre have been prepared according to Article 94 of the Financial
Regulation which stipulates that, the rules adopted by the Accounting Officer of the European
Commission based on internationally accepted accounting standards for public sector, shall apply. The financial statements referred to in Article 92 shall present information, including information on
accounting policies, in a manner that ensures it is relevant, reliable, comparable and understandable.
Reporting Currency
The Centre’s reporting currency is the Euro
Transactions and balances
Foreign currency transactions are converted into Euro using the exchange rates prevailing at the dates of the transactions.
Year-end balances of monetary assets and liabilities denominated in foreign currencies are converted into Euro on the basis of the exchange rates applying on 31 December.
Foreign exchange gains and losses resulting from the settlement of foreign currency transactions and from the translation at year-end exchange rates of monetary assets and liabilities denominated in
foreign currencies are recognised in the economic outturn account. Intangible fixed assets & Internally Developed Intangible fixed assets Intangible fixed assets are valued at their acquisition price converted into Euro at the rate applying when they were purchased, less depreciation and impairment. The exception is assets acquired free of charge that are valued at their market value. See amortisation rates below. The Accounting Officer of the European Commission had granted a temporary exception with respect to the introduction of the International Public Sector Accounting Standards (IPSAS) based EC rules. One of these exceptions related to Accounting Rule n°6 and the non-capitalisation of internally developed intangible assets, normally software. From 2010 onwards, the exception has been lifted and as a consequence, the annual accounts have to reflect the capitalization of internally developed intangible fixed assets in accordance with the rules laid down. From an accounting perspective there are only three phases to an IT Project: a Research phase, a Development phase and an Operational phase. Under the accounting rule, only the development phase can be capitalized and recorded as ‘Assets under construction’. Once the project goes live, the resulting asset (the development cost) will be amortised over its useful life which means the costs will be spread over several years. The depreciation rates should range between 3 and 8 years. The depreciation follows the same principle as applied to the Centre’s fixed assets i.e. if a project goes live in the first half of a month then the depreciation is applicable for that same month, if a project goes live on or following the 16th of a month then the depreciation applies starting from the following month. The amount of research expenses incurred on IT projects and development costs not capitalized are disclosed in these annual accounts 2013 as required. In addition to the criteria which an intangible asset should meet, also a threshold had to be set for the total estimated development cost of an IT project. The threshold at ECDC was set at € 150.000.

Final Annual Accounts 2013
4
The application of accounting rule n° 6 in the annual accounts of 2013 increases the transparency regarding the Centre’s internally developed intangible fixed assets in particular its internally developed IT projects (for example GIS, EPIS, VBORNET, E3, Tessy, CRM, DMS and others) In 2013, the following projects have gone live: VBORNET, DMS, CRM and GIS EMMA. As a consequence, their development costs, booked in previous years as ‘Intangible assets under construction’ are now depreciated, starting 2013, over the next four years. Tangible fixed assets Tangible fixed assets are stated at historical cost. Historical cost includes expenditure that is directly attributable to the acquisition of the items. Subsequent costs are included in the asset’s carrying amount or recognised as a separate asset, as appropriate, only when it is probable that future economic benefits associated with the item will flow to the Centre and the cost of the item can be measured reliably. All other repairs and maintenance are charged to the economic outturn account during the financial period in which they are incurred. Depreciation is calculated using the straight line method to allocate depreciation cost to the assets’ residual values over their estimated useful lives, as follows:
The fixed asset’s depreciation commences in the month if the asset’s delivery date is before or on the 15th of the month, while if the delivery date of the asset is on the 16th or after that date, the monthly
depreciation will only commence the following month.
The assets’ residual values and useful lives are reviewed, and adjusted if appropriate, on a regular
basis. An asset’s carrying amount is written down immediately to its recoverable amount if the asset’s carrying amount is greater than its estimated recoverable amount. Gains and losses on disposals are
determined by comparing proceeds with carrying amount. These are included in the economic outturn account.
In addition, improvements to the building are capitalized and depreciated over the lease period which runs according to the contract signed in 2007 between ECDC and the landlord Akademiska Hus AB
until 31/1/2018.
Type of Asset Depreciation Rate
Intangible assets 25%
Plant, machinery and equipment 10% to 25%
Furniture & Vehicles 10% to 25%
Fixtures and fittings 10% to 33%
Computer hardware 25%
Final Annual Accounts 2013
5
Impairment of assets
Assets that have an indefinite useful life are not subject to amortization and are tested regularly for
impairment. Assets that are subject to amortization are reviewed for impairment whenever events or
changes in circumstances indicate that the carrying amount may not be recoverable. An impairment
loss is recognized as the amount by which the asset’s carrying amount exceeds its recoverable amount.
The recoverable amount is the higher of an asset’s fair value less costs to sell and value in use. Inventories The inventories shown in the accounts reflect the stock of publications of the Centre at year-end. These inventories are assets held for distribution in the ordinary course of its operations. The Centre’s inventories are goods purchased which are for distribution to other parties free of charge. These parties are mainly our stakeholders: Management Board, Advisory Forum, Member States, and Competent Bodies etc. These publications are also distributed at conferences and events. As the Centre controls the rights to create and issue various assets, these publications are recognized as inventories and reported at their printing cost. The cost of these inventories is assigned by using the first-in, first-out method (FIFO). Publications which are, at year-end, older then N-1, are written down as these hold no longer a service potential expected to be realized from their distribution. Receivables
Receivables are carried at original invoice amount less write-down for impairment. A write-down for impairment of receivables is established when there is objective evidence that the Centre will not be able to collect all amounts due according to the original terms of receivables. Cash & cash equivalents
Cash and cash equivalents include bank accounts and one imprest account. Use of estimates In accordance with generally accepted accounting principles, the financial statements necessarily include amounts based on estimates and assumptions by management. Significant estimates include, but are not limited to, accrued income and charges, contingent assets and liabilities, and degree of impairment of fixed assets. Actual results could differ from those estimates. Changes in estimates are reflected in the period in which they become known.
Final Annual Accounts 2013
6
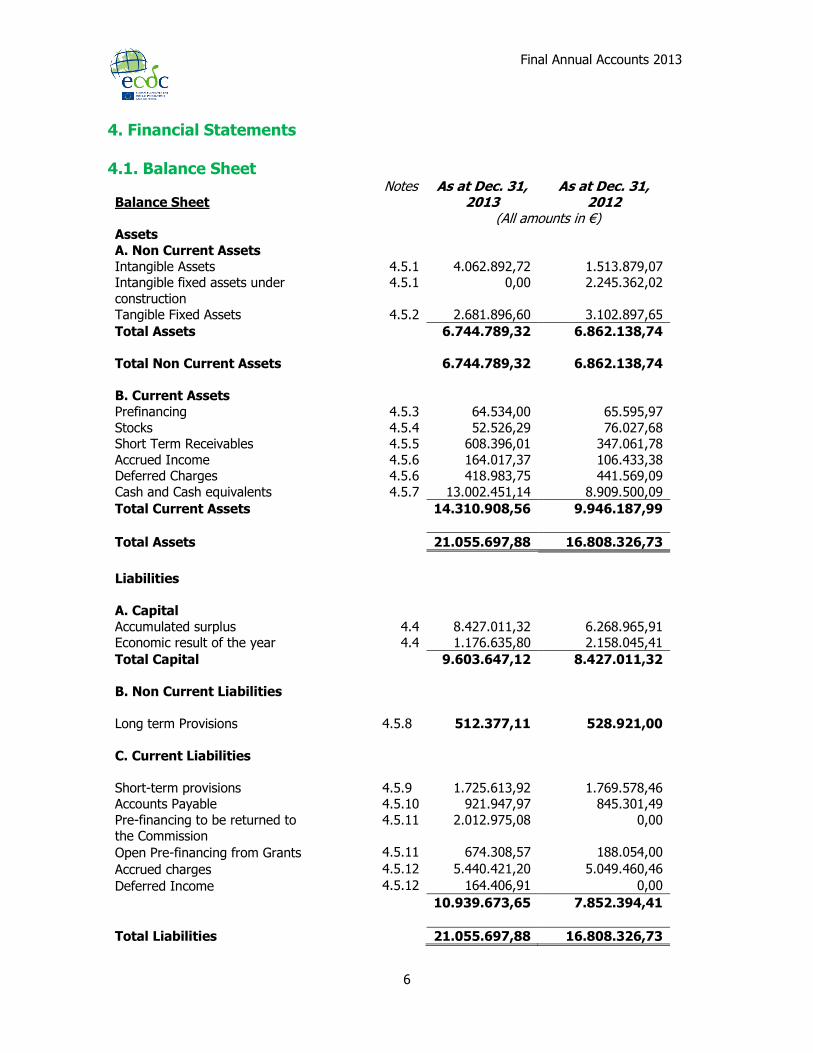
4. Financial Statements 4.1. Balance Sheet
Balance Sheet Notes As at Dec. 31,
2013 As at Dec. 31,
2012 (All amounts in €) Assets
A. Non Current Assets
Intangible Assets 4.5.1 4.062.892,72 1.513.879,07 Intangible fixed assets under
construction
4.5.1 0,00 2.245.362,02
Tangible Fixed Assets 4.5.2 2.681.896,60 3.102.897,65
Total Assets 6.744.789,32 6.862.138,74
Total Non Current Assets 6.744.789,32 6.862.138,74
B. Current Assets
Prefinancing 4.5.3 64.534,00 65.595,97
Stocks 4.5.4 52.526,29 76.027,68 Short Term Receivables 4.5.5 608.396,01 347.061,78
Accrued Income 4.5.6 164.017,37 106.433,38 Deferred Charges 4.5.6 418.983,75 441.569,09
Cash and Cash equivalents 4.5.7 13.002.451,14 8.909.500,09
Total Current Assets 14.310.908,56 9.946.187,99
Total Assets 21.055.697,88 16.808.326,73
Liabilities
A. Capital
Accumulated surplus 4.4 8.427.011,32 6.268.965,91 Economic result of the year 4.4 1.176.635,80 2.158.045,41
Total Capital 9.603.647,12 8.427.011,32
B. Non Current Liabilities
Long term Provisions
4.5.8 512.377,11 528.921,00
C. Current Liabilities
Short-term provisions 4.5.9 1.725.613,92 1.769.578,46 Accounts Payable 4.5.10 921.947,97 845.301,49
Pre-financing to be returned to the Commission
4.5.11 2.012.975,08 0,00
Open Pre-financing from Grants 4.5.11 674.308,57 188.054,00
Accrued charges 4.5.12 5.440.421,20 5.049.460,46
Deferred Income 4.5.12 164.406,91 0,00
10.939.673,65 7.852.394,41
Total Liabilities 21.055.697,88 16.808.326,73
Final Annual Accounts 2013
7
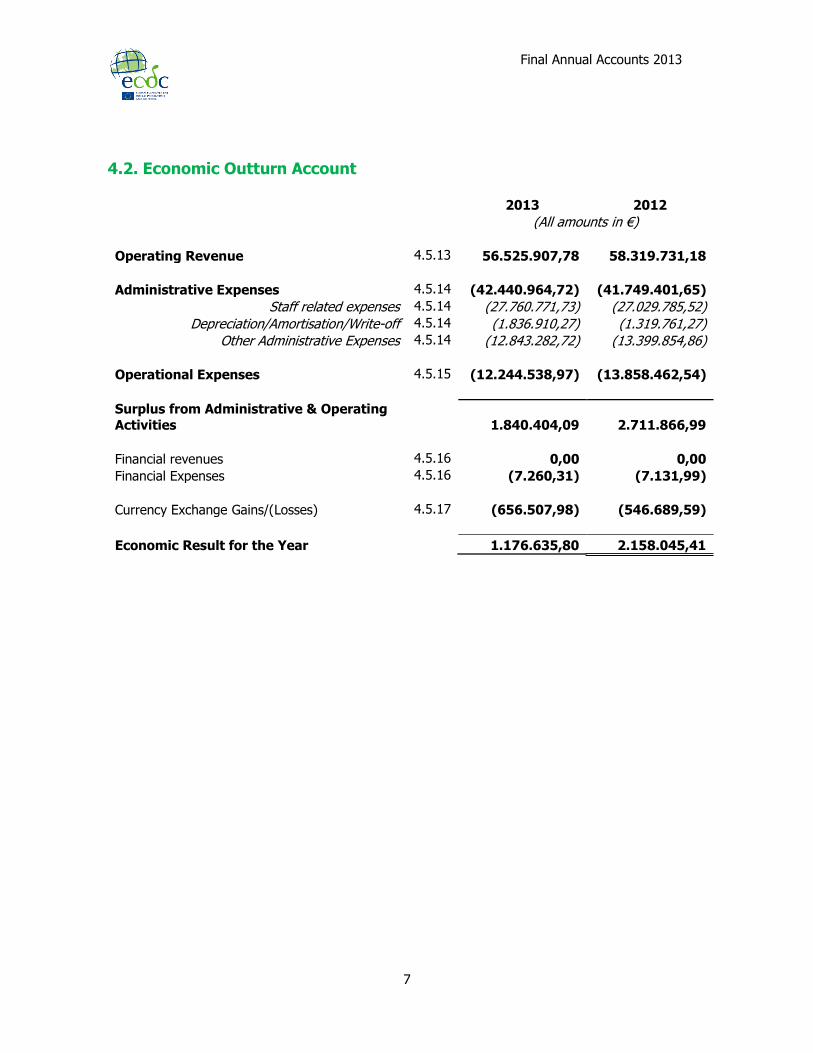
4.2. Economic Outturn Account
2013 2012
(All amounts in €)
Operating Revenue 4.5.13 56.525.907,78 58.319.731,18
Administrative Expenses 4.5.14 (42.440.964,72) (41.749.401,65)
Staff related expenses 4.5.14 (27.760.771,73) (27.029.785,52)
Depreciation/Amortisation/Write-off 4.5.14 (1.836.910,27) (1.319.761,27) Other Administrative Expenses 4.5.14 (12.843.282,72) (13.399.854,86)
Operational Expenses 4.5.15 (12.244.538,97) (13.858.462,54)
Surplus from Administrative & Operating
Activities
1.840.404,09 2.711.866,99
Financial revenues 4.5.16 0,00 0,00
Financial Expenses 4.5.16 (7.260,31) (7.131,99)
Currency Exchange Gains/(Losses) 4.5.17 (656.507,98) (546.689,59)
Economic Result for the Year 1.176.635,80 2.158.045,41
Final Annual Accounts 2013
8
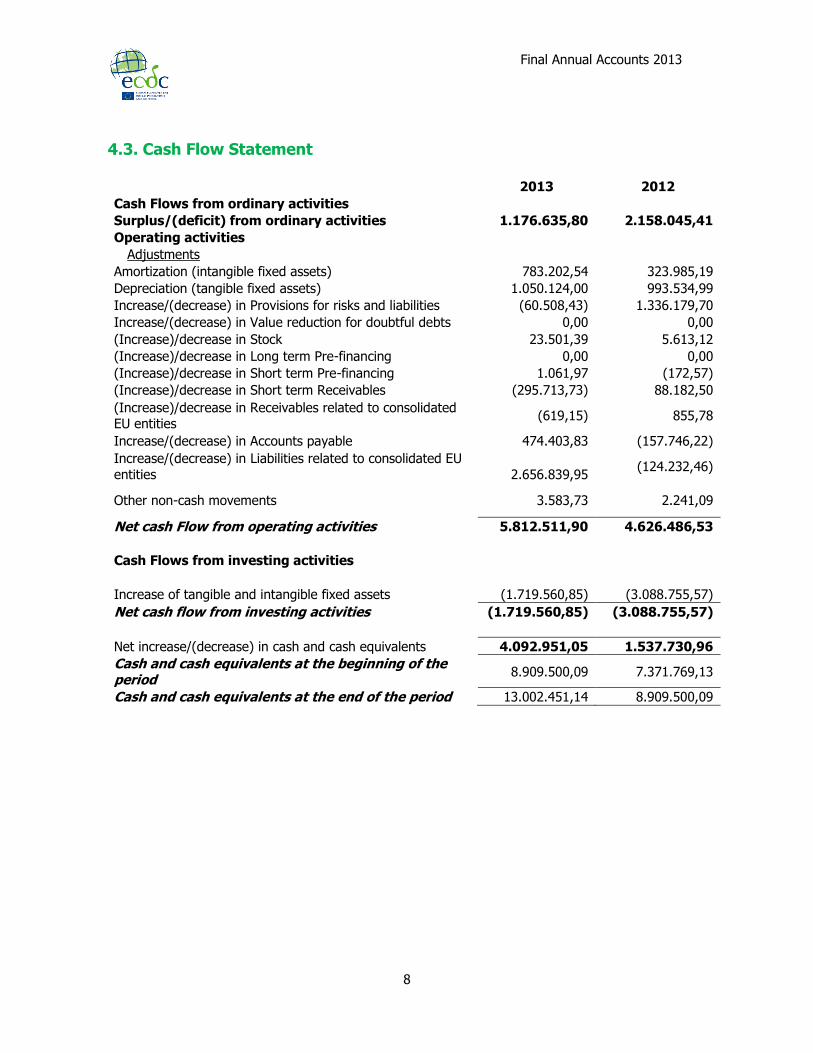
4.3. Cash Flow Statement 2013 2012
Cash Flows from ordinary activities Surplus/(deficit) from ordinary activities 1.176.635,80 2.158.045,41
Operating activities
Adjustments
Amortization (intangible fixed assets) 783.202,54 323.985,19
Depreciation (tangible fixed assets) 1.050.124,00 993.534,99
Increase/(decrease) in Provisions for risks and liabilities (60.508,43) 1.336.179,70
Increase/(decrease) in Value reduction for doubtful debts 0,00 0,00
(Increase)/decrease in Stock 23.501,39 5.613,12
(Increase)/decrease in Long term Pre-financing 0,00 0,00
(Increase)/decrease in Short term Pre-financing 1.061,97 (172,57)
(Increase)/decrease in Short term Receivables (295.713,73) 88.182,50
(Increase)/decrease in Receivables related to consolidated EU entities
(619,15) 855,78
Increase/(decrease) in Accounts payable 474.403,83 (157.746,22)
Increase/(decrease) in Liabilities related to consolidated EU
entities
2.656.839,95 (124.232,46)
Other non-cash movements 3.583,73 2.241,09
Net cash Flow from operating activities 5.812.511,90 4.626.486,53
Cash Flows from investing activities
Increase of tangible and intangible fixed assets (1.719.560,85) (3.088.755,57)
Net cash flow from investing activities (1.719.560,85) (3.088.755,57)
Net increase/(decrease) in cash and cash equivalents 4.092.951,05 1.537.730,96
Cash and cash equivalents at the beginning of the period
8.909.500,09 7.371.769,13
Cash and cash equivalents at the end of the period 13.002.451,14 8.909.500,09
Final Annual Accounts 2013
9
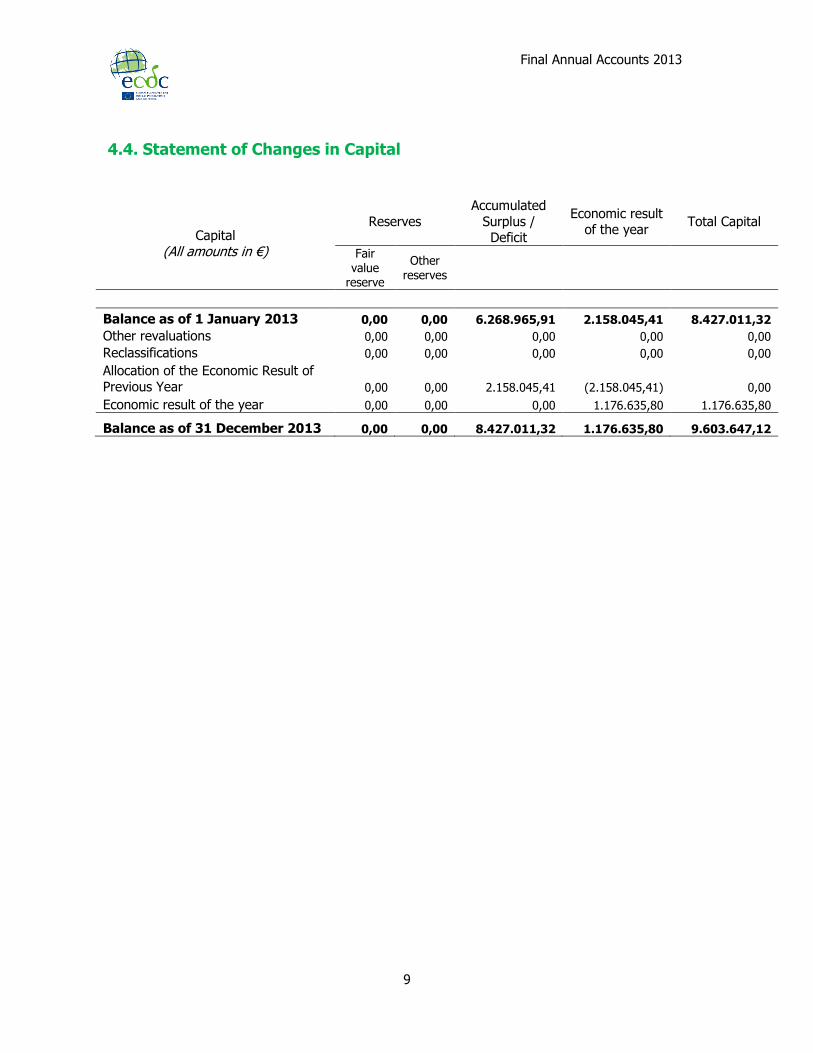
4.4. Statement of Changes in Capital
Capital
(All amounts in €)
Reserves
Accumulated
Surplus / Deficit
Economic result of the year
Total Capital
Fair value
reserve
Other reserves
Balance as of 1 January 2013 0,00 0,00 6.268.965,91 2.158.045,41 8.427.011,32
Other revaluations 0,00 0,00 0,00 0,00 0,00
Reclassifications 0,00 0,00 0,00 0,00 0,00
Allocation of the Economic Result of
Previous Year 0,00 0,00 2.158.045,41 (2.158.045,41) 0,00
Economic result of the year 0,00 0,00 0,00 1.176.635,80 1.176.635,80
Balance as of 31 December 2013 0,00 0,00 8.427.011,32 1.176.635,80 9.603.647,12

Final Annual Accounts 2013
10
4.5. Notes to the Financial Statements 4.5.1. Intangible Assets
All amounts in €
Internally
generated Computer
Software
Other
Computer
Software
Total Computer Software
Other
Intangible
assets (1)
Intangible fixed
assets under
construction
Total
Gross carrying amounts 01.01.2013
865.504,92 1.823.083,55 2.688.588,47 00,0 2.245.362,02 4.933.950,49
Additions
145.330,40 145.330,40
943.314,47 1.088.644,87
Disposals
(201.226,02) (201.226,02)
(201.226,02)
Transfer between headings 3.188.676,49
3.188.676,49
(3.188.676,49) 0,00
Other changes
Gross carrying amounts 31.12.2013
4.054.181,41 1.767.187,93 5.821.369,34 0,00 0,00 5.821.369,34
Accumulated amortization and impairment 01.01.2013
(1.174.709,40) (1.174.709,40)
0,00 (1.174.709,40)
Amortization (470.057,73) (313.144,81) (783.202,54)
0,00 (783.202,54)
Write-back of amortization
Disposals
199.435,32 199.435,32
0,00 199.435,32
Accumulated amortization 31.12.2013
(470.057,73) (1.288.418,89) (1.758.476,62)
0,00 (1.758.476,62)
Net carrying amounts 31.12.2013
3.584.123,68 478.769,04 4.062.892,72
0,00 0,00 4.062.892,72
Not capitalised cost Research cost Not capitalised
development cost *
Cost of the year 2013 138.404,86 114.937,99
Final Annual Accounts 2013
11
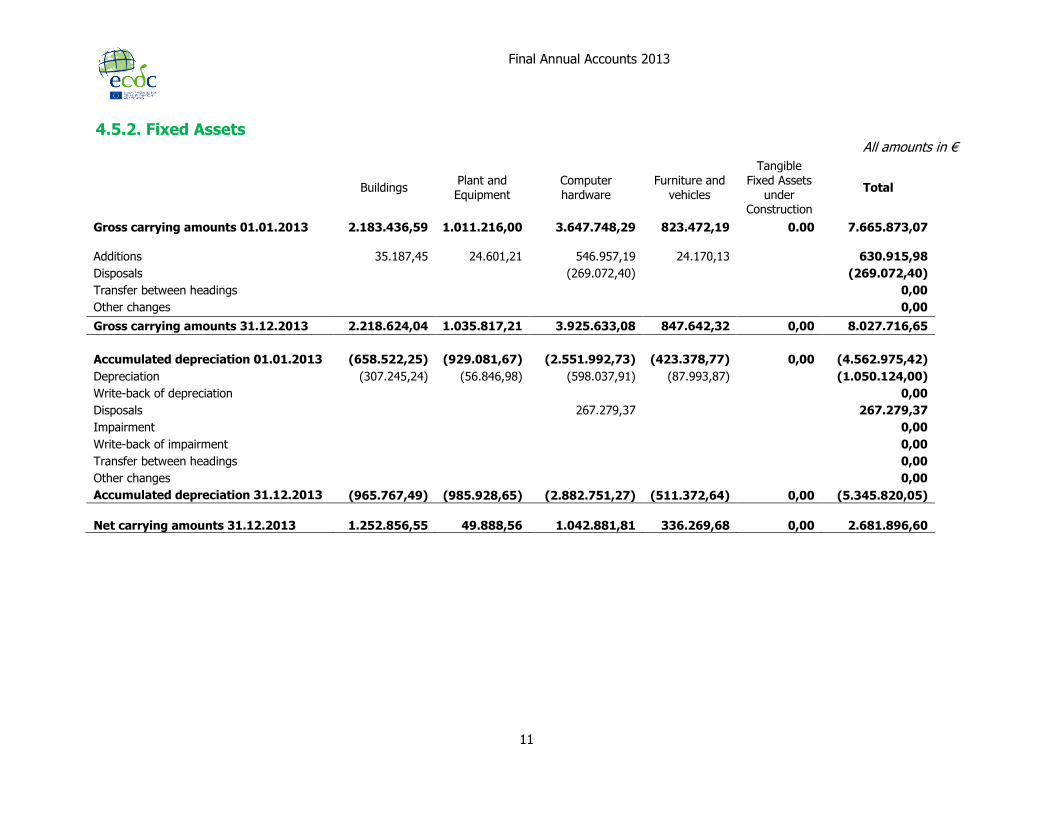
4.5.2. Fixed Assets All amounts in €
Buildings Plant and Equipment
Computer hardware
Furniture and vehicles
Tangible Fixed Assets
under Construction
Total
Gross carrying amounts 01.01.2013 2.183.436,59 1.011.216,00 3.647.748,29 823.472,19 0.00 7.665.873,07
Additions 35.187,45 24.601,21 546.957,19 24.170,13 630.915,98
Disposals (269.072,40) (269.072,40)
Transfer between headings 0,00
Other changes 0,00
Gross carrying amounts 31.12.2013 2.218.624,04 1.035.817,21 3.925.633,08 847.642,32 0,00 8.027.716,65
Accumulated depreciation 01.01.2013 (658.522,25) (929.081,67) (2.551.992,73) (423.378,77) 0,00 (4.562.975,42)
Depreciation (307.245,24) (56.846,98) (598.037,91) (87.993,87) (1.050.124,00)
Write-back of depreciation 0,00
Disposals 267.279,37 267.279,37
Impairment 0,00
Write-back of impairment 0,00
Transfer between headings 0,00
Other changes 0,00
Accumulated depreciation 31.12.2013 (965.767,49) (985.928,65) (2.882.751,27) (511.372,64) 0,00 (5.345.820,05)
Net carrying amounts 31.12.2013
1.252.856,55
49.888,56
1.042.881,81
336.269,68
0,00
2.681.896,60
Final Annual Accounts 2013
12
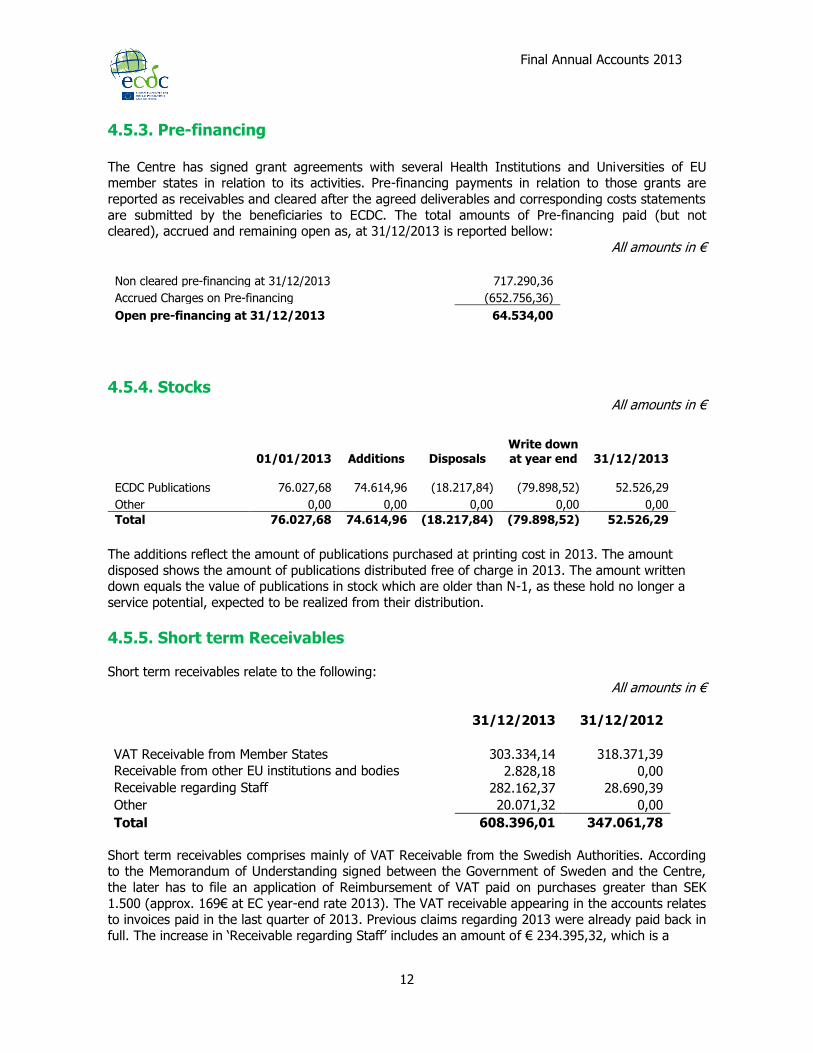
4.5.3. Pre-financing The Centre has signed grant agreements with several Health Institutions and Universities of EU member states in relation to its activities. Pre-financing payments in relation to those grants are
reported as receivables and cleared after the agreed deliverables and corresponding costs statements
are submitted by the beneficiaries to ECDC. The total amounts of Pre-financing paid (but not cleared), accrued and remaining open as, at 31/12/2013 is reported bellow:
All amounts in €
Non cleared pre-financing at 31/12/2013 717.290,36
Accrued Charges on Pre-financing (652.756,36)
Open pre-financing at 31/12/2013 64.534,00
4.5.4. Stocks
All amounts in €
01/01/2013 Additions Disposals
Write down at year end 31/12/2013
ECDC Publications 76.027,68 74.614,96 (18.217,84) (79.898,52) 52.526,29
Other 0,00 0,00 0,00 0,00 0,00
Total 76.027,68 74.614,96 (18.217,84) (79.898,52) 52.526,29
The additions reflect the amount of publications purchased at printing cost in 2013. The amount
disposed shows the amount of publications distributed free of charge in 2013. The amount written down equals the value of publications in stock which are older than N-1, as these hold no longer a
service potential, expected to be realized from their distribution.
4.5.5. Short term Receivables
Short term receivables relate to the following: All amounts in €
31/12/2013 31/12/2012
VAT Receivable from Member States 303.334,14 318.371,39
Receivable from other EU institutions and bodies 2.828,18 0,00
Receivable regarding Staff 282.162,37 28.690,39
Other 20.071,32 0,00
Total 608.396,01 347.061,78
Short term receivables comprises mainly of VAT Receivable from the Swedish Authorities. According to the Memorandum of Understanding signed between the Government of Sweden and the Centre,
the later has to file an application of Reimbursement of VAT paid on purchases greater than SEK
1.500 (approx. 169€ at EC year-end rate 2013). The VAT receivable appearing in the accounts relates to invoices paid in the last quarter of 2013. Previous claims regarding 2013 were already paid back in
full. The increase in ‘Receivable regarding Staff’ includes an amount of € 234.395,32, which is a
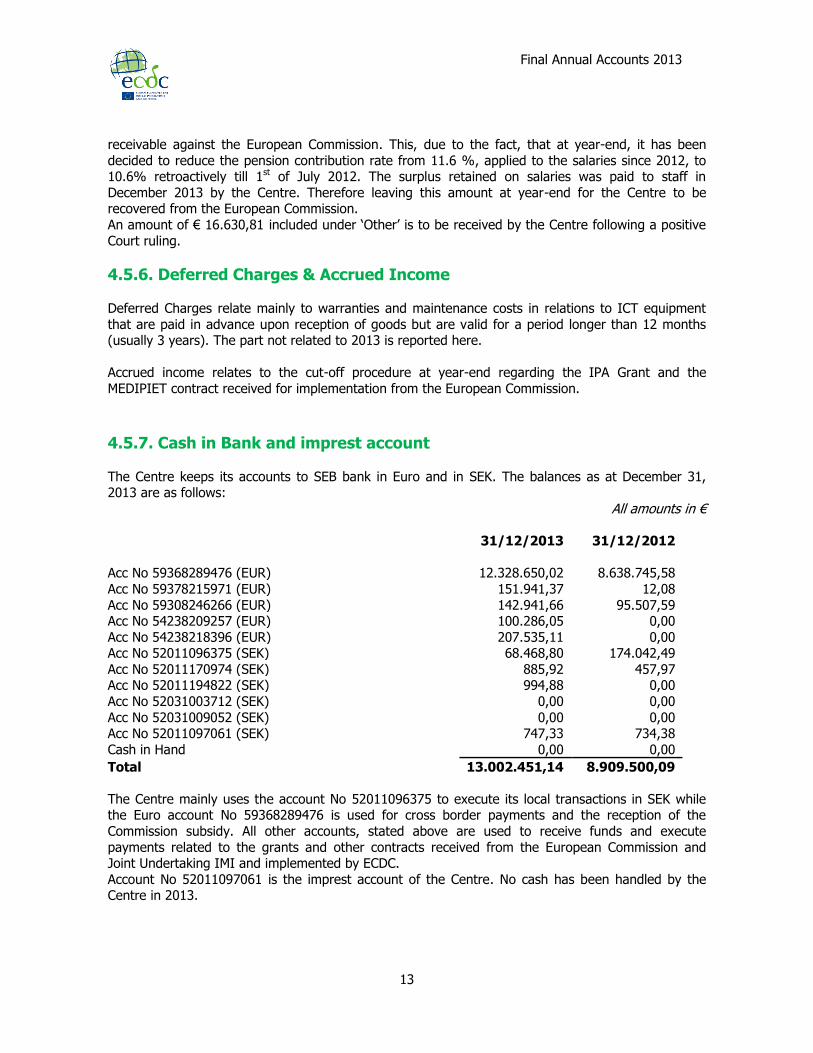
Final Annual Accounts 2013
13
receivable against the European Commission. This, due to the fact, that at year-end, it has been
decided to reduce the pension contribution rate from 11.6 %, applied to the salaries since 2012, to 10.6% retroactively till 1st of July 2012. The surplus retained on salaries was paid to staff in
December 2013 by the Centre. Therefore leaving this amount at year-end for the Centre to be recovered from the European Commission.
An amount of € 16.630,81 included under ‘Other’ is to be received by the Centre following a positive
Court ruling.
4.5.6. Deferred Charges & Accrued Income
Deferred Charges relate mainly to warranties and maintenance costs in relations to ICT equipment
that are paid in advance upon reception of goods but are valid for a period longer than 12 months (usually 3 years). The part not related to 2013 is reported here.
Accrued income relates to the cut-off procedure at year-end regarding the IPA Grant and the
MEDIPIET contract received for implementation from the European Commission.
4.5.7. Cash in Bank and imprest account
The Centre keeps its accounts to SEB bank in Euro and in SEK. The balances as at December 31, 2013 are as follows:
All amounts in €
31/12/2013 31/12/2012
Acc No 59368289476 (EUR) 12.328.650,02 8.638.745,58
Acc No 59378215971 (EUR) 151.941,37 12,08
Acc No 59308246266 (EUR) 142.941,66 95.507,59 Acc No 54238209257 (EUR) 100.286,05 0,00
Acc No 54238218396 (EUR) 207.535,11 0,00 Acc No 52011096375 (SEK) 68.468,80 174.042,49
Acc No 52011170974 (SEK) 885,92 457,97 Acc No 52011194822 (SEK) 994,88 0,00
Acc No 52031003712 (SEK) 0,00 0,00
Acc No 52031009052 (SEK) 0,00 0,00 Acc No 52011097061 (SEK) 747,33 734,38
Cash in Hand 0,00 0,00
Total 13.002.451,14 8.909.500,09
The Centre mainly uses the account No 52011096375 to execute its local transactions in SEK while the Euro account No 59368289476 is used for cross border payments and the reception of the
Commission subsidy. All other accounts, stated above are used to receive funds and execute
payments related to the grants and other contracts received from the European Commission and Joint Undertaking IMI and implemented by ECDC.
Account No 52011097061 is the imprest account of the Centre. No cash has been handled by the Centre in 2013.

Final Annual Accounts 2013
14
4.5.8. Long Term Provisions In accordance with the lease contract with the landlord, the Centre has the obligation to restore the
building in its original state when vacating the premises at the end of the lease, this obligation is still reflected in the accounts. Based on a study carried out in 2012, the dilapidation cost of this obligation
has been estimated at 4.539.200 SEK, which equals 512.377 € (converted at the official EC 2013
year-end exchange rate applicable for SEK).
4.5.9. Short Term Provisions In 2013, additional provisions were booked due to the following. A legal action with the Court of
Justice was introduced in previous years by the European Commission against the decision from the Council, not to adopt the European Commission’s proposals related to the annual salary adjustment
for 2011 and 2012 of the remuneration and pension of the officials and other servants of the European Union and the corrections coefficients applied thereto. In November 2013, a negative ruling
was pronounced by the Court of Justice on the given proposal, but also with the instruction for the
European Commission to provide the Council with a new proposal. Following this new proposal, provisions have been recalculated, taking also into account the aspect of exchange rate differences
involved and provisioned for in the accounts 2013. An amount of € 224.295,27 has been booked regarding the 2011 salary adjustments and € 1.201.318,65 for the salary adjustments of 2012.
Another provision related to a court case from previous years remains in the accounts of 2013, as the decision from the Court has been appealed.
4.5.10. Accounts Payable The breakdown of accounts payable at the end of the year is as follows:
All amounts in €
31/12/2013 31/12/2012
Vendors 741.991,61 815.648,83 Interest Income payable to the Commission (1) 6.403,69 22.045,70
Other payables to the Commission 55.147,81 300,36 Payables to other EU agencies 18.118,81 300,36
Other payables to Member States 0,00 7.306,60
Social Security Contributions & income taxes payable 0,00 0,00 Sundry Payables 100.286,05 0,00
Total 921.947,97 845.301,49
(1) see also Note 4.5.16
Final Annual Accounts 2013
15
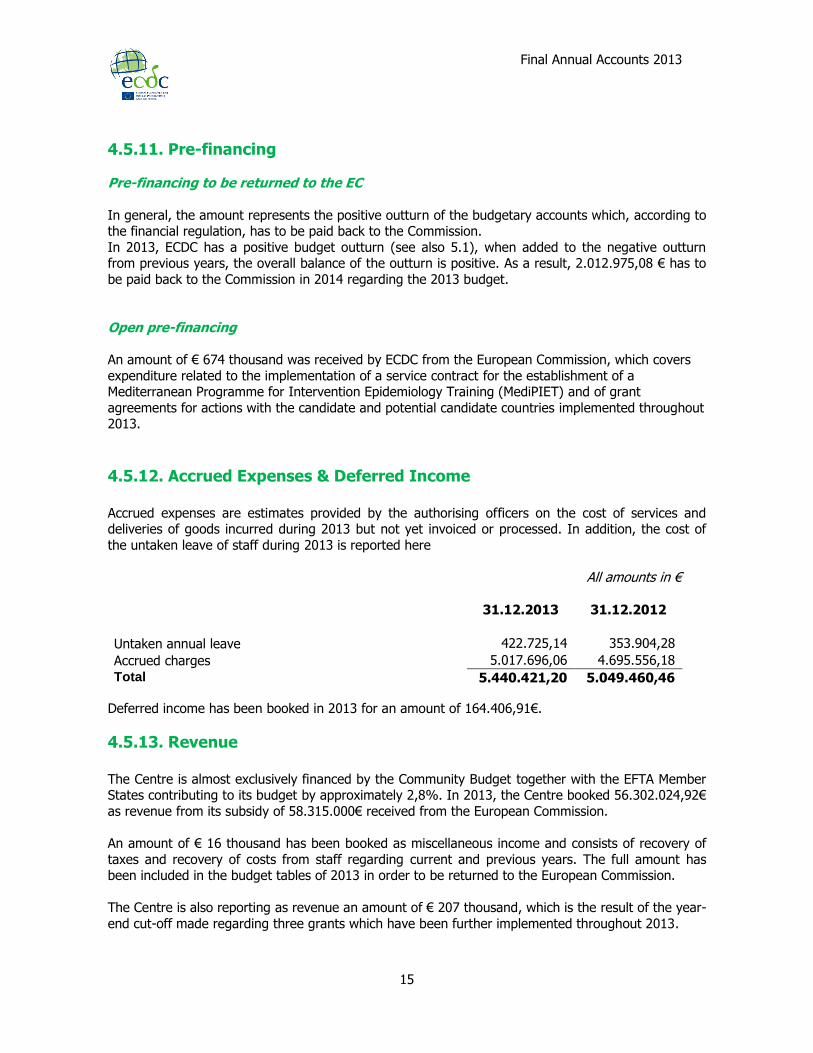
4.5.11. Pre-financing Pre-financing to be returned to the EC
In general, the amount represents the positive outturn of the budgetary accounts which, according to the financial regulation, has to be paid back to the Commission.
In 2013, ECDC has a positive budget outturn (see also 5.1), when added to the negative outturn from previous years, the overall balance of the outturn is positive. As a result, 2.012.975,08 € has to
be paid back to the Commission in 2014 regarding the 2013 budget.
Open pre-financing
An amount of € 674 thousand was received by ECDC from the European Commission, which covers
expenditure related to the implementation of a service contract for the establishment of a Mediterranean Programme for Intervention Epidemiology Training (MediPIET) and of grant
agreements for actions with the candidate and potential candidate countries implemented throughout 2013.
4.5.12. Accrued Expenses & Deferred Income Accrued expenses are estimates provided by the authorising officers on the cost of services and deliveries of goods incurred during 2013 but not yet invoiced or processed. In addition, the cost of
the untaken leave of staff during 2013 is reported here
All amounts in €
31.12.2013 31.12.2012
Untaken annual leave 422.725,14 353.904,28
Accrued charges 5.017.696,06 4.695.556,18
Total
5.440.421,20 5.049.460,46
Deferred income has been booked in 2013 for an amount of 164.406,91€.
4.5.13. Revenue The Centre is almost exclusively financed by the Community Budget together with the EFTA Member States contributing to its budget by approximately 2,8%. In 2013, the Centre booked 56.302.024,92€
as revenue from its subsidy of 58.315.000€ received from the European Commission.
An amount of € 16 thousand has been booked as miscellaneous income and consists of recovery of
taxes and recovery of costs from staff regarding current and previous years. The full amount has been included in the budget tables of 2013 in order to be returned to the European Commission.
The Centre is also reporting as revenue an amount of € 207 thousand, which is the result of the year-
end cut-off made regarding three grants which have been further implemented throughout 2013.
Final Annual Accounts 2013
16
Here the posting versus accrued revenue or open pre-financing is equal to the expenditures made
under the grants during 2013.
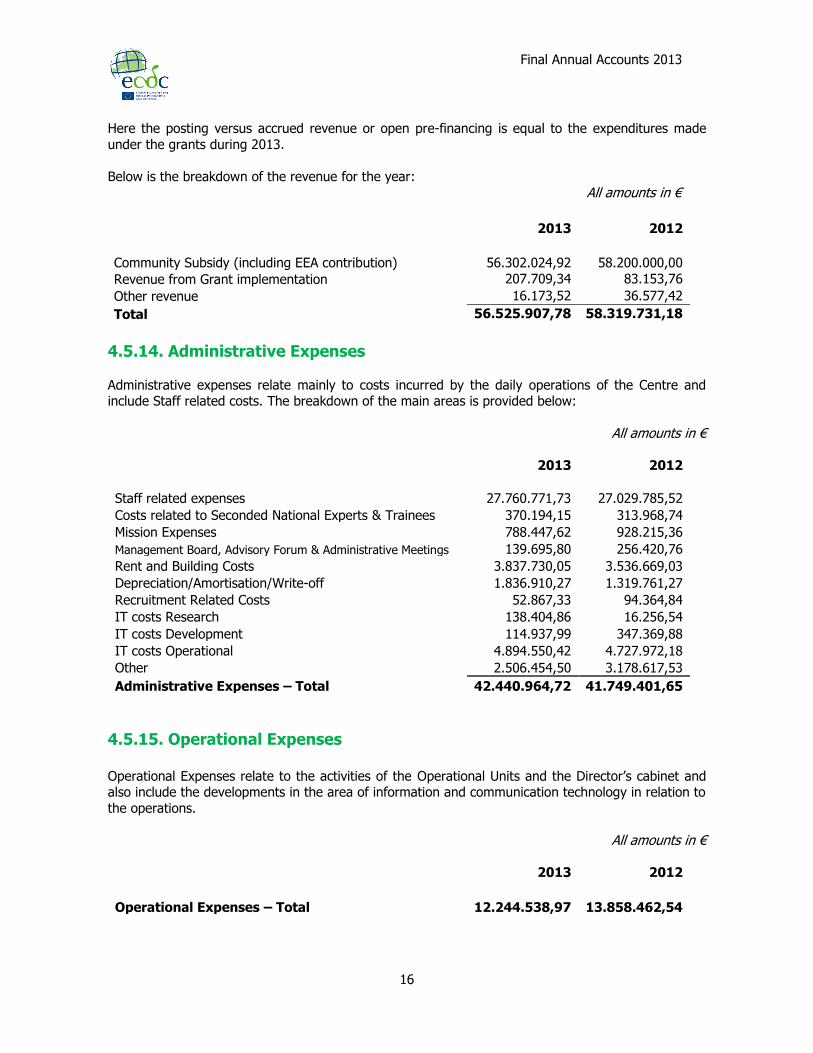
Below is the breakdown of the revenue for the year:
All amounts in €
2013 2012
Community Subsidy (including EEA contribution) 56.302.024,92 58.200.000,00
Revenue from Grant implementation 207.709,34 83.153,76
Other revenue 16.173,52 36.577,42
Total 56.525.907,78 58.319.731,18
4.5.14. Administrative Expenses
Administrative expenses relate mainly to costs incurred by the daily operations of the Centre and include Staff related costs. The breakdown of the main areas is provided below:
All amounts in €
2013 2012
Staff related expenses 27.760.771,73 27.029.785,52
Costs related to Seconded National Experts & Trainees 370.194,15 313.968,74
Mission Expenses 788.447,62 928.215,36
Management Board, Advisory Forum & Administrative Meetings 139.695,80 256.420,76
Rent and Building Costs 3.837.730,05 3.536.669,03
Depreciation/Amortisation/Write-off 1.836.910,27 1.319.761,27
Recruitment Related Costs 52.867,33 94.364,84
IT costs Research 138.404,86 16.256,54
IT costs Development 114.937,99 347.369,88
IT costs Operational 4.894.550,42 4.727.972,18
Other 2.506.454,50 3.178.617,53
Administrative Expenses – Total 42.440.964,72 41.749.401,65
4.5.15. Operational Expenses Operational Expenses relate to the activities of the Operational Units and the Director’s cabinet and also include the developments in the area of information and communication technology in relation to
the operations.
All amounts in €
2013 2012
Operational Expenses – Total 12.244.538,97 13.858.462,54
Final Annual Accounts 2013
17
4.5.16. Finance Income / Expense This heading covers expenses mainly relating to bank fees, interest expenses on late payment of
charges and interest expenses on leasing.
In addition, the Centre received € 6 thousand of interest income earned on the Community Subsidy
that is reported under Note 4.5.10. – Accounts Payable, as according to the Financial Regulation it has to be returned to the Commission.
4.5.17. Exchange rate gains/ losses The Seat of the Centre is outside of the Euro-zone. As a result a substantial part of its activities is carried out in Swedish crowns while the Centre’s income as well as its reporting Currency is Euro. The
exchange rate differences encountered in 2013 consist of the revaluation of the Swedish Crown in relation to € at year-end, together with the adjustment of the weighting factor applied to the
remuneration of staff employed in Sweden and differences related to the payments made in Swedish
Crown as the exchange rate used in our financial system differs from the daily rate used by the bank when the payments are actually made. These three components resulted in exchange rate losses of
€ 657 thousand (versus losses of € 547 thousand in 2012).
4.5.18. Contingent Assets & Liabilities
Contingent Liabilities
As at 31 December 2013, the Centre had agreements with several contractors and suppliers for the
amount of € 5.247 thousand. These agreements relate mainly to operational projects and are
covered by budgetary commitments against 2013 appropriations.
In accordance with the lease contract, the Centre has the obligation to restore the building in its original state when vacating the premises at the end of the lease. This obligation is reflected in the
accounts. Based on a study which was carried out in 2012 the cost of this obligation has been
estimated at 512.377 € (converted at the official EC 2013 year-end exchange rate applicable for SEK) The residual amount of this contingent liability for 2014 till 2018 equals 336.070 €.
Final Annual Accounts 2013
18
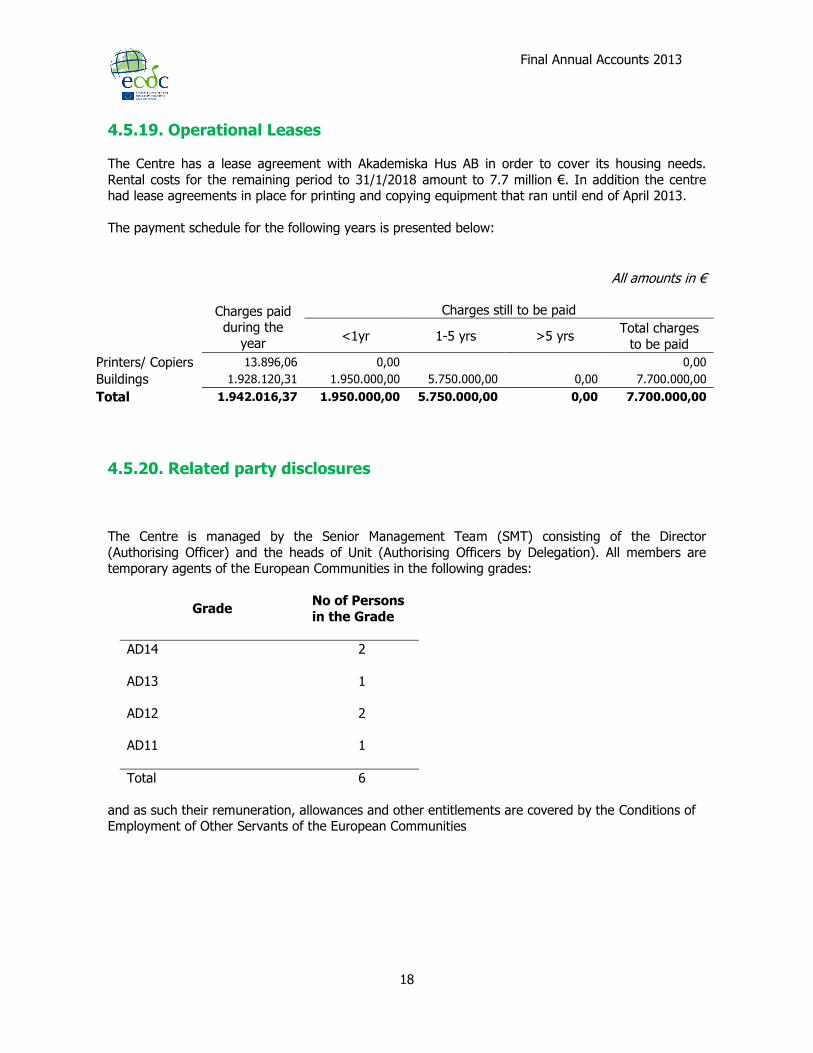
4.5.19. Operational Leases
The Centre has a lease agreement with Akademiska Hus AB in order to cover its housing needs.
Rental costs for the remaining period to 31/1/2018 amount to 7.7 million €. In addition the centre had lease agreements in place for printing and copying equipment that ran until end of April 2013.
The payment schedule for the following years is presented below:
All amounts in €
Charges paid during the
year
Charges still to be paid
<1yr 1-5 yrs >5 yrs Total charges
to be paid
Printers/ Copiers 13.896,06 0,00 0,00
Buildings 1.928.120,31 1.950.000,00 5.750.000,00 0,00 7.700.000,00
Total 1.942.016,37 1.950.000,00 5.750.000,00 0,00 7.700.000,00
4.5.20. Related party disclosures
The Centre is managed by the Senior Management Team (SMT) consisting of the Director
(Authorising Officer) and the heads of Unit (Authorising Officers by Delegation). All members are temporary agents of the European Communities in the following grades:
Grade No of Persons
in the Grade
AD14 2
AD13 1
AD12 2
AD11 1
Total 6
and as such their remuneration, allowances and other entitlements are covered by the Conditions of Employment of Other Servants of the European Communities

Final Annual Accounts 2013
19
4.5.21. Pension Obligations
ECDC staff are members of the European Communities Pension Scheme which is a defined benefit pension plan.
A defined benefit plan is a pension plan that generally defines an amount of pension benefit that an employee will receive on retirement, usually dependent on one or more factors such as age and
years of service. In 2013, throughout the whole year, ECDC staff initially contributed 11,6% of their basic salary to the
pension scheme.
On the 10th of December 2013, the Council adopted a regulation reducing the 2012 pension contribution rate from 11.6 % to 10.6% retroactively from the 1st of July 2012. The surplus retained
on salaries was paid out to staff in December 2013 by the Centre. Following another Regulation adopted by the Council on 17 December 2013, the 2013 pension
contribution rate was further reduced from 10.6% to 10.3% of the basic salary, with retroactive
effect from 1 July 2013. This retained surplus has been paid back to staff through their February 2014 salary.
The cost undertaken by the European Commission is not presented on the ECDC’s accounts.
Future benefits payable to ECDC staff under the EC Pension Scheme are accounted for in the
accounts of the European Commission and no such provisions are entered in the Centre’s accounts.
Final Annual Accounts 2013
20
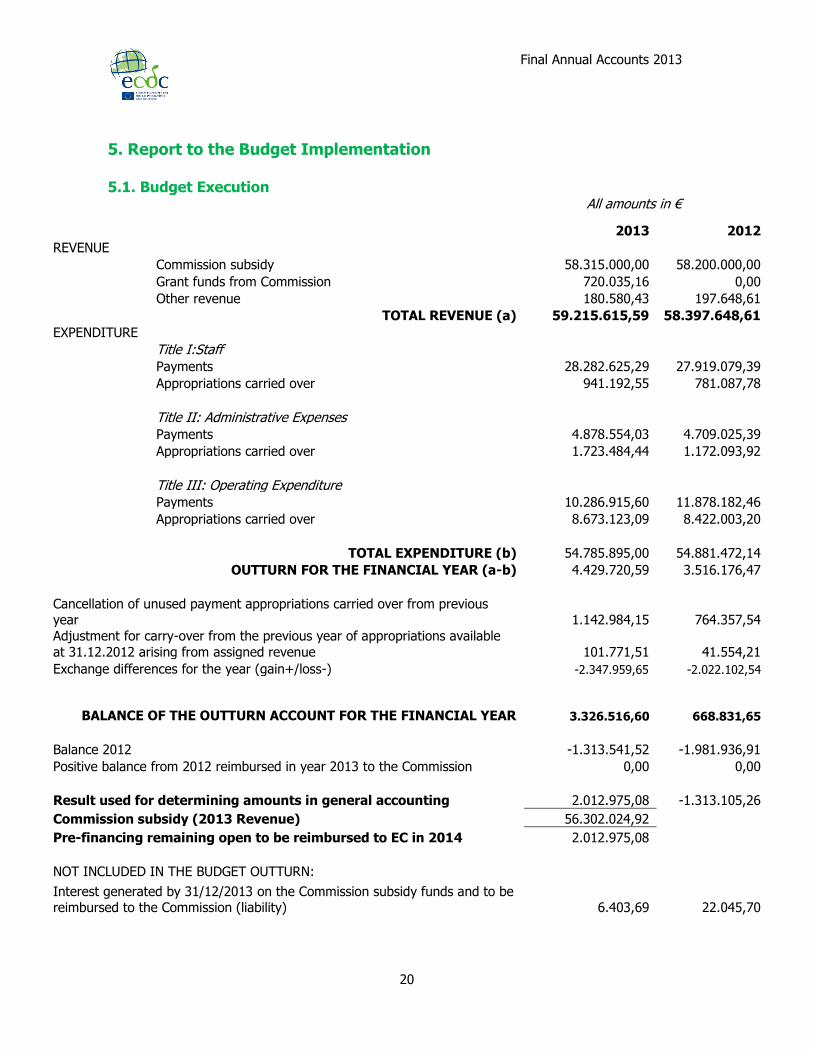
5. Report to the Budget Implementation 5.1. Budget Execution All amounts in €
2013 2012
REVENUE
Commission subsidy 58.315.000,00 58.200.000,00
Grant funds from Commission 720.035,16 0,00
Other revenue 180.580,43 197.648,61
TOTAL REVENUE (a) 59.215.615,59 58.397.648,61
EXPENDITURE
Title I:Staff
Payments 28.282.625,29 27.919.079,39
Appropriations carried over 941.192,55 781.087,78
Title II: Administrative Expenses
Payments 4.878.554,03 4.709.025,39
Appropriations carried over 1.723.484,44 1.172.093,92
Title III: Operating Expenditure
Payments 10.286.915,60 11.878.182,46
Appropriations carried over 8.673.123,09 8.422.003,20
TOTAL EXPENDITURE (b) 54.785.895,00 54.881.472,14
OUTTURN FOR THE FINANCIAL YEAR (a-b) 4.429.720,59 3.516.176,47
Cancellation of unused payment appropriations carried over from previous year 1.142.984,15 764.357,54
Adjustment for carry-over from the previous year of appropriations available
at 31.12.2012 arising from assigned revenue 101.771,51 41.554,21
Exchange differences for the year (gain+/loss-) -2.347.959,65 -2.022.102,54
BALANCE OF THE OUTTURN ACCOUNT FOR THE FINANCIAL YEAR 3.326.516,60 668.831,65
Balance 2012
-1.313.541,52 -1.981.936,91
Positive balance from 2012 reimbursed in year 2013 to the Commission 0,00 0,00
Result used for determining amounts in general accounting 2.012.975,08 -1.313.105,26
Commission subsidy (2013 Revenue) 56.302.024,92
Pre-financing remaining open to be reimbursed to EC in 2014 2.012.975,08
NOT INCLUDED IN THE BUDGET OUTTURN: Interest generated by 31/12/2013 on the Commission subsidy funds and to be
reimbursed to the Commission (liability) 6.403,69 22.045,70

Final Annual Accounts 2013
21
5.2. Explanatory notes to the Budget 5.2.1. Income The initial Budget appropriations for 2013 as voted by the Management board meeting in November
2012 amounted to € 58.315.000. During the year the following adjustments were made:
Budget Line
Initial Available Budget Adjustments
Final Available Budget
2000 IC1 European Community Contribution - Current Year Appropriations 56.727.000,00 (0,00) 56.727.000,00
2001 IC4 European Community Contribution - Earmarked funds (Reuse previous years) 0,00 (0,00) 0,00
200 European Community contribution 56.727.000,00 (0,00) 56.727.000,00
3000 IC1 Subsidy from EEA/EFTA member states (% of EU contribution) 1.588.000,00 (0,00) 1.588.000,00
300 Subsidy from the EEA/EFTA 1.588.000,00 (0,00) 1.588.000,00
Total Revenue 2013 58.315.000,00 (0,00) 58.315.000,00
R0 – External assigned revenue
European Community Contribution - Earmarked funds 720.035,16 (0,00) 720.035,16
No adjustment to the budget, as shown in the table above, was made in 2013, neither to the European Community Contribution 2013 nor to the EEA/EFTA Member States contribution.
In 2013, an amount of € 720.035,16 was received to the budget 2013 as external assigned revenue.
The amounts collected refer to the following contracts: IPA grant, MediPIET, Joint Undertaking IMI
grant and ENPI grant
Final Annual Accounts 2013
22
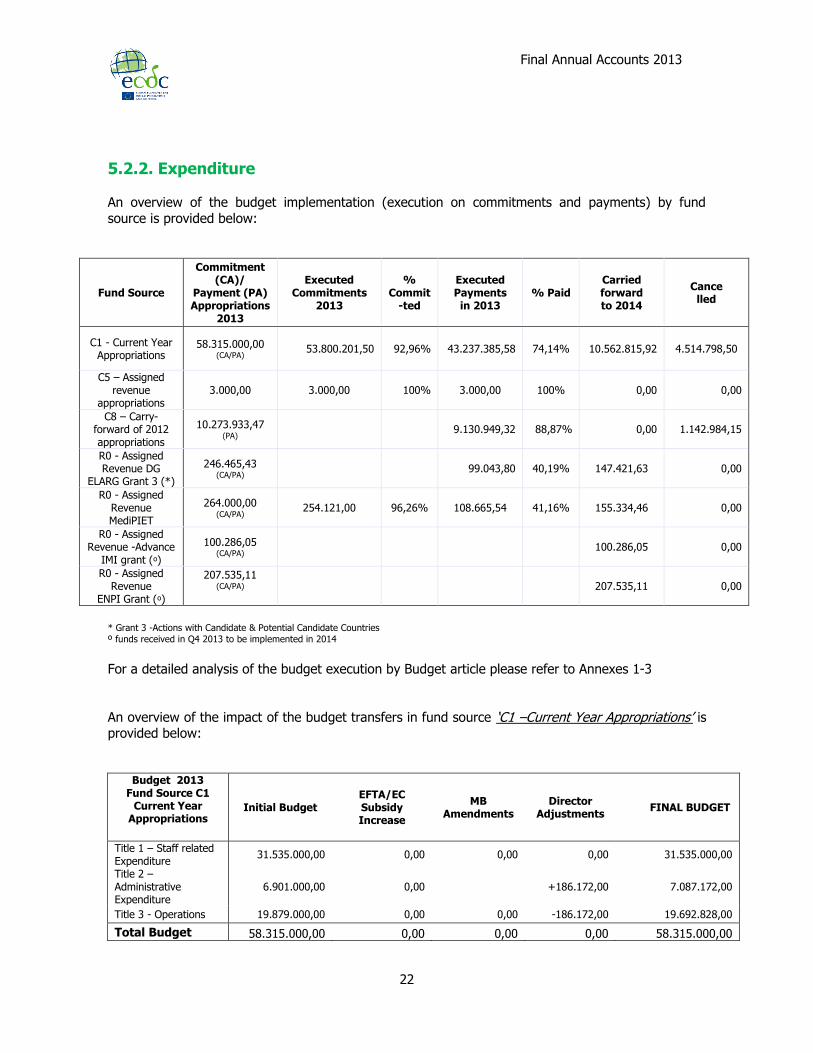
5.2.2. Expenditure An overview of the budget implementation (execution on commitments and payments) by fund
source is provided below:
Fund Source
Commitment (CA)/
Payment (PA) Appropriations
2013
Executed Commitments
2013
% Commit
-ted
Executed Payments in 2013
% Paid Carried forward to 2014
Cance lled
C1 - Current Year Appropriations
58.315.000,00 (CA/PA)
53.800.201,50 92,96% 43.237.385,58 74,14% 10.562.815,92 4.514.798,50
C5 – Assigned revenue
appropriations 3.000,00 3.000,00 100% 3.000,00 100% 0,00 0,00
C8 – Carry-forward of 2012 appropriations
10.273.933,47 (PA)
9.130.949,32 88,87% 0,00 1.142.984,15
R0 - Assigned Revenue DG
ELARG Grant 3 (*)
246.465,43 (CA/PA)
99.043,80 40,19% 147.421,63 0,00
R0 - Assigned Revenue MediPIET
264.000,00 (CA/PA)
254.121,00 96,26% 108.665,54 41,16% 155.334,46 0,00
R0 - Assigned Revenue -Advance
IMI grant (ᵒ)
100.286,05 (CA/PA)
100.286,05 0,00
R0 - Assigned Revenue
ENPI Grant (ᵒ)
207.535,11 (CA/PA)
207.535,11 0,00
* Grant 3 -Actions with Candidate & Potential Candidate Countries
º funds received in Q4 2013 to be implemented in 2014
For a detailed analysis of the budget execution by Budget article please refer to Annexes 1-3
An overview of the impact of the budget transfers in fund source ‘C1 –Current Year Appropriations’ is provided below:
Budget 2013 Fund Source C1
Current Year Appropriations
Initial Budget EFTA/EC Subsidy Increase
MB Amendments
Director Adjustments
FINAL BUDGET
Title 1 – Staff related Expenditure
31.535.000,00 0,00 0,00 0,00 31.535.000,00
Title 2 – Administrative Expenditure
6.901.000,00 0,00
+186.172,00 7.087.172,00
Title 3 - Operations 19.879.000,00 0,00 0,00 -186.172,00 19.692.828,00
Total Budget 58.315.000,00 0,00 0,00 0,00 58.315.000,00

Final Annual Accounts 2013
23
5.2.3. Reconciliation between the Budget Outturn Account (see 5.1) and the Economic Outturn Account (see 4.2)
All amounts in €
Economic Outturn Account 2013 1.176.635,80
Adjustment for accrual items (items not in the budgetary result but included in the economic result)
Adjustments for Accrual Cut-off (reversal 31.12.2012) (5.403.539,76)
Adjustments for Accrual Cut-off (cut- off 31.12.2013) 7.012.264,46
Unpaid invoices at year end but booked in charges 0,00
Depreciation of intangible and tangible fixed assets 1.836.910,27
Provisions 709.417,00
Value reductions 0,00
Pre-financing given in previous year and cleared in the year 65.703,39
Pre-financing received in previous year and cleared in the year 0,00
Payments made from carry-forward of payment appropriations 9.130.949,33
Other (deferred charges, stock decrease, exchange rate diff – rappel 2011) (1.646.280,01)
Adjustment for budgetary items (item included in the budgetary result but not in the economic result)
Asset acquisitions (less unpaid amounts) (2.069.526,22)
New pre-financing paid in the year 2013 and remaining open as at 31.12.2013 (64.534,00) New pre-financing received in the year 2013 and remaining open as at
31.12.2013 2.525.300,90
Budgetary recovery orders issued in 2013 on balance sheet accounts (not 7 or 6 accounts) and cashed 0,00
Payment appropriations carried over to 2014 (11.337.800,08)
Cancellation of unused carried over payment appropriations from previous year 1.142.984,15 Adjustment for carry-over from the previous year of appropriations available at
31.12 arising from assigned revenue 101.771,51
Other (deferred income) 146.259,87
Budgetary Outturn Account 2013 3.326.516,60
Final Annual Accounts 2013
24
5.2.4. Budgetary Principles The establishment and implementation of the budget of the European Centre for Disease Prevention
and Control are governed by the following basic principles:
(a) unity and budget accuracy;
all expenditure and revenue must be incorporated in a single budget document, must be booked on a budget line and expenditure must not exceed authorised appropriations;
(b) universality:
this principle comprises two rules:
o the rule of non-assignment, meaning that budget revenue must not be earmarked for specific items of expenditure (total revenue must cover total expenditure);
o the gross budget rule, meaning that revenue and expenditure are entered in full in the budget without any adjustment against each other;
(c) annuality: the appropriations entered are authorised for a single year and must therefore be used
during that year;
(d) equilibrium: the revenue and expenditure shown in the budget must be in balance (estimated revenue
must equal payment appropriations);
(e) specification:
each appropriation is assigned to a specific purpose and a specific objective;
(f) unit of account:
the budget is drawn up and implemented in euro and the accounts are presented in euro;
(g) sound financial management: budget appropriations are used in accordance with the principle of sound financial
management, namely in accordance with the principles of economy, efficiency and effectiveness;
(h) transparency: the budget is established and implemented and the accounts presented in compliance with
the principle of transparency - the budget and amending budgets are published in the Official Journal of the European Communities.
Final Annual Accounts 2013
25
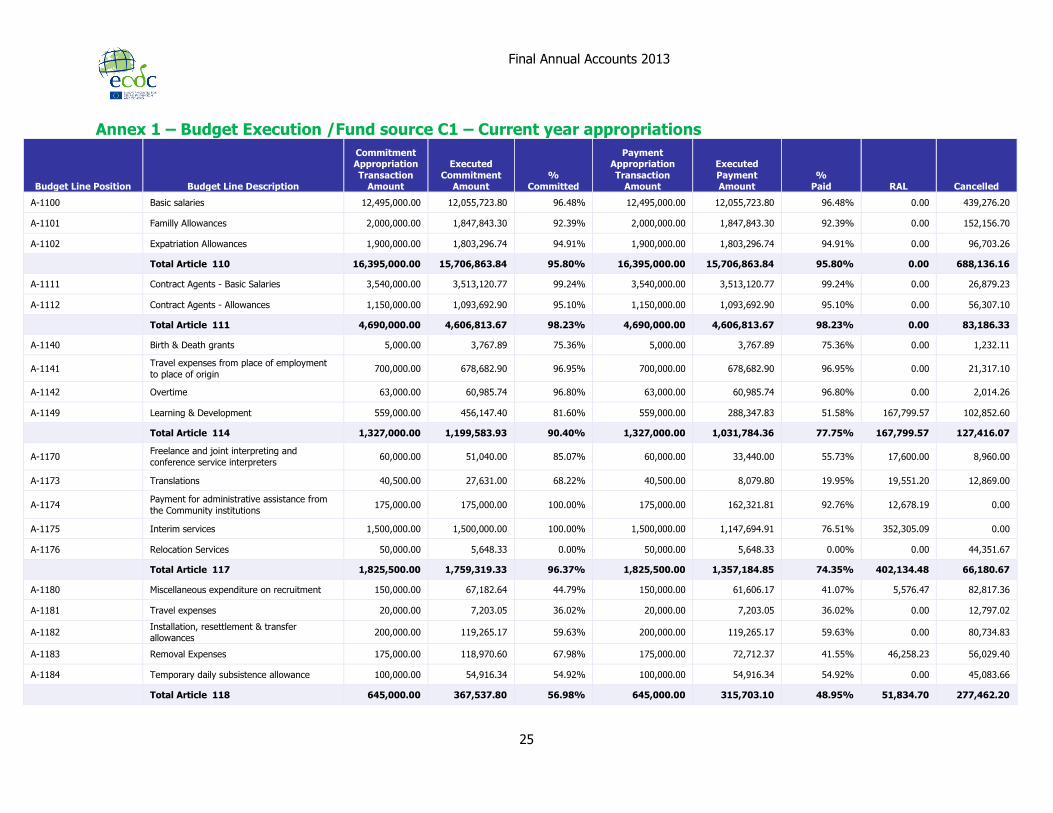
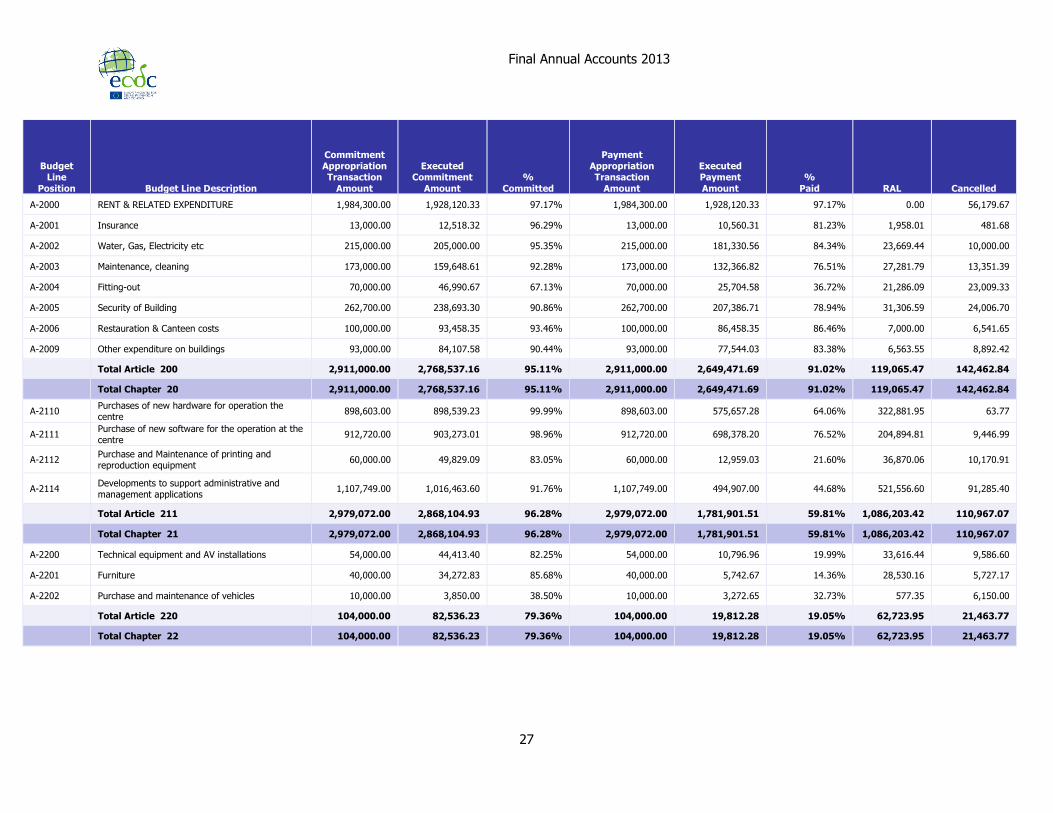
Annex 1 – Budget Execution /Fund source C1 – Current year appropriations
Budget Line Position Budget Line Description
Commitment Appropriation
Transaction Amount
Executed
Commitment Amount
% Committed
Payment Appropriation
Transaction Amount
Executed
Payment Amount
% Paid RAL Cancelled
A-1100 Basic salaries 12,495,000.00 12,055,723.80 96.48% 12,495,000.00 12,055,723.80 96.48% 0.00 439,276.20
A-1101 Familly Allowances 2,000,000.00 1,847,843.30 92.39% 2,000,000.00 1,847,843.30 92.39% 0.00 152,156.70
A-1102 Expatriation Allowances 1,900,000.00 1,803,296.74 94.91% 1,900,000.00 1,803,296.74 94.91% 0.00 96,703.26
Total Article 110 16,395,000.00 15,706,863.84 95.80% 16,395,000.00 15,706,863.84 95.80% 0.00 688,136.16
A-1111 Contract Agents - Basic Salaries 3,540,000.00 3,513,120.77 99.24% 3,540,000.00 3,513,120.77 99.24% 0.00 26,879.23
A-1112 Contract Agents - Allowances 1,150,000.00 1,093,692.90 95.10% 1,150,000.00 1,093,692.90 95.10% 0.00 56,307.10
Total Article 111 4,690,000.00 4,606,813.67 98.23% 4,690,000.00 4,606,813.67 98.23% 0.00 83,186.33
A-1140 Birth & Death grants 5,000.00 3,767.89 75.36% 5,000.00 3,767.89 75.36% 0.00 1,232.11
A-1141 Travel expenses from place of employment
to place of origin 700,000.00 678,682.90 96.95% 700,000.00 678,682.90 96.95% 0.00 21,317.10
A-1142 Overtime 63,000.00 60,985.74 96.80% 63,000.00 60,985.74 96.80% 0.00 2,014.26
A-1149 Learning & Development 559,000.00 456,147.40 81.60% 559,000.00 288,347.83 51.58% 167,799.57 102,852.60
Total Article 114 1,327,000.00 1,199,583.93 90.40% 1,327,000.00 1,031,784.36 77.75% 167,799.57 127,416.07
A-1170 Freelance and joint interpreting and
conference service interpreters 60,000.00 51,040.00 85.07% 60,000.00 33,440.00 55.73% 17,600.00 8,960.00
A-1173 Translations 40,500.00 27,631.00 68.22% 40,500.00 8,079.80 19.95% 19,551.20 12,869.00
A-1174 Payment for administrative assistance from
the Community institutions 175,000.00 175,000.00 100.00% 175,000.00 162,321.81 92.76% 12,678.19 0.00
A-1175 Interim services 1,500,000.00 1,500,000.00 100.00% 1,500,000.00 1,147,694.91 76.51% 352,305.09 0.00
A-1176 Relocation Services 50,000.00 5,648.33 0.00% 50,000.00 5,648.33 0.00% 0.00 44,351.67
Total Article 117 1,825,500.00 1,759,319.33 96.37% 1,825,500.00 1,357,184.85 74.35% 402,134.48 66,180.67
A-1180 Miscellaneous expenditure on recruitment 150,000.00 67,182.64 44.79% 150,000.00 61,606.17 41.07% 5,576.47 82,817.36
A-1181 Travel expenses 20,000.00 7,203.05 36.02% 20,000.00 7,203.05 36.02% 0.00 12,797.02
A-1182 Installation, resettlement & transfer allowances
200,000.00 119,265.17 59.63% 200,000.00 119,265.17 59.63% 0.00 80,734.83
A-1183 Removal Expenses 175,000.00 118,970.60 67.98% 175,000.00 72,712.37 41.55% 46,258.23 56,029.40
A-1184 Temporary daily subsistence allowance 100,000.00 54,916.34 54.92% 100,000.00 54,916.34 54.92% 0.00 45,083.66
Total Article 118 645,000.00 367,537.80 56.98% 645,000.00 315,703.10 48.95% 51,834.70 277,462.20
Final Annual Accounts 2013
26
Budget Line
Position Budget Line Description
Commitment Appropriation Transaction
Amount
Executed Commitment
Amount
%
Committed
Payment Appropriation Transaction
Amount
Executed Payment
Amount
%
Paid RAL Cancelled
A-1190 Weightings applied to remunerations 3,650,000.00 3,402,011.23 93.21% 3,650,000.00 3,402,011.23 93.21% 0.00 247,988.77
A-1191 Provisional Appropriation (rappel) 465,000.00 0.00 0.00% 465,000.00 0.00 0.00% 0.00 465,000.00
Total Article 119 4,115,000.00 3,402,011.23 82.67% 4,115,000.00 3,402,011.23 82.67% 0.00 712,988.77
Total Chapter 11 28,997,500.00 27,042,129.80 93.26% 28,997,500.00 26,420,361.05 91.11% 621,768.75 1,955,370.20
A-1300 Mission expenses, travel expenses and incidental expenditure
1,000,000.00 795,452.10 79.55% 1,000,000.00 543,033.14 54.30% 252,418.96 204,547.90
Total Article 130 1,000,000.00 795,452.10 79.55% 1,000,000.00 543,033.14 54.30% 252,418.96 204,547.90
Total Chapter 13 1,000,000.00 795,452.10 79.55% 1,000,000.00 543,033.14 54.30% 252,418.96 204,547.90
A-1410 Medical Service 150,000.00 120,557.31 80.37% 150,000.00 91,949.91 61.30% 28,607.40 29,442.69
Total Article 141 150,000.00 120,557.31 80.37% 150,000.00 91,949.91 61.30% 28,607.40 29,442.69
Total Chapter 14 150,000.00 120,557.31 80.37% 150,000.00 91,949.91 61.30% 28,607.40 29,442.69
A-1520 Staff Exchanges 450,000.00 372,100.00 82.69% 450,000.00 370,163.10 82.26% 1,936.90 77,900.00
Total Article 152 450,000.00 372,100.00 82.69% 450,000.00 370,163.10 82.26% 1,936.90 77,900.00
Total Chapter 15 450,000.00 372,100.00 82.69% 450,000.00 370,163.10 82.26% 1,936.90 77,900.00
A-1700 Entertainment & Representation Expenses 9,500.00 8,700.00 91.58% 9,500.00 6,991.69 73.60% 1,708.31 800.00
Total Article 170 9,500.00 8,700.00 91.58% 9,500.00 6,991.69 73.60% 1,708.31 800.00
Total Chapter 17 9,500.00 8,700.00 91.58% 9,500.00 6,991.69 73.60% 1,708.31 800.00
A-1801 Social Contact Between Staff 63,000.00 54,425.00 86.39% 63,000.00 19,672.77 31.23% 34,752.23 8,575.00
A-1802 Sickness Insurance 550,000.00 548,066.23 99.65% 550,000.00 548,066.23 99.65% 0.00 1,933.77
A-1803 Accident and Occupational Diseases 105,000.00 80,746.05 76.90% 105,000.00 80,746.05 76.90% 0.00 24,253.95
A-1804 Unemployment for temporary staff 210,000.00 201,641.35 96.02% 210,000.00 201,641.35 96.02% 0.00 8,358.65
Total Article 180 928,000.00 884,878.63 95.35% 928,000.00 850,126.40 91.61% 34,752.23 43,121.37
Total Chapter 18 928,000.00 884,878.63 95.35% 928,000.00 850,126.40 91.61% 34,752.23 43,121.37
Total Title 1 31,535,000.00 29,223,817.84 92.67% 31,535,000.00 28,282,625.29 89.69% 941,192.55 2,311,182.16
Final Annual Accounts 2013
27
Budget Line
Position Budget Line Description
Commitment Appropriation Transaction
Amount
Executed Commitment
Amount
%
Committed
Payment Appropriation Transaction
Amount
Executed Payment
Amount
%
Paid RAL Cancelled
A-2000 RENT & RELATED EXPENDITURE 1,984,300.00 1,928,120.33 97.17% 1,984,300.00 1,928,120.33 97.17% 0.00 56,179.67
A-2001 Insurance 13,000.00 12,518.32 96.29% 13,000.00 10,560.31 81.23% 1,958.01 481.68
A-2002 Water, Gas, Electricity etc 215,000.00 205,000.00 95.35% 215,000.00 181,330.56 84.34% 23,669.44 10,000.00
A-2003 Maintenance, cleaning 173,000.00 159,648.61 92.28% 173,000.00 132,366.82 76.51% 27,281.79 13,351.39
A-2004 Fitting-out 70,000.00 46,990.67 67.13% 70,000.00 25,704.58 36.72% 21,286.09 23,009.33
A-2005 Security of Building 262,700.00 238,693.30 90.86% 262,700.00 207,386.71 78.94% 31,306.59 24,006.70
A-2006 Restauration & Canteen costs 100,000.00 93,458.35 93.46% 100,000.00 86,458.35 86.46% 7,000.00 6,541.65
A-2009 Other expenditure on buildings 93,000.00 84,107.58 90.44% 93,000.00 77,544.03 83.38% 6,563.55 8,892.42
Total Article 200 2,911,000.00 2,768,537.16 95.11% 2,911,000.00 2,649,471.69 91.02% 119,065.47 142,462.84
Total Chapter 20 2,911,000.00 2,768,537.16 95.11% 2,911,000.00 2,649,471.69 91.02% 119,065.47 142,462.84
A-2110 Purchases of new hardware for operation the centre
898,603.00 898,539.23 99.99% 898,603.00 575,657.28 64.06% 322,881.95 63.77
A-2111 Purchase of new software for the operation at the centre
912,720.00 903,273.01 98.96% 912,720.00 698,378.20 76.52% 204,894.81 9,446.99
A-2112 Purchase and Maintenance of printing and reproduction equipment
60,000.00 49,829.09 83.05% 60,000.00 12,959.03 21.60% 36,870.06 10,170.91
A-2114 Developments to support administrative and management applications
1,107,749.00 1,016,463.60 91.76% 1,107,749.00 494,907.00 44.68% 521,556.60 91,285.40
Total Article 211 2,979,072.00 2,868,104.93 96.28% 2,979,072.00 1,781,901.51 59.81% 1,086,203.42 110,967.07
Total Chapter 21 2,979,072.00 2,868,104.93 96.28% 2,979,072.00 1,781,901.51 59.81% 1,086,203.42 110,967.07
A-2200 Technical equipment and AV installations 54,000.00 44,413.40 82.25% 54,000.00 10,796.96 19.99% 33,616.44 9,586.60
A-2201 Furniture 40,000.00 34,272.83 85.68% 40,000.00 5,742.67 14.36% 28,530.16 5,727.17
A-2202 Purchase and maintenance of vehicles 10,000.00 3,850.00 38.50% 10,000.00 3,272.65 32.73% 577.35 6,150.00
Total Article 220 104,000.00 82,536.23 79.36% 104,000.00 19,812.28 19.05% 62,723.95 21,463.77
Total Chapter 22 104,000.00 82,536.23 79.36% 104,000.00 19,812.28 19.05% 62,723.95 21,463.77
Final Annual Accounts 2013
28
Budget
Line Position Budget Line Description
Commitment Appropriation
Transaction Amount
Executed
Commitment Amount
% Committed
Payment Appropriation
Transaction Amount
Executed
Payment Amount
% Paid RAL Cancelled
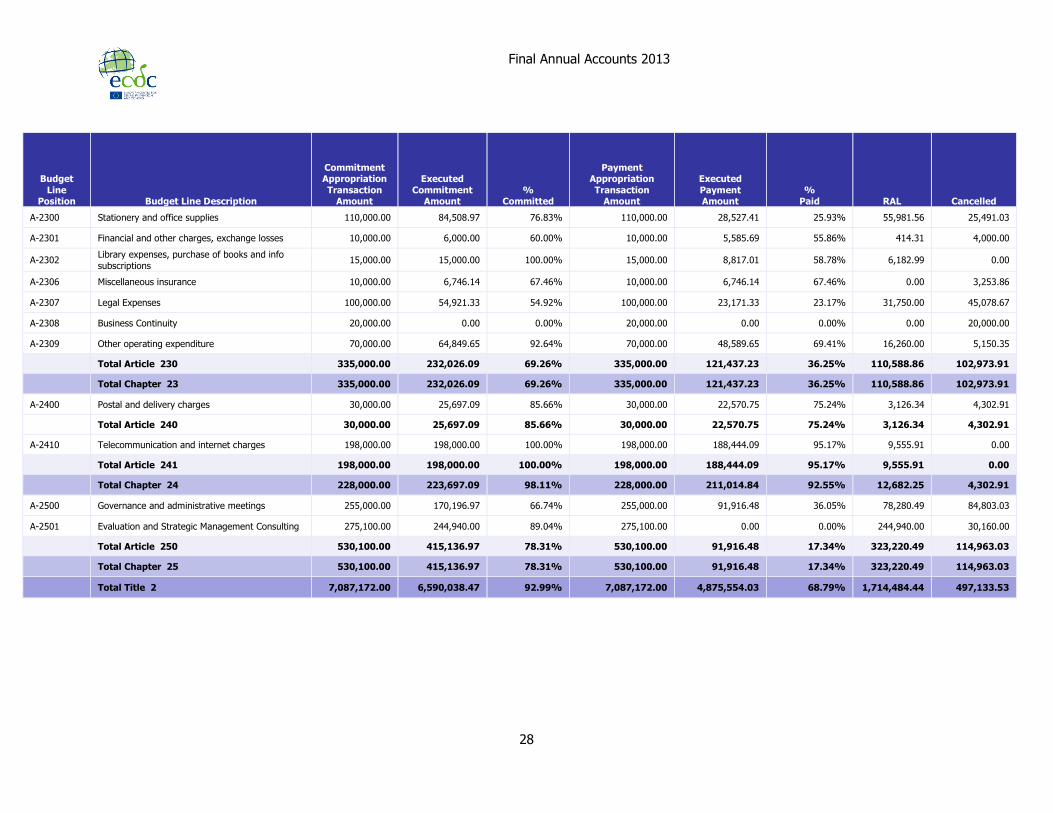
A-2300 Stationery and office supplies 110,000.00 84,508.97 76.83% 110,000.00 28,527.41 25.93% 55,981.56 25,491.03
A-2301 Financial and other charges, exchange losses 10,000.00 6,000.00 60.00% 10,000.00 5,585.69 55.86% 414.31 4,000.00
A-2302 Library expenses, purchase of books and info
subscriptions 15,000.00 15,000.00 100.00% 15,000.00 8,817.01 58.78% 6,182.99 0.00
A-2306 Miscellaneous insurance 10,000.00 6,746.14 67.46% 10,000.00 6,746.14 67.46% 0.00 3,253.86
A-2307 Legal Expenses 100,000.00 54,921.33 54.92% 100,000.00 23,171.33 23.17% 31,750.00 45,078.67
A-2308 Business Continuity 20,000.00 0.00 0.00% 20,000.00 0.00 0.00% 0.00 20,000.00
A-2309 Other operating expenditure 70,000.00 64,849.65 92.64% 70,000.00 48,589.65 69.41% 16,260.00 5,150.35
Total Article 230 335,000.00 232,026.09 69.26% 335,000.00 121,437.23 36.25% 110,588.86 102,973.91
Total Chapter 23 335,000.00 232,026.09 69.26% 335,000.00 121,437.23 36.25% 110,588.86 102,973.91
A-2400 Postal and delivery charges 30,000.00 25,697.09 85.66% 30,000.00 22,570.75 75.24% 3,126.34 4,302.91
Total Article 240 30,000.00 25,697.09 85.66% 30,000.00 22,570.75 75.24% 3,126.34 4,302.91
A-2410 Telecommunication and internet charges 198,000.00 198,000.00 100.00% 198,000.00 188,444.09 95.17% 9,555.91 0.00
Total Article 241 198,000.00 198,000.00 100.00% 198,000.00 188,444.09 95.17% 9,555.91 0.00
Total Chapter 24 228,000.00 223,697.09 98.11% 228,000.00 211,014.84 92.55% 12,682.25 4,302.91
A-2500 Governance and administrative meetings 255,000.00 170,196.97 66.74% 255,000.00 91,916.48 36.05% 78,280.49 84,803.03
A-2501 Evaluation and Strategic Management Consulting 275,100.00 244,940.00 89.04% 275,100.00 0.00 0.00% 244,940.00 30,160.00
Total Article 250 530,100.00 415,136.97 78.31% 530,100.00 91,916.48 17.34% 323,220.49 114,963.03
Total Chapter 25 530,100.00 415,136.97 78.31% 530,100.00 91,916.48 17.34% 323,220.49 114,963.03
Total Title 2 7,087,172.00 6,590,038.47 92.99% 7,087,172.00 4,875,554.03 68.79% 1,714,484.44 497,133.53
Final Annual Accounts 2013
29
Budget
Line Position Budget Line Description
Commitment Appropriation
Transaction Amount
Executed
Commitment Amount
% Committed
Payment Appropriation
Transaction Amount
Executed
Payment Amount
% Paid RAL Cancelled
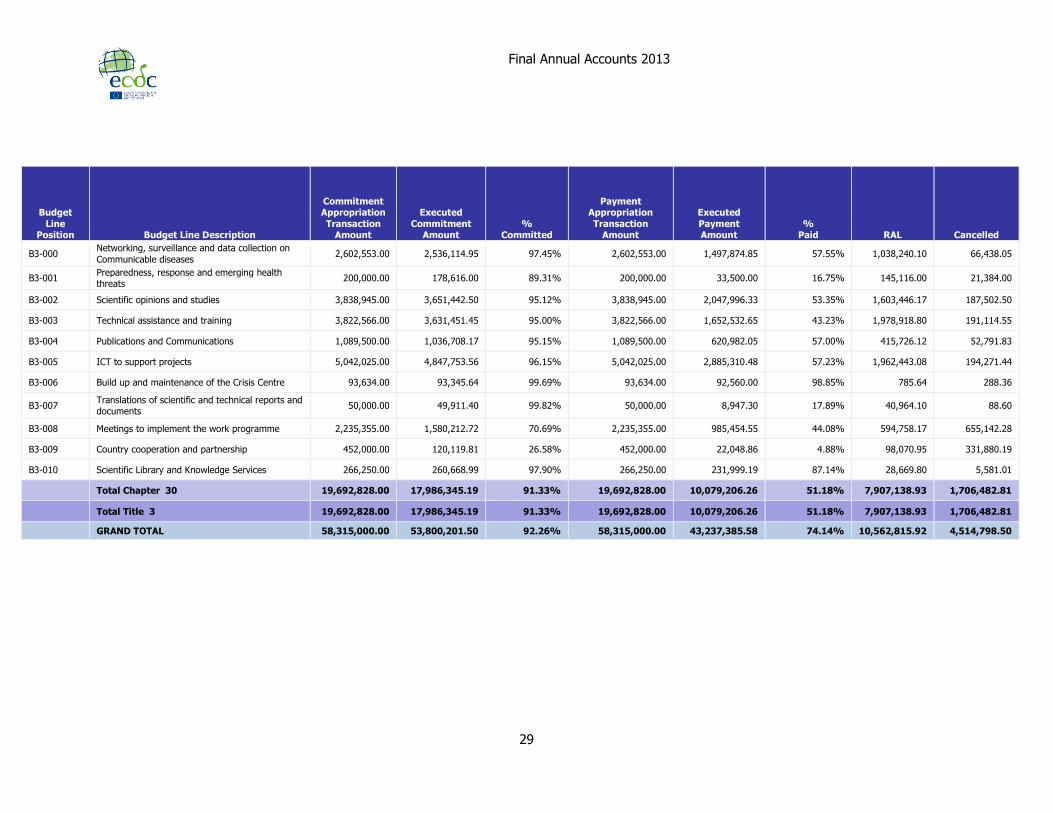
B3-000 Networking, surveillance and data collection on
Communicable diseases 2,602,553.00 2,536,114.95 97.45% 2,602,553.00 1,497,874.85 57.55% 1,038,240.10 66,438.05
B3-001 Preparedness, response and emerging health threats
200,000.00 178,616.00 89.31% 200,000.00 33,500.00 16.75% 145,116.00 21,384.00
B3-002 Scientific opinions and studies 3,838,945.00 3,651,442.50 95.12% 3,838,945.00 2,047,996.33 53.35% 1,603,446.17 187,502.50
B3-003 Technical assistance and training 3,822,566.00 3,631,451.45 95.00% 3,822,566.00 1,652,532.65 43.23% 1,978,918.80 191,114.55
B3-004 Publications and Communications 1,089,500.00 1,036,708.17 95.15% 1,089,500.00 620,982.05 57.00% 415,726.12 52,791.83
B3-005 ICT to support projects 5,042,025.00 4,847,753.56 96.15% 5,042,025.00 2,885,310.48 57.23% 1,962,443.08 194,271.44
B3-006 Build up and maintenance of the Crisis Centre 93,634.00 93,345.64 99.69% 93,634.00 92,560.00 98.85% 785.64 288.36
B3-007 Translations of scientific and technical reports and documents
50,000.00 49,911.40 99.82% 50,000.00 8,947.30 17.89% 40,964.10 88.60
B3-008 Meetings to implement the work programme 2,235,355.00 1,580,212.72 70.69% 2,235,355.00 985,454.55 44.08% 594,758.17 655,142.28
B3-009 Country cooperation and partnership 452,000.00 120,119.81 26.58% 452,000.00 22,048.86 4.88% 98,070.95 331,880.19
B3-010 Scientific Library and Knowledge Services 266,250.00 260,668.99 97.90% 266,250.00 231,999.19 87.14% 28,669.80 5,581.01
Total Chapter 30 19,692,828.00 17,986,345.19 91.33% 19,692,828.00 10,079,206.26 51.18% 7,907,138.93 1,706,482.81
Total Title 3 19,692,828.00 17,986,345.19 91.33% 19,692,828.00 10,079,206.26 51.18% 7,907,138.93 1,706,482.81
GRAND TOTAL 58,315,000.00 53,800,201.50 92.26% 58,315,000.00 43,237,385.58 74.14% 10,562,815.92 4,514,798.50
Final Annual Accounts 2013
30
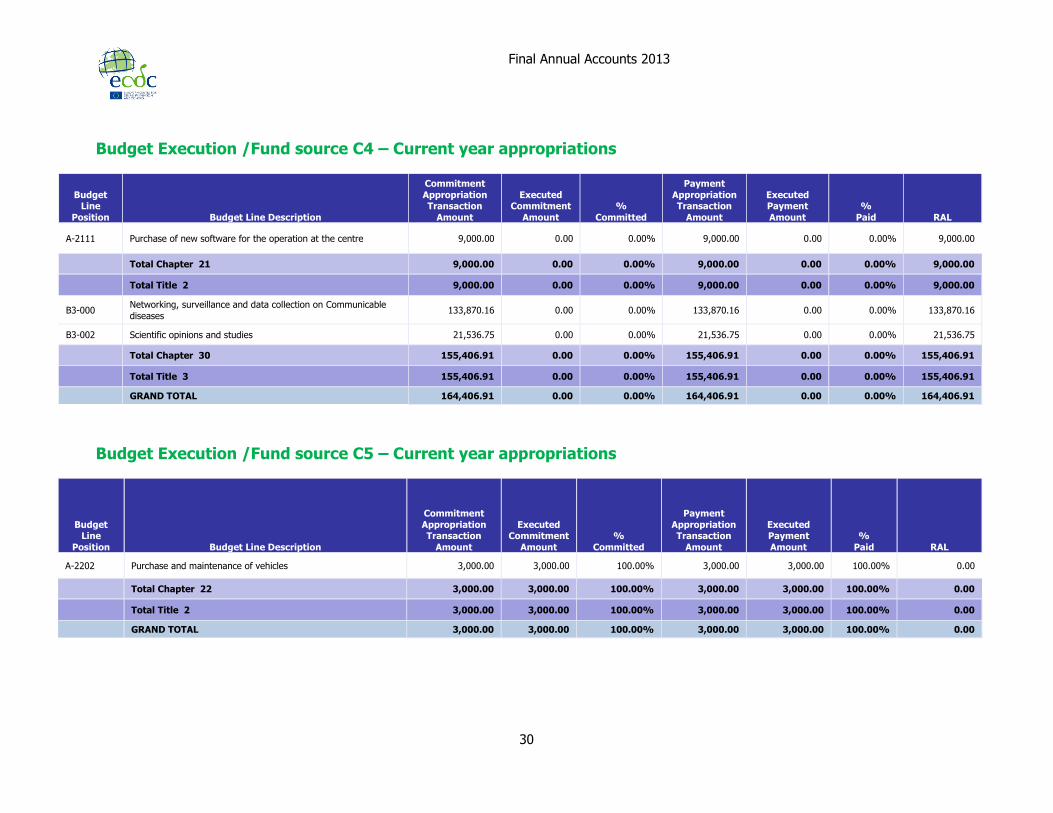
Budget Execution /Fund source C4 – Current year appropriations
Budget Line
Position Budget Line Description
Commitment
Appropriation Transaction
Amount
Executed Commitment
Amount
%
Committed
Payment
Appropriation Transaction
Amount
Executed Payment
Amount
%
Paid RAL
A-2111 Purchase of new software for the operation at the centre 9,000.00 0.00 0.00% 9,000.00 0.00 0.00% 9,000.00
Total Chapter 21 9,000.00 0.00 0.00% 9,000.00 0.00 0.00% 9,000.00
Total Title 2 9,000.00 0.00 0.00% 9,000.00 0.00 0.00% 9,000.00
B3-000 Networking, surveillance and data collection on Communicable
diseases 133,870.16 0.00 0.00% 133,870.16 0.00 0.00% 133,870.16
B3-002 Scientific opinions and studies 21,536.75 0.00 0.00% 21,536.75 0.00 0.00% 21,536.75
Total Chapter 30 155,406.91 0.00 0.00% 155,406.91 0.00 0.00% 155,406.91
Total Title 3 155,406.91 0.00 0.00% 155,406.91 0.00 0.00% 155,406.91
GRAND TOTAL 164,406.91 0.00 0.00% 164,406.91 0.00 0.00% 164,406.91
Budget Execution /Fund source C5 – Current year appropriations
Budget Line
Position Budget Line Description
Commitment
Appropriation Transaction
Amount
Executed Commitment
Amount
%
Committed
Payment
Appropriation Transaction
Amount
Executed Payment
Amount
%
Paid RAL
A-2202 Purchase and maintenance of vehicles 3,000.00 3,000.00 100.00% 3,000.00 3,000.00 100.00% 0.00
Total Chapter 22 3,000.00 3,000.00 100.00% 3,000.00 3,000.00 100.00% 0.00
Total Title 2 3,000.00 3,000.00 100.00% 3,000.00 3,000.00 100.00% 0.00
GRAND TOTAL 3,000.00 3,000.00 100.00% 3,000.00 3,000.00 100.00% 0.00
Final Annual Accounts 2013
31
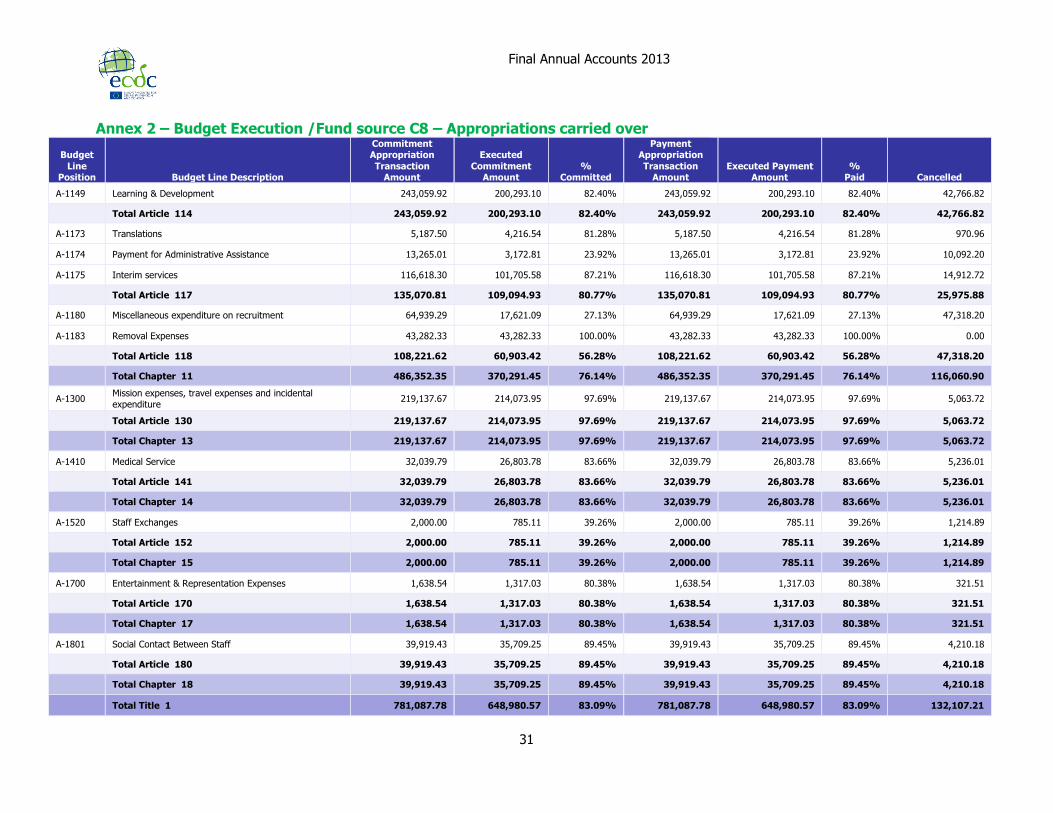
Annex 2 – Budget Execution /Fund source C8 – Appropriations carried over
Budget
Line Position Budget Line Description
Commitment Appropriation
Transaction Amount
Executed
Commitment Amount
% Committed
Payment Appropriation
Transaction Amount
Executed Payment Amount
% Paid Cancelled
A-1149 Learning & Development 243,059.92 200,293.10 82.40% 243,059.92 200,293.10 82.40% 42,766.82
Total Article 114 243,059.92 200,293.10 82.40% 243,059.92 200,293.10 82.40% 42,766.82
A-1173 Translations 5,187.50 4,216.54 81.28% 5,187.50 4,216.54 81.28% 970.96
A-1174 Payment for Administrative Assistance 13,265.01 3,172.81 23.92% 13,265.01 3,172.81 23.92% 10,092.20
A-1175 Interim services 116,618.30 101,705.58 87.21% 116,618.30 101,705.58 87.21% 14,912.72
Total Article 117 135,070.81 109,094.93 80.77% 135,070.81 109,094.93 80.77% 25,975.88
A-1180 Miscellaneous expenditure on recruitment 64,939.29 17,621.09 27.13% 64,939.29 17,621.09 27.13% 47,318.20
A-1183 Removal Expenses 43,282.33 43,282.33 100.00% 43,282.33 43,282.33 100.00% 0.00
Total Article 118 108,221.62 60,903.42 56.28% 108,221.62 60,903.42 56.28% 47,318.20
Total Chapter 11 486,352.35 370,291.45 76.14% 486,352.35 370,291.45 76.14% 116,060.90
A-1300 Mission expenses, travel expenses and incidental expenditure
219,137.67 214,073.95 97.69% 219,137.67 214,073.95 97.69% 5,063.72
Total Article 130 219,137.67 214,073.95 97.69% 219,137.67 214,073.95 97.69% 5,063.72
Total Chapter 13 219,137.67 214,073.95 97.69% 219,137.67 214,073.95 97.69% 5,063.72
A-1410 Medical Service 32,039.79 26,803.78 83.66% 32,039.79 26,803.78 83.66% 5,236.01
Total Article 141 32,039.79 26,803.78 83.66% 32,039.79 26,803.78 83.66% 5,236.01
Total Chapter 14 32,039.79 26,803.78 83.66% 32,039.79 26,803.78 83.66% 5,236.01
A-1520 Staff Exchanges 2,000.00 785.11 39.26% 2,000.00 785.11 39.26% 1,214.89
Total Article 152 2,000.00 785.11 39.26% 2,000.00 785.11 39.26% 1,214.89
Total Chapter 15 2,000.00 785.11 39.26% 2,000.00 785.11 39.26% 1,214.89
A-1700 Entertainment & Representation Expenses 1,638.54 1,317.03 80.38% 1,638.54 1,317.03 80.38% 321.51
Total Article 170 1,638.54 1,317.03 80.38% 1,638.54 1,317.03 80.38% 321.51
Total Chapter 17 1,638.54 1,317.03 80.38% 1,638.54 1,317.03 80.38% 321.51
A-1801 Social Contact Between Staff 39,919.43 35,709.25 89.45% 39,919.43 35,709.25 89.45% 4,210.18
Total Article 180 39,919.43 35,709.25 89.45% 39,919.43 35,709.25 89.45% 4,210.18
Total Chapter 18 39,919.43 35,709.25 89.45% 39,919.43 35,709.25 89.45% 4,210.18
Total Title 1 781,087.78 648,980.57 83.09% 781,087.78 648,980.57 83.09% 132,107.21
Final Annual Accounts 2013
32
Budget Line
Position Budget Line Description
Commitment Appropriation Transaction
Amount
Executed Commitment
Amount
%
Committed
Payment Appropriation Transaction
Amount
Executed Payment
Amount
%
Paid Cancelled
A-2002 Water, Gas, Electricity Expenses 21,544.06 18,139.23 84.20% 21,544.06 18,139.23 84.20% 3,404.83
A-2003 Maintenance, cleaning 29,631.91 28,751.88 97.03% 29,631.91 28,751.88 97.03% 880.03
A-2004 Fitting-out 40,077.31 38,917.82 97.11% 40,077.31 38,917.82 97.11% 1,159.49
A-2005 Security of BuildingSecurity of Building 17,887.98 17,887.98 100.00% 17,887.98 17,887.98 100.00% 0.00
A-2006 Restauration & Canteen costs 8,891.09 8,176.14 91.96% 8,891.09 8,176.14 91.96% 714.95
A-2009 Other expenditure on buildings 13,221.02 13,019.30 98.47% 13,221.02 13,019.30 98.47% 201.72
Total Article 200 131,253.37 124,892.35 95.15% 131,253.37 124,892.35 95.15% 6,361.02
Total Chapter 20 131,253.37 124,892.35 95.15% 131,253.37 124,892.35 95.15% 6,361.02
A-2110 Purchases of new hardware for operation the centre 347,233.55 347,215.29 99.99% 347,233.55 347,215.29 99.99% 18.26
A-2111 Purchase of new software for the operation at the centre
158,083.54 152,800.39 96.66% 158,083.54 152,800.39 96.66% 5,283.15
A-2112 Purchase and Maintenance of printing and reproduction equipment
66,657.82 45,854.96 68.79% 66,657.82 45,854.96 68.79% 20,802.86
A-2114 Developments to support administrative and
management applications 163,820.00 158,801.29 96.94% 163,820.00 158,801.29 96.94% 5,018.71
Total Article 211 735,794.91 704,671.93 95.77% 735,794.91 704,671.93 95.77% 31,122.98
Total Chapter 21 735,794.91 704,671.93 95.77% 735,794.91 704,671.93 95.77% 31,122.98
A-2200 Technical equipment and AV installations 13,596.69 12,565.38 92.41% 13,596.69 12,565.38 92.41% 1,031.31
A-2201 Furniture 21,277.55 21,205.22 99.66% 21,277.55 21,205.22 99.66% 72.33
A-2202 Purchase and maintenance of vehicles 520.08 306.22 58.88% 520.08 306.22 58.88% 213.86
Total Article 220 35,394.32 34,076.82 96.28% 35,394.32 34,076.82 96.28% 1,317.50
Total Chapter 22 35,394.32 34,076.82 96.28% 35,394.32 34,076.82 96.28% 1,317.50
Final Annual Accounts 2013
33
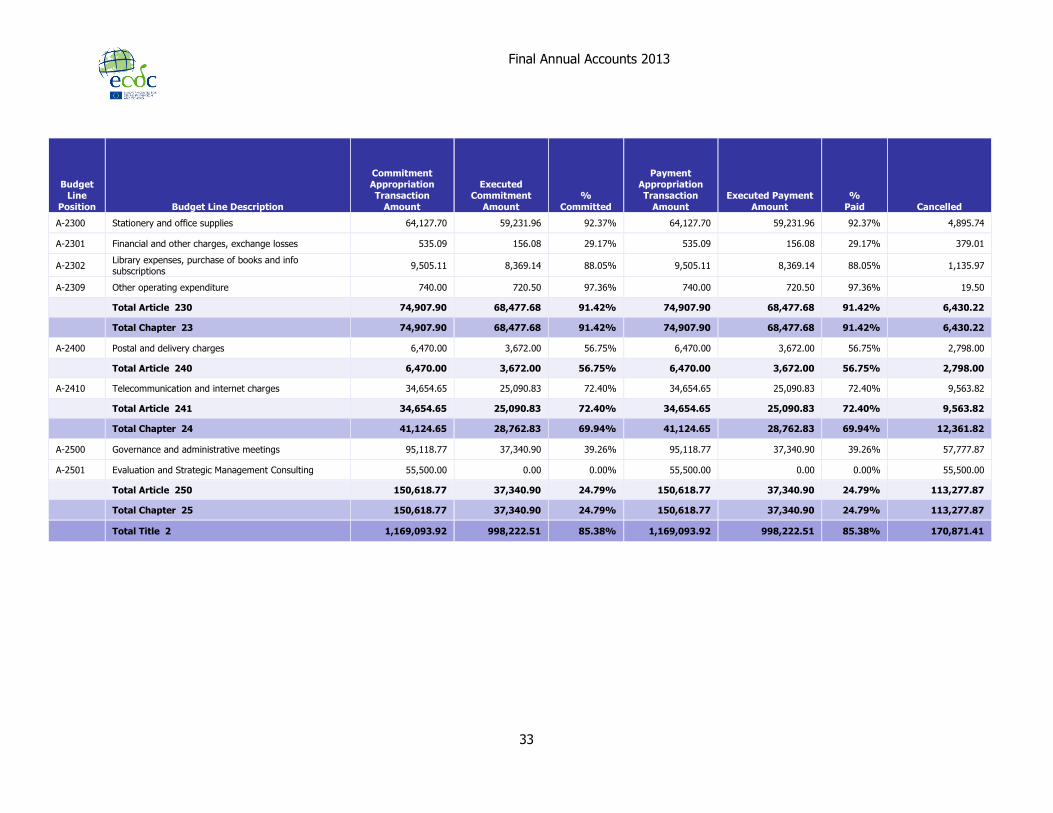
Budget Line
Position Budget Line Description
Commitment Appropriation Transaction
Amount
Executed Commitment
Amount
%
Committed
Payment Appropriation Transaction
Amount
Executed Payment
Amount
%
Paid Cancelled
A-2300 Stationery and office supplies 64,127.70 59,231.96 92.37% 64,127.70 59,231.96 92.37% 4,895.74
A-2301 Financial and other charges, exchange losses 535.09 156.08 29.17% 535.09 156.08 29.17% 379.01
A-2302 Library expenses, purchase of books and info subscriptions
9,505.11 8,369.14 88.05% 9,505.11 8,369.14 88.05% 1,135.97
A-2309 Other operating expenditure 740.00 720.50 97.36% 740.00 720.50 97.36% 19.50
Total Article 230 74,907.90 68,477.68 91.42% 74,907.90 68,477.68 91.42% 6,430.22
Total Chapter 23 74,907.90 68,477.68 91.42% 74,907.90 68,477.68 91.42% 6,430.22
A-2400 Postal and delivery charges 6,470.00 3,672.00 56.75% 6,470.00 3,672.00 56.75% 2,798.00
Total Article 240 6,470.00 3,672.00 56.75% 6,470.00 3,672.00 56.75% 2,798.00
A-2410 Telecommunication and internet charges 34,654.65 25,090.83 72.40% 34,654.65 25,090.83 72.40% 9,563.82
Total Article 241 34,654.65 25,090.83 72.40% 34,654.65 25,090.83 72.40% 9,563.82
Total Chapter 24 41,124.65 28,762.83 69.94% 41,124.65 28,762.83 69.94% 12,361.82
A-2500 Governance and administrative meetings 95,118.77 37,340.90 39.26% 95,118.77 37,340.90 39.26% 57,777.87
A-2501 Evaluation and Strategic Management Consulting 55,500.00 0.00 0.00% 55,500.00 0.00 0.00% 55,500.00
Total Article 250 150,618.77 37,340.90 24.79% 150,618.77 37,340.90 24.79% 113,277.87
Total Chapter 25 150,618.77 37,340.90 24.79% 150,618.77 37,340.90 24.79% 113,277.87
Total Title 2 1,169,093.92 998,222.51 85.38% 1,169,093.92 998,222.51 85.38% 170,871.41
Final Annual Accounts 2013
34
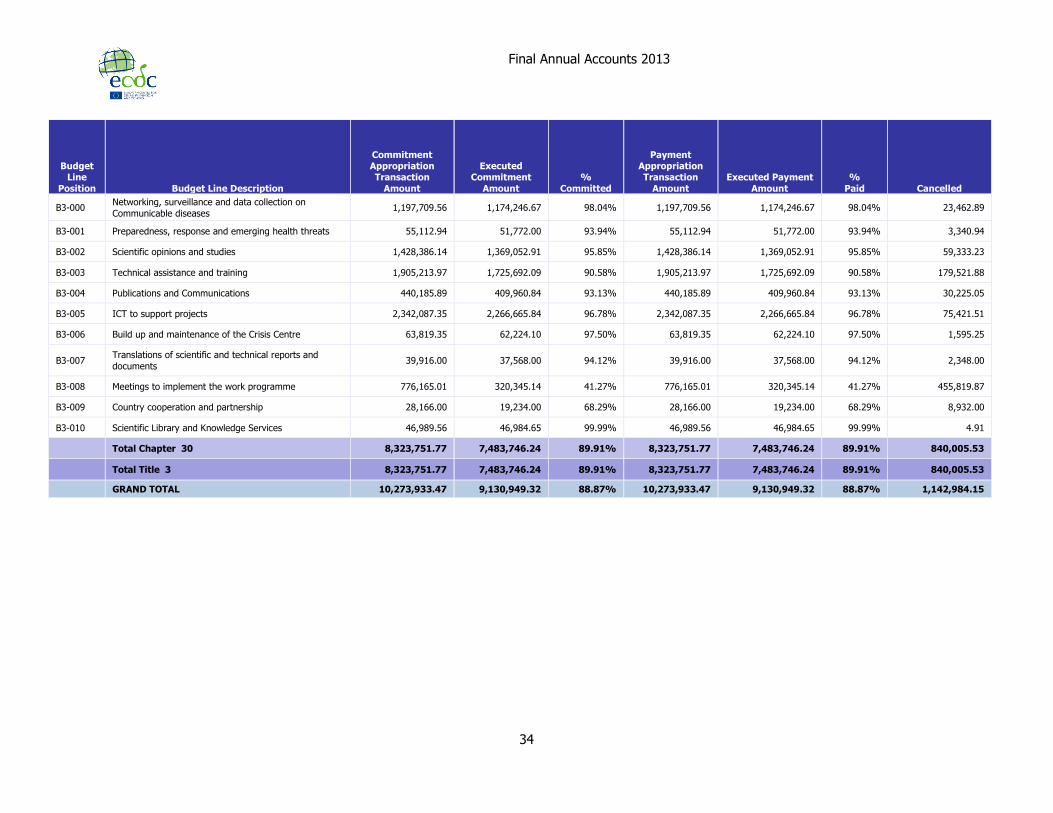
Budget Line
Position Budget Line Description
Commitment Appropriation Transaction
Amount
Executed Commitment
Amount
%
Committed
Payment Appropriation Transaction
Amount
Executed Payment
Amount
%
Paid Cancelled
B3-000 Networking, surveillance and data collection on
Communicable diseases 1,197,709.56 1,174,246.67 98.04% 1,197,709.56 1,174,246.67 98.04% 23,462.89
B3-001 Preparedness, response and emerging health threats 55,112.94 51,772.00 93.94% 55,112.94 51,772.00 93.94% 3,340.94
B3-002 Scientific opinions and studies 1,428,386.14 1,369,052.91 95.85% 1,428,386.14 1,369,052.91 95.85% 59,333.23
B3-003 Technical assistance and training 1,905,213.97 1,725,692.09 90.58% 1,905,213.97 1,725,692.09 90.58% 179,521.88
B3-004 Publications and Communications 440,185.89 409,960.84 93.13% 440,185.89 409,960.84 93.13% 30,225.05
B3-005 ICT to support projects 2,342,087.35 2,266,665.84 96.78% 2,342,087.35 2,266,665.84 96.78% 75,421.51
B3-006 Build up and maintenance of the Crisis Centre 63,819.35 62,224.10 97.50% 63,819.35 62,224.10 97.50% 1,595.25
B3-007 Translations of scientific and technical reports and
documents 39,916.00 37,568.00 94.12% 39,916.00 37,568.00 94.12% 2,348.00
B3-008 Meetings to implement the work programme 776,165.01 320,345.14 41.27% 776,165.01 320,345.14 41.27% 455,819.87
B3-009 Country cooperation and partnership 28,166.00 19,234.00 68.29% 28,166.00 19,234.00 68.29% 8,932.00
B3-010 Scientific Library and Knowledge Services 46,989.56 46,984.65 99.99% 46,989.56 46,984.65 99.99% 4.91
Total Chapter 30 8,323,751.77 7,483,746.24 89.91% 8,323,751.77 7,483,746.24 89.91% 840,005.53
Total Title 3 8,323,751.77 7,483,746.24 89.91% 8,323,751.77 7,483,746.24 89.91% 840,005.53
GRAND TOTAL 10,273,933.47 9,130,949.32 88.87% 10,273,933.47 9,130,949.32 88.87% 1,142,984.15
Final Annual Accounts 2013
35
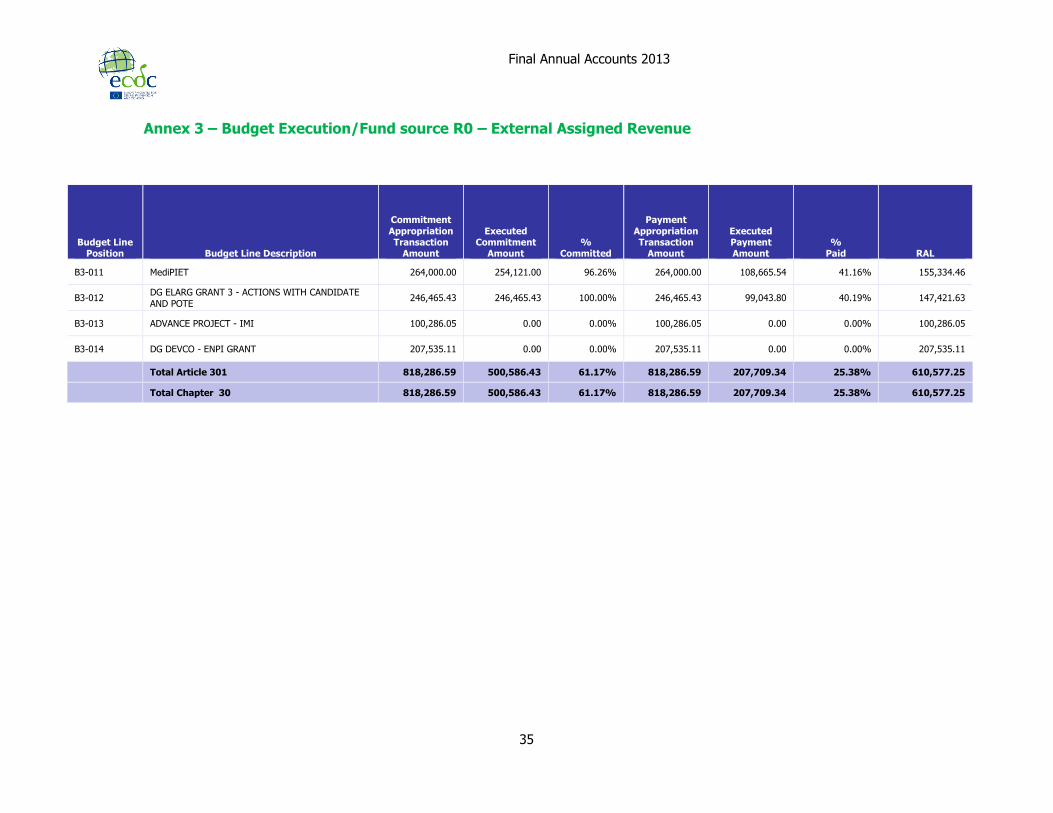
Annex 3 – Budget Execution/Fund source R0 – External Assigned Revenue
Budget Line Position Budget Line Description
Commitment
Appropriation Transaction
Amount
Executed Commitment
Amount %
Committed
Payment
Appropriation Transaction
Amount
Executed Payment Amount
% Paid RAL
B3-011 MediPIET 264,000.00 254,121.00 96.26% 264,000.00 108,665.54 41.16% 155,334.46
B3-012 DG ELARG GRANT 3 - ACTIONS WITH CANDIDATE
AND POTE 246,465.43 246,465.43 100.00% 246,465.43 99,043.80 40.19% 147,421.63
B3-013 ADVANCE PROJECT - IMI 100,286.05 0.00 0.00% 100,286.05 0.00 0.00% 100,286.05
B3-014 DG DEVCO - ENPI GRANT 207,535.11 0.00 0.00% 207,535.11 0.00 0.00% 207,535.11
Total Article 301 818,286.59 500,586.43 61.17% 818,286.59 207,709.34 25.38% 610,577.25
Total Chapter 30 818,286.59 500,586.43 61.17% 818,286.59 207,709.34 25.38% 610,577.25

36
Report on budget and financial management of the European Centre for Disease Prevention and Control
Ninth Financial Year – 2013
Stockholm, June 10th, 2014
37
Table of Contents Page
1. Developments in the organization during the year...................…….….…….…38 2. Budget Implementation & Finance………………………………….…………….….…..…...39 3. Audit issues and internal control……………………….……………………….……………..…42 4. Human Resources and Staffing………………….…….…………………………….……….…44
Report on budget and financial management 2013
38
1. Developments in the Organisation during the year 2013 Since it was set up in 2005, ECDC has grown to around 300 staff, with 200 temporary agents and
another 100 contract agents foreseen to be employed.
2013 was an important milestone in the history of ECDC as it was the last year of the implementation
of its multiannual programme 2007–2013, and the adoption of the new strategic multiannual work programme for the period 2014–2020 (SMAP). The SMAP contains details of agreed deliverables, and
milestones towards those deliverables during 2014-2020, as well as indicators for assessing progress. This will facilitate planning for ECDC in future years and provide a high level of transparency to the
Centre’s partners.
In 2013, ECDC further increased its output, consolidated its structures and developed its partnerships
to address the need for a strengthened response to the threat of communicable diseases in Europe.
ECDC is organised into five Units and the Director’s Office. The Heads of Units are responsible for the activities in their Units, which are divided in sections. There is also a level of middle management,
where a number of Heads of Sections are responsible for the activities. ECDC has a Senior
Management Team (SMT), consisting of the Director and the Heads of Unit, which play an important role in the management of ECDC.
The Annual Work Programme 2013, prepared along the lines of the strategic multi-annual Work Programme 2007-2013, was approved by the Management Board in June 2012. The programme
includes specific objectives. The implementation was followed up on a regular basis through the
Management Information System (MIS), which had been implemented in 2009 with the view to be a central point of reference for the management and monitoring of the activities in the work
programme and additional features have been developed into the application throughout 2013, as the module for procurement. The monthly reporting to the SMT of key data, such as commitments,
payments and budget transfers was continued in 2013 and intensified towards the end of the year with the issue of weekly overviews in order to show the budget implementation and facilitate the
decision making.
In 2013, the Director of ECDC, as Authorising Officer (AO), delegated financial responsibility to the
five Heads of Unit (Authorising Officers by Delegation (AOD)). The Heads of Unit in turn delegated, but only in their absence, to the Deputy Heads of Unit, if applicable. Should the Deputy Head of Unit
be unavailable, the authority returns to the Director. Thereby, a very limited number of persons act
as AO/AOD in ECDC. The AODs can enter into budgetary and legal commitments and authorise payments. However, all budgetary and legal commitments over 250.000€ need to be signed by the
Director.
For the expenditure of 2013, the AODs signed a Declaration of Assurance to the AO, similar to the
one signed by the AO himself, for the area for which they have been delegated responsibility.
Report on budget and financial management 2013
39
2. Budget Implementation ABAC WF (the EC integrated budgetary and accounting system) has reinforced compliance with the
accrual accounting rules and ensured that ECDC financial systems are updated with all changes in the financial regulation.
The core budget of the Centre remained approximately at the same level as in the previous year, namely € 58.3 million in 2013 compared to € 58.2 million in 2012.
The budget execution in terms of commitment appropriations at year end initially reached 96% (=
55.9 million €), which would have been a similar percentage to 2012.
Following the general advice of the European Commission (EC) to Agencies, ECDC prepared for the
scenario to enable it to pay for the outstanding salary adjustments regarding 2011 in December
2013, pending the decision of the Court of Justice (CJ).
The EC and ECDC simulated the total budgetary impact of the rappel 2011, which was estimated at € 3.4 million. Additionally to 2.1 million € earmarked on salary and non-salary budget lines within Title
I, ECDC identified the need to reserve (and transfer) 1.3 million € from Title II and III into Title I. A
formal document requesting the approval of the MB regarding these transfers was presented to the MB on the day of the non-approval of the rappel 2011.
Following the negative ruling of the CJ regarding rappel 2011, the transfers have not been carried out and a total of € 3.28 million, strictly foreseen for this purpose, remained unused and had to be
cancelled at the end of 2013.
As a consequence, the final budget execution decreased to 92% in terms of commitment appropriations, equivalent to € 53.8 million.
In 2013, a total of 8% of the 2013 budget or € 4.5 million remained unused of which € 2.3 million in
Title I, € 0.5 million in Title II and € 1.7 million in Title III. The majority of budget lines with unused appropriations are staff related such as Salaries & Allowances and Weightings applied to
remunerations and other cancelled funds earmarked for the rappel 2011 on Title II and III. As
described above, 3.28 million € in Title I, II and III remained unspent at year-end due to the non –approval of the salary adjustments.
The budget execution, in terms of payments, reached 74% of the total budget and therefore slightly
decreased by 2% compared to 2012. The payment execution for administrative expenses reached
almost 69% and therefore remained at the same level as in 2012. The payment execution for operational expenses in Title III reached 51% and therefore decreased by 7% compared to 2012.
The main reason for this is, that the substantial amount of 1.3 million €, which had been earmarked for the rappel 2011 on Title III, had to be cancelled at the end of the year.
Report on budget and financial management 2013
40
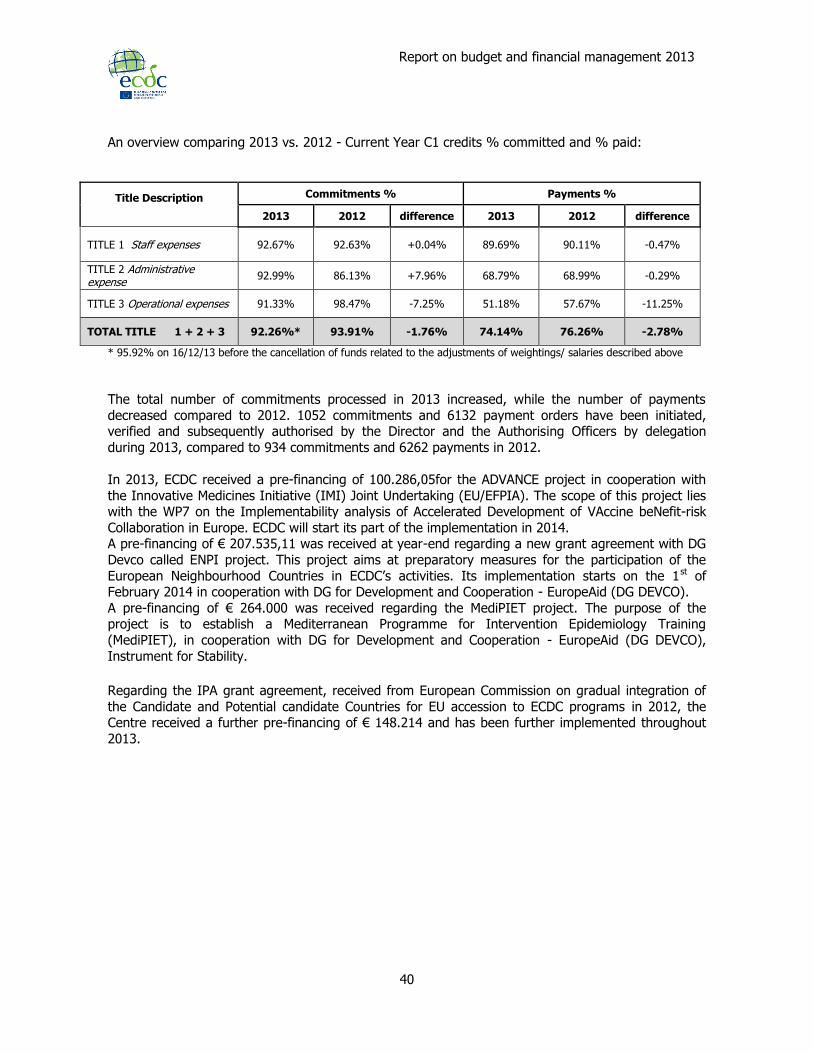
An overview comparing 2013 vs. 2012 - Current Year C1 credits % committed and % paid:
Title Description Commitments % Payments %
2013 2012 difference 2013 2012 difference
TITLE 1 Staff expenses 92.67% 92.63% +0.04% 89.69% 90.11% -0.47%
TITLE 2 Administrative expense
92.99% 86.13% +7.96% 68.79% 68.99% -0.29%
TITLE 3 Operational expenses 91.33% 98.47% -7.25% 51.18% 57.67% -11.25%
TOTAL TITLE 1 + 2 + 3 92.26%* 93.91% -1.76% 74.14% 76.26% -2.78%
* 95.92% on 16/12/13 before the cancellation of funds related to the adjustments of weightings/ salaries described above
The total number of commitments processed in 2013 increased, while the number of payments
decreased compared to 2012. 1052 commitments and 6132 payment orders have been initiated, verified and subsequently authorised by the Director and the Authorising Officers by delegation
during 2013, compared to 934 commitments and 6262 payments in 2012.
In 2013, ECDC received a pre-financing of 100.286,05for the ADVANCE project in cooperation with
the Innovative Medicines Initiative (IMI) Joint Undertaking (EU/EFPIA). The scope of this project lies with the WP7 on the Implementability analysis of Accelerated Development of VAccine beNefit-risk
Collaboration in Europe. ECDC will start its part of the implementation in 2014. A pre-financing of € 207.535,11 was received at year-end regarding a new grant agreement with DG
Devco called ENPI project. This project aims at preparatory measures for the participation of the
European Neighbourhood Countries in ECDC’s activities. Its implementation starts on the 1st of February 2014 in cooperation with DG for Development and Cooperation - EuropeAid (DG DEVCO).
A pre-financing of € 264.000 was received regarding the MediPIET project. The purpose of the project is to establish a Mediterranean Programme for Intervention Epidemiology Training
(MediPIET), in cooperation with DG for Development and Cooperation - EuropeAid (DG DEVCO),
Instrument for Stability.
Regarding the IPA grant agreement, received from European Commission on gradual integration of
the Candidate and Potential candidate Countries for EU accession to ECDC programs in 2012, the Centre received a further pre-financing of € 148.214 and has been further implemented throughout
2013.
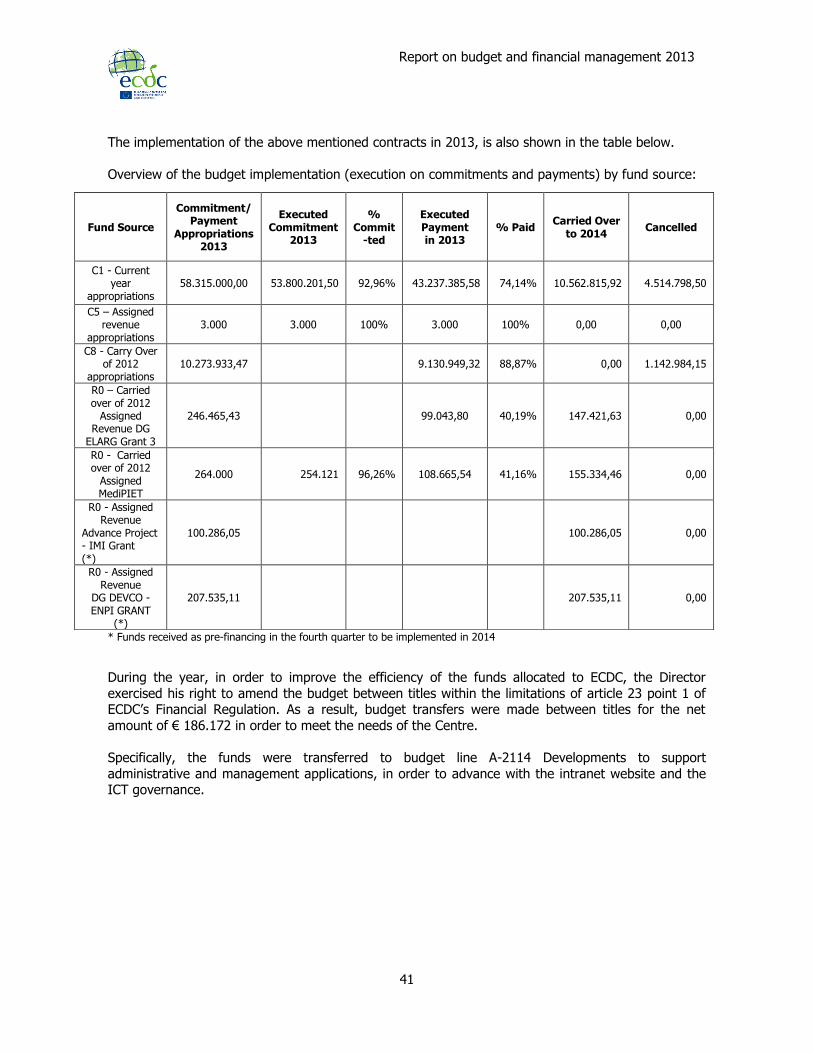
Report on budget and financial management 2013
41
The implementation of the above mentioned contracts in 2013, is also shown in the table below.
Overview of the budget implementation (execution on commitments and payments) by fund source:
* Funds received as pre-financing in the fourth quarter to be implemented in 2014
During the year, in order to improve the efficiency of the funds allocated to ECDC, the Director
exercised his right to amend the budget between titles within the limitations of article 23 point 1 of ECDC’s Financial Regulation. As a result, budget transfers were made between titles for the net
amount of € 186.172 in order to meet the needs of the Centre.
Specifically, the funds were transferred to budget line A-2114 Developments to support
administrative and management applications, in order to advance with the intranet website and the ICT governance.
Fund Source
Commitment/ Payment
Appropriations 2013
Executed Commitment
2013
% Commit
-ted
Executed Payment in 2013
% Paid Carried Over
to 2014 Cancelled
C1 - Current year
appropriations 58.315.000,00 53.800.201,50 92,96% 43.237.385,58 74,14% 10.562.815,92 4.514.798,50
C5 – Assigned revenue
appropriations 3.000 3.000 100% 3.000 100% 0,00 0,00
C8 - Carry Over of 2012
appropriations 10.273.933,47 9.130.949,32 88,87% 0,00 1.142.984,15
R0 – Carried over of 2012
Assigned Revenue DG
ELARG Grant 3
246.465,43 99.043,80 40,19% 147.421,63 0,00
R0 - Carried over of 2012
Assigned MediPIET
264.000 254.121 96,26% 108.665,54 41,16% 155.334,46 0,00
R0 - Assigned Revenue
Advance Project - IMI Grant (*)
100.286,05 100.286,05 0,00
R0 - Assigned Revenue
DG DEVCO - ENPI GRANT
(*)
207.535,11 207.535,11 0,00

Report on budget and financial management 2013
42
An overview of the impact of the budget transfers in fund source ‘C1 –Current Year Appropriations’ is provided below:
Budget 2013
Fund Source C1 Current Year
Appropriations Initial Budget
MB Amendments
Director Adjustments
EFTA
Adjustments FINAL BUDGET
Title 1 – Staff related Expenditure
31.535.000,00 0,00 0,00
0,00 31.535.000,00
Title 2 –Administrative Expenditure
6.901.000,00 0,00 186.172,00
0,00 7.087.172,00
Title 3 - Operations 19.879.000,00 0,00 -186.172,00
0,00 19.692.828,00
Total Budget 58.315.000,00 0,00 0,00
0,00 58.315.000,00
At year-end 2013, ECDC carried forward, to 2014, the amount to € 10.5 million, which is equivalent
to 18 % of the total budget and approximately the same amount carried forward at year-end of 2012.
In 2013, there was a significant increase in deliverables from the procurement office which supported
28 open calls for tenders, 3 calls for proposals, as well as 54 negotiated procedures, among which 9
procedures of a value above € 25,000. 56 reopening procedures within ICT framework contracts were undertaken and regular CPCG meetings were held resulting in the issue of 32 CPCG Opinions.
Additionally, the procurement office continued to liaise with external stakeholders and accordingly update procedural guidance at the Centre to enhance compliance with the EU Public Procurement
legislation. In addition, the Centre decided to strengthen the area of procurement without compromising on the legal tasks to be carried out. The Procurement Section and the Legal Services
Section were established. It is envisaged to implement a full restructuring of ECDC Procurement and
Finance activities at the beginning of 2014.
3. Audit issues and internal control
Internal Control Standards
Since 2006, the ECDC has had a set of Internal Control Standards (ICS) in place. They specify the
necessary requirements, actions and expectations in order to build an effective system of internal
control that could provide a reasonable assurance on the achievement of the ECDC objectives. These control standards were developed along the lines of the European Commission’s Internal Control
Standards, which are based on the international Committee of Sponsoring Organizations of the Treadway Commission (COSO) standards.
In early 2010, ECDC followed the example of the European Commission and introduced the revised set of Internal Control Standards. These revised Internal Control Standards are more detailed in the
requirements and increase the internal control especially in the areas of staff allocation and mobility,
business continuity, external communication and accounting and financial reporting. The revised ICS were discussed in detail in the Audit Committee and adopted by the Management Board in March
2010.

Report on budget and financial management 2013
43
The standards cover the areas of mission and values, human resources, planning and risk
management processes, operations and control activities, information and financial reporting, and evaluation and audit.
Each Internal Control Standard is made up of a number of requirements to be met. For each such requirement ECDC has identified what is in place already, the actions to take, the person responsible
and the deadline for when it should be in place.
A review of the implementation of the ICS was performed as part of the work for the annual report 2013. The results were discussed and validated by ECDC management. One of the standards (ICS
number 14) has partly not been implemented, regarding evaluation of activities, while the rest are mainly implemented or implemented. Work will continue in 2014 on the outstanding actions not yet
in place, in order to make sure all ICS are implemented.
European Court of Auditors
ECDC is audited every year by the European Court of Auditors (ECA). The audit provides a Statement
of Assurance as to the reliability of the accounts of the Centre and the legality and regularity of the transactions underlying them.
ECDC received an unqualified (2) opinion for 2012, indicating that the accounts are reliable and the transactions underlying the accounts are legal and regular.
In total, there were 5 comments raised by the ECA regarding the 2012 annual accounts. 3 of them
regarding the Framework Contract from 2009, already dealt with the year before, one regarding a lack of ex-post verification of grants and one regarding carry-overs in operational expenditure (Title
III) being high but reflecting the multi-annual nature of activities.
All of these issues are being addressed by ECDC. A number of actions have already been taken last
year regarding the issues on the Framework Contract, e.g. the new Framework Contract is now being
managed by one Authorising Officer only, and all the consumption is being monitored by one resource officer.
Regarding ex-post verifications of grants the Grant Verification Policy has been revised. All ex-post verifications planned for 2012 will be performed together with the grant verifications for 2013.
Thereby there will be no reduction in the controls performed.
The ECA audit of the 2013 annual accounts is on-going. The draft report will be available in June
2014. The first part of the audit was performed in October 2013 and the second part will be
performed in April 2014.
Internal Audit Service
The ECDC is also audited by its Internal Auditor, the Internal Audit Service of the European Commission (IAS). The audit work to be performed is defined in the risk based IAS Strategic Audit
Plan. All observations and recommendations are taken into account and appropriate action plans are
developed. The implementation of these actions is being followed up regularly.
2 Unqualified audit opinion = The auditor’s report contains a clear written expression of opinion on the financial statements or the legality and regularity of underlying transactions as a whole. An unqualified opinion is expressed when the auditor concludes that, on the whole, the underlying transactions are legal and regular and the supervisory and control systems are adequate to manage the risk.
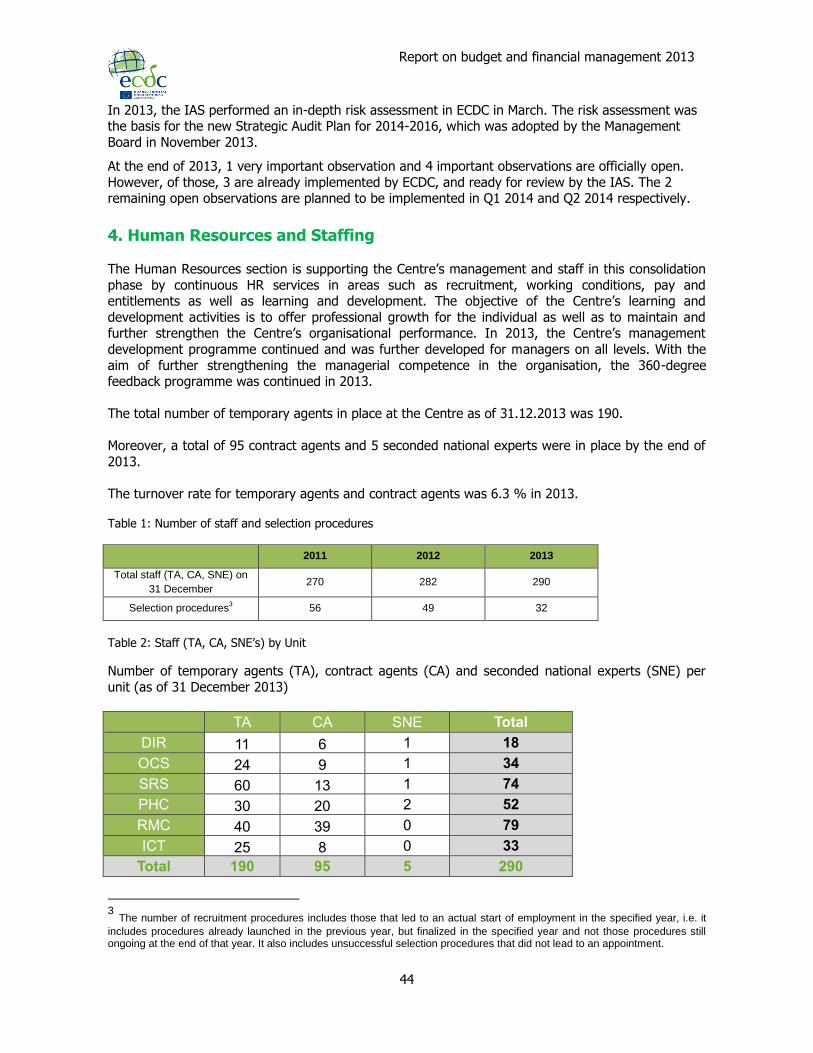
Report on budget and financial management 2013
44
In 2013, the IAS performed an in-depth risk assessment in ECDC in March. The risk assessment was the basis for the new Strategic Audit Plan for 2014-2016, which was adopted by the Management
Board in November 2013.
At the end of 2013, 1 very important observation and 4 important observations are officially open.
However, of those, 3 are already implemented by ECDC, and ready for review by the IAS. The 2 remaining open observations are planned to be implemented in Q1 2014 and Q2 2014 respectively.
4. Human Resources and Staffing
The Human Resources section is supporting the Centre’s management and staff in this consolidation
phase by continuous HR services in areas such as recruitment, working conditions, pay and entitlements as well as learning and development. The objective of the Centre’s learning and
development activities is to offer professional growth for the individual as well as to maintain and further strengthen the Centre’s organisational performance. In 2013, the Centre’s management
development programme continued and was further developed for managers on all levels. With the
aim of further strengthening the managerial competence in the organisation, the 360-degree feedback programme was continued in 2013.
The total number of temporary agents in place at the Centre as of 31.12.2013 was 190.
Moreover, a total of 95 contract agents and 5 seconded national experts were in place by the end of
2013.
The turnover rate for temporary agents and contract agents was 6.3 % in 2013. Table 1: Number of staff and selection procedures
2011 2012 2013
Total staff (TA, CA, SNE) on
31 December 270 282 290
Selection procedures3 56 49 32
Table 2: Staff (TA, CA, SNE’s) by Unit
Number of temporary agents (TA), contract agents (CA) and seconded national experts (SNE) per
unit (as of 31 December 2013)
TA CA SNE Total
DIR 11 6 1 18
OCS 24 9 1 34
SRS 60 13 1 74
PHC 30 20 2 52
RMC 40 39 0 79
ICT 25 8 0 33
Total 190 95 5 290
3 The number of recruitment procedures includes those that led to an actual start of employment in the specified year, i.e. it
includes procedures already launched in the previous year, but finalized in the specified year and not those procedures still ongoing at the end of that year. It also includes unsuccessful selection procedures that did not lead to an appointment.
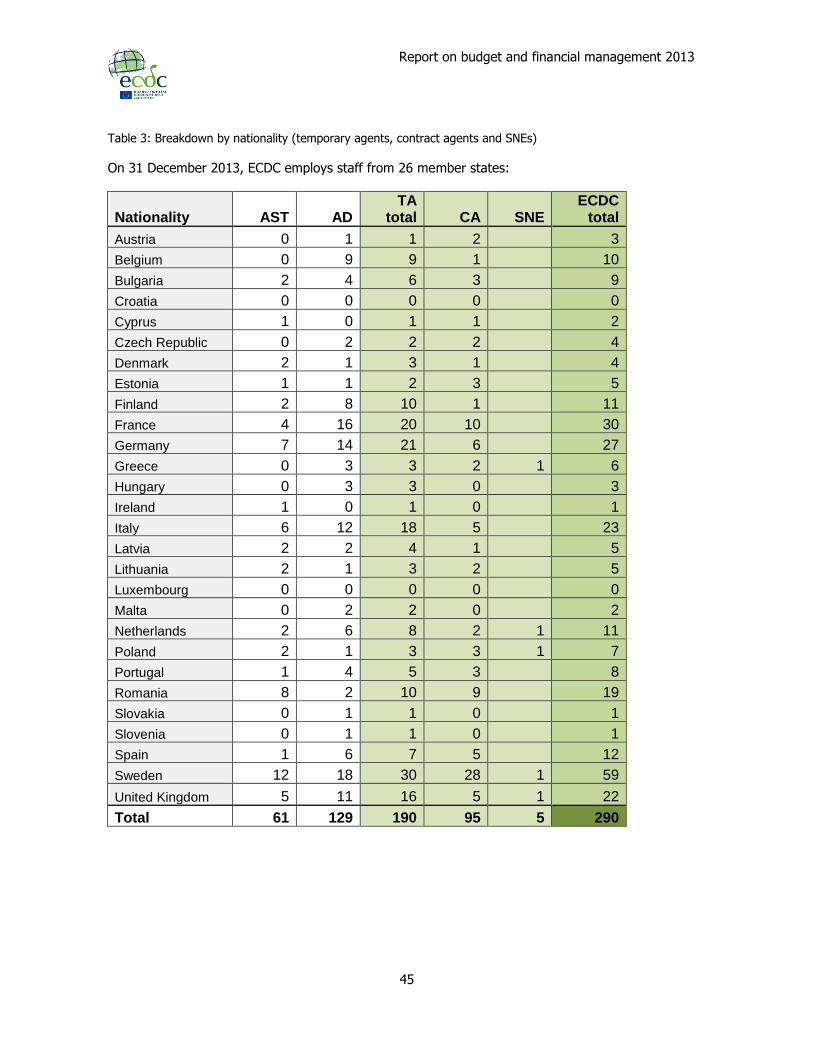
Report on budget and financial management 2013
45
Table 3: Breakdown by nationality (temporary agents, contract agents and SNEs)
On 31 December 2013, ECDC employs staff from 26 member states:
Nationality AST AD TA
total CA SNE ECDC
total
Austria 0 1 1 2 3
Belgium 0 9 9 1 10
Bulgaria 2 4 6 3 9
Croatia 0 0 0 0
0
Cyprus 1 0 1 1 2
Czech Republic 0 2 2 2 4
Denmark 2 1 3 1 4
Estonia 1 1 2 3 5
Finland 2 8 10 1 11
France 4 16 20 10 30
Germany 7 14 21 6 27
Greece 0 3 3 2 1 6
Hungary 0 3 3 0 3
Ireland 1 0 1 0 1
Italy 6 12 18 5 23
Latvia 2 2 4 1 5
Lithuania 2 1 3 2 5
Luxembourg 0 0 0 0 0
Malta 0 2 2 0 2
Netherlands 2 6 8 2 1 11
Poland 2 1 3 3 1 7
Portugal 1 4 5 3 8
Romania 8 2 10 9 19
Slovakia 0 1 1 0 1
Slovenia 0 1 1 0 1
Spain 1 6 7 5 12
Sweden 12 18 30 28 1 59
United Kingdom 5 11 16 5 1 22
Total 61 129 190 95 5 290