Embed Size (px)
Citation preview

.l ever in NNUAL ACCOUl
1985
/ I
ENGLISH VERSION IN GUILDERS

I
Unilever rn 1985 Annual Accounts
UNlLEVER N.V. ANNUAL ACCOUNTS 1985 AND FURTHER INFORMATION
Contents
Report of the auditors Accounts - general introductron -- Accounts - accounting policies Consolrdated accounts and no?es Consolrdated current cost accounts and notes Principal group and related companies Unilever N.V. company accounts and notes Unilever N.V. further statutory information Unilever PLC company balance sheet and notes
rw3e introduction This booklet contains the Unilever N V Annual Accounts for
2 1985, the Audrtors’ Report thereon, further statutory 3 informatron and the company balance sheet of Umlever PLC.
4-5 The Unilever N.V. Annual Accounts comprise the company
6-23 accounts on the historical cost basis of Unilever N V., and
24-29 the consolidated accounts on the historical cost basis,
30-33 together with supplementary current cost accounts, of the
34-36 N.V. Group, the PLC Group and the combined N.V. and PLC
-- Groups, Currency figures in the Unilever N.V. Annual 36 Accounts are expressed in guilders, except where stated
37-39 otherwise.
This booklet is an English translation of the original Dutch publication. There is also an English version issued by PLC with currency figures expressed in pounds sterling and containing the Unilever PLC Annual Accounts for 1985 together with the Auditors’ Report thereon; it is identical with this booklet except for the difference in currency and for certain details which are required only in the United Kingdom or in the Netherlands and which are therefore not included in the N V or PLC versions respectively
The Unilever N.V. Directors’ Report for 1985, with figures expressed in guilders, is contained in a separate booklet entitled ‘Unrlever In 1985, Annual Report and Salient Figures’ which is available in Dutch, and in English and German translatrons. In addition there IS an English version with figures translated into US dollars, as well as an English version issued by Unilever PLC with figures in pounds sterling.
The documents ‘Unilever in 1985, Annual Report and Salient Figures’ and ‘Umlever in 1985, Annual Accounts’ in the Dutch language, with figures expressed rn gurlders, together comprise the full Annual Report and Accounts and further statutory information, as drawn up by the Board of Directors of Unilever N V. in accordance with Dutch legislation
Copies of both documents and of all other versions thereof can be obtained without charge on application to: Unilever N.V., External Affairs Department, PO Box 760, 3000 DK Rotterdam, or Unilever PLC, External Affairs Department, PO Box 68, Unilever House, London EC4P 4BQ.
1

Unrlever in 1985 Annual Accounts
Report of the auditors to the members of Unilever N.V. We have examined the accounts expressed in guilders of Unilever N.V., which include the accounts of the N.V. Group, the PLC Group, and the combined N V and PLC Groups.
In our opinion the accounts set out on pages 3 to 23 and 30 to 36, which have been prepared under the historical cost convention, give a true and fair view of the state of affairs of Unilever N.V., the N.V. Group, the PLC Group, and the combined N.V. and PLC Groups at 31st December, 1985 and of their profit and source and use of funds for the year then ended.
In our opinion the supplementary current cost accounts on pages 24 to 29, which have been prepared on a different basis for providing for deferred taxation from that adopted in the historical cost accounts, have been properly prepared in accordance with the policies and methods set out in the notes. In our opinion the summary of the effect on the current cost accounts of adopting a full provision for deferred taxation on page 29 has been properly prepared.
Price Waterhouse Nederland Coopers & Lybrand The Hague London
Coopers & Lybrand Nederland Price Waterhouse Rotterdam London
As auditors of Unilever N.V., As auditors of Unilever PLC m respect of the in respect of the accounts of Unilever N V., accounts of Unilever PLC, the N.V. Group and the the PLC Group and the combmed N.V. and combined PLC and PLC Groups N.V. Groups
1st April, 1986
A separate audit report has been issued to the members of Unilever PLC on the accounts of Unilever PLC and the PLC Group, in accordance with legal requirements in the United Kingdom, and on the accounts of the N.V. Group and the accounts of the combined PLC and N.V. Groups. Those accounts are expressed in pounds sterling.
2

Unilever in 1985 Annual Accounts
Unilever The two parent companies, Unilever N.V. and Unilever PLC, operate as nearly as practicable as a single company, have identical Boards of Directors and are linked by agreements, including an Equalisation Agreement which is designed so that the position of the shareholders of both companies is as nearly as possible the same as if they held shares in a single company. The combined affairs of N.V. and PLC are, therefore, more important to shareholders than those of the two separate companies.
Consequently, combined accounts are prepared for Unilever N.V. and Unilever PLC which comprise an aggregation of the consolidated accounts of Unilever N.V. and its group companies and the consolidated accounts of Unilever PLC and its group companies.
The Equalisation Agreement, amongst other things, provides for both companies to adopt the same principles of accountancy and requires as a general rule the dividends and other rights and benefits (including rights on liquidation) attaching to each FI. 12 nominal of ordinary capital of N.V. to be equal in value at the relevant sterling/guilder rate of exchange to those attaching to each E 1 nominal of ordinary share capital of PLC as if each such unit formed part of the ordinary capital of one and the same company
Companies legislation The accounts set out on pages 3 to 23 and 30 to 39 have been prepared under the historical cost convention and comply with Civil Code, Book 2 in the Netherlands and the United Kingdom Companies Act 1985.
As additional information current cost accounts are set out on pages 24 to 29.
Accounting standards The accounts comply with Accounting Standards (SSAPs) in the United Kingdom, except for the treatment of deferred taxation as explained below, and with current Dutch accounting principles.
United Kingdom Accounting Standard SSAP 15 requires that no provision should be made for deferred taxation when it is probable, based on reasonable assumptions, that a liability will not crystallise. In this respect SSAP 15 is not in agreement with Dutch law as currently applied and, because of the latter and the Equalisation Agreement, full provision continues to be made for deferred taxation liabilities. The effects of this departure from SSAP 15 are shown in the notes to the accounts.
OECD Guidelines In preparing our Report and Accounts we adhere to the disclosure recommendations of the OECD Guidelines for Multinational Enterprises.
3 _-
Unilever rn 1985 Annual Accounts
Group companies Companies included in the consolidation of N.V. (N.V. group companies) are the companies in which, directly or indirectly, N.V. holds more than half of the total issued capital and companies in which, directly or indirectly, N.V. holds half or less of the total issued capital where their consolidation is in accordance with the true and fair view required to be given by the accounts.
Companies included in the consolidation of PLC (PLC group companies) are those in which, directly or indirectly, PLC holds more than half of the equity capital and those in which, directly or indirectly, PLC is a shareholder and controls the composition of a majority of the board of directors.
The figures of all group companies are included in the consolidated accounts as at 31st December, except those of some group companies in Africa, which prepare their accounts to 30th September and are included on that basis.
Brooke Bond Group plc and its group companies were acquired by PLC on 10th October, 1984, the effective date of acquisition being taken as 30th September, 1984. The turnover and results of the Brooke Bond Group for the fourth quarter of 1984, together with the fourth quarter 1984 finance costs of the acquisitron, were not taken up In the 1984 PLC consolrdated accounts and are now included In the 1985 PLC consolidated profrt and loss account
A list of principal group companies is given on pages 30 to 33.
Related companies Related companres (associated companres and trade investments) are those, other than group companies, in which N.V or PLC directly or indirectly has a shareholdrng, on a long-term basis, for the purpose of securing a contrrbution to the Group’s activities.
Associated companies are related companies In respect of which N.V. or PLC IS in a position to exercise significant influence. The results of associated companies included in the consolidated accounts are for periods ending not earlier than 30th June.
Trade Investments are related companies other than associated companies.
A lrst of principal related companies is given on page 33.
Foreign currencies Exchange differences arisrng in the accounts of indivrdual companies from transactrons denominated In foreign currencies are dealt with In the rndrvrdual companies’ profit and loss accounts Those arising on tradrng transactions are taken to operatrng profit, those arrsrng on cash, current investments and borrowmgs are considered similar In nature to the interest on the correspondrng asset or liability and are therefore Included with Interest receivable or interest payable as approprrate. The amounts Involved are shown in notes (5) and (6) on page 10.
In preparing the consolidated accounts of N.V. in guilders and of PLC in sterling, profit and loss accounts for the year and assets and liabilities at the year-end are translated at year-end rates of exchange. The effect of exchange rate changes during the year on the assets and liabilities at the beginning of the year is recorded as a movement in profit retained.
In arriving at the combined figures in gurlders or sterlrng, the figures for N V In gurlders or PLC In sterlrng are translated at the year-end sterlrng/gurlder exchange rate, except for the ordinary capital of N.V. or PLC, which IS translated at the Equalisation Agreement rate of E 1 = FI. 12. The effect of restating the assets and lrabilihes of N.V. or PLC at the beginning of the year at the year-end sterling/guilder exchange rate is described as sterling/guilder realignment and is shown as a movement in profit retained.
Fixed assets No value is attributed to Intangible assets. Purchased goodwill, being the difference between the price paid for new interests and the fair value of the Group’s share of their net assets at the date of acquisitron, is written off in the year as a movement in profit retained.
Tangible assets are stated at cost (net of capital-based grants) less depreciation. Deprecration is provided by the straight-line method at percentages of cost based on the expected average useful lives of the assets Estimated useful lives by major class of depreciable assets are as follows, the range of lives within each class reflecting the drversrty of the assets.
Freehold burldrngs (no deprecration on freehold land) 33-40 years
Leasehold land and buildings (or life of lease If less than 33 years) 33-40 years
Plant and equipment 5-20 years Motor vehicles 3- 6 years Shrps IO-20 years
Fixed investments comprise interests in and loans to related companies and other investments held on a continuing basis.
Interests In assocrated companies are stated in the consolidated balance sheets at the Group’s share of their net assets; the Group’s share of associated companies’ profits and losses IS included in the consolidated profit and loss accounts; and its share of their retained profits and reserves accrued since acquisitron, or since the initial investment where a company has changed from being a group company to an associated company, is included in consolidated profit retained.
Trade investments are stated at cost less amounts written off and dividends from these shareholdings are accounted for when received.
Other fixed investments, which are stated at cost less amounts written off, consist of long-term shareholdrngs in companies that are not group companies or related companies and long-term loans other than to group companies or related companies
Current assets Stocks are stated at the lower of cost and estimated net realisable value, after provisions for obsolescence. Cost is mainly average cost. It comprises direct costs and, where appropriate, a proportion of production overheads.
Debtors are stated after deducting adequate provrsron for doubtful debts
Current Investments are lrqurd funds temporarrly invested and are shown at their realisable value, the difference between this and cost being taken to other interest recervable and srmrlar income in the profit and loss accounts.
4

Unilever in 1985 Annual Accounts 1
Provisions for liabilities and charges Liabilities in respect of retrrement and death benefits to past and present employees are provided for by payments to pension and provident funds and by making provisions for unfunded pensions. The amounts of the payments/charges are determrned on an actuarial basis so that over the long term the funds and provisions will be adequate to meet the liabilities. The provisions for unfunded pensions and similar obligations represent the estimated present value of the future liability for retirement and death benefits, other than benefits provided through pension and provident funds, after taking account of future charges.
Deferred taxation, calculated at current rates of tax unless future rates have been enacted, includes: (a) tax lrabilities arising from the accelerated depreciation of
tangible assets for tax purposes; (b) tax liabilities relating to stock reliefs; (c) estimated future tax relief on the provisions for unfunded
pensions; (d) tax on short-term and other timing differences; (e) provisron for taxation on the revaluation of the net assets
of new interests acquired.
Provisron is not regarded as necessary, and is not made, for taxation which would become payable if retained profrts of group companies and associated companies were distributed to the parent companies, as it is not the intention to distribute more than the divrdends the tax on whrch is included in the accounts.
The deferred taxation provrsrons which would be released if SSAP 15 were applied are given for informatron in notes (7) and (18) on pages 10 and 18.
Research and development Expenditure on research and development is charged against the profit of the year in which it is incurred.
Turnover Turnover comprises sales of goods and services after deduction of discounts and sales taxes. It includes sales to related companies but does not include sales by related companies or sales between group companies.
Inter-group pricing for goods and services International trade in own manufactured goods between group companies is relatively unimportant, amounting to under 7% of turnover. The preferred method for determining the transfer prices is to take the market price; where there is no market price, the two managements concerned engage in arm’s length negotiations. Normally this will lead to a price fixed at ex-works cost plus an appropriate percentage for a profit mark-up. Where required the method employed is discussed and agreed with the government authorities of the countries concerned.
General services provided by central advisory departments and research laboratories are charged to group companies on the basis of fees under agreements approved where necessary by the government authorities of the countries concerned.
Where a central purchasing department buys goods for a group company for use in Its productron, then that company is erther treated as the buyer In the contract or is given the benefit of the central purchasing department’s contract price.
However, where a specialist buying service is provided directly by one unit for another, an appropriate commissron is generally either included in the price or shown on the face of the relevant documents. In most of these cases the method applied is based on agreements with the taxation and other government authorities of the countries concerned.
Leases Lease rental payments, which are principally in respect of operating leases, are charged to the profit and loss accounts on a straight-line basis over the lease term, or between rent reviews where these exist, except in cases where another systematic and rational basis is more appropriate.
3

nilever in 1985 Annual Accounts
for the year ended 31st December
FI. million
Combined
1984 1985
N.V. PLC
1984 1985 1984 1985
66 791 66 771 Turnover (1) (45 550) (45 783) Cost of sales (2)
21 241 20 988 (IO 496) (IO 770)
(7 622) (6 568) 118 147
Gross profit Drstribution and selling costs (2) Admrnrstrative expenses (2) Other operating Income
3 841 3 797
292 302 459 494
(769) (779)
(18) 17
3 823 3 814 (1 605) (1 591)
2 218 2 223 (140) (159)
2 078 2 064 (108) -
1 970 2 064 (16) (16)
(684) (718)
1 270 1 330
Operating profit (3)
I Income from fixed investments (4) Other interest receivable and similar income (5) Interest payable and similar charges (6)
Financial items
Profit on ordinary activities before taxation Taxation on profit on ordinary activities (7)
Profit on ordinary activities after taxation Outside interests in group companies
Profit on ordinary activities attributable to shareholders Extraordinary items (8)
Profit after extraordinary items attributable to shareholders Preference dividends Dividends on ordinary capital
42 592 40 790 (28 220) (27 059)
14 372 13 731 (7 778) (7 665) (4 221) (3 998)
2 429 2 122
(222) (156)
2 207 1 966 (906) (862)
1 301 1 104 (83) (80)
1218 1 024 (75) -
1 143 1 024 (15) (15)
(452) (474)
676 535
24 199 25 981 (17 330) (18 724)
6 869 7 257 (2 718) (3 105) (2 801) (2 570)
62 93
1412 1 675
266 146
(239)
204 173
1616 1 848 1699) (729)
917 1119 (57) (79)
860 1 040 (33) -
827 1 040 (I) (1)
(232) (244)
594 795 Profit of the year retained
Movements in profit retained 1 270 1 330 Profit of the year retarned 676 535 594 795
(973) (152) Goodwill (154) (132) (819) (20) 315 (1 526) Effect of exchange rate changes 289 (743) 26 (783)
(514) (209) Sterlrng/guilder realignment - - (514) (209)
98 (557) Net movements during year 811 (340) (713) (217) 12 810 12 908 Profrt retained - 1st January 5 469 6 280 7 341 6 628
12 908 12 351 Profit retained - 31st December (20) 6 280 5 940 6 628 6 411
1984 1985 Combined earnings per share (for details of calculation see page 23)
FI. 37.01 FI. 36.79 Guilders per FI. 20 of ordinary capital 134.33p 137.96p Pence per 25~ of ordinary capital
On a SSAP15 basis the figures would be: FI. 38.84 FI. 39.05 Guilders per FI. 20 of ordinary capital
141.06~ 146.318 Pence per 25p of ordinary capital
References between brackets relate to notes on pages 9 to 11 and 21

Unilever In 1985 Annual Accounts
as at 31st December
FI. mlllion
Combined N.V. PLC
1984 1985 1984 1985 1984 1985
12 915 12 162 1 626 1 246
14 541 13 408
11 501 9 744 9 359 8 259 1 856 3 492 2 152 2 398
25 468 23 893
4 285 3 919 10 155 9 404
1 048 1 020 480 502
9 500 9 048
Fixed assets Tangible assets (9) Flxed investments (10)
7 279 7 305 566 498
7 845 7 803
Current assets Stocks (11) Debtors (12) Current investments (13) Cash at bank and in hand (14)
Less. Creditors due within one year Borrowings (15) Trade and other creditors (16) Taxation on profits Dividends
Net current assets
6 197 5 679 5 423 5 229 1 365 1 840 1517 1 664
14 502 14412
1 884 3 063 2401 856 6 037 6 139 4 118 3 265
515 575 533 445 306 330 174 172
5 760 4 305 3 740 4 743
5 636 4 857 1 060 748
6 696 5 605
5 304 4 065 3 936 3 030
491 1 652 1 235 734
10 966 9 481
24 041 22 456 Total assets less current liabilities 13 605 12 108 10 436 10 348
3 274 2 587 189 228 247 191
2 930 2 978 2 551 2 258
-
738 684
Creditors due after more than one year Borrowings (15) Trade and other creditors (16) Taxation on profits
Provisions for liabilities and charges Penslons and similar obligattons (17) Deferred taxation and other provisions (18)
Inter-group N V./PLC
Outside interests in group companies
2 330 2 125 134 161
70 82
2 175 2 331 1 248 1 258
55 (I 085)
356 356
944 462 55 67
177 109
755 647 1 303 1 000
(55) 1 085
382 328
1 400 1 399 89 a7
12 623 12 044
14 112 13 530
Capital and reserves Called up share capital (19) Share premium account Profit retained and other reserves (20)
Total capital employed
495 494 37 35
6 343 6 121
7 237 6 880
13 605 12 108
1st April, 1986
6 875 6 650
10 436 10 348 24 041 22 456
References between brackets relate to notes on pages 11 to 21
7

nrlever rn 1985 Annual Accounts
for the year ended 31st December
FI million
Combined N.V. PLC
1984 1985 1984 1985 1984 1985
3 823 3 814
1 395 1 385 641 671
(186) (130) (85) (138)
5 588 5 602
107 (473)
5 695 5 129
(1 198) (I 406) (2 101) (2 363) (2 340) 402
(7) 57
(I 403) (27) (350) (476)
1 094 891 (641) (690)
(36;) (51%
(7 307) (4 130)
(I 612) 999
Funds generated from operations Profit on ordinary activities before taxation Elimination of items not involving a flow of funds:
Depreciation Unfunded pension provisions Share of associated companies’ profit before taxation, less dividends received Others
Funds from other sources Increase/decrease in borrowings due after more than one year
Total sources
Taxation payments during the year Capital expenditure less disposals Purchase/sale of group companies (21) Purchase/sale of fixed investments Increase/decrease in:
Stocks Debtors Trade and other creditors
Dividends paid during the year Inter-group N.V./PLC Other uses
Total uses
Net increase/decrease in net liquid funds
2 207 1 966
871 837 466 496
(II) (7) (17) 15
3 516 3 307
143 (60)
3 659 3 247
(708) (759) (I 353) (I 500)
(434) (264) (I) 4
(869) (118) (567) (435) 731 749
(440) (464) (IO) (1 139)
(225) (312)
(3 876) (4 238)
1616 1848
524 548 175 175
(175) (1.23) (68) (153)
2 072 2 295
(36) (413)
2 036 1 882
(490) (647) (748) (863)
(I 906) 666 (6) 53
(534) 217 i& 363 142
(201) (226) (1Z 1 139
(206)
(3 431) 108
G!17) (991) (1 395) 1 990
2 112 323 (117) 628
(60) 21
1 935 972 (I 612) 999
323 1 971 Net liquid funds 31st December
1 856 3 492 2 752 2 398
(4 285) (3 919)
Net liquid funds 1st January Effect of exchange rate changes Sterling/guilder realignment
Revised opening funds Net increase/decrease in net liquid funds
of which: Current investments Cash at bank and in hand Borrowrngs due within one year
1 259 998 (44) 434
- -
1215 1432 0.17) (991)
853 (675) (73) 194 (60) 21
720 (460) (I 395) 1 990
998 441 (675) 1530
1 365 1 840 491 1 652 1517 1664 1 235 734
(I 884) (3 063) (2 401) (856)
The figures in the above statement are derived from movements between opening and closing balance sheet totals. Adjustments are, however, made to these movements to remove the effect of exchange rate changes (page 6) sterling/guilder realignment (page 6) and the purchase/sale of group companies (note (21) on page 21).
Reference between brackets relates to note on page 21
8

Unilever in 1985 Annual Accounts c
FI. million
Combined
1984 1985
NV PLC
1984 1985 1984 1985
40 544 42 381 12 838 11 553 13 409 12 837
(1) Turnover Analysis by geographical areas: Europe North America Rest of the World
27 076 27 055 13 468 15 326 11 294 9 662 1 544 1 891
4 222 4 073 9 187 8 764
66 791 66 771 42 592 40 790 24 199 25 981
33 507 33 930 17 371 16 242 4 998 4 785
10 915 11 814
Analysis by operations: Food products Detergents and personal products Speciality chemicals Other operations
23 600 22 901 9 907 11 029 11 697 11 143 5 674 5 099
4 046 3 864 952 921 3 249 2 882 7 666 8 932
66 791 66 771 42 592 40 790 24 199 25 981
(45 550) (45 783) (I 0 496) (10 770)
(9 022) (6 568)
(63 068) (63 121) (40 219) (38 722)
(9 373) (9 180) (13) (12)
(1 027) (950) (458) (445) (824) (825)
(6) (6)
(11 701) (I 1 418) Total staff costs (7 710) (7 492) (3 991) (3 926) (37 182) (37 312) Raw materials and packaging (22 870) (21 765) (14 312) (15 547)
(1 395) (I 385) Depreciation (871) (837) (524) (548) (112) (123) Lease rentals: Plant and machinery (72) (73) (40) (50) (276) (299) Other tangible assets (204) 0.08) (7.3 (91)
(25) (28) Auditors’ remuneration (14) (14) (II) (14) (249) (137) Exceptional items (e.g. reorganisations) (129) (144) (120)
(12 128) (Ii 419) Other costs (8 349) (8 189) (3 779) (4 23;)
(63 068) (63 121) (40 219) (38 722) (22 849) (24 399)
(2) costs Cost of sales Distribution and sellmg costs Administrative expenses
These comprise: Remuneration of employees Emoluments of Directors Unilever pension schemes State pension costs Other social security costs Superannuation of former Directors
(28 220) (7 778) 14 221)
(6 001) (5 852) (3 372) (3 328) (7) (6) (6) (6)
(660) (606) (367) 1344) (346) (351) (112) (94) (693) (674) (131) (151)
(3) (3) (3) (3)
(27 059) (7 665) (3 998)
(17 330) (18 724) (2 718) 13 105) (2 801) (2 570)
(22 849) (24 399)
(3) Operating profit Analysis by geographical areas:
1 707 2 083 Europe 1 205 1 381 502 702 784 432 North America 765 395 19 37
1 350 1 282 Rest of the World 459 346 891 936
3 841 3 797 2 429 2 122 1412 1 675
Analysis by operations. 2 001 1 958 Food products 1 340 1 331 661 627 1 030 699 Detergents and personal products 539 229 491 470
533 508 Speciality chemicals 440 385 93 123 277 632 Other operations 110 177 167 455
3 841 3 797 2 429 2 122 1412 1 675
9

Combined N V. PLC
1984 1985 1984 1985 1984 1985
(4) Income from fixed investments 257 230 Share of assocrated companies’ profrt before taxation 23 21 234 209
Income from trade Investments’ 5 47 Listed shares - 3 5 44
11 13 Unlisted shares 5 2 6 11 Income from other investments:
14 9 Unlisted 14 7 - 2 5 3 Interest on loans 4 3 1 -
~.___ 292 302 46 36 246 266
Income from trade investments - listed shares includes a FI 40 million profit on the sale of a trade investment.
(I 589) (1 469) 1121) (110)
(I 710) (I 579)
105 -
105 (12)
(I 605) (1 591)
(1861 (104) (118) 75
68 48
(236) 19
99 146 17 (121
116 134
2 334 2 357
10
467 (8)
459
(629) 1108)
(32)
(769)
(420)
(5) Other interest receivable and similar income 473 Interest receivable 297 326 170 147
21 Exchange differences (II) 22 3 (I)
494 286 348 173 146
(6) Interest payable and similar charges (629) Interest on borrowings (453) (388) (176) (241) (127) Other interest payable (97) (i13i ill) (14)
(23) Exchange differences (4) (39) (28) 16
(779) (554) (540) (215) (239)
Interest on borrowings, the final repayment of which (386) will be made within five years, amounted to (314) (277) 1106) (109)
Unilever rn 1985 Annual Accounts
(7) Taxation on profit on ordinary activities Current year: Parent and group companies (953) (852) Associated companies (11) (IO)
(964) (862)
Adjustments previous years: Parent and group companies Associated companies
58 - - -
Full provision has been charged for deferred taxation, as explamed on page 3, In respect of: Accelerated depreciation Stock reliefs Unfunded pensron and other provisions
On a SSAP 15 basis this charge would be adjusted by: Accelerated depreciation Other
Profit on ordinary activities after taxation on a SSAP 15 basis would amount to 1418 1 197
58 -
(906) (862)
(103) (115) (129) 75
12 77
(220) 37
87 142 30 (49)
117 93
(636) (617) (110) (100)
(746) (717)
47 - (::,
47 (12)
(699) (729)
(83) 11 11 56 (29)
(16) (181
12 4 (13) 37
(I) 41
916 1 160

Unilever in 1985 Annual Accounts
FI. million
Combined N.V. PLC
1984 1985 1984 1985 1984 1985
Taxation on profit on ordinary activities (continued) The charge for PLC Parent and group companies comprises: United Kingdom Corporation Tax at 41 l/4% (1984: 46%%) (428) (459) less: double tax relief 224 260 plus: non United Kingdom taxes (432) (418)
(636) (617)
The close company provisions of the United Kingdom Income and Corporation Taxes Act 1970 do not apply to PLC.
(533) 177 248
(8) Extraordinary items - Extraordinary charge (224) - (309) - - Tax relief thereon 149 - 28 - - Deferred taxation adjustment - - 248 -
(108) - (75) - (33) -
The extraordrnary charge in 1984 comprrsed losses arising, and provisions for estimated losses less surpluses, consequent on the decision to withdraw from certain activities.
The deferred taxation adjustment in 1984 followed the reductions In rates of corporation tax legislated in the United Kingdom Frnance Act 1984.
3 821 3 512 293 243 239 161
(9) Tangible assets at cost less depreciation Land and buildings: - freehold - leasehold - long-term (50 years or over) - leasehold - short-term
2 285 2 255 1 536 1 257 5 17 288 226
112 84 127 77
4 353 3 916 7 419 7 310
1 143 936
Total land and buildings Plant and machinery Payments on account and assets in course of construction
2 402 2 356 1 951 1 560 4 140 4 369 3 279 2 941
737 580 406 356
12 915 12 162 7 279 7 305 5 636 4 857
2 247 1 784
784 530
At 31st December, capital expenditure authorised by the Boards and not spent amounted to 1419 1 089
Of these amounts commitments had been entered into for 485 299
828 695
299 231
11

Unilever In 1985 Annual Accounts
FL million
Combined N.V. PLC
1984 1985 1984 1985 1984 1985
1083 710 90 153 45 51
225 145 183 187
1626 1 246
861 593 222 117
1083 710
717 685
1083 (190) (32) 51
(Iii,
(70) (128)
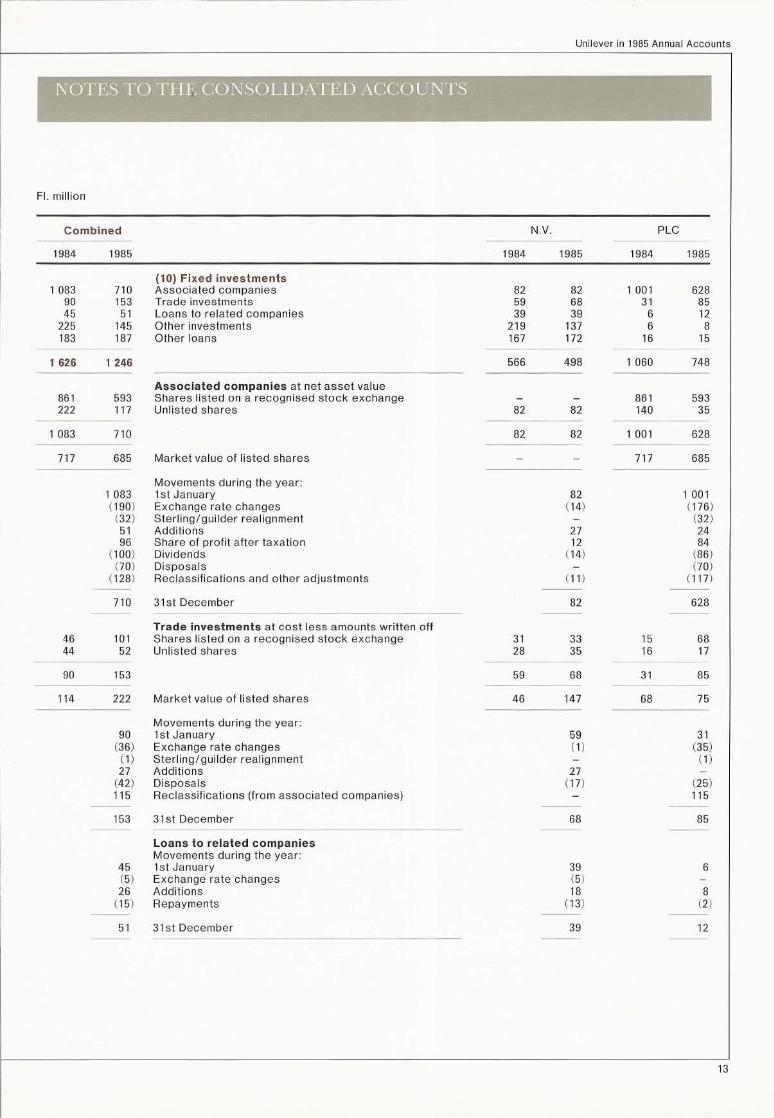
(10) Fixed investments Assocrated companies Trade investments Loans to related companies Other investments Other loans
Associated companies at net asset value Shares listed on a recognised stock exchange Unlisted shares
Market value of listed shares
Movements during the year: 1 st January Exchange rate changes Sterling/guilder realignment Additions Share of profit after taxation Dividends Disposals Reclassifications and other adjustments
710 3 1 st December
46 101 44 52
90 153
114 222
(3960)
(I)
142:) 115
153
Trade investments at cost less amounts written off Shares listed on a recognised stock exchange Unlisted shares
Market value of listed shares
Movements during the year: 1st January Exchange rate changes Sterling/guilder realignment Additions Disposals Reclassifications (from associated companies)
3 1 st December
45 (5)
(:E,
51
Loans to related companies Movements during the year 1st January Exchange rate changes Additions Repayments
31st December
82 82 59 68 39 39
219 137 167 172
566 498
- -
82 82
82 82
- -
(Y42) -
27
(1':)
(1%
82
31 33 28 35
59 68
46 147
59 (1) -
(::I -
68
39 (5)
1:381
39
1 001 628 31 85
6 12 6 8
16 15
1060 748
861 593 140 35
1 001 628
717 685
1 001
(176) (32) 24 84
186) (70)
(117)
628
15 68 16 17
31 85
68 75
(33;)
(1)
(25) 115
85
6 -
(2")
12
13

FL million
Combined N.V. PLC
1984 1985 1984 1985 1984 1985
Fixed investments (continued)
225 (54)
-
183 (8) -
(i
187
Other investments Unlisted, including FI. 60 million (1984: FI. 103 million) securities held for redemption of preference shares of National Starch and Chemical Holding Corporation
Movements during the year: 1st January Exchange rate changes Sterling/guilder realignment Additions Disposals
219 137 6 8
219 (53)
-
(1;)
3 1 st December
Other loans Movements during the year: 1st January Exchange rate changes Sterling/gurlder realrgnment Additions Repayments
137
167 (6) -
8
16 (2)
3 1 st December 172 15
(11) Stocks 5 182 4 378 Raw materials and consumables
587 524 Work in progress 5 732 4 842 Finished goods and goods for resale
2 947 2 561 2 235 1 817 336 312 251 212
2 914 2 806 2 818 2 036
11 501 9 744 6 197 5 679 5 304 4 065
(12) Debtors Amounts due within one year:
6 869 6 037 Trade debtors 4 076 3 781 2 793 2 256 286 80 Amounts owed by related companies 20 31 266 49
1 458 1 372 Other debtors 908 927 550 445 478 520 Prepayments and accrued income 247 314 231 206
9 091 8 009 5 251 5 053 3 840 2 956 .~~
Amounts due after one year 11 17 Trade debtors 2 5 9 12
220 216 Other debtors 139 158 81 58 37 17 Prepayments and accrued income 31 13 6 4
~ ~~~~ ~~~. 268 250 172 176 96 74
9 359 8 259 Total debtors 5 423 5 229 3 936 3 030
(13) Current investments 1 241 2 317 Listed on a recognised stock exchange 777 1 151 464 1 166
615 1 175 Unlisted 588 689 27 486
1 856 3 492 1 365 1 840 491 1 652
1 755 3 299 The cost of current investments amounted to 1 300 1 678 455 1 621
Lrsted Investments of PLC include those lrsted on The United Krnqdom Stock Exchange amounting to 458 613

Unilever In 1985 Annual Accounts
I FI millron
Combined N.V. PLC
1984 1985 1984 1985 1984 1985
(14) Cash at bank and in hand 989 1 356 On call 591 912 398 444
1 763 1 042 Repayment notice required 926 752 837 290
2 752 2 398 1517 1 664 1 235 734
(15) Borrowings Debenture and similar loans Bank loans and overdrafts
2 452 3 768 974 662 1 762 1 420 2 371 656
3 426 4 430 4 133 2 076
7 559 6 506 4 214 5 188 3 345 1318
4 285 3 919 The repayments fall due as follows: Within 1 year
486 417 After 1 year but within 2 years 1 474 697 After 2 years but within 5 years
775 992 After 5 years but within 10 years 232 185 After IO years but within 20 years 307 296 After 20 years
1 884 3 063 2401 856
288 339 198 78 1 157 631 317 66
650 966 125 26 223 177 9 8
12 12 295 284
2 330 2 125 944 462 3 274 2 587
Amounts repayable after 5 years
Repayable by instalments: Debenture and similar loans Bank loans and overdrafts
548 388 95 53
514 375 92 51
606 426
34 13 3 2
643 441 37 15
Not repayable by instalments: Debenture and similar loans Bank loans and overdrafts
587 1019 84 13
671 1 032
268 719 319 300 11 10 73 3
279 729 392 303
1314 1 473 885 1 155 429 318
Total amount due on borrowings repayable by instalments any of which are payable after 5 years: Debenture and srmilar loans Bank loans and overdrafts
1 068 613 295 162
1 007 576 61 37 286 152 9 10
1 363 775 1 293 728 70 47
Secured amounts are: Debenture and similar loans Bank loans and overdrafts
179 67 526 460
62 41 248 285
117 26 278 175
395 201 705 527 310 326
of which: Secured against tangible assets Secured against other assets
429 340 276 187
705 527
176 169 134 157
253 171 142 30
395 201 310 326
15

FI milllon
Combined
1984 1985
N.V. PLC
1984 1985 1984 1985
105 90 6% Bonds 1972/91 25 - 83/4o/o Bonds 198 1 I85
356 276 91/@/o Bonds 1987 (US $) 356 257 9%0/o Bonds 1986/90 (US $) 129 120 41/z% Bonds 1984/91 (Swiss Frs.) 137 134 63/40/o Bonds 1991 (Swiss Frs.) 137 134 71/z% Bonds 1993 (Swiss Frs.)
- 7 Other
1 245 1018 Total Unilever N.V. (see also page 35) Group companies: Netherlands:
15 9%0/o Loans 1986/89 France:
- 1OV~o/o Bonds 1992 U.S.A.:
-
151 -
205 836
38
92
412 920 780 159 349
3 768
97/G/o Notes 1992 6%%~-9~/8% Commercial paper 1986 7’:~/31%1-81~/:{/:(1% Euronotes 1986 12W/o Note 1996
A series of other loans at various interest rates
2 452
Unilever PLC 42
9 226 148
-
-
8 220 120
52
400
6%0/o Debenture stock 1985/88 51/$/o Unsecured loan stock 1991/2006
1
Ranking 73/40/o Unsecured loan stock 1991/2006 pari passu 8% Unsecured loan notes 1985/92 Other
425
42 28 507 234
974 662
3 426 4 430
1 191 2 375
3 203 1 241 930 835
4 133 2 076
Borrowings (continued)
Debenture and similar loans Unilever N.V.
Total Unilever PLC Pound sterling equivalent in millions 100 (1984: 103) (see also page 38) Group companies: Canada:
87h% Debentures Series B 1993 A series of other loans at various interest rates
of which repayable within one year
Bank loans and overdrafts Loans Overdrafts
Unilever in 1985 Annual Accounts
3 094 1 544 of which repayable within one year
105 25
356 356 129 137 137
-
1 245
15
-
-
151 -
205 836
2 452
- - - - -
- - 425 400
- -
- -
-
2 452
737
-
3 768
2 096
42 28 507 234
974 662
974 662
454 279
1 342 972 1 861 269 420 448 510 387
1 762 1 420 2 371 656
1 147 967 1 947 577
90 -
276 257 120 134 134
7
1018
- - - - - - - - - - - -
38
92
412 920 780 159 349
3 768
- - 42 - 9 8 - 226 220 - 148 120 - - 52
16
/-
Unilever in 1985 Annual Accounts
FI. mrllron
Combined
1984 1985
N.V. PLC
1984 1985 1984 1985
5 115 4740 519 463
39 39 655 646
2016 1642 I ail I 874
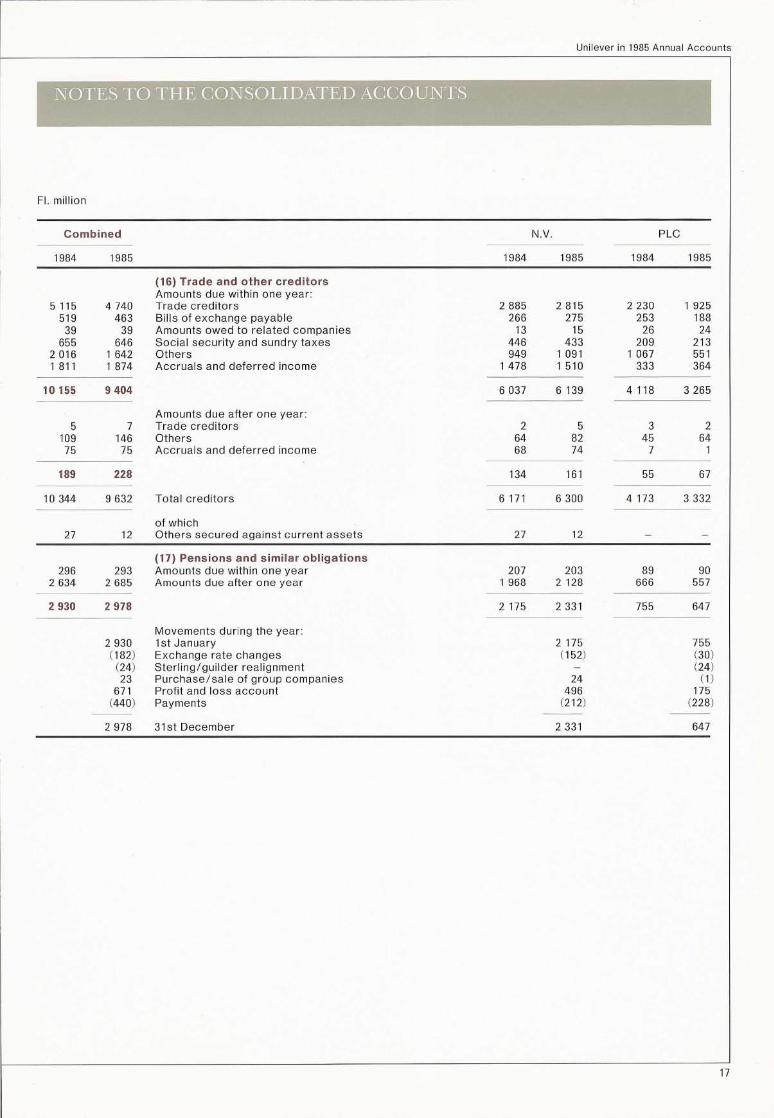
(16) Trade and other creditors Amounts due within one year Trade creditors Bills of exchange payable Amounts owed to related companies Social security and sundry taxes Others Accruals and deferred income
10 155 9404
5 7 109 146
75 75
Amounts due after one year: Trade creditors Others Accruals and deferred income
189 228
IO 344 9 632
27 12 Others secured aaainst current assets
Total credrtors
of which
2 885 2 815 2 230 1 925 266 275 253 188
13 15 26 24 446 433 209 213 949 1 091 1067 551
I 478 1510 333 364
6037 6 139 4 118 3265
2 5 3 2 64 a2 45 64 68 74 7 1
134 161 55 67
6 171 6300 4 173 3 332
27 12
296 293 2 634 2 685
2 930 2 978 2 175 2 331
2 930 (182) (24) 23
671 (440)
2 978 3 1 st December 2 331 647
(17) Pensions and similar obligations Amounts due within one year Amounts due after one year
Movements during the year: 1st January Exchange rate changes Sterling/guilder realignment Purchase/sale of group companies Profit and loss account Payments
207 203 1 968 2 128
2 175 755 (152) (30)
- (24) 24 (I)
496 175 (212) (228)
89 90 666 557
755 647
I 17

FI. million
Combined N.V. PLC
1984 1985 1984 1985 1984 1985
2 143 2 044 481 383
(496) (464) (359) (308)
(18) Deferred taxation and other provisions Deferred taxation: Accelerated depreciation Stock reliefs Unfunded pension provisions Short-term and other timing differences
887 967 481 381
(241) (266) (226) (150)
1 256 1 077
(25;) (133) (158)
1 769 1 655 (161) (92) 943 695
2 551 2 258 -
Advance Corporation Tax Other provisions
Advance Corporation Tax is available for offset against future United Kingdom Corporation Tax Inabilities.
2 551 (122)
(41)
($56,
(2::)
Movements during the year: 1 st January Exchange rate changes Sterling/guilder realignment New group companies Disposal of group companies Profit and loss account Other adjustments
2 258 31st December
(1 804) (I 863) (235) (249) 453 406 326 304
Other provisions include the provisions for estimated losses referred to in note (8) on page 11.
On a SSAP 15 basis deferred taxation would be reduced by: Accelerated depreciation Stock reliefs Unfunded pension provisions Short-term and other timing differences
(1 260) (1 402) (659) (786)
901 932 - -
347 326
1 248 1 258
868 723 (161) (92)
596 369
1 303 1 000
Unilever in 1985 Annual Accounts
1 248 (49)
81 (I)
(10) (11)
1 258 1 000
(818) (923) (986) (940) (235) (247) - (2)
199 205 254 201 195 179 131 125
1 303 (73) (41)
(1::, 102
(192)
(601) (616)
286 1114
1 400
285 1114
1 399
(19) Called up share capital Preferential share capital Ordinary share capital
265 265 21 20 640 640 474 474
905 905 495 494
18
Unrlever rn 1985 Annual Accounts
Authorised Nomrnal Number
value of shares per share issued
Issued and fully paid
1984 1985 1984 1985
FI. million 75 75
200 200 75 75
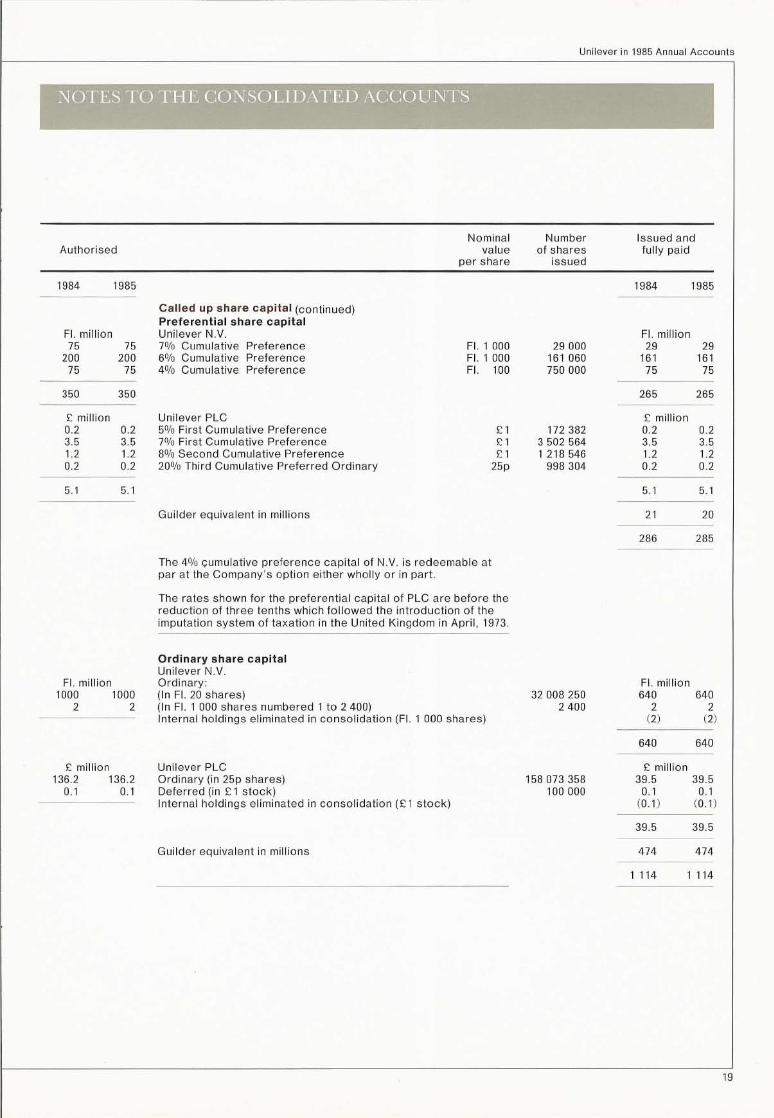
Called up share capital (continued) Preferential share capital Unilever N.V. 7% Cumulative Preference 6% Cumulative Preference 4% Cumulative Preference
FI. 1 000 29 000 FI. 1 000 161 060 FI. 100 750 000
350 350 265 265
E million 0.2 0.2 3.5 3.5 1.2 1.2 0.2 0.2
5.1 5.1
FI. million 1000 1000
2 2
E million 136.2 136.2
0.1 0.1
Unilever PLC 5% First Cumulative Preference 7% First Cumulative Preference 80/o Second Cumulative Preference 20% Thrrd Cumulatrve Preferred Ordinary
El El Cl
25~
Guilder equivalent in millions
The 4% cumulative preference capital of N.V. is redeemable at par at the Company’s ophon either wholly or in part
The rates shown for the preferential capital of PLC are before the reduction of three tenths which followed the rntroduction of the Imputation system of taxation in the United Kingdom in April, 1973
Ordinary share capital Unilever N.V. Ordinary: (In FI. 20 shares) (In FI. 1 000 shares numbered 1 to 2 400) Internal holdings eliminated in consolidation (FI. 1 000 shares)
Unilever PLC Ordinary (in 25p shares) Deferred (in f 1 stock) Internal holdings eliminated in consolidation (f 1 stock)
Guilder equivalent in millions
172 382 3 502 564 1 218 546
998 304
32 008 250 2 400
158 073 358 100 000
FI. million 29 29
161 161 75 75
f million 0.2 0.2 3.5 3.5 1.2 1.2 0.2 0.2
5.1 5.1
21 20
286 285
FI. million 640 640
(221 (22)
640 640
E million 39.5 39.5
0.1 0.1 (0.1) (0.1)
39.5 39.5
474 474
1114 1114
19

Called up share capital (continued)
Under the arrangements for the variation of the Leverhulme Trust shares in a group company have been issued which are convertible at the end of the year 2038 into a maximum of 10 375 000 ordinary shares of PLC.
Options granted to Directors and employees to acquire ordinary shares of N.V. and PLC and still outstanding at 31 st December, 1985 were as follows:
Nominal value Option Date
Number Per Total price normally of shares share value per share exercisable
N.V. share options
PLC 1985 Executive Share Option Schemes
63 209 FL 20 FI. 1 264 180 FI. 351.20 1986195 3 416 FI. 20 FI. 68 320 FI. 401.50 1986/95
775 556 25~ El93 889 r11.375 1988194
PLC 1985 Sharesave Scheme 2 109 029 25~ f527 257 f 10.24 1990
Internal holdings The ordinary shares numbered 1 to 2 400 (inclusive) in N.V. and deferred stock of PLC are held as to one half of each class by N.V. Elma - a group company of N.V. - and one half by United Holdings Limited - a group company of PLC. This capital is eliminated in consolidation. It carries the right to nominate persons for election as Directors al General Meetings of shareholders. A nominal dividend of l/4% was paid on the deferred stock of PLC. The above-mentioned group companies have waived their rights to dividends on their ordinary shares in N.V. The Directors of N.V. Elma are N.V. and PLC, who with Mr. F. A. Maljers and Sir Kenneth Durham are also Directors of United Holdings Limited.
At 31st December, 1985 a group company of N.V. held certificates (depositary receipts) representing 49 728 FI. 20 ordinary shares of N.V. in connection with Unilever N.V. share options. The book value of these shares is eliminated in consolidation by deduction from profit retained and other reserves (see note (20) on page 21).
Umlever in 1985 Annual Accounts
20

l- Unilever in 1985 Annual Accounts
1
FI. million
Combined
1984 1985
N.V PLC
1984 1985 1984 1985
5 287 5 308 7 163 6 776
458 267
(20) Profit retained and other reserves Profit retained: Parent companies Group companies Associated companies
12 908 12 351
(311) (315) 26 25
- (17)
12 623 12 044
Other reserves: Adjustment on conversion of N.V.‘s ordinary capital at El = FI. 12 Capital redemption reserve Book value of N.V. shares or certificates held by a group company in connection with N.V. share options
2 793 2 888 2 494 2 420 3 480 3 049 3 683 3 727
7 3 451 264
6 280 5 940 6 628 6411
- - (31 I) (315) - - 26 25
- (17) - -
6 280 5 923 6 343 6 121
(963) 169 (166) (19) (626) 111 471 55 115 5
- -
68 34
(21) Purchase/sale of group companies Tangible assets Frxed investments
Net current assets Creditors due after one year Provrsions for liabilities and charges Inter-group N.V./PLC Outside interests
(231) (238)
(2) (19) (43)
(3) 32 (37) 104
(2) - 15 51
(1 101) 355 (17) (9)
(9751 (144)
(2 093) 202 (247) 200
(2 340) 402
Net assets acquired/sold Profit/loss on sale Goodwill written off
Consideration Net liqurd funds of companies purchased/sold
(287) (I 13)
(155) (12,
(442) (213) 8 (51)
(434) (264) (I 906)
(73.2) (185) (578) 474 152
2 53
407 -
154
($9”)
(17)
(814) 468 (17) (34)
(820) (19)
(1 651) 415 (255) 251
666
Pensions The book value of the assets of the funds
12 192 12 707 at 31st December amounted to 6 011 6451 6 181 6 256
Provisions in the consolidated accounts to meet 2 930 2 978 obligations under unfunded schemes amounted to 2 175 2 331 755 647
These provisions, together with the assets of the funds, are sufficient in total to cover all pensions in course of payment at their existing levels and all contractual entitlements to deferred benefits in respect of service to date.
21

22
FI. million
Combined N.V. PLC
1984 1985 1984 1985 1984 1985
Contingent liabilities are not expected to give rise to any material loss. They include:
449 390 Guarantees 244 226 205 164 116 94 Bills discounted 53 52 63 42
Guarantees given by the parent companies or by group companies relating to liabilities included in the consolidated accounts are not included above. A summary of guarantees given by each parent company is set out in the notes to the respective balance sheets on pages36and39.
2 544 2 098 345 300
2 889 2 398
Commitments Long-term lease commitments, principally for operating leases, in respect of: Land and buildings Other tangible assets
393 343 338 297 264 247 216 204 182 172
1 496 1 135
2 889 2 398
The commitments fall due as follows: 1986 1987 1988 1989 1990
After 1990
Unilever II- 1985 Annual Accounts
512 921 Other commitments 475 882 37 39
25 674 of which payable wrthin one year 21 641 4 33
1 305 831 723 311
Exposures on third-party fixed price contracts outstanding at 31st December for commodities, to which the bulk of contracts refer, are: Purchase contracts (net) Selling contracts (net)
The consolidated accounts do not anticipate the results of such contracts except that provision is made where a loss would be incurred if market prices ruling at 31st December remained unchanged.
943 858 1 601 1 240 249 226 96 74
1 192 1 084 1 697 1 314
236 223 157 120 206 192 132 105 157 156 107 91 121 124 95 80
99 100 83 72 373 289 1 123 846
1 192 1 084 1 697 1 314
483 365 822 466 368 183 355 128
146 20
111
277
The average number of employees during the year was: (in thousands)
139 Europe 82 79 64 60 22 North America 15 16 5 6
151 Rest of the World 40 42 71 109
312 137 137 140 175

Unilever in 1985 Annual Accounts
S
Combined earnings per share The calculation of earnings per share is based on the combined profit of the year on ordinary activities attributable to ordinary capital divided by the combined number of share units representing the combined issued ordinary capital of N.V. and PLC. For the calculation of combined ordinary capital the rate of exchange E: I= FI. 12 has been used, in accordance with the Equalisation Agreement.
The calculations are therefore: Combined ordinary capital (see page 19) Less: N.V. shares held by a group company of N.V. in connection with N.V. share options
The combrned number of share unrts IS therefore 55 669 526 (1984 55 719 254) of FI 20 or alternatively 371 130 171 (1984 371 461 691) of 25p.
Profrt on ordinary activities attributable to shareholders Less: preference drvidends
Profit on ordinary activities attributable to ordinary caprtal
Divided by combined share units =
On a SSAP 15 basis the calculations would be: Profit on ordinary actrvities attributable to ordinary capital
Divided by combined share units =
The effects on combined earnings per share of (a) full conversion into PLC ordinary shares of the shares in a group company, exercisable in the year 2038 as described in note (19) and (b) the issue of ordinary shares under option, details of which are set out in note (19), are not material.
FI. million E million
1984 1985 1984 1985
1114 1 114
- (I)
1114 1113
2 078 2 064 503 516 (16) (16) (4) (41
2 062 2 048 499 512
FI. 37.01 FI. 36.79 134.33p 137.96p
2 164 2 174 524 543
FI. 38.84 FI. 39.05 141.06~ 146.31p
Profit and loss accounts - Parent companies As the accounts of Unilever N.V. have been included in the consolidated accounts its own profit and loss account on page 34 - in accordance with Dutch legislation - mentions only income from fixed investments after taxation as a seoarate item.
93 93
- -
93 93
As the profit and loss account of Unilever PLC has been included in the consolidated accounts advantage has been taken of provisions in United Kingdom legislation which permit the omission of a profit and loss account with the company balance sheet on page 37.
23

Unilever rn 1985 Annual Accounts
24
Introduction The current cost accounts have been prepared in accordance with United Kingdom Accounting Standard SSAP 16, pending further discussion on this subject.
The accounting policies set out on pages 4 and 5 have been followed in preparing the current cost accounts, except where they are inconsistent with current cost principles as explained below.
Tangible assets, depreciation and disposals In general, the current replacement cost of tangible assets is determined by applying specific price indices in the country of location to the original cost of the assets, net of capital-based grants.
Land is stated at estimated market value based on current use.
The depreciation adjustment is the drfference between depreciation on the historical cost of assets and on the current replacement cost of assets.
Amounts necessary to restate profits and losses on the disposal of assets by reference to the current rather than historical cost of the assets concerned are shown under ‘other adjustments’. The disposals dealt with in this way are those treated as exceptional items in the historical cost accounts.
Stocks and the cost of sales adjustment Stocks are stated as in the historical cost accounts The difference between current replacement cost and histormal cost at the balance sheet date IS not material.
The cost of sales adjustment identifies the extent to which the charge in the historical cost accounts for stocks consumed differs from the value to the business of those stocks. In general, it is computed by identifying the effect of the price change during the year on the value of normal stock required for the operation of the business. The price change is established using specific prices or indices applicable to stocks in the country of location.
Monetary working capital adjustment The monetary working capital adjustment reflects the impact of price changes on the amounts needed for monetary working capital. The adjustment is calculated by reference to the net balances of debtors and creditors associated with the day to day activities of the business, using indices appropriate to the country in which they are held.
Fixed investments The share of the retained profit and reserves, and results for the year, of significant associated companies has been restated on a current cost basis consistent with that used for the consolidated companies.
Trade investments are included at estimated current value
Gearing adjustment This takes credit for the proportion of the current cost adjustments to the profit and loss account which can be regarded as being financed by third parties. The gearing proportion is the average for the year determined separately for N.V. and PLC on a group basis. It is calculated as the ratio of net borrowing to net operating assets as shown on page 28.
Taxation Taxation is based on United Kingdom Accounting Standard SSAP 15 Provision for deferred taxation is not made if the Directors are able to foresee on reasonable evidence that no liability is likely to arise.
Current cost rnformation showing the effect of full provision for deferred taxation is given on page 29.
Outside interests in group companies The historical cost figures have been adjusted for the portion of the current cost adjustments attributable to outside interests.
Reserves The capital maintenance reserve includes our share of the revaluation surpluses on assets, the current cost adjustments and foreign exchange differences arising from translation of the opening assets and liabilities of N.V. into gurlders and of PLC into sterling at the closing rates of exchange.
Sterling/gurlder realignment has been apportioned between capital maintenance reserve and current cost profit retained

Unilever in 1985 Annual Accounts
for the year ended 31st December
FI. million
Combined N.V. PLC
1984 1985 1984 1985 1984 1985
66 791 66 771
3 841 3 797
(620) (551) (703) (54)
(2:50, (5293)
2 303 3 156
253 210 367 210 459 494
(769) (779)
2 613 3 291 (I 489) (I 457)
1 124 1 834 (113) (157)
1011 1 677 (I 211) -
(200) 1 677 (16) (16)
(684) (718)
(900) 943
Turnover
Historical cost operating profit Adjustments required to obtain current cost operating profit: Depreciation Cost of sales Monetary working capital Other
Current cost operating profit
Income from fixed investments (1) Gearing adjustment Other interest receivable and similar income Interest payable and similar charges
Current cost profit on ordinary activities before taxation Taxation
Current cost profit on ordinary activities after taxation Outside interests in group companies
Current cost profit on ordinary activities attributable to shareholders Extraordinary items (2)
Current cost profit after extraordinary items attributable to shareholders Preference dividends Dividends on ordinary capital
42 592
2 429
(344) (435)
(865)
1 569
41 259 286
(554)
40 790 24 199
2 122 1412
25 981
1 675
(327) (276) (30) (268)
($75) (13:)
(224) (24)
1 753 734 1 403
34 212 176 130 108 80 348 173 146
(540) (215) (239)
1 601 1 725 089) (769)
1012 (700)
1 566 (688)
812 956 312 878 (68) (69) (45) (88)
744 887 267 790 (207) - (I 004) -
537 887 (737) 790 (15) (15) (I) (I)
(452) (474) U-32) (244)
Current cost profit of the year retained 70 398 (970) 545
(900) (921) (392)
(2 213) 9 433
Movements in current cost profit retained 943 Current cost profit of the year retained 398 (970) 545
(152) Goodwill (132) (767) (20) (110) Sterling/guilder realignment - - (392) (110)
681 Net movements during year (84) 266 (2 129) 415 7 220 Balance - 1st January 3 814 3 730 5 619 3 490
7 220 7 901 Balance - 31st December (4) 3 730 3 996 3 490 3 905
1984 1985 Combined current cost earnings per share (for details of calculation see page 23)
FI. 17.86 FI. 29.84 Guilders per FI. 20 of ordinary capital 64.88~ 112.09p Pence per 25~ of ordinary capital
25
References between brackets relate to notes on pages 27 and 28.

Unilever in 1985 Annual Accounts
as at 31st December
FI. million
Combined N.V. PLC
1984 1985 1984 1985 1984 1985
Fixed assets Tangible assets (3) Fixed investments
12365 11 826 8 855 7 604 646 665 1 889 1 339
13011 12491 10744 8 943 23155 21 434
Current assets Stocks Debtors Current investments Cash at bank and in hand
5 304 4 065 3 936 3 030
491 1652 1235 734
11 501 9 744 9 359 8 259 1 856 3 492 2752 2 398
6 197 5 679 5423 5 229 1365 1840 1517 1664
14502 14412
8 742 IO 107 -
10 966 9481 25468 23 893
15968 14 845 Less: Creditors due within one year
9 500 9 048 Net current assets 5 760 4305
1 7 226 4 738
3 740 4 743
14484 13 686 - 33 255 30482 Total assets less current liabilities 18771 16 796
Creditors due after more than one year
Provisions for liabilities and charges
Inter-group N.V./PLC
Outside interests in group companies
1
Capital and reserves Called up share capital Share premium account Capital maintenance reserve Current cost profit retained and other reserves (4)
12 638 12060 10 758 10 113
Total capital employed 18771 16 796 14484 13 686
2 534 2 368 1 176 638
2939 2 848 2 039 1382
3 710 3 006
4978 4230
- -
1 171 1 073
23396 22 173
33255 30482
Movements in capital maintenance reserve Cost of sales, monetary working capital and gearing adjustments Outside interests in the above adjustments Revaluation surpluses (5) Effect of exchange rate changes Sterlmg/guilder realignment
171 (115) 155 (64) (3) 6 (8) 4
385 477 280 476 382 (1 195)
- - (497:) (1 244)
(224)
Net movements during year 935 (827) 7 (1 052) Balance - 1 st January 7 016 7 951 7 014 7 021
326 (179) (11) 10 665 953 452 (2 439)
(490) (224)
942 (1 879) 14 030 14 972
14 972 13 093 Balance - 31st December 7 951 7 124 7 021 5969
References between brackets relate to notes on pages 27 and 28.
26

Unrlever in 1985 Annual Accounts
FI. mrllion
Combined N.V PLC
1984 1985 1984 1985 1984 1985
218 16 19
253
(1) Income from fixed investments Share of assocrated companies’ current cost profit
178 before taxation 18 19 200 159 20 Income from trade investments 5 5 11 15 12 Income from other investments 18 10 1 2
210 41 34 212 176
(2) Extraordinary items (I 186) - Extraordinary charge (356) - (830)
177 (202) 1
Tax relief thereon 149 -
Deferred taxation adjustment - - (2%
(1 211) - (207) - (1 004)
The extraordinary charge in 1984 is that referred to in note (8) on page 11 increased to reflect current cost values at 31st December, 1984 and provision for deferred taxation on a SSAP 15 basis, less the related gearing adjustment.
The deferred taxation adjustment, which arose as a consequence of changes legislated in the United Kingdom Finance Act 1984, was calculated on a SSAP 15 basis, and thereby differed significantly from that included in note (8) on page 11.
(3) Tangible assets 8 572 7 358 Land and buildings 4 856 4 434 3 716 2 924
12 648 12 072 Plant and machinery 7 509 7 392 5 139 4 680
21 220 19 430 12 365 11 826 8 855 7 604
Current replacement cost 14 184 12 251 Land and buildings 8 290 7 611 5 894 4 640 25 637 24 182 Plant and machinery 15 795 15 250 9 842 8 932
39 a21 36 433 24 085 22 861 15 736 13 572 -
Depreciation 5 612 4 893 Land and buildings 3 434 3 177 2 178 1716
12 989 12 110 Plant and machinery 8 286 7 858 4 703 4 252
18 601 17 003 11 720 11 035 6 881 5 968

28
FI. million
Combined N.V. PLC
1984 1985 1984 1985 1984 1985
(4) Current cost profit retained and other reserves 7 220 7 901 Current cost profit retained 3 730 3 996 3 490 3 905
Other reserves: Adjustment on conversion of PLC’s ordinary
1311) (315) capital at fl = FI. 12 (311) (315) 26 25 Capital redemption reserve - - 26 25
Book value of N.V. shares held by a group company - (17) in connection with N.V. share options - - - (17)
6 935 7 594 3 730 3 979 3 205 3 615
572 798 77 67 16 88
665 953
(5) Revaluation surpluses Tangible assets Associated companies Trade investments
381 378 191 420 - 7 77 60 4 92 12 (4)
385 477 280 476
21 220 19 430 1 852 1 294
230 328 11 457 9 304
34 759 30 356
23 396 22 173 1 171 1 073
(104) (60) 480 502
24 943 23 688
7 559 6 506 4 978 4 230
(2 721) (4 068)
9 816 6 668
34 759 30 356
Financing of net operating assets The net current replacement cost of the net operatrng assets at 31st December amounted to Tangible assets Associated compames Trade Investments Other
These were financed by:
Shareholders’ interest Capital and reserves Outside interests in group compames Less preference shares of National Starch and Chemical Holding Corporation Proposed dividends
Net borrowing Borrowings Provisions for liabilities and charges Other financial items
12 365 11 826 8 855 7 604 127 126 1 725 1 168
94 192 136 136 5 989 5 324 5 468 3 980
18 575 17 468 16 184 12 888
12 638 12 060 605 605
(104) (60) 306 330
13 445 12 935
4 214 5 188 2 939 2 848
(2 023) (3 503)
5 130 4 533
18 575 17 468
Unilever in 1985 Annual Accounts
10 758 10 113 566 468
- -
174 172
11 498 10 753
3 345 1318 2 039 1 382
(698) (565)
4 686 2 135
16 184 12 888

Unilever III 1985 Annual Accounts
FI. million
Combined
1984 1985
N.V. PLC
1984 1985 1984 1985
2 303 3 156
2 912 3 406 (1 605) (1 591)
1 307 1815 (106) (151)
1 201 1 664 (521) -
680 1 664 (16) (16)
(684) (718)
(20) 930
33 255 30 482 (358) (199)
32 897 30 283
3 710 3 006 9 837 8 772
- - 906 833
18 444 17 672
32 897 30 283
Summary of effect of adopting full provision for deferred taxation
Profit and loss account Current cost operating profit
Current cost profit on ordinary activities before taxation Taxation
Current cost profit on ordinary activities after taxation Outside interests in group companies
Current cost profit on ordinary activities attributable to shareholders Extraordinary items
Current cost profit after extraordinary items attributable to shareholders Preference divrdends Drvidends on ordinary capital
Current cost profrt of the year retamed
Balance sheet Total assets less current lrabilrties as on page 26 Adjustment to value of associated companies
Creditors due after one year Provisions for lrabilitres and charges Inter-group N.V./PLC Outside interests in group companies Capital and reserves
The above figures differ from those set out with notes on pages 25 to 28 where the United Kingdom SSAP 15 method of accounting for deferred taxation has been adopted, in that: (a) The taxation charge in the profit and loss account is that shown in the historical cost accounts (see note (7) on page 10). (b) Within the extraordinary items the extraordinary charge was reduced to reflect the full provision basis for deferred taxation and the deferred taxation adjustment was that shown in the historical cost accounts (see note (8) on page 11). (c) Deferred taxation included in provisions for liabilities and charges is that shown in the historical cost accounts (see note (18) on page 18) with the addition of tax provisions on revaluation surpluses arising on the uplrft of assets to a current cost basis. The gearing adjustments, outside interests in group companies and figures for associated companies have been adjusted accordingly.
1 569 1 753 734 1 403
1 776 1810 1 136 1 596 (906) (862) (699) (729)
870 948 437 867 (65) (67) (41) (84)
805 881 396 783 (164) - (357) -
641 881 39 783 (15) (15) (1) (I)
(452) (474) (232) (244)
174 392 (194) 538
18 771 16 796 (23) (19)
18 748 16 777
2 534 2 368 6 124 5 793
55 (I 085) 453 449
9 582 9 252
18 748 16 777
14 484 13 686 (335) (180)
14 149 13 506
1 176 638 3 713 2 979
(55) 1 085 453 384
8 862 8 420
14 149 13 506
29

as at 31st December, 1985
Introduction The companies lrsted below are those whrch in the opinion of the Directors principally affect the amount of profit and assets shown in N.V ‘s and PLC’s consolidated accounts.
Full information as required by Article 379 of Book 2, Civil Code, in the Netherlands in respect of companies in which N.V., directly or indirectly, has a shareholding of 20% or more of the total issued capital has been filed with the Commercial Registry in Rotterdam.
Particulars of PLC group and related companies as required by the United Kingdom Companies Act 1985 will be annexed to the next Annual Return of PLC.
The main activities of the companies listed below are indicated according to the following key:
Other foods Detergents Personal products Specialrty chemicals Paperboard and packaging Agrtbusiness UAC International Others
F D P C
PP A
2(
The companies are, unless otherwise indicated, incorporated and principally operate in the countries under which they are shown
The letters N.V. or PLC after the name of each country indicate whether in the country concerned the shares in the companies listed are held directly or indirectly by N.V. or by PLC.
The percentage of equity directly or indirectly held is mentioned in the margin, except where It is 100%. Where the percentage of total issued capital directly or indirectly held differs from the percentage of equity directly or Indirectly held, this is stated separately. All percentages are rounded down to the nearest whole number.
Principal group companies
Eurooe
Unilever rn 1985 Annual Accounts
o/o
75
99 99 99 99 99 99
99
99 99
75
50
Austria - N.V. Nordsee Ges.m.b.H. Csterreichische Unilever Ges.m.b.H. Unifrost Ges.m.b.H.
Belgium - N.V. Hartog N.V. Iglo-Ola N.V. Lever N.V. S.B.T. N.V. Union N.V.
Denmark - N.V. Uni-Dan A/S -
Finland - N.V. Paasivaara Oy Turun Saippua Oy
France - N.V. Astra-Calve S A. Francaise de Sorns et Parfums S A 4P Emballages France S.A. Francaise d’Alrmentation et de Boissons S.A Lever S A. Compagnie des Glaces et Surgeles
Alimentarres S.A. Unilever Export France S.A. - PLC CNF S.A. Niger France S.A.
Germany - N.V. Deutsche Unilever G.m.b.H. ‘Elbe’ Transport G.m.b.H. Elida-Gibbs G.m.b.H. 4P Folie Forchheim G.m.b.H. Novia Lebensmittel G.m.b.H. Langnese-lglo G.m.b.H. Lever Sunlicht G.m.b.H. Meistermarken-Werke G.m.b.H ,
F MFDPPP
F
F F D 0 M
MFDP
MF DP
MF P
PP F D
F 0
U U
i P
PP F F D
Spezialfabrik fur Back- und Grosskuchenbedarf 4P Nrcolaus Kempten G.m.b.H. 4P Verpackungen Ronsberg G.m.b.H. ‘Nordsee’ Deutsche Hochseefischerei G.m b H 4P Rube Gottingen Verwaltungs- und Beteiligungs
G m.b.H. Schafft Fleischwerke G.m b H ‘Unichema’ Chemie G.m b H. Union Deutsche Lebensmtttelwerke G.m.b.H
Greece - N.V. lndustrie Hellenique de Detergents S.A. (E.V.A.) ‘Elais’ Oleaginous Products S.A.
Ireland - PLC Lever Brothers (Ireland) Ltd W 8 C. McDonnell Ltd. Paul and Vincent Ltd. HB Ice Cream Ltd.
MF PP PP
F
PP F C
MF
D M
D MF
A F
30

Unilever in 1985 Annual Accounts
as at 31st December, 1985
Principal group companies (continued)
VO
75 75 75
75
74 60
99
90
55
95
Italy - N.V. Algel S.p.A. Also S.p.A. Sagit S.p.A. Sodel S.p.A. Unil-It S.p.A.
The Netherlands - N.V. Algemeen Vrachtkantoor B.V. Van den Bergh en Jurgens B.V. Koninklijke Maatschappij De Betuwe B.V. Calve-De Betuwe B.V. Croklaan B.V. Crosfield Chemie B.V. 4P Drukkerij Reclame B.V. Iglo-Ola B.V. Lever Industrial B.V. Lever Sunlight B.V. Lipoma B.V. Lucas Aardenburg B.V. Marga B.V. Mavibel (Maatschappij voor lnternationale
Beleggingen) B.V. Mengvoeder UT-Delfia B.V. Nederlandse Unilever Bedrijven B.V.
(Percentage of total issued capital held-99) Handelmaatschappij Noorda B.V. Safial B.V. Saponia B.V. Exportslachterij Udema B.V. Unichema Chemie B.V. Unilever Export B.V. Unilever Financieringsmaatschappij B.V. UniMills B.V. UVG Nederland B.V. Wemado B.V. Zeepfabriek de Fenix B.V.
Portugal - N.V. lglo lndustrias de Gelados, Lda. lndustrias Lever Portuguesa, Lda.
Spain - N.V. Agra S.A. Frigo S.A. Lever Iberica S.A. Unilever Esparia S.A.
Sweden - N.V. Gibbs AB Glace-Bolaget AB Leverindus AB Margarinbolaget AB
(Percentage of total issued capital held-50) Novia Livsmedelsindustrier AB Pierre Robert AB AB Sunlight Svenska Unilever Forvaltnings AB
Switzerland - N.V. ‘Astra’, Fett- und Oelwerke A.G. Elida Cosmetic A.G. Meina Holding A.G. Sais A.G. Sunlight A.G.
o/o
F F F D
MFDP
0 MF
F F
M C
PP F D D H F H
H A
H H H H F C 0 0 M F H D
F DP
M F D H
P F D
M F P
DP H
M P H
MF DP
A. Sutter A.G Unilever (Schweiz) A.G.
United Kingdom - PLC Batchelors Foods Ltd. The Berkshire Printing Co. Ltd. Birds Eye Wall’s Ltd. BOCM Silcock Ltd. BOCM Silcock (N.I.) Ltd. Brooke Bond Group plc Brooke Bond Oxo Ltd. C.W.A. Holdings Ltd. Joseph Crosfield & Sons Ltd. Elida Gibbs Ltd. Ford & Slater Group Ltd. Lever Brothers Ltd. Leverton Group Ltd. Lipton Tea Company Ltd. Loders & Nucoline Ltd. Mattessons Meats Ltd. Oxoid Ltd. PPF International Ltd. Thames Board Ltd. Thames Case Ltd. UAC Ltd. U.A.C. Holdings Ltd. UAC International Ltd. UAC UK Holdings Ltd. UML Ltd. Unichema Chemicals Ltd. Unilever (Commonwealth Holdings) Ltd Unilever Export Ltd. Unilever U.K. Central Resources Ltd Unilever U.K. Holdings Ltd. United Agricultural Merchants Ltd. Van den Berghs and Jurgens Ltd. Vinyl Products Ltd. The Wall’s Meat Company Ltd. John West Foods Ltd.
D 0
z1 F A A H F
: P U
Fl F
M F 0 C
PP PP
U U U U 0 C
cl 0 H A M C F F
North America
o/o Canada - PLC Lever Brothers Llmited MDP Thomas J. Lipton Inc. MF A & W Food Services of Canada Ltd. F Unilever Canada Limited H
United States of America - N.V. Lawry’s Foods, Inc. F Lever Brothers Company MFDP Thomas J. Lipton, Inc. National Starch and Chemical Corporatron c’ Shedd’s Food Products, Inc. M Unrlever United States, Inc H
31

Umlever in 1985 Annual Accounts
as at 31st December, 1985
Principal group companies (conhnued)
Rest of the World ‘h
vu
99
61
99
99
99
99
60
51
85
80 99 67
97
88 54
80
85
32
Argentina - N.V. Lever y Asociados s.a.c.i.f
Australia - PLC Unilever Australia Ltd.
Bangladesh - PLC Lever Brothers Bangladesh Ltd.
Brazil - N.V. lndustrias Gessy Lever Ltda.
United Republic of Cameroun - PLC Plantations Pamol du Cameroun Ltd. R.W. King S.A.
Chile - N.V./PLC Lever Chile S.A.
Colombia - N.V. Compariia Colombiana de Grasas
‘Cogra-Lever’ S.A.
People’s Republic of the Congo (Brazzaville) - PLC
Societe Commerciale du Kouilou Niari-Congo S.A.
Gabon - PLC Hatton et Cookson S.A.
Ghana - PLC UAC of Ghana Ltd.
India - PLC Hindustan Lever Ltd.
Indonesia - N.V. P.T. Unilever Indonesia
Ivory Coast - PLC Blohorn S.A. CFCI S.A. Uniwax S.A.
Japan - N.V. Nippon Lever KK
Kenya - PLC Brooke Bond Kenya Ltd. East Africa Industries Ltd. Gailey & Roberts Ltd.
Malawi - PLC Lever Brothers (Malawi) Ltd.
Malaysia - PLC Lever Brothers (Malaysia) Sdn. Bhd. Pamol Plantations Sdn. Bhd.
MFDPC
MFDPCO
FDPC
MFDPC
A U
MFDP
MDP
U
U
U
MDPCA
MFDPC
MDAPP U U
MFDP
A0 MFDPC
U
MDPC
MFDPC A
Mexico - N.V. Zwanenberg de Mexico S.A.
Netherlands Antilles - N.V. Mavibel International N.V. Unilever Becumij N.V.
New Zealand - PLC Lever Brothers (New Zealand) Ltd. Unilever New Zealand Ltd.
Niger - PLC 99 Niger-Afrique S.A.
60 Nigeria - PLC Pamol (Nigeria) Ltd.
66 Pakistan - PLC Lever Brothers Pakistan Ltd.
Philippines - N.V. Philippine Refining Company Inc.
87 Sierra Leone - PLC UAC of Sierra Leone Ltd.
Republic of Singapore - PLC Lever Brothers Singapore Sdn. Bhd.
60 Solomon Islands - PLC Lever Solomons Ltd. Lever’s Pacific Timbers Ltd.
0~1th Africa - PLC Elida-Gibbs (Pty.) Ltd. Lever Brothers (Pty.) Ltd. Lipton (SA) (Pty.) Ltd. Unilever South Africa (Pty.) Ltd. Van den Bergh and Jurgens (Pty.) Ltd.
Sri Lanka - PLC Lever Brothers (Ceylon) Ltd.
70 Taiwan - N.V. Formosa United Industrial Corporation Ltd.
Tanzania - PLC UAC of Tanzania Ltd.
78 Republic of Tchad - PLC Brasseries du Logone S.A.
Thailand - N.V. Lever Brothers (Thailand) Ltd.
50 Trinidad - PLC Lever Brothers West Indies Ltd.
65 Turkey - N.V. Unilever-Is Ticaret ve Sanayi Turk Limited
$irketi MF
Uganda - PLC Gailey & Roberts (Uganda) Ltd
F
0 0
H FDPC
U
A
MDPC
MFDPC
U
MDP
A U
P D F H M
MDPCA
D
U
U
MFDPC
MFDPC
U

Unilever in 1985 Annual Accounts
as at 31st December, 1985
Principal group companies (continued)
“/a Venezuela - N.V. Lever SA FDP
Republic of Zaire - N.V.
58 Plantations Lever au Za’ire s.a.r.1. A Compagnie des Margarines, Savons et
Cosmehques au Za’ire s.a.r.1. MDPC - PLC
99 Sedec s.a.r.1. U
Zambia - PLC K. B. Davies & Co. (Zambia) Ltd. U
Zimbabwe - PLC Lever Brothers (Private) Ltd MFDPC
Principal related companies
Associated companies
Europe
o/o Denmark - N.V.
50 Margarinefabrikken Alfa-Solo A/S M -
Germany - N.V. 50 Fritz Homann Lebensmittelwerke
G.m.b.H. & Co. K.G. MF
Portugal - N.V. 40 FIMA - Ftibrica Imperial de Margarina Lda. M
Rest of the World
vo Colombia - N.V.
49 Plantaciones Unipalma de Los Llanos S.A. A
Nigeria - PLC 14 Guinness Nigeria Ltd. U 40 Lever Brothers Nigeria Ltd. MFDPC 14 Nigerian Breweries Ltd. U 40 UAC of Nigeria Ltd. U
El Salvador - N.V. 50 lndustrias Unisola S.A. MFDP
Trade investments
Europe
Vfl The Netherlands - N.V.
37 Gamma Holding N.V. (Percentage of total issued capital held-34) 0
Rest of the World
o/o Australia - PLC
48 Bushells Pty Ltd. F
Korea - N.V. 50 Aekyung Industrial Company Limited D
33

Unilever in 1985 Annual Accounts
34
The balance sheet below rncludes the proposed proflt appropriation
FI. million
1984 1985
Balance sheet as at 3 1st December
3 191 Fixed assets Fixed investments
Current assets 1 903 Debtors 1 742
96 Current investments 345 590 Cash at bank and in hand 543
2 589 2 630 730 Less: Creditors due within one year 1 152
3 010
1 859 Net current assets 1 478
5 050 Total assets less current liabilities 4 488
1 199 Creditors due after more than one year 684
117 Provisions for liabilities and charges 87
(18) Inter-group N V./PLC (111)
Capital and reserves Called up share capital
265 Preferential share capital (19) 265 642 Ordinary share capital (19) 642
907 907 52 Share premium account 52
2 793 Profit retained and other reserves 2 869
3 752 3 828
5 050 Total capital employed 4 488
Profit and loss account for the year ended 31st December
640 (86)
Income from fixed investments after taxation 501 Other income and expense 83
554 Profit of the year 584
Pages 4 to 33, 35 and 36 contain the notes to the Unilever N V company accounts. For the informatlon as required by Article 392 of Book 2, CIVII Code, reference is made to page 36
The Board of Directors 1st April, 1986
References between brackets relate to note on pages 18 to 20

Unilever in 1985 Annual Accounts
FI. million
1984 1985 1984 1985
2 060 1 131
3 191
1 799 5
95 4
1 903
96 -
96
90
374
Fixed investments Shares in group companies Loans to group companies
Shares in group companies Shares in group companies are stated at cost. The cost of N.V. shares purchased and held by a group company has been deducted from this heading. Profit retained and Profit of the year shown in this balance sheet and the notes thereto are less than the amounts shown under these headings in the consolidated balance sheet and profit and loss account, mainly because only part of the profits of the group companres is distributed In the form of dividend.
Movements during the year: 1st January Shares held by a group company
31st December
Loans to group companies Movements during the year: 1st January Additions Redemptions Exchange differences
31st December
Debtors Amounts owed by group companies Amounts owed by related companies Other debtors Prepayments and accrued income
of which due after one year
Current investments Listed stocks Unlisted stocks
The cost of current investments amounted to
Cash at bank and in hand includes items for which notice of repayment is required amounting to
2 041 969
3 010
2 060 (19)
2 041
1 131 132 0.7)
(267)
969
1 643 3
94 2
1 742
1
268 77
345
352
209
46 14
221 44 99
2 304
Creditors Due within one year: Debenture and similar loans (15) Bank loans and overdrafts Amounts owed to group companies Taxation and social security Other creditors Accruals and deferred income Dividends
334 175 198
45 67
3 330
730 1 152
1 199
438
69 38 10
Due after one year: Debenture and similar loans (15)
These include amounts due after five years: Debenture and similar loans
Provisions for liabilities and charges Unfunded pension provisions Deferred taxation Other provisions
684
326
81 (2)
8
117 87
16 of which due within one year 15
Ordinary share capital Shares numbered 1 to 2 400 are held by a group company of Unilever N V and a group company of Unilever PLC. Additionally, 49 728 FI. 20 ordinary shares are held by another group company. Full details are given in note (19) on page 20.
Share premium account For the application of Article 44 of the Income Tax Act 1964 only a small part, if any, of the premium shown in the balance sheet is available for issue of tax free bonus shares.
References between brackets relate to notes on pages 15, 16 and 18 to 20.
- 35

1984
Profit retained and other reserves 2 793 Profit retained
Cost of Unilever N.V. shares purchased - and held by a group company
2 793 31st December
Contingent liabilities are not expected to give rise to any material loss. They include:
1985
2 888
(19)
2 869
Guarantees given for debts of group and other companies, under which amounts outstanding at 31st December were as follows:
2 105 For N.V. group companies 3 790 - For PLC and its group companies -
33 Others 26
2 138 3 816
Of the above, guaranteed also by 356 Unilever PLC 2 390
Unilever in 1985 Annual Accounts
Further information Unilever N V. as required by Article 392, Book 2, Civil Code
Report of the Auditors See page 2.
The rules for profit appropriation in the Articles of Association (summary of Article 41)
The profit of the financial year is applied first to the reserves required by law or by the Equalisation Agreement, secondly to the covering of losses of previous years, if any, and thirdly to the reserves deemed necessary by the Board of Directors. Dividends due to the holders of the Cumulative Preference Shares, including any arrears in such dividends, are then paid; if the profit is insufficient for this purpose, the amount available shall be distributed to them m proportion to the dividend percentages of their shares. Any profit remaining thereafter is at the disposal of the General Meeting. Distributions from this remaining profit are made to the holders of the ordinary shares pro rata to the nomrnal amounts of their holdings
Proposed profit appropriation 1984 1985
554 Profit of the year 584 (15) Preference dividends (15)
539
(452)
87 2 706
Profit at disposal of the Annual General Meeting of shareholders Proposed profit appropriation in accordance with Article 41 of the Articles of Association: Ordinary dividends
Profit of the year retained Balance 1 st January
2 793 Balance 31st December
569
(474)
95 2 793
2 888
Special controlling rights under the Articles of Association See page 20
36

I Unilever in 1985 Annual Accounts
as at 31st December
f million
1984 1985
1 033
2 56 91
175
324 Less:
379 Creditors due within one year
(55)
Fixed assets Fixed investments
Current assets Stocks Debtors Current investments Cash at bank and rn hand
2 65
383 44
494
988
Net current assets/liabilities
153
341
978 Total assets less current liabilities 1 329
311
10
(7)
664
978
Creditors due after more than one year 377
Provisions for liabilities and charges 18
Inter-group N V /PLC 269
Capital and reserves Called up share capital
5 Preferenttal share caprtal (19) 5 40 Ordrnary share capital (19) 40
45 45 9 Share premrum account 9 6 Caprtal redemphon reserve (20) 6
604 Profit retained 605
665
Total capital employed 1 329
Kenneth Durham, Chairman F. A. Maljers, Vice-Chairman
1st April, 1986
References between brackets relate to notes on pages 18 to 21.
37

Unilever in 1985 Accounts
E million
1984 1985 1984 1985
Debtors Due within one year: Amounts owed by group companies Amounts owed by related companies Others Prepayments and accrued income
Fixed investments 503 Shares in group companies 531 507 Loans to group companies 435
22 Shares in related companies 22 1 Other loans -
1 033 988
Shares in group companies Shares in group companies are stated at Directors’ valuation made on the rearrangement of the Unilever Groups in 1937, with bonus shares at par and other additions at cost or valuation, less amounts written off.
Profit retained and Profit of the year shown in the balance sheet and the notes thereto are less than the amounts shown under these headings in the consolidated balance sheet and profit and loss account, marnly because only part of the profits of the group companies IS distributed in the form of dividend.
11 -
13 2
15
7 2
25 26
31 Due after one year: Advance Corporation Tax 39
56 Total debtors 65
The Advance Corporation Tax borne by the parent company will be surrendered and set off against liabilities of the group companies where appropriate. The total of E39 million includes E21 million recoverable against 1985 liabilities and I: 18 million against those for later years.
Current investments Listed on a recognised stock exchange Unlisted
91 -
91
279 104
Movements during the year 1 st January Additions Disposals
383
The cost of current investments amounted to
Creditors Due within one year: Debenture and similar loans (15) Bank loans and overdrafts Trade creditors Amounts owed to group companres Taxation and social security Other Dividends
375 85 31st December
Loans to group companies Movements during the year: 1 st January Additions Repayments
36 247
8 7
30 32 10 10 22
7 42
153
7 36 38
3 1 st December 435
Shares in related companies - at cost
4 Listed on a recognised stock exchange 4 18 Unlisted 18
22 22
12 Market value of listed shares 16
379
Due atter one year: Debenture and similar loans (15) Amounts owed to group companies Taxation and social security
67 240
4
70 307
-
311 377 There were no movements during the year. The debenture and similar loans
include amounts repayable after more than five years
Provisions for liabilities and charges Unfunded pensjon provIsIons Deferred taxation
57 70
17 (7)
21 (3)
18 10
Reference between brackets relates to note on pages 15 and 16
38

Unilever in 1985 Annual Accounts
f million
1984 1985
601
(5569)
Profit retained 1st January Profit for financial year Ordinary and deferred dividends
604
604 31st December
Contingent liabilities are not expected to give rise to any material loss. They include:
Guarantees given for debts of group and other companies, under which amounts outstanding at 31st December were as follows:
86 For N.V. and its group companies 41 For PLC group companies 13 Others
605
597 34
5
140
86 Of the above, guaranteed also by Unilever N.V.
636
597
Printed by 4P Drukkerij Reclame B. V., Molenbaan 2, 2908 LM Cape//e aan den IJssel, the Netherlands
39