Embed Size (px)
Citation preview

DOCUMENT RESUME
ED 343 725PS 020 476
TITLE Incidence and Impact of Selected Infkxtious Diseases
in Childhood.
INSTITUTION National Center for Health Statistics (DHHS/PHS),
Hyattsville, MD.
REPORT NO DHHS-Pub-(PHS)91-1508; ISBN-0-8406-0453-3
PUB DATE Oct 91
NOTE 309.
PUB TYPE Statistical Data (110) -- Collected Works - Serials
(022)
JOURNAL CIT Vital and Health Statistics; Series 10 n160 Oct
1991
EDRS PRICE MF01/PCO2 Plus Postage.
DESCRIPTORS *Adolescents; *Child Health; *Children; *Communicable
Diseases; Incidence; National Surveys; Racial
Differences; Sex Differences
IDENTIFIERS *Childhood Illnesses; Diarrhea; Ear Infections;
Health Surveys; Hepatitis; Meningitis; Mononucleosis;
Pneumonia; Rheumatic Fever; Tolibillitis; Urinary
Tract Infections
ABSTRACTThis report provides estimates of the lifetime and
annual incidence of certain infectious diseases of children in
various demographic groups. Data on the social and health care impact
of the diseases in terms of limited activity, days spent in bed,
school days lost, contacts with physicians, hospitalizations,
surgery, and use of medication are presented. The data are taken from
the 1988 National Health Interview Survey on Child Health. The nine
diseases for which statistics are reported are: ear infection,
tonsillitis, pneumonia, diarrhea, urinary tract infection,
mononucleosis, hepatitis, meningitis, and rheumatic fever. Results
indicated that: (1) a total of 38 percent of children had at least
one of the diseases; (2) ear illness was the most common illness,
affecting 25 percent of children; (3) among infants, 10 percent had
ear infection, 3 percent had diarrhea, and 3 percent had pneumonia;
(4) tonsillitis was the most common disease among teenagers; (5) most
diseases were reported more frequently among White children than
among Black or Hispanic children; and (6) girls were 5 times as
likely as boys to have urinary tract infections. A reference list of
16 items is provided. Appendixes include a description of the data
collection and statistical methods used in the study and definitions
of terms used in the report. (BC)
***********************************************************************Reproductions supplied by EDRS are the best that can be made
from the original document.
***********************************************************************

I (baba Asw. 0 0
II 00 A. a. ...A. 0 4. Au
--
-47
Ilk
U DEPARTMENT OF EDUCATIONOffice of Educatwal Research and Improvement
EDUCATIONAL. RESOURCES INFORMATIONCENTER tERICI
11)(This CrOcurilenl riaS been reprOduCed Isreceived t rom the person or organizationoriginating it
0 M,ric-v changes have Deen made to improvereproduction Quality
Points of vie,* or opinions staled in MS document do not neCesSarily represent officialOE RI position Or policy
a_

Copyright Information
All material aaDearing in this report is in the Public domain and may bereproduced or copied without Permission: citation as to source, however. isappreciated
Suggested citation
Hardy. AM incidence and impact of selected infectious diseases in childhoddCenter !or Health Statistics. Vital Health Slat 10(180) 1991
Library of Congress Cataloging-in-Publication Data
Hardy Ann Mincidence and .moact of se'ected ,nfectious diseases -n ch.fahood
0 Cm ;Vital and health statistics Series 10 Data horn the NationalHealth '-ter.riew Suriey no 1801 ;DHHS rudlication ro ;FINS) 91 15081
Baser) on data from the 1988 National Heaith in'orview Surdev of Childleaito
o!bilog,a;.i,cal referencesISBN 8406 0451 3
Comrnuricat e d.seases ,:h:iare n United States EoiderriolodyC,:rninunicadie d.seases in children Jolted States Stat,sfics
.3 C. C seases in chiloren Urited Sates Prevention I NationalSur"ohi S i 1 Nationa. Center fcr f-dealth Sta1:st:cs LI S
in -1'e Seies V Series vital ana heaith statistics Series 10. Data trcmt-e Nt --a- 'lea fh ev no '80
Cammuricavie Cseaes aoicem oidqy tin,tedStatns -Jat.stics C:rr-nnicat. C ;eases .rfancv & c' !;:hccc: U"ited"...tat.s 'at A %.'41,1RA4J7 3 A346 no 1601-4,j4.;362 1 -.373 C31614 5 9921
DLC01 l..uraN Cdngress 91.21501

Vital andHealth StatisticsIncidence andImpact of SelectedInfectious Diseasesin Childhood
Series 10:Data from the National Health InterviewSurveyNo, 180This report provides estimates of the lifetime and annual incidence of selectedinfectious diseases for children in various demographic groups. The social andhealth care impact of these diseases in terms of limitation in activity, bed days,school days lost, physician contacts, hospitalizations, surgery, and use ofmedication is also presented. The data are from the 1988 National HealthInterview Survey on Child Health.
U S DEPARTMENT OF HEALTH AND HUMAN SERVICESPubhc Health ServiceCenters tot Disease ControlNational Center for Health Statistics
Hyattsville. MarylandOctober 1991DHHS Publication No (PHS) 91-1508
4

National Center for Health Statistics
Manning Feinleib, M.D., Dr.P.I-1., Director
Robert A. Israel. Deputy Director
Jacob J. Feldman, Ph.D.. A%-sociate Director fiw .4nalysis
and Epidemnilogy
Gail F. Fisher, Ph.D., Associah. Director fOr Planning and
Extramural Programs
Peter L. Hurley, As.wciate Director fOr ucil and Health
Statistics Systems
Robert A. Israel. Acting Associate Director fi)r
Intmaticnal Statistics
Stephen F. Nieberd Mg, Associate Director for
Management
Charles J. Rothwell, .Associute n1 1 COOT foT Dina
Processing and Seivices
Monroe Ci. Sirken, Director few Research
and Afethodologt
David I... Larson..Assistant Director, Atlanta
Division of Health Interview Statistics
Owen T. Thornberry. Jr., Ph.D.,Directiw
Deborah M. Winn. Ph.D., Deputy Director
Gerry E. Ilendershot, Ph.D., Chif, Illness and Disability
Statistics Branch
Nelma B. Keen, Chicf: Systems and Piovamming Branch
Stewart C. Rice. Jr., Cluej: Swvey Planning and
Development Branch
Robert A. Wright. Chief, 1..tili:ation and Ey( uiulireStatistics Bninch
( ,hy'etalton ,1 S Thorair tly t.rmu,
rrider air lep%I.If fon Atonal I liaith InteriiclN stim.,-%. the
Public Scnico c .1110I.,11/ed I.' 11%C. 1:1,01.1I .1% 11Inqbk:, Ihe s.:1\ lies Or
of ithci StAte itkics
in .1,,,I.1.inkc nIth srcilf MIMI, est.11,ItshClI III(' N.1!1,11.ti
Ileahh Statistic+. the I S it the ( oisus. unikt sonti.a.tti.11
mr.inrsinnitt. path; waled in pl.intling the stil+e% and ..:ollekt,14: the

Contents
Introduction1
Highlights2
Sources and limitiaions of data3
Results4Lifetime incidence of selected infectious diseases4Annual incidence o selected infectious diseases4Social impact and nealth care consequences of selected infectious diseases5
References7
List of detailed tables8
Appendixes
I. Technical notes on methodsII. Definitions of certain terms usrxi in this report 14
21
List of text tables
A. Relative risk of ever having had selected infectious diseases, by race and Hispanic origin: United States,19884B. Relative risk of having had selected infectious diseases in the past year, by race and Hispanic origin: UnitedStates, 19885C. Percent of children with selected infectious diseases in the past year who required hospitalization, by age, sex,race, and Hispanic origin: United States. 19886D. Percent of children with repeated tonsillitis or repeated ear infections in the past year who required surgery. byage, sex, race, and Hispanic origin: United States, 19886
Symbols
Data not available
Category not applicable
Quantity zero
0.0 Quantity more than zero but less than0.05
Z Quantity more than zero but less than500 where numbers are rounded tothousands
Figure does not meet standard ofreliability or precision

Incidence and Impactof Selected InfectiousDiseases in Childhoodby Ann M. Hardy, Dr.P.H., Division of HealthInterview Statistics
IntroductionInfectious diseases are an important t ...alth problem
tor children; excluding routine infant mid child healthexaminations, the five leading diagnoses made duringoffice visits to pediatricians are infectious diseases (1).These visits account for about 40 percent of all officevisits for illness for all children and for about half of thedoctor visits for pre-school-aged children (1).
In addition to being important causes of morbidity,infectious diseases are aiso important causes of infant andchildhood mortality. Infectious diseases are listed as theunderlying cause of death for about 4 percent of infantdeaths but are estimated to contribute to 12.5 percent ofdeaths (2). For children 1-4 years of age, infections arethe underlying cause of 10 percent of deaths; for those5-14 yearn, the figure is 5 percent (3). Infections are alsoimportant contributors to other causes of childhood mor-tality, such as cancer.
The purpose of this report is to provide in onedocument recent national estimates of thc occurrence ofsome of the more common childhood infectious diseases.Various demographic characteristics associated with thesediscases and their impact on health care utilization andlimitation of activity are also examined. This informationmay be useful for surveillance and disease control effortsas well as for hulth care planning. The estimates arebased on data collected in the 1988 National HealthInterview Survey on Child Health (NHISCH) whichincluded children from birth through 17 years. Informa-tion is presented on eight specific diseases: Repeatedtonsillitis or enlargement of the tonsils or adenoids, fre-quent or repeated ear infections, mononucleosis, hepatitis,meningitis, bladder or urinary tract infection, rheumaticfever, and pneumonia. Another disease, frequent or re-peated diarrhea or colitis, was also included. While theremay be noninfectious causes for this disease, some epi-sodes are likely to be infectious in origin. Also, children,particularly infants, with diarrhea, regardless of the cause,may represent a source of infection for others with whomthey have contact. All of the estimates presented for thesediseases are based on parental reporting.
It should be noted that there are other sources of dataon the incidence of infectious diseases in children. How-
ever, comparisons with the information in this report aredifficult because of methodological differences. One alter-nate source is the Centers for Disease Control (CDC)notifiable disease surveillance system which provides sum-mary data on a weekly basis (4). For most of the diseasesin this reporting system, surveillance is passive, and under-reporting may occur. Also, because the system is etiologicagent specific and because some diseases, such as mono-nucleosis, are not reportable, the data are not directlycomparable with that presented in this report.
Reports in the medical literature on prospective stud-ies of children also provide incidence information. Gener-ally these studies are not population based but limited toselected groups in one medical practice (5,6). The fewpopulation-based studies that have been reported on have,in general, been limited geographically (7,8).
The National Health and Nutrition Examination Sur-vey (NHANES I) conducted by the National Center forHealth Statistics (NCHS) in 1976-80 did collect data on apast history of ear infections and urinary tract infectionsfor children over 6 months of age. Because of differencesin wording compared with the NIESCH, the data fromthe two surveys are not directly comparable.
Two other data systems maintained by NCHS provideinformation on health care utilization for specific diseases,The National Ambulatory Care Survey (NAMCS) haspublished information on office visits to pediatricians.However, this sui cey focuses on visits and not on patients.The National Hospital Discharge Survey collects informa-tion on a sample of hospital discharges and is useful forexamining hospital utilization for specific diseases. Thisdata set may be less useful for looking at childhoodinfectious diseases as many of the latter are managed onan outpatient basis.
The 1981 Child Health Supplement to the NationalHealth Interview Survey included questions about many ofthe same diseases described in this report (9). By compar-ing estimates from the two surveys, trends in infectiousdiseases could be studied, but such an analysis is beyondthe scope of this report.
7

Highlights
The following highlights summarize information de-serit7ed in detail in the text and tables that follow.
Thirty-eight percent of children were reported to haveever had at least one of the nine infectious diseasesexamined (repeated (tar infection, repeated tonsillitisor enlarged adenoids, pneumonia, frequent diarrheaor colitis, bladder or urinary tract infectio: mononu-cleosis, hepatitis, meningitis, and rheumatic fever);11 percent were reported to have had two or more ofthese diseases.The most common of these conditions was repeatedear infection, affecting one-quarter of all children atsome time in their lives and 9 percent in the previousyear.Among infants (under 1 year of age), 10 percent werereported to have had repeated ear infection, 3 per-cent had had frequent diarrhea or colitis, and 3 per-cent had had pneumonia.Among teenagers, 13-17 years of age, repeated tonsil-litis was the most common disease, affecting 5 per-cent in the past year.In general, most of these diseases were reported morefrequently among white non-Hispanic children thanblack non-Hispanic or Hispanic children.The most striking difference in disease incidence by
sex was for bladder urinary tract infections; girls were
2
more than five times as likely to have had this condi-tion as boys.The six most common of these infectious diseases(repeated ear infection, repeated tonsillitis, pneumo-nia, frequent diarrhea or colitis, bladder or urinarytract infection, and mononucleosis) had a variety ofimpacts on children:
Between 29 and 82 percent of affected childrenwere reported to have been limited in thcir usualactivities in the past year as a result of theseconditions.Children with these conditions had from 1.2 to 7.6bed days per year as a result.These six conditions resulted in about 2 milliondays of school lost and over 40 million physiciancontacts per year.While hospitalization and surgery were relativelyuncommon for these conditions, physician con-tacts and medication use were very common. Thenumber of physiccan contacts per child per yearfor children with these conditions ranged from2.0-4.2; 46-93 percent of children with thesediseases took medication prescribed or recom-mended by a physician for the condition.
6

Sources and limitationsof data
The estimates presented in this report were based oninformation collected by the 1988 National Health Inter-view Survey on Child Health (NHIS-CH). This supple-ment was developed jointly by the National Center forHealth Statistics (NCHS), the National Institute of ChildHealth and Human Development (NICHD). and the Bu-reau of Maternal and Child Health of the Health Re-sources and Services Administration (HRSA). ChildTrends Incorporated, a private research company, wasalso involved in survey development and design.
The NHIS is an ongoing, cross-sectional survey of theU.S. civilian noninstitutionalized population conducedannually by NCHS. Each week a national probabi:itysample of households is contacted. Household membusare interviewed in person by U.S. Bureau of the Censuspersonnel to obtain information about their health statusand sociodemographic characteristics.
The NHIS has two main parts: A basic health anddemographic questionnaire which is used every year. andone or more speLial health topic questionnaires whichchange annually. In 1988, the special topics includedAIDS (acquired immunodeficiency syndrome) knowledgeand attitudes, medical device implants, occupationalhealth, alcohol, and child health. These data sets can belinked for analytic purposes.
For the NHIS-CH, one sample child under 18 years ofage was randomly selected from each family with childrenin that age range. The questionnaire was administered inperson to the adult family member who knew the mostabout the sample child's health; for 80 percent thc re-spondent was the mother. In 1988. the total interviewedsample for the basic health questionnaire consisted of47,485 households containing 122,310 persons. The totalresponse rate was 95 percent. The NHIS-CH collecteddata on 17,100 children, about 95 percent of those eligi-ble. Thus the combined overall response rate for theNHIS-CH was 90 percent. the product of the responserates for the basic and the child health questionnaires.Item nonresponse for the variables used in this report waslow, generally less than 5 percent.
The estimates presented in this report arc for nonin-stitutionalized persons under 18 years of age. Details ofthe survey design, the methods u.yz..c1 in estimation, and thegeneral qualifications of the data obtained with the surveycan be found in appendix I. Because the estimates arebased on a sample, they are subject to sampling variability.Formulas for computing sampling errors are also de-scribed in appendix I. In general, the standard errorsassociated with the estimates are low. However, when theestimated number in thc numerator or denominator of arate or percent is quite small, the standard errors may belarge.
Definitions for many of the terms used in this reportcan be found in appendix H. The entire NHIS-CH ques-tionnaire is contained in the 1988 edition of the NHISannual report entitled "Current Estimates From the Na-tional Health Interview Survey, 1988" (10).
Respondents to the NHIS-CH were asked if thesample child had ever had any on a list of specific healthconditions including each of the diseases discussed in thisreport. Those who indicated the sample child had everhad a condition were asked if the child had had thecondition in the past year. Questions were also askedabout limitation in activity and health care utilizationresulting from these diseases during the past year. Forboth time periods (ever and past year), the occurrence ofdisease was based on reports by the respondents. There-fore, the respondents had to recall that the child had hadthe disease and had to be willing to report this informa-tion. Some underreporting may have resulted from this.with the less serious forms of certain diseases being lesslikely to have been reported.
All the differences noted in this report are statisticallysignificant at thc 0.05 level. The t test with a critical valueof 1.96 was used to test all comparisons. The terms"similar- and "not different" in this report indicate thatno statistical difference was found between the measuresbeing compark.d. Lack of comment regarding differencesbetween two estimates does not imply that the differencewas tested and found not to be statistically significant.
3
Results
Lifetime incidence of selectedinfectious diseases
Overall, an estimated 38 percent of children had everhad at least one of the nine infectious diseases examinedin this report, and 11 percent had had two or more ofthese diseases. Frequent or repeated ear infection was the
most commonly reported of the nine infectious conditionsexamined, affecting almost one-quarter of all children(table 1). This was followed by repeated tonsillitis orenlargement of tonsils or adenoids (12.8 percent) andpneumonia (6.6 percent). Rheumatic fever was the leastcommon disease, affecting only 0.2 percent of children.
For most of the diseases, lifetime incidence increasedwith age. The two exceptions were repeated ear infectionand frequent diarrhea or colitis, which were highest inchildren a:,es 1-4 years and decreased in older children.This may he duc to respondents for the older children notrecalling these diseases, which tend to occur in pre-school-aged children, or to the diseases being more common nowthan when the older children were younger.
Males were more likely than females to have ever hadrepeated ear infection, frequent diarrhea or colitis, andpneumonia (table 1). Females were more likely thanmales to have had bladder or urinary tract infection. Thiswas most striking in the age group 5-11 years, wherefemales were 6.4 times more likely to have had theseinfections than males.
In general, these nine infectious diseases were morecommonly reported in white non-Hispanic children thanin either black non-Hispanic or Hispanic children (ta-ble 2). Table A shows the relative risk for five of thesediseases for white non-Hispanic children compared withblack non-Hispanic and Hispanic children. The relativerisks for white children compared with black childrenranged from 2.3 for repeated ear infection to 1.0 forfrequent diarrhea or colitis. For white non-Hispanic chil-dren compared with Hispanic children, the relative riskswere slightly lower, ranging from 2.5 for bladder or urinarytract infection to 1.0 for frequent diarrhea or colitis.
Three of the diseases, repeated ear infections, re-peated tonsillitis, and mononucleosis, increased in lifetimeincidence with income (table 3). No consistent trend byincome was seen for the other diseases. Children with ausual source of routine health care were more likely tohave had repeated ear infcction than children without
4
Table A. Relative rlsk of ever having had selected Infectiousdiseases, by race and Hispanic origin: United States, 1988
Disease
Black White White
non. non- non-
Hispanie Hispanic Hispanici Hispanic
Repeated ear infection 1.0 2.3 1.0 1.5
Repeated tonsillitis 1.0 1.7 1.0 1.4
Pneumonia 1 0 1.6 1.0 2.0
Bladder or urinary tractInfection 1.0 2.1 1.0 2.5
Frequent diarrhea or colitis . . 1.0 1.0 1.0 1.0
'Reference group.
such care. Children with hPalth insurance were more likely
to have this disease and repeated tonsillitis than thosewithout health insurance. This is probably because thesediseases may go undiagnosed without an examination by ahealth care provider; children with a source of routinecare and with health insurance probably are more likely toaccess medical care for less serious illness, and thus havemore opportunity to have ear infections and tonsillitisdiagnosed.
Slight differences in lifetime incidence were alsonoted by geographic region (table 4). For three of thediseases (repeated ear infection, repeated tonsillitis, andpneumonia), rates were highest among children in theMidwest and lowest among those in the Northeast.
Annual incidence of selectedinfectious diseases
For three of the diseases, hepatitis, meningitis, andrheumatic fever, the reported incidence in the past yearwas too small to make reliable estimates. The remainderof this report will focus on the other six diseases.
Repeated ear infection was the most common disease,with an annual incidence rate of 9.0 per 100 children up to17 years, followed by repeated tonsillitis (4.7) and pr u-monia (1.7) (table 5). In the age group 0-4 years, the ratefor repeated ear infections was quite high, 16.0 per 100
children in this age group, more than five times theincidence rate for the next most common diseases, re-peated tonsillitis and pneumonia. For those aged 5-11years, bladder or urinary tract infections were as commonas pneunmia. For teenagers, repeated tonsillitis was themost common disease. Mononucleosis was also much

Table B. Relative rlsk of having hed selected Infectious diseasesin the past year, by race and Hispanic origin: United States, 1988
Disease
Black White Whitenon- non. non-
Hispanic' Hispanic Hispanic' Hispanic
Repeated ear infection 1.0 1 8 1 0 1.4Repeated tonsillitis 1.0 1 8 1.0 1 2Pneumonia 1.0 1.7 1 0 '2 5Bladder or urinary tract
infection 1 io 1 8 1 0 *2.0Frequent diarrhea or cobtls . 1 0 1.1 1.0 1.0
'Reference group.
more common in this age group than in younger children.Females had higher incidence rates of repeated tonsillitisand bladder and urinary tract infections than males.
For most of the diseases, white non-Hispanic childrenhad higher rates than black non-Hispanic children (ta-ble 6). Mononucleosis was reported almost exclusivelyamong white children. As seen in table B, the relativerisks for white children compared with black childrenranged from 1.8 for repeated tonsillitis and repeated carinfection to 1.1 for frequent diarrhea or colitis. For whitechildren compared with Hispanic childien, the relativerisk was increased only for repeated ear infection andrepeated tonsillitis.
When rates for these six diseases were examined byincome level, rates for three diseases, repeated tonsillitis,frequent diarrhea or colitis, and pneumonia, were higheramong those in the lower income categories than thosewith higher incomes (table 7). The other diseases showedno consistent pattern of incidence by income. Only onedisease, repeated ear infection, showed a difference inincidence rate related to whether the child had a usualsource of routine health care (9.7 per 100 children who didversus 3.8 per 100 children who did not). This difference islikely due to children with a usual source of routine healthcare having morc opportunity for ear infections to bediagnosed than do children without a usual source ofroutine care. This condition was also slightly more com-mon among those children vbith health insurance cover-age.
Regional variations in disease rates were also seen(table 8). Rates for repeated ear infections were loweramong children in the West than in the Midwest andNortheast. Repeated tonsillitis was more common in theMidwest and South than in the Northeast and West.Bladder or urinary tract infections were reported lessfrequently for those from the Northeast than from theother regions.
Social impact and health careconsequences of selectedinfectious diseases
For the six infectious diseases discussed in the preced-ing section, information on the social and health careimpact on children with these conditions in the previous
1 1
year was also examined. Impact included limitation inactivity, bed days, school-loss days, physician contacts,hospitalization, need for surgery, and use of medication.This type of information supplements the informationpresented on rates of disease and helps quantify thefinancial, social, and health care burden they create.
Limitation in activity All six diseases were associatedwith limitation in usual childhood activities in at leastsome of the children affected (table 9). Pneumonia andmononucleosis resulted in limitation in the highest per-cent of affected children (82 and 79 percent, respec-tively). Frequent diarrhea or colitis resulted in limitationin only 29 percent of children with this condition, Formost of the diseases, those aged 4 years and younger wereless likely to be limited than older children. Males andfemales were similar in the proportion limited in activityfor these conditions. White non-Hispanic children werereported to have been limited more often than blacknon-Hispanic children.
Bed days Bed days ranged from 7.6 days per year perchild with mononucleosis to 1.2 days per year per childwith frequent diarrhea or colitis (table 10). For pneumo-nia, those aged 12-17 years had more bed days thanyounger children with this condition. For mononucleosisand frequent diarrhea or colitis, children aged 5-11 yearshad more bed days than other children. Females withmononucleosis had more bed days than males with thiscondition; for other conditions the number of bed dayswas similar for males and females. Hispanic children withpneumonia and with repeated ear infections had more beddays than white and black non-Hispanic children.
School-loss days Children with mononucleosis andpneumonia had more school-loss days than children withthe other infectious diseases (table 11). Those with fre-quent diarrhea or colitis and bladder or urinary tractinfections had the least (2.0 days for each). Females hadslightly more school-loss days for frequent diarrhea orcolitis than males with this condition. Hispanic childrenhad substantially more school-loss days than non-Hispanicchildren for pneumonia and slightly more for bladder orurinary tract infections. White children had about 1 moreschool day lost for repeated tonsillitis than did eitherblack or Hispanie children. In total, these six conditionsresulted in an annual loss ot about 28 million days ofschool.
HospitalizationWith the exception of pneumonia,hospitalization tor these infectious diseases was fairly rare,Approximately one-quarter of the children with pneumo-nia were hospitaliad; for repeated tonsillitis and re?eatedear infection, less than 7 percent of affected childrenwere hospitalized (table C). For children aged 0-4 yearswith pneumonia, 36.2 percent were hospitalized, morethan twice the proportion for those over age 4 years withthis disease. Because of low incidence of hospitalization,reliable estimates cannot be made for the other threediseases.
SurgerySurgery was also rare for these particulardiseases, and reliable estimates could be made only for
5

Table C. Percent of chltdren with selected Infectious diseases in tho past year who required hospitalization, by ago, sex, race, and
Hispanic origin; United States, 1988
Disease
7.11.7,0Ago
All 0 4 5 .11 12 I?ages years years years
Sex Race and Hispanic origin
White Mack
Male Female non.Hispanic non.Hlspanic Hispanic.106.1it
Pneumonia 2 2 *2.4 '1.9 '2 6 '2 4 '2 0 22 '4 3 '0 4
Repeated tonsillitis 6 7 '6 6 9 1 '3 6 8 9 '4 9 6 6 '5 8 67 7
Repeated ear infection . 25 9 36 2 '18.8 '12 6 30 0 20 0 22 7 41 9 49 0
Table D. Percent of children with repeated tonsillitis or repeated oar infections in the past year who required surgery, by age, sox, race,
and Hispanic origin: United States, 1988
Disease
Ago
All 0 4 5 1 1 12 17
ages years years years Male
Sox !loco and Hispanic origin
Mee Black
Foinato ncn.Hispanic non.ttspanic hspanic
Repeated ear ofection . . 7 0 7 6 6 7 5 4 7 8 6 1 8 9 '1 0 1 1
Repeated tonaiiinis 10 9 '10 6 14 4 '6 3 143 8 0 12 0 4 3 7 6
repeated tonsillitis and repeated ear infection. Elevenpercent of children with repeated tonsillitis and 7 percentof children with repeated ear infection reqMred surgelyfor their conditions (table D). For repeated tonsillitis, thepercent needing surgery was highest in the age group 5-11years and higner for males than for females.
Physician contacts-While hospitalization and surgerywere relatively uncommon for most of the infectiousconditions examined, a large proportion of children withthese disorders had outpatient contact with a health careprovidei. The proportion who had had at least one physi-cian contact during the past year for these conditions washighest for repeated ear infections and mononucleosis(92,4 and 91.9 percent, respectively) and lowest for fre-quent diarrhea or colitis (61.4 percent) (table 12). Forthree of the diseases (repeated ear infection, repeatedtonsillitis, and frequent diarrhea or colitis), younger chil-dren were more likely to have had physician visits thanolder children with the same disease. There were nosignificant differences in proportion with a physician con-tact by sex or race and c:thnicity.
Children with these six infectious diseases in the pastyear had over 40 million physician contacts as a result.
6
Those children with repeated ear infections had the most(4.2 per affected child) (table 13). The number of visitsfor the other disorders ranged from 2.0 visits per year perchild with frequent diarrhea or colitis to 2.9 per child withrepeated tonsillitis and mononucleosis. For most of thesediseases, younger children had more visits than olderchildren and white non-Hispanic children had more visits
than black non-Ilispanic children.Use of Medication ie of doctor-prescribed Or
-recommended medicati.',, in the past 12 months by chil-dren with specific conditions was also assessed. More than90 percent of children with pneumonia and repeated carinfections reported taking medication (93.4 and 92.8 per-cent, respectively) (table 14). Only 45.5 percent of thosewith frequent diarrhea or colitis took medication. Forrepeated tonsillitis and repeated ear infection, youngerchildren were more likely than older children to have usedmedication. In general, patterns of medication use weresimilar within the three racial-ethnic groups, with medi-cation for pneumonia and repeated ear infections used bymore than 80 percent of affected children and medicationfor frequent dia, thea or colitis less common (used by less
than 50 percent).

II
References
1. Cypress 13K. Patterns of ambulatory care in pediatrics: TheNational Ambulatory Medical Care Survey, United States,January 1980-December 1981. National Center for HealthStatistics. Vital Health Stat 13(75). 1983.
2. Jason JM, Jarvis WR. Infectious diseases: Preventablecauses of infant mortality. Pediatrics 80:335-41. 1987.
3. National Center for Health Statistics. Advance report offinal mortality statistics, 1988. Monthly vital statistics re-port; vol 39 no 7, suppl. Hyattsville, Maryland: PublicHealth Service. 1990.
4. Centers for Disease Control. Bacterial meningitis and men-ingococcemia, United States, 1978. MMWR 28:277-9.1979.
5. Murphy TF, Henderson FW, Clyde WA, et al. Pneumonia:An eleven-year study in a pediatric practice. Am J Epide-miol 113:12-21. 1981.
6. Tee le DW, Klein JPO, Rosner BA. Epidemiology of otitismedia in children. Ann Otol Rhino! Laryngol (suppl)68:5-6. 1980.
7. Heath CW, Brodsky AL, Potolsky AL Infectious mononu-cleosis in a general population. Am J Epidemiol 95:46-52.1972.
8. Biles RW, Buffler PA, O'Donell AA. Epidemiology ofotitis media: A community study. Am J Public Health70:593-8. 1980.
9. Poe GS. Design and procedures for the 1981 child healthsupplement to the National Health Interview Survey. Na-tional Center for Health Statistics. Working Paper SeriesNo. 28. 1986.
13
10. Adams PF, Hardy AM. Current estimates from the Na-tional Health Interview Survey, 1988. National Center forHealth Statistic.. Vital Health Stat 10(173). 1989.
11. Massey JT, Moore TF, Parsons VL, Tadros W. Design andestimation for the National Health Interview Survey,1985-94. National Center for Health Statistics. VitalHealth Stat 2(110). 1989.
12. Koons DA. Quality control and measurement of nonsam-pling error in the Health Interview Suivey. National Centerfor Health Statistics. Vital Health Stat 2(54). 1973.
13. Balamuth E, Shapiro S. Health interview responses com-pared with medical records. National Center for HealthStatistics. Vital Health Stat 2(7). 1965.
14. Madow WG. Interview data on chronic conditions com-pared with information derived from medical records.National Center for Health Statistics. Vital Health Stat2(23). 1967.
15. Cannell CF, Fowler FJ Jr, Marquis KH. The influence ofinterviewer and respondent psychological and behavioralvariables on the reporting in household interviews. Na-tional Center for Health Statistics. Vital Health Stat 2(26).1968.
16. Cannel! CF, Fowler FJ Jr. Comparison of hospitalizationreporting in three survey procedures. National Center forHealth Statistics:Vital Health Stat 2(8). 1965.
7

List of detailed tables
I. Percent of children who had ever had selected infec-tious diseases, by age and sex: United States, 1988.
2. Percent of children who had ever had selected infec-tious diseases, by age, race, and Hispanic origin:United States, 1988
3. Percent of children who had ever had selected infec-tious diseases, by family income, usual sou:ce of rou-
tine health care, and health insurance coverage:United States, 1988
4. Percent of children who had ever had selected infec-tious diseases, by geographic region: United States,1988
5. Annual incidence rate per 100 children for selectedinfectious diseases, by age and sex: United States,1988
6. Annual incidence rate per 100 children for selectedinfectious diseases, by race and Hispanic origin:United States, 1988
7. Annual incidence rate per 100 children for selectedinfectious diseases, by family income, usual source ofroutine health care, and health insurance coverage:United States, 1988
8
9
9
10
10
10
11
11
8. Annual incidence rate per 100 children for selectedinfectious diseases, by geographic region: UnitedStates, 1988
9. Percent of children with selected infectious diseases in
the past year who had resulting activity limitation, by
age, sex, race, and Hispanic origin: United States,1988
10. Average annual number of bed days per child v.ithselected infectious diseases, by age, sex, race, and
Hispanic origin: United States, 1988
11. Average annual numb,]..r of school-loss dlys per childwith selected infectious diseases, by age, sex, race, and
Hispanic origin: United States, 1988
12. Percent of children with selected infectious diseases in
the past year who had physician contact, by age, sex,
race, and Hispanic origin: United States, 1988
13. Average annual number of physician contacts perchild with selected infectious diseases, by age, sex,race, and Hispanic origin: United States, 1988
14. Percent of children with selected infectious diseases in
the past year who required medication, by age, sex,
race, and Hispanic origin: United States, 1988
1 4
11
11
11
12
12
12
12

Table 1. Percent of children who had ever had selected infectious diseases, by age and sex: United States, 1908
Sex and disease
Age
All
ages0-1year
1-4yoars
5-11years
12-17years
Both sexes
Repeated ear infection 24 5 10 3 29.4 28.0 19.6Repeated tonsillitis .............. 12 8 *0 9 5.3 13 9 19.1Pneumonia 6.6 2 8 5 3 7.2 7.6Bladder or urinary tract infection 3 8 '0 5 2 0 4.7 4.5Frequent diarrhea or colitis 3.1 2.9 5.3 2 7 2.0Mononucleosis 1 3 '0 2 0.8 2.8Meningitis 0 7 *0 1 0.7 0.8 0.6Hepatitis ...... 0.3 '0.1 '0.1 *0 3 '0.3Rheumatic fever 0.2 - - '0.1 "0.3
Male
Repeated ear infection 25 A 1 1.1 32 3 29.7 19.5Repeated tonsillitis 12.0 1.2 6.0 13.6 16.4Pneumonia 7.3 '4.4 6.0 8.0 8.0Bladder or urinary tract infection 1 2 '0 6 '1.0 1.3 1.5Frequent diarhea or colitis 3.7 "3.9 6.3 3.1 2.4Mononucleosis1 1 *0.3 '0.6 2.4Meningitis 0 8 '0.2 '0.8 1.0 '0.8Hepatitis '0 2 '0 1 '0.4 '0.2Rheumatic fever '0.2 - - 0.2 "0.4
Female
Repeated ear infection 23 2 9 4 26.4 26.3 19.6Repeated tonsillitis 13 6 "0 5 4.5 14.1 22.0PneumOnia 6.0 *1.0 4.6 6.5 7.2Bladder or urinary tract infection 6.4 0 4 3.0 8.3 7.7Frequent diarrhea or colitis 2.5 '1.8 4.2 2.2 1.7Mononucleosis 1.4 - '0.1 1.0 3.1Meningitis 0.5 '0.5 '0.5 '0.5Hepatitis *0.3 '0.2 '0.1 '0.3 '0.5Rheumatic fever . .......... '0.1 '0.1 *0.3
Table 2. Percent of children who had ever had selected Infectious diseases, by age, race, and Hispanic origin: United States, 1988
Age
Race, Hispanic origin, and diseasoAll
ages0-4
Years
5-11years
'2-17years
White non.Hispanic
Repeated ear Infection 27.6 28 2 31.5 22.4Repeated tonsillitis 14 9 4.8 16.5 21.9Pneumonia 7.7 5.5 8.2 8.9Bladder or urinary tract infection 4.5 2 5 5 7 5.4Frequent diarrhea or colitis 3 1 4.7 2.9 2.0Mononucleosis 1.6 "0.3 0.9 3.5Meningitis 0 7 0.5 0.8 0.6Hepatitis 0 3 '0.1 '0.4 '0.4Rheumatic fever '0.1 '0.0 "0.1 *0.3
Black non.Hispanic
Repeated ear Infection 16.1 17.8 18.6 11.8Repeated tonsillitis 6 5 '2.8 5.5 10.9Pneumonia 4.8 3.9 5.8 4.4Bladder or urinary tract infection 2.1 1.2 '2.2 '2.9Frequent diarrhea or colitis 2 9 6.5 1.9 '1.2Mononucleosis *0 5 *0.0 '0.3 1.0Meningitis '0.5 '0 1 "0.3 '0.9Hepatitis . . . ........ '0.1 '0.3 - -Rheumatic fever '0.1 - "0.1 0.1
Hispanic
Repeated ear infection . 19 9 21 8 22.8 14.2Repeated tonsillitis 10.2 4.4 11.2 14.8Pneumonia . . . .
3_9 '2.9 3.4 5.4Bladder or urinary tract intenon 1 8 1 3 '2.3 '1.5Frequent diarrhea or colitis . 3.0 '3.2 '2.4 '3.5Mononucleosis '0.6 - 1.0 '0.8Meningitis . . . 1 0 1 .4 1.2 '0.3Hepatitis. . . . '0 2 '0_2 '0.4Rheumatic fever.. '0.3 - - '0.9
9
15
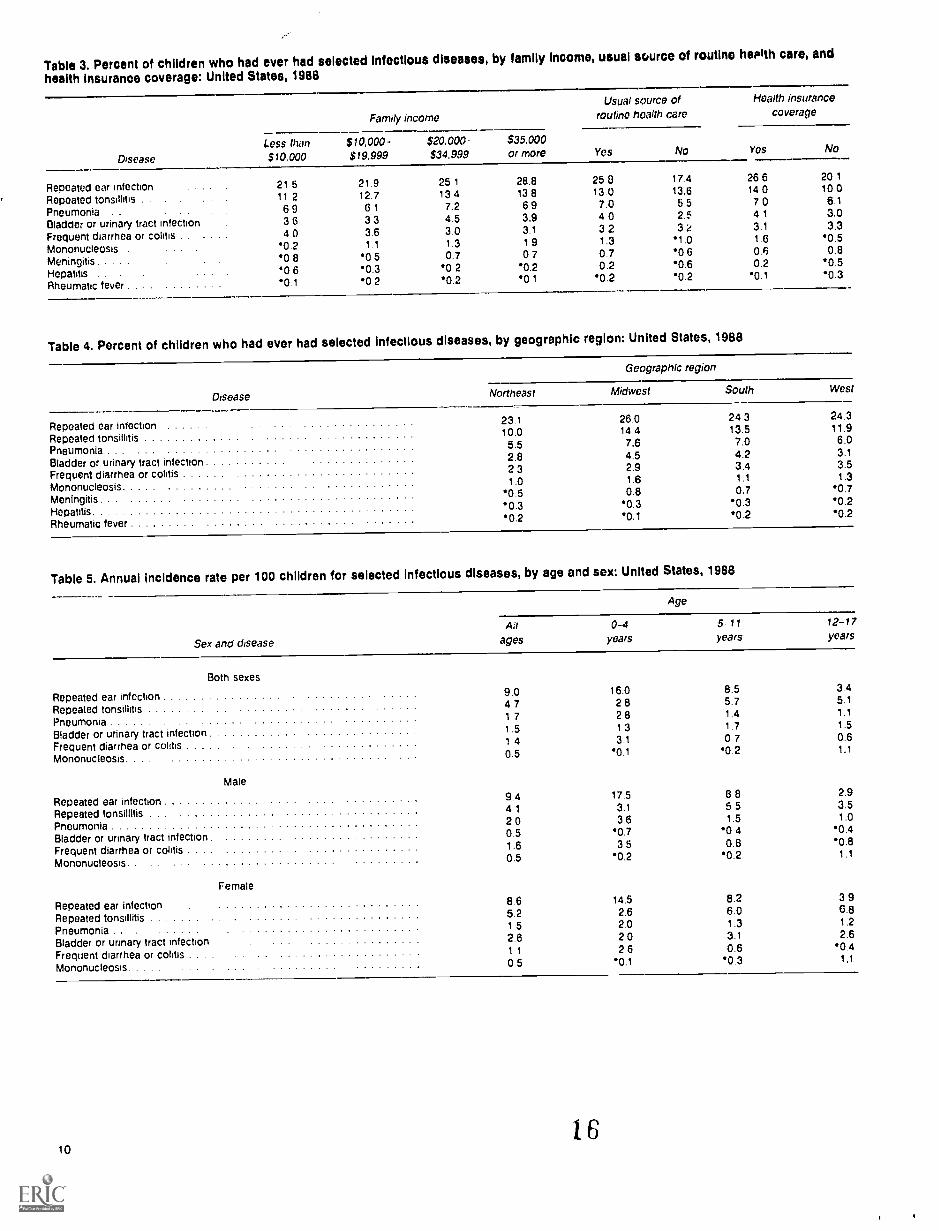
Table 3. Percent of children who had ever had selected Infectious diseases, by family Income, usual source of routine herath care, and
health insurance coverage: United States, 1988
Disease
Family income
Less than$10,000
$10,000 -$19.999
$20.000-$34.999
$35.000or more
Repeated ear infectionRepeated tonsillitis .
Pneumonia . .
Bladder or urinary tract infection .
21 511 26 93 6
21.912.76 13 3
25 113 47.24 5
28.813 86 93.9
Frequent diarrhea or colitis . . . 4.0 3.6 3.0 3.1
Mononucleosis '0.2 1.1 1.3 1 9
Meningitis '0 8 '0.5 0.7 0 7
Hepatitis . . . '0 6 0.3 '0 2 '0.2
Rheumatic fever *0.1 '0.2 '0.2 *0 1
Usual source ofroutine health care
Yes
Health insurancecoverage
25 813 07.04 03 21.30.70.2
"0.2
17.413.65 52.53 21 .0
'0 6'0.60.2
Yes No
26 614 07 04 13.11 60.60.2
'0.1
20 110.0
6.13.03.3
'0.50.8
*0.5'0.3
Table 4. Percent of children who had ever had selected infectious diseases, by geographic region: United States, 1988
Geographic region
Disease Northeast Midwest South West
Repeated ear infection 23.1 26.0 24 3 24.3
Repeated tonsillitis 10.0 14.4 13.5 11.9
Pneumonia 5.5 7.6 7.0 6.0
Bladder or urinary tract infection 2.8 4.5 4.2 3.1
Frequent diarrhea or colitis 2 3 2.9 3.4 3.5
Mononucleosis 1.0 1.6 1.1 1.3
Meningitis'0 5 0.8 0.7 '0.7
Hepatitis.0.3 '0.3 '0.3 '0.2
Rheumatic fever '0.2 '0.1 '0.2 '0.2
Table 5. Annual Incidence rate per 100 children for selected infectious diseases, by age and sex: United States, 1988
Sex and disease
Age
0-4 5 11 12-17
ages years years years
Both sexes
Repeated ear infection 9.0 16.0 8.5 3.4
Repeated tonsillitis 4 7 2 8 5 7 5.1
Pneumonia1 7 2 8 1.4 1.1
Bladder or urinary tract infection 1.5 1 3 1.7 1.5
Frequent diarrhea or colitis 1 4 3 1 0.7 0.6
Mononucleosis. 0.5 0.1 '0.2 1.1
Male
Repeated ear infection 9.4 17.5 8 8 2.9
Repeated tonsillitis 4 1 3.1 5.5 3.5
Pneumonia 2 0 3.6 1.5 1.0
Bladder or urinary tract infection 0.5 0.7 '0 4 '0.4
Frequent diarrhea or colitis 1.6 3 5 0.8 '0.8
Mononucleosis 0.5 '0.2 '0.2 1.1
Female
Repeated ear infection 8.6 14.5 8.2 3 9
Repeated tonsillitis 5.2 2.6 6.0 6.8
Pneumonia . 1 5 2 0 1.3 1.2
Bladder or urinary tract infection 2.6 2 0 3.1 2.6
Frequent diarrhea or colitis . . .1 1 2 6 0.6 '0.4
Mononucleosis 0.5 .0.1 '0.3 1.1
106

Table 6. Annual incidence rate per 100 children for selectedinfectious diseases, by race and Hispanic origin: United States,1988
Race and Hispanic origin
DiseaseWhite
non-Hispanic
Repeated ear Infection 10.2Repeated tonsillitis 5.3Pneumonia 2.0Bladder or urinary tractinfection . . . 1 8
Frequent diarrhea or colitis 1.4Mononucleosis . . 0 6
Blacknon-Hispanic Hispanic
5.8 7 32.4 4.31.2 *0.6
1 0 *0 61 3 1 4
*0 1
Table 7. Annual incidence rate per 100 children for selected infectious diseases, by family income, usual source of routine health care,and health Insurance coverage: United States, 1988
Disease
Usual source ofFamily income routine health care
Health insurancecoverage
Less than $10.000- $20.000- $35.000$10,000 $14.999 $34.999 or more Yes No Yes No
Repeated ear infection 9 0 8 9 9 6 9.6 9 7 3 8 9 6 8.0Repeated tonsillitis 5.2 5.1 4 5 4 6 4.8 4.5 5 0 4 1Pneumonia ....... . . . . 2.6 1.3 2 1 1 4 1 8 1.0 1.7 2.0Bladder or urinary trat infection . . . . 1 6 1.8 1 7 1.4 1.7 *0 6 1.6 1.5Frequent diarrhea or colitis 2.0 1.8 1.4 1 1 1.4 *1.4 1 3 1.6Mononucleosis *0 0 0 6 '0.5 *0.6 0 5 '0.3 0.6 *0.1
Table 8. Annual incidence rate per 100 children for selectedInfectious diseases, by geographic region: United States, 1988
Geographic region
Disease Northeast Midwest South West
Repeated ear infection 9.9 9.6 9.0 7.5Repeated tonsillitis 4.2 5.1 5.1 4.0Pneumonia 1.4 2.0 1.8 1.6Bladder or urinary tract infection 0.9 1.8 1 9 1.2Frequent diarrhea or colitis . . . 1.0 1.2 1.6 1.4Mononucleosis . . . *0.4 0.6 0 4 *0.4
Table 9. Percent of children with selected infectious diseases in the past year who had resulting activity limitation, by age, sex, race, andHispanic origin: United States, 1988
Disease
Age Sex Race and Hispanic origin
All 0 4 5. 11 12 17 White Blackages years years years Male Female non-Hispanic non-Hispanic Hispanic
Repeated ear infection 49 6 41 9 52 I 49 9 45 3 48.1 48 4 41 6 37 7Repeated tonsillitis . 58 0 58 0 59 8 55 9 60 0 56 5 59 2 54 2 51 0Pneumonia . . 81.5 77 2 87 1 82 6 81.4 77 3 80 3 88 9 '85 6B1adder orurinary tract infection 79 4 '82 0 *71 7 81 3 79 3 79 6 81 3 42 5Frequent diarrhea or colitis 37 3 '24 1 38 2 47 1 *30 1 38 5 38 2 42 7 *18 1Mononucleosis . . 29 3 20 7 47 2 45.3 28 7 30 3 30 0 *18 5 48.2
Table 10. Average annual number of bed days per child with selected infectious diseases, by age, sex, race and Hispanic origin:United States, 1988
Disease
Age Sex Race and Hispanic origin
All 0-4 5-11 12-17 White Blackages years years years Male Female non-Hispanic non-hispanic Hispanic
Repeated ear infection 1 7 1 9 1 4 1 8 1 8 1 6 1 5 1 2 3.7Repeated tonsillitis 2.8 2 5 2 6 3 1 2 4 3 0 2 9 2.2 2 4Pneumona 4 9 4 0 4 4 7 1 4 9 4 6 4.4 4 6 10.1Bladder or urinary tract infection 1 5 1 3 1 0 2 3 1 6 1 5 1 6 1 1 *0.6Frequent diarrhea or colitis . 1 2 0 8 2 3 0 9 1 4 0 8 1 1 0 8 2.1Mononucleosis . 7 6 *1 6 13 8 6 1 5 4 9 6 7 9 *3.1
BEST COPY AVAILABLE
7
11
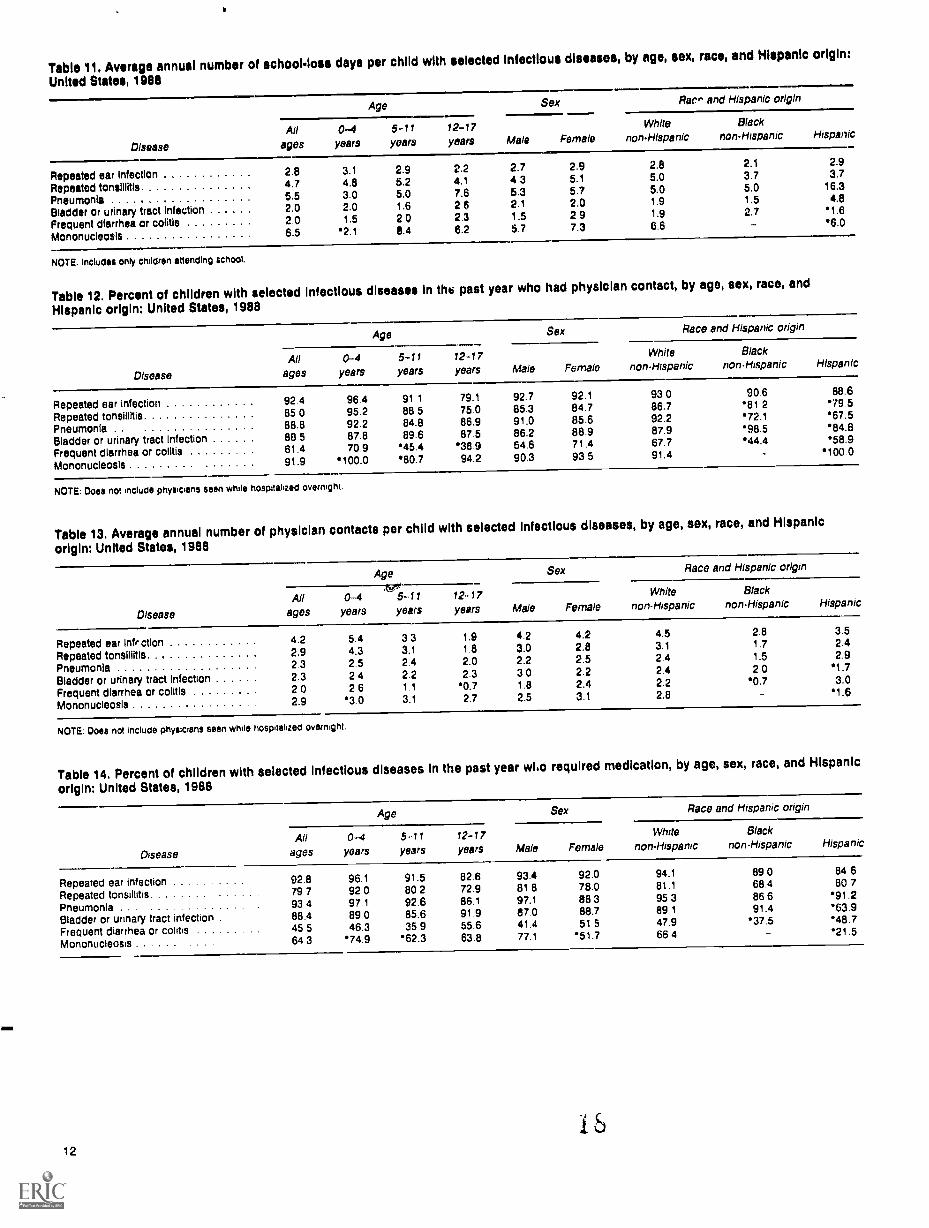
Table 11. Average annual number of school-loss days per child with selected infectious diseases, by age, sex, race, and Hispanic origin:
United States, 1988
Age Sex Rat," and Hispanic origin
Disease
Allages
0-4years
5-11years
12-17years Male Female
Whitenon-Hispanic
Blacknon-Hispanic Hispanic
Repeated ear infection 2.8 3.1 2.9 2.2 2.7 2.9 2.8 2.1 2.9
Repeated tOnallittis 4.7 4.8 5.2 4.1 4.3 5.1 5.0 3.7 3.7
Pneumonia 5.5 3.0 5.0 7.6 5.3 5.7 5.0 5.0 16.3
Bladder or urinary tract Infection 2.0 2.0 1.6 2 6 2.1 2.0 1.9 1.5 4.8
Frequent diarrhea or colitis 2.0 1.5 2 0 2.3 1.5 2 9 1.9 2.7 1.6
Mononucleosis 6.5 *2.1 8.4 6.2 5.7 7.3 6.6 - *6.0
NOTE. Include 11 Only Children ettending school.
Table 12. Percent of children with selected infectious diseases in thv past year who had physician contact, by age, sex, race, and
Hispanic origin: United States, 1988
Age Sex Race and Hispanic origin
Disease
Allages
0-4years
5-11years
12-1 7
years Male FemaleWhite
non-HispanicBlack
non-Hispanic Hispanic
Repeated ear Infection 92 4 96 4 91 1 79.1 92.7 92.1 93 0 90.6 88.6
Repeated tonsillitis 85 0 95.2 88 5 75.0 85.3 84.7 86.7 *81 2 79.5
Pneumonia 88.8 92.2 84.8 86.9 91.0 85.6 92.2 *72.1 '67.5
Bladder or urinary tract infection 88 5 87.8 89.6 87.5 86.2 88.9 87.9 *98.5 *84.8
Frequent diarrhea or colitis 61.4 70.9 45.4 *38.9 54.6 71.4 67.7 '44.4 '58.9
Mononucleosis 91.9 100.0 *80.7 94.2 90.3 93 5 91.4 - *100.0
NOTE: Does not include physicians seen while hospitalized overnight.
Table 13. Average annual number of physician contacts per child with selected infectious diseases, by age, sex, race, and Hispanic
origin: United States, 1988
Age Sex Race and Hispanic origin
Disease
Allages
0-4years
5-11years
12-1 7years Male Female
Whitenon-Hispanic
Blacknon-Hispanic Hispanic
Repeated ear !Mr ctlon 4.2 5.4 3 3 1.9 4.2 4.2 4.5 2.8 3.5
Repeated tonsillitis 2.9 4.3 3.1 1.8 3.0 2.8 3.1 1.7 2.4
Pneumonia 2.3 2.5 2.4 2.0 2.2 2.5 2.4 1.5 2.9
Bladder or urinary tract infection 2.3 2 4 2.2 2.3 3 0 2.2 2.4 2 0 *1.7
Frequent diarrhea or colitis 2 0 2 6 1.1 *0.7 1.8 2.4 2.2 *0.7 3.0
Mononucleosis 2.9 3.0 3.1 2.7 2.5 3.1 2.8 1.6
NOTE: Does not include physicians seen while hospitalized overnight:
Table 14. Percent of children with selected infectious diseases in the past year who required medication, by age, sex, race, and Hispanic
origin: United States, 1988
Age Sex Race and Hispanic origin
Disease
Allages
0-4years
5-71years
12-17years Male Female
Whitenon-Hispanic
Blacknon-Hispanic Hispanic
Repeated ear infection 92.8 96.1 91.5 82 6 93.4 92.0 94.1 89.0 84 6
Repeated tonsillitis 79 7 92 0 80 2 72.9 81 8 78.0 81.1 68.4 80 7
Pneumonia 93 4 97.1 92.6 86.1 97.1 88 3 95 3 86 6 '91.2
Bladder or urinary tract infection . 88.4 89.0 85.6 91.9 87.0 88.7 89.1 91.4 '63.9
Frequent diarrhea or colitis 45 5 46.3 35 9 55.6 41.4 51 5 47.9 *37.5 48.7
Mononucleosis ... .. . . 64 3 *74.9 *62.3 63.8 77.1 *51.7 66 4 '21.5
12
AS

Appendixes
Contents
I. Technical notes on methods14Background14Statistical design of the NHIS14Collection and processing of data15Estimation procedures15Reliability of estimates16
II. Definitions of certain terms used in this report21
List of appendix tables
I. Age-race-sex poststratification cells for the 1988 National Health Interview Survey on Child Health ..... 16IL Number of children 17 years of age and under, by age, sex, race, and Hispanic origin: United States, 1988... 17III. Number of children 17 years of age and under, by selected characteristics: United States, 1988 17IV. Number of children 17 years of age and under with selected infectious diseases in the past year, by selected
characteristics: United States, 198818
V. Number of bed days in the past year for children with selected infectious diseases, by age, sex, race, andHispanic origin: United States, 1988
18VI. Number of children with selected infectious diseases in the past year who attended school, by age, scx, race,and Hispanic origin: United States, 1988
19VII. Number of school-loss days in the past year for children with selected infectious diseases, by age, sex, race, and
Hispanic origin: United States, 198819
VIII. Number of physician contacts in the past year for children with selected infectious diseases, by age, sex, race,and Hispanic origin: U.tited States, 1988
20
13

Appendix ITechnical notes onmethods
Background
This report is one of a series of statistical reportspublished by the staff of the National Center for HealthStatistics (NCHS). It is based on information collectedfrom a nationwide sample of households included in theNational Health Interview Survey (NHIS). Data are ob-tained on the sociodemographic and health characteristicsof all family members and unrelated individuals living in
these households.Field operations for the survey are conducted by the
U.S. Bureau of the Census under specifications estab-lished by NCHS. The U.S. Bureau of the Census partici-pates in the survey planning, selects the sample, andconducts the interviews. The data are then transmitted toNCHS for preparation, processing, and analysis.
Summary reports and reports on special topics for
each year's data are prepared by the staff of the Divisionof Health Interview Statistics for publication in Vital andHealth Statistics, Series 10 publications of NCHS. Dataalso are tabulated for other rcports published by NCHSstaff and for use by other organizations and by researcherswithin and outside the Government. Since 1969, public
use data tapes have been prepared for each year of datacollection.
The health characteristics described by NHIS esti-mates pertain only to the resident, civilian noninstitution-alized population of the United States living at the time ofthe interview. The sample does not include persons resid-ing in nursing homes, members of the Armed Forces,institutionalized persons, or U.S. nationals living abroad.
Statistical design of the NHIS
General design
The NHIS has been conducted continuously since1957. The sample design .of the survey has undergonechanges following each decennial census. This periodicredesign of the NHIS sample allows the incorporation ofthe latest population information and statistical method-ology into the survey design. The data presented in thisreport were collected using an NHIS sample design firstimplemented in 1985. It is anticipated that this design will
be used until 1995. A detailed description of the sampledesign is contained in the publication entitled "Design
14
and Estimation for the National Health Interview Survey,1985-94" (11).
The sampling scheme of the NHIS follows a multi-stage probability design that permits continuous sampling
of the civilian noninstitutionalized population residing inthe United States. The survey is designed in such a waythat the sample scheduled for each week is representativeof the target population and the weekly samples areadditive over time. This design permits estimates forfrequent events or for large population groups to beproduced from data collected over a short period of time.Estimates for less frequent events or for smaller popula-tion subgroups can be obtained from data collected over alonger period of time. The annual sample is so designedthat tabulations can be provided for each of the four majorgeographic regions. Because interviewing is done through-out the year, there is no seasonal bias for annual esti-mates. The continuous data collection also has
administrative and operational advantages because field-work can be handled on a continuing basis with anexperienced, stable staff.
Sample selection
The target population for the NHIS is the civiliannoninstitutionalized population residing in the UnitedStates. For the first stage of the sample design, the UnitedStates is considered to be a universe composed of approx-imately 1,900 geographically defined primary samplingunits (PSU's). A PSU consists of a county, a small groupof contiguous counties, or a metropolitan statistical area(MSA). The PSU's collectively cover the 50 States andDistrict of Columbia. The 52 largest PSU's in the universeare referred to as self-representing PSU's. The otherPSU's in the universe are clustered into 73 strata, and 2sample PSU's are chosen from each stratum with proba-bility proportional to population size. The selection of two
Li's per stratum allows more efficient variance estima-tion than was possible under the pre-1985 NHIS design inwhich only one PSU was selected per stratum. The currentprocedure yields a total of 198 PSU's selected in thesecond stage.
Within a PSU, two types of second stage units, re-ferred to as segments, are used: Area segments and permitarea segments. Area segments are defined geographicallyand contain an expected eight households. Permit area

segments cover geographic areas ct g housing unitsbuilt after the 1980 census. The perm area segments aredefined using updated lists of building permits issued inthe PSU since 198b and contain an expected four house-holds.
Within each segment, all occupied households aretargeted for interview. On occasion, a sample segmentmay contain a large number of households. In this situa-tion, the households arc subsampled to provide a manage-able interviewer workload.
To increase the precision of estimates for black per-sons, differential sampling rates are applied in PSU'scontaining a population consisting of between 5 and50 percent black persons. Within those PSU's, samplingrates for selection of segments are increased in areasknown to have the highest concentration of black persons;segment sampling rates are decreased in other areaswithin those PSU's to ensure that the total sample is thesame size as it would have been without oversamplingblack persons.
The sample was so designed that a typical NHIS fullsample for the data collection years 1985 to 1995 willconsist of approximately 7,500 segments containing about59,000 assigned households. Of these households, an ex-pected 10,000 will be vacant, demolished, or occupied bypersons not in the target population of the survey. Theexpected sample of 49,000 occupied households will yielda probability sample of about 127,000 persons.
The NHIS sample is so designed that it can serve as asample frame for other NCHS population-based surveys.Four national subdesigns, or panels, constitute the fullNHIS sample design. Each panel contains a representativesample of the U.S. civilian noninstitutionalized popula-tion. All four panels have identical sampling properties,and any combination of panels defines a national design.Panels were constructed to facilitate the linkage of theNHIS to other surveys and also to efficiently make largereductions in the size of the sample by eliminating panelsfrom the survey when budgetary constraints make thisnecessary.
In 1988, the NHIS sample consisted of 8,435 segmentscontaining 62,106 assigned households. Of the 50,061households eligible for interview, 47,485 households actu-ally were interviewed, resulting in a sample of 122,310persons. The total noninterview rate was 5.1 percent;3.0 percent was the result of respondent refusal, and theremainder was primarily the result of failure to locate aneligible respondent at home after repeated calls.
Collection and processing of dataThe NHIS questionnaire contains two major parts:
The first, the basic health and demographic component,consists of topi,:s that remain relatively unchanged fromyear to year. Among these topics are the incidence ofacute conditions, the prevalence of chronic conditions,persons limited in activity due to impairment or healthproblems, and utilization of health care services involving
physician care and short-stay hospitalization. The secondpart, a special topics component, consists of additionaltopics that change from year to year.
Careful procedures are followed to ensure the qualityof data collected in the NHIS interview. Most householdsin the sample are contacted by mail before the interviewerarrives. Potential respondents are informed of the impor-tance of the survey and assured that all informationobtained in the interview will be held in strict confidence.Interviewers make repeated trips to a household when arespondent is not found on the first visit. The success ofthese procedures is indicated by the response rate for thesurvey, which has been between 95 and 98 percent overthe years.
When contact is made, the interviewer attempts tohave all family members of the housnhold aged 19 yearsand over present during the interview. When this is notpossible, proxy responses for absent family members areaccepted. In most situations, proxy respondents are usedfor persons under 19 years of age. Persons 17 and 18 yearsof age may respond for themselves, however.
Interviewers undergo extensive training and retrain-ing. The quality of their work is checked by means ofperiodic observation and by reinterview. Their work also isevaluated by statistical studies of the data they obtain intheir interviews. A field edit is performed on all com-pleted interviews so that if there are any problems withthe information on the questionnaire, respondents may berecontacted to solve the problem.
Completed questionnaires are sent from the U.S.Bureau of the Census field offices to NCHS for codingand editing. To ensure the accuracy of coding, a 5-percentsample of all questionnaires is recoded and keyed by othercoders. A 100-percent verification procedure is used ifcertain error tolerances are exceeded. Staff of the Divisionof Health Interview Statistics then edit files to removeimpossible and inconsistent codes.
Estimation procedures
The complex, multistage probability sample utilizedby the NHIS must be reflected in the derivation ofsurvey-based estimates. For this report, 1988 NHISCH(National Health Interview Survey on Child Health) sam-ple person counts were weighted to produce nationalestimates. The weight for each sample child was derivedfrom his or her final annual weight on the core NHIS. Thisweight is the product of up to four components:
1. Probability of selection. The basic weight for eachNHIS respondent is obtained by multiplying the recip-rocals of the probabilities of selection at each step ofthe design; PSU, segment, and household.2. Household nonresponse adjustment within segment.Because of household nonresponse on the basic NHIShealth and demographic questionnaire, a weightingadjustment is required. The nonresponse adjustmentweight is a ratio with the number of households in a
2115

sample segment as the numerator and the number ofhouseholds actually interviewed in that segment as thedenominator. This adjustment reduces bias in arestimate to the extent that persons in the noninter-viewed households have the same characteristics 'As
persons in interviewed households in the samesegment.3. First-stage ratio adjustment. The weight for persons
in the non-self-representing PSU's is ratio adjusted to
the 1980 population within four race-residence classes
of the non-self-representing strata within each geo-graphic region.4. Poststraufication by age-race-sex. Within each of the
16 age-race-sex cells (table I), a weight is constructed
each quarter to adjust the first-stage population esti-mates based on the NHIS to an independent estimate
of the population of each cell. These independentestimates are prepared by the U.S. Bureau of theCensus and are updated quarterly.
Table I. Age-race-sex postatratIfIcatIon cells for the 1988 NationalHealth IntervIew Survey on Child Health
Race and sex
Age in years
0-4 5-9 10-14 15-17
Black
Male X
Female X
All other
Male X X X X
Female X X X X
The main effect of the ratio-adjustment process (3above) is to make the sample more closely representative
of the target population by age, sex, race, and residence.
The poststratification adjustment helps to reduce the
component of bias resulting from sampling frame under-
coverage; furthermore, this adjustment frequently reduces
sampling variance.In some households responding to the basic health
and demographic component of the NHIS, there is nonre-
sponse to the special topic questionnaire. Although the
NHIS estimation procedures include no separate adjust-ment factor to reduce the bias due to this type of nonr--
sponse, the poststratification by age-race-sex also serves to
reduce the nonresponse bias in estimates derived from the
special topics sections, to the extent that nonrespondents
to the special topics questionnaire are similar to respon-dents in each poststratification adjustment cell.
Reliability of estimates
Because NHIS estimates are based on a sample, they
may differ somewhat from the figures that would have
been obtained if a complete census had been taken usingthe same survey and processing procedures. There are two
types of errors possible in an estimate based on a sample
survey: Sampling and nonsampling errors. To the extent
16
possible, these types of errors are kept to a minimum bymethods built into the survey procedures described earlier(11). Although it is very difficult to measure the extent of
bias in the NH1S, several studies have been conducted toexamine this problem (12-16).
Nonsampling errors
Interviewing process Information, such as the number
of days of restricted activity caused by a condition, can be
obtained mor0 accurately from household members than
from any other source because only the persons concernedare in a position to report this information. However,
there are limitations to the accuracy of the diagnostic and
other information collected in household interviews. For
example, for diagnostic information, the household re-spondent can usually pass on to the interviewer only theinformation the physician has given to the family. Forconditions not medically attended, diagnostic information
is often no more than a description of symptoms. Further,
a respondent may not answer a question in the intended
manner because he or she has not properly understood
the question, has forgotten the event, does not know, ordoes not wish to divulge the answer. Regardless of the
type of measure, all NHIS data are estimates of known
reported morbidity, disability, and so forth.Reference period bias NHIS estimates do not repre-
sent a complete measure of any given topic during the
specified calendar period because data are not collected in
the interview for persons who died or became institution-
alized during the reference period. For many types ofstatistics collected in the survey, the reference period isthe 2 weeks prior to the interview week. For such a short
period, the contribution by decedents to a total inventory
of conditions or services should be very small. However,
the contribution by decedents during a long reference
period (such as 1 year) might be significant, especiallywithin older age groups.
Population estimate Some of the published tablesinclude population figures for specified categories. Exceptfor overall totals for the 16 age, sex, and race groups,which are adjusted to independent estimates, these figures
are based on the sample of households in NHIS. They are
given primarily to provide denominators for rate compu-tation and for this purpose they are more appropriate foruse with the accompanying measures of health character-
istics than other population data that may be available.With the exception of the overall totals by age, sex, and
race mentioned above, the population figures may differ
from figures (which are derived from different sources)published in reports of the U.S. Bureau of the Census.Official population estimates are presented in the U.S.Bureau of the Census reports in Series P-20, P-25, and
P-60.Rounding of numbers In published tables, the figures
are rounded to the nearest thousand, although they are
not necessarily accurate to that detail. Derived statistics,
such as rates and percent distribution, are computed after

the estimates on which they are based have been rounded Table III. Number of children 17 years of age and under, byselected characteristics: United States, 1988
to the nearest thousand.
Sampling errors
The standard error is the primary measure of sam-pling errors, that is, the variation that might occur bychance because only a sample of a population is surveyed.The chances are about 68 in 100 that an estimate based ona sample would differ from that obtained from a completecensus by less than 1 standard error. The chances areabout 95 in 100 that the difference between a sample-based and a census estimate would differ by less thantwice the standard error of the estimate and about 99 in100 that it would differ by less than a factor of 2.5.
Indivioual standard errors were not computed foreach estimate in this report. Instead, standard errors werecomputed for a broad spectrum of estimates. Regressiontechniques were then applied to produce equations fromwhich a standard error for any estimate can be approxi-mated. Rules explaining their use are presented in thesection below.
The reader is cautioned that this procedure will givean approximate standard error of an estimate rather thanthe precise standard error. The -eader is further cau-tioned that particular care should be exercised when thedenominator is small.
General rules for determining standard errorsTo produce approximate standard errors for NHIS
estimates in this report, the reader must first determinethe type of estimate for which the standard error isneeded. For each percent p included in this report, thestandard error can be estimated as
SE(p) V(8,307p) (100 - p)=
where y is the estimated base of the percent. The basesof the percents are shown in tables II and III. For theestimated rates in this report, approximate standarderrors are determined using the formula
CharacteristicNumber inthousands
Family IncomeLess than $10,000
7,924$10.000--$19,99910,911$20.000434,99917,022$35,000 or more20,582
Child has usual source of routine health careYes
55.970No5,119
Health insurance coverageYes
46.620No15,205
Geographic regionNortheast
11,621Midwest16,574South22.149West13,225
SE(p) = p VILE x)2 SE(y)2x2 y2
where p is the estimated rate expressed as the ratio oftwo estimates, p = xly (inflated by 100 whenappropriate). SE(x) and SE(y) are computed from thefollowing formulas
S E(x) V0.000075598:: + 8,307xand
SE(y) 0.000075598y2 + 8,307yand x and y are obtained from tables IV-VIII.
The approximate standard error of the differencebe.aveen two statistics (rate or percent) is given by theformula
SE(x, - x2) =VSE(x1)2 + SE(x,)2
where x1 and x2 are the two estimates being compared,x1 - x2 is the difference between them, and SE(x1) andSE(x2) are the standard errors for the two estimates.
Table II. Number of children 17 years of age and under, by age, sex, race, and Hispanic origin: United States, 1988
Sex, race and Hispanic origin
All ages,17 years
and under0-4
yearsUnder1 year
1-4years
5-11years
12-17years
Number In thousandsAll children63.569 18.424 3,858 14,566 24,649 20.495Sex
Male32,526 9.439 2,041 7,396 12,445 10,642
Female31,043 8.988 1,818 7.168 12,204 9,854Race and Hispanic origin
White non-HIspanic44,645 12,836 2,562 10,274 17,325 14,485
Black non-Hispanic9,640 2.687 619 2,068 3.708 3.145
Hispanic7,329 2,193 502 1.891 2.863 2,182
, !EST COPY AVAILABLE
2317

Table IV, Number of children 17 years of age and under with select:Id infectious diseases In the past year, by selected characteristics:
United States, 1988Disease
Characteristic
Repeatedear
infectionRepeatedtonsillitis Pneumonia
Bladder orurinary tract
infection
Frequentdiarrheaor colitis
Mono-nucleosis
Number In thousands
All children5,735 2,975 1,090 974 863 304
Age
0-4 years2,951 521 521 245 571 "23
5-11 years2,093 1,411 348 429 172 *61
12-17 years692 1,043 221 299 119 220
Sex and age
Male3,055 1,347 638 156 515 151
0-4 years1,648 288 341 "64 333 '16
5-11 years1,097 684 192 "53 100 '22
12-17 years310 375 105 '39 "82 114
Female2,680 1,628 453 817 348 153
0-4 years1,303 233 179 181 238
7
5-11 years995 727 157 376 73 "40
12-17 years382 668 116 260 "38 106
Race and Hispanic origin
White non-Hispanic4,566 2,372 893 814 603 286
Black non-Hispanic557 234 118 93 123
Hispanic527 314 '61 *45 99 '10
Family income
Less than 510,000710 410 204 130 159 *2
510,000-$19,999974 560 145 192 192 '62
520,000-534,9991,630 760 354 290 234 '88
$35,000 or more.1.985 951 293 289 232 132
ChiM has usual source of routine health care
Yes5,437 2.656 1.030 992 776 288
No195 230 48 '30 73 *14
Health insurance coverage
Yes4,464 2,332 790 731 605 282
No1,222 617 300 233 244 "21
'Geographic region
Northeast1,155 492 158 105 114 "50
Midwest1,589 830 324 291 202 99
South1,995 1,120 401 418 359 98
West997 525 206 160 189 '56
Table V. Number of bed days in the past year for children with selected infectious diseases, by age, sex, race, and Hispanic origin:
United States, 1988Disease
Charactenstic
Repeatedear
infectionRepeatedtonsillitis Pneumonia
Bladder orurinary tract
infection
Frequentdiarrheaor colitis
Mono-nucleosis
Number in thousands
All children9,711 8,194 5,198 1,428 975 2,148
Age
0 4 years5.545 1,308 2.103 316 465 *35
5-11 years2,932 3,700 1,524 435 400 789
12-17 years1,234 3,187 1,570 677 110 1,323
Sex
Male .
5.395 3.292 3.110 243 697 741
Female .. ' 4,316 4,902 2,088 1.185 278 1,407
Race and Hispanic origin
White non-Hispanic6,981 6,808 3,945 1,280 666 2,087
Black non-Hispanic .676 510 537 101 98 -
Hispanic. .
1,940 744 617 "29 208 '30
18

Table VI. Number of children with selected infectious diseases in the past year who attended school, by age, sex, race, and Hispanicorigin: United States, 1988
Disease
Characteristic
Repeatedear
infectionRepeatedtonsillitis Pneumonia
Bladder orurinary tract
infection
Frequentdiarrheaor colitis
Mono.nucleosis
Number In thousandsAll children3,213 2,522 624 730 325 276
Ago
0-4 years606 194 103 *59 '71 125-11 years
1,994 1,322 304 393 151 '6112-17 years6.741 1,007 217 277 103 203
SexMale
1.690 1,114 334 107 212 135Female1,523 1,408 290 623 113 142
Race and Hispanic originWhite non-Hispanic .
2,625 2,048 521 638 250 259Black non-HIspanic278 183 *71 65 '39Hispanic263 245 *24 '23 '35 '10
NOTE. Includes children in preschools ono nursery wools.
Table VII. Number of school-loss days In the past year for children with selected Infectious diseases, by age, sox, race, and Hispanicorigin: United States, 1988
Disease
Characteristic
Repeatedear
infectionRepeatedtonsilidis Pneumonia
Bladder orurinary tract
infection
Frequentdiarrheaor colitis
Mononucleosis
Number In thousandsAll children8,912 11,943 3.431 1,447 648 1.804
Age0-4 years
1,858 931 305 119 104 '255-11 years5.590 6,866 1,487 614 306 51412-17 years1.464 4,146 1.640 714 237 1,265
SexMale
4,490 4,925 1,774 228 323 767Female
4,422 7,117 1,667 1.219 324 1.037Race and Hispanic origin
White non-Hispanic7,409 10.191 2,632 1,221 487 1,715Black non-Hispanic
585 686 352 98 103Hispanic746 903 391 110 '56 *58
NOTE. Includes children in preschools and nursery schools.
19

Table VIII. Number of physician contacts in the past year for children with selected infectious diseeses, by age, sex, race, and Hispanic
origin: United States, 198811.17=wcalWamaamslosilW.EVO-Nelfilimassan 2..war-Vvel.1.0.1zEm-IMILa=ff.IMMal.a.MAMBIZI
Disease
InseseurgisaemflizalogroMaanTsveLli
tsasema.maarammarmeernImmaneniene*YES NIMEINIRISS2.60.T.N.ILE 313.113Miat4Mil..1111.
Characteristic
Ropeakkiear
infechenRepealedtonsillaiS Pneumonia
Madder orurinary ,'ract
infection
Fmcluontdiarrheaor colitis
Mono,nuctOOsts
Numbot In thousandS
All children24,119 8,515 2,544 2,235 1,758 846
Age
0-4 years .. 16.839 2263 1.286 590 1,481 69
5- 11 years . .
6,952 4.390 818 965 192 191
12-17 years1.328 1,862 440 680 *85 586
Sex
Male12.760 3.974 1.396 473 921 371
Female . .
11,359 4.541 1,148 1,762 838 474
Race and Hispanic origin
Whiia non-Hispanic . . .. .. 20,393 7.253 2,159 1,952 1.355 813
Black norhHispanic .1.551 399 177 187 692
Hispanic ...... .1,857 755 177 *76 293 16
NOTE. Excluees physic/ens seen *Ade nosettabzeo overnight
2

Appendix IIDefinitions of certainterms used in thisreport
Age The age recorded for each child is his or her ageat last birthday. Age was recorded in single years (inmonths, if under 1 year) arid grouped for presentation inthe tables. For almost 5 percent of the National HealthInterview Survey on Child Health (NHISCH) samplechildren, the age reported on the NHISCH questionnairediffered to some degree (not always by a full year) fromthe age that was recorded on the basic health and demo-graphic questionnaire. In all discrepant cases, the ageused in analysis is that recorded on the NHISCH.
Race The population is divided into three racialgroups "white," "black," and "all other." The last in-cludes Aleut, Eskimo, or American Indian; Asian orPacific Islander; and any other races. Characterization ofthe NHISCH sample child's race is based on the basicNHIS household respondent's characterization of thechild's racial background.
Hispanic origin Characterization of Hispanic origin isbased on the household respondent's description of thesample child's ancestry. Children classified as Hispanicinclude those whose ancestry was defined as Puerto Rican,Cuban, Mexican/Mexicano, Chicano, or other Hispanic.
Family income Each sample child is classified ac-cording to the total income of his or her family asrecorded on the NH1S basic health and demographicquestionnaire. The income recorded is the total of allincome received by family members in the 12-monthperiod preceding the week of interview. Income from allsources is included, for example, wages, salaries, rentsfrom property, pension, and help from relatives.
Geographic region For the purpose of classifying thepopulation by geographic area, the States are grouped intofour regions. These regions, which correspond to thoseused by the U.S. Bureau of the Census, are as follows:
Region States inchided
Northeast Maine, New Hampshire. Vermont,Massachusetts, RhodeConnecticut, New York, New Jersey,and Pennsylvania
Midwest Michigan, Ohio, Illinois, Indiana,Wisconsin, Minnesota, Iowa,
Missouri, North Dakota,South Dakota, Nebraska,and Kansas
South Delaware, Maryland, District ofColumbia, Virginia, West Virginia, NorthCarolina, South Carolina, Georgia,Florida, Kentucky, Tennessee, Alabama, Mis-sissippi, Arkansas, Louisiana,Oklahoma, and Texas
West Montana, Idaho, Wyoming,Colorado, New Mexico, Arizona,Utah, Nevada, Washington, Oregon,California, Hawaii, and Alaska
Usual source of routine care Sample children areclassified as having a usual source of routine health care ifthe respondent indicated that there was a particular clinic,health center, hospital, doctor's office, or other place thatthe child usually went for routine health care. Childrenwho reportedly had never received routine health carewere excluded from this classification.
Health insurance coverage Sample children are classi-fied as being covered by health insurance if the respond-ent indicated that the child was currently covered by ahealth insurance plan which pays any part of a hospital,doctor's, or surgeon's bill.
Limitation in activity because of selected infectious dis-eases A reduction in the child's ability to perform usualchildhood activities, such as playing with other children orparticipating in games or sports.
Bed dayA day during which the child stayed in bedmore than half a day because of illness. All hospital daysfor inpatients are considered bed days.
School-loss day A day on which a student missed allor part of a day from school in which he or she wascurren:ly enrolled. For the NHISCH, this included chil-dren enrolled in nursery schools or preschools.
Physician contact A physician contact is defined asconsultation with a physician, in person or by telephone,for examination, diagnosis, treatment, or advice. (Physi-cian contacts with hospital inpatients are not included.)The contact is considered to be a physician contact if theservice is provided directly by the physician or by a nurse
2721

or other person acting under a physician's supervision. For
the purpose of this definition, "physician" includes doc-
tors of medicine and osteopathic physicians. The term"doctor" is used in the interview rather than "physician"because of popular usage.
Hospital For the NHIS in general, a hospital is
defined as any institution either (a) named in the listing of
hospitals in the current American Hospital AssociationGuide to the Health Cure Field or (b) found on the
22
Master Facility List maintained by the National Center forHealth Statistics. For this report, children were classified
as hospitalized if they spent at least 1 night in a hospital.
Medication For this report, medication included
medicine, other than vitamins, prescribed or recom-mended by a doctor.
Relative risk The ratio of the incidence rate of adisease in one group to the rate for that disease in another
group.
28
* U S. GOVERNMENT PRINTING OFFICE: 1991 - 2 8 1 - 7 9 8 / 1 0 0 1 0

Vital and Health Statisticsseries descriptions
SERIES 1 Programs and Collection Procedures Reportsdescribing the general programs cf the National ('cinter forHealth Statistics and Its uffices and divisions ana the datacollecti.on metriods used. They also include aefiritions andotner material necessary for understanding the data.
SERIES 2. Data Evaluation and Methods Research Studies of newstatistical methodology including experimental tests of newsurvey methods, studies of vital statistics collectionmethods, new analytical techniques. objective evaivationsof reliability of collected data. and contributions to statisticaltheory. Studies also include comparison of U.S.methodology with those of other countries.
SERIES 3. Analytical and Epidemiological Studies Reportspresenting analytical or interpretive studies cased cr. vitaland health statistics. carrying !he anaiysis than tneexpository types of reports in the other series
SERIES 4, Documents and Committee Reports Final reports cfma1or committees concerned with vital and heaith statisticsana documents such as recorrmenaed rnociel vitalregistration laws arid revised birth ana death certificates.
SERIES 5. Comparative International Vital and Health StatisticsReports- Analytical and descrvive reports comparingU.S. vital and health statistics with those of other ccuntries
SERIES 6. Cognition and Survey Measurement - Reports 'ram !heNational Laboratory for Collaborative Research in Cognitionand Survey Measurement us.rg methods cl cognitivescience to design. evaluate, and test su!yey instruments
SERIES 10. Data From the National Health interview Survey -Statistics on illness, accidental ir!uries. d;saaiiity use athospital. rnecical. cental, and other services. and otrerhealth-related toDics, all basea or aata coilectra in :recontinuing national housenold nterview survey
SERES 11 Data From the National Health Examination Survey andthe National Health and Nutrition Examination SurveyData from direct examination. testing. and measurement ctnatiorai samples of tne civiiian roninstitutionalireapopulation provide !he oas,s 'or 0) estimates of th.emedically defined prevalence of saecific diseases in vieUnited States and the aistribut:ons of 1"e acouiation withrespect to physical, physiological. and Psychologicalcharacterist,cs and ,2) analys,s of relatenships among thevarious measurements without reference to an explicit finiteuniverse of Persons
SENES 12
SERIES 13.
SERIES 14
Data From the Institutionalized Population SurveysDiscontinued in :375. P.vPortf:, -cm :nese :;umieys areincluded in Series 13
Data on Health Resources Utilization Statistics cn tneutthzation of health manpower and facilities Providing long.term care, ambulatory care, hospitai care, and familyalarming services.
Data on Health Resou..ces: Manpower and FacilitiesStatistics on the numbers. geographic a stribution. andcharacteristics of health resources including physicians.dentists, nurses, otner health occupations, hospitals,nursing nomes. and outpatient tac iities.
-)4.. a
SERIES 15. Data From Special Surveys Statistics on health andhealth-related topics collected in special surveys that arerot a part ot the continuing lata systems of the NationalCenter for Health Statistics.
SERIES 16. Compilations of Advance Data From Vital and HealthStatistics - These reports Provide early release of datafrom the National Center for Health Statistics' health anddemographic surveys. Many of these releases are followedby detailed reports in the Vital and Heath Statistics Series.
SERIES 20. Data on Mortality - Various statistics on mortality otherthan as included In regular annual or monthly reports.Special analyses by cause of death. age, and otherdemographic variables: geographic and 1:rne seriesanalyses, and statistics on characteristics of death notavailable from the vital records based on sampie surveys ofthose records.
SERIES 21 Data on Natality, Marriage, and Divorce -Variousstatistics on natality, marriage, and divorce other than asincluded in regular annual or monthly reports. Specialanalyses by demographic variables: geographic and timeseries analyses: studies of fertility: and statistics oncharacteristics of births 'not available from the vital recordsbased on sample surveys of those records
SERIES 22. Data From the National Mortality and Natality SurveysDiscontinued in 1975. Reports from these sample surveysbased on vital records are included in Series 20 and 21,respectively.
SERIES 23. Data From the National Survey of Family GrowthStatisucs on fert!:ty family formation and dissciu: on. familiyplanning. anc related maternal and infant health toc:csaervec from a per.ocic survey c a rationwice oropac.. tvsamp:e of women 15.44 years cf age.
SERIES 24 Compilations of Data on Natality, Mortality, Marriage.Divorce, and Induced Terminations of PregnancyAdvance reports of births, deaths, marriages. anc mvorcesare based on hat cata 'Tom the Nat orai Vital StatisticsSystem ana are Cuplisnea annually as supp;errents to theMortnly V-tal Statistics Report IMVSR1. These Tecarts arefollowed by the publication of Cleta:lec data .r1 V.talStatist.cs of the united States annuat .o.umes Otherreports including induced terminations of pregnancy ssuedperiodica .y as siuoplements to t,,e MVSR provide seiectedfindings based on data from tre National V tal StatisticsSystem and hnav Pe followea by detalied reports in vita!and Hea.th Stat.s: cs Series.
or ansv..ets O oi-estIons =cut this wort or fcr a st cf t:es o' eportsPuplished in these series. contact:
Scientific ana Tecnnzai lnformat.on BranchNational Center for Health StatisticsCenters for Disease ControtPublic Health Serv.ce6525 Belcrest Road. Room 1064Hyattsville. Md :0782
301-43643500

DEPARTMENT OFHEALTH & HUMAN SERVICES
Public Health ServiceCenters for Disease ControlNational Center for Health Statistics6525 Be !crest RoadHyattsville, Maryland 20782
OFFICIAL BUSINESSPENALTY FOR PRIVATE USE, $300
DHHS Publication No. (PHS) 91-1508, Series 10. No. 180 30
BULK RATEPOSTAGE & FEES PAID
PHS/NCHS i1
PERMIT NO. G-281 1
,

IM
U.S. Dept. of Education
Office of EducationalResearch and Improvement (0ERI)
immnlA°_ .../Date Filmed
August 12, 1992