Embed Size (px)
Citation preview
Figure 25. Polar plots showing azimuthal square-array direct-current resistivity at site 3 for arrays 1 and 2, Pelham, N.H. Apparent resistivity in ohm meters (Ω m), is plotted as a function of azimuth, in degrees east of true north; (A) resistivity of square array 1, center at 200 Ω m; (B) resistivity of square array 2, center at 200 Ω m. Site and array locations are shown on figures 1 and 20, respectively.
Near-horizontal features in bedrock that cannot be identified with a lineament analysis were indicated by 2-D resistivity surveys. These near-horizontal features are identified as sheeting fracture zones, which may enhance the transmissivity of near-vertical fracture zones.
Site 4, Goffstown, New Hampshire
Site 4 on Mountain Road in Goffstown, N.H., is set in a grassy field and wooded terrain. The site is on the south side of North Uncanoonuc Mountain, and ranges in elevation from about 850 to 930 ft between survey lines. Bedrock geology of this area consist of two variations of the Rangeley Formation, biotite schist and granofels, and rusty biotite-muscovite schist (fig. 26) (T.R. Armstrong and W.C. Burton, U.S. Geological Survey, written commun., 1999). The bedrock is exposed at the surface on the northern part of the study area. The overburden at this site is mapped as a till, which is unsorted to poorly sorted clay silt, sand, pebbles, cobbles and boulders, with some gravel (Koteff, 1970). Lineaments at the site
30 Geophysical Investigations of Well Fields to Characterize F
were identified from LOWALT and HIGHALT aerial photography (Ferguson and others, 1997) trending 27° (fig. 26). These lineaments were fracture correlated by domain-analysis techniques (R.B. Moore and others, U.S. Geological Survey, written commun., 2001). Fracture data in a 4,000-ft radius of the site has five peak orientations: 55°±9° (100 percent, normalized height), 315°±8° (87 percent, normalized height), 272°±11° (75 percent, normalized height), 24°±7° (57 percent, normalized height), and 335°±5° (64 percent, normalized height).
Well GNW 406 (fig. 26), drilled to a depth of 500 ft, has a reported yield of 75 gal/min. The static water level was at a depth of approximately 10 ft after drilling in April 1997, and was at a depth of 64 ft during the borehole-geophysical surveys in December 2000. The drillers’ log indicates that the high-yield water-bearing zone is between 420 and 500 ft deep. Probabilities of exceeding a yield of 40 gal/min from a 400-ft deep well at this site ranged from 10 to 38 percent. A 38-percent probability is calculated for the 98.4-ft (30-m) square cell that well GNW 406 is in (R.B. Moore and others, U.S. Geological Survey,
ractured-Bedrock Aquifers in Southern New Hampshire

Figu
re 2
6. G
eoph
ysic
al s
urve
y lo
catio
ns, b
edro
ck g
eolo
gy, a
nd li
neam
ents
at s
ite 4
, Gof
fsto
wn,
N.H
. Si
te lo
catio
n is
sho
wn
on fi
gure
1.
ANALYSIS AND RESULTS OF GEOPHYSICAL INVESTIGATIONS OF WELL FIELDS 31

written commun., 2001). Variations in probability at the site are caused by fracture-correlated lineaments and topography. Two geophysical-survey lines were located to bisect lineaments on either side of the well. Line 1, extending 440 ft from west to east is in the field to the north of the well. Line 2 is in the woods to the south of the well, extending 440 ft from west to east. Array 1 was set on line 1 centered at 190 ft (fig. 26).
Geophysical Surveys and Interpretation
Six surface and six borehole-geophysical surveys were used to characterize site 4 (figs. 27-31). Overburden thickness and physical properties were derived from GPR, EM, and 2-D resistivity survey results. Magnetometer, VLF, surface EM, 2-D resistivity, square-array resistivity, and borehole- geophysical survey results were used to determine bedrock properties, and identify anomalies that could be caused by bedrock fractures. Borehole-geophys-ical surveys including caliper, fluid temperature and resistivity, and EM borehole logs were used to charac-terize and help identify bedrock features seen in the OTV logs.
GPR was collected on lines 1 and 2. Line 1 was surveyed using a continuous profile method, taking advantage of the open field. Subsurface near-horizontal reflectors are seen throughout the line up to 20 ft in depth. Line 2 was collected using a point survey and did not yield consistent reflectors.
Magnetometer measurements were made along line 2 at site 4 (fig. 28a). The average magnetic field measured at this site during the survey is 352 nT. The magnetic field along the line 2 gradually rises, except for a low anomaly of approximately 340 nT between 250 and 330 ft (fig. 28a).
VLF tilt-angle surveys were made at lines 1 and 2. VLF tilt-angle inflections from line 1 are seen at 125, 225, and 335 ft (fig. 27a). VLF tilt-angle survey results from line 2 are obscured by interference from near-by overhead power lines and are not useful (fig. 28b).
EM surveys were collected on both lines at site 4. Line 1 VD anomalies (fig. 27c) that could indicate near-vertical conductors were seen at 160, 230, and 310 ft. VD survey results from line 2 (fig. 28c) indicated anomalies centered at 195 and 380 ft.
Models were created to check interpretation of the 2-D resistivity survey data at lines 1 and 2. Resistivity data from line 1 indicate there are three
32 Geophysical Investigations of Well Fields to Characterize Fr
Figure 27. Magnetic and electromagnetic surveys at site 4 from line 1, Goffstown, N.H. (A) very low frequency (VLF) electromagnetic survey; (B) electromagnetic (EM) terrain conductivity survey with a 20-meter (65.6-foot) coil spacing. Site and line locations are shown on figures 1 and 26, respectively.
primary units, which likely represent unsaturated overburden and resistive competent and conductive fractured bedrock. A model fit with the field data was obtained by placing the water-table surface in the fracture zones below the top of bedrock at a depth between 40 and 50 ft (relative elevation between 80 and 90 ft). Near-vertical conductive features below the interpreted bedrock surface are interpreted at 190 and 315 ft. Several horizontal conductive features also were interpreted in the bedrock (fig. 29).
2-D resistivity results from line 2 indicate four units that likely represent resistive unsaturated and conductive saturated overburden, resistive competent
actured-Bedrock Aquifers in Southern New Hampshire

Figure 28. Magnetic and electromagnetic surveys at site 4 from line 2, Goffstown, N.H. (A) magnetometer survey; (B) very low frequency (VLF) electromagnetic survey; (C) electromagnetic (EM) terrain conductivity survey with a 20-meter (65.6-foot) coil spacing. Site and line locations are shown on figures 1 and 26, respectively.
Figure 29. Cross sections showing (A and B) inverted resistivity sections of two-dimensional, direct-current resistivity data at site 4 from line 1, Goffstown, N.H.; (C) model based on field data from A and B; and (D and E) synthetic resistivity output data from Model C. Site and line locations are shown on figures 1 and 26, respectively.
ANALYSIS AND RESULTS OF GEOPHYSICAL INVESTIGATIONS OF WELL FIELDS 33
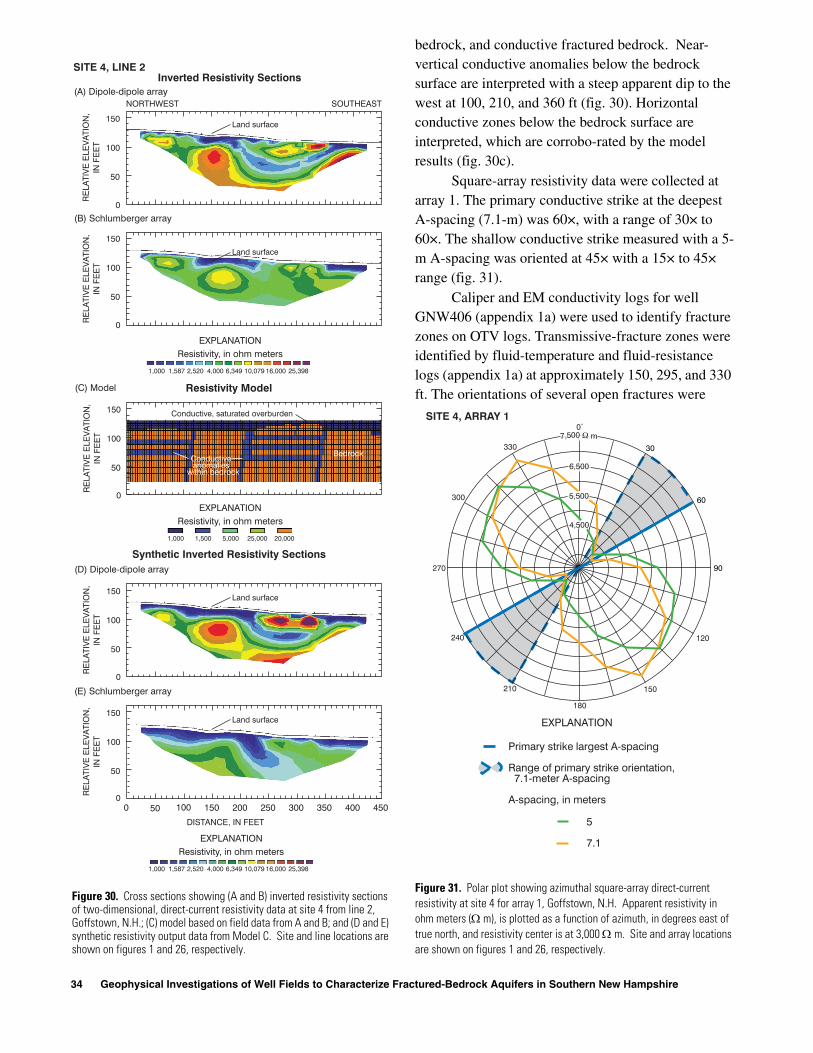
Figure 30. Cross sections showing (A and B) inverted resistivity sections of two-dimensional, direct-current resistivity data at site 4 from line 2, Goffstown, N.H.; (C) model based on field data from A and B; and (D and E) synthetic resistivity output data from Model C. Site and line locations are shown on figures 1 and 26, respectively.
bedrock, and conductive fractured bedrock. Near-vertical conductive anomalies below the bedrock surface are interpreted with a steep apparent dip to the west at 100, 210, and 360 ft (fig. 30). Horizontal conductive zones below the bedrock surface are interpreted, which are corrobo-rated by the model results (fig. 30c).
Square-array resistivity data were collected at array 1. The primary conductive strike at the deepest A-spacing (7.1-m) was 60×, with a range of 30× to 60×. The shallow conductive strike measured with a 5-m A-spacing was oriented at 45× with a 15× to 45× range (fig. 31).
Caliper and EM conductivity logs for well GNW406 (appendix 1a) were used to identify fracture zones on OTV logs. Transmissive-fracture zones were identified by fluid-temperature and fluid-resistance logs (appendix 1a) at approximately 150, 295, and 330 ft. The orientations of several open fractures were
Figure 31. Polar plot showing azimuthal square-array direct-current resistivity at site 4 for array 1, Goffstown, N.H. Apparent resistivity in ohm meters (Ω m), is plotted as a function of azimuth, in degrees east of true north, and resistivity center is at 3,000 Ω m. Site and array locations are shown on figures 1 and 26, respectively.
34 Geophysical Investigations of Well Fields to Characterize Fractured-Bedrock Aquifers in Southern New Hampshire
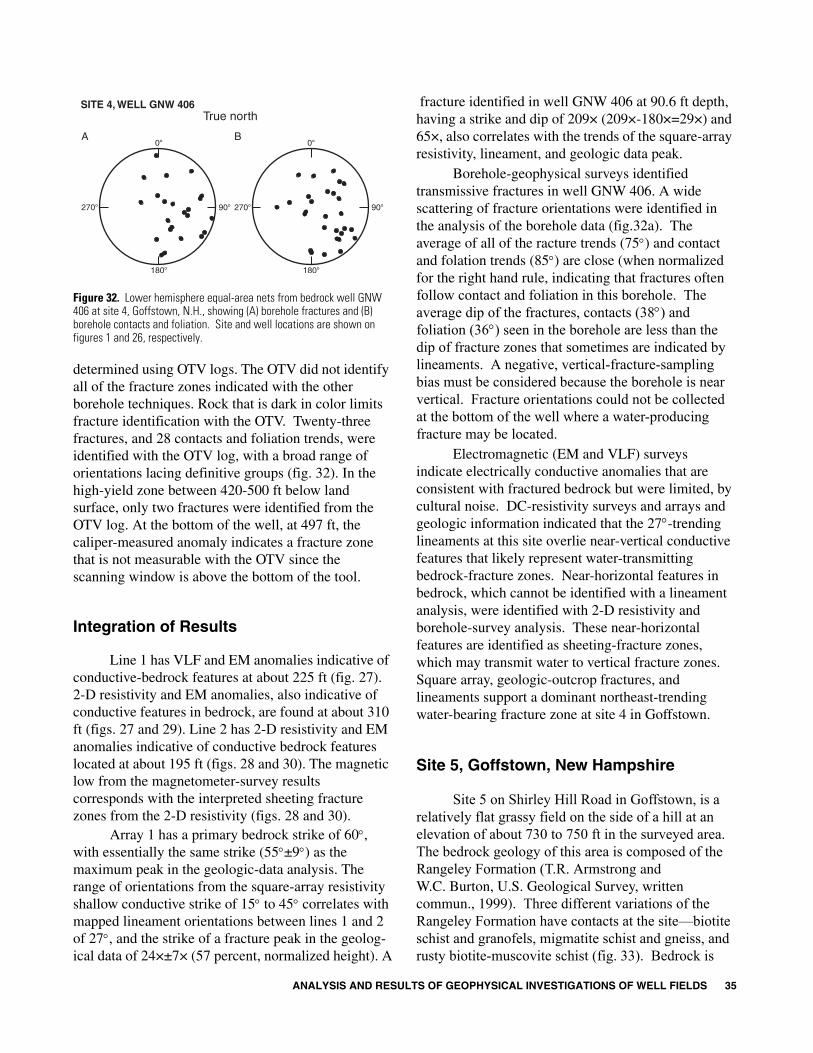
Figure 32. Lower hemisphere equal-area nets from bedrock well GNW 406 at site 4, Goffstown, N.H., showing (A) borehole fractures and (B) borehole contacts and foliation. Site and well locations are shown on figures 1 and 26, respectively.
determined using OTV logs. The OTV did not identify all of the fracture zones indicated with the other borehole techniques. Rock that is dark in color limits fracture identification with the OTV. Twenty-three fractures, and 28 contacts and foliation trends, were identified with the OTV log, with a broad range of orientations lacing definitive groups (fig. 32). In the high-yield zone between 420-500 ft below land surface, only two fractures were identified from the OTV log. At the bottom of the well, at 497 ft, the caliper-measured anomaly indicates a fracture zone that is not measurable with the OTV since the scanning window is above the bottom of the tool.
Integration of Results
Line 1 has VLF and EM anomalies indicative of conductive-bedrock features at about 225 ft (fig. 27). 2-D resistivity and EM anomalies, also indicative of conductive features in bedrock, are found at about 310 ft (figs. 27 and 29). Line 2 has 2-D resistivity and EM anomalies indicative of conductive bedrock features located at about 195 ft (figs. 28 and 30). The magnetic low from the magnetometer-survey results corresponds with the interpreted sheeting fracture zones from the 2-D resistivity (figs. 28 and 30).
Array 1 has a primary bedrock strike of 60°, with essentially the same strike (55°±9°) as the maximum peak in the geologic-data analysis. The range of orientations from the square-array resistivity shallow conductive strike of 15° to 45° correlates with mapped lineament orientations between lines 1 and 2 of 27°, and the strike of a fracture peak in the geolog-ical data of 24×±7× (57 percent, normalized height). A
fracture identified in well GNW 406 at 90.6 ft depth, having a strike and dip of 209× (209×-180×=29×) and 65×, also correlates with the trends of the square-array resistivity, lineament, and geologic data peak.
Borehole-geophysical surveys identified transmissive fractures in well GNW 406. A wide scattering of fracture orientations were identified in the analysis of the borehole data (fig.32a). The average of all of the racture trends (75°) and contact and folation trends (85°) are close (when normalized for the right hand rule, indicating that fractures often follow contact and foliation in this borehole. The average dip of the fractures, contacts (38°) and foliation (36°) seen in the borehole are less than the dip of fracture zones that sometimes are indicated by lineaments. A negative, vertical-fracture-sampling bias must be considered because the borehole is near vertical. Fracture orientations could not be collected at the bottom of the well where a water-producing fracture may be located.
Electromagnetic (EM and VLF) surveys indicate electrically conductive anomalies that are consistent with fractured bedrock but were limited, by cultural noise. DC-resistivity surveys and arrays and geologic information indicated that the 27°-trending lineaments at this site overlie near-vertical conductive features that likely represent water-transmitting bedrock-fracture zones. Near-horizontal features in bedrock, which cannot be identified with a lineament analysis, were identified with 2-D resistivity and borehole-survey analysis. These near-horizontal features are identified as sheeting-fracture zones, which may transmit water to vertical fracture zones. Square array, geologic-outcrop fractures, and lineaments support a dominant northeast-trending water-bearing fracture zone at site 4 in Goffstown.
Site 5, Goffstown, New Hampshire
Site 5 on Shirley Hill Road in Goffstown, is a relatively flat grassy field on the side of a hill at an elevation of about 730 to 750 ft in the surveyed area. The bedrock geology of this area is composed of the Rangeley Formation (T.R. Armstrong and W.C. Burton, U.S. Geological Survey, written commun., 1999). Three different variations of the Rangeley Formation have contacts at the site—biotite schist and granofels, migmatite schist and gneiss, and rusty biotite-muscovite schist (fig. 33). Bedrock is
ANALYSIS AND RESULTS OF GEOPHYSICAL INVESTIGATIONS OF WELL FIELDS 35

Figu
re 3
3. G
eoph
ysic
al s
urve
y lo
catio
ns, b
edro
ck g
eolo
gy, a
nd li
neam
ents
at s
ite 5
, Gof
fsto
wn,
N.H
. Si
te lo
catio
n is
sho
wn
on fi
gure
1.
36 Geophysical Investigations of Well Fields to Characterize Fractured-Bedrock Aquifers in Southern New Hampshire

exposed in the northern most part of the surveyed area. The overburden at this site is till, which is unsorted to poorly sorted clay, silt, sand, pebbles, cobbles and boulders, with some gravel (Koteff, 1970). Mapped lineaments at the site were observed from LOWALT (Ferguson and others, 1997), and TOPO platforms trending 347° and 346°, respectively (fig. 33). These lineaments are visible at the site as swales trending about 340°. Fracture data in a 4,000-ft radius of the site has four peak orientations: 34°±7° (100 percent, normalized height), 301°±6° (32 percent, normalized height), 5°±7° (24 percent, normalized height), and 340°±11° (15 percent, normalized height). Fractures measured in an outcrop just south of the site on the side of Shirley Hill Road, have a strike and dip of 355° and 80°.
Well GNW 263 drilled to a depth of 150 ft has a reported yield of 80 gal/min. The static water level and bedrock are at a depth of 10 ft according to the drillers’ log. Well GNW 408 was installed for domestic use during this study and provided an opportunity for logging by a geologist during its drilling and a survey with borehole-geophysical tools. The depth of the till, at GNW 408, was 21 ft and the well was completed at 200 ft into bedrock. The well was completed shortly after the demand for domestic use was met and exceeded in this case. A 20-gal/min producing zone was identified during drilling between 170 and 175 ft, and is described as a contact between a muscovite-quartz-feldspar granofels and a muscovite biotite granofels (S.F. Clark, Jr., U.S. Geological Survey, written commun., 1999).
The probability of exceeding a yield of 40 gal/min from a 400-ft-deep well at this site ranged from 12 to 14 percent. A 14-percent probability is calculated for the 98.4-ft (30-m) square cell that well GNW 263 is in (R.B. Moore and others, U.S. Geolog-ical Survey, written commun., 2001). Well GNW 408 is in a cell with a 12-percent probability. Variations in probability at the site appear to be caused by topography. Two geophysical-survey lines bisect lineament locations. Line 1 is in a field to the southeast of the GNW 263 and line 2 is in a field to the east of the well. A center location for array 1 was set in the swale at 230 ft on line 1 (fig. 33).
Geophysical Surveys and Interpretation
Seven surface and six borehole geophysical surveys were used to characterize site 5. Overburden
thickness and physical properties were derived from GPR, EM, and 2-D resistivity survey results. Bedrock properties and anomalies that could be caused by bedrock fractures were observed in seismic-refraction, magnetometer, VLF, EM, 2-D resistivity and square-array resistivity, and borehole-geophysical survey results. Caliper, EM borehole, and a drillers’ log was used to characterize and help identify bedrock fractures measured with the OTV logs.
Seismic-refraction data were collected in two orientations separated by 90° at lines 1 and 2. The bedrock seismic-wave velocities were compared at each orientation. Seismic-refraction-data collection at lines 1 and 2 were centered at 220 and 135 ft along the lines. The average velocity of the seismic wave in bedrock along, and normal to, line 1 is 13,500 and 14,000 ft/s respectively, and do not indicate a large velocity contrast. The average velocity of the bedrock along line 2 is 14,000 ft/s, and the average velocity normal to line 2 is 11,500 ft/s, which are indicative of a contrast.
GPR data were collected at the two lines at site 5 using a continuous profile method. Electrically conductive till attenuated the radar signal and useful radar records could not be identified.
The average magnetic field measured at site 5 during the survey was 374 nT. Low magnetic anomalies of 250 nT between 30 and 60 ft, and of 350 nT between 200 and 250 ft were identified along line 1 (fig. 34a). Metal farm machinery parked on line 2 prevented a magnetic survey from being conducted.
VLF tilt-angle surveys were made at lines 1 and 2. Line 1 has VLF inflections at 130 and 155 ft (fig. 34b). Line 2 has an inflection centered at 165 ft (fig. 35a).
EM surveys also were collected on lines 1 and 2 at site 5. Apparent conductivity had a range from 26 to -28 mmho/m. Along line 1, an anomaly in the VD measurement that could be related to a near-vertical conductor was observed at 180 ft (fig. 34c). An additional EM survey done 50 ft to the south and parallel to line 1 produced similar results. The height of the peaks of the anomaly indicates a dip to the west. Along line 2, an anomaly in the VD measurement with a 20-m (65.6-ft) coil spacing that could be related to a near-vertical subsurface conductor was centered at 160 ft (fig. 35b). The height of the peaks of the anomaly is consistent with the line 1 anomalies, indicating a dip to the west. EM measurements with a 40-m (131.2 ft) coil spacing also were made along
ANALYSIS AND RESULTS OF GEOPHYSICAL INVESTIGATIONS OF WELL FIELDS 37

Figure 34. Magnetic and electromagnetic surveys at site 5 from line 1, Goffstown, N.H. (A) magnetometer survey; (B) very low frequency (VLF) electromagnetic survey; (C) electromagnetic (EM) terrain conductivity survey with a 20-meter (65.6-foot) coil spacing. Site and line locations are shown on figures 1 and 33, respectively.
Figure 35. Magnetic and electromagnetic surveys at site 5 from line 2, Goffstown, N.H. (A) very low frequency (VLF) electromagnetic survey; (B) electromagnetic (EM) terrain conductivity survey with a 20-meter (65.6-foot) coil spacing; (C) electromagnetic (EM) terrain conductivity survey with a 40-meter (131.2-foot) coil spacing. Site and line locations are shown on figures 1 and 33, respectively.
38 Geophysical Investigations of Well Fields to Characterize Fractured-Bedrock Aquifers in Southern New Hampshire

line 2 (fig. 35c). The 40-m-coil spacing surveys at a greater depth than the 20-m-coil spacing and indicates that a west-dipping anomaly continues at depth.
2-D resistivity surveys were done at lines 1 and 2. Models were used to verify interpretations of the data. Resistivity data from lines 1 and 2 show four resistivity units, likely representing resistive- unsaturated, and conductive-saturated sediments, and resistive-competent and conductive-fractured bedrock. Below the interpreted bedrock surface, at around 190 ft along the line, is a conductive anomaly penetrating into the bedrock (fig. 36). Resistivity data from line 2 (fig. 37) indicate a horizontal conductive feature between 140 and 180 ft at a depth of about 20 ft. A steep, west-dipping conductive feature in bedrock is interpreted at 160 ft (fig. 37).
Square-array resistivity data were collected at array 1. A-spacings of 5-40 m were used. Resistivity data from array 1 surveyed with a 40-m A-spacing has a primary conductive strike of 0°, and a secondary strike of 30°. The anomaly forming the secondary strike ranged from 15° to 45°. The surveys with small A-spacings indicate a primary conductive strike of 30° and a secondary conductive strike of 0° (fig. 38).
Caliper and EM conductivity logs were used in well GNW 408 to identify fracture zones on OTV logs (appendix 1b). A total of 12 fractures, including 6 open-fracture orientations were determined using the OTV log. Two groups of fractures (fig. 39a) that were identified on the OTV log, have a range of strikes and dips between 317-342° and 25-42°, dipping NE, and 202-225° and 22-51°, dipping NW. A group of contacts and foliation trends were identified that have a range of strikes and dips of 180-210° and 21-58°, dipping NW (fig. 39b). These trends indicate that the large group of fractures are coincident with foliation or contacts. A fracture on a contact that was identified as producing 20 gal/min during drilling from the OTV log has a strike and dip of 180° and 21°. Strong borehole EM-conductivity anomalies are identified above and below this water-bearing zone.
Integration of Results
Line 1 has conductive 2-D resistivity, EM, and VLF anomalies from 160-180 ft. Conductive anomalies on line 2 appear near 160 ft along the line from the results of 2-D resistivity, EM (20- and 40-m coil spacing) and VLF surveys. At site 5, a number of geophysical anomalies (VLF, EM, and 2-D resistivity)
were particularly distinct; the EM anomaly was especially large and distinct.
Conductive-striking bedrock features interpreted from square-array resistivity results have the same orientation as fractures identified in outcrop and remotely sensed lineaments. These features likely are related to fracture zones. The deep primary strike from array 1 of 0°±7.5 is less than 6.5° of the orientation of the lineament it is centered on, which has a strike of 347°, and is the same as fractures measured in outcrops adjacent to the site (355°, 80°). The secondary strike from array 1 has the same orientation as the axis of foliation seen in a neighboring outcrop, and coincides with the orienta-tion of the largest geologic-data fracture peak for the site. Secondary strikes in the square-array resistivity data, at depth, range from 15° to 45° and may be explained by a fold-axis trend of 43°. The LOWALT lineament between lines 1 and 2 strikes 347° and correlates with a small fracture peak from geological mapping data. This peak has a strike of 340°±11° (15 percent, normalized height).
Borehole-geophysical surveys identified a group of fractures with an average strike (330°) that matches a peak in the geologic-outcrop fracture data. This peak has a strike of 340°±11° (15 percent, normalized height).
Electromagnetic (EM and VLF) and DC-resistivity (2-D and square-array) surveys and geologic information indicate strong electrically conductive anomalies that are consistent with fractured bedrock. These surveys indicate that lineaments likely represent steep-westward-dipping conductive bedrock features. These features may represent fractured-bedrock zones likely to transmit water.
Site 6, Salem, New Hampshire
Site 6 on Brady Road in Salem, N.H., is a flat, and often wet, grassy field at an elevation of about 130 ft. The water table in the overburden at the site ranges in depth from 0-2 ft below the land surface. Overburden material at the site is mapped as a coarse-grained (medium sand to cobble gravel) stratified drift. Saturated thickness ranged from 20 to greater than 40 ft; transmissivity of the stratified-drift aquifer is between 1,001 and 4,000 ft2/d (Stekl and Flanagan, 1992). Lyons and others (1997) mapped the bedrock
ANALYSIS AND RESULTS OF GEOPHYSICAL INVESTIGATIONS OF WELL FIELDS 39