Embed Size (px)
DESCRIPTION
Fig. 16.11, p.497. T cos q. T cos q. 2 T sin q (Restoring force) SHM. Fig. 16.11, p.497. Fig. 16.7, p.491. x,y graph : A snapshot of the displacement at some time t. y vs t : Sit at a particular x and plot displacement as a function of time. Fig. 16.8, p.492. Fig. 16.18, p.501. - PowerPoint PPT Presentation
Citation preview

Slide 1 Fig. 16.11, p.497
Slide 2 Fig. 16.11, p.497
TcosTcos
2Tsin(Restoring force)
SHM
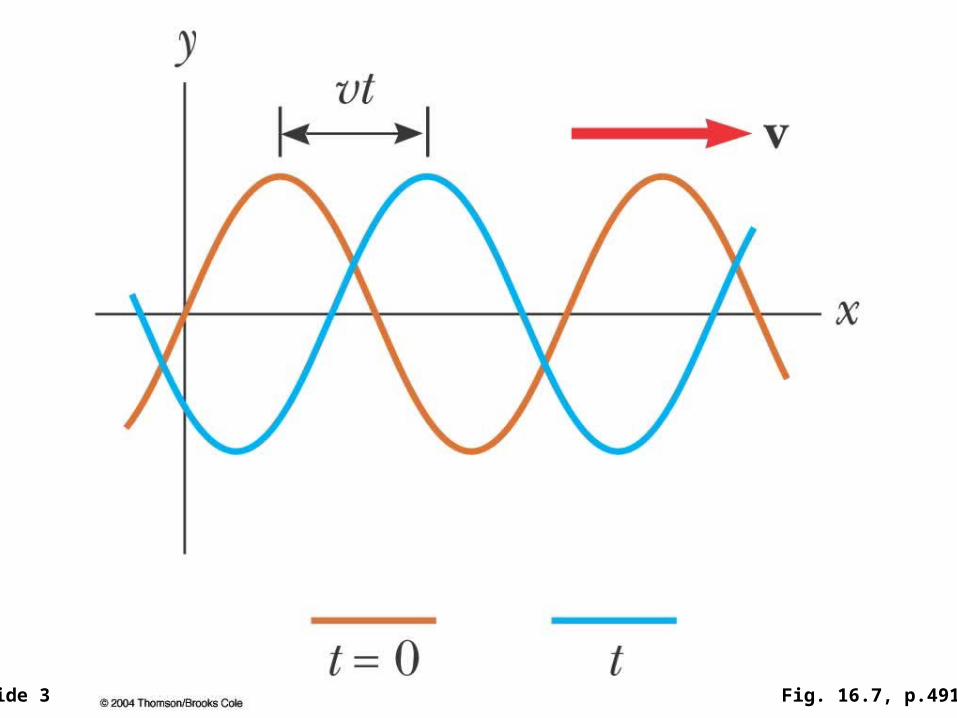
Slide 3 Fig. 16.7, p.491
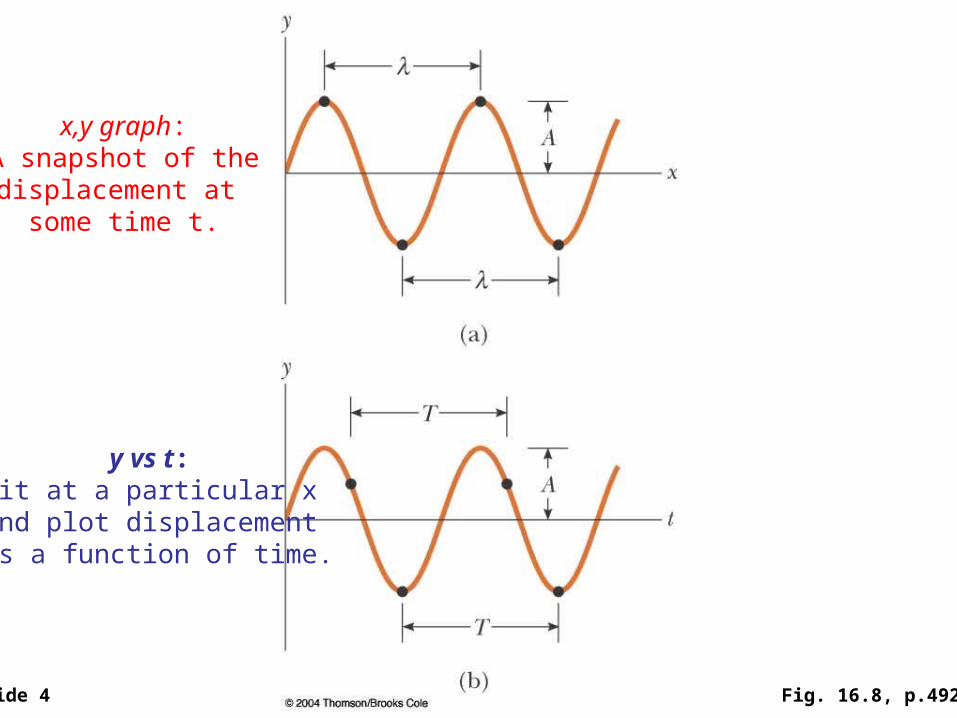
Slide 4 Fig. 16.8, p.492
x,y graph:A snapshot of the displacement at
some time t.
y vs t:Sit at a particular x
and plot displacement as a function of time.
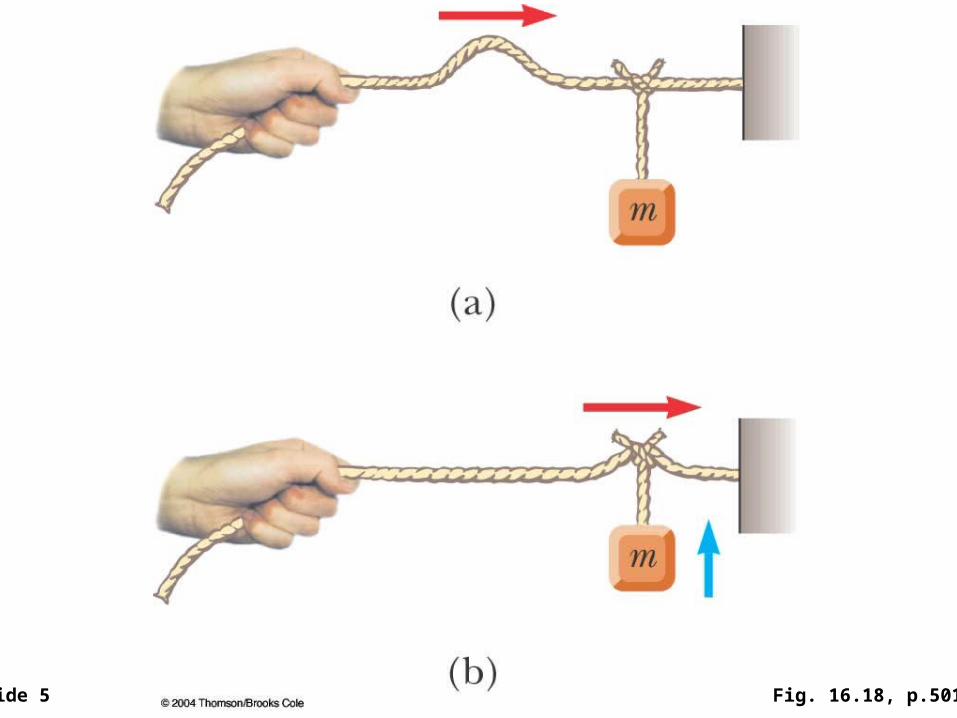
Slide 5 Fig. 16.18, p.501
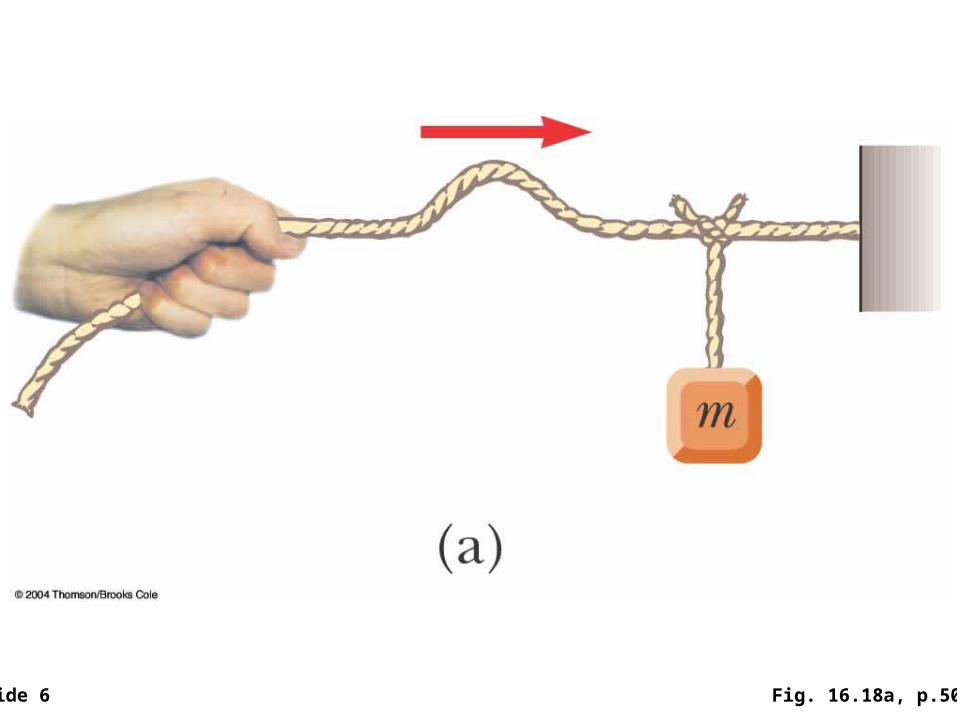
Slide 6 Fig. 16.18a, p.501
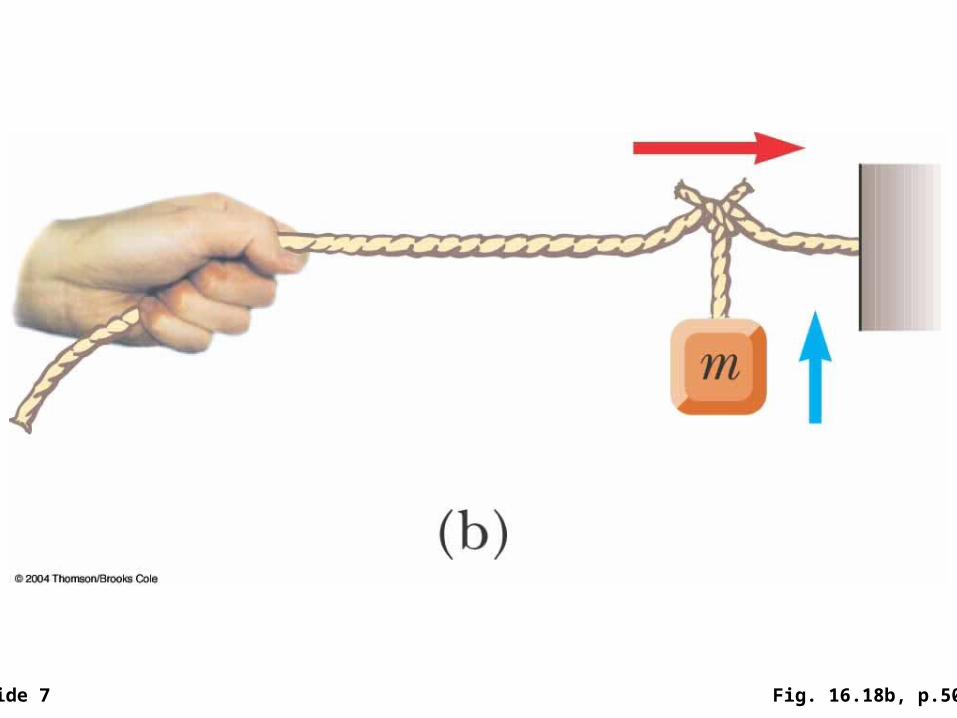
Slide 7 Fig. 16.18b, p.501
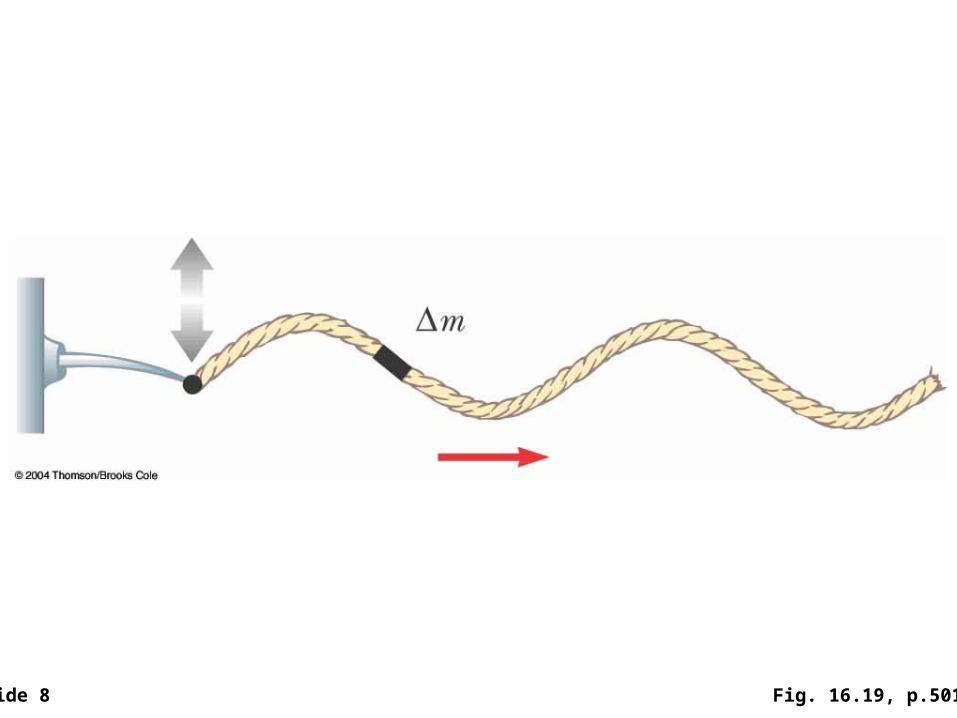
Slide 8 Fig. 16.19, p.501
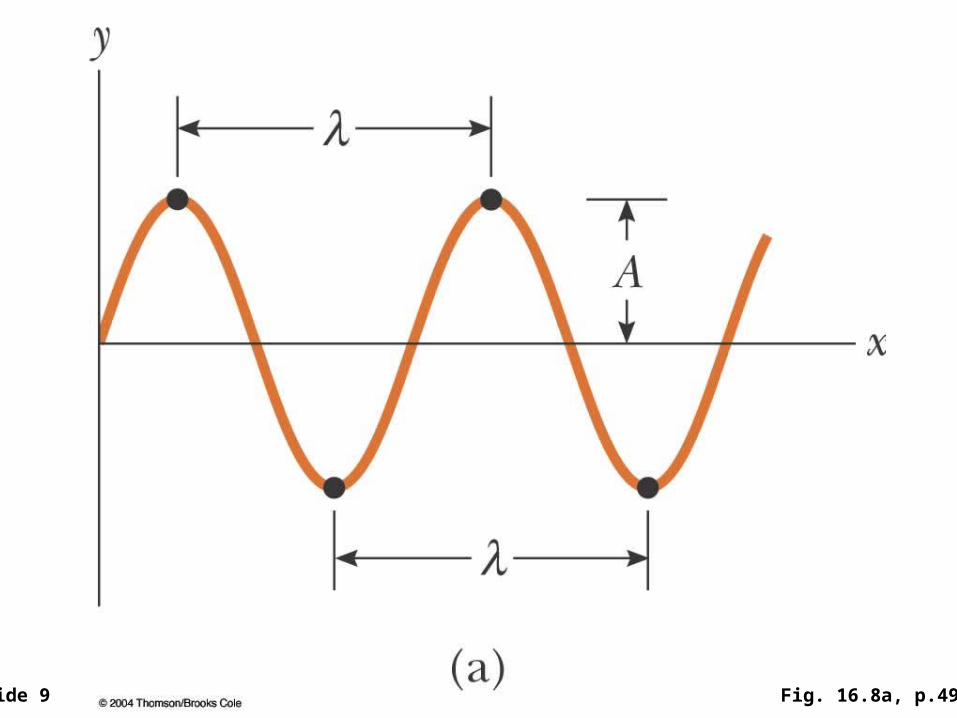
Slide 9 Fig. 16.8a, p.492
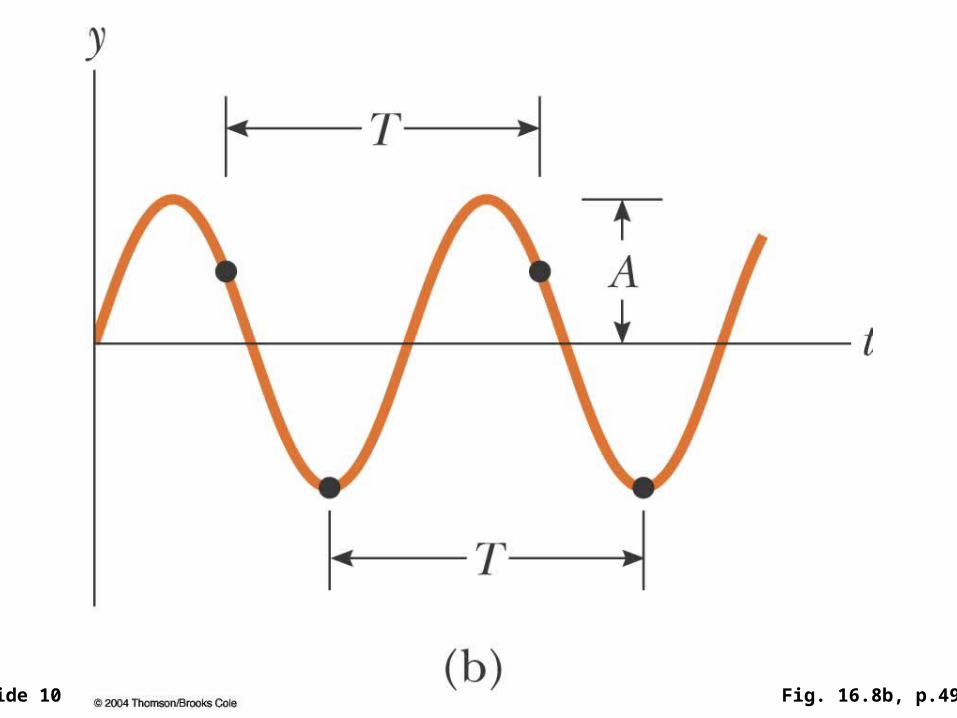
Slide 10 Fig. 16.8b, p.492
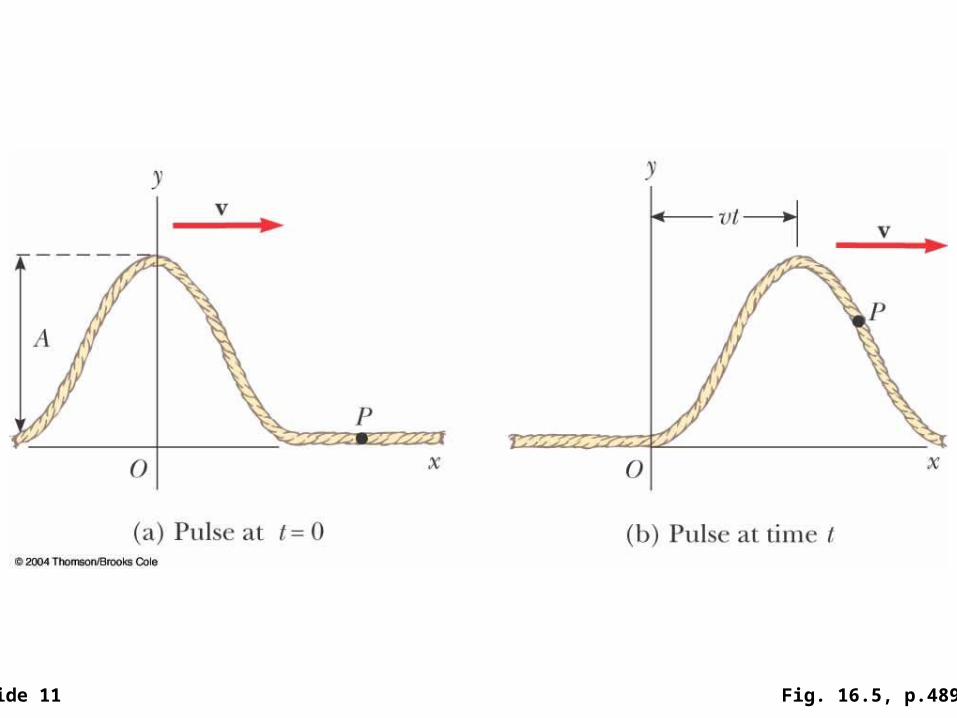
Slide 11 Fig. 16.5, p.489
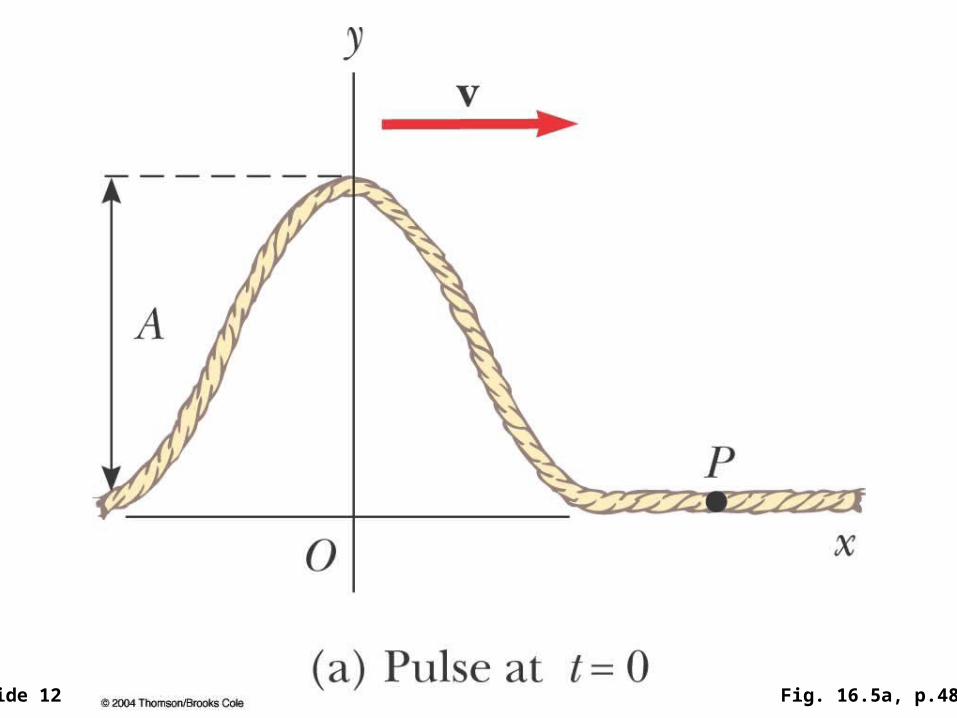
Slide 12 Fig. 16.5a, p.489
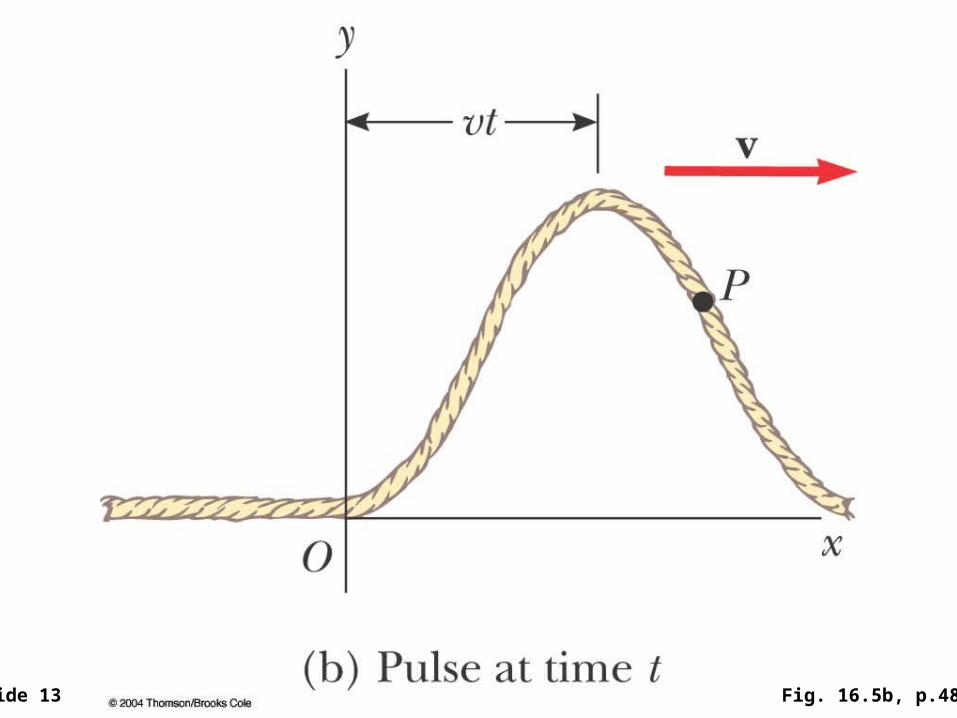
Slide 13 Fig. 16.5b, p.489
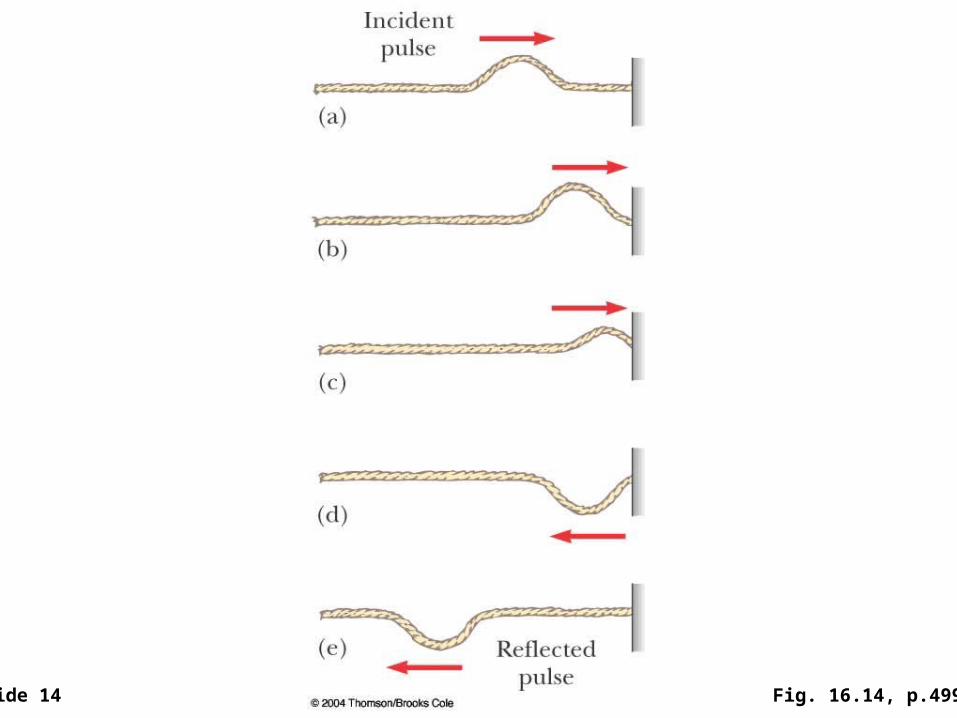
Slide 14 Fig. 16.14, p.499
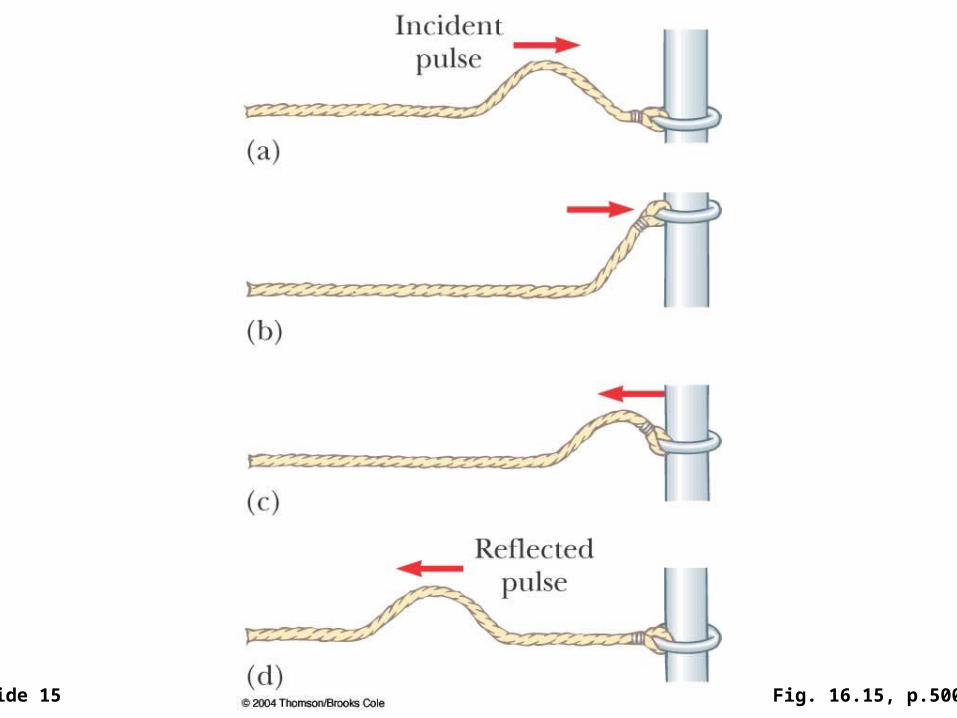
Slide 15 Fig. 16.15, p.500
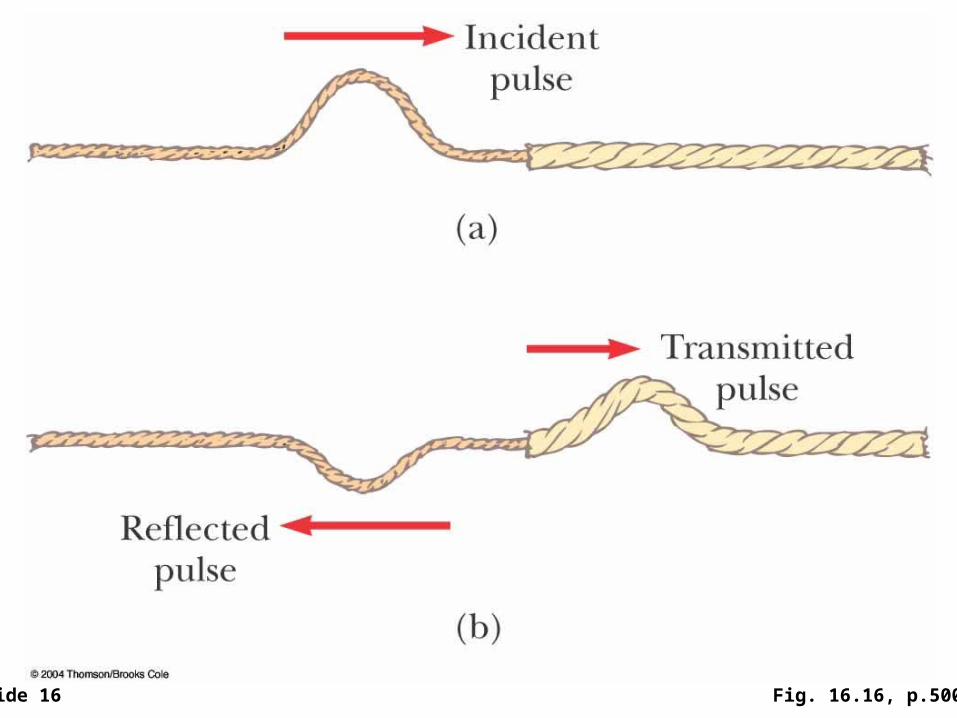
Slide 16 Fig. 16.16, p.500
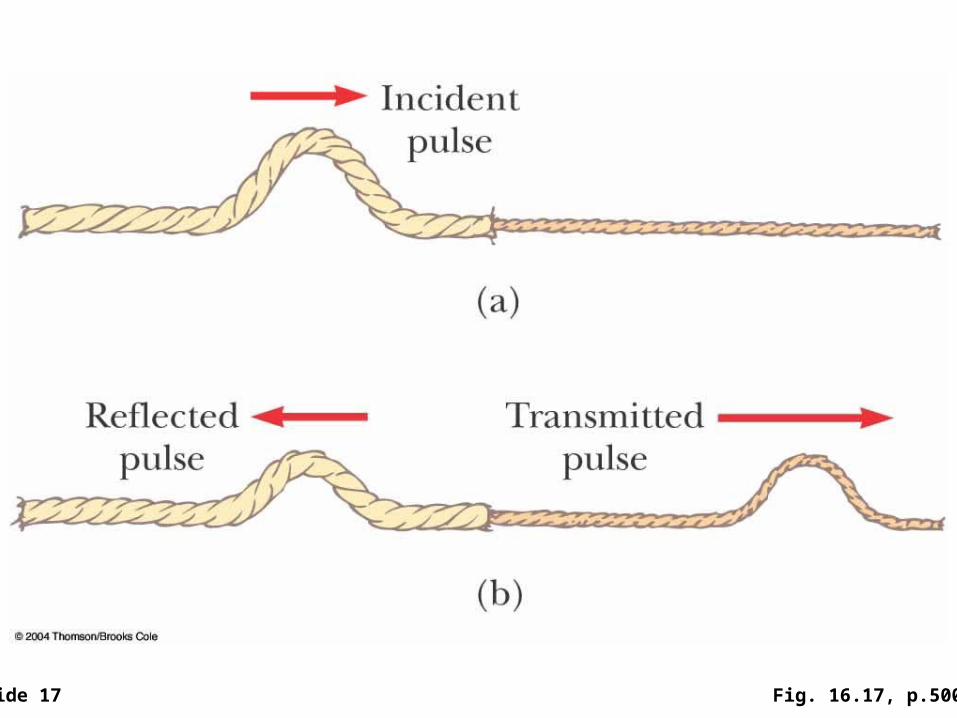
Slide 17 Fig. 16.17, p.500

![Index [pharmrev.aspetjournals.org]pharmrev.aspetjournals.org/content/pharmrev/43/4/local/back-matter.pdf · primary structure, kidney (fig.), 497 ... pathophysiology, ... schematic](https://img.dokumen.tips/doc/110x75/5b82cde67f8b9a315b8bcf1a/index-primary-structure-kidney-fig-497-pathophysiology-schematic.jpg)