Embed Size (px)
Citation preview
Field Testing of Electrokinetic Nanoparticle Treatment
for Corrosion Mitigation in Reinforced Concrete
Henry Cardenas
1, Joshua Alexander
1, Kunal Kupwade-Patil
1 and Luz Marina Calle
2
1Applied Electrokinetics Laboratory (AEL), Louisiana Tech University, Ruston, Louisiana
71272, USA. E-mail: <[email protected]>, <[email protected]>,
<[email protected]>. 2
Corrosion Technology Laboratory, NASA, Kennedy Space Center, Florida, 32899, USA.
E-mail: <[email protected]>.
ABSTRACT
Electrokinetic Nanoparticle (EN) treatment was used as a rapid repair measure to mitigate
chloride induced corrosion of reinforced concrete in the field. EN treatment uses an electric
field to transport positively charged nanoparticles to the reinforcement through the concrete
capillary pores. Cylindrical reinforced concrete specimens were batched with 4.5 wt % salt
content (based on cement mass). Three distinct electrokinetic treatments were conducted
using high current density (up to 5 A/m2) to form a chloride penetration barrier that was
established in 5 days, as opposed to the traditional 6-8 weeks, generally required for
electrochemical chloride extraction (ECE). These treatments included basic EN treatment,
EN with additional calcium treatment, and basic ECE treatment. Field exposures were
conducted at the NASA Beachside Corrosion Test Site, Kennedy Space Center, Florida,
USA. The specimens were subjected to sea water immersion at the test site as a post-
treatment exposure.
INTRODUCTION
In 2001, the U.S. Federal Highway Administration in concert with CC Technologies
Laboratories Inc., finalized a landmark study on the direct costs of corrosion in nearly every
major U.S. industrial sector [Koch et al. 2002]. Corrosion in bridge structures is an especially
costly problem. The study found that the annual direct cost of highway bridge repairs (largely
related to reinforcement corrosion) was $8.3 billion in the U.S. alone. The electrokinetic
approach may provide an increase in the durability of concrete repairs by removing
aggressive chemical species and sealing the region with a close chemical relative of the
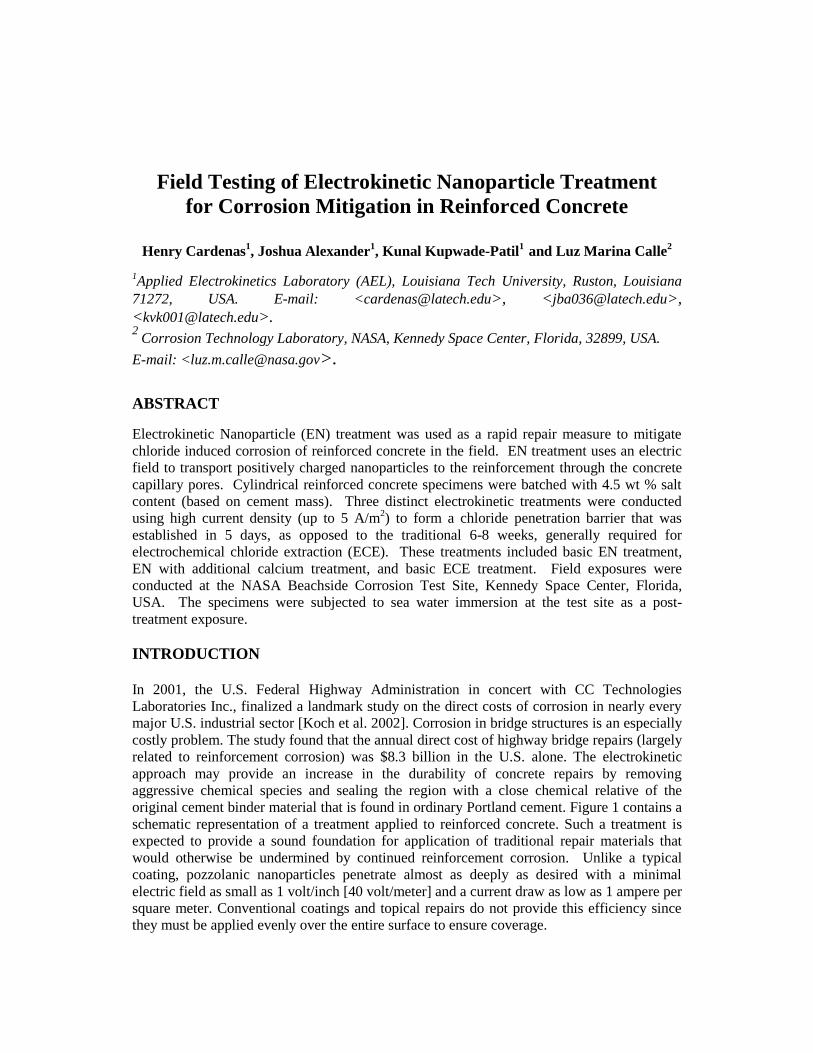
original cement binder material that is found in ordinary Portland cement. Figure 1 contains a
schematic representation of a treatment applied to reinforced concrete. Such a treatment is
expected to provide a sound foundation for application of traditional repair materials that
would otherwise be undermined by continued reinforcement corrosion. Unlike a typical
coating, pozzolanic nanoparticles penetrate almost as deeply as desired with a minimal
electric field as small as 1 volt/inch [40 volt/meter] and a current draw as low as 1 ampere per
square meter. Conventional coatings and topical repairs do not provide this efficiency since
they must be applied evenly over the entire surface to ensure coverage.
AAlluummiinnaa ppaarrttiicclleess
Pore Wall
SSiilliiccaa ppaarrttiicclleess
RReeiinnffoorrcceemmeenntt
Prior work examined the use of 24-nm, positively charged silica particles, for EN treatments
in which the steel reinforcement was used as the cathode (Cardenas and Struble 2006,
Cardenas and Kupwade-Patil 2007, Kupwade-Patil et al., 2008). In this treatment, the
positively charged particles were drawn directly to the reinforcement while chloride ions
were being driven away. The objective was to develop a chemical and structural corrosion
barrier around the reinforcement. Initially, the treatment drew sodium, potassium, and
calcium ions to the reinforcement surface, increasing the local alkalinity while driving away
chlorides. Later, as the nanoparticles arrived, they were expected to react with available
calcium to form a calcium-silicate-hydrate (C-S-H) barrier around the realkalized region.
Additional particle loading was provided to fortify this physical barrier as more calcium
became available further back from the reinforcement. The intention was that the physical
barrier would “keep” the alkali metals close to the reinforcement while slowing/preventing
the return of chlorides or other aggressive species. In re-exposure testing that followed
treatment, the treated specimens showed little damage while the untreated controls were
severely corroded.
The present work considered the use of elevated current density in order to accelerate the
overall treatment process. Another feature of this work was the exposure to actual seawater
at NASA’s Beachside Corrosion Test Site, one of the most aggressive environments in North
America.
EXPERIMENTAL PROCEDURE
This work focused on nanoparticle treatments using high current densities on 3 inch × 6 inch
[0.07 meter × 0.15 meter] concrete test cylinders.
Fig 1. Predicted Formation of Particles in Cement Matrix after Treatment
The nanoparticle chosen for the treatment was a 24-nm diameter alumina coated silica
particle. The 30 weight percent nanoparticle suspension was provided by Nalco Chemical,
Naperville, IL, USA.
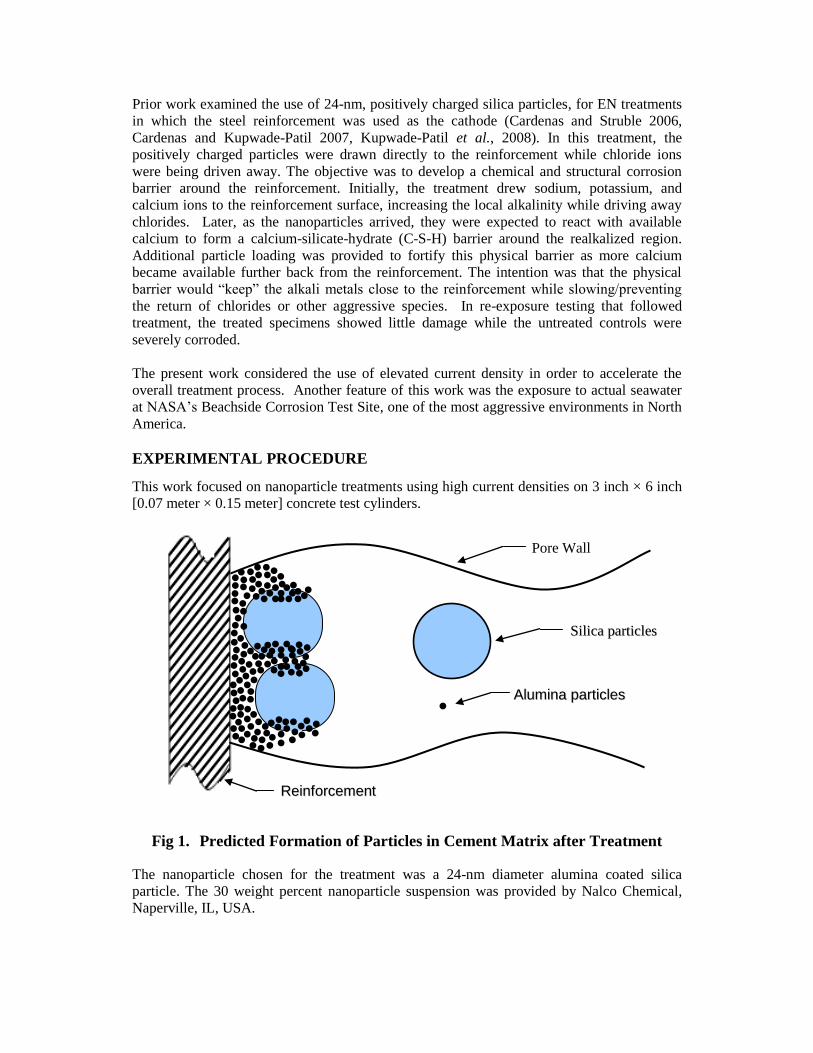
The mix design was completed as per ACI 211.1, for selecting proportions for normal,
heavyweight and mass concrete. The mix ingredients in this case were Type I Portland
cement, aggregate, water, and salt as shown in Table 1. The steel reinforcement inside the
concrete was a 6-inch [0.15 meter] 1018 mild steel with a 0.25 inch [0.006 meter] diameter.
The rebar was positioned in the center of the top of the specimen and embedded 3 inches
[0.07 meter] into the concrete. The material was poured into the molds in three-volume
increments as per ASTM C192.
Table 1. Batch Composition
Materials Weight
kg [lbs]
Water 8.4 [18.5]
Cement 16.5[36.5]
Gravel 42.4[93.5]
Sand 25.6[56.5]
Salt 0.37[0.83]
The purpose of this research was to investigate if it was possible to deliver the nanoparticles
into the pores of the concrete using a high current without reducing the strength of the
concrete. This hypothesis was tested by setting the power supplies to produce a voltage drop
across each specimen of 25 volts per inch [1000 volts per meter] of cover. In this case, there
was 1.5 inches [0.03 meter] of cover so the desired voltage drop for one specimen needed to
be 37.5 volts. Also, the current was checked daily during treatment to ensure that a current
density of 10 A/m2 was not exceeded. Three different treatment solutions were compared in
this work: EN, EN + Ca, and ECE.
One style of treatment involved connecting the specimens in series. This was accomplished
by connecting two specimens per power supply (one EN and one ECE) and setting the power
supply to produce a 37.5 volt drop across the EN-treated specimens. The circuit was
connected so that the mixed metal oxide coated titanium counter electrode of one specimen
was connected to the positive terminal of the power supply and the working electrode of the
second specimen was connected to the negative terminal of the power supply. Figure 2 shows
the circuit diagram for specimens connected in series. The treatment of each specimen was
completed in a 4 inch [0.10 meter] × 8 inch [0.20 meter] plastic mold. A mixed metal oxide
coated titanium electrode was formed in a helical fashion around the inside of the treatment
container.
The second treatment type used in this work involved connecting the specimens in parallel.
The same parameters as in the series treatment type were used for the parallel treatment type.
The power supplies were set to produce a voltage drop of 37.5 volts across the specimens and
the current was checked as to not exceed 5 A per square meter of concrete surface area. In
this case, all of the specimens that were receiving similar treatments were placed in one
container rather than each specimen having its own container. Similar to the series treatment
setup, a titanium counter electrode was used to electrically push the nanoparticles into the
pores of the concrete. Instead of the electrode going around the outside of the specimen, the
electrode was placed in the center of the container and the specimens were organized around
the electrode. Figure 3 shows the circuit diagram for the parallel setup.

Fig 2. Treatment of Twelve Specimens Conducted in Series
All of the EN and EN + Ca treatment specimens started out in one container since both
received similar treatments for the first 4 days. After the fourth day, the EN treatment
specimens and EN + Ca treatment specimens were placed in different containers due to
differences in the remaining treatment periods. After the fourth day of treatment, the EN
specimens were separated from the EN + Ca specimens. The treatment solution on the fourth
day for the EN specimens consisted of 0.16 L of nanoparticle solution and 4.16 L of
deionized water. The treatment solution for the EN + Ca specimens consisted of 217 g of
tetra flake calcium chloride (Tetra Technologies, The Woodland, TX) dissolved in 4.31 L of
deionized water.
Fig 3. Treatment Setup Showing Specimens Arranged in a Parallel Treatment
Circuit
Treatment
Container
Titanium
Wire
+
Indirect tension test was conducted on the cylindrical specimens to measure the splitting
tensile strength as per ASTM C 496/96. Visual examination of the reinforcement was done
as per ASTM G33-99. Microscopic imaging samples were extracted from the broken
concrete cylinders and vacuum mounted in epoxy. Polishing was conducted using 60, 120,
150, 320 and 600 grit size papers with the model Alpha-Beta Polisher manufactured by
Buehler, Lake Bluff, IL. Micro-polishing was conducted with Buehler polishing-cloths
ranging from 3-0.02 µm. These cloths were the ULTRA-PAD: 3 µm (for SiC removal),
TEXMET 2000: 3 µm (for profile flattening), TRIDENT: 1 µm (for polishing), and the
MICROCLOTH: 0.02 µm (for finishing). Polishing was conducted with a non-aqueous
lubricant (propylene glycol) and with no particulate abrasives. After each polishing stage, the
specimens were rinsed with ethyl alcohol to remove loose material. Microstructural analysis
was conducted using a Hitachi S-4800 field emission scanning electron microscope (FE
SEM) manufactured by Hitachi, Pleasanton, CA. Quantitative elemental analysis was done
using the FE SEM Energy Dispersive Spectrum Analysis (EDAX) with Genesis
Microanalysis software from Ametek Inc., Paoli, PA. Fourier transform infrared
spectroscopy (FTIR) was conducted using a Mattson Genesis II FTIR spectrometer,
manufactured by Mattson Genesis Inc., Middleton, WI. Samples were ground sufficiently to
pass a No. 30 sieve and mixed with potassium bromide (KBr) in a ratio of 1:100. The
mixture was compacted to provide a smooth test surface and pressed into pellets for
transmittance measurements.
RESULTS AND DISCUSSION
The left side of Figure 4 contains a bar chart illustrating the measured surface areas that were
covered with corrosion products. Each column represents a specific test category. Four to six
specimens were tested in each of these categories. The value reported for each column is an
average of these specimens. The first column on the left represents the controls examined just
prior to treatment application. The 3% corrosion coverage occurred over a 21-day exposure
period that preceded treatment. The remaining columns represent specimens that were tested
following EN treatment and a 30-day post-treatment exposure to seawater. The EN-treated
specimens exhibited 6% average corrosion coverage while the EN + Ca case revealed 4%
average corrosion coverage. The specimens subjected to chloride extraction without particle
treatment exhibited an 11% area of corrosion coverage. The control specimens were not
subjected to any treatment. These exhibited an average corrosion area coverage of 67%.
The right side of Figure 4 shows a comparison of corrosion product coverage observed in
each test case. Each specimen shown on the right side of Figure 5 represents the worst case
observed in each category. The control specimen exhibited 67% corrosion coverage and
showed evidence of pitting. The ECE specimen exhibited extensive corrosion damage with
some pitting. The EN and EN + Ca specimens also exhibited some corrosion.
The specimens subjected to ECE treatment showed more corrosion when compared to the
two EN treatment cases. The difference in corrosion coverage between both of the EN treated
cases and the control specimens was also evident. In comparing these post-treatment cases to
the pre-treatment specimens it was apparent that the controls and the ECE cases (Figure 4)
exhibited more severe corrosion than the pre-treatment controls. The distinction between the
two EN cases and the pretreatment controls was not readily apparent. This suggested that the
EN and EN + calcium treatments kept the corrosion from progressing much beyond the
original damage caused by the pre-treatment exposure. These visual observations appeared to
reflect the same order of severity that is observed in the bar chart of Figure 4.

The ECE specimens and controls clearly exhibited the worst corrosion damage. These
observations indicated that the EN and ECE treatments appeared to halt the corrosion
progress. The EN + Ca treatments did not appear to standout from the EN treatment. Perhaps
a longer exposure period could possibly show differences in performance among these cases
Fig 4. Corrosion Analysis that Compares the Measured Area Covered With
Corrosion Products for Each Case The results of the tensile and porosity tests carried out are illustrated in the bar chart of Figure
5. The EN + Ca and the ECE-treated specimens exhibited values of 221 and 219 psi
respectively. The lowest strength values were observed among the untreated controls. These
values were over 30% below the values obtained for the EN-treated specimens. EN treated
and EN+ Ca treated cases exhibited 35% and 29% increases in strength as compared to the
untreated controls. Reductions in porosity induced by particle treatments appeared to provide
enhanced strength.
From Figure 5 it is clear that the EN-treated specimens were significantly stronger in tension
than the untreated controls. This strength enhancement has two likely sources. The first
source is the porosity reduction due to EN-treatment. In addition, the more extensive
corrosion damage observed on the surfaces of the control specimens could have contributed
to the lower strength result since the buildup of corrosion products on the bars could have
caused the development of tensile residual stresses. This stress may have added to the stress
present during the course of tensile testing, leading to a lower apparent strength.
The microstructure of these specimens was examined following tensile strength testing.
Figure 6 provides a comparison in microstructure of the EN-treated and ECE-treated cases.
The ECE-treated specimen appears to exhibit a typical porous morphology for fractured
cement paste. The EN specimen image contains a fairly dense aggregate particle evident in
75% of the image. The upper left quadrant appears to contain cement paste. The morphology
of this paste appears to be denser than that observed in the ECE case. A more extensive
example of this densified morphology is exhibited in Figure 7. These samples were removed
from a specimen subjected to EN treatment for 4 days followed by 3 days of calcium
36
4
11
67
0
10
20
30
40
50
60
70
80
% C
orr
osi
on p
roduct
s
EN
EN
+ C
a
EC
E
Con
tro
l
Pre
-Tre
atm
ent
Con
tro
l

treatment. Both images clearly show the light-colored florets of a calcium-rich phase. The
right side image also provides a clearer view of the densified cement morphology that is
typical of EN treatment. As shown in the chart in Figure 5, the calcium contribution did not
appear to enhance the strength of the cylinders as compared to the EN treatment alone. The
distance that all of these SEM samples resided from the steel reinforcement was
approximately 1 mm [0.001 m]. Based on the dosages of the treatments applied, the extent of
the treated zone would be expected to range as much as 12 mm [0.012 m] to 25mm [0.025 m]
from the steel. It is thus not surprising that the SEM image of the EN treated specimen would
exhibit a densified morphology at a distance of 1 mm from the steel.
Fig 5. Comparison of Splitting Tensile Strength (Left) and Porosity (Right) for
each Treatment Case
In Figure 5, the differences in tensile strength observed in these cases was not significant.
The approximately 25% difference in strength between ECE and EN cases was notable. As
indicated by the SEM images of Figures 6 and 7, the most likely cause for this strength
increase was a porosity reduction due to nanoparticle loading of the capillary pore network in
the concrete Each of the treatments shared chloride extraction as a common feature. In the
cases of the nanoparticle treatments, the transport of particles going in and chlorides coming
out was designed to be simultaneous. The question of chloride content was examined by
Energy Dispersive X-Ray Spectroscopy (EDS) analysis of polished SEM specimens.
Figures 8 and 9 contain SEM images of EN treated and EN + Ca treated specimens after they
had been re-immersed in saltwater for 30 days. The images exhibit relatively dark regions of
aggregate surrounded by lighter regions of hardened cement paste. Occasional black areas are
large pores or voids. In some cases, a particle of concrete became lodged in these pores (as
indicated by a lighter color within them). EDS analysis was conducted on these polished
surfaces in order to obtain quantitative information on the elemental content of the
microstructures. The chart of peaks indicating the presence of various species appears to the
right of each polished image.
29
0 p
si
1.9
9 M
Pa
22
1p
si
1.5
2 M
Pa
21
9 p
si
1.5
0M
Pa
18
2 p
si
1.2
5 M
Pa
0
50
100
150
200
250
300
350
Sp
littin
g T
ensile
Str
eng
th (
psi)
6.46.9
8
9.8
0
2
4
6
8
10
12
Poro
sity(%
)
EN
EN
+ C
a
EC
E
Co
ntr
ol
EN
EN
+ C
a
EC
E
Co
ntr
ol

Table 2 contains the chemical analysis results obtained from specimens representing each
trial category of this study. It was observed that the controls exhibited the most sodium and
chloride. The two EN cases exhibited the most aluminum. The EN + Ca cases exhibited the
Fig 6. SEM Images of ECE and EN Specimens at a Distance of 1 mm from the Steel
Reinforcement
Fig 7. SEM Image of EN + Ca Treated Specimen Showing Light- Colored Calcium-
Rich Deposits (Samples Taken 1 mm from the Steel Reinforcement)
highest calcium content. The highest silicon content observed was in the controls category.
Of all the species listed in Table 2, the only ones that are not common to concrete are the
sodium and chloride. The elevated sodium and chloride content of the controls is not
surprising since these species are dominant in saltwater and there was no pore-blocking
treatment applied in these cases that could stop the ingress of these species.
Table 2. Elemental Composition Results from SEM/EDAX Analysis
Specimen
Type
Cl Na Al Ca Si
Controls 4.1 3.2 1.0 10.9 23.8
EN 0.0 0.3 1.1 14.8 10.0
EN + Ca 0.4 0.5 1.7 23.7 5.6
ECE 0.8 0.5 0.6 8.5 1.0
20 µm
ECE Specimen EN Specimen
20 µm 20 µm
20 µm

It is interesting to note that none of the cases exhibited an unusually high aluminum content.
Alumina-coated silica particles carry a small amount of alumina. The calcium content was
understandably elevated in the EN + Ca case. The silicon content results are somewhat
puzzling. The silicon content in hardened cement paste and many aggregates is expected to
be reasonably significant. EN treatment would be expected to provide additional silicon but
this value was decidedly smaller for the two EN cases 10 and 5.6 weight percent as compared
to the 23.8 weight percent content of the untreated control. The near-zero silicon content of
the ECE case is also puzzling.
Fig 8. SEM Image of Polished EN Treated Concrete Specimen (Left) and EDS
Analysis (Right).
Fig 9. SEM Image of Polished EN + Calcium Treated Concrete Specimen (Left)
and EDS Analysis (Right).
The average value of corrosion rates obtained from several control specimens subjected to
saltwater immersion is 0.41 Mils Per Year (mpy) [0.0104 mm per year]. These values were
obtained just prior to the initiation of treatments. Table 3 contains corrosion rates measured
after the initiation of EN and ECE treatments. As compared to the pretreatment values, the
corrosion rates after 1 day of treatment were generally over 200% higher than the
pretreatment values. On the 4th day following the start of EN treatment, the corrosion rates
were further increased. The corrosion rates for the EN and EN + Ca cases were 30% and 40%
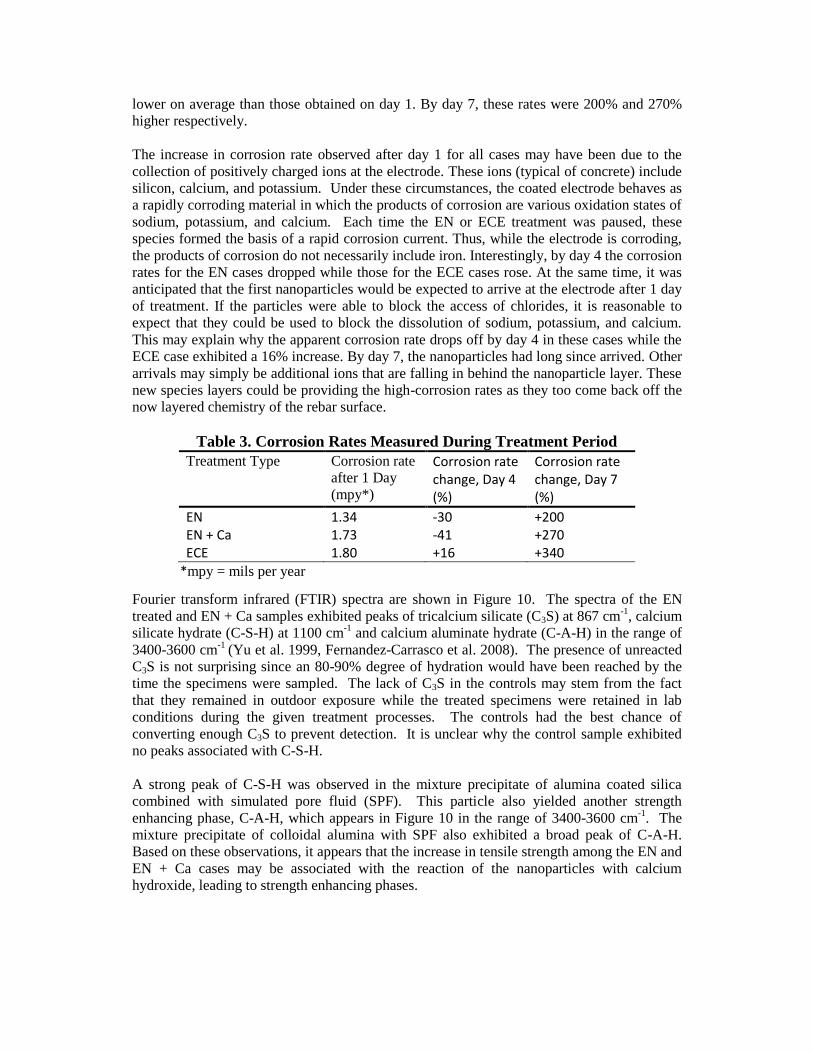
lower on average than those obtained on day 1. By day 7, these rates were 200% and 270%
higher respectively.
The increase in corrosion rate observed after day 1 for all cases may have been due to the
collection of positively charged ions at the electrode. These ions (typical of concrete) include
silicon, calcium, and potassium. Under these circumstances, the coated electrode behaves as
a rapidly corroding material in which the products of corrosion are various oxidation states of
sodium, potassium, and calcium. Each time the EN or ECE treatment was paused, these
species formed the basis of a rapid corrosion current. Thus, while the electrode is corroding,
the products of corrosion do not necessarily include iron. Interestingly, by day 4 the corrosion
rates for the EN cases dropped while those for the ECE cases rose. At the same time, it was
anticipated that the first nanoparticles would be expected to arrive at the electrode after 1 day
of treatment. If the particles were able to block the access of chlorides, it is reasonable to
expect that they could be used to block the dissolution of sodium, potassium, and calcium.
This may explain why the apparent corrosion rate drops off by day 4 in these cases while the
ECE case exhibited a 16% increase. By day 7, the nanoparticles had long since arrived. Other
arrivals may simply be additional ions that are falling in behind the nanoparticle layer. These
new species layers could be providing the high-corrosion rates as they too come back off the
now layered chemistry of the rebar surface.
Table 3. Corrosion Rates Measured During Treatment Period
Treatment Type Corrosion rate
after 1 Day
(mpy*)
Corrosion rate change, Day 4 (%)
Corrosion rate change, Day 7 (%)
EN 1.34 -30 +200 EN + Ca 1.73 -41 +270 ECE 1.80 +16 +340
*mpy = mils per year
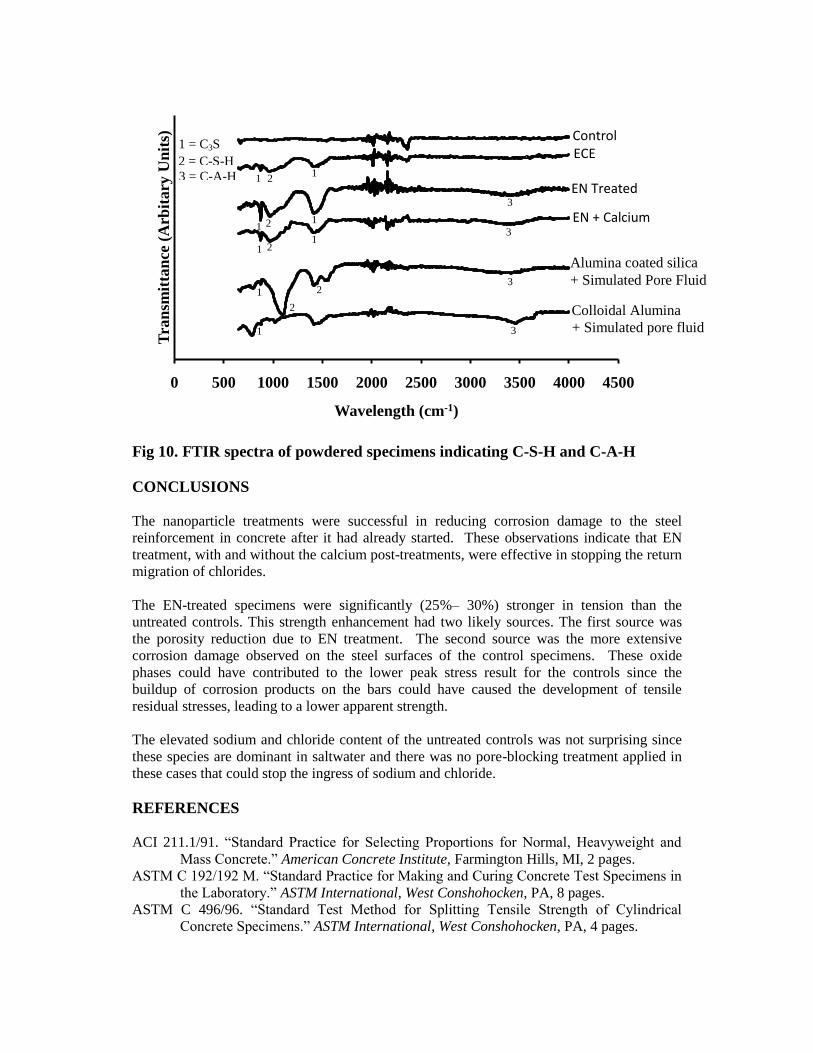
Fourier transform infrared (FTIR) spectra are shown in Figure 10. The spectra of the EN
treated and EN + Ca samples exhibited peaks of tricalcium silicate (C3S) at 867 cm-1
, calcium
silicate hydrate (C-S-H) at 1100 cm-1
and calcium aluminate hydrate (C-A-H) in the range of
3400-3600 cm-1
(Yu et al. 1999, Fernandez-Carrasco et al. 2008). The presence of unreacted
C3S is not surprising since an 80-90% degree of hydration would have been reached by the
time the specimens were sampled. The lack of C3S in the controls may stem from the fact
that they remained in outdoor exposure while the treated specimens were retained in lab
conditions during the given treatment processes. The controls had the best chance of
converting enough C3S to prevent detection. It is unclear why the control sample exhibited
no peaks associated with C-S-H.
A strong peak of C-S-H was observed in the mixture precipitate of alumina coated silica
combined with simulated pore fluid (SPF). This particle also yielded another strength
enhancing phase, C-A-H, which appears in Figure 10 in the range of 3400-3600 cm-1
. The
mixture precipitate of colloidal alumina with SPF also exhibited a broad peak of C-A-H.
Based on these observations, it appears that the increase in tensile strength among the EN and
EN + Ca cases may be associated with the reaction of the nanoparticles with calcium
hydroxide, leading to strength enhancing phases.
0 500 1000 1500 2000 2500 3000 3500 4000 4500
Tra
nsm
itta
nce
(A
rbit
ary
Un
its)
Wavelength (cm-1)
Fig 10. FTIR spectra of powdered specimens indicating C-S-H and C-A-H
CONCLUSIONS
The nanoparticle treatments were successful in reducing corrosion damage to the steel
reinforcement in concrete after it had already started. These observations indicate that EN
treatment, with and without the calcium post-treatments, were effective in stopping the return
migration of chlorides.
The EN-treated specimens were significantly (25%– 30%) stronger in tension than the
untreated controls. This strength enhancement had two likely sources. The first source was
the porosity reduction due to EN treatment. The second source was the more extensive
corrosion damage observed on the steel surfaces of the control specimens. These oxide
phases could have contributed to the lower peak stress result for the controls since the
buildup of corrosion products on the bars could have caused the development of tensile
residual stresses, leading to a lower apparent strength.
The elevated sodium and chloride content of the untreated controls was not surprising since
these species are dominant in saltwater and there was no pore-blocking treatment applied in
these cases that could stop the ingress of sodium and chloride.
REFERENCES
ACI 211.1/91. “Standard Practice for Selecting Proportions for Normal, Heavyweight and
Mass Concrete.” American Concrete Institute, Farmington Hills, MI, 2 pages.
ASTM C 192/192 M. “Standard Practice for Making and Curing Concrete Test Specimens in
the Laboratory.” ASTM International, West Conshohocken, PA, 8 pages.
ASTM C 496/96. “Standard Test Method for Splitting Tensile Strength of Cylindrical
Concrete Specimens.” ASTM International, West Conshohocken, PA, 4 pages.
Control ECE
EN Treated
EN + Calcium
Alumina coated silica
+ Simulated Pore Fluid
Colloidal Alumina
+ Simulated pore fluid
1
-
1
- 1
-
1
-
1
-
2
-
2
- 2
-
2
-
1 = C3S
2 = C-S-H 1
1
1
3
3
3
3
3 = C-A-H
2
ASTM G33/99. “Standard Practice for Recording Data from Atmospheric Corrosion Test of
Metallic-Coated Steel Specimens.” ASTM International, West Conshohocken, PA, 3
pages.
Cardenas, H., and Kupwade-Patil, K. (2007). “Corrosion Remediation using Chloride
Extraction Concurrent with Electrokinetic Pozzolan Deposition in Concrete.”
Proceedings of the Sixth International Conference on Electrokinetic Remediation,
117.
Cardenas, H., and Struble, L.(2006). “Electrokinetic Nanoparticle Treatment of Hardened
Cement Paste for Reduction of Permeability,” Journal of Materials in Civil
Engineering, 18(1), July-August, 554-560.
Fernandez-Carrasco, L., Rius, J., and Miravitlles. (2008). “Supercritical Carbonation of
Calcium Aluminate Cement.” Cement and Concrete Research, 38(8-9), 1033-1037.
Koch, G. H., M. P. H. Brongers, Thompson, N. G., Virmani, Y. P., Payer, J. H.
(2001). “Corrosion Costs and Preventive Strategies in the United States.” National
Association of Corrosion Engineers, Publication No. FHWA-RD-O1-156, Materials
Performance, 3-11.
Kupwade-Patil, K., Gordan, K., Xu, K., Moral, O., Cardenas, H., and Lee, L. (2008)
“Corrosion mitiagation in concrete beams using electrokinetic nanoparticle .”
Proceedings of First International Conference on Excellence in Concrete
Construction Through Innovation, 365-371.
Yu, P., Kirkpatrick, J., Poe, B., McMillan, P., and Cong, X. (1999), “Structure of Calcium
Silicate Hydrate (C-S-H) Near, Mid and Far-Infrared Spectroscopy,” Journal of
American Ceramic Society, 82(3), March, 742-748.


