Embed Size (px)
Citation preview

Kasetsart J. (Nat. Sci.) 45 : 943 - 959 (2011)
Field Performance of Kamphaengsaen Canal Automation System
Varawoot Vudhivanich1* and Vich Sriwongsa2
ABSTRACT
The Kamphaengsaen canal automation system (KPS CAS) was developed for real time
monitoring and regulation of the flow in the canal irrigation system of Kasetsart University,
Kamphaengsaen campus, Nakhon Pathom province. KPS CAS consists of five remote terminal units
(RTUs) and a master station. Robogate, a low cost micro-controller embedded system was used to
function as RTUs for flow monitoring and control in the irrigation canals of Kamphaengsaen campus.
Two types of Robogate were used—namely, a water level control Robogate installed at a cross regulator
and a discharge control Robogate installed at a head regulator. Upstream water level control and constant
volume control were algorithms of KPS CAS that were used for the water level and discharge control,
respectively. The master station installed at the Department of Irrigation Engineering located more than
1 km from the Kamphaengsaen canal irrigation system was designed to poll the data from the RTUs
every half an hour via citizen band 245 MHz radio. The KPS CAS was tested for 600 d during the period
from 10 October 2006 to 1 June 2008. The various field performances of the canal automation system
were studied including the accuracy of the floating-type water level and gate positioning sensors,
performance characteristics of the upstream water level control algorithm, reliability of data measurement
and the overall control performance of the KPS CAS. The results showed that both sensors had a very
small error of measurement. The characteristics of water level and gate adjustment of Robogate 9021
were observed at 5 sec intervals, producing more than 20,200 data records, in order to check the
effectiveness of the upstream control algorithm. When the upstream water level deviated from the
target water level, the gate was adjusted 4–12 times automatically, within a duration of 310–780 sec,
until the upstream water level was maintained at the target level. During the test period of 600 d, 17.3%
of data were missing due to unexpected disturbances and failures. The automatic mode operation was
compared to the manual operation. The root mean square error of the target water level control in the
automatic mode (0.009–0.013 m), was considerably smaller than that of the manual mode (0.118–0.178
m). With smaller water level fluctuations at the cross regulators, the head regulator could produce a
more uniform discharge into the canal. Therefore it could be concluded that the KPS CAS is useful for
flow control.
Keywords: canal automation, canal control, irrigation, Robogate, Kamphaengsaen
1 Department of Irrigation Engineering, Faculty of Engineering at Kamphaengsaen, Kasetsart University, Nakhon Pathom
73140, Thailand.2 Irrigation Development Institute, Royal Irrigation Department, Pakred, Nonthaburi 11120, Thailand.
* Corresponding author, e-mail: [email protected]
Received date : 25/04/11 Accepted date : 20/07/11
944 Kasetsart J. (Nat. Sci.) 45(5)
INTRODUCTION
Water allocation and delivery in an
equitable, efficient, reliable and timely way, while
minimizing staff and operating costs, is a challenge
for irrigation engineers (Plusquellec, 1988). The
main factor contributing to poor water delivery
performance is the lack of effective water control
in irrigation canal networks. With traditional
management tools, an open-channel water
conveyance and delivery system is very difficult
to manage in real situations, especially for a
demand-oriented operation (Clemmens, 1987).
The irrigation canal system in Thailand is designed
for an upstream control principle, without
consideration of unsteady flows that usually affect
the actual canal operation and flow rate (Sriwongsa
and Vudhivanich, 2008). In addition, most
irrigation projects in Thailand use a gated,
undershot-type, manually operated system. The
advantage of this control structure is its flexibility,
but it is difficult to control the flow rate in actual
operation (Plusquellec et al., 1994) due to the high
sensitivity of undershot-type gates (Renault et al.,
2007) and the various perturbations that exist in
the canal system.
The various control methods for an
irrigation canal system have been developed in
order to improve the efficiency, effectiveness and
flexibility of water delivery. Those methods are
upstream control, downstream control, constant
volume and a variant of downstream control.
Upstream control is a common practice in
Thailand, but there are some disadvantages. The
water delivery plan has to be established in
advance. If there is an unexpected rainfall event
or farmers reduce their water use, there will be an
excess amount of water which is considered as a
loss. Upstream control provides more advantages
to the upstream users. In contrast, downstream
control can respond to water demands more
quickly, has lower operational losses and requires
fewer field operation staff and favors the
downstream users, but requires a larger canal size.
Nowadays, computers and information
technology play an important role in remote
monitoring and control, which can be useful in
water management. An automatic canal control
system in connection with supervisory control and
data acquisition (SCADA) systems can improve
irrigation canal management. It can substantially
increase water use efficiency and the quality of
the deliveries and, at the same time, save on labor
and reduce construction costs (Rijo, 1999). Canal
automation was tested and implemented in the Salt
River Project and the Maricopa Stanfield Irrigation
and Drainage District, Central Arizona, to improve
the water delivery service to farmers, reduce
operating costs and improve distribution efficiency
(that is to reduce unaccounted losses). The
implementation of canal automation through these
two projects demonstrated the capabilities and
limitations of this technology (Clemmens et al.,
1997). SCADA and telemetering systems have
been employed in some water projects in Thailand,
including irrigation projects. They mostly rely on
imported equipment and technology which leads
to high investment and operating costs. In 2003,
Vudhivanich and Sriwongsa (2004) developed a
low cost micro-controller and sensors for remote
monitoring and control of the regulator. A test with
three regulators during the period from August to
December 2003 at the Bang Lane irrigation
project, Nakhon Pathom province produced a
satisfactorily result, with an average error of 2.3%.
In order to study flow control more
comprehensively, a canal automation model, 4 m
wide and 8 m long, consisting of one water supply
tank and five regulators was developed in the
laboratory of the Department of Irrigation
Engineering, Faculty of Engineering, Kasetsart
University, Kamphaengsaen campus (Vudhivanich
and Sriwongsa, 2011). A micro-controller
embedded system called Robogate was developed
to monitor the water level and gate positioning
and to control the regulator for the model. Four

Kasetsart J. (Nat. Sci.) 45(5) 945
Robogate controllers were installed 3–4 m apart
in a model canal for upstream water level control
and one Robogate was installed at the head tank
for controlling the discharge into the canal model.
A Robogate is designed to work in three modes:
Mode 0 (telemetering mode), Mode 1 (automatic
mode) and Mode 2 (remote control). An upstream
control algorithm was used to self-regulate the
check gate in automatic mode. The performance
of the canal automation model and the Robogate
was tested in six runs. The results showed that
generally, the Robogate was very capable in
controlling the water level in the model. The
coefficient of variation of the water level upstream
of the Robogate was very small, being less than
0.06 in all experiments. Two indicators—namely,
the maximum control error and the unsteady period
(which was defined as the period of water level
variation beyond the control tolerance)—were
selected for the analysis of the performance of the
canal automation model under disturbed
conditions. This laboratory experiment showed
that the Robogates could remove the effect of flow
disturbances within a reasonable period of 2–8
min. This experiment helped in determining that
the Robogates can be used for the effective and
automatic control of the upstream water level in
the model. However, field experiment was needed
to confirm the accuracy and effectiveness of the
canal automation system, Robogate and the
sensors. In 2006, the canal automation system was
developed for the monitoring and control of flow
parameters in the irrigation system of Kasetsart
University, Kamphaengsaen campus. This system
is called the Kamphaengsaen canal automation
system or KPS CAS (Sriwongsa and Vudhivanich,
2008). The objective of the present research was
to assess the performance of the Kamphaengsaen
canal automation system under field conditions.
MATERIALS AND METHODS
Kamphaengsaen irrigation canal systemThe irrigation system of Kasetsart
University, Kamphaengsaen campus consists of
the main storage reservoir (Reservoir 1), the main
canal (MC) and one lateral canal (1L-MC) which
can supply irrigation water to 720 ha of cultivated
crop area on the Kamphaengsaen campus.
Reservoir 1 has a storage capacity of 0.9 million
m3. It was designed to re-regulate irrigation water
that was supplied from 1L-6R-2L of the
Phanomtuan O&M project of the Greater Mae
Klong Irrigation System to the campus irrigation
system. The main canal (MC) has a delivering
capacity of 1 m3.sec-1 with the total main canal
length being 3.6 km. The lateral canal, 1L-MC,
has a total length of 3.25 km. The main crops are
sugarcane, paddy, pasture, vegetables, upland
crops and fish farms. A map of the Kamphaengsaen
canal irrigation system is shown in Figure 1(a).
The detailed characteristics of the canals are shown
in Table 1.
Table 1 Characteristics of irrigation canals on Kamphaengsaen campus.
Canals Length Canal specifications
(km) B D SS Longitudinal Irrigation
(m) (m) slope area (ha)
MC 0+000-0+725 0.80 0.65 1:1.5 1:5,000 96
0+725-2+175 0.60 0.45 1:1.5 1:6,000 400
1L-MC 0+000-1+200 0.90 0.50 1:1.5 1:5,000 104
1+200-2+500 1.10 0.50 1:1.5 1:7,000 120
Total 720Length=length of canal section between two Robogates; B = bed width; D = water depth; SS = side slope

946 Kasetsart J. (Nat. Sci.) 45(5)
Figure 1 Kamphaengsaen canal automation system (KPS CAS) showing: (a) Kamphaengsaen irrigation
system; and (b) Layout of KPS CAS.
Kamphaengsaen canal automation systemThe Kamphaengsaen canal automation
system (KPS CAS) was developed by the authors
for the automatic control of irrigation water
delivery in the canal system of Kasetsart
University, Kamphaengsaen campus (Sriwongsa
and Vudhivanich, 2008). The design of the canal
automation system was based on experience
gained from several laboratory experiments on the
canal automation model conducted by
Vudhivanich and Sriwongsa (2011) at the
Department of Irrigation Engineering, Kasetsart

Kasetsart J. (Nat. Sci.) 45(5) 947
University during 2005–2006. The system
consisted of five remote terminal units (RTUs)
installed in the canal system and a master station
installed at the Department of Irrigation
Engineering. Robogate, an embedded system with
five analog-to-digital convertor ports and 1 citizen
band (CB) communication radio and an optional
motor control circuit, were used as RTUs. Each
Robogate was designed to undertake a different
function. Robogate 901 was installed at the head
regulator to monitor and control discharge from
Reservoir 1 into the main canal. Robogate 902
installed at the junction of 1L-MC was more
complicated than the others and consisted of two
micro-controller embedded systems called 9021
and 9022. The embedded micro-controller 9021
was designed to monitor and control the water
level upstream of the cross regulator at MC km
0+725. The embedded micro-controller 9022 of
Robogate 902 was designed to monitor and control
the discharge at the head regulator of 1L-MC.
Robogate 903 was installed at the 1L-MC km
1+200 cross regulator for water level control.
Robogates 904 and 905 were installed at the tail
ends of the main canal and the 1L-MC lateral
canal, respectively, to monitor the tail water level.
The volume control algorithm was used for
discharge control of the head regulator, and the
upstream water level control algorithm was used
for the water level control of the cross regulator.
The layout of the KPS CAS is shown in Figure
1(b). The components and functions of the KPS
CAS are described in Table 2. Photographs of the
Robogates and master station are shown in Figure 2.
Control algorithm of KPS CASThe KPS CAS was designed to monitor
and control the flow parameters including the
water level and regulator gate opening. The
Robogate installed at the cross regulator
automatically controls water level upstream of the
cross regulators to the pre-specified target water
level using the upstream control algorithm as
shown in Figure 3. Every 30 min, the computer at
the master station monitors the flow conditions
(water levels, gate openings and gate discharges)
via radio transmission from the Robogates. The
data are recorded in the database. The discharge
requirements of the head regulators are analyzed
using the constant volume control algorithm
shown in Equations 1–3. The new gate settings of
the head regulators are determined by the
submerged flow formula in Equation 4. Finally,
the master station commands the Robogate at the
head regulator to adjust the gate according to the
new discharge requirements.
∆V = ∆WL × L (1)
∆Q = ∆∆V
t(2)
Qt = Qt-1 ± ∆Q (3)
Qt = CsLhs 2g h∆ (4)
Cs = C1h
Gs
o
c
2
(5)
where, ∆WL = cross sectional area of the canal
flow deviated from the target area (m2); ∆V =
deviation of the volume of water in the
downstream reach from the target volume (m3); L
= length of downstream canal reach (m); ∆t = time
interval for discharge adjustment to maintain
constant volume; ∆Q = additional discharge to
maintain the constant volume in downstream reach
(m3.s-1); Qt = required discharge of the head
regulator for the next 30 min (m3.s-1); Qt-1 = present
discharge (m3.s-1); Cs = submerged flow discharge
coefficients; L = gate width (m); hs = downstream
water elevation (m) – gate threshold elevation (m);
Go = gate opening (m); g = gravity acceleration
(m.s-2); ∆h = upstream water surface elevation (m)
– downstream water surface elevation (m); C1, C2
= calibrated discharge coefficients of Equation 5
as shown in Table 3.
The field experiments were conducted to
test the various aspects of performance of the canal
automation system—namely, 1) the accuracy of

948 Kasetsart J. (Nat. Sci.) 45(5)
Table 2 Details of KPS CAS.
Component Details Location Function
Robogate 901 Embedded micro- MC head Monitor and control discharge
controller regulator at km through MC head regulator
2 floating type water 0+00
level sensors
1gate positioning
sensor
12V-DC gear motor
Robogate 902 2 sets of 1L-MC junction Monitor and control water
embedded micro- level upstream of MC cross
controller; 9021 and regulator at km 0+725
9022 Monitor and control discharge
3 floating type water through 1L-MC head
level sensors regulator
2 gate positioning
sensors
2 DC gear motors
(12V)
Robogate 903 Embedded micro- 1L-MC cross Monitor and control water
controller regulator at km level upstream of 1L-MC
2 floating type water 1+200 cross regulator at km 1+200
level sensors
1gate positioning
sensor
1 DC gear motor(12V)
Robogate 904 Embedded micro- Tail end of MC, Monitor water level at the tail
controller; 1 floating km 2+175 end of MC km 2+175
type water level sensor
Robogate 905 Embedded micro- Tail end of 1L- Monitor water level at the tail
controller; 1 floating MC, km 2+500 end of 1L-MC km 2+500
type water level sensor
Master station Computer Department of Retrieve water level, gate
canal automation Irrigation opening and flow data from
interface Engineering, Robogates and record on
CB transmission radio Kamphaengsaen datalogger
canal automation campus Calculate discharge
software requirements and new gate
settings for head regulators at
MC km 0+000 and 1L-MC
km 0+000
Feedback the new gate
settings to Robogates

Kasetsart J. (Nat. Sci.) 45(5) 949
Figure 2 Robogates and master station of Kamphaengsaen canal automation system (KPS CAS): (a)
Robogate 901 at head regulator of MC km 0+000; (b) Robogate 902 at junction of 1L-MC;
(c) Robogate 903 at cross regulator of 1L-MC km 1+200; (d) Robogate 904 at MC km 2+175;
(e) Robogate 905 at 1L-MC km 2+500; (f) master station. DS = Downstream; US = Upstream.

950 Kasetsart J. (Nat. Sci.) 45(5)
Figure 3 Upstream control algorithm of Robogate installed at cross regulators: WL = upstream water
level; TL = target water level; G0 = gate position; Gauto = calculated gate position adjustment
value; Gauto1 = previous gate position adjustment value; r = sub-loop; φ = coefficient of
automatic gate adjustment, equal to 1.0 in this study. (Sriwongsa and Vudhivanich, 2008)
Table 3 Coefficients C1, C2 and gate threshold elevation of 4 main regulators of Kamphaengsaen
irrigation water delivery system.
Regulators Threshold elevation C1 C2
(m msl)
MC head regulator at km 0+000 7.394 1.1418 -2.1586
MC cross regulator at km 0+725 8.012 0.4799 -0.1971
1L-MC head regulator at km 0+000 7.856 0.3384 -0.5998
1L-MC cross regulator at km 1+200 6.300 0.1516 -0.4056msl =mean sea level.

Kasetsart J. (Nat. Sci.) 45(5) 951
measurement by water level sensor 2) the
performance of the automatic upstream control
algorithm 3) the reliability of measurement and
4) the control performance of the KPS CAS in
automatic mode compared to manual operation.
RESULTS AND DISCUSSION
Accuracy of water level sensorsThe accuracy of the water level measured
by the floating-type potentiometer sensors was
tested against the manual staff gauge measurement
under field conditions. The water level readings
from the sensor and staff gauge of the five
Robogates were sampled and the differences
between the sensors and manual readings were
computed (Table 4). The probability distribution
of the differences was normally distributed with
almost a zero mean and 1.7 cm standard deviation
by chi square test (P > 0.01). There was more than
a 90% probability that the differences were
distributed between -3 and 3 cm. The mean
absolute difference was small (1.0–2.2 cm). The
sensor readings showed very high correlation with
the manual staff gauge measurement; R2 was
between 0.896 and 0.986, which showed that the
water level measurement by the floating-type
potentiometer sensor differed only by a very small
amount from the staff gauge measurement.
Performance of automatic upstream controlalgorithm
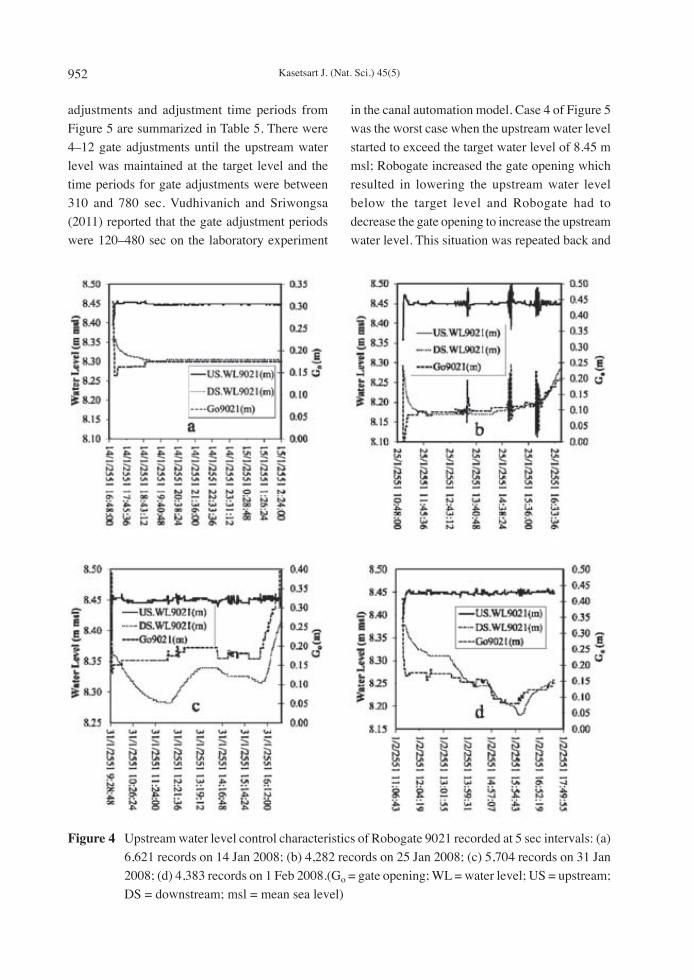
The performance of the automatic
upstream control algorithm as shown in Figure 3
was tested. The large amount of water level and
gate opening data from Robogate 9021were
recorded at 5 sec intervals in order to see how the
upstream control algorithm worked under field
conditions. The data consisting of over 20,200
records from four samplings were obtained for
analysis as shown in Figures 4(a)–(d). There were
seven cases where the upstream water level
deviated from the target control water level and
Robogate adjusted the gate automatically to
maintain the target upstream water level. Three
cases where the upstream water level dropped
below the target level of 8.45 m msl and three cases
where the upstream water level rose above the
target water level are plotted in Figure 5 in order
to show how Robogate 9021 worked in this
unsteady state until the target upstream water
levels were maintained. The number of gate
Table 4 Differences in water level measurement using floating-type potentiometer sensor compared
to staff gauge measurements.
Robogate Sensor N Average WL(m) Absolute error R2
Min. Mean Max.
(m) (m) (m)
901 US.WL 61 8.771 0.003 0.019 0.048 0.965
DS.WL 61 8.529 0.002 0.010 0.024 0.986
902 US.WL 67 8.398 0 0.009 0.020 0.985
(9021) DS.WL 67 8.265 0.003 0.022 0.059 0.927
(9022) DS.WL 67 8.253 0 0.014 0.054 0.896
903 US.WL 67 6.895 0.001 0.014 0.059 0.976
DS.WL 67 6.802 0.001 0.012 0.033 0.972
904 WL 60 7.685 0.001 0.009 0.026 0.962
905 WL 64 5.320 0.001 0.013 0.039 0.979N = number of measurements; Max. = Maximum; Min. = Minimum; msl = mean sea level; WL = water level; US = upstream;
DS = downstream.
952 Kasetsart J. (Nat. Sci.) 45(5)
Figure 4 Upstream water level control characteristics of Robogate 9021 recorded at 5 sec intervals: (a)
6,621 records on 14 Jan 2008; (b) 4,282 records on 25 Jan 2008; (c) 5,704 records on 31 Jan
2008; (d) 4,383 records on 1 Feb 2008.(Go = gate opening; WL = water level; US = upstream;
DS = downstream; msl = mean sea level)
adjustments and adjustment time periods from
Figure 5 are summarized in Table 5. There were
4–12 gate adjustments until the upstream water
level was maintained at the target level and the
time periods for gate adjustments were between
310 and 780 sec. Vudhivanich and Sriwongsa
(2011) reported that the gate adjustment periods
were 120–480 sec on the laboratory experiment
in the canal automation model. Case 4 of Figure 5
was the worst case when the upstream water level
started to exceed the target water level of 8.45 m
msl; Robogate increased the gate opening which
resulted in lowering the upstream water level
below the target level and Robogate had to
decrease the gate opening to increase the upstream
water level. This situation was repeated back and

Kasetsart J. (Nat. Sci.) 45(5) 953
Figure 5 Enlargement of Figure 4 to show the performance of Robogate 9021 to maintain the upstream
target water level: (a) case 1 US.WL < TL; (b) case 2 US.WL > TL; (c) case 3 US.WL > TL;
(4) case 4 US.WL > TL; (5) US.WL < TL; (6) US.WL < TL. (Go = gate opening; WL = water
level; US = upstream; DS = downstream; TL = target level; msl = mean sea level)

954 Kasetsart J. (Nat. Sci.) 45(5)
forth five times before the upstream target water
level was maintained at the target. This oscillation
can take place when the coefficient (φ) of the linear
proportional control algorithm is not appropriate.
This is one disadvantage of the control algorithm
used in Robogate. To reduce this effect, further
study is needed to find an appropriate coefficient.
Reliability of measurementThe functions of Robogate are to
measure the water levels and gate positions and to
transmit the data to the datalogger at the master
station via CB communication radio every 30 min.
There were three main factors that could reduce
Robogate’s capability to satisfactorily complete
these functions—interference in radio
communication, electricity failure and equipment
failure. The data recorded in the datalogger at the
master station from 10 October 2006 to 1 June
2008 were analyzed in order to determine the
percentage of missing data (Table 6). The
percentage of missing data ranged between 14.0
and 22.3% and averaged 17.3. From this analysis,
it can be concluded that the KPS CAS had 82.7%
reliability of measurement which was considered
quite acceptable.
Control performance of Kamphaengsaen canalautomation system
The KPS CAS was tested for 600 d
during the period from 10 October 2006 to 1 June
2008. The system was operated in manual mode
from 10 October 2006 to 3 January 2008 and in
automatic mode from 4 January to 1 June 2008.
The flow characteristics including the upstream
and downstream water levels, gate openings and
discharges of the regulators controlled by
Robogates 901–903 are plotted in Figure 6. The
tail water levels monitored by Robogates 904 and
905 are also plotted in Figure 6. It can be seen that
the automatic mode operation could control the
upstream water level at the target with a much
Table 5 Gate adjustment statistics of Robogate 9021 to maintain the target upstream water level.
Case Date Time No. of gate Adjusted time period
(hr:min:sec) adjustments (sec)
1 14 Jan 06 17:00:14–17:13:10 4 310
2 25 Jan 06 13:21:30–13:29:50 7 270
3 25 Jan 06 14:52:35–15:04:15 10 495
4 25 Jan 06 15:15:40–16:06:35 12 780
5 31 Jan 06 19:30:10–19:41:50 4 355
6 1 Feb 06 11:22:30–11:34:10 4 385
Table 6 Analysis of measurement reliability of Robogate.
Robogate Number of recorded data Missing data Reliability of
Theoretical Actual Missing (%) measurement
(%)
901 28,752 23,194 5,558 19.3 80.7
902 28,752 24,728 4,024 14.0 86.0
903 28,752 24,470 4,282 14.9 85.1
904 28,752 22,350 6,402 22.3 77.7
905 28,752 24,127 4,625 16.1 83.9
Average 17.3 82.7

Kasetsart J. (Nat. Sci.) 45(5) 955
Figure 6 Flow characteristics of manual and automatic modes of operation recorded at differentRobogates from 10 October 2006 to 1 June 2011: (a) water level and gate opening at Robogate901; (b) discharge at Robogate 901; (c) water level and gate opening at Robogate 9021; (d)discharge at Robogate 9021; (e) water level and gate opening at Robogate 9022; (f) dischargeat Robogate 9022; (g) water level and gate opening at Robogate 903; (h) discharge at Robogate903; (i) water level at Robogate 904; (j) water level at Robogate 905. (Manual = Canalautomation system set in manual operation mode; Auto = Canal automation system set inautomatic operation mode; US=upstream; DS=downstream; Go=gate opening.)

956 Kasetsart J. (Nat. Sci.) 45(5)
smaller variation than the manual mode of
operation as shown in Figures 6(c) and (g). This
can be explained by the fact that when the KPS
CAS operated in automatic mode, Robogate
monitored and adjusted the gate every 0.5 sec.
During this very short time period, the upstream
water level would deviate from the target by only
a small amount; therefore, only a small gate
adjustment was needed each time to bring the
water level back to the target level. This was in
contrast to manual operation, where due to the
limited number of staff, the gate could be adjusted
only once every day or every two days and so a
higher water level fluctuation could be expected.
The discharge regulators controlled by Robogates
901 and 9022 showed similar results. The
discharge at Robogate 9022 during automatic
mode operation showed much smaller variation
than that during manual operation mode.
Consequently, the discharges at Robogates 9021
and 903 and the tail water level at Robogates 904
and 905 showed smaller variations in automatic
mode.
Statistical analysis of the Robogate flow
control parameters in manual and automatic
operation modes from Figure 6 is shown in Table
7. The coefficient of variation (CV) of the upstream
water level control by Robogates 9021 and 903
was in the range 0.002–0.003 in automatic mode
which was a much smaller range than the CV in
manual mode (0.014–0.026). There was no
difference compared to the CV of discharge at
Robogate 901 because of the high variation in the
water requirements of the Kamphangsaen
irrigation system during the experimental period
under the manual and automatic modes of
operation.
The performance of the Robogate to
control the water level upstream of the regulators
to meet the target water level was evaluated by
the root mean square error (RMSE). The RMSE
values of the target water level control in manual
and automatic modes of operation are compared
in Table 8. The range in the RMSE of the target
water level control in automatic mode (0.009–
0.013 m), was much smaller than the RMSE range
in the manual mode (0.118–0.178 m), which
showed that the automatic mode of operation could
control the upstream water level much better than
the manual mode. With smaller levels of water
fluctuation at the cross regulators, the regulator
could provide a more uniform discharge into the
canal. For example, if the cross regulators could
control the upstream water level within the target
water level to ± 1 RMSE, the variation of discharge
through the regulators could be estimated from the
average flow characteristics during the test as
shown in Table 9. A water level variation within
±1 RMSE from the target level could cause very
high differential hydraulic head variation (∆h
variation) for manual operation (64.7–120.4%),
compared to the variation for automatic operation
Figure 6 (Cont.)

Kasetsart J. (Nat. Sci.) 45(5) 957
Table 8 Performance of Robogate for upstream water level control of cross regulators.
Robogate Target water RMSE (m)
level (m msl) Manual operation Automatic operation
902(9021) 8.410 0.118 0.013
903 6.830 0.178 0.009
Root mean square error = RMSE = ( )WL TL
N
− 2
; msl = mean sea level.
Table 7 Comparison of statistics of the Robogate flow control parameters in manual and automatic
modes.
Regu- Flow Manual mode operation Automatic mode operation
lator control Max. Min. Mean SD CV Max. Min. Mean SD CV
parameter
901 Discharge 0.353 0.000 0.144 0.064 0.444 0.405 0.051 0.202 0.091 0.450
(m3.s-1)
9021 US water 8.726 7.891 8.391 0.115 0.014 8.436 8.309 8.409 0.013 0.002
level
(m msl)
9022 Discharge 0.263 0.000 0.094 0.040 0.426 0.152 0.000 0.115 0.012 0.104
(m3.sec-1)
903 US water 7.459 6.527 6.828 0.176 0.026 6.849 6.610 6.830 0.020 0.003
level
(m msl)
904 Tail water 8.058 6.305 7.640 0.824 0.108 7.756 7.621 7.681 0.022 0.003
level
(m msl)
905 Tail water 5.750 2.760 5.278 0.293 0.056 5.364 5.251 5.294 0.017 0.003
level
(m msl)Max. = Maximum; Min. = Minimum; CV=coefficient of variation = SD/mean; US = Upstream; msl = mean sea level.
(3.3–13.3%). High differential head variation
resulted in high discharge variation (Q variation)
with a range of 28.3–48.5% for manual operation
compared to 1.6–6.4% for automatic operation.
Therefore, it can be concluded that the KPS CAS
in automatic mode can be useful in flow regulation
and control under field conditions.
CONCLUSION
Various aspects of the field performance
of the Kamphaengsaen canal automation system
were tested on the Kasetsart University,
Kaphaengsaen campus for 600 d during the period
from 10 October 2006 to 1 June 2008. The results
showed that water level measurement using a
floating-type potentiometer sensor had a very
small error compared to manual staff gauge
measurement; the mean absolute error ranged
between 0.11 and 0.27%. The automatic upstream
control algorithm of Robogate 9021 was tested
with recordings at 5 sec intervals of the water level

958 Kasetsart J. (Nat. Sci.) 45(5)
and gate position. More than 20,200 data records
from four sample periods were obtained for the
analysis. When the upstream water level deviated
from the target water level, the gate was adjusted
4–12 times automatically before the upstream
water level was maintained at the target level. The
time period required for gate adjustment was 310–
780 sec which was acceptable for field operation.
The data recorded in the datalogger at the master
station from 10 October 2006 to 1 June 2008 were
analyzed to determine the reliability of
measurement, which was found to be acceptable
with a result of 82.7%. The automatic mode of
operation was compared to manual operation. The
results showed that the automatic mode of
operation could control the target upstream water
level with much smaller variation than the manual
mode operation. The CV of the water level in
automatic mode was much smaller than that in
manual mode. The RMSE of the target water level
control in automatic mode (0.009–0.013 m) was
much smaller than the RMSE in manual mode
(0.118–0.178 m). With smaller water level
fluctuation at the cross regulators, the regulator
could produce a more uniform discharge into the
canal. Therefore, it can be concluded that the KPS
CAS in automatic mode can be useful in flow
regulation and control. However the appropriate
Table 9 Performance of canal automation system for discharge control.
Robogate Operation TL Average ∆h RMSE ∆h variation Q variation
mode (m) DS (m) (m) (%) (%)
(m msl)
902(9021) Manual 8.410 8.312 0.098 0.118 120.4 48.5
Auto 8.410 8.312 0.098 0.013 13.3 6.4
902(9022) Manual 8.410 8.292 0.118 0.118 100.0 41.4
Auto 8.410 8.292 0.118 0.013 11.0 5.4
903 Manual 6.830 6.555 0.275 0.178 64.7 28.3
Auto 6.830 6.555 0.275 0.009 3.3 1.6
TL = Target water level; msl = mean sea level; DS = Downstream; RMSE = Root mean square error; ∆h variation(%) = 100RMSE
h∆,
Q variation(%) = 100 1100
1+ −
∆h iation var
coefficients for the linear proportional control
algorithm should be investigated in order to
improve the performance of Robogate and the
canal automation system.
ACKLOWLEDGEMENTS
This research was financially supported
by Kasetsart University research funds from 2006
to 2008.
LITERATURE CITED
Clemmens, A.J. 1987. Delivery system schedules
and required capacities, pp.18–34. In D.D.
Zimbelman, (ed.). Planning, Operation,Rehabilitation and Automation ofIrrigation Water Delivery Systems, ASCE.
New York.
Clemmens, A.J., E. Dautista and R.J.Strand. 1997.
Implementation of Canal Automation in
Central Arizona, SSVII IAHR Congress. San
Francisco, CA, USA. 5 pp.
Plusquellec, H. 1988. Improving Operation ofCanal Irrigation System. Economic
Development Institute and the Agriculture and
Rural Development Department, World Bank,
Washington, D.C. 155 pp.

Kasetsart J. (Nat. Sci.) 45(5) 959
Plusquellec, H., C.M. Burt and H.W. Walter. 1994.
Modern Water Control in Irrigation,Technical Report No.246. World Bank. 110
pp.
Renault, D., T. Facon and R.Wahaj. 2007.
Modernizing Irrigation Management: TheMASSCOTE Approach, FAO Irrigation and
Drainage Paper 63. FAO, Rome. 207 pp.
Rijo, M. 1999. SCADA of an upstream controlled
irrigation canal system, pp.123–136. In A.J.
Clemmens and S.S. Anderson, (eds.).
Modernization of Irrigation Water Delivery
Systems. Proc. of the USCID Workshop.Phoenix, AZ, USCID.
Sriwongsa, V. and V.Vudhivanich. 2008.
Development of Kamphaengsaen Canal
Automation System, The 6th RegionalSymposium on InfrastructureDevelopment, Kasetsart University,
University of the Philippines and Tokyo
Institute of Technology, 8–10 December.
Bangkok, Thailand. pp.1-6.
Vudhivanich, V. and V. Sriwongsa. 2004.
Development of supervisory control and data
acquisition system for canal regulator.
Engineering Journal Kasetsart 53: 1–11.
Vudhivanich, V. and V. Sriwongsa. 2011.
Development of a canal automation model: a
laboratory experiment. Kasetsart J. (Nat.Sci.) 45: 1–13.