Embed Size (px)
Citation preview
Journal of Hazardous Materials B81 (2001) 141–166
Field demonstration of pervaporation for theseparation of volatile organic compounds from a
surfactant-based soil remediation fluid
Leland M. Vane∗, Lynnann Hitchens,Franklin R. Alvarez, Eugene L. Giroux
U.S. Environmental Protection Agency, National Risk ManagementResearch Laboratory, Cincinnati, OH 45268, USA
Received 19 May 2000; received in revised form 5 October 2000; accepted 6 October 2000
Abstract
As part of a Department of Defense project, the US Environmental Protection Agency wasresponsible for designing, building and field operating a pilot-scale pervaporation unit. The fieldsite was an active dry cleaning facility on the grounds of Marine Corps Base Camp Lejeune inJacksonville, NC. The overall goal of the project was to remove tetrachloroethylene (PCE) from thesoil beneath the dry cleaning shop using a surfactant-based soil remediation fluid and to recycle/reusethe surfactant. In order to reinject the recovered surfactant, the pervaporation unit was required toachieve an average 95% removal of contaminants from the extracted fluid over the duration of thetest period. PCE removal averaged 95.8% during peak surfactant levels and exceeded 99.9% in theabsence of surfactant, thereby meeting the reinjection requirement. Removal of a group of secondarycontaminants at the site, termed VarsolTM compounds, was monitored via concentrations of threeVarsolTM marker compounds: decane, undecane and 1,3,5-trimethylbenzene. The pervaporationsystem processed 100,000 gal of groundwater and surfactant solution over a period of 70 days. Inorder to evaluate and validate process performance, a variety of process variables and propertieswere monitored over the course of the demonstration. Pervaporation costs are projected to be onthe order of $20 per 1000 gal of surfactant solution treated for a moderate size system (10 gpm).Published by Elsevier Science B.V.
Keywords:Pervaporation; Surfactant enhanced aquifer remediation; VOC; SEAR; Microemulsion
∗ Corresponding author. Tel.:+1-513-569-7799; fax:+1-513-569-7677.E-mail address:[email protected] (L.M. Vane).
0304-3894/01/$ – see front matter Published by Elsevier Science B.V.PII: S0304-3894(00)00337-X

142 L.M. Vane et al. / Journal of Hazardous Materials B81 (2001) 141–166
1. General overview and project description
1.1. General overview
The purpose of the Department of Defense (DoD) Environmental Security TechnologyCertification Program (ESTCP) is to demonstrate and validate the most promising inno-vative technologies that target the most urgent environmental needs and are projected topay back the investment through cost savings and improved efficiency. The purpose of theESTCP project entitled “Integrated demonstration of surfactant enhanced aquifer remedi-ation with surfactant regeneration/reuse” was to validate an in situ surfactant technologyfor residual dense non-aqueous phase liquid (DNAPL) removal from contaminated soilsand to show that an above-ground treatment system can be used to cost-effectively recycleand reuse the surfactants. The demonstration site was an active dry cleaning facility at USMarine Corps Base Camp Lejeune in Jacksonville, NC. The primary contaminant in the soilbeneath the facility was tetrachloroethylene (PCE). In this project, the US EnvironmentalProtection Agency’s (USEPA) National Risk Management Research Laboratory (NRMRL)undertook the design, assembly, testing and field operation of a pervaporation unit. Thiswork was one component of the DoD ESTCP project. The USEPA pervaporation unit wasused to remove primarily volatile DNAPL solvents from surfactant solutions, thereby en-abling the reinjection of the surfactant solution into the ground. The DoD project lead, NavalFacilities Engineering Service Center, contracted with Duke Engineering and Services Inc.for subsurface characterization and treatment tasks. The University of Oklahoma was taskedto reconcentrate surfactant by micellar enhanced ultrafiltration (MEUF) after the contami-nant had been removed. A schematic diagram of the integrated system is shown in Fig. 1.As depicted in the figure, an aqueous surfactant solution was prepared and injected into thesubsurface via wells. Groundwater and surfactant solution were recovered via extraction
Fig. 1. Schematic diagram of integrated surfactant enhanced aquifer remediation (SEAR) and surfactant recoveryprocesses.

L.M. Vane et al. / Journal of Hazardous Materials B81 (2001) 141–166 143
wells. The hydraulic gradient established between the injection and extraction wells causedthe surfactant solution to flow through the contaminated soil where contaminant mobiliza-tion and solubilization occurred. The contaminant in the solution recovered at the extractionwells was then removed using a pervaporation unit. The decontaminated surfactant solutionwas then reconcentrated by ultrafiltration before being mixed with fresh surfactant prior toreinjection.
The USEPA objective for the pervaporation demonstration was to achieve at least 95%single pass removal of tetrachloroethylene (PCE) and 95% averaged removal of VarsolTM
components from a surfactant enhanced aquifer remediation (SEAR) fluid. VarsolTM isa hydrocarbon-based dry cleaning solvent which was used at the facility prior to PCE.VarsolTM components are present in the DNAPL at concentrations 2–4 orders of magnitudelower than PCE. Measurement of the PCE removal objective was based on weekly averagesof PCE removal for the duration of the demonstration. Measurement of the VarsolTM removalobjective was based on the average removals of three VarsolTM marker compounds: decane,undecane and 1,3,5-trimethylbenzene. It was expected that the VarsolTM removal objectivewould be met when weekly averages of VarsolTM removal exceed 95% at the end of thepervaporation treatment project as surfactant concentrations declined during the post-SEARwater flood.
1.1.1. The process (mention of trade names, vendors, or commercial products does notconstitute an endorsement or recommendation for use)
In pervaporation, as applied in this project, a liquid stream containing VOCs is placed incontact with one side of a non-porous polymeric membrane while a vacuum or gas purge isapplied to the other side. Pervaporation is pictorially represented in Fig. 2. The componentsin the liquid stream sorb into the membrane, permeate through the membrane and evaporateinto the vapor phase (hence the word pervaporate). The vapor is then condensed. By using
Fig. 2. Pictorial representation of the removal of VOCs from surfactant solution by pervaporation.

144 L.M. Vane et al. / Journal of Hazardous Materials B81 (2001) 141–166
Fig. 3. Schematic diagram of USEPA pervaporation field unit at Marine Corps Base Camp Lejeune.
a membrane which is VOC-selective, the material on the vapor side of the membrane, oncecondensed, will contain VOCs with concentrations significantly higher than those on theliquid side of the membrane. A concentration factor of 1000 is not uncommon. Due to thelow solubility of VOCs in water, a pure VOC phase and a VOC-saturated water phase areformed when the permeate vapor is condensed. If alcohols are present in the SEAR fluidformulation, a portion of those alcohols will be transported through the membrane and willpartition between the water and VOC permeate phases. Since the surfactant is hydrophilic,ionic and has a low vapor pressure, it should not be a component of the permeate and thus,it will remain on the feed/liquid side of the membrane.
In 1995, USEPA-NRMRL initiated pilot and bench-scale tests of pervaporation forremoving volatile organic compounds (VOCs) such as 1,1,1-trichloroethane (TCA) andtoluene from surfactant solutions [1–4]. These experiments showed that pervaporation couldeffectively remove all of the studied VOCs from surfactant solutions. However, the presenceof the surfactant did diminish removal efficiencies.
The pervaporation field unit was assembled by IT Corporation based on specificationsprovided by the USEPA. A simplified schematic diagram of the unit is provided in Fig. 3 andfeatures of the system are detailed below. IT Corporation and USEPA engineers designedthe system. The pervaporation system was designed for unattended operation. The systemautomatically controlled feed flow, feed pressure, vacuum pressure and emptied the perme-ate reservoirs. Two pervaporation membrane systems were operated in series. The first wasa single vibrating membrane module containing approximately 10 m2 of membrane. Thesecond was a grid of up to 36 hollow fiber membrane modules, each containing 3 m2 of

L.M. Vane et al. / Journal of Hazardous Materials B81 (2001) 141–166 145
membrane area. The arrangement and number of hollow fiber modules used was modifiedthroughout the demonstration to enhance performance.
In the field demonstration, the surfactant solution was pumped from six extraction wellsby Duke Engineering to a three-way valve at the front end of the pervaporation system. Fluidfrom the extraction wells was blended into one stream before it arrived at the pervaporationunit. The total extraction flow rate averaged 1.0 gpm. The Camp Lejeune pervaporationfield unit was designed to achieve 95% removal of PCE from this extracted fluid. Thefluid contained variable amounts of surfactant (Alfoterra 145 4 PO ether sulfate (Alfoterra145), also referred to as Isalchem 145 or IC145), isopropyl alcohol (IPA), calcium chloride(CaCl2) and contaminants. The alcohol was added to the SEAR fluid to reduce the viscosityof the surfactant-DNAPL microemulsion. The CaCl2 was added to reduce mobilization ofsoil fines that might plug the soil pores and to enhance the DNAPL solubilization behaviorof the surfactant. At the onset of the remediation demonstration, water containing CaCl2was injected. As a result, the fluid extracted initially did not contain any surfactant. As thedemonstration progressed, however, the injected fluid contained 4 wt.% surfactant, 16 wt.%IPA and 0.2 wt.% CaCl2. As a result, the concentration of Alfoterra 145 in the extracted fluidincreased over time and was expected to plateau at 1.5 wt.%, with IPA rising to 6.0 wt.%.The resulting PCE concentration in the pervaporation feed stream was predicted to reacha maximum of 10,000 mg/l. Since IPA was intentionally added to the SEAR fluid, it wasnot considered to be a contaminant, thus, no IPA removal objective was defined for thepervaporation equipment. However, the concentration of IPA in the system was monitoredto determine the level of removal achieved by the pervaporation system.
In case of an emergency shutdown of the treatment system, the three-way valve divertedflow to a waste tanker. This safety feature was only activated once during 70 days ofoperation, the result of a faulty flowmeter which caused an 11 h pervaporation systemshutdown. In normal operation, the three-way valve allowed the surfactant solution to flowinto an oil–water separator. The purpose of this separator was to remove any free-productDNAPL from the surfactant solution using gravity separation. The lower drains of thisseparator were connected to a 55 gal stainless steel drum for DNAPL and grit collection. Theoverflow from the oil–water separator gravity flowed to a 1000 gal epoxy-lined fiberglassreinforced plastic “feed” tank (Raven Industries Model DF354). The contents of this tankcould be pH adjusted using a 20 gpm recirculation loop equipped with an acid additionsystem. The target pH of the feed solution was 4.5 to reduce the likelihood of formingcarbonate precipitates and scales in the system. A nitrogen blanket was applied to both thefeed tank and oil–water separator to minimize oxidation of soluble iron, thereby reducingthe formation of iron precipitates. The pervaporation feed pump (Eastern Centrichem PumpModel ET7M-1725), drew fluid from the bottom of the feed tank at approximately 1 gpm.The level of fluid in the feed tank was held approximately constant, even though flow fromthe wells was variable, by automatically or manually adjusting the feed flow rate. Thus,the feed to the pervaporation modules was also somewhat variable but averaged 1.0 gpm.The feed solution was pumped through a heat exchanger (Vicarb Inc.), an electric heater(Gaumer Co., Model C4F6N 40H4-RK-ER-X, 30 kW heater with Fenwal Series 920 Model923 digital indicating controller with Newport Model 82 alarm unit) and a two-stage bagfiltration system (Strainrite Bag Filter, Harrington Corro-Flo) with the finest filter beingeither 1 or 5mm nominal particle retention. In the heat exchanger, the influent stream

146 L.M. Vane et al. / Journal of Hazardous Materials B81 (2001) 141–166
was preheated using heat recovered from the treated pervaporation residual stream. A UVsystem (Ideal Horizons, Model SSWE-6) located after the filters sterilized the solution toreduce biofilm growth in the MEUF system. Biofilm growth on the silicone pervaporationmembranes was not expected to be a problem.
Pretreated surfactant solution was sent to a vibrating pervaporation system (New LogicInternational, 15 in. i-series VSEP unit) for initial PCE removal. The solution was thensent to a series of hollow fiber membrane modules (Applied Membrane Technology, ModelPVCTXS1SS) for additional PCE removal. The treated surfactant solution then flowedthrough the recovery heat exchanger, a pH adjustment loop (to raise pH prior to MEUF)and then to an MEUF storage tank, where the solution was then processed by the Uni-versity of Oklahoma. Vacuum was supplied to both pervaporation membrane systems bya multi-stage dry chemical vacuum pump with integrated vapor compression and conden-sation (Stokes Vacuum, CD-75 Dry Pump, 75 cfm nominal, 5 hp). A recirculating chiller(Icewagon Industries, Model DE5AC, 5 t capacity) provided coolant at 2◦C to condensethe permeate. The two-phase (water and organic) permeate condensate was pumped fromthe condenser reservoirs to a PCE/water gravity separator. The PCE phase was manuallydrawn off the bottom of this separator and transferred to a solvent disposal drum providedby Baker Environmental. The permeate water was transferred to a waste tanker, although, itcould have been returned to the feed tank for further processing. Each liquid process streampassed through a flow totalizer in order to provide data for mass balance calculations.
1.2. Experimental design
Operation of the field unit followed detailed written procedures to ensure consistent per-formance. The system operating conditions — process temperatures, feed flowrate, residualpressures and permeate (vacuum) pressure — were maintained and monitored at least twiceper day. Three times each week (usually on Monday, Wednesday, and Saturday), a set ofsamples was taken from the feed stream, outlet stream of the VSEP membrane system andoutlet stream of the hollow fiber module system, designated Feed, Residual 1 (Resid1) andResidual 2 (Resid2), respectively. These samples were sent to USEPA facilities in Cincin-nati for PCE determination by GC/FID analysis using an autosampler (Archon, VarianCorp.), purge & trap concentrator (LCS3000, Tekmar Corp.) and a Finnigan/Tremetrics9001 GC equipped with a DB-624 megabore column and flame ionization detector (FID).Bromobutane was added to all samples by the autosampler as a surrogate to monitor theproper operation of the analytical system. Each Monday, a separate set of Feed and Resid2samples was obtained and sent to USEPA-Cincinnati for PCE/VarsolTM determination byGC/MS (HP 6890 equipped with a HP624 column) using an autosampler (Archon, VarianCorp.) and purge & trap concentrator (LCS3000, Tekmar Corp.). The sampling methodwas similar for all sampling points. The needle of an airtight syringe was inserted througha septum port installed on each process line to be sampled. Since the process streams werepressurized, sample was forced into the syringe when the plunger was pulled back, thus,avoiding the creation of vacuum conditions in the syringe which might volatilize VOCs.After flushing, a slight excess of sample was drawn into the syringe. The syringe needlewas then withdrawn from the septum port, excess sample expelled and the desired samplevolume was injected into a volumetric flask of water (either 50 or 100 ml) which contained

L.M. Vane et al. / Journal of Hazardous Materials B81 (2001) 141–166 147
3 to 6 drops of antifoam (the antifoam was prepared daily by diluting 1 g of Dow Antifoam Cwith 5 g water). The volumetric flask was promptly mixed by inverting and shaking at leastthree times, a portion of the contents was poured into a labeled 40 ml EPA vial, completelyfilling the vial. In general, only one dilution of each stream was performed. In some cases,two dilutions were performed to ensure that one set was within the linear calibration rangeof the off-site GC. The maximum dilution used was 500-fold (200ml in 100 ml). At thehighest surfactant concentrations, a minimum of a 40:1 dilution was applied in order to re-duce surfactant concentrations to minimize foam generation during purging. Each dilutionwas performed in triplicate, starting with acquisition of the sample by syringe. At least twoof the three triplicate samples were analyzed. Permeate samples were collected at the samefrequency as feed samples in undiluted form in 40 ml vials (for water or organic phases)or in 2 ml vials (only for organic phase). Later in the demonstration, the permeate organicphase which had been collected during the preceding week, was weighed and subsampled.
All field samples were stored in a refrigerator at 4◦C. The samples were shipped inStyrofoam containers chilled with ice packs to Cincinnati approximately two times perweek. The samples were analyzed upon receipt at USEPA-Cincinnati facilities. Unanalyzedsamples were stored in a refrigerator at 4◦C. The maximum storage time was 4 days.Acceptable PCE recoveries from field matrix spike samples indicated little or no decay inconcentration due to storage. Organic phase samples and water samples for IPA analysiswere expected to have even longer acceptable storage times of up to 14 days.
In order to evaluate the contaminant removal performance of the pervaporation system,several other process variables were measured. These non-critical parameters included sur-factant concentration and IPA concentration. Surfactant analysis were provided by the Uni-versity of Oklahoma based on a high performance liquid chromatography (HPLC) method.IPA analysis were performed on-site by IT Corporation using a GC/FID.
2. Pervaporation system design considerations
In planning for this field demonstration, USEPA engineers drew from pervaporation fielddemonstration experiences of outside organizations as well as their own experiences. In a1996 field demonstration, performed by Membrane Technology and Research, Inc. (MTR),pervaporation was used to remove VOCs from groundwater at the DOE Pinellas Plant, FL.Ferrous iron in the range of 8–26 mg/l caused repeated fouling of spiral wound pervaporationmodules [5]. Based on reported observations, ferrous ions were oxidizing to ferric ions whenthe anoxic groundwater came in contact with air in process drums. Ferric compounds havean extremely low solubility in water, thus, iron precipitates formed throughout the system.The precipitates accumulated in the pervaporation modules causing flow channel pluggingwhich lead to increased pressure drops and reduced process efficiency.
In a 1995 field demonstration, pervaporation was used by Zenon Environmental to removeVOCs from groundwater at the Naval Air Station North Island near San Diego, CA [6]. In thisdemonstration, the pervaporation system consisted of hollow fiber membranes. Iron particlesand carbonate scales caused module blockage. The brackish groundwater contained highconcentrations of calcium (circa 200 mg/l) and magnesium ions (circa 500 mg/l) which tendto form scale precipitates in water containing carbonates, especially when heated. At this site

148 L.M. Vane et al. / Journal of Hazardous Materials B81 (2001) 141–166
groundwater was heated to approximately 70◦C before entering the pervaporation modulewhich likely caused the formation of carbonate scales and precipitates. In addition, the sys-tem was operated in a multi-pass mode in which the flow rate through the module was severaltimes higher than the groundwater flow rate. While this mode of operation yielded higherprocess efficiencies, it also created high retention times for precipitate nuclei, giving thenuclei more time to grow into particles which could plug the modules. The iron particles ap-peared to come from a carbon steel equilibration tank in which the groundwater was stored.Use of the tank was discontinued once it was identified as the source of the iron particles.
Finally, in 1996–1997 the USEPA performed a pilot-scale demonstration of pervapora-tion for the removal of VOCs from an actual SEAR fluid [1]. This SEAR fluid came from ademonstration conducted by the University of Texas, the Air Force Center for Environmen-tal Excellence and Duke Engineering and Services at Hill Air Force Base Operable Unit2 (OU-2) site. The OU-2 site had been contaminated with a degreasing solvent, primarilytrichloroethylene (TCE). Due to its use, the solvent contained some oil and grease. TheSEAR fluid and the degreasing solvent formed a stable microemulsion thereby enablingthe hydraulic removal of the contaminant from the subsurface. However, when the solventwas removed, the residual oil was not solubilized by the SEAR fluid alone. Thus, when thepervaporation system removed the chlorinated solvent, oil was released from the fluid andbecame deposited on surfaces in the pervaporation module. Spiral wound modules fromHoechst Celanese Corporation were employed (similar in design to the MTR spiral woundmodules). The oil coated the liquid flow spacer in the module, causing flow restrictions,increased pressure drops and reduced performance. Subsequently, experiments were per-formed with novel hollow fiber modules designed and produced by New Jersey Instituteof Technology (NJIT) and Applied Membrane Technology (AMT) [7]. Although, oil alsobecame deposited in the NJIT/AMT modules, the design of these modules allowed for thecontinuous removal of the oil through the membrane (paper in preparation). Unfortunately,the hollow fiber modules had limited temperature and pressure operating ranges. The life-time before leakage in the modules was also suspect. No severe iron or carbonate issueswere encountered with the Hill AFB SEAR fluid. However, a sandy particulate materialwas found to accumulate at the ends of the hollow fiber modules. It was concluded thatthis material was a form of heater scale which had likely flaked off the heater elements andmade its way to the modules.
Throughout these experiments, it was determined that pervaporation effectively removedVOCs from groundwater and SEAR fluids. However, a variety of common groundwaterand SEAR compounds had caused severe operating restrictions. The Camp Lejeune per-vaporation system included several equipment and operating features designed to avoidthe problems encountered in previous demonstrations. First, the feed tank was blanketedwith nitrogen gas at a pressure of 2–6 in. of water. A water leg on the tank served as apressure relief outlet. Thus, little or no oxidation of ferrous iron would occur in the perva-poration system. In addition, during normal operation, the fluid level in the tank would beheld constant, thus, reducing the pressure fluctuations in the feed tank, reducing the likeli-hood of air being drawn into the tank and also reducing nitrogen usage. The MTR Pinellasdemonstration had used surge tanks and feed tanks in which fluid from the surge tank wasperiodically transferred to the feed tank, thus, tank levels changed, sometimes rapidly, dur-ing the process causing reduced pressure conditions which lead to air being drawn into the

L.M. Vane et al. / Journal of Hazardous Materials B81 (2001) 141–166 149
tanks. For the Camp Lejeune Unit, a pH adjustment loop was added to the feed tank so thatthe pH of SEAR fluid could be lowered to reduce the likelihood of carbonate precipitateformation. A solution of hydrochloric acid could be added to acidify the contents of thetank with a target pH of 4–4.5. Typical silicone pervaporation membranes are stable overa range of pH conditions, from acidic to basic, although, strongly basic conditions shouldbe avoided. A second pH adjustment loop was located at the outlet from the pervaporationsystem in order to return the pH to that desired for SEAR fluid reinjection. Further, tominimize formation of scale in the electric heaters, it was recommended that a maximumheater core temperature of 50◦C be employed, thus, restricting the feed temperature to thepervaporation modules to the range of 40 to 50◦C. In case heater scale formed and flakedoff, bag filters were located between the heater and the pervaporation modules. Filters with25, 10, 5 and 1mm nominal particle retention were available. Since spiral wound modulesappeared to be susceptible to fouling by precipitates and oils, it was decided that this typeof module would not be used for the Camp Lejeune demonstration. Instead, new pervapo-ration modules were designed, tested and scaled-up to deal with the problems encounteredin past tests. A vibrating membrane system from New Logic International was modifiedto accept pervaporation membranes and operate in pervaporation mode. This system offershigh efficiencies and very low fouling potential. A modified hollow fiber module designfrom AMT was also employed. Finally, thick membranes were used to lessen the water fluxthrough the membranes, thereby reducing the temperature drop due to evaporation and thecooling capacity for condensation in the vacuum pump. The membranes used were thickerthan desired due to production limitations for the novel membrane modules. All of thesedesign issues and operating parameters were selected prior to field operation and beforefull knowledge of groundwater chemistry was available. As a result, some of them may nothave been necessary and additional changes may have been advisable.
3. Pervaporation system performance
3.1. Timeline of pervaporation field activities
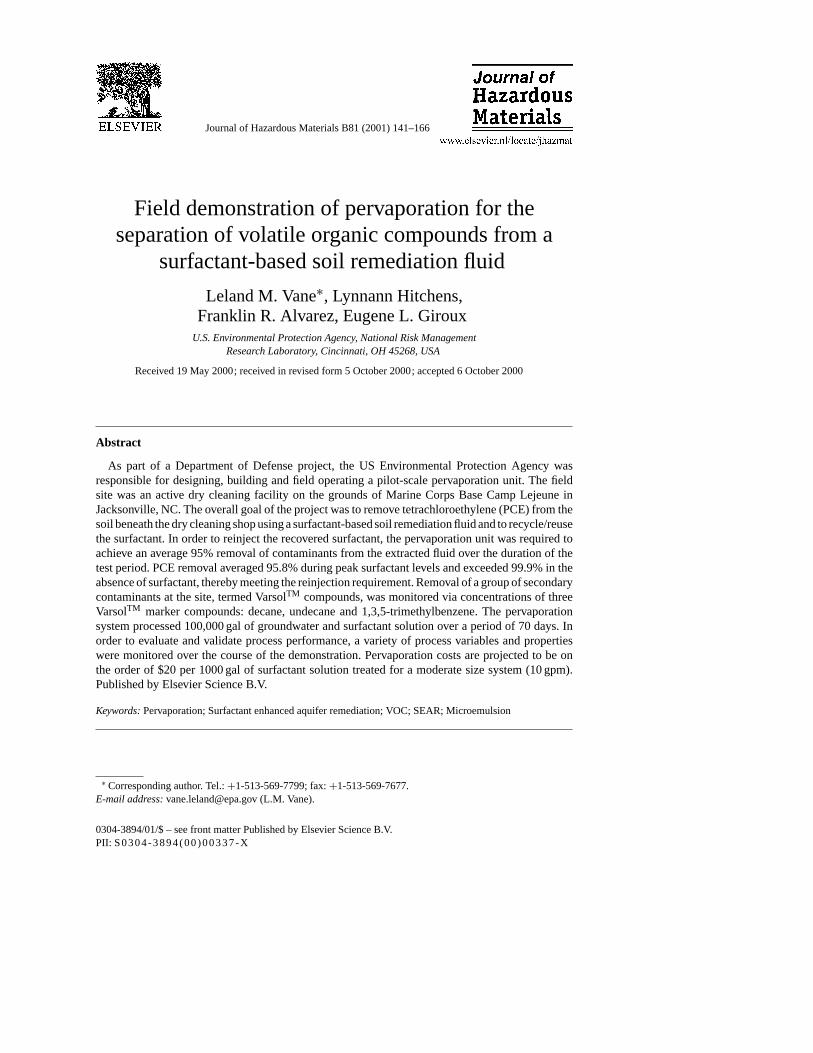
The field pervaporation system was delivered to the Camp Lejeune site on Wednesday, 17March 1999. A field tent was used as weather protection for the system. The floor of the tentconsisted of a double layer of polypropylene sheeting covered with plywood. A berm aroundthe inside edge of the tent provided secondary containment for any accidental spills. Picturesof the membrane systems and of the inside of the tent are provided in Fig. 4. Installation andstart-up testing of the pervaporation system was completed on Friday, 19 March 1999. Thesystem was then operated in recirculation mode (treated residual was returned to the feedtank) using tap water as the feed liquid. The pervaporation system operated in this mode untilMonday, 29 March 1999 at 14:30 h (day 0), when the system began accepting groundwaterfrom the six extraction wells. On day 0, the pervaporation system was switched to single passmode in which extracted water was withdrawn from the feed tank, processed through thepervaporation modules, then sent either to a waste tanker or to the MEUF feed tanks. Treatedfluid was sent to the waste tanker until 18:30 h, 15 April 1999 (day 17) when it was directedto the MEUF feed tank. Prior to day 17, surfactant concentrations were too low to make

150 L.M. Vane et al. / Journal of Hazardous Materials B81 (2001) 141–166
ultrafiltration practical. Surfactant injection into the subsurface was halted on the afternoonof Thursday, 3 June 1999 (day 66). The pervaporation system accepted extracted fluid untilthe morning of Monday, 7 June 1999 (day 70). At this time, USEPA staff performed a 50%dilution of material in the feed tank to determine the effect of diluting the surfactant on PCEremoval. After approximately 24 h of flushing with tap water, the pervaporation system wasshut down on Tuesday, 8 June 1999. Originally, the pervaporation system was to be operateduntil surfactant concentrations dropped to approximately 0.1 wt.% during the post-SEARwater flood. Due to a 2-week extension in the SEAR flood and scheduling conflicts, it wasnot possible to operate the pervaporation system past day 70. The pervaporation systemwas disassembled and returned to the USEPA’s Test and Evaluation Facility in Cincinnati,OH during the week of 28 June 1999.
Fig. 4. Pictures of (a) vibrating pervaporation unit (b) hollow fiber pervaporation modules and (c) Camp Lejeunepervaporation field system.

L.M. Vane et al. / Journal of Hazardous Materials B81 (2001) 141–166 151
Fig. 4. (Continued).

152 L.M. Vane et al. / Journal of Hazardous Materials B81 (2001) 141–166
3.2. Process parameters and measurements
3.2.1. Iron, calcium, pHDuring the Camp Lejeune demonstration, influent ferrous iron concentrations ranged
from 8 to 19 mg/l, averaging 14 mg/l, similar to concentrations which caused problems inthe Pinellas pervaporation demonstration. The concentration of ferrous iron leaving the per-vaporation system was 13 mg/l, the same as the influent concentration considering samplingand analytical errors/variability. No iron precipitates were observed in the system. Thus,it appears that the nitrogen blanketing system worked effectively. The average pH of theextracted water was 4.3, within the target range for the feed tank, thus, no pH adjustmentwas necessary. The calcium concentration was on the order of 300 mg/l due to the additionof CaCl2 to the SEAR fluid. No calcium or carbonate precipitate was observed in the filtersor membrane modules. Initially, filters of 25 and 5mm retention were used in series. Thesewere removed once to determine their condition and replaced with 5 and 1mm filters. Apressure drop increase across the filters was never observed. A fine grey colored particlewas seen in the filter, although, no accumulation on the filter surface was apparent. The greyparticles were likely clay fines from the soil. Aside from the grey color, the original filtersappeared to be in good shape.
3.2.2. TemperatureThe target feed temperature into the first membrane unit of the Camp Lejeune pervapo-
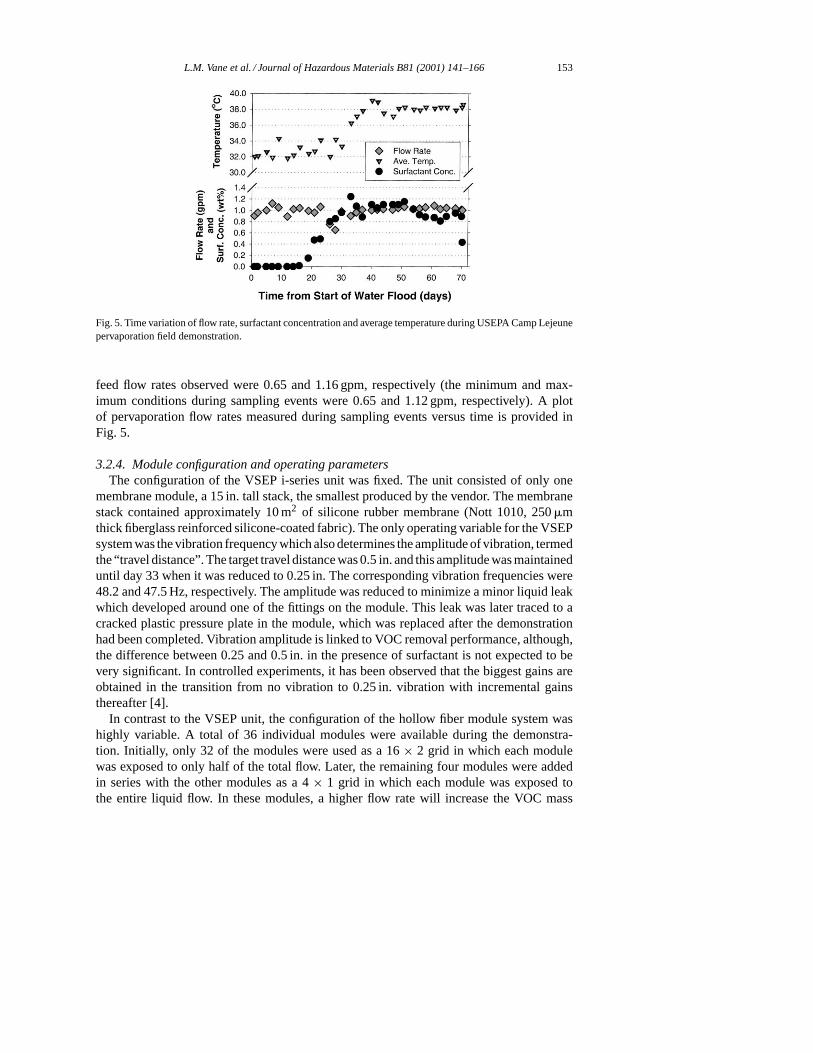
ration system was 40◦C. Due to heat losses from hoses, filters and piping, the temperatureof the fluid entering the first pervaporation module was 5 to 6◦ below the heater set point.Temperatures at the second pervaporation system were 8 or 9◦ below the heater set point.Since system performance is a function of temperature, the reduced temperatures in thepervaporation systems were resulting in lower PCE removal performance. In addition, be-cause the temperature of the residual fluid was low, limited heat could be recovered topre-heat the feed. Thus, the heater was required to make up for the heat losses, resultingin heater core temperatures greater than the 50◦C desired maximum. Mid-way through thedemonstration, insulation was installed on process hoses and equipment to reduce temper-ature losses. Foam insulation was installed on hoses while plastic sheeting was draped overthe hollow fiber module grid. In addition, the heater set point was raised so that the tem-perature of fluid entering the first pervaporation module approached 40◦C. These changesyielded fairly stable operating temperatures during the second half of the demonstration.The temporal variation of the average temperature in the pervaporation modules is shown inFig. 5.
3.2.3. Flow rateThe target flow rate for the combined extraction wells was 1.0 gpm. Due to calibration
difficulties, filter plugging and extraction pump malfunctions during the first several weeksof the SEAR demonstration, the flow rate from the extraction wells to the pervaporationsystem was somewhat variable. Eventually, the extraction rates were better behaved andpervaporation flow rate stabilized. The average feed flow rate to the pervaporation sys-tem was 0.99 gpm. On a few occasions, a high or low flow rate was required to keep upwith the pumping rate for the extraction wells. The minimum and maximum pervaporation
L.M. Vane et al. / Journal of Hazardous Materials B81 (2001) 141–166 153
Fig. 5. Time variation of flow rate, surfactant concentration and average temperature during USEPA Camp Lejeunepervaporation field demonstration.
feed flow rates observed were 0.65 and 1.16 gpm, respectively (the minimum and max-imum conditions during sampling events were 0.65 and 1.12 gpm, respectively). A plotof pervaporation flow rates measured during sampling events versus time is provided inFig. 5.
3.2.4. Module configuration and operating parametersThe configuration of the VSEP i-series unit was fixed. The unit consisted of only one
membrane module, a 15 in. tall stack, the smallest produced by the vendor. The membranestack contained approximately 10 m2 of silicone rubber membrane (Nott 1010, 250mmthick fiberglass reinforced silicone-coated fabric). The only operating variable for the VSEPsystem was the vibration frequency which also determines the amplitude of vibration, termedthe “travel distance”. The target travel distance was 0.5 in. and this amplitude was maintaineduntil day 33 when it was reduced to 0.25 in. The corresponding vibration frequencies were48.2 and 47.5 Hz, respectively. The amplitude was reduced to minimize a minor liquid leakwhich developed around one of the fittings on the module. This leak was later traced to acracked plastic pressure plate in the module, which was replaced after the demonstrationhad been completed. Vibration amplitude is linked to VOC removal performance, although,the difference between 0.25 and 0.5 in. in the presence of surfactant is not expected to bevery significant. In controlled experiments, it has been observed that the biggest gains areobtained in the transition from no vibration to 0.25 in. vibration with incremental gainsthereafter [4].
In contrast to the VSEP unit, the configuration of the hollow fiber module system washighly variable. A total of 36 individual modules were available during the demonstra-tion. Initially, only 32 of the modules were used as a 16× 2 grid in which each modulewas exposed to only half of the total flow. Later, the remaining four modules were addedin series with the other modules as a 4× 1 grid in which each module was exposed tothe entire liquid flow. In these modules, a higher flow rate will increase the VOC mass

154 L.M. Vane et al. / Journal of Hazardous Materials B81 (2001) 141–166
Fig. 6. Schematic diagram of the hollow fiber module configurations used during the demonstration. The lowertwo modules are shown connected in parallel (n × 2) and the upper two modules are shown connected in series(n × 1). The two sets are connected in series with regard to liquid flow but in parallel with regard to the vacuum.
transport efficiency. Thus, a 24× 1 grid will be more efficient than a 12× 2 grid al-though, the same number of modules are used. The main negative effect of ann × 1grid is a higher pressure drop. Since higher flow rates and pressures can cause modulefailures due to fiber leaks, there is a tradeoff between improved VOC removal efficiencyand possible damage to the modules. By the end of the demonstration, 24 of the mod-ules were operated as a 24× 1 grid in order achieve the desired levels of PCE removal.The remaining modules were operated in a 5× 2 or 6× 2 grid. A schematic diagramshowing the difference between then × 1 andn × 2 module configurations is provided inFig. 6.
3.2.5. Surfactant and alcoholAs mentioned previously, the surfactant concentration was expected to change signifi-
cantly over the course of the demonstration, starting with no surfactant, rising to a plateauof 1.5 wt.%, then dropping during the post-SEAR water flood. A temporal plot of surfactantconcentration is also provided in Fig. 5. Surfactant injection commenced on 6 April 1999(day 8) and due to the retention time of the test plot, quantifiable levels of surfactant werenot observed until 14 April 1999 (day 16). Due to higher than expected subsurface dilution,the surfactant concentration in the fluid from the six extraction wells never reached theexpected peak of 1.5 wt.%. The highest observed surfactant concentration was 1.2 wt.%on day 33. The average surfactant concentration during the plateau region was 1.0 wt.%.During this same time, the IPA concentration rose from 0 to a plateau average of 4.1 wt.%,or roughly four times the surfactant concentration — the same ratio as for the injection fluid(4 wt.% surfactant and 16 wt.% IPA). The pervaporation system removed about 5% of the

L.M. Vane et al. / Journal of Hazardous Materials B81 (2001) 141–166 155
IPA resulting in an average concentration in the residual stream of 3.8 wt.%. Significantlymore IPA would have been removed if thinner membranes had been utilized. The permeatewater condensed in the vacuum pump contained up to 30 wt.% IPA due to the selectivity ofthe silicone membrane for IPA relative to water.
3.2.6. PCE concentrations and removalPreliminary modeling of the subsurface extraction system performed by the University of
Texas at Austin predicted that PCE concentrations in the mixed extracted fluid would start atabout 70 mg/l during the pre-SEAR water flood, rise to a maximum of 10,000 mg/l during theSEAR and decline to 40 mg/l during the post-SEAR water flood. Concentrations in excessof 1000 mg/l were predicted for a period of approximately 40 days. PCE concentrationsactually observed in the pervaporation feed and final residual (effluent) streams are displayedin Fig. 7. PCE concentrations started at 35 mg/l. After only 5 days, feed concentrationsapproached the PCE water solubility limit of 240 mg/l, likely due to the presence of DNAPLin the process lines and oil/water separator. PCE concentrations remained below the watersolubility of PCE until surfactant appeared in the extraction fluid. However, as shownin the figure, PCE concentrations in the pervaporation system never exceeded 1000 mg/l,reaching a maximum of 890 mg/l. It was later observed that the input parameters for thesubsurface modeling program overestimated the level and extent of contamination. ThePCE concentration in the final Residual (Resid2) stream ranged from below detection limits(<0.05 mg/l) to 61 mg/l. These concentrations translate to PCE removal efficiencies rangingfrom 93.1 to 99.96% PCE removed. The fraction of PCE removed in the VSEP membranesystem (XVSEP) was calculated according to the following relationship:
XVSEP = (CF − CR1)
CF(1)
Fig. 7. Feed and effluent (Resid2) PCE concentrations measured during Camp Lejeune pervaporation field demon-stration, note: error bars represent the standard deviation of duplicate analysis, error bars are generally smallerthan the size of the symbols.

156 L.M. Vane et al. / Journal of Hazardous Materials B81 (2001) 141–166
Fig. 8. Variation of the overall fraction of PCE removed by pervaporation field unit for each sampling event(symbols) and the moving weekly average removal (line) with elapsed time. Overall removal calculated from datain Fig. 6. Note: size of error bars is smaller than the size of the symbols.
The fraction removed in the hollow fiber membrane system (XHF) is
XHF = (CR1 − CR2)
CR1(2)
The total fraction of PCE removed by the process (XT) was determined by
XT = (CF − CR2)
CF(3)
whereCF is Feed concentration (mg/l);CR1 intermediate Residual (Resid1) concentration(mg/l); CR2 final Residual (Resid2) concentration (mg/l).
The overall fraction of PCE removed, determined for each sampling event, is plottedin Fig. 8. The moving weekly average (average of three successive measurements) is alsodisplayed in Fig. 8. As seen in the figure, the moving average only dropped below the targetof 95% removal on two occasions and never dropped below 94%. It should be noted thatrelative PCE removal was not a function of PCE feed concentration, at least not for theconcentrations encountered in this project. In other words, a system which removes 95% ofPCE from a solution containing 50 mg/l will remove 95% from the same solution containing1000 mg/l. The residual solutions will have significantly different levels of PCE (2.5 versus50 mg/l), but the fraction of PCE removed will be the same.
PCE removal will, however, be a function of surfactant concentration, flow rate, temper-ature and membrane module configuration. Surfactant reduces process efficiency becauseof the partitioning of the VOC into the surfactant micelles, thereby reducing the availability,or activity, of the VOC [2,3,8,9]. Increasing surfactant levels will reduce VOC removal fora pervaporation system. In simplistic terms, flow rate effects removal as follows:
CR
CF= exp
(−kA
Q
)(4)

L.M. Vane et al. / Journal of Hazardous Materials B81 (2001) 141–166 157
Fig. 9. Time variation of the fraction of PCE removed in the vibrating VSEP and hollow fiber pervaporationsystems and the overall PCE removed by the Camp Lejeune pervaporation unit.
whereCR is the Residual VOC concentration,CF is the Feed VOC concentration,k isthe overall lumped mass transport coefficient,A is membrane area andQ is the flow rate.Thus, all other variables being equal, VOC removal is an exponential function of flow rate.However, the removal of VOCs from water is typically controlled by diffusion throughthe liquid boundary layer next to the membrane, a situation referred to as “concentrationpolarization”. In these cases,k is also a function ofQ, so the relationship between removaland flow rate can be quite complex.
All things considered, changes in surfactant concentration will dominate PCE removalperformance while temperature, flow rate, and module configuration will have secondaryeffects. Therefore, it was expected that PCE removal would be high initially, then dropwhen surfactant appeared in the extracted fluid. This is the general trend observed in Fig. 8.Overlaid on this general trend, changes in the other process parameters caused day today variations in PCE removal. This relationship can be observed by comparing the processvariables in Fig. 5 to the PCE removal performance in Fig. 8. A spike in PCE removal on day28 corresponds to the lowest flow rate encountered during the demonstration. Although, theoverall PCE removal was of importance for meeting regulatory reinjection requirements, theindividual performance of the two pervaporation systems was of interest for understandingthe behavior of these systems. The performance of each system is shown in Fig. 9. In thisfigure, the fraction of PCE removed by each system, of the PCE entering that particularsystem, is displayed. For systems operated in series, the overall fraction removed (XT) iscalculated from the individual fraction removals (XVSEP andXHF) as follows:
(1 − XT) = (1 − XVSEP)(1 − XHF) (5)
or, in terms of the fraction remaining,Yi :
YT = YVSEPYHF (6)
whereYi = 1 − Xi .

158 L.M. Vane et al. / Journal of Hazardous Materials B81 (2001) 141–166
Table 1PCE removal performance for each pervaporation subsystem and the overall system in the presence and absenceof surfactant
Pervaporation system Fraction of PCE removeda
No surfactant (days 5–16) Surfactant plateau region (days 28–70)
VSEP system 0.9887± 0.0019 0.655± 0.026Hollow fiber system 0.947± 0.015 0.875± 0.024Overall pervaporation system 0.99936± 0.00025 0.9576± 0.0035
a Average and 95% confidence limits provided.
Performance of the VSEP system declined with increasing surfactant concentration andonly showed variation with flow rate while temperature effects were minor for the rangeof temperatures experienced in this project. Performance of the hollow fiber system alsodeclined with increasing surfactant concentrations, but rebounded as process temperatureswere raised and more modules were brought on-line (on day 28). In addition, the configu-ration of the modules was modified as the project progressed in order to improve efficiency.As noted previously, an experiment was performed on the final day of operation, in whichthe contents of the feed tank were diluted 50% to observe the effect on PCE removal. Asseen on day 70 in the figures, PCE removal increased for both pervaporation systems asthe surfactant was diluted from 0.89 to 0.43 wt.%. The performances of each pervaporationsystem, in the presence and absence of surfactant, are detailed in Table 1.
As seen from this data, the pervaporation system achieved a very high removal of PCEin the absence of surfactant (>99.9%) and exceeded the project objective of 95% PCEremoval in the presence of surfactant, achieving an average PCE removal of 95.8% duringthe surfactant plateau region. Although, the hollow fiber system exhibited a higher PCEremoval performance than the VSEP system in the presence of surfactant, the VSEP systemwas more efficient considering the amount of membrane area involved — the hollow fibersystem contained 10 times more membrane area than the VSEP. The VSEP delivered a PCEremoval performance equivalent to a hollow fiber system containing five times as muchmembrane area.
3.2.7. PCE mass balance and permeate waterMass balance calculations were made by comparing the mass of PCE which was removed
(based on feed flow rate and Feed/Residual sample data) to the mass of PCE which wascollected as permeate (based on permeate flows and concentrations). The mass of PCE inthe feed should be equal to the sum of the PCE (1) remaining in the final Residual, (2)dissolved in the permeate water, (3) present in the permeate organic and (4) escaping withincondensable gases from the vacuum pump. The mass of PCE removed by the membranesystem and recovered as permeate were calculated according to the following expressions:
Mremoved= Qt(CF − CR2) × 10−6 (7)
Mrecovered= Mporgwporg + Mpwwpw = (VporgCporg + VpwCpw) × 10−6 (8)

L.M. Vane et al. / Journal of Hazardous Materials B81 (2001) 141–166 159
whereMremovedis mass of PCE removed by the membrane (kg),Q volumetric feed flowrate (l/min),t elapsed time (min),Mrecoveredmass of PCE recovered in permeate (kg),Mporgmass of permeate organic phase collected in timet (kg),Mpw mass of permeate water phasecollected in timet (kg), Vporg volume of permeate organic phase collected in timet (l),Vpw volume of permeate water phase collected in timet (l), wporg mass concentration ofPCE in permeate organic phase (kg-PCE/kg-organic),wpw mass concentration of PCE inpermeate water phase (kg-PCE/kg-water phase),Cporg concentration of PCE in permeateorganic phase (mg/l),Cpw concentration of PCE in permeate water phase (mg/l).
According to the quality assurance project plan, mass balance closure was to be indicatedwhen the mass recovered was between 60 and 130% of the mass removed. Weekly massbalances were performed over four successive weeks (from 5/8/99 to 6/5/99) and yieldedclosures of 111.7, 95.2, 98.5 and 100.6%. Over these 4 weeks, 73.34 kg of PCE wererecovered in the permeate and 72.17 kg were calculated to have been removed from thefeed solution yielding an overall closure of 101.6% with a 95% confidence interval of±7.0%. Thus, mass balance was achieved.
Over the course of the 70 day operation, approximately 2200 l of permeate water phasewere collected. The rate of collection was reasonably constant. Due to the variation inIPA feed concentration, the concentration of IPA in the permeate water phase ranged from0 wt.% at the outset to as high as 30 wt.% during peak IPA concentrations. The cumulativepermeate water phase was estimated to contain 1700 kg of water. Water and IPA fluxeswere not calculated due to the variations in IPA concentration, membrane area, and processtemperatures as well as the fact that the permeate water values represent the combinedpermeate from two types of very different modules.
3.2.8. VarsolTM removalAs stated in the objectives section, measurement of the VarsolTM removal objective was
to be based on the average removal of three VarsolTM marker compounds: decane, un-decane and 1,3,5-trimethylbenzene (commonly called mesitylene). The VarsolTM removalobjective would be met when weekly averages of VarsolTM removal exceeded 95% at theend of the pervaporation treatment project as surfactant concentrations declined during thepost-SEAR water flood. Based on the surfactant partitioning behavior of these compounds,it was expected that they would be harder to remove than PCE from a surfactant solution andthe removal would decrease according to the following series: 1,3,5-trimethylbenzene>
decane> undecane. Prior to surfactant breakthrough, concentrations of all three VarsolTM
markers were below the 0.005 mg/l threshold reporting value of the GC/MS method em-ployed. During the surfactant plateau region (days 28–70), concentrations ranged from 0.8to 1.8 mg/l for decane and 0.5 to 1.4 mg/l for undecane — two to three orders of magnitudelower than PCE concentrations. Concentrations of 1,3,5-trimethylbenzene never exceededthe 0.5 mg/l threshold reporting value established for the GC/MS method with surfactantsolutions. As with PCE concentrations, VarsolTM concentrations were up to 10 times lowerthan had been expected based on model predictions. Since concentrations of VarsolTM
marker compounds were always near the threshold reporting value of the analytical method,calculations of VarsolTM removal are less accurate and less precise than those for PCE.During the surfactant plateau region, decane removal averaged 56% and undecane removalaveraged 33%. Based on the surfactant partitioning behavior of the VarsolTM marker com-

160 L.M. Vane et al. / Journal of Hazardous Materials B81 (2001) 141–166
pounds (measured separately by headspace chromatography at USEPA facilities), it is es-timated that removal of 1,3,5-trimethylbenzene was likely around 70%. Average VarsolTM
removal would certainly have exceeded 95% in the absence of surfactant due to the highvapor–liquid partitioning coefficients (Henry’s law constant) observed for the VarsolTM
markers. Based on this vapor–liquid partitioning information, VarsolTM removal from wa-ter should exceed even that of PCE. Unfortunately, concentrations of the compounds weretoo low to quantify when no surfactant was present. Although, the VarsolTM removal ob-jective was likely met, it could not be quantified due to the low VarsolTM concentrationsencountered.
3.2.9. Quality assurance/quality controlIn order to ensure an adequate quality level for the pervaporation demonstration, a quality
assurance project plan was prepared, reviewed, approved and followed. One field QA auditand two analytical laboratory QA audits were performed to ensure adherence to the approvedQAPP. With regard to GC/FID PCE measurements, the relative percent difference betweenduplicate analysis were generally within 2% and very rarely exceeded 5%. PCE matrix spikerecoveries (both Resid2 and field blank spikes) ranged from 80 to 110%, with most in the95 to 105% range. The rotameter used to determine flow rate for mass balance calculationswas accurate to within 3%, based on periodic bucket tests.
3.3. Accomplishments of the pervaporation demonstration
The USEPA pervaporation field demonstration at Camp Lejeune yielded a number ofaccomplishments. Most importantly, the pervaporation field unit was able to meet the 95%PCE removal requirement for reinjection of the recovered SEAR fluid, thus, enabling reuseof the surfactant. Reinjection of the first batch of recycled surfactant commenced on 13 May1999 (day 45). Secondly, the pervaporation system operated continuously for 70 days withonly one short duration shutdown. During these 70 days, 100,000 gal of groundwater andSEAR fluid were processed. Previously reported field demonstrations were unable to oper-ate for more than a few days without encountering shutdown events. Thirdly, fouling of thepervaporation modules by iron precipitation, carbonate scale, or oil was not observed despitethe presence of ferrous iron, calcium ions, and “free oil” from the surfactant in the feed solu-tion. Successful avoidance of fouling was achieved by process design and module selectiondecisions. A fourth accomplishment was the achievement of 102% PCE mass balance clo-sure over 4 weeks of operation. Finally, this field demonstration marked the first full-scaleimplementation of the VSEP vibrating membrane system for pervaporation. In fact, overthe course of this project, the use of the vibrating system for pervaporation was taken fromconcept, through bench-scale testing, pilot-scale evaluation, to full-scale implementation.
3.4. Lessons learned and problems encountered
Several problems were encountered during the course of the field work. In addition, anumber of process design changes can be recommended after the field experience. A de-scription of these issues is included here to assist future practitioners, just as past experiencesfrom other field demonstrations strengthened the design of the Camp Lejeune pervaporation

L.M. Vane et al. / Journal of Hazardous Materials B81 (2001) 141–166 161
system. It should be noted that all of these problems were resolved or, for minor problems,tolerated with no detrimental effect on the project.
A hairline crack in a plastic pressure plate inside the VSEP module allowed surfactantsolution to drip slowly out of the bottom of membrane stack and to come in contact witha gland seal O-ring separating the vacuum chamber from the pressure plate. The vacuumchamber of the membrane module was inspected several times during the demonstration andsurfactant was observed to have accumulated in that location. In addition, an oily substancewas found in the chamber. It is likely that the fluid leaking from the plate crack also leakedpast the gland sealO-ring. Once exposed to vacuum, the water, VOC and IPA evaporatedfrom the solution, leaving behind surfactant and oil. The oil apparently originated from themanufacture of the surfactant. The surfactant vendor indicated that the active surfactant con-tained approximately 1% “free oil”, likely polypropylene glycol oligomers and polymers.The free oil is not water soluble although, it does dissolve in IPA or in a surfactant solution.The presence of the surfactant and free oil in the vacuum chamber could have caused partialblockage of permeate drainage cloths in the membrane trays, resulting in reduced VSEPperformance. After the demonstration was completed, the cracked plate was replaced witha new plate. It was found that the free oil and surfactant could be removed from the per-meate zone using IPA and water, respectively. PCE removal efficiencies equivalent to thoseobserved during the start of the field demonstration were achieved in post-demonstrationtesting indicating that no irreversible performance reductions resulted from surfactant andfree oil accumulation in the permeate chamber.
Leakage of surfactant solution also occurred in the hollow fiber modules. Of the 36 mod-ules, only one displayed substantial leakage. Approximately 11 others displayed leakageat levels low enough for the evaporation of the water to keep up with the leak. Thus, leakyfibers became filled with surfactant and free oil over time, but the leaks did not appearto greatly impact performance. The majority of the leaking modules were located at thefront end of the hollow fiber grid, experiencing the greatest liquid pressures, up to 32 psig.Pressures on the order of 15 psig did not appear to negatively impact the modules. Thus, itcan be concluded that these particular modules should not be operated at pressures aboveabout 15 psig for extended periods of time.
Transfer of condensate from the second permeate condensate reservoir to the PCE/waterseparator was problematic. In this case, a two-phase fluid (DNAPL and water) at atmosphericpressure must be pumped from a reservoir elevated approximately 12 in. above the pumpinlet to a tank situated 48 in. above the pump outlet. A centrifugal pump and two gearpumps each failed. The second gear pump was replaced with a Teflon-diaphragm pumpwhich effectively handled the two-phase condensate for the last few weeks of the fieldwork. The effect of solvents on pump operation, whether due to seal damage or cavitation,etc. and pump suction head requirements should be given due consideration.
Since temperature plays a significant role in PCE removal performance as well as infouling avoidance, control of temperature is a critical process issue. The main obstacle totemperature control during the field demonstration was heat loss from Teflon-lined rubberhoses, stainless steel piping and fittings and the hollow fiber modules. Foam insulation wasinstalled on process hoses and pipes. A 0.006 in. thick polypropylene tarp was draped overthe entire hollow fiber module assembly to stop convective heat losses due to air flow in thetent.

162 L.M. Vane et al. / Journal of Hazardous Materials B81 (2001) 141–166
3.5. Pervaporation process costs
The cost of pervaporation treatment is a function of many variables. The variables with thelargest impact are the flow rate to be treated, desired treatment level, surfactant concentrationand type of surfactant, VOCs to be removed and micellar partitioning behavior of the VOCs.As discussed previously, the fraction of VOC removed is relatively independent of thefeed concentration — a system designed to remove 99% VOC from a stream containing100 mg/l VOC will likely also remove 99% VOC from a stream containing only 1 mg/l of thesame VOC. However, the concentration of VOC remaining in these two cases will be verydifferent (1 versus 0.01 mg/l). VOC concentrations can vary significantly during a surfactantremediation, but surfactant concentrations (and therefore, relative removal efficiency) willlikely stay within pre-determined bounds. Thus, a relative % VOC removal target is generallypreferred over absolute concentration targets from a standpoint of system design. At CampLejeune, 95% relative VOC removal was required.
Regarding energy usage, the Camp Lejeune pervaporation system drew 27 A of threephase, 480 V electrical service, or about 13 kW which translates to approximately $30per day at residential rates ($0.10/kWh) and $15 per day at reduced commercial rates($0.05/kWh). The heater and chillers required the bulk of the energy.
As shown in Eq. (4), the amount of membrane area required to achieve a desired % VOCremoval is proportional to the flow rate to be treated. However, the processing cost per unitvolume of liquid treated, decreases due to economies of scale achieved. The effect of micellarpartitioning of the VOC on treatment cost is a complicated relationship. Based on pilot-scaleobservations and micellar partitioning studies with several surfactants and VOCs, the effectof surfactant on processing cost can be estimated. In brief, the observed mass transportcoefficient,k, in Eq. (4) appears to vary with the extramicellar fraction of VOC (fex) to the0.5 power. For example, iff ex = 0.33 (meaning that (1/3) of VOC molecules are outsidesurfactant micelles while (2/3) have partitioned inside the micelles), then the observed masstransport coefficient will be 0.57 timesk in the absence of surfactant. Thus, the membranearea will have to be increased by a factor of 1/0.57, or 1.74 times, in order to achieve thesame relative % VOC removal. Treatment costs for a variety of scenarios are provided inTable 2. Following the convention established for comparing pump and treat systems, costsare calculated per 1000 gal of liquid treated. As in all cost estimates, the assumptions whichform the basis for the estimates and the items included/excluded are required in order tocompare costs of competing technologies. The assumptions used in preparing Table 2 areprovided as footnotes to the table.
As shown in Table 2, pervaporation treatment costs decline significantly as the capacityof the system increases. This decline is a result of economies of scale which can be achievedwith chemical process equipment. However, capital costs of membrane modules and hous-ings, alone, typically do not benefit from economies of scale as do column type separationtechnologies like distillation, steam stripping and air stripping. In membrane systems, themaximum amount of area available in a single module is generally much smaller than thetypical amount of membrane required to achieve the desired separation. Thus, the neededarea is obtained by linking several of the smaller units together which yields a cost scalingfactor near unity as opposed to 0.4–0.6 for other process equipment. In contrast to typicalpervaporation systems, the VSEP pervaporation system introduced in this project exhibits

L.M
.Va
ne
eta
l./Jou
rna
lofH
aza
rdo
us
Ma
teria
lsB
81
(20
01
)1
41
–1
66
163

164 L.M. Vane et al. / Journal of Hazardous Materials B81 (2001) 141–166
attractive economies of scale. The VSEP system does not reach the area “replication” pointuntil approximately 200 m2 — significantly higher than for hollow fiber modules (3–10 m2)or spiral wound modules (15 m2). Future generations of the VSEP technology are expectedto allow even higher maximum module areas.
The treatment cost for the actual pervaporation system used at Camp Lejeune was esti-mated to be $275 per 1000 gal. An optimized 1 gpm system for the same application wouldyield a treatment cost of $100 per 1000 gal. For 10 gpm systems achieving 99% removalof chlorinated VOC from surfactant solutions estimated treatment costs range from $17 to$24 per 1000 gal or $245 to $345 per day of operation. Treatment costs for pervaporationsystems based on spiral wound modules were found to be somewhat higher than those forthe VSEP system. The lower cost of the VSEP system, better economies of scale and con-cerns regarding fouling with spiral wound modules led to the use of the VSEP system inthe cost analysis. Systems based on hollow fiber modules were not cost-competitive withthe VSEP system. Improvements in mass transport and reductions in cost for the hollowfiber modules would make them more cost competitive, but they would still not have theeconomy of scale advantage of the VSEP.
3.6. IPA recovery
Just as pervaporation can remove chlorinated VOCs from water, so too, can it removeIPA from water. However, the pervaporation unit which was designed for PCE removal atCamp Lejeune was not designed for IPA recovery, the membranes were too thick to providefor sufficient IPA fluxes. A second pervaporation system, loaned to the USEPA by MTRwas utilized to demonstrate the recovery of IPA from the SEAR fluid (actually, the MEUFpermeate was used as the feed material for the IPA recovery system). The results of the IPArecovery investigation will be reported in a separate publication. Process design scenarioswhich allow for the removal of VOC and recovery of IPA using the same pervaporationmodules are under consideration, thus, making the economics very attractive.
4. Conclusions and recommendations
The USEPA pervaporation field unit met the PCE removal requirement for reinjectionof surfactant during the ESTCP SEAR demonstration project at Marine Corps Base CampLejeune. The unit processed 100,000 gal of groundwater and SEAR fluid in continuous op-eration over 70 days. PCE removal averaged 95.8% during the surfactant plateau region andexceeded 99.9% when treating groundwater containing no surfactant. The average flow ratethrough the system was 0.99 gpm. PCE concentrations ranged from 35 to 890 mg/l while sur-factant concentrations ranged from 0 to 1.2 wt.%. Concentrations of hydrocarbon secondarycontaminants (VarsolTM compounds) were significantly lower than PCE concentrations atall times. VarsolTM marker concentrations in all samples were below detection limits in theabsence of surfactant, thus making quantification of removal impossible. In the presence ofsurfactant, removal averaged 33% for undecane and 56% for decane, although, concentra-tions were generally near or below the method detection limits. Due to low concentrationsof 1,3,5-trimethylbenzene observed even in the presence of surfactant, removal of this com-

L.M. Vane et al. / Journal of Hazardous Materials B81 (2001) 141–166 165
pound could not be quantified, but would likely have been around 70% based on micellarpartitioning behavior observed in laboratory tests. Likewise, in the absence of surfactant,VarsolTM removal should have exceeded that of PCE, but was not quantifiable. As a result,whether the average 95% removal criteria was met for VarsolTM could not be determined. Apervaporation system with four to five times the membrane area of the Camp Lejeune perva-poration unit would be needed to achieve 95% VarsolTM removal during peak surfactant con-centrations. Such a system, however, would remove more than 99.999% PCE from the samesurfactant solution. Reasonable risk-based contaminant removal criteria must be establishedfor each site so that a practical treatment system can be designed for the economical recov-ery and reuse of surfactants while still meeting the risk management needs of the site and itsneighbors. Relative contaminant removal requirements (such as 95% removal) are preferredto fixed concentration objectives for pervaporation system design since pervaporation sys-tems typically remove the same relative amount of VOC, independent of feed concentration.
Fouling problems encountered in previous pervaporation demonstrations were not expe-rienced in the Camp Lejeune demonstration, a result of the prudent design and operation ofthe system, despite conditions which would favor fouling. For example, high concentrationsof iron (14 mg/l Fe2+) and calcium (300 mg/l Ca2+) were present as well as free oils fromthe surfactant production process. No chemical additives, other than nitrogen gas, wererequired to avoid fouling. The main problem associated with the membrane modules wasthe presence of small leaks of liquid into the permeate regions of the module, most of whichdid not appreciably affect performance. The estimated cost of the pervaporation separationwas $275 per 1000 gal treated for the Camp Lejeune field system. An optimized unit for theCamp Lejeune demonstration would cost $100 per 1000 gal treated. Significant cost reduc-tions are possible for larger systems with a best-design 10 gpm system costing only $17–24per 1000 gal treated for 99% PCE removal. In comparison, each 1000 gal of surfactantsolution during the surfactant plateau region contains $500–$600 worth of surfactant (as-suming 1.2 wt.% of $5/lb high-activity surfactant or 4.8 wt.% of $1.5/lb moderate-activitysurfactant). Thus, the value of recovered surfactant more than covers the cost of the pervapo-ration system. Costs for removing less-hydrophobic VOCs, such as TCE, TCA and toluene,from surfactants would be lower than for PCE while removal costs for more hydrophobicVOCs, such as the VarsolTM hydrocarbons, would be higher. Since pervaporation involvesthe volatilization of the contaminant, the technology is generally not suitable for treatmentof streams containing semi-volatile and non-volatile contaminants. However, pervaporationhas an added advantage over competing VOC removal technologies in that the system couldbe designed to recover alcohols for reuse at the same time it removes VOCs. Alternatively,a pervaporation system could be installed to remove alcohol from the MEUF permeatestream, thereby reducing disposal costs and enabling the reuse of the alcohol.
Finally, the vibrating pervaporation system introduced during the Camp Lejeune demon-stration has the potential to dramatically reduce pervaporation costs for a variety of sepa-rations as well as the ability to handle solutions with a high fouling potential. Although,pervaporation costs may not approach those required for drinking water treatment, theymay be competitive for more contaminated streams such as those encountered by tradi-tional pump and treat systems. Treatment costs for 100 gpm pervaporation systems (99.99%VOC removal from groundwater) are projected to be below $10 per 1000 gal treated,with no fugitive emissions and the ability to handle solutions with high concentrations

166 L.M. Vane et al. / Journal of Hazardous Materials B81 (2001) 141–166
of iron and scale-forming compounds. Specifically, a project to evaluate pervaporation formethyl-t-butylether (MTBE) removal from groundwater has been proposed. In addition,work is on-going (as of December 1999) to construct a VSEP membrane module out oftraditional pervaporation membrane rather than the non-traditional material used for theCamp Lejeune VSEP module. This change should result in an increased VOC removal effi-ciency. Thus, the new vibrating pervaporation system holds a great deal of promise, largelyuntapped at the present time.
Acknowledgements
A substantial number of individuals and organizations significantly contributed to thesuccess of the USEPA Camp Lejeune pervaporation field demonstration. USEPA staff in-volved in the project included: Leland Vane, Lynnann Hitchens, Franklin Alvarez, JohnnySpringer, Patrick Clark, Eugene Giroux (NCOA grantee), Ballard Mullins, Lauren Drees,Diana Redmond and Leo Fichter. Non-EPA individuals deserving thanks include: US De-partment of Navy personnel: Laura Yeh (DoD project leader), Katherine Landman, RickRaines; IT Corp. staff: Craig Patterson, Phil Conley, Stuart Shealy, Dave Elstun, Gary Lub-bers; MTR staff: Hans Wijmans, Anurag Mairal, Ramin Daniels, Rae Wang, Richard Baker;New Logic staff: Greg Johnson, Marius Neagoe, Brad Culkin; AMT staff: Steve Conover,Tom McEvoy; Univ. of Oklahoma: Ed Tucker, Andy Slagle, Eric Brown; Univ. of Texas atAustin: Gary Pope and his research group; Duke Engineering: Fred Holzmer, Jeff Scheer-horn, Ken Simpson, Varadarajan Dwarakanath, Minquan Jin; Baker Environmental: MarkDeJohn, Kathy Chavara.
References
[1] F.R. Alvarez, L.M. Vane, L. Hitchens, Demonstration of pilot-scale pervaporation systems for volatile organiccompound removal from a surfactant enhanced aquifer remediation fluid. I. Spiral wound membrane modules,submitted for journal review.
[2] L. Hitchens, L.M. Vane, F.R. Alvarez, VOC removal from water and surfactant solutions by pilot-scalepervaporation system, Sep. Pur. Tech., in press.
[3] J.-S. Jiang, L.M. Vane, S.K. Sikdar, Recovery of VOCs from surfactant solutions by pervaporation, J. Memb.Sci. 136 (1997) 233–247.
[4] L.M. Vane, F.R. Alvarez, E.L. Giroux, Reduction of concentration polarization in pervaporation usingvibrating membrane module, J. Memb. Sci. 153 (1999) 233–241.
[5] R.W. Baker, A.L. Athayde, R. Daniels, M. Le, I. Pinnau, J.H. Ly, J.G. Wijmans, J.H. Kaschemekat, V.D.Helm, Development of pervaporation to recover and reuse volatile organic compounds from industrial wastestreams, DOE/AL/98769-1, 1997, Report to U.S. Department of Energy.
[6] Zenon Environmental, Inc. Cross-flow pervaporation technology, EPA/540/R-95/511, 1998, USEPA/ORDSITE Innovative technology evaluation report.
[7] I. Abou-Nemeh, S. Majumdar, A. Saraf, K.K. Sirkar, L.M. Vane, F.R. Alvarez, L. Hitchens, Demonstration ofpilot-scale pervaporation systems for volatile organic compound removal from a surfactant enhanced aquiferremediation fluid. II. Hollow fiber membrane modules, submitted for journal review.
[8] L.M. Vane, E.L. Giroux, F.R. Alvarez, L. Hitchens, Separation of volatile organic compounds from surfactantsolutions by pervaporation, in: J.F. Scamehorn, J.H. Harwell (Eds.), Surfactant-Based Separations: Scienceand Technology, American Chemical Society, Washington, DC, 2000.
[9] L.M. Vane, E.L. Giroux, Henry’s law constants and micellar partitioning of VOCs in surfactant systems, J.Chem. Eng. Data 45 (2000) 38–47.