Embed Size (px)
Citation preview
Journal ofMembrane Science, 1’7 (1984) 289-307 Elsevier Science Publishers B.V., Amsterdam - Printed in The Netherlands
289
ON THE MECHANISM OF SEPARATION OF ETHANOL/WATER MIXTURES BY PERVAPORATION I. CALCULATIONS OF CONCENTRATION PROFILES*
M.H.V. MULDER and C.A. SMOLDERS
Department of Chemical Technology, Twente University of Technology, P.0. Box 217, 7500 AE Enschede (The Netherlands)
(Received April 25, 1983; accepted in revised form August 9, 1983)
Summary
A solution--diffusion model for the permeation of liquid mixtures through polymeric membranes taking into account coupling of fluxes has been developed. The model is applied to the separation by pervaporation of ethanol-water mixtures through cellulose acetate. In order to determine the activities of the permeating components in the poly- meric membrane, values of polymer-liquid and liquid---liquid interaction parameters are needed; polymer-liquid interaction parameters have been determined from swelling ex- periments and liquid-liquid interaction parameters have been calculated from excess free energy of mixing data taken from the literature.
Concentration profiles of water and ethanol in cellulose acetate membranes have been calculated using (a) apparent concentration independent diffusion coefficients, and (b) diffusion coefficients with exponential concentration dependence and two adjustable parameters. It is discussed that the transport of ethanol-water mixtures by pervaporation cannot be explained by using concentration independent diffusion coefficients.
Introduction
Transport of liquids through homogeneous polymeric membranes, as prac- tised during pervaporation, differs from gas separation because the concentra- tions of the permeating components in the polymer are in general much higher. The high permeant concentrations have, in their turn, a large influence on the diffusion coefficients of the penner&s. Hence transport equations derived from gas separation cannot be applied a priori to pervaporation.
For a description of a pervaporation transport model, one should distin- guish single component and multicomponent permeability. Single component permeation through homogeneous polymeric membranes can be satisfactorily described by Fick’s law with a concentration dependent diffusion coefficient, as has been done by several authors [l-5] . Also, the application of free volume theory to single component permeation [6] shows good agreement between theory and experiment. Paul [7] proposed a model for pressure-
*Paper presented at the European Workshop on Pervaporation, September 21-22, 1982, Nancy, France.
0376-7388/84/$03.00 0 1984 Elsevier Science Publishers B.V.
290
induced diffusion of liquids through highly swollen rubber membranes, satis- factory agreement between theory and experiment was established.
No satisfactory theory exists that describes the transport of a mixture. Fels [8] tried to modify the free volume concept to include contributions from both penetrants to the total free volume. Although this approach can have a significant contribution.to the study of molecular separation phenom- ena, the agreement between theory and experiment is still lacking.
Greenlaw [9] investigated the effect of a linear relationship between the concentrations of permeants and their diffusion coefficients. For liquid mixtures that behave almost ideally, such as the heptane-hexane mixture used by Greenlaw, this treatment may hold but it is uncertain whether this would be the case for non-ideal mixtures such as ethanol-water.
Tack [lo] attempted to predict selectivities for water-dioxane mixtures from permeabilities of the pure components using Fick’s law with a concen- tration dependent diffusion coefficient. Their results show that it would hardly be possible to predict selectivities for non-ideal mixtures from single component permeability data alone.
Lee [ 111 used a solution-diffusion model with concentration independent diffusion coefficients and without considering a possible coupling of fluxes. As a consequence, the selectivity factor is equal to the ratio of the permeabil- ity coefficients obtained from single component permeation experiments. In the case of liquid mixtures which show hardly any mutual interaction, nor any interaction with the polymer, this treatment may hold, but with other mixtures which behave far from ideally, such as ethanol-water, this treatment is probably too simple.
When a liquid mixture permeates through a membrane there will be coupling of fluxes. The flux of a component of the binary mixture may change, not only by the presence of the other component but also by its movement. This phenomenon has been pointed out clearly by Meares [ 121 in a review article about transport through polymeric membranes from the liquid phase. Coupling can be divided into two parts, a thermodynamic part and a kinetic part. The thermodynamic part, the change in concentration of one component in the membrane due to the presence of another component, is caused by mutual interactions between the permeants in the membrane as well as by interactions between the individual components and the membrane material. The extent of these interactions depends on the polymer-mixed penetrant system. Kinetic coupling is due to the dependence of the concentration on the dif- fusion coefficients of low molecular weight components in polymers, partic- ularly in glassy polymers. In polymers below their glass transition, such as cellulose acetate, polysulfone and polyacrylonitrile at room temperature, the thermal motions of the chain segments are very much restricted. When low molecular weight components are dissolved in such polymers, the mobility of the chains increases. In the case of a binary mixture, both components will exert a plasticizing effect on the segmental motions, and the mobilities of both permeants will be enhanced by the combined plasticizing action.
291
Therefore, in a model description for the separation of liquid mixtures by pervaporation, coupling phenomena have to be taken into account.
The object of this article is to present a modified solution--diffusion model which combines both the thermodynamic and the kinetic (diffusive) aspects of the pervaporation process. Our approach differs from the original solu- tion--diffusion model [ 11,13,14] in that we now consider coupling of fluxes, whereas in the original model each component dissolved in the mem- brane and diffused through it independently. With the model described here it is possible to calculate concentration profiles. When data on experimental concentration profiles are available, it is possible to calculate diffusion coef- ficients of permeating components in polymeric membranes. In this article we will present calculated concentration profiles of ethanol and water in cellulose acetate membranes using (a) apparent concentration independent diffusion coefficients obtained from steady-state measurements, and (b) dif- fusion coefficients with an exponential concentration dependence with two adjustable parameters. In a forthcoming article [ 151 we will report on ex- perimentally determined concentration profiles and discuss these results in terms of the proposed model.
Description of the model
Although the model follows the formalism of the solutiondiffusion model some assumptions have been made: l The model applied to pervaporation processes because only boundary con-
ditions of the pervaporation process am included. In principle the model can be modified to apply to other membrane processes.
l The model describes the flow of permeants in the membrane as a one- dimensional steady-state diffusion: the permeation rate is independent of time and the chemical potential of a component in the membrane is only a function of concentration and distance and not of time. Another impor- tant point is that during steady-state the membrane undergoes no struc- tural changes.
l The application of the model is restricted to homogeneous membranes or to very dense toplayers of asymmetric or composite membranes where transport takes place by diffusion and not by convection.
l Transport through the membrane is ratedetermining. This assumption im- plies that surface processes such as sorption at the feed/membrane interface and desorption at the membrane/permeate interface are fast compared to diffusion processes through the membrane.
l The interfaces of the membrane are in equilibrium with the upstream and downstream phase. This means that the chemical potential of component i in the upstream phase is equal to the chemical potential of component i just inside the membrane.
l The chemical potential or activity of a component in the polymeric mem- brane can be described by Flory-Huggins thermodynamics [ 161.
292
Binning [ 11 was the first to propose that the transport of liquids through homogeneous membranes takes place by a solution-diffusion mechanism.
According to the original solution--diffusion model [ 13,141, the flux of a component i through the membrane can be described by the product of concentration, mobility and driving force. The driving force in most mem- brane processes and also in pervaporation is given by the gradient in the chemical potential. For component i the flux can be described by
dpi Ji = -ciBi x
At constant temperature, eqn. (1) may be written as
The pressure difference between the upstream and downstream phase is about 1 bar (0.1 MPa) in pervaporation processes. Therefore, the pressure gradient can be neglected with respect to the activity gradient
d In ai Ji = -CiBiRT -
dx
Assuming that
Di= RTBi (4)
where Di is the diffusion coefficient of component i in the polymer-fixed frame of reference, substitution of eqn. (4) in eqn. (3) gives
(5)
The activity of a component in the membrane can be described by Flory- Huggins thermodynamics [ 161. For a binary system the activities a1 and a,
are given by
Inal = A/J~ -_ =lnui + (l-- 2) U2 +x1& RT
AcC2 lna, = -
RT =lnu, + (l- : j Vi +X12 3 4 (7)
xl2 is a binary interaction parameter between components 1 and 2 called the Flory-Huggins interaction parameter. This interaction parameter is a dimen- sionless quantity characterizing the difference in interaction energy of a sol- vent molecule immersed in pure polymer compared with one in pure solvent.
In the case of a polymeric membrane and a binary liquid mixture, a ter- nary system, the activities al and az of liquid components 1 and 2 in the polymeric membrane are given by [ 161
293
b-~ a2 + (x12+1 ; +x23$3) ($1 + $3)
1
2 @14J3 -x13 v (9)
1
Substitution of eqns. (8) and (9) into eqn. (5) gives
ln$l+(1-$1)~“$2 ; -4~3 2
2
+ (x12$2 + x1343) ($2 + $3) -x23 v1 4243 v
2 I
J2 =--m2~2(0,,~2)%[lnm2+(1-02)-m, :-C3 z 1 3
v2
+ (x12@1 v + x23@3) (@l + 43) -x13
1 1
(10)
(11)
Equations (10) and (11) are two coupled non-linear differential equations which have to be solved numerically. One should realize that eqns. (10) and (11) are simplified phenomenological relations. Although it seems that both components will diffuse independently, this is not true. One can see from eqns. (8) and (9) (or from eqns. (10) and (11)) that the activity of component 1 is not only dependent on its concentration but also on the concentration of components 2 and 3 and on the interaction parameters between components 1 and 2 (x12), 1 and 3 (x13) and 2 and 3 (x23). Secondly, the diffusion coef- ficient, III, is concentration dependent, not only on the concentration of com- ponent 1 but also on the concentration of component 2, because in the case of a liquid mixture both components will exert a plasticizing action and the diffusion coefficients will be enhanced by the combined action. The concen- trations of components 1 and 2 change continuously from upstream to downstream phase during steady-state transport. Because the diffusion coef- ficients are assumed to be concentration dependent they will also change accordingly across the membrane as a function of the distance.
Evaluation of the binary interaction parameter ,y I2 Solutions involving hydrogen bonding show deviations from ideal behav-
iour, especially in mixtures of liquids with strong hydrogen bonding such as water and ethanol.
294
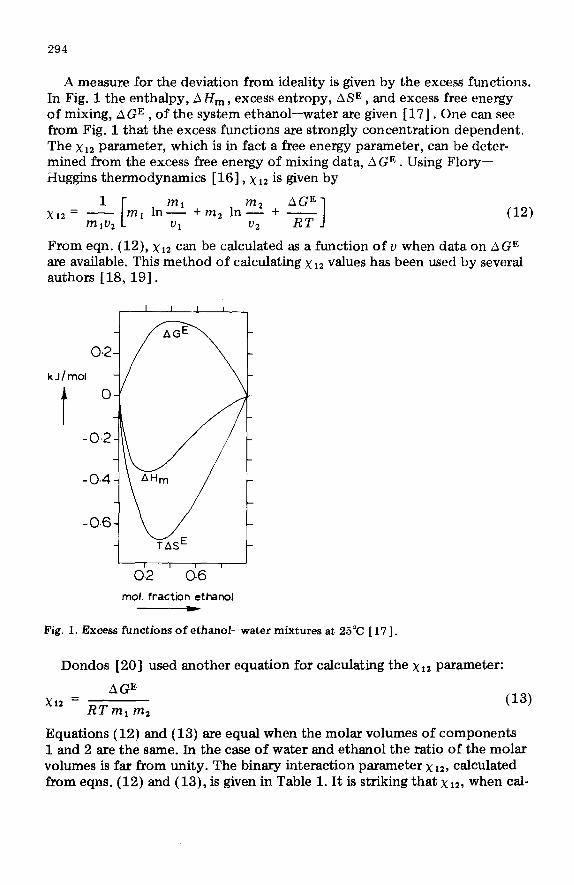
A measure for the deviation from ideality is given by the excess functions. In Fig. 1 the enthalpy, AH,, excess entropy, ASE , and excess free energy of mixing, AGE , of the system ethanol-water are given [1’7] . One can see from Fig. 1 that the excess functions are strongly concentration dependent. The xlz parameter, which is in fact a free energy parameter, can be deter- mined from the excess free energy of mixing data, AGE. Using Flory- Huggins thermodynamics [ 161, x 12 is given by
1
c
AGE x12= - ml lrlm’ +m2 Ins + ~
mlv2 Vl v2 RT I (12)
From eqn. (12), xl2 can be calculated as a function of v when data on AGE are available. This method of calculating xl2 values has been used by several authors [X3, 191.
012 mol. fraction ethanol
Fig. 1. Excess functions of ethanol-water mixtures at 25°C [ 17 1.
Dondos [20] used another equation for calculating the x 12 parameter:
AGE
‘I2 - RTmi m, (13)
Equations (12) and (13) are equal when the molar volumes of components 1 and 2 are the same. In the case of water and ethanol the ratio of the molar volumes is far from unity. The binary interaction parameter x L2, calculated from eqns. (12) and (13), is given in Table 1. It is striking that x 12, when cal-
295
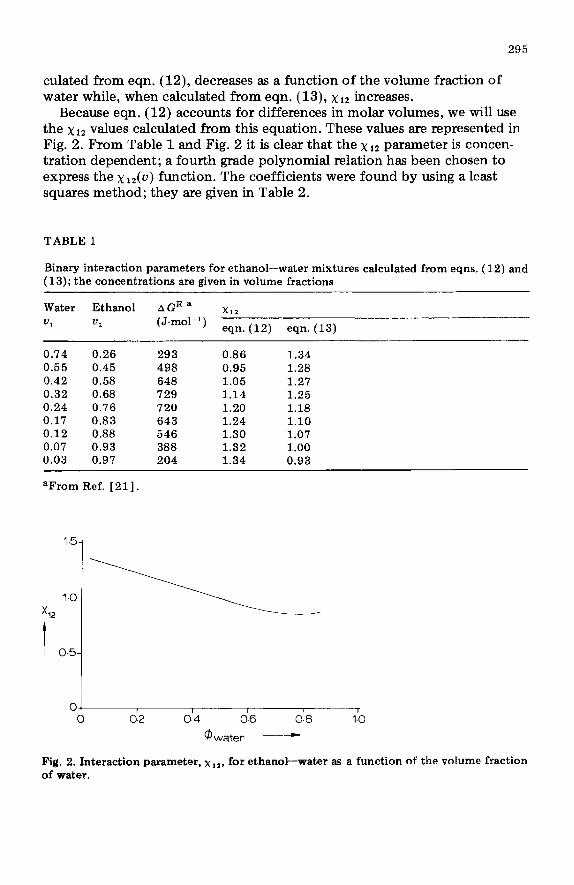
culated from eqn. (X2), decreases as a function of the volume fraction of water while, when calculated from eqn. (13), x 12 increases.
Because eqn. (12) accounts for differences in molar volumes, we will use the xiz values calculated from this equation. These values are represented in Fig. 2. From Table 1 and Fig. 2 it is clear that the x Iz parameter is concen- tration dependent; a fourth grade polynomial relation has been chosen to express the x12(u) function The coefficients were found by using a least squares method; they are given in Table 2.
TABLE 1
Binary interaction parameters for ethanol-water mixtures calculated from eqns. (12) and (13); the concentrations are given in volume fractions
Water Ethanol AGEa Xl2
VI *2 (J-mol-‘) eqn. (12) eqn. (13) -
0.74 0.26 293 0.86 1.34 0.55 0.45 498 0.95 1.28 0.42 0.58 648 1.05 1.27 0.32 0.68 729 1.14 1.25 0.24 0.76 720 1.20 1.18 0.17 0.83 643 1.24 1.10 0.12 0.88 546 1.30 1.07 0.07 0.93 388 1.32 1.00 0.03 0.97 204 1.34 0.93
aFrom Ref. [21].
1.5-
X ,sl.O- >
I 0.5-
0 0
I 0.2
I T I 1 0.4 0.6 0.8 I.0
@ water -
Fig. 2. Interaction parameter, x 1l, for ethanol-water as a function of the volume fraction of water.
296
TABLE 2
Coefficients for the functions x 1 *(u,) or x 1 *( u,)
Xl2 =a+bv,+cvZ,+dv;+ev~
a b c d e
0.98 -1.35 4.15 -3.31 0.89
II,: Volume fraction of ethanol in ethanoI-water mixtures. u2: Volume fraction of ethanol referred to the nonsolvent part in the ternary system.
Evaluation of the binary parameters xi3 and ~23
Two methods are available to determine interaction parameters of a polymer and a nonsolvent: equilibrium swelling experiments and inverse gas chromatography. The disadvantage of the latter method is that interaction parameters are obtained for infinite polymer concentrations, xm, at elevated temperatures. Because the interaction parameter is usually temperature and concentration dependent, extrapolation is often difficult. Swelling experi- ments are easy to perform at any temperature. The extent of swelling depends on the interaction between polymer and penetrant (in our case the nonsol- vent). Polymers, applied as homogeneous or dense membranes as in per- vaporation experiments, absorb only a small quantity of nonsolvent. The membrane can be considered as a swollen gel or a network with crosslinks caused by crystalline regions, chain entanglements or Van der WaaIs interac- tions. The swelling behaviour of such a network can be expressed by the Flory-Rehner theory [ 161. The free energy change, A G, involved in the mixing of a nonsolvent and a polymer consists of two parts, the free energy of mixing, A G, , and the elastic free energy, A Gel, [ 161:
AG = AG, + AG,l (14)
At swelling equilibrium, AG = 0, eqn. (15) is obtained:
ln(l-vp)+vp +xvk + > (VP l/3 _
Mcvp
f VP) = 0 (15)
M, can be interpreted as the average molecular weight between two cross- links. In polymer-nonsolvent systems with small amounts of nonsolvent in the polymer, the last term in eqn. (15) can be neglected. In the case of cellulose acetate the values of x will not differ by more than 0.05, even for very unrealistic values of M, (MC = 265, the molecular weight of one seg- ment). This is within the accuracy of the experimentally determined values. Equation (15) has thus been reduced to a very simple form:
(16)
The results of the swelling experiments are given in Table 3. The solubility of water in cellulose acetate is in close agreement with values obtained by other investigators [ 13, 221 . For the calculations of the profiles, the x 13 and xz3 parameters have been considered as constant.
TABLE 3
Sorption values and binary interaction parameters of cellulose acetate/water and cellulose acetate/ethanol
Solubility Weight fraction Volume fraction x (g penetrant / penetrant penetrant 100 g dry polymer)
CA/water 14.3 0.125 0.157 1.4 CAjethanol 2 1.5 0.177 0.262 1.1
Calculation of concentration profiles In order to calculate concentration profiles the following approach has
been followed. A homogeneous membrane is divided into a number of in- finitesimally thin layers [23-251. The fluxes, J1 and J2, across every layer are the same because of the steady-state condition. Since the concentration difference over a thin layer is small, linear relations can be written between fluxes and forces. The intensive variables (i.e., chemical potentials) change continuously from the feed across the membrane to the permeate side. Equilibrium exists at the hypothetical interfaces of the thin layers; therefore the chemical potential of a component at the outstream side of the nth layer is equal to that at the instream side of the (n+l)th layer.
In cases where the concentration profiles in the membrane are far from linear one can question if it is permissible to use linear relations, because a small number of layers is responsible for the major part of the concentration difference. In such a case the membrane has to be divided into a large num- ber of layers so that the concentration difference over any single layer is small. By using a large number of layers (n > 100) of equal thickness, results of the calculation procedure become independent of this number, which is an indication that the procedure followed is correct.
An alternative procedure, as suggested by McCallum [25], is to divide the membrane into a number of layers of equal concentration difference but of unequal thickness. With this procedure it is also possible to treat non-linear behaviour, but the computation is more complex than the procedure we applied. By taking each layer to be infinitesimally thin, it is assumed that the concentration gradient across a layer is equal to the concentration dif- ference over the layer divided by its thickness:
dx Ax (17)
298
The transport equations (10) and (11) can be applied to each of the layers. When eqn. (17) is substituted into eqns. (10) and (ll), two coupled non- linear differential equations have been transformed into two non-linear equa- tions with two variables, @I and &. It is also possible to transform these non- linear equations into linear equations, by expressing ln a, and In az as total differentials of $ i and &. After substitution, eqn. (5) becomes
d ln a2 J2 =-qb2D2 -
dx
(18)
The partial derivatives a In al/a@,, a In a,/ap,, a In a,/&$, and a ln a2/a@2 can be obtained by differentiating eqns. (8) and (9) to $1 and 4S2 respectively (see Appendix). The result is two linear equations for JI and J2 with two variables @ 1 and $ 2 :
J1 = _ 4dn - 1P1(@1,@2)
Ax {g,,[@,(n) -@1(n - 111 +g*2[42(n) -h(n-1)1 1
(20)
J 2
= _ #2(n - 1Pz(@i,42)
Ax {gzlCGl(n)-$l(n -I)1 +g,,[tidn) ---@h-J-)1 )
(21)
The coefficients g,,, g,,, g,, and g,, are defined in the Appendix. From eqns. (20) and (21) the concentration profiles can be calculated as follows.
When the interaction parameters xi2, xl3 and x23, the permeation rates J1 and J2, the diffusion coefficients D1 and Dz, the molar volumes VI, V2 and V3 and the initial concentrations @l(n=l), cj2(n=l) and ~~(n=l) are known, the two variables $,(n=2) and @,(n=2) can be calculated. These concentra- tions are the starting values for the next layer. In this way we are able to calculate the concentrations +%I, g2 and #3 (I;@i=l) as a function of the penetra- tion distance.
Experimental
Materials Cellulose acetate (E 398-3) was obtained from Eastman Chemicals. Acetone
(reagent grade) was used without further purification.
Membrane preparation Homogeneous cellulose acetate membranes were prepared by casting a
solution of cellulose acetate in acetone upon a glass plate after which the acetone was allowed to evaporate in a nitrogen atmosphere. The membranes were completely transparent.
299
Swelling measurements Dried strips of cellulose acetate membrane (about 0.3 g) were immersed
in conical flasks containing water or ethanol. The flasks were placed in a thermostated bath at 20°C. After 24 hours the strips were removed, pressed between tissue paper and weighed in a closed flask. This procedure was con- tinued until no further weight increase was observed. The solubility can be expressed as a relative weight increase (g penetrant/lOO g dry polymer).
Pervaporation The pervaporation experiments were carried out as described previously
[26]. Vacuum at downstream side was maintained at a pressure of 13.3 Pa (0.1 mmHg) by a Crompton Parkinson vacuum pump. The pressure was measured by an Edwards piranhi. The experiments were carried out for eight hours. Samples were taken every hour and steady-state conditions were usually reached after about three hours. The thickness of the homogeneous membrane was about 20 ym. The temperature of the liquid feed mixture was about 20°C.
Product analysis Analysis of binary ethanol-water mixtures was performed on a Varian
model 3700 gas chromatograph fitted with a chromosorb 60/80 column and equipped with a thermal conductivity detector.
Results and discussion
Concentration profiles of ethanol and water in cellulose acetate membranes have been calculated using (a) apparent concentration independent diffusion coefficients calculated from steady-state pervaporation experiments, and (b) diffusion coefficients with an exponential concentration dependence.
Concentration independent diffusion coefficients The diffusion coefficients given in the first example have been calculated
from a steady-state pervaporation experiment and are in fact mean or ap- parent diffusion coefficients (see eqn. (22)) :
(22)
These calculated values are given in Table 4, together with the permeation rates, membrane thickness and volume fractions just inside the membrane at the feed/membrane boundary. These latter values are obtained numerically from eqns. (6)+9). From an equilibrium sorption experiment, performed under the same conditions as the pervaporation experiment, an overall sorp- tion value of 0.34 (= volume fraction) has been obtained. This result agrees reasonably well with the calculated values of $J I and G1 given in Table 4. The
300
binary interaction parameters, determined as described earlier, are also given in Table 4, together with the ratios of the molar volumes which have been taken from the literature [ 19,271.
TABLE 4
Parameters obtained from pervaporation experiments; feed: ethanol-water 7 3-27% by weight; temperature; 20°C
Pervaporation Other parameters parameters
J, = 0.033 cm-hr-’ VI/V, = 0.309 J, = 0.042 cm-hr-’ v,/v, = 0.002 1 = 20pm V,/V, = 0.0065 #J, = 0.133 X13 = 1.4 @2 = 0.230 XZS = 1.1 c3 = 0.637 <, = 13.8 X lo-’ cm2-seem1 D, = 10.1 X lo-’ cm’-set-’
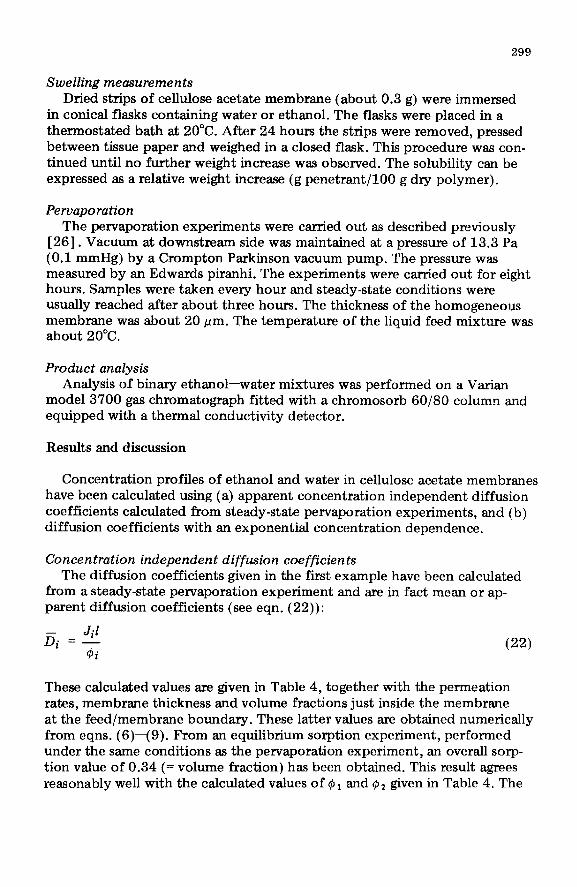
The concentration profiles of water and ethanol in cellulose acetate have been calculated from eqns. (20) and (21), using the parameters given in Table 4. These profiles are given in Fig. 3. One can see from Fig. 3 that somewhere within the membrane the concentration of ethanol becomes zero, which is not possible. Hence, it is not correct to use transport equations for liquid mixtures such as ethanol and water, using concentration independent diffusion coefficients and uncoupled flow. This conclusion was already clear-
Oi- \ Oi?
I 1
0 0.4 0.6 08
X, (relative distance through membrane)
4
Fig. 3. Calculated concentration profiles with concentration independent diffusion coef- ficients obtained from steady-state pervaporation experiments 1, water; 2, ethanol; and 3, mixture; fi, = 13.8 X lo-* cm’/sec;B’, = 10.1 X lOma cm2/sec.
301
ly stated by Meares [ 121. In a forthcoming article [ 151 we will give experi- mental evidence for this statement. As a consequence, the model description of Lee [ll] cannot be applied to this kind of liquid mixture or to any liquid mixture where the liquids exert a plasticizing action on the polymer.
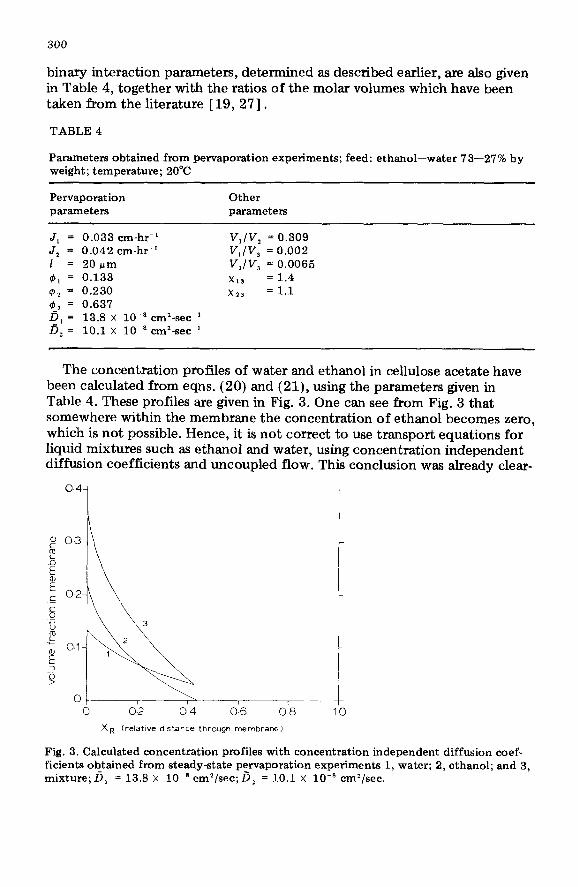
The ethanol and water profiles given in Fig. 3 can be changed by increasing the diffusion coefficients. This can be carried out quite easily numerically. If the diffusion coefficients of ethanol and water increase by a factor two, while the other parameters are kept constant, profiles are obtained as given in Fig. 4. The profiles shown in Figs. 3 and 4 do not deviate much from linearity. This can be related to the fact that concentration independent dif- fusion coefficients have been used.
X, (relatwe distance through Imembrane )
Fig. 4. Calculated concentration profiles with concentration independent diffusion coef- ficients. 1, water; 2, ethanol; and 3, mixture; 6, = 27 X lo-* cm2/sec; d, = 25 x 10.’ cm’/sec..
Concentration dependent diffusion coefficients We will now consider the case of concentration dependent diffusion coef-
ficients. Different relationships can be used to express the relation between diffusion coefficient and concentration. Most authors have used a linear [9,28] or an exponential [2-5, 10,29, 301 relationship. An exponential relationship holds for the case where the diffusion coefficient is more strong- ly concentration dependent:
Di = D*i exp (7Ai) (231
In the case of a binary mixture, the diffusion coefficients of components 1 and 2 are given by
D1 =Dol exp CR& + ~~6~) (241
D2 = no2 exp (Y 1& + ~24~) (25)
302
Except for the concentration itself, two other factors determine the value of the diffusion coefficients: DO, which is the diffusion coefficient at zero concentration of penetrant and the exponential factor, y , which is a plasticiz- ing constant, showing the effect of the penetrant concentration on the mobil- ity of the penetrant in the membrane. In the case of liquid mixtures, there will be a combined plasticizing action (see eqns. (24) and (25)). For our model calculations the same values for the other parameters have been used as given in Table 4.
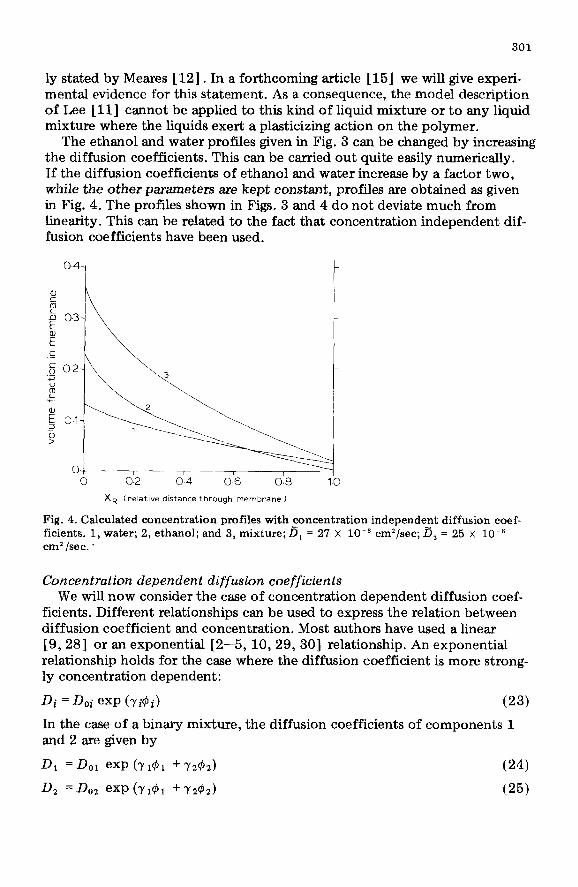
The influence of the proportionality factor, DO, and the exponential fac- tor, y , on concentration profiles are given in Figs. 5 and 6. In Fig. 5 the proportionality factor, DO, has been given a higher value, and in Fig. 6 a higher value is given to the exponential factor, y . Both figures show a typical exponential behaviour. However, the curvature strongly depends on the ex- ponential factor, y . In Figs. 5 and 6 the exponential factor y has the same value for both components. The actual values of y 1 and yZ will not be iden- tical because both components will not exert the same plasticizing action.
I I I I
0 0.2 0.4 0.6 O-8 10
XR (relative distance through membrane )
Fig. 5. Calculated concentration profiles with concentration dependent diffusion coef- ficients. D,, = 8.8 x 10e8 cm’/sec; D,, = 6.0 X lOmE cm2/sec; y, = yz = 7.3; 1, water; 2, ethanol; and 3, mixture.
The differences between Figs. 5 and 6 are evident. If y increases (Fig. 6), the concentration profiles become more concave. This is not unexpected since the contribution of the exponential factor is more important than that of the proportionality factor, DO. The exponential factor 7 is undoubtedly related to the Flory-Huggins interaction parameter, so for the system water/ ethanol/cellulose acetate, yz (ethanol) will have a higher value than y 1 (water).
At this stage a more precise study of the influence of the different factors (DO, y) on the concentration profile did not seem relevant to us without detailed information about experimental concentration profiles. In a forth-
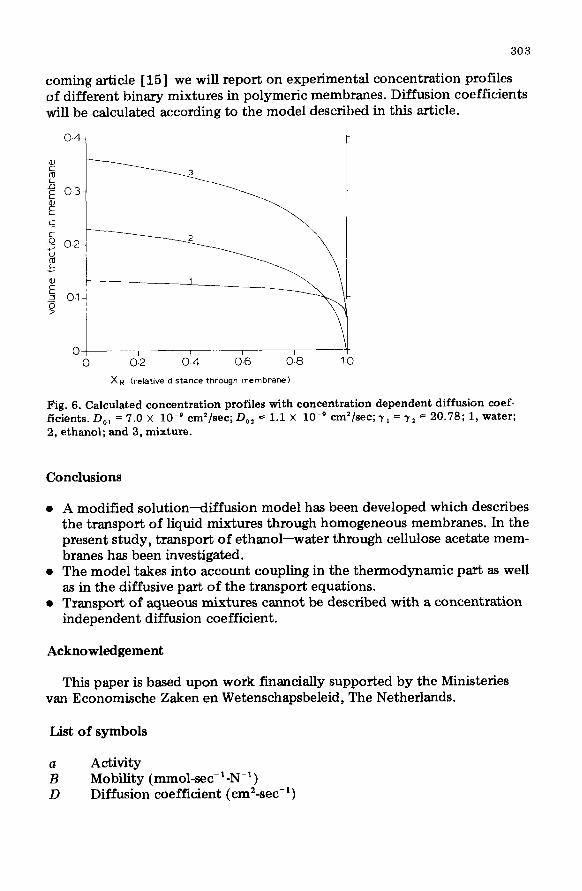
303
coming article [15] we will report on experimental concentration profiles of different binary mixtures in polymeric membranes. Diffusion coefficients will be calculated according to the model described in this article.
Oi 1 / I I
0 0.2 0.4 0.6 0.8 '
XR (relative distance tnrough membrane)
Fig. 6. Calculated concentration profiles with concentration dependent diffusion coef- ficients. D,, = 7.0 x 10e9 cm2/sec; D,, = 1.1 x 10m9 cm*/sec; 7, = yz = 20.78; 1, water; 2, ethanol; and 3, mixture.
Conclusions
l A modified solution-diffusion model has been developed which describes the transport of liquid mixtures through homogeneous membranes. In the present study, transport of ethanol-water through cellulose acetate mem- branes has been investigated.
l The model takes into account coupling in the thermodynamic part as well as in the diffusive part of the transport equations.
l Transport of aqueous mixtures cannot be described with a concentration independent diffusion coefficient.
Acknowledgement
This paper is based upon work financially supported by the Ministeries van Economische Zaken en Wetenschapsbeleid, The Netherlands.
List of symbols
; Activity Mobility (mmol-sec-l-N_‘)
D Diffusion coefficient (cm2-see-‘)
304
D Mean or apparent diffusion coefficient (cm’-see-‘)
DO Diffusion coefficient at zero concentration (cm’-see-‘)
AG, Free energy of mixing (J-mol-I) AGE Excess free energy of mixing (J-mol-‘) J 1 m
: R T U u V Ax
Permeation rate (cm-hr-’ ) Membrane thickness (pm)
Mole fraction Number of layers Pressure (Pa) Gas constant (J-mol-‘-K-l) Temperature (K) Volume fraction referred to the nonsolvent part in the ternary system Volume fraction in the binary system Molar volume ( cm3-mol-‘) Thickness of one layer (pm)
Exponential factor Flory-Huggins interaction parameter Volume fraction in the ternary system Chemical potential (J-mol-*) Specific volume (cm3-g-l) Density (g-cms3)
Indices
1 Water 2 Ethanol 3 Cellulose acetate i Component i
P Polymer
References
1 R.C. Binning, R.J. Lee, J.F. Jennings and EC. Martin, Separation of liquid mixtures, Ind. Eng. Chem., 53 (1961) 45.
2 S.N. Kim and K. Kammermeyer, Actual concentration profiles in membrane separa- tion, Sep. Sci., 5 (1970) 679.
3 R.Y.M. Huang and V.J.C. Lin, Separation of liquid mixtures by using polymer mem- branes. 1. Permeation of binary organic liquid mixtures through polyethylene, J. Appl. Polym. Sci., 12 (1968) 2615.
4 R.B. Long, Liquid permeation through plastic films, Ind. Eng. Chem. Fundam., 4 (1965) 445.
5 P. Aptel, J. Cuny, J. Jozefowicz, G. Morel and J. Neel, Liquid transport through membranes prepared by grafting of polar monomers onto poly(tetrafluoroethylene) films. II. Some factors determining pervaporation rate and selectivity, J. Appl. Polym. Sci., 18 (1974) 351.
6 M. Fels and R.Y.M. Huang, The effect of styrene grafting on the diffusion and solubil- ity of organic liquids in polyethylene, J. Appl. Polym. Sci., 14 (1970) 537.
305
7 D.R. Paul and O.M. Ebra-Lima, The mechanism of liquid transport through swollen polymer membranes, J. Appl. Polym. Sci., 15 (1971) 2199.
8 M. Fels, Permeation and separation behavior of binary organic mixtures in poly- ethylene, AIChE Symp. Ser., 68 (1972) 49.
9 F.W. Greenlaw, R.A. Shelden and E.V. Thompson, Dependence of diffusive permea- tion rates on upstream and downstream pressures. II. Two component permeant, J. Membrane Sci., 2 (1977) 333.
10 R.W.M. Tack, J.Yu. Cheung and R.L. Cook, Dioxane-water transport through Nylon-6 membranes, Sep. Sci., 9 (1974) 361.
11 C.H. Lee, Theory of reverse osmosis and some other membrane permeation opera- tions, J. Appl. Polym. Sci., 19 (1975) 83.
12 P. Meares, Transport through polymer membranes from the liquid phase, Ber. Bun- senges. Phys. Chem., 83 (1979) 342.
13 H.K. Lonsdale, U. Merten and R.L. Riley, Transport properties of cellulose acetate osmotic membranes, J. Appl. Polym. Sci., 9 (1965) 1341.
14 U. Merten, Transport properties of osmotic membranes, in: U. Merten (Ed.), Desalina- tion by Reverse Osmosis, The M.I.T. Press, Cambridge, Mass., 1966, p. 15.
15 M.H.V. Mulder, T. Franken and C.A. Smolders, On the separation of ethanol/water mixtures by pervaporation. II. Experimental concentration profiles, submitted to J. Membrane Sci.
16 P. Flory, Principles of Polymer Chemistry, Cornell University Press, Ithaca, New York, 1953.
17 A.G. Mitchell and W.F.K. WynneJones, Thermodynamic and other properties of solu- tions involving hydrogen bonding, Disc. Faraday Sot., 15 (1953) 161.
18 T.M. Aminabhavi and P. Munk, Preferential adsorption onto polystyrene in mixed solvent systems, Macromolecules, 12 (1979) 607.
19 F.W. Altena and C.A. Smolders, Calculation of liquid-liquid phase separation in a tenary system of a polymer in a mixture of a solvent and a nonsolvent, Macromolecules, 15 (1982) 1491.
20 A. Dondos, P. Rempp and H. Benoit, Effet des propri&& thermodynamiques des melanges de solvants sur les dimensions de chaines macromol&ulaires, J. Polym. Sci., Part c, 30 (1970) 9.
21 S. Westmeier, Excessenthalpie, Freie Excessenthalpie, Excessvolumen und Viskositgt von Ausgewihlten bin&en fliissigen Mischungen. Teil II. Die Systeme Wasser-Methanol und Wasser-xthanol, Chem. Techn., 28 (1976) 350.
22 M.A. Frommer, M. Shporer and R.M. Messalem, Water binding and irreversible de- hydration processes in cellulose acetate membranes, J. Appl. Polym. Sci., 17 (1973) 2263.
23 0. Kedem, Water and salt transport in hyperfiltration, in: H.K. Lonsdale and H.E. Podall (Eds.), Reverse Osmosis Membrane Research, Plenum Press, New York, 1972, p. 17.
24 KS. Spiegler and 0. Kedem, Thermodynamics of hyperfiltration (reverse osmosis) criteria for efficient membranes, Desalination, 1 (1966) 311.
25 C. McCallum and P. Meares, Computer prediction of stationary states of membranes from differential permeabilities, J. Membrane Sci., 1 (1976) 65.
26 M.H.V. Mulder, F. Kruitz and C.A. Smolders, Separation of isomeric xylenes by per- vaporation through cellulose ester membranes, J. Membrane Sci., 11 (1982) 349.
27 R.C. Weast, Handbook of Chemistry and Physics, 54th Edition, CRC Press, Cleveland, Ohio, 1973-1974.
28 R. Rautenbach and R. Albrecht, Separation of organic binary mixtures by pervapora- tion, J. Membrane Sci., 7 (1980) 203.
29 H.W. Chandler and E.J. Henley, Diffusion and equilibrium studies for the system acrylonitrilestyrene-polyethylene, AIChE J., 7 (1961) 295.
30 D.W. McCall, Diffusion in ethylene polymers. I. Desorption kinetics for a thin slab, J. Polym. Sci., 26 (1957) 151.
306
Appendix
It is assumed that the binary interaction parameter, xiz, is concentration dependent while the polymer-nonsolvent parameters x L3 and xz3 are con- sidered as constant. In the case of a ternary system, x 12 depends only on the composition of the nonsolvent mixture in the polymer (x 12 = x lz(~z)).
$2 $2
u2 = - =
41 +@2 I-@3
(Al)
For the x12(u2) function, a fourth grade polynomial relation has been chosen:
xl2 =a+bu2+cu: +duz +eu: (AZ)
The coefficients are given in Table 2. By differentiation of eqns. (8) and (9) with respect to @, and d2, the partial derivatives a In a,/ao,, a In a,/&, a In a#@, and a In a2/a$2 are obtained.
- x23 ah2
h-~ a2 =ln@2+(1-@2)-Gl + (x lZ(U2MJ 1
From eqns. (8) and (9) it is derived that:
(A3)
a lna1 1 =g11= - -1+
V1
ah 4Jl
- - xl242 + x2302
v3
; -XI& - 241 - @2) 2
ax12
+42(1-41) -
ax12
a#, + u;(l--2u~) -
3 a2x12
au2 + UlU2
au;
a lna1 V1 Vl
a#, = g12 = - v 2
+ 7 +x12(~-@1)+x*3(~1-1)
3
ax12
+ x23 ; (2@J2+91--1)+dz(~-~d r
2 2
ax12 - 2u:u, - -
2 2 ak2 -
au2
UlU2 au;
(A4)
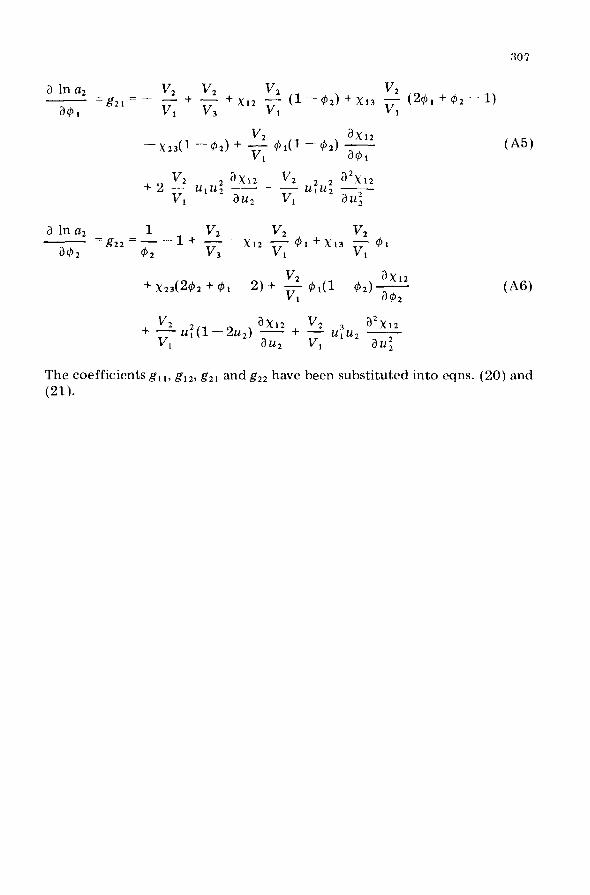
9 In a2 v, v,
241
=921=-
Vl v3 : 1 ; 1
- + - +x12 (l-02) + x13 (%I +452-l)
-x23(1 -412) + ;
3x12
Gl(J -@2) r (J45) 1 1
+ V2 ax12 6 a2x12
2 - ii1112 2 -- - u,u2 2 2 - V, au, VI au’,
a In a2 1
ah =g,, =-
$2
-l+ $1 +x13
; 3 ; 1 p, 1
-xl2
+ aX,2
x23(%2 + 41 -2) + ; @I(1 -4257 1 2
v2 ah2 v, 3 + 7&l-2u,) - +
a2x12
- UlU2
1 au2 vl au;
(A6)
The coefficients gL 1, g12, g,, and g,, have been substituted into eqns. (20) and
(21).
![Mucus permeating thiolated self-emulsifying drug delivery permeating... · 2019. 7. 1. · particulate drug delivery to the underlying mucosal epithelium [1–3]. ... As the dynamic](https://img.dokumen.tips/doc/110x75/613de9ed2809574f586e444a/mucus-permeating-thiolated-self-emulsifying-drug-delivery-permeating-2019.jpg)