Embed Size (px)
Citation preview

Health Consultation
FIDALGO BAY
ANACORTES WASHINGTON
Prepared by the Washington State Department of Health
February 25 2010
Prepared under a Cooperative Agreement with the US DEPARTMENT OF HEALTH AND HUMAN SERVICES
Agency for Toxic Substances and Disease Registry Division of Health Assessment and Consultation
Atlanta Georgia 30333
Health Consultation A Note of Explanation
A health consultation is a verbal or written response from ATSDR or ATSDRrsquos Cooperative Agreement Partners to a specific request for information about health risks related to a specific site a chemical release or the presence of hazardous material In order to prevent or mitigate exposures a consultation may lead to specific actions such as restricting use of or replacing water supplies intensifying environmental sampling restricting site access or removing the contaminated material
In addition consultations may recommend additional public health actions such as conducting health surveillance activities to evaluate exposure or trends in adverse health outcomes conducting biological indicators of exposure studies to assess exposure and providing health education for health care providers and community members This concludes the health consultation process for this site unless additional information is obtained by ATSDR or ATSDRrsquos Cooperative Agreement Partner which in the Agencyrsquos opinion indicates a need to revise or append the conclusions previously issued
You May Contact ATSDR Toll Free at 1-800-CDC-INFO
or Visit our Home Page at httpwwwatsdrcdcgov
HEALTH CONSULTATION
FIDALGO BAY
ANACORTES WASHINGTON
Prepared By
Washington State Department of Health Under Cooperative Agreement with the
Agency for Toxic Substances and Disease Registry
HC-Fidalgo Bay
Foreword
The Washington State Department of Health (DOH) has prepared this health consultation in cooperation with the Agency for Toxic Substances and Disease Registry (ATSDR) ATSDR is part of the US Department of Health and Human Services and is the principal federal public health agency responsible for health issues related to hazardous waste This health consultation was prepared in accordance with methodologies and guidelines developed by ATSDR
The purpose of this health consultation is to identify and prevent harmful human health effects resulting from exposure to hazardous substances in the environment Health consultations focus on specific health issues so that DOH can respond to requests from concerned residents or agencies for health information on hazardous substances DOH evaluates sampling data collected from a hazardous waste site determines whether exposures have occurred or could occur reports any potential harmful effects and recommends actions to protect public health The findings in this report are relevant to conditions at the site during the time of this health consultation and should not necessarily be relied upon if site conditions or land use changes in the future
For additional information or questions regarding DOH or the contents of this health consultation please call the health advisor who prepared this document
Lenford OrsquoGarro Washington State Department of Health Office of Environmental Health Assessments PO Box 47846 Olympia WA 98504-7846 (360) 236-3376 FAX (360) 236-2251 1-877-485-7316 Web site wwwdohwagovehpoehassashtm
For persons with disabilities this document is available on request in other formats To submit a request please call 1-800-525-0127 (voice) or 1-800-833-6388 (TTYTDD)
For more information about ATSDR contact the ATSDR Information Center at 1-888-422-8737 or visit the agencyrsquos Web site wwwatsdrcdcgov
2
HC-Fidalgo Bay
Table of Contents Foreword 2 Glossary 4 Summary and Statement of Issues 8 Background 9
Existing Fish Consumption Advisories 10 Discussion 10
Contaminants of Concern 10 Exposure Pathways 14 Beach Play Scenario 15 Fish and Shellfish Ingestion Scenario 15 Benefits of Fish Consumption 16 Chemical Specific Toxicity 17 Arsenic 17 Cadmium 18 Chromium 18 Dioxins and furans 19 Lead 20 Mercury 21 Polycyclic Aromatic Hydrocarbons (PAHs) 22
Evaluating non-cancer hazards 22 Evaluating Exposure to Lead 23 Evaluating Cancer Risk 24 Multiple Chemical Exposures 25 Uncertainty 26 Fish Meal Limits 27 Conclusions 28 Recommendations 28
General Advice 29 Public Health Action Plan 29 Author 30 References 31 Appendix A 39 Appendix B 42 Appendix C 46 Appendix D 54 Appendix E 60
3
HC-Fidalgo Bay
Glossary
Agency for Toxic Substances and Disease
Registry (ATSDR)
The principal federal public health agency involved with hazardous waste issues that is responsible for preventing or reducing the harmful effects of exposure to hazardous substances on human health and quality of life ATSDR is part of the US Department of Health and Human Services
Cancer Risk A theoretical risk for developing cancer if exposed to a substance every day for 70 years (a lifetime exposure) The true risk might be lower
Cancer Risk Evaluation Guide (CREG)
The concentration of a chemical in air soil or water that is expected to cause no more than one excess cancer in a million persons exposed over a lifetime The CREG is a comparison value used to select contaminants of potential health concern and is based on the cancer slope factor (CSF)
Cancer Slope Factor A number assigned to a cancer-causing chemical that is used to estimate its ability to cause cancer in humans
Carcinogen Any substance that causes cancer
Comparison value
Calculated concentration of a substance in air water food or soil that is unlikely to cause harmful (adverse) health effects in exposed people The CV is used as a screening level during the public health assessment process Substances found in amounts greater than their CVs might be selected for further evaluation in the public health assessment process
Contaminant A substance that is either present in an environment where it does not belong or is present at levels that might cause harmful (adverse) health effects
Dermal Contact Contact with (touching) the skin (see route of exposure)
Dose (for chemicals that are not
radioactive)
The amount of a substance to which a person is exposed over some time period Dose is a measurement of exposure Dose is often expressed as milligram (amount) per kilogram (a measure of body weight) per day (a measure of time) when people eat or drink contaminated water food or soil In general the greater the dose the greater the likelihood of an effect An ldquoexposure doserdquo is how much of a substance is encountered in the environment An ldquoabsorbed doserdquo is the amount of a substance that actually got into the body through the eyes skin stomach intestines or lungs
Environmental Media Evaluation Guide
(EMEG)
A concentration in air soil or water below which adverse non-cancer health effects are not expected to occur The EMEG is a comparison value used to select contaminants of potential health concern and is based on ATSDRrsquos minimal risk level (MRL)
4
HC-Fidalgo Bay
Environmental Protection Agency (EPA) United States Environmental Protection Agency
Exposure Contact with a substance by swallowing breathing or touching the skin or eyes Exposure may be short-term [acute exposure] of intermediate duration or long-term [chronic exposure]
Groundwater Water beneath the earthrsquos surface in the spaces between soil particles and between rock surfaces [compare with surface water]
Hazardous substance Any material that poses a threat to public health andor the environment Typical hazardous substances are materials that are toxic corrosive ignitable explosive or chemically reactive
Ingestion The act of swallowing something through eating drinking or mouthing objects A hazardous substance can enter the body this way [see route of exposure]
Ingestion rate (IR) The amount of an environmental medium that could be ingested typically on a daily basis Units for IR are usually literday for water and mgday for soil
Inhalation The act of breathing A hazardous substance can enter the body this way [see route of exposure]
Inorganic Compounds composed of mineral materials including elemental salts and metals such as iron aluminum mercury and zinc
Lowest Observed Adverse Effect Level (LOAEL) The lowest tested dose of a substance that has been reported to cause
harmful (adverse) health effects in people or animals
Maximum Contaminant Level (MCL)
A drinking water regulation established by the federal Safe Drinking Water Act It is the maximum permissible concentration of a contaminant in water that is delivered to the free flowing outlet of the ultimate user of a public water system MCLs are enforceable standards
Media Soil water air plants animals or any other part of the environment that can contain contaminants
5
HC-Fidalgo Bay
Minimal Risk Level (MRL)
An ATSDR estimate of daily human exposure to a hazardous substance at or below which that substance is unlikely to pose a measurable risk of harmful (adverse) noncancerous effects MRLs are calculated for a route of exposure (inhalation or oral) over a specified time period (acute intermediate or chronic) MRLs should not be used as predictors of harmful (adverse) health effects [see oral reference dose]
Model Toxics Control Act (MTCA)
The hazardous waste cleanup law for Washington State
No Observed Adverse Effect Level (NOAEL)
The highest tested dose of a substance that has been reported to have no harmful (adverse) health effects on people or animals
Oral Reference Dose (RfD)
An amount of chemical ingested into the body (ie dose) below which health effects are not expected RfDs are published by EPA
Organic Compounds composed of carbon including materials such as solvents oils and pesticides that are not easily dissolved in water
Parts per billion (ppb)Parts per million
(ppm)
Units commonly used to express low concentrations of contaminants For example 1 ounce of trichloroethylene (TCE) in 1 million ounces of water is 1 ppm 1 ounce of TCE in 1 billion ounces of water is 1 ppb If one drop of TCE is mixed in a competition size swimming pool the water will contain about 1 ppb of TCE
Plume
A volume of a substance that moves from its source to places farther away from the source Plumes can be described by the volume of air or water they occupy and the direction they move For example a plume can be a column of smoke from a chimney or a substance moving with groundwater
Reference Dose Media Evaluation Guide
(RMEG)
A concentration in air soil or water below which adverse non-cancer health effects are not expected to occur The RMEG is a comparison value used to select contaminants of potential health concern and is based on EPArsquos oral reference dose (RfD)
Route of exposure The way people come into contact with a hazardous substance Three routes of exposure are breathing [inhalation] eating or drinking [ingestion] or contact with the skin [dermal contact]
Surface Water Water on the surface of the earth such as in lakes rivers streams ponds and springs [compare with groundwater]
Time Weighted Approach (TWA)
The exposure concentration of a contaminant during a given period
6
HC-Fidalgo Bay
Volatile organic compound (VOC)
Organic compounds that evaporate readily into the air VOCs include substances such as benzene toluene methylene chloride and methyl chloroform
7
HC-Fidalgo Bay
Summary and Statement of Issues
Introduction In the Fidalgo Bay community Washington State Department of Healthrsquos (DOH) top priority is to ensure that the community has the best information possible to safeguard its health Washington State Department of Ecology (Ecology) asked DOH to conduct this health consultation The purpose of this health consultation is to evaluate the potential human health hazard posed by contaminants in sediments clams and bottom fish tissue at Fidalgo Bay in Anacortes Skagit County Washington DOH prepares health consultations under a cooperative agreement with the Agency for Toxic Substances and Disease Registry (ATSDR)
Overview DOH reached three important conclusions about Fidalgo Bay in Anacortes Skagit County Washington
Conclusion 1 DOH concludes that eating seafood at tribal scenario rates is expected to harm children and adultsrsquo health The Swinomish Samish Lummi and the Upper Skagit are tribes or nations that fish in this area or it is in their usual and accustomed fishing rights areas If any of the tribes or nations are using Fidalgo Bay for harvesting and eating seafood at tribal scenario rates this would represent a ldquopublic health hazardrdquo
Basis for conclusion Based on tribal scenario consumption rates exposures are above levels known to result in non-cancer and cancer harmful health effects
Conclusion 2 DOH concludes that eating bottom fish or shellfish from Fidalgo Bay is not expected to harm the general populationrsquos (children or adults) health
Basis for conclusion Based on general population consumption rates the exposure scenario is below levels known to result in non-cancer harmful health effects In addition the exposure scenario does not present an elevated cancer risk
Conclusion 3 DOH concludes that touching breathing or accidentally eating sediment one-day-per-week or 52 days per year from Fidalgo Bay is not expected to harm peoplersquos health
Basis for conclusion The maximum level of carcinogenic polycyclic aromatic hydrocarbons (cPAHs) in this exposure scenario is below levels known to result in non-cancer harmful health effects In addition the exposure scenario does not present an elevated cancer risk
For More Information Please feel free to contact Lenford OrsquoGarro at (360) 236-3376 or 1-877-485-7316 if you have any questions about this health consultation
8
HC-Fidalgo Bay
Background
The Fidalgo Bay site is located in western Skagit County Washington and is bordered by the City of Anacortes to the west and March Point to the east (Figures 1 2) Fidalgo Bay has supported wood product industries recreational marinas oil refining and boat building Several sites are listed on Ecologyrsquos Confirmed and Suspected Contaminated Sites List as contributing contaminants into Fidalgo Bay Therefore Fidalgo Bay has been identified by Ecology under the Toxics Cleanup Programrsquos (TCP) Puget Sound Initiative for focused sediment cleanup and source control
Fidalgo Bay is a generally shallow embayment with extensive tide flats and eelgrass The tide flats area supports spawning and rearing of forage fish (eg Pacific herring surf smelt and sand lance) juvenile salmonids clams crabs and an abundance of other marine life Many species of birds use the area including bald eagles peregrine falcons migratory waterfowl and wading birds
Past and current industries along the west shoreline of Fidalgo Bay include Cap Sante Marine Dakota Creek Industries Custom Plywood Former Shell Oil Tank Farm and Former Scott Paper Mill Across the bay from Anacortes along March Point to the east there are two oil refineries that produce gasoline diesel and propane There have been a number of accidental releases from these sites [1] Custom Plywood Cap Sante Marine Former Shell Oil Tank Farm and Dakota Creek Industries are under an Ecology agreed order to conduct a site remedial investigation and a feasibility study (RIFS) to guide the selection of a cleanup remedy Across the southern part of the bay runs the old causeway railroad trestle (Tommy Thompson Trail causeway) that was built with creosote pilings The southern end of Fidalgo Bay has been proposed as an Aquatic Reserve to be managed by the Washington State Department of Natural Resources [2 3]
Between August and October 2007 sediment and tissue samples (clams crabs and fish (skin-off fillets composites)) were collected (Figure 3) Sediment profile imaging was performed on sediments at 126 locations surface sediment chemistry analysis on sediments from 58 locations and toxicity testing on sediments from 24 locations [4 5]
Native American Tribes and Nations in the Puget Sound have reserved the right to take fish at their usual and accustomed grounds and stations These include marine and fresh water areas in and around Puget Sound The Swinomish Indian Tribal Community and Samish Indian Nation are nearest to Fidalgo Bay The Swinomish Indian Tribal Community stated that Fidalgo Bay is an important historic harvest site that has been impacted by contamination and has therefore not been used for harvest in recent years [6] However other Native American Tribes and Nations harvest seafood from the Fidalgo Bay area
9
HC-Fidalgo Bay
Existing Fish Consumption Advisories
In October 2006 DOH issued a Puget Sound Recreational Marine Area 7 Fish Consumption Advisory and a Puget Sound crab consumption advisory that recommends the following
1 Eat no more than one meal per week for rockfish and Chinook salmon and no more than one meal per month for resident (blackmouth) Chinook salmon
2 Eat Dungeness and Red Rock crab from non-urban areas and do not eat the ldquocrab butterrdquo (viscera) More information regarding these advisories is available at httpwwwdohwagovehpoehasfishrma7htm or by calling toll-free 1-877-485shy7316
Discussion
Contaminants of Concern
Contaminants of concern (COC) in sediment were determined by employing a screening process Maximum sediment contaminant levels were screened against health-based soil comparison values Several types of health-based comparison or screening values were used during this process [see the glossary for descriptions of ldquocomparison valuerdquo ldquocancer risk evaluation guide (CREG)rdquo ldquoenvironmental media evaluation guide (EMEG)rdquo and ldquoreference dose media evaluation guide (RMEG)rdquo] Comparison values such as the CREG and EMEG offer a high degree of protection and assurance that people are unlikely to be harmed by contaminants in the environment For chemicals that cause cancer the comparison values represent levels that are calculated to increase the risk of cancer by about one in a million These types of comparison values often form the basis for cleanup In general if a contaminantrsquos maximum concentration is greater than its comparison value then the contaminant is evaluated further
Comparisons may also be made with legal standards such as the cleanup levels specified in the Washington State toxic waste cleanup law the Model Toxics Control Act (MTCA) Legal standards may be strictly health-based or they may incorporate non-health considerations such as the cost the practicality of attainment or natural background levels
Tables 1 2 and 3 show the maximum concentrations of contaminants detected in analyzed sediment and tissue samples from Fidalgo Bay The contaminant ranges are similar to maximum values detected or the sample size was small
10
HC-Fidalgo Bay
Table 1 Maximum concentrations of contaminants detected in sediment within Fidalgo Bay in Anacortes Washington
Compounds Maximum Concentration
(ppm)
Comparison Value (ppm)
EPA Cancer Class
Comparison Value
Reference
Contaminant of Concern
(COC)
Arsenic 606 20 A EMEG No
Cadmium 116 10 B1 EMEG No
Chromium 298 200daggerdagger A RMEG No
Copper 269 J 2000 D IM EMEG No
Lead 128 250 B2 MTCA No
Mercury 0086 1 D MTCA No
Silver 0159 300 D RMEG No
Zinc 599 20000 D EMEG No
2-Methylnaphthalene 0007 J 200 RMEG No
Acenaphthene 0003 J 3000 RMEG No
Acenaphthylene 00088 J 2000 D No
Anthracene 0029 20000 D RMEG No
Benzo(a)anthracene 0066 062 B2 Region 9 cPAH
Benzo(a)pyrene 0073 01 B2 CREG cPAH
Benzo (b)fluoranthene 01 062 B2 Region 9 cPAH
Benzo (k)fluoranthene 0033 062 B2 Region 9 cPAH
Benzo(ghi)perylene 0033 2000 D No
Chrysene 011 62 B2 Region 9 cPAH
Dibenz(ah)anthracene 00079 J 01 CREG cPAH
Dibenzofuran 0005 J 290 D Region 9 No
Fluoranthene 024 2000 D RMEG No
Fluorene 00095 J 2000 D RMEG No
Indeno(123-cd)pyrene 0044 062 B2 Region 9 cPAH
Naphthalene 0019 30000 C IM EMEG No
Phenanthrene 0082 2000 D No
Pyrene 016 2000 D RMEG No
Hexachlorobenzene 00011 04 B2 CREG No
24-DDT 000025 J 30 B2 IM EMEG No
44-DDD 000081 JP 30 B2 IM EMEG No
44-DDE 000043 JP 30 B2 IM EMEG No
44-DDT 00007 JP 30 B2 IM EMEG No
Alpha-BHC 00014 P 01 B2 CREG No
Endosulfan I 00028 100 EMEG No
Endosulfan Sulfate 000023 J 100 EMEG No
11
HC-Fidalgo Bay
Endrin aldehyde 0017 20 D EMEG No
4-Methylphenol 10 310 Region 9 No
Benzyl alcohol 00077 J 18000 Region 9 No
Bis(2-ethylhexyl)phthalate 0026 J 3000 B2 EMEG No
Butyl benzyl phthalate 00084 J 10000 C RMEG No
Di-n-butyl phthalate 0011 J 5000 D RMEG No
Diethyl phthalate 00034 J 300000 D IM EMEG No
Dimethyl phthalate 00031 J 100000 D Region 9 No
Phenol 061 20000 D RMEG No
Total Aroclors 0035dagger 1 EMEG No
Total cPAH TEQ 0102 01 B2 CREG Yes
Total Dioxin TEQ 000000891dagger 000005 B2 No
CREG - ATSDRrsquos Cancer Risk Evaluation Guide (child) RMEG - ATSDRrsquos Reference Dose Media Evaluation Guide (child) EMEG - ATSDRrsquos Environmental Media Evaluation Guide (child) IM EMEG - ATSDRrsquos Intermediate Environmental Media Evaluation Guide (child) J - data qualifier The associated numerical result is an estimate JP - data qualifier The associated numerical result is an estimate confirmation criteria was exceeded P - data qualifier The confirmation criteria was exceeded A - EPA human carcinogen B1 - EPA Probable human carcinogen (limited human sufficient animal studies) B2 - EPA Probable human carcinogen (inadequate human sufficient animal studies) C - EPA Possible human carcinogen (no human limited animal studies) D - EPA Not classifiable as to health carcinogenicity Region 9 ndash EPA Preliminary Remediation Goals dagger
Maximum surface sediment daggerdagger
Assume hexavalent chromium Fluoranthene RMEG value was used as a surrogate Benzo(a)pyrene CREG value was used as a surrogate 44-DDT IM EMEG value was used as a surrogate Endosulfan I EMEG value was used as a surrogate Endrin EMEG value was used as a surrogate Arocolor 1254 EMEG value was used as a surrogate Total Dioxin TEQ ndash sum of dioxinfurans toxic equivalent (TEQ) Total cPAH TEQ ndash sum of all carcinogenic polycyclic aromatic hydrocarbons (cPAH) toxic equivalent (TEQ) all cPAHs in COC are added using the TEQ approach to obtain Total cPAH TEQ PPM ndash parts per million BOLD values exceed comparison values
12
HC-Fidalgo Bay
Table 2 Maximum concentration of contaminants detected in fish and shellfish sampled at Fidalgo Bay in Anacortes Washington
Chemicals Contaminant maximum concentration (ppm) Comparison Valuea
(ppm)
EPA Cancer ClassHorse
Clams Manila Clams
Bent nose
Clams
Macoma Clams
Starry Flounder
English Sole
Arsenic total 282 314 384 na 135 31 0003 A
Cadmium 015 032 031 na 0091 012 05 B1 inhalation
Chromium 223 594 591 na 043 059 147 D
Copper 520 633 8634 na 265 184 197 D
Lead 126 213 671 na 127 163 na B2
Mercury 0009 003 002 na 0071 00077 0049 D
Nickel 176 328 315 na 047 035 98
Silver 015 035 016 na 00028 00037 246 D
Zinc 1958 1310 4254 na 1116 985 1475 D
Total Dioxin TEQ
70E-8 12E-7 76E-7 69E-7 175E-7 168E-7 315E-8
A - EPA Human carcinogen B1 - EPA Probable human carcinogen (limited human sufficient animal studies) B2 - EPA Probable human carcinogen (inadequate human sufficient animal studies) D - EPA Not classifiable as to health carcinogenicity Total Dioxin TEQ ndash sum of dioxinfurans toxic equivalent (TEQ) a = Comparison values for contaminants in fish were obtained from EPA Guidance for Assessing Chemical Contaminant Data (subsistence fishers) [14] na ndash not available PPM ndash parts per million BOLD values exceed comparison values
13
HC-Fidalgo Bay
Table 3 Maximum concentration of contaminants detected in Red Rock and Dungeness crab sampled at Fidalgo Bay in Anacortes Washington
Chemicals Contaminant maximum concentration (ppm) Comparison Valuea
(ppm)
EPA Cancer ClassRed Rock Crab Dungeness Crab
Tissue Other Hepato -pancreas
Tissue Other Hepato -pancreas
Arsenic total 595 469 731 1047 681 654 0003 A
Cadmium 136 647 3313 013 023 037 05 B1 inhalation
Chromium 011 069 024 0095 084 0062 147 D
Copper 1017 2643 6852 1183 3112 3420 197 D
Lead 119 159 173 128 145 125 na B2
Mercury 0058 0026 0060 0088 0051 0049 0049 D
Nickel 025 062 135 060 054 030 98
Silver 015 023 050 023 031 046 246 D
Zinc 5655 3569 8057 4579 2439 2009 1475 D
Total Dioxin TEQ
18E-7 153E-6 657E-6 144E-7 582E-6 105E-5 315E-8
A - EPA Human carcinogen B1 - EPA Probable human carcinogen (limited human sufficient animal studies) B2 - EPA Probable human carcinogen (inadequate human sufficient animal studies) D - EPA Not classifiable as to health carcinogenicity Other soft tissue (viscera) Total Dioxin TEQ ndash sum of dioxinfurans toxic equivalent (TEQ) a = Comparison values for contaminants in fish were obtained from EPA Guidance for Assessing Chemical Contaminant Data (subsistence fishers) [14] na ndash not available PPM ndash parts per million BOLD values exceed comparison values
Exposure Pathways
In order for any contaminant to be a health concern the contaminant must be present at a high enough concentration to cause potential harm and there must be a completed route of exposure to people
Human use patterns and site-specific conditions were considered in the evaluation of exposure to lead and arsenic Exposure to contaminants in sediment can occur through the following pathways and routes
Ingestion exposure (swallowing)
Most people inadvertently swallow small amounts of sediments soil and dust (and any contaminants they might contain) Young children often put hands toys pacifiers and other things in their mouths that may have dirt or dust on them and may be swallowed Adults may
14
HC-Fidalgo Bay
ingest sediments soil and dust through activities such as gardening mowing construction work dusting and in this case recreational activities
Pica behavior is a persistent eating of non-food substances (such as dirt or paper) In a small percentage of children pica behavior has been found to result in the ingestion of relatively large amounts of soil (one or more grams per day) Compared to typical children those who swallow large amounts of contaminated soil may have added risks from short-term exposure Some adults may also exhibit pica behavior
Inhalation exposure (breathing)
Although people can inhale suspended sediment soil or dust airborne sediment usually consists of relatively large particles that are trapped in the nose mouth and throat and are then swallowed rather than breathed into the lungs
Skin exposure (dermal)
Dirt particles that can adhere to the skin may cause additional exposure to contaminants through dermal absorption Although human skin is an effective barrier for many environmental contaminants some chemicals can move easily through the skin
The following discussion addresses possible community behavior and site-specific conditions that are considered in the evaluation of exposure to carcinogenic polycyclic aromatic hydrocarbons (cPAHs) as a contaminant of concern in site sediments through the following pathways and routes
Inadvertent sediment ingestion dust particle inhalation and dermal absorption of contaminants in sediment during beach play
Beach Play Scenario
Although contact with sediments at beaches may be an infrequent or seasonal exposure pathway there is concern because areas along Fidalgo Bay have elevated levels of contaminants (see Table 1) Exposure to contaminants in sediment can occur by swallowing (ingestion exposure) breathing (inhalation exposure) or getting it on skin (dermal exposure) During recreational activities at beaches people are likely to be exposed to any sediment contaminants In order for a contaminant to be a health concern the contaminant must be present at a high enough concentration to cause potential harm and there must be a completed route of exposure to people cPAHs are evaluated in this document since they exceed their health comparison values in sediments See Appendix A for the evaluation of sediments
Fish and Shellfish Ingestion Scenario
Fidalgo Bay falls under the Puget Sound Recreational Marine Area 7 Fish Consumption Advisory which states no more than one meal per week for rockfish and Chinook salmon and no more than one meal per month for resident (blackmouth) Chinook salmon This area also falls under the Puget Sound Crab Advisory DOH recommends only Dungeness and Red Rock crab
15
HC-Fidalgo Bay
from non-urban areas be consumed and do not eat the ldquocrab butterrdquo (hepatopancreas) and viscera
Comparison values for contaminants in fish were obtained from EPArsquos Guidance for Assessing Chemical Contaminant Data (subsistence fishers) [8] Bottom fish (English sole and Starry Flounder) shellfish (Bent Nose Horse Macoma and Manila clams) and crabs (Dungeness and Red Rock) were collected and tissue was analyzed for contaminants in these samples (see Tables 2 and 3)
As mentioned above in order for a contaminant to be a health concern it must be present at a high enough concentration to cause potential harm and there must be a completed route of exposure to people People may at times disregard these advisories and consume more fish and crab from Fidalgo Bay In the event of this scenario DOH evaluated bottom fish clams and crab contaminant exposure for the general population and for the Swinomish Tribe and Samish Indian Nation Aspects of EPArsquos Tribal Fish and Shellfish consumption framework were used to set rates (See Appendix C) [9] Horse and Manila clams are targeted shellfish species for human consumption Bent Nose and Macoma clams are not usually targeted shellfish species for human consumption
Appendix B details the methodology and assumptions used by DOH to estimate exposure from eating seafood from Fidalgo Bay For the general adult population average ingestion rates of 175 gday represent the 90th percentile per capita ingestion rates for people of age 18 or older in the United States including people that do and do not consume fish [10] Since there was only data for bottom fish it was assumed that bottom fish was consumed similarly to the tribal rate of about four percent of the total intake of seafood For the general adult population an average shellfish consumption rate of 17 gday was used to calculate exposure doses For the general child population an average fish consumption rate of 028 gday based on bottom fish data only was used The average shellfish consumption rate of 057 gday was used to calculate exposure doses (See Appendix B Table B1)
The tribal consumer scenario was based on the EPA Tribal framework for fish and shellfish consumption rates for risk-based decisions (See Appendix C) [15] The percent of their consumption rate was represented by the category of seafood for both the Tulalip and the Suquamish Tribes [9 11 12]
Benefits of Fish Consumption
It is important to consider the benefits of eating fish Fish are an excellent source of protein and are associated with reduced risk of coronary heart disease The health benefits of eating fish have also been associated with low levels of saturated versus unsaturated fats Saturated fats are linked with increased cholesterol levels and risk of heart disease while unsaturated fats (eg omega-3 polyunsaturated fatty acid) are an essential nutrient Fish also provide a good source of some vitamins and minerals [13 14] The American Heart Association recommends two servings of fish per week as part of a healthy diet [15]
16
HC-Fidalgo Bay
The health benefits of eating fish deserve particular consideration when one is dealing with subsistence consuming populations Removal of fish from the diet of subsistence consumers can have serious health social and economic consequences that must be considered in issuing fish advisories Consumption advisories for subsistence consumers could therefore significantly impact diet Any advice given to fish consumers to reduce the amount of fish they eat based on chemical contamination should attempt to balance the health benefits with the health risks In general people should eat fish low in contaminants and high in omega-3 fatty acid Fish consumption advice should also take into account that eating alternative sources of protein also has risks For instance increasing the consumption rate of beef or pork at the expense of eating fish can increase the risk of heart disease In addition some contaminants that are common in fish such as dioxin might also be present in other meats
The level of contaminant exposure from fish consumption varies with the species of fish whole fish or fillet consumption rate and preparation and cooking process Exposure to contaminants in fish can be significantly reduced through simple preparation measures Simply removing the skin of the fish can reduce PCB exposure [16] Cooking fish using fillets instead of whole fish can reduce PCB levels by more than 20 In some cases PCBs were removed up to 50 through cooking [17 18]
Chemical Specific Toxicity
The following sections are general summaries of COC health effects The public health implications of exposure to these COCs from sediments and tissues are discussed later Copper will not be evaluated since Bent Nose clams are not usually targeted shellfish species for human consumption In addition DOH recommends only Dungeness and Red Rock crab from non-urban areas be consumed and do not eat the ldquocrab butterrdquo (hepatopancreas) and viscera
Arsenic
Arsenic is a naturally occurring element in the earths soil In Washington normal soil background concentrations rarely exceed 20 ppm [19] However the widespread use of arsenic-containing pesticides and the emissions from smelters has resulted in significantly higher levels of arsenic on many properties in the state There are two forms of arsenic - organic and inorganic The EPA-established reference dose (RfD) for arsenic is 00003 mgkgday based on skin color changes and excessive growth of tissue (human data) [20] EPA classifies the inorganic form of arsenic as a human carcinogen DOH will not be using the slope factor of 15 per mgkgday due to the arsenic weight of evidence approach The recent EPA IRIS review draft for the Science Advisory Board presented a slope factor for combined lung and bladder cancer of 57 per mgkgday [21] The slope factor calculated from the work by the National Research Council is about 21 per mgkgday [22] These slope factors could be higher if the combined risk for all arsenic-associated cancers (bladder lung skin kidney liver etc) were evaluated For this or any other health consultation DOH will use a slope factor of 57 per mgkgday which appears to reflect EPAs Review DRAFT assessment
Inorganic arsenic is much more harmful than organic arsenic therefore DOH based health evaluations on the levels of inorganic arsenic present in fish samples Generally inorganic arsenic in fish and shellfish ranged from about 1-20 of total arsenic [20 22 23 24] The US
17
HC-Fidalgo Bay
Food and Drug Administration (FDA) proposed 10 of total arsenic estimated as inorganic arsenic [24] Ecologyrsquos evaluation of shellfish in Puget Sound indicated that less than 1 of total arsenic found was in the inorganic form of arsenic [25] For this health consultation DOH assumed that 1 of the total arsenic detected was inorganic arsenic Therefore 1 of the concentration was used to calculate the estimated dose from exposure to inorganic arsenic in shellfish Similarly Ecologyrsquos evaluation of English Sole fish in Puget Sound indicated that less than 1 of the total arsenic found was in the inorganic form of arsenic [25] However since there was no inorganic arsenic data for Starry Flounder DOH assumed that 10 of the total arsenic detected in bottom fish was inorganic arsenic (see Uncertainty section)
Consuming seafood from Fidalgo Bay could result in an exposure dose of 135 times 10-5 mgkgday (see Appendix B Table B4) for the general public Similarly consuming seafood from Fidalgo Bay could result in exposure doses ranging from 364 times 10-4 to 629 times 10-5 mgkgday (see Appendix C Table C1 and Table C6) for a tribal population Health effects of skin cancer changes in the skin vascular disease and liver enlargement occurred in humans chronically exposed to 14 times 10-2 mgkgday of arsenic in drinking water [20] Therefore DOH does not expect that exposures to arsenic in fish shellfish and crabs will cause harmful non-cancer health effects for the general population The tribal exposure scenario resulted in doses that are slightly above the RfD In addition there is the assumption that all the seafood consumed by the tribal members is from Fidalgo Bay only However DOH does not expect that exposures to arsenic in fish shellfish and crabs will cause harmful non-cancer health effects for tribal consumption population
Cadmium
Cadmium is a naturally occurring element in the earths crust Cadmium is used mainly in batteries pigments metal coatings and metal alloys Cadmium is found in most foods at low levels with the lowest levels found in fruits and the highest found in leafy vegetables and potatoes Shellfish have higher cadmium levels (up to 1 ppm) than other types of fish or meat Cadmium is stored in the liver and kidneys and slowly leaves the body in the urine and feces [26] However high levels of cadmium will cause kidney damage and cause bones to become fragile and break easily Studies of workers exposed to airborne cadmium also suggest a link with prostate cancer The ability of cadmium to cause cancer via the oral route is disputed by many studies The RfD for cadmium that is ingested with food is 0001 mgkgday
Consuming seafood from Fidalgo Bay could result in an exposure dose of 394 times 10-5 mgkgday (see Appendix B Table B4) for the general public Similarly consuming seafood from Fidalgo Bay could result in exposure doses ranging from 30 times 10-3 to 480 times 10-4 mgkgday (see Appendix C Table C2 and Table C7) for a tribal population A NOAEL of 21 times 10-3 mgkgday was established for exposure to cadmium Therefore DOH does not expect that exposures to cadmium in crabs will cause harmful non-cancer health effects for the general population However DOH does expect that exposures to cadmium in crabs will cause harmful non-cancer health effects for tribal consumption population
Chromium
Chromium is a naturally occurring element in the earths soil Chromium is found in three main forms chromium 0 (metal) chromium III (trivalent chromium) and chromium VI (hexavalent
18
HC-Fidalgo Bay
chromium) Chromium metal is used for making steel Chromium III is an essential nutrient required by the body Chromium VI is more easily absorbed and harmful Ingesting large amounts of chromium VI can cause stomach ulcers kidney and liver damage and even death However some ingested chromium VI is converted to chromium III and most will exit the body in feces within a few days and never enter the bloodstream Only about 2 percent of ingested chromium passes through the walls of the intestine and enters the bloodstream [27 28 29] The EPA established RfD for chromium VI is 0003 mgkgday The chromium evaluated here represents total chromium as opposed to chromium VI Dose calculations however do not attempt to fractionate the chromium concentrations DOH is being very conservative in the evaluation of total chromium and considers all chromium to be chromium VI
Consuming seafood from Fidalgo Bay could result in an exposure dose of 151 times 10-4 mgkgday (see Appendix B Table B4) for the general public Similarly consuming seafood from Fidalgo Bay could result in exposure doses ranging from 116 times 10-2 to 184 times 10-3 mgkgday (see Appendix C Table C3 and Table C8) for a tribal population A NOAEL of 25 times 100 mgkgday was established for exposure to chromium (VI) The tribal exposure scenario resulted in doses that exceed the RfD but falls below the actual toxic effect levels However since DOH was very conservative in its evaluation and assumed all chromium in the seafood was chromium IV and 100 percent of the chromium was absorbed In addition there is the assumption that all the seafood consumed by the tribal members is from Fidalgo Bay only Therefore DOH does not expect that exposures to chromium in crabs will cause harmful non-cancer health effects for the general population and tribal consumption population
Dioxins and furans
Dioxins Furans and cPAHs TEQ concentrations
Although several dioxin and furan congeners were analyzed in tissue only a single value called a dioxin toxic equivalent (TEQ) is presented in this health consultation Each dioxinfuran or dioxin-like PCB congener is multiplied by a Toxic Equivalency Factor (TEF) to produce the dioxin TEQ The TEQs for each chemical are then summed to give the overall 2378shytetrachlorodibenzo-p-dioxin TEQ The TEQ approach is based on the premise that many dioxinsfurans and dioxin-like PCB congeners are structurally and toxicologically similar to 2378-tetrachlorodibenzo-p-dioxin TEFs are used to account for the different potency of dioxins and furans relative to 2378-tetrachlorodibenzo-p-dioxin and are available for ten chlorinated dibenzofurans and seven chlorinated dibenzodioxins using the World Health Organization (WHO) methodology [7] A similar TEQ approach is developed for each cPAH based on the relative potency to benzo(a)pyrene
Dioxins and furans (dioxins) consist of about 210 structural variations of dioxin congeners which differ by the number and location of chlorine atoms on the chemical structure The primary sources of dioxin releases to the environment are the combustion of fossil fuels and wood the incineration of municipal medical and hazardous waste and certain pulp and paper processes Dioxins also occur at very low levels from naturally occurring sources and can be found in food water air and cigarette smoke
19
HC-Fidalgo Bay
The most toxic of the dioxin congeners 2378-tetrachlorodibenzo-p-dioxin (TCDD) can cause chloracne (a condition of acne like lesions on the face and neck) Exposure to high levels of dioxins can cause liver damage developmental effects and impaired immune function [30] Long-term exposure to dioxins could increase the likelihood of developing cancer Studies in rats and mice exposed to TCDD resulted in thyroid and liver cancer [31] EPA considers TCDD to be a probable human carcinogen and developed a cancer slope factor of 15x 10
5
mgkgday [32 33]
Consuming seafood from Fidalgo Bay could result in an exposure dose of 196 times 10-11
mgkgday (see Appendix B Table B4) for the general public Similarly consuming seafood from Fidalgo Bay could result in exposure doses ranging from 609 times 10-10 to 101 times 10-10
mgkgday (see Appendix C Table C4 and Table C9) for a tribal population Health effects of altered social behavior have been observed in monkeys exposed to 12 times 10-7 mgkgday of dioxin [30] The tribal exposure scenario resulted in doses that are below the MRL of 1x 10
9
mgkgday Therefore DOH does not expect that exposures to dioxin in fish shellfish and crabs will cause harmful non-cancer health effects for the general population and tribal consumption population
Lead ndash Occurrence Health Concerns and Risks
Lead is a naturally occurring chemical element that is normally found in soil In Washington normal background concentrations rarely exceed 20 ppm [19] However the widespread use of certain products (such as leaded gasoline lead-containing pesticides and lead-based paint) and the emissions from certain industrial operations (such as smelters) has resulted in significantly higher levels of lead in many areas of the state
Elimination of lead in gasoline and solder used in food and beverage cans has greatly reduced exposure to lead Currently the main pathways of lead exposure in children are ingestion of paint chips contaminated soil and house dust and drinking water in homes with old plumbing
Children less than seven years old are particularly vulnerable to the effects of lead Compared to older children and adults they tend to ingest more dust and soil absorb significantly more of the lead they swallow and more of the lead they absorb can enter their developing brain Pregnant women and women of childbearing age should also be aware of lead in their environment because lead ingested by a mother can affect the unborn fetus
Health effects
Exposure to lead can be monitored by measuring the level of lead in the blood In general blood lead rises 3-7 gdl for every 1000 ppm increase in soil or dust concentration [34] For children the Centers for Disease Control and Prevention (CDC) has defined an elevated blood lead level (BLL) as greater than or equal to 10 micrograms of lead per deciliter of blood (gdl) [35] However there is growing evidence that damage to the central nervous system resulting in learning problems can occur at blood lead levels less than 10 gdl About 22 percent of children in the US have blood lead levels greater than 10 gdl
20
HC-Fidalgo Bay
Lead poisoning can affect almost every system of the body and often occurs with no obvious or distinctive symptoms Depending on the amount of exposure a child has lead can cause behavior and learning problems central nervous system damage kidney damage reduced growth hearing impairment and anemia [36]
In adults lead can cause health problems such as high blood pressure kidney damage nerve disorders memory and concentration problems difficulties during pregnancy digestive problems and pain in the muscles and joints [36] These have usually been associated with blood lead levels greater than 30 gdl
Because of chemical similarities to calcium lead can be stored in bone for many years Even after exposure to environmental lead has been reduced lead stored in bone can be released back into the blood where it can have harmful effects Normally this release occurs relatively slowly However certain conditions such as pregnancy lactation menopause and hyperthyroidism can cause more rapid release of the lead which could lead to a significant rise in blood lead level [37]
EPArsquos target cleanup goal is no more than 5 of the community with BLLs above 10 microgdL Consuming seafood from Fidalgo Bay could result in the estimated BLL for the general population 13 to 14 percent above 10 μgdL for a child and 15 to 19 percent above 10 μgdL for an adult with a 95th percentile fetus BLL range of 46 to 48 μgdL (see Appendix D Tables D1 and D6) Consumption of seafood at tribal scenario rates from Fidalgo Bay could result in the estimated BLL 125 to 3243 percent above 10 μgdL for a child and 19 to 304 percent above 10 μgdL for an adult with a 95th percentile fetus BLL range of 59 to 927 μgdL (see Appendix D Tables D3 D5 D8 and D10)
Mercury
Mercury exists in the environment in three forms elemental inorganic and organic Methylmercury is the form of organic mercury related to exposure in fish Methylmercury is formed from inorganic mercury in the environment by microorganisms in aquatic systems In the aquatic food chain methylmercury biomagnifies as it is passed from lower to higher trophic levels through consumption of prey organisms Fish at the top of the food chain can biomagnify methlymercury which represents a potential health concern for consumers of fish
Ingested methlymercury is readily absorbed and complexed with the cysteine amino acid and crosses the blood-brain barrier In Minamata Bay Japan mothers who were exposed to high amounts of mercury but were asymptomatic gave birth to severely affected infants Other epidemiologic studies have shown developmental effects in both animal and human studies are the primary concern about methylmercury exposure The EPA established RfD for mercury is 00001 mgkgday
Mercury evaluated here represents total mercury as opposed to methylmercury Dose calculations however do not attempt to fractionate the mercury concentrations because almost all of the total mercury found in fish is methylmercury
Consuming seafood from Fidalgo Bay could result in an exposure dose of 559 times 10-6 mgkgday (see Appendix B Table B4) for the general public Similarly consuming seafood from Fidalgo
21
HC-Fidalgo Bay
Bay could result in exposure doses ranging from 320 times 10-4 to 529 times 10-5 mgkgday (see Appendix C Table C5 and Table C10) for a tribal population ATSDR has derived a NOAEL of 13 times 10-3 mgkgday for mercury Therefore DOH does not expect that exposures to mercury in fish and crabs will cause harmful non-cancer health effects for the general population The tribal exposure scenario resulted in doses that slightly exceed the RfD but falls below the actual toxic effect levels In addition there is the assumption that all the seafood consumed by the tribal members is from Fidalgo Bay only Therefore DOH does not expect that exposures to mercury in fish and crabs will cause harmful non-cancer health effects for tribal consumption populations
Polycyclic Aromatic Hydrocarbons (PAHs)
Polycyclic aromatic hydrocarbons (PAHs) are generated by the incomplete combustion of organic matter including oil wood and coal They are found in materials such as creosote coal coal tar and used motor oil Based on structural similarities metabolism and toxicity PAHs are often grouped together when one is evaluating their potential for adverse health effects EPA has classified some PAHs ndash called cPAHs ndash as probable human carcinogens (Cancer Class B2) as a result of sufficient evidence of carcinogenicity in animals and inadequate evidence in humans [38]
Benzo(a)pyrene is the only cPAH for which EPA has derived a cancer slope factor The benzo(a)pyrene cancer slope factor was used as a surrogate to estimate the total cancer risk of cPAHs in sediment It should be noted benzo(a)pyrene is considered the most carcinogenic of the cPAHs The use of its cancer slope factor as a surrogate for total cPAH carcinogenicity may overestimate risk To address this issue DOH made an adjustment for each cPAH based on the relative potency to benzo(a)pyrene or TEQ [38]
Dietary sources make up a large percentage of PAH exposure in the US population Smoked or barbecued meats and fish contain relatively high levels of PAHs The majority of dietary exposure to PAHs for the average person comes from ingestion of vegetables and grains (cereals) [39]
Sediment ingestion from Fidalgo Bay could result in lifetime non cancer exposure doses of 360 times 10-7 mgkgday (see Appendix A Table A2) A LOAEL of 10 times 101 mgkgday was established for PAH Therefore DOH does not expect that exposures to PAHs in sediment will cause harmful non-cancer health effects
Evaluating non-cancer hazards
Exposure assumptions for estimating contaminant doses from sediment and tissue exposures are found in Appendices A and B Tables A1 and B1 In order to evaluate the potential for non-cancer adverse health effects that may result from exposure to contaminated media (ie air water soil and sediment) a dose is estimated for each COC These doses are calculated for situations (scenarios) in which a person might be exposed to the contaminated media The estimated dose for each contaminant under each scenario is then compared to EPArsquos oral reference dose (RfD) RfDs are doses below which non-cancer adverse health effects are not expected to occur (considered ldquosaferdquo doses) They are derived from toxic effect levels obtained from human population and laboratory animal studies These toxic effect levels can be either the
22
HC-Fidalgo Bay
lowest-observed adverse effect level (LOAEL) or a no-observed adverse effect level (NOAEL) In human or animal studies the LOAEL is the lowest dose at which an adverse health effect is seen while the NOAEL is the highest dose that does not result in any adverse health effects
Because of data uncertainty the toxic effect level is divided by ldquosafety factorsrdquo to produce the lower and more protective RfD If a dose exceeds the RfD this indicates only the potential for adverse health effects The magnitude of this potential can be inferred from the degree to which this value is exceeded If the estimated exposure dose is only slightly above the RfD then that dose will fall well below the observed toxic effect level The higher the estimated dose is above the RfD the closer it will be to the actual observed toxic effect level This comparison is called a hazard quotient (HQ) and is given by the equation below
HQ = Estimated Dose (mgkg-day) RfD (mgkg-day)
Estimated exposure doses exposure assumptions and hazard quotients are presented in Appendix A for cPAHs found in sediment Based on exposure estimates quantified in Appendix A the general population is not likely to experience adverse non-cancer health effects from exposure to chemical contaminants in Fidalgo Bay since the exposure dose did not exceed the RfD
Similarly estimated exposure doses exposure assumptions and hazard quotients are presented in Appendices B and C for contaminants found in tissue Based on exposure estimates quantified in Appendix B the general population is not likely to experience adverse non-cancer health effects from exposure to chemical contaminants in Fidalgo Bay However the tribal exposure scenario results in doses that exceed the RfD and in some cases these exposures fall below the actual toxic effect levels (see Appendix C)
Evaluating Exposure to Lead
The biokinetics of lead are different from most toxicants because it is stored in bones and remains in the body long after it is ingested Childrenrsquos exposure to lead is evaluated through the use of the Integrated Exposure Uptake Biokinetic Model for Lead in Children (IEUBK) developed by the EPA The IEUBK predicts blood lead levels in a distribution of exposed children based on the amount of lead that is in environmental media (eg fish) [40] It is important to note that the IEUBK model is not expected to accurately predict the blood lead level of a child (or a small group of children) at a specific point in time In part this is because a child (or group of children) may behave differently and therefore have different amounts of exposure to contaminated soil and dust than the average group of children used by the model to calculate blood lead levels For example the model does not take into account reductions in exposure that could result from community education programs Despite this limitation the IEUBK model is a useful tool to help prevent lead poisoning because of the information it can provide about the hazards of environmental lead exposure For children who are regularly exposed to lead-contaminated fish the IEUBK model can estimate the percentage of young children who are likely to have blood lead concentrations that exceed a level that may be associated with health problems (usually 10 gdl)
23
HC-Fidalgo Bay
Average fish lead concentrations and estimated blood lead levels
The IEUBK model was used to estimate the percentage of children that could have elevated blood lead levels if they frequently eat lead contaminated fish Default parameters are used for all model inputs unless stated [40] Exposure was based on a general population and a tribal scenario for children eating shellfish and bottom fish containing an average concentration of lead (see Appendix D)
The adult lead model was used to estimate the 95th percentile Fetal Blood Lead and the average blood lead levels of women who consume lead contaminated seafood Exposure was based on a general population and a tribal scenario for adults eating shellfish and bottom fish containing an average concentration of lead (see Appendix D)
Evaluating Cancer Risk
Some chemicals have the ability to cause cancer Theoretical cancer risk is estimated by calculating a dose similar to that described above and multiplying it by a cancer potency factor also known as the cancer slope factor Some cancer potency factors are derived from human population data Others are derived from laboratory animal studies involving doses much higher than are encountered in the environment Use of animal data requires extrapolation of the cancer potency obtained from these high dose studies down to real-world exposures This process involves much uncertainty
Current regulatory practice assumes there is no ldquosafe doserdquo of a carcinogen Any dose of a carcinogen will result in some additional cancer risk Theoretical cancer risk estimates are therefore not yesno answers but measures of chance (probability) Such measures however uncertain are useful in determining the magnitude of a cancer threat because any level of a carcinogenic contaminant carries an associated risk The validity of the ldquono safe doserdquo assumption for all cancer-causing chemicals is not clear Some evidence suggests that certain chemicals considered to be carcinogenic must exceed a threshold of tolerance before
Theoretical Cancer Riskinitiating cancer For such chemicals risk estimates are not appropriate Recent Theoretical cancer risk estimates do not reach
zero no matter how low the level of exposure guidelines on cancer risk from EPA reflect the to a carcinogen Terms used to describe this
potential that thresholds for some risk are defined below as the number of excess carcinogenesis exist However EPA still cancers expected in a lifetime assumes no threshold unless sufficient data Term of Excess Cancers indicate otherwise [41] moderate is approximately equal to 1 in 1000
low is approximately equal to 1 in 10000 very low is approximately equal to 1 in 100000
This document describes theoretical cancer slight is approximately equal to 1 in 1000000risk that is attributable to site-related insignificant is less than 1 in 1000000
contaminants in qualitative terms like low very low slight and no significant increase in theoretical cancer risk These terms can be better understood by considering the population size required for such an estimate to result in a single cancer case For example a low increase in cancer risk indicates an estimate in the range
24
HC-Fidalgo Bay
of one cancer case per ten thousand persons exposed over a lifetime A very low estimate might result in one cancer case per several tens of thousands exposed over a lifetime and a slight estimate would require an exposed population of several hundreds of thousands to result in a single case DOH considers theoretical cancer risk insignificant when the estimate results in less than one cancer per one million exposed over a lifetime The reader should note that these estimates are for excess cancers that might result in addition to those normally expected in an unexposed population
Cancer is a common illness and its occurrence in a population increases with the age of the population There are many different forms of cancer resulting from a variety of causes not all are fatal Approximately 14 to 13 of people living in the United States will develop cancer at some point in their lives [42]
Theoretical cancer risk estimates for exposure to cPAHs in sediments is considered insignificant (2 cancers estimated per 10000000 exposed) (see Appendix A Table A3) Although exposure to cPAHs may occur the magnitude is likely to be considerably less than the estimated minimum background exposure from sources in food water air sediment and soil Many areas of Fidalgo Bay are already under Ecology Agreed Orders The Orders require an RIFS be conducted to guide the selection of a cleanup remedy
Theoretical cancer risk estimates for exposure to seafood by the general population is very low (2 cancers estimated per 100000 exposed) (see Appendix B Tables B5) This estimate is within EPArsquos acceptable risk for fish consumption However this is based on bottom fish and shellfish data only Theoretical cancer risk estimates for exposure to seafood by Tribal consumers range from low to moderate (4 cancers estimated per 10000 exposed) and moderate to high (2 cancers estimated per 1000 exposed) (see Appendix C)
Multiple Chemical Exposures
A person can be exposed to more than one chemical through more than one pathway Exposure to a chemical through multiple pathways occurs if a contaminant is present in more than one medium (ie air soil surface water groundwater and sediment) For example the dose of a contaminant received from drinking water might be combined with the dose received from contact with the same contaminant in fish
For many chemicals much information is available on how the individual chemical produces effects However it is much more difficult to assess exposure to multiple chemicals Due to the large number of chemicals in the environment it is impossible to measure all of the possible interactions between these chemicals The potential exists for these chemicals to interact in the body and increase or decrease the potential for adverse health effects Individual cancer risk estimates can be added since they are measures of probability However when estimating non-cancer risk similarities must exist between the chemicals if the doses are to be added Groups of chemicals that have similar toxic effects can be added such as volatile organic compounds (VOCs) which cause liver toxicity Polycyclic aromatic hydrocarbons (PAHs) are another group of compounds that can be assessed as one combined dose based on similarities in chemical structure and metabolites
25
HC-Fidalgo Bay
The ATSDR Interaction Profile for persistent chemicals found in fish evaluates the possibility of interactive effects from exposure to a mixture of contaminants including mercury PCBs and dioxins [43]
Uncertainty
Assessment of risks attributable to environmental exposures is filled with many uncertainties Uncertainty with regard to the health assessment process refers to the lack of knowledge about factors such as chemical toxicity human variability human behavior patterns and chemical concentrations in the environment Uncertainty can be reduced through further study
The majority of uncertainty comes from our knowledge of chemical toxicity For most chemicals there is little knowledge of the actual health impacts that can occur in humans from environmental exposures unless epidemiological or clinical evidence exists As a result toxicological experiments are performed on animals These animals are exposed to chemicals at much higher levels than found in the environment The critical doses in animal studies are often extrapolated to real world exposures for use in human health risk assessments In order to be protective of human health uncertainty factors are used to lower that dose in consideration of variability in sensitivity between animals and humans and the variability within humans These uncertainty factors can account for a difference of two to three orders of magnitude when calculating risk Furthermore there are hundreds of chemicals for which little toxicological information is known in animals or humans These chemicals may in fact be toxic at some level but risks to humans cannot be quantified due to uncertainty
The majority of arsenic found in seafood is organic arsenic Inorganic arsenic in fish and shellfish ranged from about 1 to 20 of the total arsenic [20 22 23 24] Ecologyrsquos evaluation of shellfish and English sole in the Puget Sound indicated that less than 1 of the total arsenic found was in the inorganic form of arsenic [25] However since there was no arsenic speciation data for starry flounder DOH assumed that 10 of the total arsenic detected in bottom fish was inorganic arsenic Inorganic arsenic is much more harmful than organic arsenic therefore the arsenic evaluation may be overestimated
The amount of contaminated media (fish water air soil) that people eat drink inhale or absorb through their skin is another source of uncertainty Although recent work has improved our understanding of these exposure factors they are still a source of uncertainty In the case of Fidalgo Bay uncertainty exists with respect to how much fish people eat from Fidalgo Bay how often they are eating it what species they are eating how often children use public access areas and how much sediment or soil children may inadvertently eat Estimates are based on best available information or worst-case scenarios This evaluation is based on the assumption that 100 percent of the type of seafood (bottom fish and shellfish) harvested and consumed was from Fidalgo Bay
Another source of uncertainty is how seafood is actually prepared for consumption and laboratory testing (ie whole fish with guts versus gutless or fillets large clams with skin and gut ball) Bottom fish and clams may contain sediments in their digestive tracts that can affect the concentration of heavy metals during analysis Horse clams are a large clam and may show similar heavy metal patterns to geoduck clams where the skin and gut ball contain the major
26
HC-Fidalgo Bay
portion of heavy metals Bottom fish species should be analyzed without the gut and large clams should be analyzed without skin and without the gut for human health purposes
The amount and type of chemical in contaminated media is another source of uncertainty Environmental samples are very costly so it is not practical or efficient to analyze an adequate number of samples for every existing chemical Instead sampling usually focuses on contaminants that are thought to be present based on historic land use or knowledge of specific chemical spills
Fish Meal Limits
Several contaminants of concern are present in seafood from Fidalgo Bay Meal limits were calculated using the RfDMRL as the target risk value and the exposure parameters provided in Appendix E Table E1
Many factors must be considered when one is recommending limits on the consumption of seafood including the health benefits of eating fish the quality and comprehensiveness of environmental data and the availability of alternate sources of nutrition In addition these limits do not consider that multiple species are consumed a consideration that would require weighting the percent of each species consumed
Childrenrsquos Health Concerns
The potential for exposure and subsequent adverse health effects often increases for younger children compared with older children or adults ATSDR and DOH recognize that children are susceptible to developmental toxicity that can occur at levels much lower than those causing other types of toxicity The following factors contribute to this vulnerability
Children are more likely to play outdoors in contaminated areas by disregarding signs and wandering onto restricted locations
Children often bring food into contaminated areas resulting in hand-to-mouth activities Children are smaller and receive higher doses of contaminant exposures per body
weight Children are shorter than adults therefore they have a higher possibility of breathing in
dust and soil Fetal and child exposure to contaminants can cause permanent damage during critical
growth stages
These unique vulnerabilities of infants and children demand special attention in communities that have contaminated water food soil or air Childrenrsquos health was considered in the writing of this health consultation and the exposure scenarios treated children as the most sensitive population being exposed
27
HC-Fidalgo Bay
Conclusions
Based on the information provided DOH concludes the following
1 DOH concludes that consumption of seafood at tribal scenario rates is expected to harm children and adults health The Swinomish Samish Lummi and the Upper Skagit are tribes or nations that fish in this area or it is in their usual and accustomed fishing rights areas If any of the tribes or nations are using Fidalgo Bay for harvesting and is consuming at tribal scenario rates this would represent a ldquopublic health hazardrdquo The Swinomish Indian Tribal Community has stated ldquoFidalgo Bay historically an important harvest site is now impacted by contamination and thus not used for harvest in recent yearsrdquo [6] It may also be unlikely that 100 of a subsistence consumer (tribes or nations) would be consuming and harvesting from Fidalgo Bay only
2 DOH concludes that consuming bottom fish or shellfish from Fidalgo Bay is not expected to harm the general populationrsquos (children or adults) This area also falls under the Puget Sound Crab Advisory DOH recommends consuming only Dungeness and Red Rock crab from non-urban areas and that ldquocrab butterrdquo and viscera should not be eaten Based on contaminants of concern in bottom fish or shellfish calculated meal limits are 13 clams per month 14 crabs per month and 14 bottom fish per month (see Appendix E Tables E2 E3 and E4) Table E5 shows the adjustment of meal size based on the body weight of the consumer
3 DOH concludes that touching breathing or accidentally eating sediment one-day-pershyweek or 52 days per year from Fidalgo Bay is not expected to harm peoplersquos health The maximum level of carcinogenic polycyclic aromatic hydrocarbons (cPAHs) in this exposure scenario is below levels known to result in non-cancer harmful health effects In addition the exposure scenario does not present an elevated theoretical cancer risk
Recommendations
1 DOH recommends Ecology perform the necessary site remedial investigation and feasibility study (RIFS) as they work through the process of cleaning up Fidalgo Bay Proceeding with the planned cleanup will contribute to a significant reduction in human health risk
2 DOH recommends Ecology perform long-term monitoring of Fidalgo Bay DOH is available to review a monitoring plan and monitoring results
3 DOH recommends following the Puget Sound Recreational Marine Area 7 Fish Consumption Advisory and the Puget Sound crab consumption advisory that states
Eat no more than one meal per week for rockfish and Chinook salmon and no more than one meal per month for resident (blackmouth) Chinook salmon
28
HC-Fidalgo Bay
Eat Dungeness and Red Rock crab from non-urban areas and do not eat the ldquocrab butterrdquo (viscera) More information regarding these advisories is available at httpwwwdohwagovehpoehasfishrma7htm or by calling toll-free 1-877-485shy7316
4 DOH also recommends following the meal limits calculated in Appendix E Eat no more than 13 or 14 eight-ounce meals per month of clams crabs bottom fish (English sole and Starry Flounder) or any combination thereof
General Advice
DOH encourages all Washingtonians to eat at least two fish meals per week as part of a heart healthy diet in accordance with American Heart Association (AHA) recommendations People may eat fish more than two times weekly but such frequent consumers should take the following steps to reduce exposure to contaminants in the fish that they eat
bull Eat a variety of fish that are low in contaminants according to guidance provided on our website at httpwwwdohwagovfish
bull Follow fish advisory advice provided by DOH (website listed below) and local health agencies for water bodies where you fish httpwwwdohwagovehpoehasfishfishadvisorieshtm
bull Young children and small adults should eat proportionally smaller meal sizes bull Grill bake or broil fish so that fat drips off while cooking bull Eat fillets without the skin bull Mercury and other metals are stored in the fillet of the fish and will not be reduced by preparing fish this way
Public Health Action Plan
Actions Planned
1 DOH will coordinate with Ecology to provide an educational materials fact sheet
2 DOH will provide copies of this health consultation to Ecology and concerned parties
3 DOH will be available at Ecologyrsquos planned public meetings in the Fidalgo Bay community
29
HC-Fidalgo Bay
Author
Lenford OrsquoGarro Washington State Department of Health
Office of Environmental Health Assessments Site Assessment Section
Designated Reviewer Dan Alexanian Manager Site Assessment Section
Office of Environmental Health Assessments Washington State Department of Health
ATSDR Technical Project Officer Audra Henry
Cooperative Agreement and Program Evaluation Branch Division of Health Assessment and Consultation
Agency for Toxic Substances and Disease Registry
30
HC-Fidalgo Bay
References
1 SAIC 2007 Fidalgo Bay Sediment Investigation Anacortes WA Sediment Sampling and Analysis Plan Prepared for the Washington State Department of Ecology Prepared by Science Applications International Corporation (SAIC) Bothell WA September 17 2007
2 Fidalgo Bay Causeway feasibility study Request for funding from Department of Ecology Prepared by Samish Indian Nation May 4 2007 httpwwwsamishtribensnusdnrDOE2042007pdf
3 Washington State Department of Natural Resources Fidalgo Bay Environmental Aquatic Reserve management plan Skagit County Washington April 2008 Prepared by Aquatic resources program httpwwwdnrwagovPublicationsaqr_rsve_fid_mgmt_planpdf
4 SAIC 2008 Fidalgo Bay Sediment Investigation Anacortes WA Final Report Prepared for the Washington State Department of Ecology Prepared by Science Applications International Corporation (SAIC) Bothell WA March 31 2008
5 SAIC 2008 Fidalgo Bay Sediment Investigation Anacortes WA Archived Sediment and Tissue Analytical Results Data Report Addendum Prepared for the Washington State Department of Ecology Prepared by Science Applications International Corporation (SAIC) Bothell WA September 2008
6 Swinomish Water Resources Program December 1 2006 Bioaccumulative Toxics in Subsistence-Harvested Shellfish ndash Contaminant Results and Risk Assessment Swinomish Indian Tribal Community La Conner WA
7 Van den Berg M Birnbaum LS Denison M De Vito M Farland W Feeley M Fiedler H Hakansson H Hanberg A Haws L Rose M Safe S Schrenk D Tohyama C Tritscher A Tuomisto J Tysklind M Walker N amp Peterson RE (2006) The 2005 World Health Organization Reevaluation of Human and Mammalian Toxic Equivalency Factors for Dioxins and Dioxin-Like Compounds Toxicol Sci 93 223-241 Available at httptoxscioxfordjournalsorgcgicontentabstract932223
8 US Environmental Protection Agency Guidance for assessing chemical contaminant data for use in fish advisories volume 2 risk assessment and fish consumption limits third edition Office of Water Washington DC EPA 823-B-00-008 2000b
9 United States Environmental Protection Agency Framework for Selecting and Using Tribal Fish and Shellfish Consumption Rates for Risk-Based Decision Making at CERCLA and RCRA Cleanup Sites in Puget Sound and the Strait of Georgia August 2007
10 United States Environmental Protection Agency Estimated Per Capita Fish Consumption in the United States EPA 821-C-02-003 2002
31
HC-Fidalgo Bay
11 Toy KA Polissar NL Liao S and Mittelstaedt GD 1996 A fish consumption survey of the Tulalip and Squaxin Island tribes of the Puget Sound region Tulalip Tribes Department of Environment 7615 Totem Beach Road Marysville WA 98271
12 The Suquamish Tribe 2000 Fish Consumption Survey of the Suquamish Tribe of the Port Madison Indian Reservation Puget Sound Region The Suquamish Tribe 15838 Sandy Hook Road Post Office Box 498 Suquamish WA 98392
13 Alaska Division of Public Health The use of traditional foods in a healthy diet in Alaska risks in perspective 1999 Jan15
14 US Environmental Protection Agency and Toxicology Excellence for Risk Assessment August comparative dietary risks balancing the risks and benefits of fish consumption1999 Aug
15 American Heart Association An eating plan for healthy Americans Available at httpwwwamericanheartorgdietary guidelinesimagesEatPlan2000pdf
16 Hora ME Reduction of polychlorinated biphenyl (PCB) concentrations in carp (Cyprinus carpio) fillets through skin removal Bull Environ Contam Toxicol 1981 Mar 26 (3)364shy6
17 Wilson ND Shear NM Paustenbach DJ Price PS The effect of cooking practices on the concentration of DDT and PCB compounds in the edible tissue of fish J Exp Anal Environ Epidemiol 1998 Jul-Sep 8(3) 423-40
18 Zabik ME Zabik MJ Polychlorinated biphenyls polybrominated biphenyls and dioxin reduction during processingcooking food Adv Exp Med Biol1999459213-31
19 Toxics Cleanup Program Department of Ecology Natural background soil metals concentrations in Washington State Publication No 94-115Olympia Washington State Department of Ecology October 1994
20 Agency for Toxic Substances and Disease Registry (ATSDR) Toxicological profile for arsenic (update) PB2000108021 Atlanta GA US Department of Health and Human Services Public Health Service September 2005
21 US Environmental Protection Agency Toxicological Review of Inorganic Arsenic In support of summary information on the Integrated Risk Information System July 2005 httpwwwepagovwatersciencecriteriaarsenicsabAsDraft_SABpdf
22 NAS 2001b Arsenic in Drinking Water 2001 Update National Academy Press Washington DC 2001 Available at httpbooksnapedubooks0309076293htmlindexhtml
23 Francesconi KA and Edmonds JS 1997 Arsenic and marine organisms Advances in Inorganic Chemistry 44147-189
32
HC-Fidalgo Bay
24 US Food and Drug Administration (FDA) 1993 Guidance document for arsenic in shellfish Department of Health and Human Services Public Health Service Food and Drug Administration Center for Food Safety and Applied Nutrition Washington DC January 1993 Available at httpwwwfoodsafetygov~frfguid-ashtml
25 Washington State Department of Ecology Environmental Assessment Program Inorganic arsenic levels in Puget Sound fish and shellfish from 303(d) listed water bodies and other areas Prepared by Art Johnson and Morgan Roose Publication No 02-03-057 Olympia Washington State Department of Ecology December 2002
26 US Department of Health and Human Services Agency for Toxic Substances and Disease Registry Toxicological profile for Cadmium (update) PB99166621 Atlanta US Department of Health and Human Services July 1999
27 Anderson RA Polansky MM Bryden NA Patterson KY Veillon C Glinsmann WH 1983 Effects of chromium supplementation on urinary Cr excretion of human subjects and correlation of Cr excretion with selected clinical parameters J Nutr 113276ndash81 Cited in Agency for Toxic Substances and Disease Registry 2000 Toxicological profile for chromium Atlanta US Department of Health and Human Services September 2000 Available at httpwwwatsdrcdcgovtoxprofilestp7html
28 Anderson RA 1986 Chromium metabolism and its role in disease processes in man Clin Physiol Biochem 431ndash41 Cited in Agency for Toxic Substances and Disease Registry 2000 Toxicological profile for chromium Atlanta US Department of Health and Human Services September 2000 Available at httpwwwatsdrcdcgovtoxprofilestp7html
29 Donaldson RM Barreras RF 1966 Intestinal absorption of trace quantities of chromium J Lab Clin Med 68484ndash493 Cited in Agency for Toxic Substances and Disease Registry 2000 Toxicological profile for chromium Atlanta US Department of Health and Human Services September 2000 Available at httpwwwatsdrcdcgovtoxprofilestp7html
30 Agency for Toxic Substances and Disease Registry Toxicological profile for chlorinated dibenzo-p-dioxins (update) Draft for public comment Atlanta US Department of Health and Human Services 2000
31 National Toxicology Program Carcinogenesis bioassay of 2378- tetrachlorodibenzo-pshydioxin in Swiss-Webster mice (gavage study) Carcinogenesis Testing Program National Cancer Institute National Institute of Health National Toxicology Program Bethesda MD DHHS publication no 82-1765 1982
32 United States Environmental Protection Agency Health assessment document for polychlorinated dibenzo-p-dioxins Washington DC US Environmental Protection Agency Office of Health and Environmental Assessment EPA report no 6008-84014 1985
33
HC-Fidalgo Bay
33 United States Environmental Protection Agency Report on the peer review of the dioxin reassessment documents toxicity equivalency factors for dioxin and related compounds (Chapter 9) and integrated risk characterization document Alexandria VA National Center for Environmental Assessment 2000
34 Agency for Toxic Substances and Disease Registry (ATSDR) Analysis Paper Impact of Lead-Contaminated Soil on Public Health US Department of Health and Human Services Public Health Service Atlanta Georgia May 1992
35 CDC Preventing lead poisoning in young children a statement by the Centers for Disease Control October 1991 Atlanta Georgia US Department of Health and Human Services Public Health Service CDC 1991
36 US Department of Health and Human Services Agency for Toxic Substances and Disease Registry Toxicological profile for Lead (update) PB99166704 Atlanta US Department of Health and Human Services July 1999
37 Agency for Toxic Substances and Disease Registry (ATSDR) Lead Toxicity (Case studies in environmental medicine Course) SS3059 Atlanta US Department of Health and Human Services Public Health Service October 2000
38 US Department of Health and Human Services Agency for Toxic Substances and Disease Registry Toxicological Profile for Polycyclic Aromatic Hydrocarbons (PAHs) (update) PB95264370 Atlanta US Department of Health and Human Services August 1995
39 Phillips D H Polycyclic Aromatic Hydrocarbons in the diet Mutation Research 1999 (443) 139-147
40 US Environmental Protection Agency Technical Review Workgroup for Lead Userrsquos Guide for the Integrated Exposure Uptake Biokinetic Model for Lead in Children (IEUBK) Windows version 10 OSWER Directive No92857-42 Document No EPA 540-K-01-005 Washington DC May 2002
41 US Environmental Protection Agency Guidelines for Carcinogen Risk Assessment (Review Draft) NCEA-F-0644 July 1999 Available at httpwwwepagovNCEArafcancerhtm
42 ATSDR Agency for Toxic Substances and Disease Registry ATSDR Fact Sheet Cancer Updated August 30 2002 Atlanta US Department of Health and Human Services Available at httpwwwatsdrcdcgovCOMcancer-fshtml
43 Agency for Toxic Substances and Disease Registry (ATSDR) Interaction Profile for persistent chemicals found in fish US Department of Health and Human Services Public Health Service May 2004
34
HC-Fidalgo Bay
44 National Center for Environmental Assessment Exposure Factors Handbook Volume 1 ndash General Factors EPA600P-95002Fa US Environmental Protection Agency August 1997
35
HC-Fidalgo Bay
Figure 1 Demographic statistics within three miles of the site - Fidalgo Bay Skagit County
Total Population 11704 White 10818 Black 33 American Indian Eskimo Aleut 143 Asian or Pacific Islander 211 Other Race 176 Hispanic Origin 386 Children Aged 6 and Younger 943 Adults Aged 65 and Older 2310 Females Aged 15 - 44 2088 Total Aged over 18 8900 Total Aged under 18 2804 Total Housing Units 5295
Calculated using the area proportion technique Source 2000 US CENSUS
36
HC-Fidalgo Bay
Figure 2 Red box indicates the Fidalgo Bay site location Skagit County Washington
37
HC-Fidalgo Bay
Figure 3 Ecologyrsquos sediment and biota sample areas within Fidalgo Bay Skagit County Washington
38
HC-Fidalgo Bay
Appendix A This section provides calculated exposure doses and assumptions used for exposure to chemicals in sediments at the Fidalgo Bay site Three different exposure scenarios were developed to model exposures that might occur These scenarios were devised to represent exposures to a child (0-5 yrs) an older child and an adult The following exposure parameters and dose equations were used to estimate exposure doses from direct contact with chemicals in sediments
Exposure to chemicals in soil via ingestion inhalation and dermal absorption
Total dose (non-cancer) = Ingested dose + inhaled dose + dermally absorbed dose
Ingestion Route
Dose(non-cancer (mgkg-day) = C x CF x IR x EF x ED BW x ATnon-cancer
Cancer Risk = C x CF x IR x EF x CPF x ED BW x ATcancer
Dermal Route
Dermal Transfer (DT) = C x AF x ABS x AD x CF ORAF
Dose(non-cancer (mgkg-day) = DT x SA x EF x ED BW x ATnon-cancer
Cancer Risk = DT x SA x EF x CPF x ED BW x ATcancer
Inhalation Route
Dosenon-cancer (mgkg-day) = C x SMF x IHR x EF x ED x 1PEF BW x ATnon-cancer
Cancer Risk = C x SMF x IHR x EF x ED x CPF x 1PEF BW x ATcancer
39
HC-Fidalgo Bay
Table A1 Exposure assumptions used to estimate cPAHs doses from direct contact with sediments in Fidalgo Bay Anacortes WA
Parameter Value Unit Comments Concentration (C) Variable mgkg Maximum detected value
Conversion Factor (CF) 0000001 kgmg Converts contaminant concentration from milligrams (mg) to kilograms (kg)
Ingestion Rate (IR) ndash adult 100 mgday Exposure Factors Handbook [44] Ingestion Rate (IR) ndash older child 100
Ingestion Rate (IR) - child 200 Exposure Frequency (EF) 52 Daysyear One days a week
Exposure Duration (Ed) 30 (5 1015) years Number of years at one residence (child older child adult yrs)
Body Weight (BW) - adult 72 kg
Adult mean body weight Body Weight (BW) ndash older child 41 Older child mean body weight Body Weight (BW) - child 15 0-5 year-old child average body weight Surface area (SA) - adult 5700
cm2 Exposure Factors Handbook Surface area (SA) ndash older child 2900 Surface area (SA) - child 2900 Averaging Timenon-cancer (AT) 1825 days 5 years Averaging Timecancer (AT) 27375 days 75 years Cancer Potency Factor (CPF) 73 mgkg-day-1 Source EPA 24 hr absorption factor (ABS) 013 unitless Source EPA (Chemical Specific) PAH Oral route adjustment factor (ORAF) 1 unitless Non-cancer (nc) cancer (c) - default Adherence duration (AD) 1 days Source EPA
Adherence factor (AF) 02
mgcm2 Child older child 007 Adult
Inhalation rate (IHR) - adult 152 m3day Exposure Factors Handbook [44] Inhalation rate (IHR) ndash older child 14
Inhalation rate (IHR) - child 83 Soil matrix factor (SMF) 1 unitless Non-cancer (nc) cancer (c) - default Particulate emission factor (PEF) 145E+7 m3kg Model Parameters
40
HC-Fidalgo Bay
Fidalgo Bay Sediment Exposure Route ndash Non-cancer
Table A2 Non-cancer hazard calculations resulting from exposure to cPAHs in sediments from Fidalgo Bay Anacortes WA
Contaminant
TEQ Concentra
tion (ppm)
(mgkg)
Scenarios
Estimated Dose (mgkgday)
Total Dose LOAEL
(mgkgday)
Total Dose LOAELIncidental
Ingestion of Soil
Dermal Contact
with Soil
Inhalation of Particulates
Child 194E-7 730E-8 134E-11 267E-7 000000003
cPAH 0102 Older Child 354E-8 267E-8 828E-12 622E-8 10E+1 0000000006
Adult 202E-8 105E-8 512E-12 307E-8 0000000003
Fidalgo Bay Sediment Exposure Route ndash Cancer
Table A3 Cancer hazard calculations resulting from exposure to cPAHs sediments from Fidalgo Bay Anacortes WA
Contaminant Concentra tion (ppm)
EPA cancer Group
Cancer Potency Factor
(mgkg-day-1)
Scenarios
Increased Cancer Risk Total
Cancer RiskIncidental
Ingestion of Soil
Dermal Contact
with Soil
Inhalation of Particulates
Child 943E-8 355E-8 653E-12 130E-7
Total cPAH TEQ 0102 B2 73 Older Child 345E-8 260E-8 806E-12 605E-8
Adult 295E-8 153E-8 747E-12 448E-8
Lifetime cancer risk 130E-7 + 605E-8 + 448E-8 = 235E-7
41
HC-Fidalgo Bay
Appendix B
This section provides calculated exposure doses and exposure assumptions used for chemicals in bottom fish shellfish and crab samples taken from Fidalgo Bay These exposure scenarios were developed to model exposures that might occur and were devised to represent exposures to the general population The following exposure parameters and dose equations were used to estimate exposure doses from ingestion of contaminants in bottom fish and shellfish
Ingestion Route
Dose(non-cancer (mgkg-day) = C x CF1 x IR x CF2 x EF x ED BW x ATnon-cancer
Cancer Risk = C x CF1 x IR x CF2 x EF x CPF x ED BW x ATcancer
Table B1 Exposure assumptions used in exposure evaluation of contaminants in bottom fish shellfish and crab samples taken from Fidalgo Bay in Anacortes Washington
Parameter Value Unit Comments Concentration (C) Variable ugkg Average detected value
Conversion Factor (CF1) 0001 mgkg Converts contaminant concentration from milligrams (mg) to kilograms (kg)
Conversion Factor (CF2) 0001 kgg Converts mass of shellfish from grams (g) to kilograms (kg)
Ingestion Rate (IR) 057
gday
Body weight-adjusted shellfish consumption rates to account for children eating nearly 16 times as much fish per body weight as do adults (see table B2)
Ingestion Rate (IR) 028 Average general population child ndash bottom fish (see table B3)
Ingestion Rate (IR) 081 Body weight-adjusted shellfish consumption rates to account for an older child eating 081 times as much fish per body weight as do adults (see table B2)
Ingestion Rate (IR) 036 Average general population older child ndash bottom fish (see table B3)
Ingestion Rate (IR) 17 Average general population adult - shellfish
Ingestion Rate (IR) 07 Average general population adult ndash bottom fish (see table B3)
Exposure Frequency (EF) 365 Daysyear Assumes daily exposure
Exposure Duration (ED) 6 years
Number of years at one residence (child) Exposure Duration (ED) 30 Number of years at one residence (adult) Body weight (BW) 15
kg Mean body weight child
Body weight (BW) 70 Mean body weight adult Averaging Timenon-cancer (AT) Variable days Equal to Exposure Duration Averaging Timecancer (AT) 25550 days 70 years Cancer Potency Factor (CPF) Variable mgkg-day-1 Source EPA ndash Chemical specific
42
HC-Fidalgo Bay
Table B2 Derivation of a childrsquos shellfish consumption rate for the general US population
Row Parameter Adult Older Child (6-17 yrs)
Child (0-6 yrs)
1 Reported All Fish Consumption Rate-gram fish per kg bodyweight per day (gkgday)
0277 0225 0433
2 Ratio to Adult All Fish Consumption Rate
1 081 16
3 Reported Shellfish Consumption (gday)
170 (average) Not Reported Not Reported
4 Average Body Weight (kg) 70 41 15 5 Ratio to Adult BW 1 059 021 6 Adjusted Shellfish Consumption Rates
(gday) = Row 2 x Row 3 x Row 5
170 (average) 081 (average) 057 (average)
Table B3 Derivation of bottom consumption rate for the general US population based on four percent of total fish intake
Row Parameter Adult Older Child (6-17 yrs)
Child (0-6 yrs)
1 Reported All Fish Consumption Rateshy(gday)
175 90 70
2 Assume bottom fish intake rate similar to tribal at about 4 percent [15]
004 004 004
3 Adjusted bottom fish rates (gday) = Row 1 x Row 2
070 036 028
43
HC-Fidalgo Bay
Table B4 Exposure dose and non-cancer risk from ingesting seafood at the average concentrations of contaminants in bottom fish clams and crab samples taken from Fidalgo Bay in Anacortes Washington
Species Contaminant Average Concentration
(ppm)
Estimated Dose (mgkgday)
General population Average
MRL or RfD (mgkgday)
Hazard quotient
General population Average
Clams
Arsenic
0027 Child 103E-6
300E-4
0003 Older child 533E-7 0002
Adult 656E-7 0002
Crabs 0071 Child 270E-6 0009
Older child 140E-6 0005 Adult 172E-6 0006
Bottom Fish 015 Child 260E-6 0009
Older child 132E-6 0004 Adult 150E-6 0005
Crabs Cadmium 048 Child 182E-5
100E-3 0018
Older child 948E-6 0009 Adult 117E-5 0012
Clams Chromium 184 Child 699E-5
300E-3 0023
Older child 364E-5 0012 Adult 447E-5 0015
Clams
Dioxin
799E-8 Child 304E-12
10E-9
0003 Older child 158E-12 00016
Adult 194E-12 00019
Crabs 975E-8 Child 371E-12 00037
Older child 193E-12 00019 Adult 237E-12 00024
Bottom Fish 134E-7 Child 250E-12 0003
Older child 118E-12 00012 Adult 134E-12 00013
Crabs
Mercury
0049 Child 186E-6
100E-4
0019 Older child 968E-7 00097
Adult 119E-6 0012
Bottom Fish 0042 Child 784E-7 0008
Older child 369E-7 00037 Adult 420E-7 00042
PPM ndash parts per million
44
HC-Fidalgo Bay
Table B5 Cancer risk from ingesting seafood at the average concentrations of contaminants in bottom fish clams and crab samples taken from Fidalgo Bay in Anacortes Washington
Species Contaminant Average Concentration
(ppm)
Cancer Potency Factor
(mgkg-day-1)
Increased Cancer Risk
General population Average
Total Cancer Risk General population
Average
Clams
Arsenic
0027
57
Child 501E-7
153E-5
Older child 434E-7 Adult 160E-6
Crabs 0071 Child 132E-6
Older child 114E-6 Adult 421E-6
Bottom Fish 015 Child 137E-6
Older child 107E-6 Adult 366E-6
Clams
Dioxin
799E-8
15E+5
Child 390E-8
582E-7
Older child 338E-8 Adult 125E-7
Crabs 975E-8 Child 476E-8
Older child 413E-8 Adult 152E-7
Bottom Fish 134E-7 Child 322E-8
Older child 252E-8 Adult 861E-8
Sum of cancer risk 159E-5
45
HC-Fidalgo Bay
Appendix C This section provides calculated exposure doses and assumptions used for exposure to chemicals in seafood at the Fidalgo Bay site using Tulalip Tribe consumption rates It is based on the EPA Tribal framework for fish and shellfish consumption rates for risk-based decisions
Intake of contaminant in mgkg-day (IR ) = (CF x CR x x UCF ) BW c i PS i 1
[Equation 1] Where IR = Intake rate of contaminant by category of fishshellfish
c
CF = contaminant concentration (mgkg) in the tissue of the particular fish or shellfish category i
CR = the total consumption rate of fish and shellfish harvested from Puget Sound 194 grams per PS
day = the percentage of the ingestion rate that consists of the category of fish or shellfish unitless
i
BW = body weight 818 kilograms observed from the Tulalip Tribesrsquo study UCF = conversion factor 1 0001 kilograms per gram
1
Estimated cancer risk (ECR) = (IR x ED x EF x CSF) (AT x UCF ) [Equation 2] total 2
Where IR = Total intake of contaminant from site-related fish and shellfish consumption
total
ED = exposure duration 70 years EF = exposure frequency 365 days per year CSF = oral cancer slope factor for contaminant AT = averaging time 70 years for carcinogens UCF = conversion factor 2 (365 daysyear)
2
Estimated hazard index (EHI) = (IR x ED x EF x UCF ) (RfD x AT) [Equation 3] total 2
Where IR = Total intake of contaminant from site-related fish and shellfish consumption
total
ED = exposure duration 70 years EF = exposure frequency 365 days per year RfD = Oral reference dose for contaminant AT = averaging time the same as exposure duration for non-carcinogenic effects UCF = conversion factor 2 (1 yr365 days)
2
46
HC-Fidalgo Bay
Table C1 Fidalgo Bay arsenic intake rate based on the Tulalip Tribe seafood consumption rate Anacortes Washington
Overall FishShellfish Consumption Rate gday
Category Percent of Consumption Rate Represented by Category
Site-related concentration of arsenic mgkg in tissue
Category Specific Exposure mgkg-day
194 Salmon 497 0 0 194 Pelagic Fish 42 0 0 194 Bottom Fish 39 015 00000139 194 Shellfish 422 0049 00000490 Sum IRtotal 00000629 Crabs tissues and clams average
Arsenic Estimated hazard index = 021
Arsenic Estimated cancer risk = 21E-3
Table C2 Fidalgo Bay cadmium intake rate based on the Tulalip Tribe seafood consumption rate Anacortes Washington
Overall FishShellfish Consumption Rate gday
Category Percent of Consumption Rate Represented by Category
Site-related concentration of cadmium mgkg in tissue
Category Specific Exposure mgkg-day
194 Salmon 497 0 0 194 Pelagic Fish 42 0 0 194 Bottom Fish 39 0 0 194 Shellfish 422 048 000048 Sum IRtotal 000048 Crabs tissues only average
Cadmium Estimated hazard index = 03
47
HC-Fidalgo Bay
Table C3 Fidalgo Bay chromium intake rate based on Tulalip Tribe seafood consumption rate Anacortes Washington
Overall FishShellfish Consumption Rate gday
Category Percent of Consumption Rate Represented by Category
Site-related concentration of chromium mgkg in tissue
Category Specific Exposure mgkg-day
194 Salmon 497 0 0 194 Pelagic Fish 42 0 0 194 Bottom Fish 39 0 0 194 Shellfish 422 184 000184 Sum IRtotal 000184 Clams tissues only average
Chromium Estimated hazard index = 061
Table C4 Fidalgo Bay dioxin intake rate based on the Tulalip Tribe seafood consumption rate Anacortes Washington
Overall FishShellfish Consumption Rate gday
Category Percent of Consumption Rate Represented by Category
Site-related concentration of dioxin mgkg in tissue
Category Specific Exposure mgkg-day
194 Salmon 497 0 0 194 Pelagic Fish 42 0 0 194 Bottom Fish 39 134E-7 124E-11 194 Shellfish 422 887E-8 888E-11 Sum IRtotal 101E-10 Crabs tissues and clams average
Dioxin Estimated hazard index = 010
Dioxin Estimated cancer risk = 152E-5
48
HC-Fidalgo Bay
Table C5 Fidalgo Bay mercury intake rate based on the Tulalip Tribe seafood consumption rate Anacortes Washington
Overall FishShellfish Consumption Rate gday
Category Percent of Consumption Rate Represented by Category
Site-related concentration of mercury mgkg in tissue
Category Specific Exposure mgkg-day
194 Salmon 497 0 0 194 Pelagic Fish 42 0 0 194 Bottom Fish 39 0042 000000388 194 Shellfish 422 0049 0000049 Sum IRtotal 00000529 Crabs tissues only average
Mercury Estimated hazard index = 053
49
HC-Fidalgo Bay
This section provides calculated exposure doses and assumptions used for exposure to chemicals in seafood at Fidalgo Bay using Suquamish Tribe consumption rates It is based on the EPA Tribal framework for fish and shellfish consumption rates for risk-based decisions
Intake of contaminant in mgkg-day (IR ) = (CF x CR x x UCF ) BW c i PS i 1
[Equation 1] Where IR = Intake rate of contaminant by category of fishshellfish
c
CF = contaminant concentration (mgkg) in the tissue of the particular fish or shellfish category i
CR = the total consumption rate of fish and shellfish harvested from Puget Sound 7668 grams per PS
day = the percentage of the ingestion rate that consists of the category of fish or shellfish unitless
i
BW = body weight 79 kilograms observed from the Suquamish Tribesrsquo study UCF = conversion factor 1 0001 kilograms per gram
1
Estimated cancer risk (ECR) = (IR x ED x EF x CSF) (AT x UCF ) [Equation 2] total 2
Where IR = Total intake of contaminant from site-related fish and shellfish consumption
total
ED = exposure duration 70 years EF = exposure frequency 365 days per year CSF = oral cancer slope factor for contaminant AT = averaging time 70 years for carcinogens UCF = conversion factor 2 (365 daysyear)
2
Estimated hazard index (EHI) = (IR x ED x EF x UCF ) (RfD x AT) [Equation 3] total 2
Where IR = Total intake of contaminant from site-related fish and shellfish consumption
total
ED = exposure duration 70 years EF = exposure frequency 365 days per year RfD = Oral reference dose for contaminant AT = averaging time the same as exposure duration for non-carcinogenic effects UCF = conversion factor 2 (1 yr365 days)
2
50
HC-Fidalgo Bay
Table C6 Fidalgo Bay arsenic intake rate based on Suquamish Tribe seafood consumption rate Anacortes Washington
Overall FishShellfish Consumption Rate gday
Category Percent of Consumption Rate Represented by Category
Site-related concentration of arsenic mgkg in tissue
Category Specific Exposure mgkg-day
7668 Salmon 239 0 0 7668 Pelagic Fish 73 0 0 7668 Bottom Fish 38 015 00000553 7668 Shellfish 65 0049 0000309 Sum IRtotal 0000364 Crabs tissues and clams average
Arsenic Estimated hazard index = 12
Arsenic Estimated cancer risk = 359E-4
Table C7 Fidalgo Bay cadmium intake rate based on Suquamish Tribe seafood consumption rate Anacortes Washington
Overall FishShellfish Consumption Rate gday
Category Percent of Consumption Rate Represented by Category
Site-related concentration of cadmium mgkg in tissue
Category Specific Exposure mgkg-day
7668 Salmon 239 0 0 7668 Pelagic Fish 73 0 0 7668 Bottom Fish 38 0 0 7668 Shellfish 65 048 0003 Sum IRtotal 0003 Crabs tissues only average
Cadmium Estimated hazard index = 3
51
HC-Fidalgo Bay
Table C8 Fidalgo Bay chromium intake rate based on Suquamish Tribe seafood consumption rate Anacortes Washington
Overall FishShellfish Consumption Rate gday
Category Percent of Consumption Rate Represented by Category
Site-related concentration of chromium mgkg in tissue
Category Specific Exposure mgkg-day
7668 Salmon 239 0 0 7668 Pelagic Fish 73 0 0 7668 Bottom Fish 38 0 0 7668 Shellfish 65 184 00116 Sum IRtotal 00116 Clams tissues only average
Chromium Estimated hazard index = 387
Table C9 Fidalgo Bay dioxin intake rate based on Suquamish Tribe seafood consumption rate Anacortes Washington
Overall FishShellfish Consumption Rate gday
Category Percent of Consumption Rate Represented by Category
Site-related concentration of dioxin mgkg in tissue
Category Specific Exposure mgkg-day
7668 Salmon 239 0 0 7668 Pelagic Fish 73 0 0 7668 Bottom Fish 38 134E-7 494E-11 7668 Shellfish 65 887E-8 56E-10 Sum IRtotal 609E-10 Crabs tissues and clams average
Dioxin Estimated hazard index = 061 Dioxin Estimated cancer risk = 914E-5
52
HC-Fidalgo Bay
Table C10 Fidalgo Bay mercury intake rate based on Suquamish Tribe seafood consumption rate Anacortes Washington
Overall FishShellfish Consumption Rate gday
Category Percent of Consumption Rate Represented by Category
Site-related concentration of mercury mgkg in tissue
Category Specific Exposure mgkg-day
7668 Salmon 239 0 0 7668 Pelagic Fish 73 0 0 7668 Bottom Fish 38 0042 00000155 7668 Shellfish 65 0049 0000309 Sum IRtotal 000032 Crabs tissues only average
Mercury Estimated hazard index = 32
53
HC-Fidalgo Bay
Appendix D
Lead exposure shellfish ingestion scenario used in the IEUBK model
This section provides inputs for the IEUBK model The following inputs to the model were used to account for the average shellfish ingestion lead exposure from Fidalgo Bay Anacortes Washington
Consumption rates shellfish general population child ndash 057 gday bottom fish general population child ndash 028 gday
The IEUBK model assumes that a childrsquos total meat intake is 935 gday EPArsquos target cleanup goal is no more than 5 of the community with BLLs above 10 microgdL Default assumptions were used unless noted
Table D1 Blood lead values determined using the IEUBK model for lead in seafood from Fidalgo Bay Anacortes Washington
Seafood Average
Concentration (ppm)
Percent meat intake as shellfish
()
Blood Lead level in percent above 10 ugdl Age range 0 - 84 months
Shellfish 121 061 14
Bottom fish
129 030 13
Average Blood Lead level in percent above 10ugdl Age range 0 - 84 months
135
PPM ndash parts per million Crabs tissues and clams average
54
HC-Fidalgo Bay
The IEUBK model assumes that a childrsquos total meat intake is 935 gday EPArsquos target cleanup goal is no more than 5 of the community with BLLs above 10 microgdL Default assumptions were used unless noted
Percent of consumption rates represented by category were obtained by using the mean because the 90th percentile did not add up to the total intake of seafood However the overall consumption rate was based on the 90th percentile consumers only
Consumption rates Tulalip Tribe child ndash shellfish (58 gday) and bottom fish (014 gday)
Table D2 Fidalgo Bay lead intake rate based on Tulalip Tribe child seafood consumption rate Anacortes Washington
Overall FishShellfish Consumption Rate gday
Category Percent of Consumption
Rate Represented by
Category
Site-related Consumption Rate gday
1107 Salmon 284 0 1107 Pelagic Fish 18 0 1107 Bottom Fish 13 014 1107 Shellfish 523 58
Crabs tissues and clams average
Table D3 Blood lead values determine using the IEUBK model for lead in seafood from Fidalgo Bay Anacortes Washington
Seafood Average
Concentration (ppm)
Percent meat intake as shellfish
()
Blood Lead level in percent above 10ugdl Age range 0 - 84 months
Shellfish 121 62 426
Bottom fish 129 015 125 Average Blood Lead level in percent above 10ugdl Age range 0 - 84 months
276
PPM ndash parts per million Crabs tissues and clams average
55
HC-Fidalgo Bay
The IEUBK model assumes that a childrsquos total meat intake is 935 gday EPArsquos target cleanup goal is no more than 5 of the community with BLLs above 10 microgdL Default assumptions were used unless noted
Percent of consumption rates represented by category were obtained by using the mean because the 90th percentile did not add up to the total intake of seafood However the overall consumption rate was based on the 90th percentile consumers only
Consumption rates Suquamish Tribe child ndash shellfish 2926 gday and bottom fish 108 gday
Table D4 Fidalgo Bay lead intake rate based on Suquamish Tribe child seafood consumption rate Anacortes Washington
Overall FishShellfish Consumption Rate gday
Category Percent of Consumption
Rate Represented by
Category
Site-related Consumption Rate gday
5398 Salmon 183 0 5398 Pelagic Fish 91 0 5398 Other 162 0 5398 Bottom Fish 2 108 5398 Shellfish 542 2926
Crabs tissues and clams average
Table D5 Blood lead values determine using the IEUBK model for lead in seafood from Fidalgo Bay Anacortes Washington
Seafood Average
Concentration (ppm)
Percent meat intake as shellfish
()
Blood Lead level in percent above 10ugdl Age range 0 - 84 months
Shellfish 121 3129 3243
Bottom fish 129 116 163 Average Blood Lead level in percent above 10ugdl Age range 0 - 84 months
1703
PPM ndash parts per million Crabs tissues and clams average
56
HC-Fidalgo Bay
Lead exposure shellfish ingestion scenario used in the Adult lead model
This section provides inputs for the Adult lead model EPArsquos target cleanup goal is no more than 5 of the community with BLLs above 10 microgdL Default assumptions were used unless noted
Table D6 Blood lead values determined using the Adult lead model for lead in seafood from Fidalgo Bay Anacortes Washington
Seafood Average
Concentration (ppm)
Motherrsquos blood lead concentration in ugdl
95th percentile fetal blood lead in ugdl
Shellfish 121 mother 19
fetus 48
Bottom fish 129
mother 15
fetus 46
Average motherrsquos blood lead concentration in ugdl
19
Average 95th percentile fetal blood lead in ugdl
47
PPM ndash parts per million Crabs tissues and clams average
57
HC-Fidalgo Bay
Table D7 Fidalgo Bay lead intake rate based on Tulalip Tribe adult seafood consumption rate Anacortes Washington
Overall FishShellfish Consumption Rate gday
Category Percent of Consumption
Rate Represented by
Category
Site-related Consumption Rate gday
194 Salmon 497 0 194 Pelagic Fish 42 0 194 Bottom Fish 39 757 194 Shellfish 422 8187
Crabs tissues and clams average
Table D8 Blood lead values determined using the Adult lead model for lead in seafood from Fidalgo Bay Anacortes Washington
Seafood Average
Concentration (ppm)
Motherrsquos blood lead concentration in ugdl
95th percentile fetal blood lead in ugdl
Shellfish 121 mother 62
fetus 190
Bottom fish
129 mother 19
fetus 59
Average motherrsquos blood lead concentration in ugdl
41
Average 95th percentile fetal blood lead in ugdl
125
PPM ndash parts per million Crabs tissues and clams average
58
HC-Fidalgo Bay
Table D9 Fidalgo Bay lead intake rate based on the Suquamish Tribe Adult seafood consumption rate Anacortes Washington
Overall FishShellfish Consumption Rate gday
Category Percent of Consumption
Rate Represented by
Category
Site-related Consumption Rate gday
7668 Salmon 239 0 7668 Pelagic Fish 73 0 7668 Bottom Fish 38 2914 7668 Shellfish 65 49842
Crabs tissues and clams average
Table D10 Blood lead values determined using the Adult lead model for lead in seafood from Fidalgo Bay Anacortes Washington
Seafood Average
Concentration (ppm)
Motherrsquos blood lead concentration in ugdl
95th percentile fetal blood lead in ugdl
Shellfish 121 mother 304
fetus 927
Bottom fish 129
mother 33
fetus 100
Average motherrsquos blood lead concentration in ugdl
169
Average 95th percentile fetal blood lead in ugdl
514
PPM ndash parts per million Crabs tissues and clams average
59
HC-Fidalgo Bay
Appendix E
Meal Limit Calculations for contaminants of concern (non-carcinogenic health effects)
Meal limits were calculated for clams crabs and bottom fish based on contaminants of concern in each species Additionally meal limits were calculated based on developmental and immunologic endpoints for dioxin and mercury Meal limits were calculated using the equation below in conjunction with the MRL or RfD as the target risk value and the exposure parameters provided in the Table E1 below The developmental and immunologic endpoints are based on the additive effects of dioxin and mercury as recommended in the ATSDR interaction profile for toxic contaminants found in fish Tables E2 E3 and E4 provides meal limits that would be protective of women and children who eat clams crabs and bottomfish from Fidalgo Bay based on contaminants of concern in each species
ML = [(RfD or MRL)BW DM]C MS ML = recommended fish meal limit per month (mealmonth) RfD = reference dose (EPA) MRL = minimal risk level (ATSDR)
Many factors must be considered when one is recommending limits on the consumption of fish including the health benefits of eating fish the quality and comprehensiveness of environmental data and the availability of alternate sources of nutrition In addition these limits do not consider that multiple species are consumed a consideration that would require weighting of the percent of each species consumed These allowable ingestion rates also do not consider the fact that cooking reduces exposure to some contaminants in fish Therefore allowable consumption limits for prepared fish would be greater than those shown in tables E2 E3 and E4
Table E1 Exposure parameters used to calculate recommended meal limits for clams crabs and bottom fish from Fidalgo Bay in Anacortes Washington
Exposure Parameter RfD Endpoint Units MRL Developmental
RfDMRL Immunological RfDMRL
Average Concentration (C) variable ugkg Arsenic 03
ugkgday Cadmium 1 Chromium 3 Dioxin 0000001 0000001 000002 Mercury 01 01 03 Days per month (DM) 304 304 304 daysmonth Mean Body Weight (BW) 60 60 60 kg Meal size (MS) 0227 0227 0227 kg
60
HC-Fidalgo Bay
Table E2 Calculated meal limits per month for clams from Fidalgo Bay in Anacortes Washington
Contamination Concentration (ppm)
Meals based on RfD MRL
Lowest meals per month (rounded to single digit)
Arsenic 0027 893 13Chromium 184 131
Dioxin 799E-8 1006
Table E3 Calculated meal limits per month for Crabs from Fidalgo Bay in Anacortes Washington
Contamination Concentration (ppm)
Meals based on RfD MRL
Meals based on Developmental additive endpoint
Meals based on Immune additive endpoint
Lowest meals per month (rounded to single digit)
Arsenic 0071 339 14Cadmium 048 167
Dioxin 975E-8 824 137 478 Mercury 0049 164
Table E4 Calculated meal limits per month for Bottom Fish from Fidalgo Bay in Anacortes Washington
Contamination Concentration (ppm)
Meals based on RfD MRL
Meals based on Developmental additive endpoint
Meals based on Immune additive endpoint
Lowest meals per month (rounded to single digit)
Arsenic 015 161 14Dioxin 134E-7 600 145 548
Mercury 0042 191
Applying the Table E2 E3 and E4 meal limits across the general population assumes that meal size will decrease or increase proportionately with body weight Such an assumption could result in underestimating exposure for consumers who eat proportionately more fish per unit of body weight Table E5 demonstrates how an eight-ounce meal for a 70-kilogram adult would change to remain proportional with body weight
61
HC-Fidalgo Bay
Table E5 Adjustment of fish meal size based on the body weight of the consumer
Body Weight Meal Size Pounds Kilograms Ounces Grams
19 9 1 28 39 18 2 57 58 26 3 85 77 35 4 113 96 44 5 142 116 53 6 170 135 61 7 199 154 70 8 227 173 79 9 255 193 88 10 284 212 96 11 312 231 105 12 340 250 113 13 369 270 123 14 397 289 131 15 425 308 140 16 454
62
HC-Fidalgo Bay
Foreword
The Washington State Department of Health (DOH) has prepared this health consultation in cooperation with the Agency for Toxic Substances and Disease Registry (ATSDR) ATSDR is part of the US Department of Health and Human Services and is the principal federal public health agency responsible for health issues related to hazardous waste This health consultation was prepared in accordance with methodologies and guidelines developed by ATSDR
The purpose of this health consultation is to identify and prevent harmful human health effects resulting from exposure to hazardous substances in the environment Health consultations focus on specific health issues so that DOH can respond to requests from concerned residents or agencies for health information on hazardous substances DOH evaluates sampling data collected from a hazardous waste site determines whether exposures have occurred or could occur reports any potential harmful effects and recommends actions to protect public health The findings in this report are relevant to conditions at the site during the time of this health consultation and should not necessarily be relied upon if site conditions or land use changes in the future
For additional information or questions regarding DOH or the contents of this health consultation please call the health advisor who prepared this document
Lenford OrsquoGarro Washington State Department of Health Office of Environmental Health Assessments PO Box 47846 Olympia WA 98504-7846 (360) 236-3376 FAX (360) 236-2251 1-877-485-7316 Web site wwwdohwagovehpoehassashtm
For persons with disabilities this document is available on request in other formats To submit a request please call 1-800-525-0127 (voice) or 1-800-833-6388 (TTYTDD)
For more information about ATSDR contact the ATSDR Information Center at 1-888-422-8737 or visit the agencyrsquos Web site wwwatsdrcdcgov
2
HC-Fidalgo Bay
Table of Contents Foreword 2 Glossary 4 Summary and Statement of Issues 8 Background 9
Existing Fish Consumption Advisories 10 Discussion 10
Contaminants of Concern 10 Exposure Pathways 14 Beach Play Scenario 15 Fish and Shellfish Ingestion Scenario 15 Benefits of Fish Consumption 16 Chemical Specific Toxicity 17 Arsenic 17 Cadmium 18 Chromium 18 Dioxins and furans 19 Lead 20 Mercury 21 Polycyclic Aromatic Hydrocarbons (PAHs) 22
Evaluating non-cancer hazards 22 Evaluating Exposure to Lead 23 Evaluating Cancer Risk 24 Multiple Chemical Exposures 25 Uncertainty 26 Fish Meal Limits 27 Conclusions 28 Recommendations 28
General Advice 29 Public Health Action Plan 29 Author 30 References 31 Appendix A 39 Appendix B 42 Appendix C 46 Appendix D 54 Appendix E 60
3
HC-Fidalgo Bay
Glossary
Agency for Toxic Substances and Disease
Registry (ATSDR)
The principal federal public health agency involved with hazardous waste issues that is responsible for preventing or reducing the harmful effects of exposure to hazardous substances on human health and quality of life ATSDR is part of the US Department of Health and Human Services
Cancer Risk A theoretical risk for developing cancer if exposed to a substance every day for 70 years (a lifetime exposure) The true risk might be lower
Cancer Risk Evaluation Guide (CREG)
The concentration of a chemical in air soil or water that is expected to cause no more than one excess cancer in a million persons exposed over a lifetime The CREG is a comparison value used to select contaminants of potential health concern and is based on the cancer slope factor (CSF)
Cancer Slope Factor A number assigned to a cancer-causing chemical that is used to estimate its ability to cause cancer in humans
Carcinogen Any substance that causes cancer
Comparison value
Calculated concentration of a substance in air water food or soil that is unlikely to cause harmful (adverse) health effects in exposed people The CV is used as a screening level during the public health assessment process Substances found in amounts greater than their CVs might be selected for further evaluation in the public health assessment process
Contaminant A substance that is either present in an environment where it does not belong or is present at levels that might cause harmful (adverse) health effects
Dermal Contact Contact with (touching) the skin (see route of exposure)
Dose (for chemicals that are not
radioactive)
The amount of a substance to which a person is exposed over some time period Dose is a measurement of exposure Dose is often expressed as milligram (amount) per kilogram (a measure of body weight) per day (a measure of time) when people eat or drink contaminated water food or soil In general the greater the dose the greater the likelihood of an effect An ldquoexposure doserdquo is how much of a substance is encountered in the environment An ldquoabsorbed doserdquo is the amount of a substance that actually got into the body through the eyes skin stomach intestines or lungs
Environmental Media Evaluation Guide
(EMEG)
A concentration in air soil or water below which adverse non-cancer health effects are not expected to occur The EMEG is a comparison value used to select contaminants of potential health concern and is based on ATSDRrsquos minimal risk level (MRL)
4
HC-Fidalgo Bay
Environmental Protection Agency (EPA) United States Environmental Protection Agency
Exposure Contact with a substance by swallowing breathing or touching the skin or eyes Exposure may be short-term [acute exposure] of intermediate duration or long-term [chronic exposure]
Groundwater Water beneath the earthrsquos surface in the spaces between soil particles and between rock surfaces [compare with surface water]
Hazardous substance Any material that poses a threat to public health andor the environment Typical hazardous substances are materials that are toxic corrosive ignitable explosive or chemically reactive
Ingestion The act of swallowing something through eating drinking or mouthing objects A hazardous substance can enter the body this way [see route of exposure]
Ingestion rate (IR) The amount of an environmental medium that could be ingested typically on a daily basis Units for IR are usually literday for water and mgday for soil
Inhalation The act of breathing A hazardous substance can enter the body this way [see route of exposure]
Inorganic Compounds composed of mineral materials including elemental salts and metals such as iron aluminum mercury and zinc
Lowest Observed Adverse Effect Level (LOAEL) The lowest tested dose of a substance that has been reported to cause
harmful (adverse) health effects in people or animals
Maximum Contaminant Level (MCL)
A drinking water regulation established by the federal Safe Drinking Water Act It is the maximum permissible concentration of a contaminant in water that is delivered to the free flowing outlet of the ultimate user of a public water system MCLs are enforceable standards
Media Soil water air plants animals or any other part of the environment that can contain contaminants
5
HC-Fidalgo Bay
Minimal Risk Level (MRL)
An ATSDR estimate of daily human exposure to a hazardous substance at or below which that substance is unlikely to pose a measurable risk of harmful (adverse) noncancerous effects MRLs are calculated for a route of exposure (inhalation or oral) over a specified time period (acute intermediate or chronic) MRLs should not be used as predictors of harmful (adverse) health effects [see oral reference dose]
Model Toxics Control Act (MTCA)
The hazardous waste cleanup law for Washington State
No Observed Adverse Effect Level (NOAEL)
The highest tested dose of a substance that has been reported to have no harmful (adverse) health effects on people or animals
Oral Reference Dose (RfD)
An amount of chemical ingested into the body (ie dose) below which health effects are not expected RfDs are published by EPA
Organic Compounds composed of carbon including materials such as solvents oils and pesticides that are not easily dissolved in water
Parts per billion (ppb)Parts per million
(ppm)
Units commonly used to express low concentrations of contaminants For example 1 ounce of trichloroethylene (TCE) in 1 million ounces of water is 1 ppm 1 ounce of TCE in 1 billion ounces of water is 1 ppb If one drop of TCE is mixed in a competition size swimming pool the water will contain about 1 ppb of TCE
Plume
A volume of a substance that moves from its source to places farther away from the source Plumes can be described by the volume of air or water they occupy and the direction they move For example a plume can be a column of smoke from a chimney or a substance moving with groundwater
Reference Dose Media Evaluation Guide
(RMEG)
A concentration in air soil or water below which adverse non-cancer health effects are not expected to occur The RMEG is a comparison value used to select contaminants of potential health concern and is based on EPArsquos oral reference dose (RfD)
Route of exposure The way people come into contact with a hazardous substance Three routes of exposure are breathing [inhalation] eating or drinking [ingestion] or contact with the skin [dermal contact]
Surface Water Water on the surface of the earth such as in lakes rivers streams ponds and springs [compare with groundwater]
Time Weighted Approach (TWA)
The exposure concentration of a contaminant during a given period
6
HC-Fidalgo Bay
Volatile organic compound (VOC)
Organic compounds that evaporate readily into the air VOCs include substances such as benzene toluene methylene chloride and methyl chloroform
7
HC-Fidalgo Bay
Summary and Statement of Issues
Introduction In the Fidalgo Bay community Washington State Department of Healthrsquos (DOH) top priority is to ensure that the community has the best information possible to safeguard its health Washington State Department of Ecology (Ecology) asked DOH to conduct this health consultation The purpose of this health consultation is to evaluate the potential human health hazard posed by contaminants in sediments clams and bottom fish tissue at Fidalgo Bay in Anacortes Skagit County Washington DOH prepares health consultations under a cooperative agreement with the Agency for Toxic Substances and Disease Registry (ATSDR)
Overview DOH reached three important conclusions about Fidalgo Bay in Anacortes Skagit County Washington
Conclusion 1 DOH concludes that eating seafood at tribal scenario rates is expected to harm children and adultsrsquo health The Swinomish Samish Lummi and the Upper Skagit are tribes or nations that fish in this area or it is in their usual and accustomed fishing rights areas If any of the tribes or nations are using Fidalgo Bay for harvesting and eating seafood at tribal scenario rates this would represent a ldquopublic health hazardrdquo
Basis for conclusion Based on tribal scenario consumption rates exposures are above levels known to result in non-cancer and cancer harmful health effects
Conclusion 2 DOH concludes that eating bottom fish or shellfish from Fidalgo Bay is not expected to harm the general populationrsquos (children or adults) health
Basis for conclusion Based on general population consumption rates the exposure scenario is below levels known to result in non-cancer harmful health effects In addition the exposure scenario does not present an elevated cancer risk
Conclusion 3 DOH concludes that touching breathing or accidentally eating sediment one-day-per-week or 52 days per year from Fidalgo Bay is not expected to harm peoplersquos health
Basis for conclusion The maximum level of carcinogenic polycyclic aromatic hydrocarbons (cPAHs) in this exposure scenario is below levels known to result in non-cancer harmful health effects In addition the exposure scenario does not present an elevated cancer risk
For More Information Please feel free to contact Lenford OrsquoGarro at (360) 236-3376 or 1-877-485-7316 if you have any questions about this health consultation
8
HC-Fidalgo Bay
Background
The Fidalgo Bay site is located in western Skagit County Washington and is bordered by the City of Anacortes to the west and March Point to the east (Figures 1 2) Fidalgo Bay has supported wood product industries recreational marinas oil refining and boat building Several sites are listed on Ecologyrsquos Confirmed and Suspected Contaminated Sites List as contributing contaminants into Fidalgo Bay Therefore Fidalgo Bay has been identified by Ecology under the Toxics Cleanup Programrsquos (TCP) Puget Sound Initiative for focused sediment cleanup and source control
Fidalgo Bay is a generally shallow embayment with extensive tide flats and eelgrass The tide flats area supports spawning and rearing of forage fish (eg Pacific herring surf smelt and sand lance) juvenile salmonids clams crabs and an abundance of other marine life Many species of birds use the area including bald eagles peregrine falcons migratory waterfowl and wading birds
Past and current industries along the west shoreline of Fidalgo Bay include Cap Sante Marine Dakota Creek Industries Custom Plywood Former Shell Oil Tank Farm and Former Scott Paper Mill Across the bay from Anacortes along March Point to the east there are two oil refineries that produce gasoline diesel and propane There have been a number of accidental releases from these sites [1] Custom Plywood Cap Sante Marine Former Shell Oil Tank Farm and Dakota Creek Industries are under an Ecology agreed order to conduct a site remedial investigation and a feasibility study (RIFS) to guide the selection of a cleanup remedy Across the southern part of the bay runs the old causeway railroad trestle (Tommy Thompson Trail causeway) that was built with creosote pilings The southern end of Fidalgo Bay has been proposed as an Aquatic Reserve to be managed by the Washington State Department of Natural Resources [2 3]
Between August and October 2007 sediment and tissue samples (clams crabs and fish (skin-off fillets composites)) were collected (Figure 3) Sediment profile imaging was performed on sediments at 126 locations surface sediment chemistry analysis on sediments from 58 locations and toxicity testing on sediments from 24 locations [4 5]
Native American Tribes and Nations in the Puget Sound have reserved the right to take fish at their usual and accustomed grounds and stations These include marine and fresh water areas in and around Puget Sound The Swinomish Indian Tribal Community and Samish Indian Nation are nearest to Fidalgo Bay The Swinomish Indian Tribal Community stated that Fidalgo Bay is an important historic harvest site that has been impacted by contamination and has therefore not been used for harvest in recent years [6] However other Native American Tribes and Nations harvest seafood from the Fidalgo Bay area
9
HC-Fidalgo Bay
Existing Fish Consumption Advisories
In October 2006 DOH issued a Puget Sound Recreational Marine Area 7 Fish Consumption Advisory and a Puget Sound crab consumption advisory that recommends the following
1 Eat no more than one meal per week for rockfish and Chinook salmon and no more than one meal per month for resident (blackmouth) Chinook salmon
2 Eat Dungeness and Red Rock crab from non-urban areas and do not eat the ldquocrab butterrdquo (viscera) More information regarding these advisories is available at httpwwwdohwagovehpoehasfishrma7htm or by calling toll-free 1-877-485shy7316
Discussion
Contaminants of Concern
Contaminants of concern (COC) in sediment were determined by employing a screening process Maximum sediment contaminant levels were screened against health-based soil comparison values Several types of health-based comparison or screening values were used during this process [see the glossary for descriptions of ldquocomparison valuerdquo ldquocancer risk evaluation guide (CREG)rdquo ldquoenvironmental media evaluation guide (EMEG)rdquo and ldquoreference dose media evaluation guide (RMEG)rdquo] Comparison values such as the CREG and EMEG offer a high degree of protection and assurance that people are unlikely to be harmed by contaminants in the environment For chemicals that cause cancer the comparison values represent levels that are calculated to increase the risk of cancer by about one in a million These types of comparison values often form the basis for cleanup In general if a contaminantrsquos maximum concentration is greater than its comparison value then the contaminant is evaluated further
Comparisons may also be made with legal standards such as the cleanup levels specified in the Washington State toxic waste cleanup law the Model Toxics Control Act (MTCA) Legal standards may be strictly health-based or they may incorporate non-health considerations such as the cost the practicality of attainment or natural background levels
Tables 1 2 and 3 show the maximum concentrations of contaminants detected in analyzed sediment and tissue samples from Fidalgo Bay The contaminant ranges are similar to maximum values detected or the sample size was small
10
HC-Fidalgo Bay
Table 1 Maximum concentrations of contaminants detected in sediment within Fidalgo Bay in Anacortes Washington
Compounds Maximum Concentration
(ppm)
Comparison Value (ppm)
EPA Cancer Class
Comparison Value
Reference
Contaminant of Concern
(COC)
Arsenic 606 20 A EMEG No
Cadmium 116 10 B1 EMEG No
Chromium 298 200daggerdagger A RMEG No
Copper 269 J 2000 D IM EMEG No
Lead 128 250 B2 MTCA No
Mercury 0086 1 D MTCA No
Silver 0159 300 D RMEG No
Zinc 599 20000 D EMEG No
2-Methylnaphthalene 0007 J 200 RMEG No
Acenaphthene 0003 J 3000 RMEG No
Acenaphthylene 00088 J 2000 D No
Anthracene 0029 20000 D RMEG No
Benzo(a)anthracene 0066 062 B2 Region 9 cPAH
Benzo(a)pyrene 0073 01 B2 CREG cPAH
Benzo (b)fluoranthene 01 062 B2 Region 9 cPAH
Benzo (k)fluoranthene 0033 062 B2 Region 9 cPAH
Benzo(ghi)perylene 0033 2000 D No
Chrysene 011 62 B2 Region 9 cPAH
Dibenz(ah)anthracene 00079 J 01 CREG cPAH
Dibenzofuran 0005 J 290 D Region 9 No
Fluoranthene 024 2000 D RMEG No
Fluorene 00095 J 2000 D RMEG No
Indeno(123-cd)pyrene 0044 062 B2 Region 9 cPAH
Naphthalene 0019 30000 C IM EMEG No
Phenanthrene 0082 2000 D No
Pyrene 016 2000 D RMEG No
Hexachlorobenzene 00011 04 B2 CREG No
24-DDT 000025 J 30 B2 IM EMEG No
44-DDD 000081 JP 30 B2 IM EMEG No
44-DDE 000043 JP 30 B2 IM EMEG No
44-DDT 00007 JP 30 B2 IM EMEG No
Alpha-BHC 00014 P 01 B2 CREG No
Endosulfan I 00028 100 EMEG No
Endosulfan Sulfate 000023 J 100 EMEG No
11
HC-Fidalgo Bay
Endrin aldehyde 0017 20 D EMEG No
4-Methylphenol 10 310 Region 9 No
Benzyl alcohol 00077 J 18000 Region 9 No
Bis(2-ethylhexyl)phthalate 0026 J 3000 B2 EMEG No
Butyl benzyl phthalate 00084 J 10000 C RMEG No
Di-n-butyl phthalate 0011 J 5000 D RMEG No
Diethyl phthalate 00034 J 300000 D IM EMEG No
Dimethyl phthalate 00031 J 100000 D Region 9 No
Phenol 061 20000 D RMEG No
Total Aroclors 0035dagger 1 EMEG No
Total cPAH TEQ 0102 01 B2 CREG Yes
Total Dioxin TEQ 000000891dagger 000005 B2 No
CREG - ATSDRrsquos Cancer Risk Evaluation Guide (child) RMEG - ATSDRrsquos Reference Dose Media Evaluation Guide (child) EMEG - ATSDRrsquos Environmental Media Evaluation Guide (child) IM EMEG - ATSDRrsquos Intermediate Environmental Media Evaluation Guide (child) J - data qualifier The associated numerical result is an estimate JP - data qualifier The associated numerical result is an estimate confirmation criteria was exceeded P - data qualifier The confirmation criteria was exceeded A - EPA human carcinogen B1 - EPA Probable human carcinogen (limited human sufficient animal studies) B2 - EPA Probable human carcinogen (inadequate human sufficient animal studies) C - EPA Possible human carcinogen (no human limited animal studies) D - EPA Not classifiable as to health carcinogenicity Region 9 ndash EPA Preliminary Remediation Goals dagger
Maximum surface sediment daggerdagger
Assume hexavalent chromium Fluoranthene RMEG value was used as a surrogate Benzo(a)pyrene CREG value was used as a surrogate 44-DDT IM EMEG value was used as a surrogate Endosulfan I EMEG value was used as a surrogate Endrin EMEG value was used as a surrogate Arocolor 1254 EMEG value was used as a surrogate Total Dioxin TEQ ndash sum of dioxinfurans toxic equivalent (TEQ) Total cPAH TEQ ndash sum of all carcinogenic polycyclic aromatic hydrocarbons (cPAH) toxic equivalent (TEQ) all cPAHs in COC are added using the TEQ approach to obtain Total cPAH TEQ PPM ndash parts per million BOLD values exceed comparison values
12
HC-Fidalgo Bay
Table 2 Maximum concentration of contaminants detected in fish and shellfish sampled at Fidalgo Bay in Anacortes Washington
Chemicals Contaminant maximum concentration (ppm) Comparison Valuea
(ppm)
EPA Cancer ClassHorse
Clams Manila Clams
Bent nose
Clams
Macoma Clams
Starry Flounder
English Sole
Arsenic total 282 314 384 na 135 31 0003 A
Cadmium 015 032 031 na 0091 012 05 B1 inhalation
Chromium 223 594 591 na 043 059 147 D
Copper 520 633 8634 na 265 184 197 D
Lead 126 213 671 na 127 163 na B2
Mercury 0009 003 002 na 0071 00077 0049 D
Nickel 176 328 315 na 047 035 98
Silver 015 035 016 na 00028 00037 246 D
Zinc 1958 1310 4254 na 1116 985 1475 D
Total Dioxin TEQ
70E-8 12E-7 76E-7 69E-7 175E-7 168E-7 315E-8
A - EPA Human carcinogen B1 - EPA Probable human carcinogen (limited human sufficient animal studies) B2 - EPA Probable human carcinogen (inadequate human sufficient animal studies) D - EPA Not classifiable as to health carcinogenicity Total Dioxin TEQ ndash sum of dioxinfurans toxic equivalent (TEQ) a = Comparison values for contaminants in fish were obtained from EPA Guidance for Assessing Chemical Contaminant Data (subsistence fishers) [14] na ndash not available PPM ndash parts per million BOLD values exceed comparison values
13
HC-Fidalgo Bay
Table 3 Maximum concentration of contaminants detected in Red Rock and Dungeness crab sampled at Fidalgo Bay in Anacortes Washington
Chemicals Contaminant maximum concentration (ppm) Comparison Valuea
(ppm)
EPA Cancer ClassRed Rock Crab Dungeness Crab
Tissue Other Hepato -pancreas
Tissue Other Hepato -pancreas
Arsenic total 595 469 731 1047 681 654 0003 A
Cadmium 136 647 3313 013 023 037 05 B1 inhalation
Chromium 011 069 024 0095 084 0062 147 D
Copper 1017 2643 6852 1183 3112 3420 197 D
Lead 119 159 173 128 145 125 na B2
Mercury 0058 0026 0060 0088 0051 0049 0049 D
Nickel 025 062 135 060 054 030 98
Silver 015 023 050 023 031 046 246 D
Zinc 5655 3569 8057 4579 2439 2009 1475 D
Total Dioxin TEQ
18E-7 153E-6 657E-6 144E-7 582E-6 105E-5 315E-8
A - EPA Human carcinogen B1 - EPA Probable human carcinogen (limited human sufficient animal studies) B2 - EPA Probable human carcinogen (inadequate human sufficient animal studies) D - EPA Not classifiable as to health carcinogenicity Other soft tissue (viscera) Total Dioxin TEQ ndash sum of dioxinfurans toxic equivalent (TEQ) a = Comparison values for contaminants in fish were obtained from EPA Guidance for Assessing Chemical Contaminant Data (subsistence fishers) [14] na ndash not available PPM ndash parts per million BOLD values exceed comparison values
Exposure Pathways
In order for any contaminant to be a health concern the contaminant must be present at a high enough concentration to cause potential harm and there must be a completed route of exposure to people
Human use patterns and site-specific conditions were considered in the evaluation of exposure to lead and arsenic Exposure to contaminants in sediment can occur through the following pathways and routes
Ingestion exposure (swallowing)
Most people inadvertently swallow small amounts of sediments soil and dust (and any contaminants they might contain) Young children often put hands toys pacifiers and other things in their mouths that may have dirt or dust on them and may be swallowed Adults may
14
HC-Fidalgo Bay
ingest sediments soil and dust through activities such as gardening mowing construction work dusting and in this case recreational activities
Pica behavior is a persistent eating of non-food substances (such as dirt or paper) In a small percentage of children pica behavior has been found to result in the ingestion of relatively large amounts of soil (one or more grams per day) Compared to typical children those who swallow large amounts of contaminated soil may have added risks from short-term exposure Some adults may also exhibit pica behavior
Inhalation exposure (breathing)
Although people can inhale suspended sediment soil or dust airborne sediment usually consists of relatively large particles that are trapped in the nose mouth and throat and are then swallowed rather than breathed into the lungs
Skin exposure (dermal)
Dirt particles that can adhere to the skin may cause additional exposure to contaminants through dermal absorption Although human skin is an effective barrier for many environmental contaminants some chemicals can move easily through the skin
The following discussion addresses possible community behavior and site-specific conditions that are considered in the evaluation of exposure to carcinogenic polycyclic aromatic hydrocarbons (cPAHs) as a contaminant of concern in site sediments through the following pathways and routes
Inadvertent sediment ingestion dust particle inhalation and dermal absorption of contaminants in sediment during beach play
Beach Play Scenario
Although contact with sediments at beaches may be an infrequent or seasonal exposure pathway there is concern because areas along Fidalgo Bay have elevated levels of contaminants (see Table 1) Exposure to contaminants in sediment can occur by swallowing (ingestion exposure) breathing (inhalation exposure) or getting it on skin (dermal exposure) During recreational activities at beaches people are likely to be exposed to any sediment contaminants In order for a contaminant to be a health concern the contaminant must be present at a high enough concentration to cause potential harm and there must be a completed route of exposure to people cPAHs are evaluated in this document since they exceed their health comparison values in sediments See Appendix A for the evaluation of sediments
Fish and Shellfish Ingestion Scenario
Fidalgo Bay falls under the Puget Sound Recreational Marine Area 7 Fish Consumption Advisory which states no more than one meal per week for rockfish and Chinook salmon and no more than one meal per month for resident (blackmouth) Chinook salmon This area also falls under the Puget Sound Crab Advisory DOH recommends only Dungeness and Red Rock crab
15
HC-Fidalgo Bay
from non-urban areas be consumed and do not eat the ldquocrab butterrdquo (hepatopancreas) and viscera
Comparison values for contaminants in fish were obtained from EPArsquos Guidance for Assessing Chemical Contaminant Data (subsistence fishers) [8] Bottom fish (English sole and Starry Flounder) shellfish (Bent Nose Horse Macoma and Manila clams) and crabs (Dungeness and Red Rock) were collected and tissue was analyzed for contaminants in these samples (see Tables 2 and 3)
As mentioned above in order for a contaminant to be a health concern it must be present at a high enough concentration to cause potential harm and there must be a completed route of exposure to people People may at times disregard these advisories and consume more fish and crab from Fidalgo Bay In the event of this scenario DOH evaluated bottom fish clams and crab contaminant exposure for the general population and for the Swinomish Tribe and Samish Indian Nation Aspects of EPArsquos Tribal Fish and Shellfish consumption framework were used to set rates (See Appendix C) [9] Horse and Manila clams are targeted shellfish species for human consumption Bent Nose and Macoma clams are not usually targeted shellfish species for human consumption
Appendix B details the methodology and assumptions used by DOH to estimate exposure from eating seafood from Fidalgo Bay For the general adult population average ingestion rates of 175 gday represent the 90th percentile per capita ingestion rates for people of age 18 or older in the United States including people that do and do not consume fish [10] Since there was only data for bottom fish it was assumed that bottom fish was consumed similarly to the tribal rate of about four percent of the total intake of seafood For the general adult population an average shellfish consumption rate of 17 gday was used to calculate exposure doses For the general child population an average fish consumption rate of 028 gday based on bottom fish data only was used The average shellfish consumption rate of 057 gday was used to calculate exposure doses (See Appendix B Table B1)
The tribal consumer scenario was based on the EPA Tribal framework for fish and shellfish consumption rates for risk-based decisions (See Appendix C) [15] The percent of their consumption rate was represented by the category of seafood for both the Tulalip and the Suquamish Tribes [9 11 12]
Benefits of Fish Consumption
It is important to consider the benefits of eating fish Fish are an excellent source of protein and are associated with reduced risk of coronary heart disease The health benefits of eating fish have also been associated with low levels of saturated versus unsaturated fats Saturated fats are linked with increased cholesterol levels and risk of heart disease while unsaturated fats (eg omega-3 polyunsaturated fatty acid) are an essential nutrient Fish also provide a good source of some vitamins and minerals [13 14] The American Heart Association recommends two servings of fish per week as part of a healthy diet [15]
16
HC-Fidalgo Bay
The health benefits of eating fish deserve particular consideration when one is dealing with subsistence consuming populations Removal of fish from the diet of subsistence consumers can have serious health social and economic consequences that must be considered in issuing fish advisories Consumption advisories for subsistence consumers could therefore significantly impact diet Any advice given to fish consumers to reduce the amount of fish they eat based on chemical contamination should attempt to balance the health benefits with the health risks In general people should eat fish low in contaminants and high in omega-3 fatty acid Fish consumption advice should also take into account that eating alternative sources of protein also has risks For instance increasing the consumption rate of beef or pork at the expense of eating fish can increase the risk of heart disease In addition some contaminants that are common in fish such as dioxin might also be present in other meats
The level of contaminant exposure from fish consumption varies with the species of fish whole fish or fillet consumption rate and preparation and cooking process Exposure to contaminants in fish can be significantly reduced through simple preparation measures Simply removing the skin of the fish can reduce PCB exposure [16] Cooking fish using fillets instead of whole fish can reduce PCB levels by more than 20 In some cases PCBs were removed up to 50 through cooking [17 18]
Chemical Specific Toxicity
The following sections are general summaries of COC health effects The public health implications of exposure to these COCs from sediments and tissues are discussed later Copper will not be evaluated since Bent Nose clams are not usually targeted shellfish species for human consumption In addition DOH recommends only Dungeness and Red Rock crab from non-urban areas be consumed and do not eat the ldquocrab butterrdquo (hepatopancreas) and viscera
Arsenic
Arsenic is a naturally occurring element in the earths soil In Washington normal soil background concentrations rarely exceed 20 ppm [19] However the widespread use of arsenic-containing pesticides and the emissions from smelters has resulted in significantly higher levels of arsenic on many properties in the state There are two forms of arsenic - organic and inorganic The EPA-established reference dose (RfD) for arsenic is 00003 mgkgday based on skin color changes and excessive growth of tissue (human data) [20] EPA classifies the inorganic form of arsenic as a human carcinogen DOH will not be using the slope factor of 15 per mgkgday due to the arsenic weight of evidence approach The recent EPA IRIS review draft for the Science Advisory Board presented a slope factor for combined lung and bladder cancer of 57 per mgkgday [21] The slope factor calculated from the work by the National Research Council is about 21 per mgkgday [22] These slope factors could be higher if the combined risk for all arsenic-associated cancers (bladder lung skin kidney liver etc) were evaluated For this or any other health consultation DOH will use a slope factor of 57 per mgkgday which appears to reflect EPAs Review DRAFT assessment
Inorganic arsenic is much more harmful than organic arsenic therefore DOH based health evaluations on the levels of inorganic arsenic present in fish samples Generally inorganic arsenic in fish and shellfish ranged from about 1-20 of total arsenic [20 22 23 24] The US
17
HC-Fidalgo Bay
Food and Drug Administration (FDA) proposed 10 of total arsenic estimated as inorganic arsenic [24] Ecologyrsquos evaluation of shellfish in Puget Sound indicated that less than 1 of total arsenic found was in the inorganic form of arsenic [25] For this health consultation DOH assumed that 1 of the total arsenic detected was inorganic arsenic Therefore 1 of the concentration was used to calculate the estimated dose from exposure to inorganic arsenic in shellfish Similarly Ecologyrsquos evaluation of English Sole fish in Puget Sound indicated that less than 1 of the total arsenic found was in the inorganic form of arsenic [25] However since there was no inorganic arsenic data for Starry Flounder DOH assumed that 10 of the total arsenic detected in bottom fish was inorganic arsenic (see Uncertainty section)
Consuming seafood from Fidalgo Bay could result in an exposure dose of 135 times 10-5 mgkgday (see Appendix B Table B4) for the general public Similarly consuming seafood from Fidalgo Bay could result in exposure doses ranging from 364 times 10-4 to 629 times 10-5 mgkgday (see Appendix C Table C1 and Table C6) for a tribal population Health effects of skin cancer changes in the skin vascular disease and liver enlargement occurred in humans chronically exposed to 14 times 10-2 mgkgday of arsenic in drinking water [20] Therefore DOH does not expect that exposures to arsenic in fish shellfish and crabs will cause harmful non-cancer health effects for the general population The tribal exposure scenario resulted in doses that are slightly above the RfD In addition there is the assumption that all the seafood consumed by the tribal members is from Fidalgo Bay only However DOH does not expect that exposures to arsenic in fish shellfish and crabs will cause harmful non-cancer health effects for tribal consumption population
Cadmium
Cadmium is a naturally occurring element in the earths crust Cadmium is used mainly in batteries pigments metal coatings and metal alloys Cadmium is found in most foods at low levels with the lowest levels found in fruits and the highest found in leafy vegetables and potatoes Shellfish have higher cadmium levels (up to 1 ppm) than other types of fish or meat Cadmium is stored in the liver and kidneys and slowly leaves the body in the urine and feces [26] However high levels of cadmium will cause kidney damage and cause bones to become fragile and break easily Studies of workers exposed to airborne cadmium also suggest a link with prostate cancer The ability of cadmium to cause cancer via the oral route is disputed by many studies The RfD for cadmium that is ingested with food is 0001 mgkgday
Consuming seafood from Fidalgo Bay could result in an exposure dose of 394 times 10-5 mgkgday (see Appendix B Table B4) for the general public Similarly consuming seafood from Fidalgo Bay could result in exposure doses ranging from 30 times 10-3 to 480 times 10-4 mgkgday (see Appendix C Table C2 and Table C7) for a tribal population A NOAEL of 21 times 10-3 mgkgday was established for exposure to cadmium Therefore DOH does not expect that exposures to cadmium in crabs will cause harmful non-cancer health effects for the general population However DOH does expect that exposures to cadmium in crabs will cause harmful non-cancer health effects for tribal consumption population
Chromium
Chromium is a naturally occurring element in the earths soil Chromium is found in three main forms chromium 0 (metal) chromium III (trivalent chromium) and chromium VI (hexavalent
18
HC-Fidalgo Bay
chromium) Chromium metal is used for making steel Chromium III is an essential nutrient required by the body Chromium VI is more easily absorbed and harmful Ingesting large amounts of chromium VI can cause stomach ulcers kidney and liver damage and even death However some ingested chromium VI is converted to chromium III and most will exit the body in feces within a few days and never enter the bloodstream Only about 2 percent of ingested chromium passes through the walls of the intestine and enters the bloodstream [27 28 29] The EPA established RfD for chromium VI is 0003 mgkgday The chromium evaluated here represents total chromium as opposed to chromium VI Dose calculations however do not attempt to fractionate the chromium concentrations DOH is being very conservative in the evaluation of total chromium and considers all chromium to be chromium VI
Consuming seafood from Fidalgo Bay could result in an exposure dose of 151 times 10-4 mgkgday (see Appendix B Table B4) for the general public Similarly consuming seafood from Fidalgo Bay could result in exposure doses ranging from 116 times 10-2 to 184 times 10-3 mgkgday (see Appendix C Table C3 and Table C8) for a tribal population A NOAEL of 25 times 100 mgkgday was established for exposure to chromium (VI) The tribal exposure scenario resulted in doses that exceed the RfD but falls below the actual toxic effect levels However since DOH was very conservative in its evaluation and assumed all chromium in the seafood was chromium IV and 100 percent of the chromium was absorbed In addition there is the assumption that all the seafood consumed by the tribal members is from Fidalgo Bay only Therefore DOH does not expect that exposures to chromium in crabs will cause harmful non-cancer health effects for the general population and tribal consumption population
Dioxins and furans
Dioxins Furans and cPAHs TEQ concentrations
Although several dioxin and furan congeners were analyzed in tissue only a single value called a dioxin toxic equivalent (TEQ) is presented in this health consultation Each dioxinfuran or dioxin-like PCB congener is multiplied by a Toxic Equivalency Factor (TEF) to produce the dioxin TEQ The TEQs for each chemical are then summed to give the overall 2378shytetrachlorodibenzo-p-dioxin TEQ The TEQ approach is based on the premise that many dioxinsfurans and dioxin-like PCB congeners are structurally and toxicologically similar to 2378-tetrachlorodibenzo-p-dioxin TEFs are used to account for the different potency of dioxins and furans relative to 2378-tetrachlorodibenzo-p-dioxin and are available for ten chlorinated dibenzofurans and seven chlorinated dibenzodioxins using the World Health Organization (WHO) methodology [7] A similar TEQ approach is developed for each cPAH based on the relative potency to benzo(a)pyrene
Dioxins and furans (dioxins) consist of about 210 structural variations of dioxin congeners which differ by the number and location of chlorine atoms on the chemical structure The primary sources of dioxin releases to the environment are the combustion of fossil fuels and wood the incineration of municipal medical and hazardous waste and certain pulp and paper processes Dioxins also occur at very low levels from naturally occurring sources and can be found in food water air and cigarette smoke
19
HC-Fidalgo Bay
The most toxic of the dioxin congeners 2378-tetrachlorodibenzo-p-dioxin (TCDD) can cause chloracne (a condition of acne like lesions on the face and neck) Exposure to high levels of dioxins can cause liver damage developmental effects and impaired immune function [30] Long-term exposure to dioxins could increase the likelihood of developing cancer Studies in rats and mice exposed to TCDD resulted in thyroid and liver cancer [31] EPA considers TCDD to be a probable human carcinogen and developed a cancer slope factor of 15x 10
5
mgkgday [32 33]
Consuming seafood from Fidalgo Bay could result in an exposure dose of 196 times 10-11
mgkgday (see Appendix B Table B4) for the general public Similarly consuming seafood from Fidalgo Bay could result in exposure doses ranging from 609 times 10-10 to 101 times 10-10
mgkgday (see Appendix C Table C4 and Table C9) for a tribal population Health effects of altered social behavior have been observed in monkeys exposed to 12 times 10-7 mgkgday of dioxin [30] The tribal exposure scenario resulted in doses that are below the MRL of 1x 10
9
mgkgday Therefore DOH does not expect that exposures to dioxin in fish shellfish and crabs will cause harmful non-cancer health effects for the general population and tribal consumption population
Lead ndash Occurrence Health Concerns and Risks
Lead is a naturally occurring chemical element that is normally found in soil In Washington normal background concentrations rarely exceed 20 ppm [19] However the widespread use of certain products (such as leaded gasoline lead-containing pesticides and lead-based paint) and the emissions from certain industrial operations (such as smelters) has resulted in significantly higher levels of lead in many areas of the state
Elimination of lead in gasoline and solder used in food and beverage cans has greatly reduced exposure to lead Currently the main pathways of lead exposure in children are ingestion of paint chips contaminated soil and house dust and drinking water in homes with old plumbing
Children less than seven years old are particularly vulnerable to the effects of lead Compared to older children and adults they tend to ingest more dust and soil absorb significantly more of the lead they swallow and more of the lead they absorb can enter their developing brain Pregnant women and women of childbearing age should also be aware of lead in their environment because lead ingested by a mother can affect the unborn fetus
Health effects
Exposure to lead can be monitored by measuring the level of lead in the blood In general blood lead rises 3-7 gdl for every 1000 ppm increase in soil or dust concentration [34] For children the Centers for Disease Control and Prevention (CDC) has defined an elevated blood lead level (BLL) as greater than or equal to 10 micrograms of lead per deciliter of blood (gdl) [35] However there is growing evidence that damage to the central nervous system resulting in learning problems can occur at blood lead levels less than 10 gdl About 22 percent of children in the US have blood lead levels greater than 10 gdl
20
HC-Fidalgo Bay
Lead poisoning can affect almost every system of the body and often occurs with no obvious or distinctive symptoms Depending on the amount of exposure a child has lead can cause behavior and learning problems central nervous system damage kidney damage reduced growth hearing impairment and anemia [36]
In adults lead can cause health problems such as high blood pressure kidney damage nerve disorders memory and concentration problems difficulties during pregnancy digestive problems and pain in the muscles and joints [36] These have usually been associated with blood lead levels greater than 30 gdl
Because of chemical similarities to calcium lead can be stored in bone for many years Even after exposure to environmental lead has been reduced lead stored in bone can be released back into the blood where it can have harmful effects Normally this release occurs relatively slowly However certain conditions such as pregnancy lactation menopause and hyperthyroidism can cause more rapid release of the lead which could lead to a significant rise in blood lead level [37]
EPArsquos target cleanup goal is no more than 5 of the community with BLLs above 10 microgdL Consuming seafood from Fidalgo Bay could result in the estimated BLL for the general population 13 to 14 percent above 10 μgdL for a child and 15 to 19 percent above 10 μgdL for an adult with a 95th percentile fetus BLL range of 46 to 48 μgdL (see Appendix D Tables D1 and D6) Consumption of seafood at tribal scenario rates from Fidalgo Bay could result in the estimated BLL 125 to 3243 percent above 10 μgdL for a child and 19 to 304 percent above 10 μgdL for an adult with a 95th percentile fetus BLL range of 59 to 927 μgdL (see Appendix D Tables D3 D5 D8 and D10)
Mercury
Mercury exists in the environment in three forms elemental inorganic and organic Methylmercury is the form of organic mercury related to exposure in fish Methylmercury is formed from inorganic mercury in the environment by microorganisms in aquatic systems In the aquatic food chain methylmercury biomagnifies as it is passed from lower to higher trophic levels through consumption of prey organisms Fish at the top of the food chain can biomagnify methlymercury which represents a potential health concern for consumers of fish
Ingested methlymercury is readily absorbed and complexed with the cysteine amino acid and crosses the blood-brain barrier In Minamata Bay Japan mothers who were exposed to high amounts of mercury but were asymptomatic gave birth to severely affected infants Other epidemiologic studies have shown developmental effects in both animal and human studies are the primary concern about methylmercury exposure The EPA established RfD for mercury is 00001 mgkgday
Mercury evaluated here represents total mercury as opposed to methylmercury Dose calculations however do not attempt to fractionate the mercury concentrations because almost all of the total mercury found in fish is methylmercury
Consuming seafood from Fidalgo Bay could result in an exposure dose of 559 times 10-6 mgkgday (see Appendix B Table B4) for the general public Similarly consuming seafood from Fidalgo
21
HC-Fidalgo Bay
Bay could result in exposure doses ranging from 320 times 10-4 to 529 times 10-5 mgkgday (see Appendix C Table C5 and Table C10) for a tribal population ATSDR has derived a NOAEL of 13 times 10-3 mgkgday for mercury Therefore DOH does not expect that exposures to mercury in fish and crabs will cause harmful non-cancer health effects for the general population The tribal exposure scenario resulted in doses that slightly exceed the RfD but falls below the actual toxic effect levels In addition there is the assumption that all the seafood consumed by the tribal members is from Fidalgo Bay only Therefore DOH does not expect that exposures to mercury in fish and crabs will cause harmful non-cancer health effects for tribal consumption populations
Polycyclic Aromatic Hydrocarbons (PAHs)
Polycyclic aromatic hydrocarbons (PAHs) are generated by the incomplete combustion of organic matter including oil wood and coal They are found in materials such as creosote coal coal tar and used motor oil Based on structural similarities metabolism and toxicity PAHs are often grouped together when one is evaluating their potential for adverse health effects EPA has classified some PAHs ndash called cPAHs ndash as probable human carcinogens (Cancer Class B2) as a result of sufficient evidence of carcinogenicity in animals and inadequate evidence in humans [38]
Benzo(a)pyrene is the only cPAH for which EPA has derived a cancer slope factor The benzo(a)pyrene cancer slope factor was used as a surrogate to estimate the total cancer risk of cPAHs in sediment It should be noted benzo(a)pyrene is considered the most carcinogenic of the cPAHs The use of its cancer slope factor as a surrogate for total cPAH carcinogenicity may overestimate risk To address this issue DOH made an adjustment for each cPAH based on the relative potency to benzo(a)pyrene or TEQ [38]
Dietary sources make up a large percentage of PAH exposure in the US population Smoked or barbecued meats and fish contain relatively high levels of PAHs The majority of dietary exposure to PAHs for the average person comes from ingestion of vegetables and grains (cereals) [39]
Sediment ingestion from Fidalgo Bay could result in lifetime non cancer exposure doses of 360 times 10-7 mgkgday (see Appendix A Table A2) A LOAEL of 10 times 101 mgkgday was established for PAH Therefore DOH does not expect that exposures to PAHs in sediment will cause harmful non-cancer health effects
Evaluating non-cancer hazards
Exposure assumptions for estimating contaminant doses from sediment and tissue exposures are found in Appendices A and B Tables A1 and B1 In order to evaluate the potential for non-cancer adverse health effects that may result from exposure to contaminated media (ie air water soil and sediment) a dose is estimated for each COC These doses are calculated for situations (scenarios) in which a person might be exposed to the contaminated media The estimated dose for each contaminant under each scenario is then compared to EPArsquos oral reference dose (RfD) RfDs are doses below which non-cancer adverse health effects are not expected to occur (considered ldquosaferdquo doses) They are derived from toxic effect levels obtained from human population and laboratory animal studies These toxic effect levels can be either the
22
HC-Fidalgo Bay
lowest-observed adverse effect level (LOAEL) or a no-observed adverse effect level (NOAEL) In human or animal studies the LOAEL is the lowest dose at which an adverse health effect is seen while the NOAEL is the highest dose that does not result in any adverse health effects
Because of data uncertainty the toxic effect level is divided by ldquosafety factorsrdquo to produce the lower and more protective RfD If a dose exceeds the RfD this indicates only the potential for adverse health effects The magnitude of this potential can be inferred from the degree to which this value is exceeded If the estimated exposure dose is only slightly above the RfD then that dose will fall well below the observed toxic effect level The higher the estimated dose is above the RfD the closer it will be to the actual observed toxic effect level This comparison is called a hazard quotient (HQ) and is given by the equation below
HQ = Estimated Dose (mgkg-day) RfD (mgkg-day)
Estimated exposure doses exposure assumptions and hazard quotients are presented in Appendix A for cPAHs found in sediment Based on exposure estimates quantified in Appendix A the general population is not likely to experience adverse non-cancer health effects from exposure to chemical contaminants in Fidalgo Bay since the exposure dose did not exceed the RfD
Similarly estimated exposure doses exposure assumptions and hazard quotients are presented in Appendices B and C for contaminants found in tissue Based on exposure estimates quantified in Appendix B the general population is not likely to experience adverse non-cancer health effects from exposure to chemical contaminants in Fidalgo Bay However the tribal exposure scenario results in doses that exceed the RfD and in some cases these exposures fall below the actual toxic effect levels (see Appendix C)
Evaluating Exposure to Lead
The biokinetics of lead are different from most toxicants because it is stored in bones and remains in the body long after it is ingested Childrenrsquos exposure to lead is evaluated through the use of the Integrated Exposure Uptake Biokinetic Model for Lead in Children (IEUBK) developed by the EPA The IEUBK predicts blood lead levels in a distribution of exposed children based on the amount of lead that is in environmental media (eg fish) [40] It is important to note that the IEUBK model is not expected to accurately predict the blood lead level of a child (or a small group of children) at a specific point in time In part this is because a child (or group of children) may behave differently and therefore have different amounts of exposure to contaminated soil and dust than the average group of children used by the model to calculate blood lead levels For example the model does not take into account reductions in exposure that could result from community education programs Despite this limitation the IEUBK model is a useful tool to help prevent lead poisoning because of the information it can provide about the hazards of environmental lead exposure For children who are regularly exposed to lead-contaminated fish the IEUBK model can estimate the percentage of young children who are likely to have blood lead concentrations that exceed a level that may be associated with health problems (usually 10 gdl)
23
HC-Fidalgo Bay
Average fish lead concentrations and estimated blood lead levels
The IEUBK model was used to estimate the percentage of children that could have elevated blood lead levels if they frequently eat lead contaminated fish Default parameters are used for all model inputs unless stated [40] Exposure was based on a general population and a tribal scenario for children eating shellfish and bottom fish containing an average concentration of lead (see Appendix D)
The adult lead model was used to estimate the 95th percentile Fetal Blood Lead and the average blood lead levels of women who consume lead contaminated seafood Exposure was based on a general population and a tribal scenario for adults eating shellfish and bottom fish containing an average concentration of lead (see Appendix D)
Evaluating Cancer Risk
Some chemicals have the ability to cause cancer Theoretical cancer risk is estimated by calculating a dose similar to that described above and multiplying it by a cancer potency factor also known as the cancer slope factor Some cancer potency factors are derived from human population data Others are derived from laboratory animal studies involving doses much higher than are encountered in the environment Use of animal data requires extrapolation of the cancer potency obtained from these high dose studies down to real-world exposures This process involves much uncertainty
Current regulatory practice assumes there is no ldquosafe doserdquo of a carcinogen Any dose of a carcinogen will result in some additional cancer risk Theoretical cancer risk estimates are therefore not yesno answers but measures of chance (probability) Such measures however uncertain are useful in determining the magnitude of a cancer threat because any level of a carcinogenic contaminant carries an associated risk The validity of the ldquono safe doserdquo assumption for all cancer-causing chemicals is not clear Some evidence suggests that certain chemicals considered to be carcinogenic must exceed a threshold of tolerance before
Theoretical Cancer Riskinitiating cancer For such chemicals risk estimates are not appropriate Recent Theoretical cancer risk estimates do not reach
zero no matter how low the level of exposure guidelines on cancer risk from EPA reflect the to a carcinogen Terms used to describe this
potential that thresholds for some risk are defined below as the number of excess carcinogenesis exist However EPA still cancers expected in a lifetime assumes no threshold unless sufficient data Term of Excess Cancers indicate otherwise [41] moderate is approximately equal to 1 in 1000
low is approximately equal to 1 in 10000 very low is approximately equal to 1 in 100000
This document describes theoretical cancer slight is approximately equal to 1 in 1000000risk that is attributable to site-related insignificant is less than 1 in 1000000
contaminants in qualitative terms like low very low slight and no significant increase in theoretical cancer risk These terms can be better understood by considering the population size required for such an estimate to result in a single cancer case For example a low increase in cancer risk indicates an estimate in the range
24
HC-Fidalgo Bay
of one cancer case per ten thousand persons exposed over a lifetime A very low estimate might result in one cancer case per several tens of thousands exposed over a lifetime and a slight estimate would require an exposed population of several hundreds of thousands to result in a single case DOH considers theoretical cancer risk insignificant when the estimate results in less than one cancer per one million exposed over a lifetime The reader should note that these estimates are for excess cancers that might result in addition to those normally expected in an unexposed population
Cancer is a common illness and its occurrence in a population increases with the age of the population There are many different forms of cancer resulting from a variety of causes not all are fatal Approximately 14 to 13 of people living in the United States will develop cancer at some point in their lives [42]
Theoretical cancer risk estimates for exposure to cPAHs in sediments is considered insignificant (2 cancers estimated per 10000000 exposed) (see Appendix A Table A3) Although exposure to cPAHs may occur the magnitude is likely to be considerably less than the estimated minimum background exposure from sources in food water air sediment and soil Many areas of Fidalgo Bay are already under Ecology Agreed Orders The Orders require an RIFS be conducted to guide the selection of a cleanup remedy
Theoretical cancer risk estimates for exposure to seafood by the general population is very low (2 cancers estimated per 100000 exposed) (see Appendix B Tables B5) This estimate is within EPArsquos acceptable risk for fish consumption However this is based on bottom fish and shellfish data only Theoretical cancer risk estimates for exposure to seafood by Tribal consumers range from low to moderate (4 cancers estimated per 10000 exposed) and moderate to high (2 cancers estimated per 1000 exposed) (see Appendix C)
Multiple Chemical Exposures
A person can be exposed to more than one chemical through more than one pathway Exposure to a chemical through multiple pathways occurs if a contaminant is present in more than one medium (ie air soil surface water groundwater and sediment) For example the dose of a contaminant received from drinking water might be combined with the dose received from contact with the same contaminant in fish
For many chemicals much information is available on how the individual chemical produces effects However it is much more difficult to assess exposure to multiple chemicals Due to the large number of chemicals in the environment it is impossible to measure all of the possible interactions between these chemicals The potential exists for these chemicals to interact in the body and increase or decrease the potential for adverse health effects Individual cancer risk estimates can be added since they are measures of probability However when estimating non-cancer risk similarities must exist between the chemicals if the doses are to be added Groups of chemicals that have similar toxic effects can be added such as volatile organic compounds (VOCs) which cause liver toxicity Polycyclic aromatic hydrocarbons (PAHs) are another group of compounds that can be assessed as one combined dose based on similarities in chemical structure and metabolites
25
HC-Fidalgo Bay
The ATSDR Interaction Profile for persistent chemicals found in fish evaluates the possibility of interactive effects from exposure to a mixture of contaminants including mercury PCBs and dioxins [43]
Uncertainty
Assessment of risks attributable to environmental exposures is filled with many uncertainties Uncertainty with regard to the health assessment process refers to the lack of knowledge about factors such as chemical toxicity human variability human behavior patterns and chemical concentrations in the environment Uncertainty can be reduced through further study
The majority of uncertainty comes from our knowledge of chemical toxicity For most chemicals there is little knowledge of the actual health impacts that can occur in humans from environmental exposures unless epidemiological or clinical evidence exists As a result toxicological experiments are performed on animals These animals are exposed to chemicals at much higher levels than found in the environment The critical doses in animal studies are often extrapolated to real world exposures for use in human health risk assessments In order to be protective of human health uncertainty factors are used to lower that dose in consideration of variability in sensitivity between animals and humans and the variability within humans These uncertainty factors can account for a difference of two to three orders of magnitude when calculating risk Furthermore there are hundreds of chemicals for which little toxicological information is known in animals or humans These chemicals may in fact be toxic at some level but risks to humans cannot be quantified due to uncertainty
The majority of arsenic found in seafood is organic arsenic Inorganic arsenic in fish and shellfish ranged from about 1 to 20 of the total arsenic [20 22 23 24] Ecologyrsquos evaluation of shellfish and English sole in the Puget Sound indicated that less than 1 of the total arsenic found was in the inorganic form of arsenic [25] However since there was no arsenic speciation data for starry flounder DOH assumed that 10 of the total arsenic detected in bottom fish was inorganic arsenic Inorganic arsenic is much more harmful than organic arsenic therefore the arsenic evaluation may be overestimated
The amount of contaminated media (fish water air soil) that people eat drink inhale or absorb through their skin is another source of uncertainty Although recent work has improved our understanding of these exposure factors they are still a source of uncertainty In the case of Fidalgo Bay uncertainty exists with respect to how much fish people eat from Fidalgo Bay how often they are eating it what species they are eating how often children use public access areas and how much sediment or soil children may inadvertently eat Estimates are based on best available information or worst-case scenarios This evaluation is based on the assumption that 100 percent of the type of seafood (bottom fish and shellfish) harvested and consumed was from Fidalgo Bay
Another source of uncertainty is how seafood is actually prepared for consumption and laboratory testing (ie whole fish with guts versus gutless or fillets large clams with skin and gut ball) Bottom fish and clams may contain sediments in their digestive tracts that can affect the concentration of heavy metals during analysis Horse clams are a large clam and may show similar heavy metal patterns to geoduck clams where the skin and gut ball contain the major
26
HC-Fidalgo Bay
portion of heavy metals Bottom fish species should be analyzed without the gut and large clams should be analyzed without skin and without the gut for human health purposes
The amount and type of chemical in contaminated media is another source of uncertainty Environmental samples are very costly so it is not practical or efficient to analyze an adequate number of samples for every existing chemical Instead sampling usually focuses on contaminants that are thought to be present based on historic land use or knowledge of specific chemical spills
Fish Meal Limits
Several contaminants of concern are present in seafood from Fidalgo Bay Meal limits were calculated using the RfDMRL as the target risk value and the exposure parameters provided in Appendix E Table E1
Many factors must be considered when one is recommending limits on the consumption of seafood including the health benefits of eating fish the quality and comprehensiveness of environmental data and the availability of alternate sources of nutrition In addition these limits do not consider that multiple species are consumed a consideration that would require weighting the percent of each species consumed
Childrenrsquos Health Concerns
The potential for exposure and subsequent adverse health effects often increases for younger children compared with older children or adults ATSDR and DOH recognize that children are susceptible to developmental toxicity that can occur at levels much lower than those causing other types of toxicity The following factors contribute to this vulnerability
Children are more likely to play outdoors in contaminated areas by disregarding signs and wandering onto restricted locations
Children often bring food into contaminated areas resulting in hand-to-mouth activities Children are smaller and receive higher doses of contaminant exposures per body
weight Children are shorter than adults therefore they have a higher possibility of breathing in
dust and soil Fetal and child exposure to contaminants can cause permanent damage during critical
growth stages
These unique vulnerabilities of infants and children demand special attention in communities that have contaminated water food soil or air Childrenrsquos health was considered in the writing of this health consultation and the exposure scenarios treated children as the most sensitive population being exposed
27
HC-Fidalgo Bay
Conclusions
Based on the information provided DOH concludes the following
1 DOH concludes that consumption of seafood at tribal scenario rates is expected to harm children and adults health The Swinomish Samish Lummi and the Upper Skagit are tribes or nations that fish in this area or it is in their usual and accustomed fishing rights areas If any of the tribes or nations are using Fidalgo Bay for harvesting and is consuming at tribal scenario rates this would represent a ldquopublic health hazardrdquo The Swinomish Indian Tribal Community has stated ldquoFidalgo Bay historically an important harvest site is now impacted by contamination and thus not used for harvest in recent yearsrdquo [6] It may also be unlikely that 100 of a subsistence consumer (tribes or nations) would be consuming and harvesting from Fidalgo Bay only
2 DOH concludes that consuming bottom fish or shellfish from Fidalgo Bay is not expected to harm the general populationrsquos (children or adults) This area also falls under the Puget Sound Crab Advisory DOH recommends consuming only Dungeness and Red Rock crab from non-urban areas and that ldquocrab butterrdquo and viscera should not be eaten Based on contaminants of concern in bottom fish or shellfish calculated meal limits are 13 clams per month 14 crabs per month and 14 bottom fish per month (see Appendix E Tables E2 E3 and E4) Table E5 shows the adjustment of meal size based on the body weight of the consumer
3 DOH concludes that touching breathing or accidentally eating sediment one-day-pershyweek or 52 days per year from Fidalgo Bay is not expected to harm peoplersquos health The maximum level of carcinogenic polycyclic aromatic hydrocarbons (cPAHs) in this exposure scenario is below levels known to result in non-cancer harmful health effects In addition the exposure scenario does not present an elevated theoretical cancer risk
Recommendations
1 DOH recommends Ecology perform the necessary site remedial investigation and feasibility study (RIFS) as they work through the process of cleaning up Fidalgo Bay Proceeding with the planned cleanup will contribute to a significant reduction in human health risk
2 DOH recommends Ecology perform long-term monitoring of Fidalgo Bay DOH is available to review a monitoring plan and monitoring results
3 DOH recommends following the Puget Sound Recreational Marine Area 7 Fish Consumption Advisory and the Puget Sound crab consumption advisory that states
Eat no more than one meal per week for rockfish and Chinook salmon and no more than one meal per month for resident (blackmouth) Chinook salmon
28
HC-Fidalgo Bay
Eat Dungeness and Red Rock crab from non-urban areas and do not eat the ldquocrab butterrdquo (viscera) More information regarding these advisories is available at httpwwwdohwagovehpoehasfishrma7htm or by calling toll-free 1-877-485shy7316
4 DOH also recommends following the meal limits calculated in Appendix E Eat no more than 13 or 14 eight-ounce meals per month of clams crabs bottom fish (English sole and Starry Flounder) or any combination thereof
General Advice
DOH encourages all Washingtonians to eat at least two fish meals per week as part of a heart healthy diet in accordance with American Heart Association (AHA) recommendations People may eat fish more than two times weekly but such frequent consumers should take the following steps to reduce exposure to contaminants in the fish that they eat
bull Eat a variety of fish that are low in contaminants according to guidance provided on our website at httpwwwdohwagovfish
bull Follow fish advisory advice provided by DOH (website listed below) and local health agencies for water bodies where you fish httpwwwdohwagovehpoehasfishfishadvisorieshtm
bull Young children and small adults should eat proportionally smaller meal sizes bull Grill bake or broil fish so that fat drips off while cooking bull Eat fillets without the skin bull Mercury and other metals are stored in the fillet of the fish and will not be reduced by preparing fish this way
Public Health Action Plan
Actions Planned
1 DOH will coordinate with Ecology to provide an educational materials fact sheet
2 DOH will provide copies of this health consultation to Ecology and concerned parties
3 DOH will be available at Ecologyrsquos planned public meetings in the Fidalgo Bay community
29
HC-Fidalgo Bay
Author
Lenford OrsquoGarro Washington State Department of Health
Office of Environmental Health Assessments Site Assessment Section
Designated Reviewer Dan Alexanian Manager Site Assessment Section
Office of Environmental Health Assessments Washington State Department of Health
ATSDR Technical Project Officer Audra Henry
Cooperative Agreement and Program Evaluation Branch Division of Health Assessment and Consultation
Agency for Toxic Substances and Disease Registry
30
HC-Fidalgo Bay
References
1 SAIC 2007 Fidalgo Bay Sediment Investigation Anacortes WA Sediment Sampling and Analysis Plan Prepared for the Washington State Department of Ecology Prepared by Science Applications International Corporation (SAIC) Bothell WA September 17 2007
2 Fidalgo Bay Causeway feasibility study Request for funding from Department of Ecology Prepared by Samish Indian Nation May 4 2007 httpwwwsamishtribensnusdnrDOE2042007pdf
3 Washington State Department of Natural Resources Fidalgo Bay Environmental Aquatic Reserve management plan Skagit County Washington April 2008 Prepared by Aquatic resources program httpwwwdnrwagovPublicationsaqr_rsve_fid_mgmt_planpdf
4 SAIC 2008 Fidalgo Bay Sediment Investigation Anacortes WA Final Report Prepared for the Washington State Department of Ecology Prepared by Science Applications International Corporation (SAIC) Bothell WA March 31 2008
5 SAIC 2008 Fidalgo Bay Sediment Investigation Anacortes WA Archived Sediment and Tissue Analytical Results Data Report Addendum Prepared for the Washington State Department of Ecology Prepared by Science Applications International Corporation (SAIC) Bothell WA September 2008
6 Swinomish Water Resources Program December 1 2006 Bioaccumulative Toxics in Subsistence-Harvested Shellfish ndash Contaminant Results and Risk Assessment Swinomish Indian Tribal Community La Conner WA
7 Van den Berg M Birnbaum LS Denison M De Vito M Farland W Feeley M Fiedler H Hakansson H Hanberg A Haws L Rose M Safe S Schrenk D Tohyama C Tritscher A Tuomisto J Tysklind M Walker N amp Peterson RE (2006) The 2005 World Health Organization Reevaluation of Human and Mammalian Toxic Equivalency Factors for Dioxins and Dioxin-Like Compounds Toxicol Sci 93 223-241 Available at httptoxscioxfordjournalsorgcgicontentabstract932223
8 US Environmental Protection Agency Guidance for assessing chemical contaminant data for use in fish advisories volume 2 risk assessment and fish consumption limits third edition Office of Water Washington DC EPA 823-B-00-008 2000b
9 United States Environmental Protection Agency Framework for Selecting and Using Tribal Fish and Shellfish Consumption Rates for Risk-Based Decision Making at CERCLA and RCRA Cleanup Sites in Puget Sound and the Strait of Georgia August 2007
10 United States Environmental Protection Agency Estimated Per Capita Fish Consumption in the United States EPA 821-C-02-003 2002
31
HC-Fidalgo Bay
11 Toy KA Polissar NL Liao S and Mittelstaedt GD 1996 A fish consumption survey of the Tulalip and Squaxin Island tribes of the Puget Sound region Tulalip Tribes Department of Environment 7615 Totem Beach Road Marysville WA 98271
12 The Suquamish Tribe 2000 Fish Consumption Survey of the Suquamish Tribe of the Port Madison Indian Reservation Puget Sound Region The Suquamish Tribe 15838 Sandy Hook Road Post Office Box 498 Suquamish WA 98392
13 Alaska Division of Public Health The use of traditional foods in a healthy diet in Alaska risks in perspective 1999 Jan15
14 US Environmental Protection Agency and Toxicology Excellence for Risk Assessment August comparative dietary risks balancing the risks and benefits of fish consumption1999 Aug
15 American Heart Association An eating plan for healthy Americans Available at httpwwwamericanheartorgdietary guidelinesimagesEatPlan2000pdf
16 Hora ME Reduction of polychlorinated biphenyl (PCB) concentrations in carp (Cyprinus carpio) fillets through skin removal Bull Environ Contam Toxicol 1981 Mar 26 (3)364shy6
17 Wilson ND Shear NM Paustenbach DJ Price PS The effect of cooking practices on the concentration of DDT and PCB compounds in the edible tissue of fish J Exp Anal Environ Epidemiol 1998 Jul-Sep 8(3) 423-40
18 Zabik ME Zabik MJ Polychlorinated biphenyls polybrominated biphenyls and dioxin reduction during processingcooking food Adv Exp Med Biol1999459213-31
19 Toxics Cleanup Program Department of Ecology Natural background soil metals concentrations in Washington State Publication No 94-115Olympia Washington State Department of Ecology October 1994
20 Agency for Toxic Substances and Disease Registry (ATSDR) Toxicological profile for arsenic (update) PB2000108021 Atlanta GA US Department of Health and Human Services Public Health Service September 2005
21 US Environmental Protection Agency Toxicological Review of Inorganic Arsenic In support of summary information on the Integrated Risk Information System July 2005 httpwwwepagovwatersciencecriteriaarsenicsabAsDraft_SABpdf
22 NAS 2001b Arsenic in Drinking Water 2001 Update National Academy Press Washington DC 2001 Available at httpbooksnapedubooks0309076293htmlindexhtml
23 Francesconi KA and Edmonds JS 1997 Arsenic and marine organisms Advances in Inorganic Chemistry 44147-189
32
HC-Fidalgo Bay
24 US Food and Drug Administration (FDA) 1993 Guidance document for arsenic in shellfish Department of Health and Human Services Public Health Service Food and Drug Administration Center for Food Safety and Applied Nutrition Washington DC January 1993 Available at httpwwwfoodsafetygov~frfguid-ashtml
25 Washington State Department of Ecology Environmental Assessment Program Inorganic arsenic levels in Puget Sound fish and shellfish from 303(d) listed water bodies and other areas Prepared by Art Johnson and Morgan Roose Publication No 02-03-057 Olympia Washington State Department of Ecology December 2002
26 US Department of Health and Human Services Agency for Toxic Substances and Disease Registry Toxicological profile for Cadmium (update) PB99166621 Atlanta US Department of Health and Human Services July 1999
27 Anderson RA Polansky MM Bryden NA Patterson KY Veillon C Glinsmann WH 1983 Effects of chromium supplementation on urinary Cr excretion of human subjects and correlation of Cr excretion with selected clinical parameters J Nutr 113276ndash81 Cited in Agency for Toxic Substances and Disease Registry 2000 Toxicological profile for chromium Atlanta US Department of Health and Human Services September 2000 Available at httpwwwatsdrcdcgovtoxprofilestp7html
28 Anderson RA 1986 Chromium metabolism and its role in disease processes in man Clin Physiol Biochem 431ndash41 Cited in Agency for Toxic Substances and Disease Registry 2000 Toxicological profile for chromium Atlanta US Department of Health and Human Services September 2000 Available at httpwwwatsdrcdcgovtoxprofilestp7html
29 Donaldson RM Barreras RF 1966 Intestinal absorption of trace quantities of chromium J Lab Clin Med 68484ndash493 Cited in Agency for Toxic Substances and Disease Registry 2000 Toxicological profile for chromium Atlanta US Department of Health and Human Services September 2000 Available at httpwwwatsdrcdcgovtoxprofilestp7html
30 Agency for Toxic Substances and Disease Registry Toxicological profile for chlorinated dibenzo-p-dioxins (update) Draft for public comment Atlanta US Department of Health and Human Services 2000
31 National Toxicology Program Carcinogenesis bioassay of 2378- tetrachlorodibenzo-pshydioxin in Swiss-Webster mice (gavage study) Carcinogenesis Testing Program National Cancer Institute National Institute of Health National Toxicology Program Bethesda MD DHHS publication no 82-1765 1982
32 United States Environmental Protection Agency Health assessment document for polychlorinated dibenzo-p-dioxins Washington DC US Environmental Protection Agency Office of Health and Environmental Assessment EPA report no 6008-84014 1985
33
HC-Fidalgo Bay
33 United States Environmental Protection Agency Report on the peer review of the dioxin reassessment documents toxicity equivalency factors for dioxin and related compounds (Chapter 9) and integrated risk characterization document Alexandria VA National Center for Environmental Assessment 2000
34 Agency for Toxic Substances and Disease Registry (ATSDR) Analysis Paper Impact of Lead-Contaminated Soil on Public Health US Department of Health and Human Services Public Health Service Atlanta Georgia May 1992
35 CDC Preventing lead poisoning in young children a statement by the Centers for Disease Control October 1991 Atlanta Georgia US Department of Health and Human Services Public Health Service CDC 1991
36 US Department of Health and Human Services Agency for Toxic Substances and Disease Registry Toxicological profile for Lead (update) PB99166704 Atlanta US Department of Health and Human Services July 1999
37 Agency for Toxic Substances and Disease Registry (ATSDR) Lead Toxicity (Case studies in environmental medicine Course) SS3059 Atlanta US Department of Health and Human Services Public Health Service October 2000
38 US Department of Health and Human Services Agency for Toxic Substances and Disease Registry Toxicological Profile for Polycyclic Aromatic Hydrocarbons (PAHs) (update) PB95264370 Atlanta US Department of Health and Human Services August 1995
39 Phillips D H Polycyclic Aromatic Hydrocarbons in the diet Mutation Research 1999 (443) 139-147
40 US Environmental Protection Agency Technical Review Workgroup for Lead Userrsquos Guide for the Integrated Exposure Uptake Biokinetic Model for Lead in Children (IEUBK) Windows version 10 OSWER Directive No92857-42 Document No EPA 540-K-01-005 Washington DC May 2002
41 US Environmental Protection Agency Guidelines for Carcinogen Risk Assessment (Review Draft) NCEA-F-0644 July 1999 Available at httpwwwepagovNCEArafcancerhtm
42 ATSDR Agency for Toxic Substances and Disease Registry ATSDR Fact Sheet Cancer Updated August 30 2002 Atlanta US Department of Health and Human Services Available at httpwwwatsdrcdcgovCOMcancer-fshtml
43 Agency for Toxic Substances and Disease Registry (ATSDR) Interaction Profile for persistent chemicals found in fish US Department of Health and Human Services Public Health Service May 2004
34
HC-Fidalgo Bay
44 National Center for Environmental Assessment Exposure Factors Handbook Volume 1 ndash General Factors EPA600P-95002Fa US Environmental Protection Agency August 1997
35
HC-Fidalgo Bay
Figure 1 Demographic statistics within three miles of the site - Fidalgo Bay Skagit County
Total Population 11704 White 10818 Black 33 American Indian Eskimo Aleut 143 Asian or Pacific Islander 211 Other Race 176 Hispanic Origin 386 Children Aged 6 and Younger 943 Adults Aged 65 and Older 2310 Females Aged 15 - 44 2088 Total Aged over 18 8900 Total Aged under 18 2804 Total Housing Units 5295
Calculated using the area proportion technique Source 2000 US CENSUS
36
HC-Fidalgo Bay
Figure 2 Red box indicates the Fidalgo Bay site location Skagit County Washington
37
HC-Fidalgo Bay
Figure 3 Ecologyrsquos sediment and biota sample areas within Fidalgo Bay Skagit County Washington
38
HC-Fidalgo Bay
Appendix A This section provides calculated exposure doses and assumptions used for exposure to chemicals in sediments at the Fidalgo Bay site Three different exposure scenarios were developed to model exposures that might occur These scenarios were devised to represent exposures to a child (0-5 yrs) an older child and an adult The following exposure parameters and dose equations were used to estimate exposure doses from direct contact with chemicals in sediments
Exposure to chemicals in soil via ingestion inhalation and dermal absorption
Total dose (non-cancer) = Ingested dose + inhaled dose + dermally absorbed dose
Ingestion Route
Dose(non-cancer (mgkg-day) = C x CF x IR x EF x ED BW x ATnon-cancer
Cancer Risk = C x CF x IR x EF x CPF x ED BW x ATcancer
Dermal Route
Dermal Transfer (DT) = C x AF x ABS x AD x CF ORAF
Dose(non-cancer (mgkg-day) = DT x SA x EF x ED BW x ATnon-cancer
Cancer Risk = DT x SA x EF x CPF x ED BW x ATcancer
Inhalation Route
Dosenon-cancer (mgkg-day) = C x SMF x IHR x EF x ED x 1PEF BW x ATnon-cancer
Cancer Risk = C x SMF x IHR x EF x ED x CPF x 1PEF BW x ATcancer
39
HC-Fidalgo Bay
Table A1 Exposure assumptions used to estimate cPAHs doses from direct contact with sediments in Fidalgo Bay Anacortes WA
Parameter Value Unit Comments Concentration (C) Variable mgkg Maximum detected value
Conversion Factor (CF) 0000001 kgmg Converts contaminant concentration from milligrams (mg) to kilograms (kg)
Ingestion Rate (IR) ndash adult 100 mgday Exposure Factors Handbook [44] Ingestion Rate (IR) ndash older child 100
Ingestion Rate (IR) - child 200 Exposure Frequency (EF) 52 Daysyear One days a week
Exposure Duration (Ed) 30 (5 1015) years Number of years at one residence (child older child adult yrs)
Body Weight (BW) - adult 72 kg
Adult mean body weight Body Weight (BW) ndash older child 41 Older child mean body weight Body Weight (BW) - child 15 0-5 year-old child average body weight Surface area (SA) - adult 5700
cm2 Exposure Factors Handbook Surface area (SA) ndash older child 2900 Surface area (SA) - child 2900 Averaging Timenon-cancer (AT) 1825 days 5 years Averaging Timecancer (AT) 27375 days 75 years Cancer Potency Factor (CPF) 73 mgkg-day-1 Source EPA 24 hr absorption factor (ABS) 013 unitless Source EPA (Chemical Specific) PAH Oral route adjustment factor (ORAF) 1 unitless Non-cancer (nc) cancer (c) - default Adherence duration (AD) 1 days Source EPA
Adherence factor (AF) 02
mgcm2 Child older child 007 Adult
Inhalation rate (IHR) - adult 152 m3day Exposure Factors Handbook [44] Inhalation rate (IHR) ndash older child 14
Inhalation rate (IHR) - child 83 Soil matrix factor (SMF) 1 unitless Non-cancer (nc) cancer (c) - default Particulate emission factor (PEF) 145E+7 m3kg Model Parameters
40
HC-Fidalgo Bay
Fidalgo Bay Sediment Exposure Route ndash Non-cancer
Table A2 Non-cancer hazard calculations resulting from exposure to cPAHs in sediments from Fidalgo Bay Anacortes WA
Contaminant
TEQ Concentra
tion (ppm)
(mgkg)
Scenarios
Estimated Dose (mgkgday)
Total Dose LOAEL
(mgkgday)
Total Dose LOAELIncidental
Ingestion of Soil
Dermal Contact
with Soil
Inhalation of Particulates
Child 194E-7 730E-8 134E-11 267E-7 000000003
cPAH 0102 Older Child 354E-8 267E-8 828E-12 622E-8 10E+1 0000000006
Adult 202E-8 105E-8 512E-12 307E-8 0000000003
Fidalgo Bay Sediment Exposure Route ndash Cancer
Table A3 Cancer hazard calculations resulting from exposure to cPAHs sediments from Fidalgo Bay Anacortes WA
Contaminant Concentra tion (ppm)
EPA cancer Group
Cancer Potency Factor
(mgkg-day-1)
Scenarios
Increased Cancer Risk Total
Cancer RiskIncidental
Ingestion of Soil
Dermal Contact
with Soil
Inhalation of Particulates
Child 943E-8 355E-8 653E-12 130E-7
Total cPAH TEQ 0102 B2 73 Older Child 345E-8 260E-8 806E-12 605E-8
Adult 295E-8 153E-8 747E-12 448E-8
Lifetime cancer risk 130E-7 + 605E-8 + 448E-8 = 235E-7
41
HC-Fidalgo Bay
Appendix B
This section provides calculated exposure doses and exposure assumptions used for chemicals in bottom fish shellfish and crab samples taken from Fidalgo Bay These exposure scenarios were developed to model exposures that might occur and were devised to represent exposures to the general population The following exposure parameters and dose equations were used to estimate exposure doses from ingestion of contaminants in bottom fish and shellfish
Ingestion Route
Dose(non-cancer (mgkg-day) = C x CF1 x IR x CF2 x EF x ED BW x ATnon-cancer
Cancer Risk = C x CF1 x IR x CF2 x EF x CPF x ED BW x ATcancer
Table B1 Exposure assumptions used in exposure evaluation of contaminants in bottom fish shellfish and crab samples taken from Fidalgo Bay in Anacortes Washington
Parameter Value Unit Comments Concentration (C) Variable ugkg Average detected value
Conversion Factor (CF1) 0001 mgkg Converts contaminant concentration from milligrams (mg) to kilograms (kg)
Conversion Factor (CF2) 0001 kgg Converts mass of shellfish from grams (g) to kilograms (kg)
Ingestion Rate (IR) 057
gday
Body weight-adjusted shellfish consumption rates to account for children eating nearly 16 times as much fish per body weight as do adults (see table B2)
Ingestion Rate (IR) 028 Average general population child ndash bottom fish (see table B3)
Ingestion Rate (IR) 081 Body weight-adjusted shellfish consumption rates to account for an older child eating 081 times as much fish per body weight as do adults (see table B2)
Ingestion Rate (IR) 036 Average general population older child ndash bottom fish (see table B3)
Ingestion Rate (IR) 17 Average general population adult - shellfish
Ingestion Rate (IR) 07 Average general population adult ndash bottom fish (see table B3)
Exposure Frequency (EF) 365 Daysyear Assumes daily exposure
Exposure Duration (ED) 6 years
Number of years at one residence (child) Exposure Duration (ED) 30 Number of years at one residence (adult) Body weight (BW) 15
kg Mean body weight child
Body weight (BW) 70 Mean body weight adult Averaging Timenon-cancer (AT) Variable days Equal to Exposure Duration Averaging Timecancer (AT) 25550 days 70 years Cancer Potency Factor (CPF) Variable mgkg-day-1 Source EPA ndash Chemical specific
42
HC-Fidalgo Bay
Table B2 Derivation of a childrsquos shellfish consumption rate for the general US population
Row Parameter Adult Older Child (6-17 yrs)
Child (0-6 yrs)
1 Reported All Fish Consumption Rate-gram fish per kg bodyweight per day (gkgday)
0277 0225 0433
2 Ratio to Adult All Fish Consumption Rate
1 081 16
3 Reported Shellfish Consumption (gday)
170 (average) Not Reported Not Reported
4 Average Body Weight (kg) 70 41 15 5 Ratio to Adult BW 1 059 021 6 Adjusted Shellfish Consumption Rates
(gday) = Row 2 x Row 3 x Row 5
170 (average) 081 (average) 057 (average)
Table B3 Derivation of bottom consumption rate for the general US population based on four percent of total fish intake
Row Parameter Adult Older Child (6-17 yrs)
Child (0-6 yrs)
1 Reported All Fish Consumption Rateshy(gday)
175 90 70
2 Assume bottom fish intake rate similar to tribal at about 4 percent [15]
004 004 004
3 Adjusted bottom fish rates (gday) = Row 1 x Row 2
070 036 028
43
HC-Fidalgo Bay
Table B4 Exposure dose and non-cancer risk from ingesting seafood at the average concentrations of contaminants in bottom fish clams and crab samples taken from Fidalgo Bay in Anacortes Washington
Species Contaminant Average Concentration
(ppm)
Estimated Dose (mgkgday)
General population Average
MRL or RfD (mgkgday)
Hazard quotient
General population Average
Clams
Arsenic
0027 Child 103E-6
300E-4
0003 Older child 533E-7 0002
Adult 656E-7 0002
Crabs 0071 Child 270E-6 0009
Older child 140E-6 0005 Adult 172E-6 0006
Bottom Fish 015 Child 260E-6 0009
Older child 132E-6 0004 Adult 150E-6 0005
Crabs Cadmium 048 Child 182E-5
100E-3 0018
Older child 948E-6 0009 Adult 117E-5 0012
Clams Chromium 184 Child 699E-5
300E-3 0023
Older child 364E-5 0012 Adult 447E-5 0015
Clams
Dioxin
799E-8 Child 304E-12
10E-9
0003 Older child 158E-12 00016
Adult 194E-12 00019
Crabs 975E-8 Child 371E-12 00037
Older child 193E-12 00019 Adult 237E-12 00024
Bottom Fish 134E-7 Child 250E-12 0003
Older child 118E-12 00012 Adult 134E-12 00013
Crabs
Mercury
0049 Child 186E-6
100E-4
0019 Older child 968E-7 00097
Adult 119E-6 0012
Bottom Fish 0042 Child 784E-7 0008
Older child 369E-7 00037 Adult 420E-7 00042
PPM ndash parts per million
44
HC-Fidalgo Bay
Table B5 Cancer risk from ingesting seafood at the average concentrations of contaminants in bottom fish clams and crab samples taken from Fidalgo Bay in Anacortes Washington
Species Contaminant Average Concentration
(ppm)
Cancer Potency Factor
(mgkg-day-1)
Increased Cancer Risk
General population Average
Total Cancer Risk General population
Average
Clams
Arsenic
0027
57
Child 501E-7
153E-5
Older child 434E-7 Adult 160E-6
Crabs 0071 Child 132E-6
Older child 114E-6 Adult 421E-6
Bottom Fish 015 Child 137E-6
Older child 107E-6 Adult 366E-6
Clams
Dioxin
799E-8
15E+5
Child 390E-8
582E-7
Older child 338E-8 Adult 125E-7
Crabs 975E-8 Child 476E-8
Older child 413E-8 Adult 152E-7
Bottom Fish 134E-7 Child 322E-8
Older child 252E-8 Adult 861E-8
Sum of cancer risk 159E-5
45
HC-Fidalgo Bay
Appendix C This section provides calculated exposure doses and assumptions used for exposure to chemicals in seafood at the Fidalgo Bay site using Tulalip Tribe consumption rates It is based on the EPA Tribal framework for fish and shellfish consumption rates for risk-based decisions
Intake of contaminant in mgkg-day (IR ) = (CF x CR x x UCF ) BW c i PS i 1
[Equation 1] Where IR = Intake rate of contaminant by category of fishshellfish
c
CF = contaminant concentration (mgkg) in the tissue of the particular fish or shellfish category i
CR = the total consumption rate of fish and shellfish harvested from Puget Sound 194 grams per PS
day = the percentage of the ingestion rate that consists of the category of fish or shellfish unitless
i
BW = body weight 818 kilograms observed from the Tulalip Tribesrsquo study UCF = conversion factor 1 0001 kilograms per gram
1
Estimated cancer risk (ECR) = (IR x ED x EF x CSF) (AT x UCF ) [Equation 2] total 2
Where IR = Total intake of contaminant from site-related fish and shellfish consumption
total
ED = exposure duration 70 years EF = exposure frequency 365 days per year CSF = oral cancer slope factor for contaminant AT = averaging time 70 years for carcinogens UCF = conversion factor 2 (365 daysyear)
2
Estimated hazard index (EHI) = (IR x ED x EF x UCF ) (RfD x AT) [Equation 3] total 2
Where IR = Total intake of contaminant from site-related fish and shellfish consumption
total
ED = exposure duration 70 years EF = exposure frequency 365 days per year RfD = Oral reference dose for contaminant AT = averaging time the same as exposure duration for non-carcinogenic effects UCF = conversion factor 2 (1 yr365 days)
2
46
HC-Fidalgo Bay
Table C1 Fidalgo Bay arsenic intake rate based on the Tulalip Tribe seafood consumption rate Anacortes Washington
Overall FishShellfish Consumption Rate gday
Category Percent of Consumption Rate Represented by Category
Site-related concentration of arsenic mgkg in tissue
Category Specific Exposure mgkg-day
194 Salmon 497 0 0 194 Pelagic Fish 42 0 0 194 Bottom Fish 39 015 00000139 194 Shellfish 422 0049 00000490 Sum IRtotal 00000629 Crabs tissues and clams average
Arsenic Estimated hazard index = 021
Arsenic Estimated cancer risk = 21E-3
Table C2 Fidalgo Bay cadmium intake rate based on the Tulalip Tribe seafood consumption rate Anacortes Washington
Overall FishShellfish Consumption Rate gday
Category Percent of Consumption Rate Represented by Category
Site-related concentration of cadmium mgkg in tissue
Category Specific Exposure mgkg-day
194 Salmon 497 0 0 194 Pelagic Fish 42 0 0 194 Bottom Fish 39 0 0 194 Shellfish 422 048 000048 Sum IRtotal 000048 Crabs tissues only average
Cadmium Estimated hazard index = 03
47
HC-Fidalgo Bay
Table C3 Fidalgo Bay chromium intake rate based on Tulalip Tribe seafood consumption rate Anacortes Washington
Overall FishShellfish Consumption Rate gday
Category Percent of Consumption Rate Represented by Category
Site-related concentration of chromium mgkg in tissue
Category Specific Exposure mgkg-day
194 Salmon 497 0 0 194 Pelagic Fish 42 0 0 194 Bottom Fish 39 0 0 194 Shellfish 422 184 000184 Sum IRtotal 000184 Clams tissues only average
Chromium Estimated hazard index = 061
Table C4 Fidalgo Bay dioxin intake rate based on the Tulalip Tribe seafood consumption rate Anacortes Washington
Overall FishShellfish Consumption Rate gday
Category Percent of Consumption Rate Represented by Category
Site-related concentration of dioxin mgkg in tissue
Category Specific Exposure mgkg-day
194 Salmon 497 0 0 194 Pelagic Fish 42 0 0 194 Bottom Fish 39 134E-7 124E-11 194 Shellfish 422 887E-8 888E-11 Sum IRtotal 101E-10 Crabs tissues and clams average
Dioxin Estimated hazard index = 010
Dioxin Estimated cancer risk = 152E-5
48
HC-Fidalgo Bay
Table C5 Fidalgo Bay mercury intake rate based on the Tulalip Tribe seafood consumption rate Anacortes Washington
Overall FishShellfish Consumption Rate gday
Category Percent of Consumption Rate Represented by Category
Site-related concentration of mercury mgkg in tissue
Category Specific Exposure mgkg-day
194 Salmon 497 0 0 194 Pelagic Fish 42 0 0 194 Bottom Fish 39 0042 000000388 194 Shellfish 422 0049 0000049 Sum IRtotal 00000529 Crabs tissues only average
Mercury Estimated hazard index = 053
49
HC-Fidalgo Bay
This section provides calculated exposure doses and assumptions used for exposure to chemicals in seafood at Fidalgo Bay using Suquamish Tribe consumption rates It is based on the EPA Tribal framework for fish and shellfish consumption rates for risk-based decisions
Intake of contaminant in mgkg-day (IR ) = (CF x CR x x UCF ) BW c i PS i 1
[Equation 1] Where IR = Intake rate of contaminant by category of fishshellfish
c
CF = contaminant concentration (mgkg) in the tissue of the particular fish or shellfish category i
CR = the total consumption rate of fish and shellfish harvested from Puget Sound 7668 grams per PS
day = the percentage of the ingestion rate that consists of the category of fish or shellfish unitless
i
BW = body weight 79 kilograms observed from the Suquamish Tribesrsquo study UCF = conversion factor 1 0001 kilograms per gram
1
Estimated cancer risk (ECR) = (IR x ED x EF x CSF) (AT x UCF ) [Equation 2] total 2
Where IR = Total intake of contaminant from site-related fish and shellfish consumption
total
ED = exposure duration 70 years EF = exposure frequency 365 days per year CSF = oral cancer slope factor for contaminant AT = averaging time 70 years for carcinogens UCF = conversion factor 2 (365 daysyear)
2
Estimated hazard index (EHI) = (IR x ED x EF x UCF ) (RfD x AT) [Equation 3] total 2
Where IR = Total intake of contaminant from site-related fish and shellfish consumption
total
ED = exposure duration 70 years EF = exposure frequency 365 days per year RfD = Oral reference dose for contaminant AT = averaging time the same as exposure duration for non-carcinogenic effects UCF = conversion factor 2 (1 yr365 days)
2
50
HC-Fidalgo Bay
Table C6 Fidalgo Bay arsenic intake rate based on Suquamish Tribe seafood consumption rate Anacortes Washington
Overall FishShellfish Consumption Rate gday
Category Percent of Consumption Rate Represented by Category
Site-related concentration of arsenic mgkg in tissue
Category Specific Exposure mgkg-day
7668 Salmon 239 0 0 7668 Pelagic Fish 73 0 0 7668 Bottom Fish 38 015 00000553 7668 Shellfish 65 0049 0000309 Sum IRtotal 0000364 Crabs tissues and clams average
Arsenic Estimated hazard index = 12
Arsenic Estimated cancer risk = 359E-4
Table C7 Fidalgo Bay cadmium intake rate based on Suquamish Tribe seafood consumption rate Anacortes Washington
Overall FishShellfish Consumption Rate gday
Category Percent of Consumption Rate Represented by Category
Site-related concentration of cadmium mgkg in tissue
Category Specific Exposure mgkg-day
7668 Salmon 239 0 0 7668 Pelagic Fish 73 0 0 7668 Bottom Fish 38 0 0 7668 Shellfish 65 048 0003 Sum IRtotal 0003 Crabs tissues only average
Cadmium Estimated hazard index = 3
51
HC-Fidalgo Bay
Table C8 Fidalgo Bay chromium intake rate based on Suquamish Tribe seafood consumption rate Anacortes Washington
Overall FishShellfish Consumption Rate gday
Category Percent of Consumption Rate Represented by Category
Site-related concentration of chromium mgkg in tissue
Category Specific Exposure mgkg-day
7668 Salmon 239 0 0 7668 Pelagic Fish 73 0 0 7668 Bottom Fish 38 0 0 7668 Shellfish 65 184 00116 Sum IRtotal 00116 Clams tissues only average
Chromium Estimated hazard index = 387
Table C9 Fidalgo Bay dioxin intake rate based on Suquamish Tribe seafood consumption rate Anacortes Washington
Overall FishShellfish Consumption Rate gday
Category Percent of Consumption Rate Represented by Category
Site-related concentration of dioxin mgkg in tissue
Category Specific Exposure mgkg-day
7668 Salmon 239 0 0 7668 Pelagic Fish 73 0 0 7668 Bottom Fish 38 134E-7 494E-11 7668 Shellfish 65 887E-8 56E-10 Sum IRtotal 609E-10 Crabs tissues and clams average
Dioxin Estimated hazard index = 061 Dioxin Estimated cancer risk = 914E-5
52
HC-Fidalgo Bay
Table C10 Fidalgo Bay mercury intake rate based on Suquamish Tribe seafood consumption rate Anacortes Washington
Overall FishShellfish Consumption Rate gday
Category Percent of Consumption Rate Represented by Category
Site-related concentration of mercury mgkg in tissue
Category Specific Exposure mgkg-day
7668 Salmon 239 0 0 7668 Pelagic Fish 73 0 0 7668 Bottom Fish 38 0042 00000155 7668 Shellfish 65 0049 0000309 Sum IRtotal 000032 Crabs tissues only average
Mercury Estimated hazard index = 32
53
HC-Fidalgo Bay
Appendix D
Lead exposure shellfish ingestion scenario used in the IEUBK model
This section provides inputs for the IEUBK model The following inputs to the model were used to account for the average shellfish ingestion lead exposure from Fidalgo Bay Anacortes Washington
Consumption rates shellfish general population child ndash 057 gday bottom fish general population child ndash 028 gday
The IEUBK model assumes that a childrsquos total meat intake is 935 gday EPArsquos target cleanup goal is no more than 5 of the community with BLLs above 10 microgdL Default assumptions were used unless noted
Table D1 Blood lead values determined using the IEUBK model for lead in seafood from Fidalgo Bay Anacortes Washington
Seafood Average
Concentration (ppm)
Percent meat intake as shellfish
()
Blood Lead level in percent above 10 ugdl Age range 0 - 84 months
Shellfish 121 061 14
Bottom fish
129 030 13
Average Blood Lead level in percent above 10ugdl Age range 0 - 84 months
135
PPM ndash parts per million Crabs tissues and clams average
54
HC-Fidalgo Bay
The IEUBK model assumes that a childrsquos total meat intake is 935 gday EPArsquos target cleanup goal is no more than 5 of the community with BLLs above 10 microgdL Default assumptions were used unless noted
Percent of consumption rates represented by category were obtained by using the mean because the 90th percentile did not add up to the total intake of seafood However the overall consumption rate was based on the 90th percentile consumers only
Consumption rates Tulalip Tribe child ndash shellfish (58 gday) and bottom fish (014 gday)
Table D2 Fidalgo Bay lead intake rate based on Tulalip Tribe child seafood consumption rate Anacortes Washington
Overall FishShellfish Consumption Rate gday
Category Percent of Consumption
Rate Represented by
Category
Site-related Consumption Rate gday
1107 Salmon 284 0 1107 Pelagic Fish 18 0 1107 Bottom Fish 13 014 1107 Shellfish 523 58
Crabs tissues and clams average
Table D3 Blood lead values determine using the IEUBK model for lead in seafood from Fidalgo Bay Anacortes Washington
Seafood Average
Concentration (ppm)
Percent meat intake as shellfish
()
Blood Lead level in percent above 10ugdl Age range 0 - 84 months
Shellfish 121 62 426
Bottom fish 129 015 125 Average Blood Lead level in percent above 10ugdl Age range 0 - 84 months
276
PPM ndash parts per million Crabs tissues and clams average
55
HC-Fidalgo Bay
The IEUBK model assumes that a childrsquos total meat intake is 935 gday EPArsquos target cleanup goal is no more than 5 of the community with BLLs above 10 microgdL Default assumptions were used unless noted
Percent of consumption rates represented by category were obtained by using the mean because the 90th percentile did not add up to the total intake of seafood However the overall consumption rate was based on the 90th percentile consumers only
Consumption rates Suquamish Tribe child ndash shellfish 2926 gday and bottom fish 108 gday
Table D4 Fidalgo Bay lead intake rate based on Suquamish Tribe child seafood consumption rate Anacortes Washington
Overall FishShellfish Consumption Rate gday
Category Percent of Consumption
Rate Represented by
Category
Site-related Consumption Rate gday
5398 Salmon 183 0 5398 Pelagic Fish 91 0 5398 Other 162 0 5398 Bottom Fish 2 108 5398 Shellfish 542 2926
Crabs tissues and clams average
Table D5 Blood lead values determine using the IEUBK model for lead in seafood from Fidalgo Bay Anacortes Washington
Seafood Average
Concentration (ppm)
Percent meat intake as shellfish
()
Blood Lead level in percent above 10ugdl Age range 0 - 84 months
Shellfish 121 3129 3243
Bottom fish 129 116 163 Average Blood Lead level in percent above 10ugdl Age range 0 - 84 months
1703
PPM ndash parts per million Crabs tissues and clams average
56
HC-Fidalgo Bay
Lead exposure shellfish ingestion scenario used in the Adult lead model
This section provides inputs for the Adult lead model EPArsquos target cleanup goal is no more than 5 of the community with BLLs above 10 microgdL Default assumptions were used unless noted
Table D6 Blood lead values determined using the Adult lead model for lead in seafood from Fidalgo Bay Anacortes Washington
Seafood Average
Concentration (ppm)
Motherrsquos blood lead concentration in ugdl
95th percentile fetal blood lead in ugdl
Shellfish 121 mother 19
fetus 48
Bottom fish 129
mother 15
fetus 46
Average motherrsquos blood lead concentration in ugdl
19
Average 95th percentile fetal blood lead in ugdl
47
PPM ndash parts per million Crabs tissues and clams average
57
HC-Fidalgo Bay
Table D7 Fidalgo Bay lead intake rate based on Tulalip Tribe adult seafood consumption rate Anacortes Washington
Overall FishShellfish Consumption Rate gday
Category Percent of Consumption
Rate Represented by
Category
Site-related Consumption Rate gday
194 Salmon 497 0 194 Pelagic Fish 42 0 194 Bottom Fish 39 757 194 Shellfish 422 8187
Crabs tissues and clams average
Table D8 Blood lead values determined using the Adult lead model for lead in seafood from Fidalgo Bay Anacortes Washington
Seafood Average
Concentration (ppm)
Motherrsquos blood lead concentration in ugdl
95th percentile fetal blood lead in ugdl
Shellfish 121 mother 62
fetus 190
Bottom fish
129 mother 19
fetus 59
Average motherrsquos blood lead concentration in ugdl
41
Average 95th percentile fetal blood lead in ugdl
125
PPM ndash parts per million Crabs tissues and clams average
58
HC-Fidalgo Bay
Table D9 Fidalgo Bay lead intake rate based on the Suquamish Tribe Adult seafood consumption rate Anacortes Washington
Overall FishShellfish Consumption Rate gday
Category Percent of Consumption
Rate Represented by
Category
Site-related Consumption Rate gday
7668 Salmon 239 0 7668 Pelagic Fish 73 0 7668 Bottom Fish 38 2914 7668 Shellfish 65 49842
Crabs tissues and clams average
Table D10 Blood lead values determined using the Adult lead model for lead in seafood from Fidalgo Bay Anacortes Washington
Seafood Average
Concentration (ppm)
Motherrsquos blood lead concentration in ugdl
95th percentile fetal blood lead in ugdl
Shellfish 121 mother 304
fetus 927
Bottom fish 129
mother 33
fetus 100
Average motherrsquos blood lead concentration in ugdl
169
Average 95th percentile fetal blood lead in ugdl
514
PPM ndash parts per million Crabs tissues and clams average
59
HC-Fidalgo Bay
Appendix E
Meal Limit Calculations for contaminants of concern (non-carcinogenic health effects)
Meal limits were calculated for clams crabs and bottom fish based on contaminants of concern in each species Additionally meal limits were calculated based on developmental and immunologic endpoints for dioxin and mercury Meal limits were calculated using the equation below in conjunction with the MRL or RfD as the target risk value and the exposure parameters provided in the Table E1 below The developmental and immunologic endpoints are based on the additive effects of dioxin and mercury as recommended in the ATSDR interaction profile for toxic contaminants found in fish Tables E2 E3 and E4 provides meal limits that would be protective of women and children who eat clams crabs and bottomfish from Fidalgo Bay based on contaminants of concern in each species
ML = [(RfD or MRL)BW DM]C MS ML = recommended fish meal limit per month (mealmonth) RfD = reference dose (EPA) MRL = minimal risk level (ATSDR)
Many factors must be considered when one is recommending limits on the consumption of fish including the health benefits of eating fish the quality and comprehensiveness of environmental data and the availability of alternate sources of nutrition In addition these limits do not consider that multiple species are consumed a consideration that would require weighting of the percent of each species consumed These allowable ingestion rates also do not consider the fact that cooking reduces exposure to some contaminants in fish Therefore allowable consumption limits for prepared fish would be greater than those shown in tables E2 E3 and E4
Table E1 Exposure parameters used to calculate recommended meal limits for clams crabs and bottom fish from Fidalgo Bay in Anacortes Washington
Exposure Parameter RfD Endpoint Units MRL Developmental
RfDMRL Immunological RfDMRL
Average Concentration (C) variable ugkg Arsenic 03
ugkgday Cadmium 1 Chromium 3 Dioxin 0000001 0000001 000002 Mercury 01 01 03 Days per month (DM) 304 304 304 daysmonth Mean Body Weight (BW) 60 60 60 kg Meal size (MS) 0227 0227 0227 kg
60
HC-Fidalgo Bay
Table E2 Calculated meal limits per month for clams from Fidalgo Bay in Anacortes Washington
Contamination Concentration (ppm)
Meals based on RfD MRL
Lowest meals per month (rounded to single digit)
Arsenic 0027 893 13Chromium 184 131
Dioxin 799E-8 1006
Table E3 Calculated meal limits per month for Crabs from Fidalgo Bay in Anacortes Washington
Contamination Concentration (ppm)
Meals based on RfD MRL
Meals based on Developmental additive endpoint
Meals based on Immune additive endpoint
Lowest meals per month (rounded to single digit)
Arsenic 0071 339 14Cadmium 048 167
Dioxin 975E-8 824 137 478 Mercury 0049 164
Table E4 Calculated meal limits per month for Bottom Fish from Fidalgo Bay in Anacortes Washington
Contamination Concentration (ppm)
Meals based on RfD MRL
Meals based on Developmental additive endpoint
Meals based on Immune additive endpoint
Lowest meals per month (rounded to single digit)
Arsenic 015 161 14Dioxin 134E-7 600 145 548
Mercury 0042 191
Applying the Table E2 E3 and E4 meal limits across the general population assumes that meal size will decrease or increase proportionately with body weight Such an assumption could result in underestimating exposure for consumers who eat proportionately more fish per unit of body weight Table E5 demonstrates how an eight-ounce meal for a 70-kilogram adult would change to remain proportional with body weight
61
HC-Fidalgo Bay
Table E5 Adjustment of fish meal size based on the body weight of the consumer
Body Weight Meal Size Pounds Kilograms Ounces Grams
19 9 1 28 39 18 2 57 58 26 3 85 77 35 4 113 96 44 5 142 116 53 6 170 135 61 7 199 154 70 8 227 173 79 9 255 193 88 10 284 212 96 11 312 231 105 12 340 250 113 13 369 270 123 14 397 289 131 15 425 308 140 16 454
62

HC-Fidalgo Bay
Table 1 Maximum concentrations of contaminants detected in sediment within Fidalgo Bay in Anacortes Washington
Compounds Maximum Concentration
(ppm)
Comparison Value (ppm)
EPA Cancer Class
Comparison Value
Reference
Contaminant of Concern
(COC)
Arsenic 606 20 A EMEG No
Cadmium 116 10 B1 EMEG No
Chromium 298 200daggerdagger A RMEG No
Copper 269 J 2000 D IM EMEG No
Lead 128 250 B2 MTCA No
Mercury 0086 1 D MTCA No
Silver 0159 300 D RMEG No
Zinc 599 20000 D EMEG No
2-Methylnaphthalene 0007 J 200 RMEG No
Acenaphthene 0003 J 3000 RMEG No
Acenaphthylene 00088 J 2000 D No
Anthracene 0029 20000 D RMEG No
Benzo(a)anthracene 0066 062 B2 Region 9 cPAH
Benzo(a)pyrene 0073 01 B2 CREG cPAH
Benzo (b)fluoranthene 01 062 B2 Region 9 cPAH
Benzo (k)fluoranthene 0033 062 B2 Region 9 cPAH
Benzo(ghi)perylene 0033 2000 D No
Chrysene 011 62 B2 Region 9 cPAH
Dibenz(ah)anthracene 00079 J 01 CREG cPAH
Dibenzofuran 0005 J 290 D Region 9 No
Fluoranthene 024 2000 D RMEG No
Fluorene 00095 J 2000 D RMEG No
Indeno(123-cd)pyrene 0044 062 B2 Region 9 cPAH
Naphthalene 0019 30000 C IM EMEG No
Phenanthrene 0082 2000 D No
Pyrene 016 2000 D RMEG No
Hexachlorobenzene 00011 04 B2 CREG No
24-DDT 000025 J 30 B2 IM EMEG No
44-DDD 000081 JP 30 B2 IM EMEG No
44-DDE 000043 JP 30 B2 IM EMEG No
44-DDT 00007 JP 30 B2 IM EMEG No
Alpha-BHC 00014 P 01 B2 CREG No
Endosulfan I 00028 100 EMEG No
Endosulfan Sulfate 000023 J 100 EMEG No
11
HC-Fidalgo Bay
Endrin aldehyde 0017 20 D EMEG No
4-Methylphenol 10 310 Region 9 No
Benzyl alcohol 00077 J 18000 Region 9 No
Bis(2-ethylhexyl)phthalate 0026 J 3000 B2 EMEG No
Butyl benzyl phthalate 00084 J 10000 C RMEG No
Di-n-butyl phthalate 0011 J 5000 D RMEG No
Diethyl phthalate 00034 J 300000 D IM EMEG No
Dimethyl phthalate 00031 J 100000 D Region 9 No
Phenol 061 20000 D RMEG No
Total Aroclors 0035dagger 1 EMEG No
Total cPAH TEQ 0102 01 B2 CREG Yes
Total Dioxin TEQ 000000891dagger 000005 B2 No
CREG - ATSDRrsquos Cancer Risk Evaluation Guide (child) RMEG - ATSDRrsquos Reference Dose Media Evaluation Guide (child) EMEG - ATSDRrsquos Environmental Media Evaluation Guide (child) IM EMEG - ATSDRrsquos Intermediate Environmental Media Evaluation Guide (child) J - data qualifier The associated numerical result is an estimate JP - data qualifier The associated numerical result is an estimate confirmation criteria was exceeded P - data qualifier The confirmation criteria was exceeded A - EPA human carcinogen B1 - EPA Probable human carcinogen (limited human sufficient animal studies) B2 - EPA Probable human carcinogen (inadequate human sufficient animal studies) C - EPA Possible human carcinogen (no human limited animal studies) D - EPA Not classifiable as to health carcinogenicity Region 9 ndash EPA Preliminary Remediation Goals dagger
Maximum surface sediment daggerdagger
Assume hexavalent chromium Fluoranthene RMEG value was used as a surrogate Benzo(a)pyrene CREG value was used as a surrogate 44-DDT IM EMEG value was used as a surrogate Endosulfan I EMEG value was used as a surrogate Endrin EMEG value was used as a surrogate Arocolor 1254 EMEG value was used as a surrogate Total Dioxin TEQ ndash sum of dioxinfurans toxic equivalent (TEQ) Total cPAH TEQ ndash sum of all carcinogenic polycyclic aromatic hydrocarbons (cPAH) toxic equivalent (TEQ) all cPAHs in COC are added using the TEQ approach to obtain Total cPAH TEQ PPM ndash parts per million BOLD values exceed comparison values
12
HC-Fidalgo Bay
Table 2 Maximum concentration of contaminants detected in fish and shellfish sampled at Fidalgo Bay in Anacortes Washington
Chemicals Contaminant maximum concentration (ppm) Comparison Valuea
(ppm)
EPA Cancer ClassHorse
Clams Manila Clams
Bent nose
Clams
Macoma Clams
Starry Flounder
English Sole
Arsenic total 282 314 384 na 135 31 0003 A
Cadmium 015 032 031 na 0091 012 05 B1 inhalation
Chromium 223 594 591 na 043 059 147 D
Copper 520 633 8634 na 265 184 197 D
Lead 126 213 671 na 127 163 na B2
Mercury 0009 003 002 na 0071 00077 0049 D
Nickel 176 328 315 na 047 035 98
Silver 015 035 016 na 00028 00037 246 D
Zinc 1958 1310 4254 na 1116 985 1475 D
Total Dioxin TEQ
70E-8 12E-7 76E-7 69E-7 175E-7 168E-7 315E-8
A - EPA Human carcinogen B1 - EPA Probable human carcinogen (limited human sufficient animal studies) B2 - EPA Probable human carcinogen (inadequate human sufficient animal studies) D - EPA Not classifiable as to health carcinogenicity Total Dioxin TEQ ndash sum of dioxinfurans toxic equivalent (TEQ) a = Comparison values for contaminants in fish were obtained from EPA Guidance for Assessing Chemical Contaminant Data (subsistence fishers) [14] na ndash not available PPM ndash parts per million BOLD values exceed comparison values
13
HC-Fidalgo Bay
Table 3 Maximum concentration of contaminants detected in Red Rock and Dungeness crab sampled at Fidalgo Bay in Anacortes Washington
Chemicals Contaminant maximum concentration (ppm) Comparison Valuea
(ppm)
EPA Cancer ClassRed Rock Crab Dungeness Crab
Tissue Other Hepato -pancreas
Tissue Other Hepato -pancreas
Arsenic total 595 469 731 1047 681 654 0003 A
Cadmium 136 647 3313 013 023 037 05 B1 inhalation
Chromium 011 069 024 0095 084 0062 147 D
Copper 1017 2643 6852 1183 3112 3420 197 D
Lead 119 159 173 128 145 125 na B2
Mercury 0058 0026 0060 0088 0051 0049 0049 D
Nickel 025 062 135 060 054 030 98
Silver 015 023 050 023 031 046 246 D
Zinc 5655 3569 8057 4579 2439 2009 1475 D
Total Dioxin TEQ
18E-7 153E-6 657E-6 144E-7 582E-6 105E-5 315E-8
A - EPA Human carcinogen B1 - EPA Probable human carcinogen (limited human sufficient animal studies) B2 - EPA Probable human carcinogen (inadequate human sufficient animal studies) D - EPA Not classifiable as to health carcinogenicity Other soft tissue (viscera) Total Dioxin TEQ ndash sum of dioxinfurans toxic equivalent (TEQ) a = Comparison values for contaminants in fish were obtained from EPA Guidance for Assessing Chemical Contaminant Data (subsistence fishers) [14] na ndash not available PPM ndash parts per million BOLD values exceed comparison values
Exposure Pathways
In order for any contaminant to be a health concern the contaminant must be present at a high enough concentration to cause potential harm and there must be a completed route of exposure to people
Human use patterns and site-specific conditions were considered in the evaluation of exposure to lead and arsenic Exposure to contaminants in sediment can occur through the following pathways and routes
Ingestion exposure (swallowing)
Most people inadvertently swallow small amounts of sediments soil and dust (and any contaminants they might contain) Young children often put hands toys pacifiers and other things in their mouths that may have dirt or dust on them and may be swallowed Adults may
14
HC-Fidalgo Bay
ingest sediments soil and dust through activities such as gardening mowing construction work dusting and in this case recreational activities
Pica behavior is a persistent eating of non-food substances (such as dirt or paper) In a small percentage of children pica behavior has been found to result in the ingestion of relatively large amounts of soil (one or more grams per day) Compared to typical children those who swallow large amounts of contaminated soil may have added risks from short-term exposure Some adults may also exhibit pica behavior
Inhalation exposure (breathing)
Although people can inhale suspended sediment soil or dust airborne sediment usually consists of relatively large particles that are trapped in the nose mouth and throat and are then swallowed rather than breathed into the lungs
Skin exposure (dermal)
Dirt particles that can adhere to the skin may cause additional exposure to contaminants through dermal absorption Although human skin is an effective barrier for many environmental contaminants some chemicals can move easily through the skin
The following discussion addresses possible community behavior and site-specific conditions that are considered in the evaluation of exposure to carcinogenic polycyclic aromatic hydrocarbons (cPAHs) as a contaminant of concern in site sediments through the following pathways and routes
Inadvertent sediment ingestion dust particle inhalation and dermal absorption of contaminants in sediment during beach play
Beach Play Scenario
Although contact with sediments at beaches may be an infrequent or seasonal exposure pathway there is concern because areas along Fidalgo Bay have elevated levels of contaminants (see Table 1) Exposure to contaminants in sediment can occur by swallowing (ingestion exposure) breathing (inhalation exposure) or getting it on skin (dermal exposure) During recreational activities at beaches people are likely to be exposed to any sediment contaminants In order for a contaminant to be a health concern the contaminant must be present at a high enough concentration to cause potential harm and there must be a completed route of exposure to people cPAHs are evaluated in this document since they exceed their health comparison values in sediments See Appendix A for the evaluation of sediments
Fish and Shellfish Ingestion Scenario
Fidalgo Bay falls under the Puget Sound Recreational Marine Area 7 Fish Consumption Advisory which states no more than one meal per week for rockfish and Chinook salmon and no more than one meal per month for resident (blackmouth) Chinook salmon This area also falls under the Puget Sound Crab Advisory DOH recommends only Dungeness and Red Rock crab
15
HC-Fidalgo Bay
from non-urban areas be consumed and do not eat the ldquocrab butterrdquo (hepatopancreas) and viscera
Comparison values for contaminants in fish were obtained from EPArsquos Guidance for Assessing Chemical Contaminant Data (subsistence fishers) [8] Bottom fish (English sole and Starry Flounder) shellfish (Bent Nose Horse Macoma and Manila clams) and crabs (Dungeness and Red Rock) were collected and tissue was analyzed for contaminants in these samples (see Tables 2 and 3)
As mentioned above in order for a contaminant to be a health concern it must be present at a high enough concentration to cause potential harm and there must be a completed route of exposure to people People may at times disregard these advisories and consume more fish and crab from Fidalgo Bay In the event of this scenario DOH evaluated bottom fish clams and crab contaminant exposure for the general population and for the Swinomish Tribe and Samish Indian Nation Aspects of EPArsquos Tribal Fish and Shellfish consumption framework were used to set rates (See Appendix C) [9] Horse and Manila clams are targeted shellfish species for human consumption Bent Nose and Macoma clams are not usually targeted shellfish species for human consumption
Appendix B details the methodology and assumptions used by DOH to estimate exposure from eating seafood from Fidalgo Bay For the general adult population average ingestion rates of 175 gday represent the 90th percentile per capita ingestion rates for people of age 18 or older in the United States including people that do and do not consume fish [10] Since there was only data for bottom fish it was assumed that bottom fish was consumed similarly to the tribal rate of about four percent of the total intake of seafood For the general adult population an average shellfish consumption rate of 17 gday was used to calculate exposure doses For the general child population an average fish consumption rate of 028 gday based on bottom fish data only was used The average shellfish consumption rate of 057 gday was used to calculate exposure doses (See Appendix B Table B1)
The tribal consumer scenario was based on the EPA Tribal framework for fish and shellfish consumption rates for risk-based decisions (See Appendix C) [15] The percent of their consumption rate was represented by the category of seafood for both the Tulalip and the Suquamish Tribes [9 11 12]
Benefits of Fish Consumption
It is important to consider the benefits of eating fish Fish are an excellent source of protein and are associated with reduced risk of coronary heart disease The health benefits of eating fish have also been associated with low levels of saturated versus unsaturated fats Saturated fats are linked with increased cholesterol levels and risk of heart disease while unsaturated fats (eg omega-3 polyunsaturated fatty acid) are an essential nutrient Fish also provide a good source of some vitamins and minerals [13 14] The American Heart Association recommends two servings of fish per week as part of a healthy diet [15]
16
HC-Fidalgo Bay
The health benefits of eating fish deserve particular consideration when one is dealing with subsistence consuming populations Removal of fish from the diet of subsistence consumers can have serious health social and economic consequences that must be considered in issuing fish advisories Consumption advisories for subsistence consumers could therefore significantly impact diet Any advice given to fish consumers to reduce the amount of fish they eat based on chemical contamination should attempt to balance the health benefits with the health risks In general people should eat fish low in contaminants and high in omega-3 fatty acid Fish consumption advice should also take into account that eating alternative sources of protein also has risks For instance increasing the consumption rate of beef or pork at the expense of eating fish can increase the risk of heart disease In addition some contaminants that are common in fish such as dioxin might also be present in other meats
The level of contaminant exposure from fish consumption varies with the species of fish whole fish or fillet consumption rate and preparation and cooking process Exposure to contaminants in fish can be significantly reduced through simple preparation measures Simply removing the skin of the fish can reduce PCB exposure [16] Cooking fish using fillets instead of whole fish can reduce PCB levels by more than 20 In some cases PCBs were removed up to 50 through cooking [17 18]
Chemical Specific Toxicity
The following sections are general summaries of COC health effects The public health implications of exposure to these COCs from sediments and tissues are discussed later Copper will not be evaluated since Bent Nose clams are not usually targeted shellfish species for human consumption In addition DOH recommends only Dungeness and Red Rock crab from non-urban areas be consumed and do not eat the ldquocrab butterrdquo (hepatopancreas) and viscera
Arsenic
Arsenic is a naturally occurring element in the earths soil In Washington normal soil background concentrations rarely exceed 20 ppm [19] However the widespread use of arsenic-containing pesticides and the emissions from smelters has resulted in significantly higher levels of arsenic on many properties in the state There are two forms of arsenic - organic and inorganic The EPA-established reference dose (RfD) for arsenic is 00003 mgkgday based on skin color changes and excessive growth of tissue (human data) [20] EPA classifies the inorganic form of arsenic as a human carcinogen DOH will not be using the slope factor of 15 per mgkgday due to the arsenic weight of evidence approach The recent EPA IRIS review draft for the Science Advisory Board presented a slope factor for combined lung and bladder cancer of 57 per mgkgday [21] The slope factor calculated from the work by the National Research Council is about 21 per mgkgday [22] These slope factors could be higher if the combined risk for all arsenic-associated cancers (bladder lung skin kidney liver etc) were evaluated For this or any other health consultation DOH will use a slope factor of 57 per mgkgday which appears to reflect EPAs Review DRAFT assessment
Inorganic arsenic is much more harmful than organic arsenic therefore DOH based health evaluations on the levels of inorganic arsenic present in fish samples Generally inorganic arsenic in fish and shellfish ranged from about 1-20 of total arsenic [20 22 23 24] The US
17
HC-Fidalgo Bay
Food and Drug Administration (FDA) proposed 10 of total arsenic estimated as inorganic arsenic [24] Ecologyrsquos evaluation of shellfish in Puget Sound indicated that less than 1 of total arsenic found was in the inorganic form of arsenic [25] For this health consultation DOH assumed that 1 of the total arsenic detected was inorganic arsenic Therefore 1 of the concentration was used to calculate the estimated dose from exposure to inorganic arsenic in shellfish Similarly Ecologyrsquos evaluation of English Sole fish in Puget Sound indicated that less than 1 of the total arsenic found was in the inorganic form of arsenic [25] However since there was no inorganic arsenic data for Starry Flounder DOH assumed that 10 of the total arsenic detected in bottom fish was inorganic arsenic (see Uncertainty section)
Consuming seafood from Fidalgo Bay could result in an exposure dose of 135 times 10-5 mgkgday (see Appendix B Table B4) for the general public Similarly consuming seafood from Fidalgo Bay could result in exposure doses ranging from 364 times 10-4 to 629 times 10-5 mgkgday (see Appendix C Table C1 and Table C6) for a tribal population Health effects of skin cancer changes in the skin vascular disease and liver enlargement occurred in humans chronically exposed to 14 times 10-2 mgkgday of arsenic in drinking water [20] Therefore DOH does not expect that exposures to arsenic in fish shellfish and crabs will cause harmful non-cancer health effects for the general population The tribal exposure scenario resulted in doses that are slightly above the RfD In addition there is the assumption that all the seafood consumed by the tribal members is from Fidalgo Bay only However DOH does not expect that exposures to arsenic in fish shellfish and crabs will cause harmful non-cancer health effects for tribal consumption population
Cadmium
Cadmium is a naturally occurring element in the earths crust Cadmium is used mainly in batteries pigments metal coatings and metal alloys Cadmium is found in most foods at low levels with the lowest levels found in fruits and the highest found in leafy vegetables and potatoes Shellfish have higher cadmium levels (up to 1 ppm) than other types of fish or meat Cadmium is stored in the liver and kidneys and slowly leaves the body in the urine and feces [26] However high levels of cadmium will cause kidney damage and cause bones to become fragile and break easily Studies of workers exposed to airborne cadmium also suggest a link with prostate cancer The ability of cadmium to cause cancer via the oral route is disputed by many studies The RfD for cadmium that is ingested with food is 0001 mgkgday
Consuming seafood from Fidalgo Bay could result in an exposure dose of 394 times 10-5 mgkgday (see Appendix B Table B4) for the general public Similarly consuming seafood from Fidalgo Bay could result in exposure doses ranging from 30 times 10-3 to 480 times 10-4 mgkgday (see Appendix C Table C2 and Table C7) for a tribal population A NOAEL of 21 times 10-3 mgkgday was established for exposure to cadmium Therefore DOH does not expect that exposures to cadmium in crabs will cause harmful non-cancer health effects for the general population However DOH does expect that exposures to cadmium in crabs will cause harmful non-cancer health effects for tribal consumption population
Chromium
Chromium is a naturally occurring element in the earths soil Chromium is found in three main forms chromium 0 (metal) chromium III (trivalent chromium) and chromium VI (hexavalent
18
HC-Fidalgo Bay
chromium) Chromium metal is used for making steel Chromium III is an essential nutrient required by the body Chromium VI is more easily absorbed and harmful Ingesting large amounts of chromium VI can cause stomach ulcers kidney and liver damage and even death However some ingested chromium VI is converted to chromium III and most will exit the body in feces within a few days and never enter the bloodstream Only about 2 percent of ingested chromium passes through the walls of the intestine and enters the bloodstream [27 28 29] The EPA established RfD for chromium VI is 0003 mgkgday The chromium evaluated here represents total chromium as opposed to chromium VI Dose calculations however do not attempt to fractionate the chromium concentrations DOH is being very conservative in the evaluation of total chromium and considers all chromium to be chromium VI
Consuming seafood from Fidalgo Bay could result in an exposure dose of 151 times 10-4 mgkgday (see Appendix B Table B4) for the general public Similarly consuming seafood from Fidalgo Bay could result in exposure doses ranging from 116 times 10-2 to 184 times 10-3 mgkgday (see Appendix C Table C3 and Table C8) for a tribal population A NOAEL of 25 times 100 mgkgday was established for exposure to chromium (VI) The tribal exposure scenario resulted in doses that exceed the RfD but falls below the actual toxic effect levels However since DOH was very conservative in its evaluation and assumed all chromium in the seafood was chromium IV and 100 percent of the chromium was absorbed In addition there is the assumption that all the seafood consumed by the tribal members is from Fidalgo Bay only Therefore DOH does not expect that exposures to chromium in crabs will cause harmful non-cancer health effects for the general population and tribal consumption population
Dioxins and furans
Dioxins Furans and cPAHs TEQ concentrations
Although several dioxin and furan congeners were analyzed in tissue only a single value called a dioxin toxic equivalent (TEQ) is presented in this health consultation Each dioxinfuran or dioxin-like PCB congener is multiplied by a Toxic Equivalency Factor (TEF) to produce the dioxin TEQ The TEQs for each chemical are then summed to give the overall 2378shytetrachlorodibenzo-p-dioxin TEQ The TEQ approach is based on the premise that many dioxinsfurans and dioxin-like PCB congeners are structurally and toxicologically similar to 2378-tetrachlorodibenzo-p-dioxin TEFs are used to account for the different potency of dioxins and furans relative to 2378-tetrachlorodibenzo-p-dioxin and are available for ten chlorinated dibenzofurans and seven chlorinated dibenzodioxins using the World Health Organization (WHO) methodology [7] A similar TEQ approach is developed for each cPAH based on the relative potency to benzo(a)pyrene
Dioxins and furans (dioxins) consist of about 210 structural variations of dioxin congeners which differ by the number and location of chlorine atoms on the chemical structure The primary sources of dioxin releases to the environment are the combustion of fossil fuels and wood the incineration of municipal medical and hazardous waste and certain pulp and paper processes Dioxins also occur at very low levels from naturally occurring sources and can be found in food water air and cigarette smoke
19
HC-Fidalgo Bay
The most toxic of the dioxin congeners 2378-tetrachlorodibenzo-p-dioxin (TCDD) can cause chloracne (a condition of acne like lesions on the face and neck) Exposure to high levels of dioxins can cause liver damage developmental effects and impaired immune function [30] Long-term exposure to dioxins could increase the likelihood of developing cancer Studies in rats and mice exposed to TCDD resulted in thyroid and liver cancer [31] EPA considers TCDD to be a probable human carcinogen and developed a cancer slope factor of 15x 10
5
mgkgday [32 33]
Consuming seafood from Fidalgo Bay could result in an exposure dose of 196 times 10-11
mgkgday (see Appendix B Table B4) for the general public Similarly consuming seafood from Fidalgo Bay could result in exposure doses ranging from 609 times 10-10 to 101 times 10-10
mgkgday (see Appendix C Table C4 and Table C9) for a tribal population Health effects of altered social behavior have been observed in monkeys exposed to 12 times 10-7 mgkgday of dioxin [30] The tribal exposure scenario resulted in doses that are below the MRL of 1x 10
9
mgkgday Therefore DOH does not expect that exposures to dioxin in fish shellfish and crabs will cause harmful non-cancer health effects for the general population and tribal consumption population
Lead ndash Occurrence Health Concerns and Risks
Lead is a naturally occurring chemical element that is normally found in soil In Washington normal background concentrations rarely exceed 20 ppm [19] However the widespread use of certain products (such as leaded gasoline lead-containing pesticides and lead-based paint) and the emissions from certain industrial operations (such as smelters) has resulted in significantly higher levels of lead in many areas of the state
Elimination of lead in gasoline and solder used in food and beverage cans has greatly reduced exposure to lead Currently the main pathways of lead exposure in children are ingestion of paint chips contaminated soil and house dust and drinking water in homes with old plumbing
Children less than seven years old are particularly vulnerable to the effects of lead Compared to older children and adults they tend to ingest more dust and soil absorb significantly more of the lead they swallow and more of the lead they absorb can enter their developing brain Pregnant women and women of childbearing age should also be aware of lead in their environment because lead ingested by a mother can affect the unborn fetus
Health effects
Exposure to lead can be monitored by measuring the level of lead in the blood In general blood lead rises 3-7 gdl for every 1000 ppm increase in soil or dust concentration [34] For children the Centers for Disease Control and Prevention (CDC) has defined an elevated blood lead level (BLL) as greater than or equal to 10 micrograms of lead per deciliter of blood (gdl) [35] However there is growing evidence that damage to the central nervous system resulting in learning problems can occur at blood lead levels less than 10 gdl About 22 percent of children in the US have blood lead levels greater than 10 gdl
20
HC-Fidalgo Bay
Lead poisoning can affect almost every system of the body and often occurs with no obvious or distinctive symptoms Depending on the amount of exposure a child has lead can cause behavior and learning problems central nervous system damage kidney damage reduced growth hearing impairment and anemia [36]
In adults lead can cause health problems such as high blood pressure kidney damage nerve disorders memory and concentration problems difficulties during pregnancy digestive problems and pain in the muscles and joints [36] These have usually been associated with blood lead levels greater than 30 gdl
Because of chemical similarities to calcium lead can be stored in bone for many years Even after exposure to environmental lead has been reduced lead stored in bone can be released back into the blood where it can have harmful effects Normally this release occurs relatively slowly However certain conditions such as pregnancy lactation menopause and hyperthyroidism can cause more rapid release of the lead which could lead to a significant rise in blood lead level [37]
EPArsquos target cleanup goal is no more than 5 of the community with BLLs above 10 microgdL Consuming seafood from Fidalgo Bay could result in the estimated BLL for the general population 13 to 14 percent above 10 μgdL for a child and 15 to 19 percent above 10 μgdL for an adult with a 95th percentile fetus BLL range of 46 to 48 μgdL (see Appendix D Tables D1 and D6) Consumption of seafood at tribal scenario rates from Fidalgo Bay could result in the estimated BLL 125 to 3243 percent above 10 μgdL for a child and 19 to 304 percent above 10 μgdL for an adult with a 95th percentile fetus BLL range of 59 to 927 μgdL (see Appendix D Tables D3 D5 D8 and D10)
Mercury
Mercury exists in the environment in three forms elemental inorganic and organic Methylmercury is the form of organic mercury related to exposure in fish Methylmercury is formed from inorganic mercury in the environment by microorganisms in aquatic systems In the aquatic food chain methylmercury biomagnifies as it is passed from lower to higher trophic levels through consumption of prey organisms Fish at the top of the food chain can biomagnify methlymercury which represents a potential health concern for consumers of fish
Ingested methlymercury is readily absorbed and complexed with the cysteine amino acid and crosses the blood-brain barrier In Minamata Bay Japan mothers who were exposed to high amounts of mercury but were asymptomatic gave birth to severely affected infants Other epidemiologic studies have shown developmental effects in both animal and human studies are the primary concern about methylmercury exposure The EPA established RfD for mercury is 00001 mgkgday
Mercury evaluated here represents total mercury as opposed to methylmercury Dose calculations however do not attempt to fractionate the mercury concentrations because almost all of the total mercury found in fish is methylmercury
Consuming seafood from Fidalgo Bay could result in an exposure dose of 559 times 10-6 mgkgday (see Appendix B Table B4) for the general public Similarly consuming seafood from Fidalgo
21
HC-Fidalgo Bay
Bay could result in exposure doses ranging from 320 times 10-4 to 529 times 10-5 mgkgday (see Appendix C Table C5 and Table C10) for a tribal population ATSDR has derived a NOAEL of 13 times 10-3 mgkgday for mercury Therefore DOH does not expect that exposures to mercury in fish and crabs will cause harmful non-cancer health effects for the general population The tribal exposure scenario resulted in doses that slightly exceed the RfD but falls below the actual toxic effect levels In addition there is the assumption that all the seafood consumed by the tribal members is from Fidalgo Bay only Therefore DOH does not expect that exposures to mercury in fish and crabs will cause harmful non-cancer health effects for tribal consumption populations
Polycyclic Aromatic Hydrocarbons (PAHs)
Polycyclic aromatic hydrocarbons (PAHs) are generated by the incomplete combustion of organic matter including oil wood and coal They are found in materials such as creosote coal coal tar and used motor oil Based on structural similarities metabolism and toxicity PAHs are often grouped together when one is evaluating their potential for adverse health effects EPA has classified some PAHs ndash called cPAHs ndash as probable human carcinogens (Cancer Class B2) as a result of sufficient evidence of carcinogenicity in animals and inadequate evidence in humans [38]
Benzo(a)pyrene is the only cPAH for which EPA has derived a cancer slope factor The benzo(a)pyrene cancer slope factor was used as a surrogate to estimate the total cancer risk of cPAHs in sediment It should be noted benzo(a)pyrene is considered the most carcinogenic of the cPAHs The use of its cancer slope factor as a surrogate for total cPAH carcinogenicity may overestimate risk To address this issue DOH made an adjustment for each cPAH based on the relative potency to benzo(a)pyrene or TEQ [38]
Dietary sources make up a large percentage of PAH exposure in the US population Smoked or barbecued meats and fish contain relatively high levels of PAHs The majority of dietary exposure to PAHs for the average person comes from ingestion of vegetables and grains (cereals) [39]
Sediment ingestion from Fidalgo Bay could result in lifetime non cancer exposure doses of 360 times 10-7 mgkgday (see Appendix A Table A2) A LOAEL of 10 times 101 mgkgday was established for PAH Therefore DOH does not expect that exposures to PAHs in sediment will cause harmful non-cancer health effects
Evaluating non-cancer hazards
Exposure assumptions for estimating contaminant doses from sediment and tissue exposures are found in Appendices A and B Tables A1 and B1 In order to evaluate the potential for non-cancer adverse health effects that may result from exposure to contaminated media (ie air water soil and sediment) a dose is estimated for each COC These doses are calculated for situations (scenarios) in which a person might be exposed to the contaminated media The estimated dose for each contaminant under each scenario is then compared to EPArsquos oral reference dose (RfD) RfDs are doses below which non-cancer adverse health effects are not expected to occur (considered ldquosaferdquo doses) They are derived from toxic effect levels obtained from human population and laboratory animal studies These toxic effect levels can be either the
22
HC-Fidalgo Bay
lowest-observed adverse effect level (LOAEL) or a no-observed adverse effect level (NOAEL) In human or animal studies the LOAEL is the lowest dose at which an adverse health effect is seen while the NOAEL is the highest dose that does not result in any adverse health effects
Because of data uncertainty the toxic effect level is divided by ldquosafety factorsrdquo to produce the lower and more protective RfD If a dose exceeds the RfD this indicates only the potential for adverse health effects The magnitude of this potential can be inferred from the degree to which this value is exceeded If the estimated exposure dose is only slightly above the RfD then that dose will fall well below the observed toxic effect level The higher the estimated dose is above the RfD the closer it will be to the actual observed toxic effect level This comparison is called a hazard quotient (HQ) and is given by the equation below
HQ = Estimated Dose (mgkg-day) RfD (mgkg-day)
Estimated exposure doses exposure assumptions and hazard quotients are presented in Appendix A for cPAHs found in sediment Based on exposure estimates quantified in Appendix A the general population is not likely to experience adverse non-cancer health effects from exposure to chemical contaminants in Fidalgo Bay since the exposure dose did not exceed the RfD
Similarly estimated exposure doses exposure assumptions and hazard quotients are presented in Appendices B and C for contaminants found in tissue Based on exposure estimates quantified in Appendix B the general population is not likely to experience adverse non-cancer health effects from exposure to chemical contaminants in Fidalgo Bay However the tribal exposure scenario results in doses that exceed the RfD and in some cases these exposures fall below the actual toxic effect levels (see Appendix C)
Evaluating Exposure to Lead
The biokinetics of lead are different from most toxicants because it is stored in bones and remains in the body long after it is ingested Childrenrsquos exposure to lead is evaluated through the use of the Integrated Exposure Uptake Biokinetic Model for Lead in Children (IEUBK) developed by the EPA The IEUBK predicts blood lead levels in a distribution of exposed children based on the amount of lead that is in environmental media (eg fish) [40] It is important to note that the IEUBK model is not expected to accurately predict the blood lead level of a child (or a small group of children) at a specific point in time In part this is because a child (or group of children) may behave differently and therefore have different amounts of exposure to contaminated soil and dust than the average group of children used by the model to calculate blood lead levels For example the model does not take into account reductions in exposure that could result from community education programs Despite this limitation the IEUBK model is a useful tool to help prevent lead poisoning because of the information it can provide about the hazards of environmental lead exposure For children who are regularly exposed to lead-contaminated fish the IEUBK model can estimate the percentage of young children who are likely to have blood lead concentrations that exceed a level that may be associated with health problems (usually 10 gdl)
23
HC-Fidalgo Bay
Average fish lead concentrations and estimated blood lead levels
The IEUBK model was used to estimate the percentage of children that could have elevated blood lead levels if they frequently eat lead contaminated fish Default parameters are used for all model inputs unless stated [40] Exposure was based on a general population and a tribal scenario for children eating shellfish and bottom fish containing an average concentration of lead (see Appendix D)
The adult lead model was used to estimate the 95th percentile Fetal Blood Lead and the average blood lead levels of women who consume lead contaminated seafood Exposure was based on a general population and a tribal scenario for adults eating shellfish and bottom fish containing an average concentration of lead (see Appendix D)
Evaluating Cancer Risk
Some chemicals have the ability to cause cancer Theoretical cancer risk is estimated by calculating a dose similar to that described above and multiplying it by a cancer potency factor also known as the cancer slope factor Some cancer potency factors are derived from human population data Others are derived from laboratory animal studies involving doses much higher than are encountered in the environment Use of animal data requires extrapolation of the cancer potency obtained from these high dose studies down to real-world exposures This process involves much uncertainty
Current regulatory practice assumes there is no ldquosafe doserdquo of a carcinogen Any dose of a carcinogen will result in some additional cancer risk Theoretical cancer risk estimates are therefore not yesno answers but measures of chance (probability) Such measures however uncertain are useful in determining the magnitude of a cancer threat because any level of a carcinogenic contaminant carries an associated risk The validity of the ldquono safe doserdquo assumption for all cancer-causing chemicals is not clear Some evidence suggests that certain chemicals considered to be carcinogenic must exceed a threshold of tolerance before
Theoretical Cancer Riskinitiating cancer For such chemicals risk estimates are not appropriate Recent Theoretical cancer risk estimates do not reach
zero no matter how low the level of exposure guidelines on cancer risk from EPA reflect the to a carcinogen Terms used to describe this
potential that thresholds for some risk are defined below as the number of excess carcinogenesis exist However EPA still cancers expected in a lifetime assumes no threshold unless sufficient data Term of Excess Cancers indicate otherwise [41] moderate is approximately equal to 1 in 1000
low is approximately equal to 1 in 10000 very low is approximately equal to 1 in 100000
This document describes theoretical cancer slight is approximately equal to 1 in 1000000risk that is attributable to site-related insignificant is less than 1 in 1000000
contaminants in qualitative terms like low very low slight and no significant increase in theoretical cancer risk These terms can be better understood by considering the population size required for such an estimate to result in a single cancer case For example a low increase in cancer risk indicates an estimate in the range
24
HC-Fidalgo Bay
of one cancer case per ten thousand persons exposed over a lifetime A very low estimate might result in one cancer case per several tens of thousands exposed over a lifetime and a slight estimate would require an exposed population of several hundreds of thousands to result in a single case DOH considers theoretical cancer risk insignificant when the estimate results in less than one cancer per one million exposed over a lifetime The reader should note that these estimates are for excess cancers that might result in addition to those normally expected in an unexposed population
Cancer is a common illness and its occurrence in a population increases with the age of the population There are many different forms of cancer resulting from a variety of causes not all are fatal Approximately 14 to 13 of people living in the United States will develop cancer at some point in their lives [42]
Theoretical cancer risk estimates for exposure to cPAHs in sediments is considered insignificant (2 cancers estimated per 10000000 exposed) (see Appendix A Table A3) Although exposure to cPAHs may occur the magnitude is likely to be considerably less than the estimated minimum background exposure from sources in food water air sediment and soil Many areas of Fidalgo Bay are already under Ecology Agreed Orders The Orders require an RIFS be conducted to guide the selection of a cleanup remedy
Theoretical cancer risk estimates for exposure to seafood by the general population is very low (2 cancers estimated per 100000 exposed) (see Appendix B Tables B5) This estimate is within EPArsquos acceptable risk for fish consumption However this is based on bottom fish and shellfish data only Theoretical cancer risk estimates for exposure to seafood by Tribal consumers range from low to moderate (4 cancers estimated per 10000 exposed) and moderate to high (2 cancers estimated per 1000 exposed) (see Appendix C)
Multiple Chemical Exposures
A person can be exposed to more than one chemical through more than one pathway Exposure to a chemical through multiple pathways occurs if a contaminant is present in more than one medium (ie air soil surface water groundwater and sediment) For example the dose of a contaminant received from drinking water might be combined with the dose received from contact with the same contaminant in fish
For many chemicals much information is available on how the individual chemical produces effects However it is much more difficult to assess exposure to multiple chemicals Due to the large number of chemicals in the environment it is impossible to measure all of the possible interactions between these chemicals The potential exists for these chemicals to interact in the body and increase or decrease the potential for adverse health effects Individual cancer risk estimates can be added since they are measures of probability However when estimating non-cancer risk similarities must exist between the chemicals if the doses are to be added Groups of chemicals that have similar toxic effects can be added such as volatile organic compounds (VOCs) which cause liver toxicity Polycyclic aromatic hydrocarbons (PAHs) are another group of compounds that can be assessed as one combined dose based on similarities in chemical structure and metabolites
25
HC-Fidalgo Bay
The ATSDR Interaction Profile for persistent chemicals found in fish evaluates the possibility of interactive effects from exposure to a mixture of contaminants including mercury PCBs and dioxins [43]
Uncertainty
Assessment of risks attributable to environmental exposures is filled with many uncertainties Uncertainty with regard to the health assessment process refers to the lack of knowledge about factors such as chemical toxicity human variability human behavior patterns and chemical concentrations in the environment Uncertainty can be reduced through further study
The majority of uncertainty comes from our knowledge of chemical toxicity For most chemicals there is little knowledge of the actual health impacts that can occur in humans from environmental exposures unless epidemiological or clinical evidence exists As a result toxicological experiments are performed on animals These animals are exposed to chemicals at much higher levels than found in the environment The critical doses in animal studies are often extrapolated to real world exposures for use in human health risk assessments In order to be protective of human health uncertainty factors are used to lower that dose in consideration of variability in sensitivity between animals and humans and the variability within humans These uncertainty factors can account for a difference of two to three orders of magnitude when calculating risk Furthermore there are hundreds of chemicals for which little toxicological information is known in animals or humans These chemicals may in fact be toxic at some level but risks to humans cannot be quantified due to uncertainty
The majority of arsenic found in seafood is organic arsenic Inorganic arsenic in fish and shellfish ranged from about 1 to 20 of the total arsenic [20 22 23 24] Ecologyrsquos evaluation of shellfish and English sole in the Puget Sound indicated that less than 1 of the total arsenic found was in the inorganic form of arsenic [25] However since there was no arsenic speciation data for starry flounder DOH assumed that 10 of the total arsenic detected in bottom fish was inorganic arsenic Inorganic arsenic is much more harmful than organic arsenic therefore the arsenic evaluation may be overestimated
The amount of contaminated media (fish water air soil) that people eat drink inhale or absorb through their skin is another source of uncertainty Although recent work has improved our understanding of these exposure factors they are still a source of uncertainty In the case of Fidalgo Bay uncertainty exists with respect to how much fish people eat from Fidalgo Bay how often they are eating it what species they are eating how often children use public access areas and how much sediment or soil children may inadvertently eat Estimates are based on best available information or worst-case scenarios This evaluation is based on the assumption that 100 percent of the type of seafood (bottom fish and shellfish) harvested and consumed was from Fidalgo Bay
Another source of uncertainty is how seafood is actually prepared for consumption and laboratory testing (ie whole fish with guts versus gutless or fillets large clams with skin and gut ball) Bottom fish and clams may contain sediments in their digestive tracts that can affect the concentration of heavy metals during analysis Horse clams are a large clam and may show similar heavy metal patterns to geoduck clams where the skin and gut ball contain the major
26
HC-Fidalgo Bay
portion of heavy metals Bottom fish species should be analyzed without the gut and large clams should be analyzed without skin and without the gut for human health purposes
The amount and type of chemical in contaminated media is another source of uncertainty Environmental samples are very costly so it is not practical or efficient to analyze an adequate number of samples for every existing chemical Instead sampling usually focuses on contaminants that are thought to be present based on historic land use or knowledge of specific chemical spills
Fish Meal Limits
Several contaminants of concern are present in seafood from Fidalgo Bay Meal limits were calculated using the RfDMRL as the target risk value and the exposure parameters provided in Appendix E Table E1
Many factors must be considered when one is recommending limits on the consumption of seafood including the health benefits of eating fish the quality and comprehensiveness of environmental data and the availability of alternate sources of nutrition In addition these limits do not consider that multiple species are consumed a consideration that would require weighting the percent of each species consumed
Childrenrsquos Health Concerns
The potential for exposure and subsequent adverse health effects often increases for younger children compared with older children or adults ATSDR and DOH recognize that children are susceptible to developmental toxicity that can occur at levels much lower than those causing other types of toxicity The following factors contribute to this vulnerability
Children are more likely to play outdoors in contaminated areas by disregarding signs and wandering onto restricted locations
Children often bring food into contaminated areas resulting in hand-to-mouth activities Children are smaller and receive higher doses of contaminant exposures per body
weight Children are shorter than adults therefore they have a higher possibility of breathing in
dust and soil Fetal and child exposure to contaminants can cause permanent damage during critical
growth stages
These unique vulnerabilities of infants and children demand special attention in communities that have contaminated water food soil or air Childrenrsquos health was considered in the writing of this health consultation and the exposure scenarios treated children as the most sensitive population being exposed
27
HC-Fidalgo Bay
Conclusions
Based on the information provided DOH concludes the following
1 DOH concludes that consumption of seafood at tribal scenario rates is expected to harm children and adults health The Swinomish Samish Lummi and the Upper Skagit are tribes or nations that fish in this area or it is in their usual and accustomed fishing rights areas If any of the tribes or nations are using Fidalgo Bay for harvesting and is consuming at tribal scenario rates this would represent a ldquopublic health hazardrdquo The Swinomish Indian Tribal Community has stated ldquoFidalgo Bay historically an important harvest site is now impacted by contamination and thus not used for harvest in recent yearsrdquo [6] It may also be unlikely that 100 of a subsistence consumer (tribes or nations) would be consuming and harvesting from Fidalgo Bay only
2 DOH concludes that consuming bottom fish or shellfish from Fidalgo Bay is not expected to harm the general populationrsquos (children or adults) This area also falls under the Puget Sound Crab Advisory DOH recommends consuming only Dungeness and Red Rock crab from non-urban areas and that ldquocrab butterrdquo and viscera should not be eaten Based on contaminants of concern in bottom fish or shellfish calculated meal limits are 13 clams per month 14 crabs per month and 14 bottom fish per month (see Appendix E Tables E2 E3 and E4) Table E5 shows the adjustment of meal size based on the body weight of the consumer
3 DOH concludes that touching breathing or accidentally eating sediment one-day-pershyweek or 52 days per year from Fidalgo Bay is not expected to harm peoplersquos health The maximum level of carcinogenic polycyclic aromatic hydrocarbons (cPAHs) in this exposure scenario is below levels known to result in non-cancer harmful health effects In addition the exposure scenario does not present an elevated theoretical cancer risk
Recommendations
1 DOH recommends Ecology perform the necessary site remedial investigation and feasibility study (RIFS) as they work through the process of cleaning up Fidalgo Bay Proceeding with the planned cleanup will contribute to a significant reduction in human health risk
2 DOH recommends Ecology perform long-term monitoring of Fidalgo Bay DOH is available to review a monitoring plan and monitoring results
3 DOH recommends following the Puget Sound Recreational Marine Area 7 Fish Consumption Advisory and the Puget Sound crab consumption advisory that states
Eat no more than one meal per week for rockfish and Chinook salmon and no more than one meal per month for resident (blackmouth) Chinook salmon
28
HC-Fidalgo Bay
Eat Dungeness and Red Rock crab from non-urban areas and do not eat the ldquocrab butterrdquo (viscera) More information regarding these advisories is available at httpwwwdohwagovehpoehasfishrma7htm or by calling toll-free 1-877-485shy7316
4 DOH also recommends following the meal limits calculated in Appendix E Eat no more than 13 or 14 eight-ounce meals per month of clams crabs bottom fish (English sole and Starry Flounder) or any combination thereof
General Advice
DOH encourages all Washingtonians to eat at least two fish meals per week as part of a heart healthy diet in accordance with American Heart Association (AHA) recommendations People may eat fish more than two times weekly but such frequent consumers should take the following steps to reduce exposure to contaminants in the fish that they eat
bull Eat a variety of fish that are low in contaminants according to guidance provided on our website at httpwwwdohwagovfish
bull Follow fish advisory advice provided by DOH (website listed below) and local health agencies for water bodies where you fish httpwwwdohwagovehpoehasfishfishadvisorieshtm
bull Young children and small adults should eat proportionally smaller meal sizes bull Grill bake or broil fish so that fat drips off while cooking bull Eat fillets without the skin bull Mercury and other metals are stored in the fillet of the fish and will not be reduced by preparing fish this way
Public Health Action Plan
Actions Planned
1 DOH will coordinate with Ecology to provide an educational materials fact sheet
2 DOH will provide copies of this health consultation to Ecology and concerned parties
3 DOH will be available at Ecologyrsquos planned public meetings in the Fidalgo Bay community
29
HC-Fidalgo Bay
Author
Lenford OrsquoGarro Washington State Department of Health
Office of Environmental Health Assessments Site Assessment Section
Designated Reviewer Dan Alexanian Manager Site Assessment Section
Office of Environmental Health Assessments Washington State Department of Health
ATSDR Technical Project Officer Audra Henry
Cooperative Agreement and Program Evaluation Branch Division of Health Assessment and Consultation
Agency for Toxic Substances and Disease Registry
30
HC-Fidalgo Bay
References
1 SAIC 2007 Fidalgo Bay Sediment Investigation Anacortes WA Sediment Sampling and Analysis Plan Prepared for the Washington State Department of Ecology Prepared by Science Applications International Corporation (SAIC) Bothell WA September 17 2007
2 Fidalgo Bay Causeway feasibility study Request for funding from Department of Ecology Prepared by Samish Indian Nation May 4 2007 httpwwwsamishtribensnusdnrDOE2042007pdf
3 Washington State Department of Natural Resources Fidalgo Bay Environmental Aquatic Reserve management plan Skagit County Washington April 2008 Prepared by Aquatic resources program httpwwwdnrwagovPublicationsaqr_rsve_fid_mgmt_planpdf
4 SAIC 2008 Fidalgo Bay Sediment Investigation Anacortes WA Final Report Prepared for the Washington State Department of Ecology Prepared by Science Applications International Corporation (SAIC) Bothell WA March 31 2008
5 SAIC 2008 Fidalgo Bay Sediment Investigation Anacortes WA Archived Sediment and Tissue Analytical Results Data Report Addendum Prepared for the Washington State Department of Ecology Prepared by Science Applications International Corporation (SAIC) Bothell WA September 2008
6 Swinomish Water Resources Program December 1 2006 Bioaccumulative Toxics in Subsistence-Harvested Shellfish ndash Contaminant Results and Risk Assessment Swinomish Indian Tribal Community La Conner WA
7 Van den Berg M Birnbaum LS Denison M De Vito M Farland W Feeley M Fiedler H Hakansson H Hanberg A Haws L Rose M Safe S Schrenk D Tohyama C Tritscher A Tuomisto J Tysklind M Walker N amp Peterson RE (2006) The 2005 World Health Organization Reevaluation of Human and Mammalian Toxic Equivalency Factors for Dioxins and Dioxin-Like Compounds Toxicol Sci 93 223-241 Available at httptoxscioxfordjournalsorgcgicontentabstract932223
8 US Environmental Protection Agency Guidance for assessing chemical contaminant data for use in fish advisories volume 2 risk assessment and fish consumption limits third edition Office of Water Washington DC EPA 823-B-00-008 2000b
9 United States Environmental Protection Agency Framework for Selecting and Using Tribal Fish and Shellfish Consumption Rates for Risk-Based Decision Making at CERCLA and RCRA Cleanup Sites in Puget Sound and the Strait of Georgia August 2007
10 United States Environmental Protection Agency Estimated Per Capita Fish Consumption in the United States EPA 821-C-02-003 2002
31
HC-Fidalgo Bay
11 Toy KA Polissar NL Liao S and Mittelstaedt GD 1996 A fish consumption survey of the Tulalip and Squaxin Island tribes of the Puget Sound region Tulalip Tribes Department of Environment 7615 Totem Beach Road Marysville WA 98271
12 The Suquamish Tribe 2000 Fish Consumption Survey of the Suquamish Tribe of the Port Madison Indian Reservation Puget Sound Region The Suquamish Tribe 15838 Sandy Hook Road Post Office Box 498 Suquamish WA 98392
13 Alaska Division of Public Health The use of traditional foods in a healthy diet in Alaska risks in perspective 1999 Jan15
14 US Environmental Protection Agency and Toxicology Excellence for Risk Assessment August comparative dietary risks balancing the risks and benefits of fish consumption1999 Aug
15 American Heart Association An eating plan for healthy Americans Available at httpwwwamericanheartorgdietary guidelinesimagesEatPlan2000pdf
16 Hora ME Reduction of polychlorinated biphenyl (PCB) concentrations in carp (Cyprinus carpio) fillets through skin removal Bull Environ Contam Toxicol 1981 Mar 26 (3)364shy6
17 Wilson ND Shear NM Paustenbach DJ Price PS The effect of cooking practices on the concentration of DDT and PCB compounds in the edible tissue of fish J Exp Anal Environ Epidemiol 1998 Jul-Sep 8(3) 423-40
18 Zabik ME Zabik MJ Polychlorinated biphenyls polybrominated biphenyls and dioxin reduction during processingcooking food Adv Exp Med Biol1999459213-31
19 Toxics Cleanup Program Department of Ecology Natural background soil metals concentrations in Washington State Publication No 94-115Olympia Washington State Department of Ecology October 1994
20 Agency for Toxic Substances and Disease Registry (ATSDR) Toxicological profile for arsenic (update) PB2000108021 Atlanta GA US Department of Health and Human Services Public Health Service September 2005
21 US Environmental Protection Agency Toxicological Review of Inorganic Arsenic In support of summary information on the Integrated Risk Information System July 2005 httpwwwepagovwatersciencecriteriaarsenicsabAsDraft_SABpdf
22 NAS 2001b Arsenic in Drinking Water 2001 Update National Academy Press Washington DC 2001 Available at httpbooksnapedubooks0309076293htmlindexhtml
23 Francesconi KA and Edmonds JS 1997 Arsenic and marine organisms Advances in Inorganic Chemistry 44147-189
32
HC-Fidalgo Bay
24 US Food and Drug Administration (FDA) 1993 Guidance document for arsenic in shellfish Department of Health and Human Services Public Health Service Food and Drug Administration Center for Food Safety and Applied Nutrition Washington DC January 1993 Available at httpwwwfoodsafetygov~frfguid-ashtml
25 Washington State Department of Ecology Environmental Assessment Program Inorganic arsenic levels in Puget Sound fish and shellfish from 303(d) listed water bodies and other areas Prepared by Art Johnson and Morgan Roose Publication No 02-03-057 Olympia Washington State Department of Ecology December 2002
26 US Department of Health and Human Services Agency for Toxic Substances and Disease Registry Toxicological profile for Cadmium (update) PB99166621 Atlanta US Department of Health and Human Services July 1999
27 Anderson RA Polansky MM Bryden NA Patterson KY Veillon C Glinsmann WH 1983 Effects of chromium supplementation on urinary Cr excretion of human subjects and correlation of Cr excretion with selected clinical parameters J Nutr 113276ndash81 Cited in Agency for Toxic Substances and Disease Registry 2000 Toxicological profile for chromium Atlanta US Department of Health and Human Services September 2000 Available at httpwwwatsdrcdcgovtoxprofilestp7html
28 Anderson RA 1986 Chromium metabolism and its role in disease processes in man Clin Physiol Biochem 431ndash41 Cited in Agency for Toxic Substances and Disease Registry 2000 Toxicological profile for chromium Atlanta US Department of Health and Human Services September 2000 Available at httpwwwatsdrcdcgovtoxprofilestp7html
29 Donaldson RM Barreras RF 1966 Intestinal absorption of trace quantities of chromium J Lab Clin Med 68484ndash493 Cited in Agency for Toxic Substances and Disease Registry 2000 Toxicological profile for chromium Atlanta US Department of Health and Human Services September 2000 Available at httpwwwatsdrcdcgovtoxprofilestp7html
30 Agency for Toxic Substances and Disease Registry Toxicological profile for chlorinated dibenzo-p-dioxins (update) Draft for public comment Atlanta US Department of Health and Human Services 2000
31 National Toxicology Program Carcinogenesis bioassay of 2378- tetrachlorodibenzo-pshydioxin in Swiss-Webster mice (gavage study) Carcinogenesis Testing Program National Cancer Institute National Institute of Health National Toxicology Program Bethesda MD DHHS publication no 82-1765 1982
32 United States Environmental Protection Agency Health assessment document for polychlorinated dibenzo-p-dioxins Washington DC US Environmental Protection Agency Office of Health and Environmental Assessment EPA report no 6008-84014 1985
33
HC-Fidalgo Bay
33 United States Environmental Protection Agency Report on the peer review of the dioxin reassessment documents toxicity equivalency factors for dioxin and related compounds (Chapter 9) and integrated risk characterization document Alexandria VA National Center for Environmental Assessment 2000
34 Agency for Toxic Substances and Disease Registry (ATSDR) Analysis Paper Impact of Lead-Contaminated Soil on Public Health US Department of Health and Human Services Public Health Service Atlanta Georgia May 1992
35 CDC Preventing lead poisoning in young children a statement by the Centers for Disease Control October 1991 Atlanta Georgia US Department of Health and Human Services Public Health Service CDC 1991
36 US Department of Health and Human Services Agency for Toxic Substances and Disease Registry Toxicological profile for Lead (update) PB99166704 Atlanta US Department of Health and Human Services July 1999
37 Agency for Toxic Substances and Disease Registry (ATSDR) Lead Toxicity (Case studies in environmental medicine Course) SS3059 Atlanta US Department of Health and Human Services Public Health Service October 2000
38 US Department of Health and Human Services Agency for Toxic Substances and Disease Registry Toxicological Profile for Polycyclic Aromatic Hydrocarbons (PAHs) (update) PB95264370 Atlanta US Department of Health and Human Services August 1995
39 Phillips D H Polycyclic Aromatic Hydrocarbons in the diet Mutation Research 1999 (443) 139-147
40 US Environmental Protection Agency Technical Review Workgroup for Lead Userrsquos Guide for the Integrated Exposure Uptake Biokinetic Model for Lead in Children (IEUBK) Windows version 10 OSWER Directive No92857-42 Document No EPA 540-K-01-005 Washington DC May 2002
41 US Environmental Protection Agency Guidelines for Carcinogen Risk Assessment (Review Draft) NCEA-F-0644 July 1999 Available at httpwwwepagovNCEArafcancerhtm
42 ATSDR Agency for Toxic Substances and Disease Registry ATSDR Fact Sheet Cancer Updated August 30 2002 Atlanta US Department of Health and Human Services Available at httpwwwatsdrcdcgovCOMcancer-fshtml
43 Agency for Toxic Substances and Disease Registry (ATSDR) Interaction Profile for persistent chemicals found in fish US Department of Health and Human Services Public Health Service May 2004
34
HC-Fidalgo Bay
44 National Center for Environmental Assessment Exposure Factors Handbook Volume 1 ndash General Factors EPA600P-95002Fa US Environmental Protection Agency August 1997
35
HC-Fidalgo Bay
Figure 1 Demographic statistics within three miles of the site - Fidalgo Bay Skagit County
Total Population 11704 White 10818 Black 33 American Indian Eskimo Aleut 143 Asian or Pacific Islander 211 Other Race 176 Hispanic Origin 386 Children Aged 6 and Younger 943 Adults Aged 65 and Older 2310 Females Aged 15 - 44 2088 Total Aged over 18 8900 Total Aged under 18 2804 Total Housing Units 5295
Calculated using the area proportion technique Source 2000 US CENSUS
36
HC-Fidalgo Bay
Figure 2 Red box indicates the Fidalgo Bay site location Skagit County Washington
37
HC-Fidalgo Bay
Figure 3 Ecologyrsquos sediment and biota sample areas within Fidalgo Bay Skagit County Washington
38
HC-Fidalgo Bay
Appendix A This section provides calculated exposure doses and assumptions used for exposure to chemicals in sediments at the Fidalgo Bay site Three different exposure scenarios were developed to model exposures that might occur These scenarios were devised to represent exposures to a child (0-5 yrs) an older child and an adult The following exposure parameters and dose equations were used to estimate exposure doses from direct contact with chemicals in sediments
Exposure to chemicals in soil via ingestion inhalation and dermal absorption
Total dose (non-cancer) = Ingested dose + inhaled dose + dermally absorbed dose
Ingestion Route
Dose(non-cancer (mgkg-day) = C x CF x IR x EF x ED BW x ATnon-cancer
Cancer Risk = C x CF x IR x EF x CPF x ED BW x ATcancer
Dermal Route
Dermal Transfer (DT) = C x AF x ABS x AD x CF ORAF
Dose(non-cancer (mgkg-day) = DT x SA x EF x ED BW x ATnon-cancer
Cancer Risk = DT x SA x EF x CPF x ED BW x ATcancer
Inhalation Route
Dosenon-cancer (mgkg-day) = C x SMF x IHR x EF x ED x 1PEF BW x ATnon-cancer
Cancer Risk = C x SMF x IHR x EF x ED x CPF x 1PEF BW x ATcancer
39
HC-Fidalgo Bay
Table A1 Exposure assumptions used to estimate cPAHs doses from direct contact with sediments in Fidalgo Bay Anacortes WA
Parameter Value Unit Comments Concentration (C) Variable mgkg Maximum detected value
Conversion Factor (CF) 0000001 kgmg Converts contaminant concentration from milligrams (mg) to kilograms (kg)
Ingestion Rate (IR) ndash adult 100 mgday Exposure Factors Handbook [44] Ingestion Rate (IR) ndash older child 100
Ingestion Rate (IR) - child 200 Exposure Frequency (EF) 52 Daysyear One days a week
Exposure Duration (Ed) 30 (5 1015) years Number of years at one residence (child older child adult yrs)
Body Weight (BW) - adult 72 kg
Adult mean body weight Body Weight (BW) ndash older child 41 Older child mean body weight Body Weight (BW) - child 15 0-5 year-old child average body weight Surface area (SA) - adult 5700
cm2 Exposure Factors Handbook Surface area (SA) ndash older child 2900 Surface area (SA) - child 2900 Averaging Timenon-cancer (AT) 1825 days 5 years Averaging Timecancer (AT) 27375 days 75 years Cancer Potency Factor (CPF) 73 mgkg-day-1 Source EPA 24 hr absorption factor (ABS) 013 unitless Source EPA (Chemical Specific) PAH Oral route adjustment factor (ORAF) 1 unitless Non-cancer (nc) cancer (c) - default Adherence duration (AD) 1 days Source EPA
Adherence factor (AF) 02
mgcm2 Child older child 007 Adult
Inhalation rate (IHR) - adult 152 m3day Exposure Factors Handbook [44] Inhalation rate (IHR) ndash older child 14
Inhalation rate (IHR) - child 83 Soil matrix factor (SMF) 1 unitless Non-cancer (nc) cancer (c) - default Particulate emission factor (PEF) 145E+7 m3kg Model Parameters
40
HC-Fidalgo Bay
Fidalgo Bay Sediment Exposure Route ndash Non-cancer
Table A2 Non-cancer hazard calculations resulting from exposure to cPAHs in sediments from Fidalgo Bay Anacortes WA
Contaminant
TEQ Concentra
tion (ppm)
(mgkg)
Scenarios
Estimated Dose (mgkgday)
Total Dose LOAEL
(mgkgday)
Total Dose LOAELIncidental
Ingestion of Soil
Dermal Contact
with Soil
Inhalation of Particulates
Child 194E-7 730E-8 134E-11 267E-7 000000003
cPAH 0102 Older Child 354E-8 267E-8 828E-12 622E-8 10E+1 0000000006
Adult 202E-8 105E-8 512E-12 307E-8 0000000003
Fidalgo Bay Sediment Exposure Route ndash Cancer
Table A3 Cancer hazard calculations resulting from exposure to cPAHs sediments from Fidalgo Bay Anacortes WA
Contaminant Concentra tion (ppm)
EPA cancer Group
Cancer Potency Factor
(mgkg-day-1)
Scenarios
Increased Cancer Risk Total
Cancer RiskIncidental
Ingestion of Soil
Dermal Contact
with Soil
Inhalation of Particulates
Child 943E-8 355E-8 653E-12 130E-7
Total cPAH TEQ 0102 B2 73 Older Child 345E-8 260E-8 806E-12 605E-8
Adult 295E-8 153E-8 747E-12 448E-8
Lifetime cancer risk 130E-7 + 605E-8 + 448E-8 = 235E-7
41
HC-Fidalgo Bay
Appendix B
This section provides calculated exposure doses and exposure assumptions used for chemicals in bottom fish shellfish and crab samples taken from Fidalgo Bay These exposure scenarios were developed to model exposures that might occur and were devised to represent exposures to the general population The following exposure parameters and dose equations were used to estimate exposure doses from ingestion of contaminants in bottom fish and shellfish
Ingestion Route
Dose(non-cancer (mgkg-day) = C x CF1 x IR x CF2 x EF x ED BW x ATnon-cancer
Cancer Risk = C x CF1 x IR x CF2 x EF x CPF x ED BW x ATcancer
Table B1 Exposure assumptions used in exposure evaluation of contaminants in bottom fish shellfish and crab samples taken from Fidalgo Bay in Anacortes Washington
Parameter Value Unit Comments Concentration (C) Variable ugkg Average detected value
Conversion Factor (CF1) 0001 mgkg Converts contaminant concentration from milligrams (mg) to kilograms (kg)
Conversion Factor (CF2) 0001 kgg Converts mass of shellfish from grams (g) to kilograms (kg)
Ingestion Rate (IR) 057
gday
Body weight-adjusted shellfish consumption rates to account for children eating nearly 16 times as much fish per body weight as do adults (see table B2)
Ingestion Rate (IR) 028 Average general population child ndash bottom fish (see table B3)
Ingestion Rate (IR) 081 Body weight-adjusted shellfish consumption rates to account for an older child eating 081 times as much fish per body weight as do adults (see table B2)
Ingestion Rate (IR) 036 Average general population older child ndash bottom fish (see table B3)
Ingestion Rate (IR) 17 Average general population adult - shellfish
Ingestion Rate (IR) 07 Average general population adult ndash bottom fish (see table B3)
Exposure Frequency (EF) 365 Daysyear Assumes daily exposure
Exposure Duration (ED) 6 years
Number of years at one residence (child) Exposure Duration (ED) 30 Number of years at one residence (adult) Body weight (BW) 15
kg Mean body weight child
Body weight (BW) 70 Mean body weight adult Averaging Timenon-cancer (AT) Variable days Equal to Exposure Duration Averaging Timecancer (AT) 25550 days 70 years Cancer Potency Factor (CPF) Variable mgkg-day-1 Source EPA ndash Chemical specific
42
HC-Fidalgo Bay
Table B2 Derivation of a childrsquos shellfish consumption rate for the general US population
Row Parameter Adult Older Child (6-17 yrs)
Child (0-6 yrs)
1 Reported All Fish Consumption Rate-gram fish per kg bodyweight per day (gkgday)
0277 0225 0433
2 Ratio to Adult All Fish Consumption Rate
1 081 16
3 Reported Shellfish Consumption (gday)
170 (average) Not Reported Not Reported
4 Average Body Weight (kg) 70 41 15 5 Ratio to Adult BW 1 059 021 6 Adjusted Shellfish Consumption Rates
(gday) = Row 2 x Row 3 x Row 5
170 (average) 081 (average) 057 (average)
Table B3 Derivation of bottom consumption rate for the general US population based on four percent of total fish intake
Row Parameter Adult Older Child (6-17 yrs)
Child (0-6 yrs)
1 Reported All Fish Consumption Rateshy(gday)
175 90 70
2 Assume bottom fish intake rate similar to tribal at about 4 percent [15]
004 004 004
3 Adjusted bottom fish rates (gday) = Row 1 x Row 2
070 036 028
43
HC-Fidalgo Bay
Table B4 Exposure dose and non-cancer risk from ingesting seafood at the average concentrations of contaminants in bottom fish clams and crab samples taken from Fidalgo Bay in Anacortes Washington
Species Contaminant Average Concentration
(ppm)
Estimated Dose (mgkgday)
General population Average
MRL or RfD (mgkgday)
Hazard quotient
General population Average
Clams
Arsenic
0027 Child 103E-6
300E-4
0003 Older child 533E-7 0002
Adult 656E-7 0002
Crabs 0071 Child 270E-6 0009
Older child 140E-6 0005 Adult 172E-6 0006
Bottom Fish 015 Child 260E-6 0009
Older child 132E-6 0004 Adult 150E-6 0005
Crabs Cadmium 048 Child 182E-5
100E-3 0018
Older child 948E-6 0009 Adult 117E-5 0012
Clams Chromium 184 Child 699E-5
300E-3 0023
Older child 364E-5 0012 Adult 447E-5 0015
Clams
Dioxin
799E-8 Child 304E-12
10E-9
0003 Older child 158E-12 00016
Adult 194E-12 00019
Crabs 975E-8 Child 371E-12 00037
Older child 193E-12 00019 Adult 237E-12 00024
Bottom Fish 134E-7 Child 250E-12 0003
Older child 118E-12 00012 Adult 134E-12 00013
Crabs
Mercury
0049 Child 186E-6
100E-4
0019 Older child 968E-7 00097
Adult 119E-6 0012
Bottom Fish 0042 Child 784E-7 0008
Older child 369E-7 00037 Adult 420E-7 00042
PPM ndash parts per million
44
HC-Fidalgo Bay
Table B5 Cancer risk from ingesting seafood at the average concentrations of contaminants in bottom fish clams and crab samples taken from Fidalgo Bay in Anacortes Washington
Species Contaminant Average Concentration
(ppm)
Cancer Potency Factor
(mgkg-day-1)
Increased Cancer Risk
General population Average
Total Cancer Risk General population
Average
Clams
Arsenic
0027
57
Child 501E-7
153E-5
Older child 434E-7 Adult 160E-6
Crabs 0071 Child 132E-6
Older child 114E-6 Adult 421E-6
Bottom Fish 015 Child 137E-6
Older child 107E-6 Adult 366E-6
Clams
Dioxin
799E-8
15E+5
Child 390E-8
582E-7
Older child 338E-8 Adult 125E-7
Crabs 975E-8 Child 476E-8
Older child 413E-8 Adult 152E-7
Bottom Fish 134E-7 Child 322E-8
Older child 252E-8 Adult 861E-8
Sum of cancer risk 159E-5
45
HC-Fidalgo Bay
Appendix C This section provides calculated exposure doses and assumptions used for exposure to chemicals in seafood at the Fidalgo Bay site using Tulalip Tribe consumption rates It is based on the EPA Tribal framework for fish and shellfish consumption rates for risk-based decisions
Intake of contaminant in mgkg-day (IR ) = (CF x CR x x UCF ) BW c i PS i 1
[Equation 1] Where IR = Intake rate of contaminant by category of fishshellfish
c
CF = contaminant concentration (mgkg) in the tissue of the particular fish or shellfish category i
CR = the total consumption rate of fish and shellfish harvested from Puget Sound 194 grams per PS
day = the percentage of the ingestion rate that consists of the category of fish or shellfish unitless
i
BW = body weight 818 kilograms observed from the Tulalip Tribesrsquo study UCF = conversion factor 1 0001 kilograms per gram
1
Estimated cancer risk (ECR) = (IR x ED x EF x CSF) (AT x UCF ) [Equation 2] total 2
Where IR = Total intake of contaminant from site-related fish and shellfish consumption
total
ED = exposure duration 70 years EF = exposure frequency 365 days per year CSF = oral cancer slope factor for contaminant AT = averaging time 70 years for carcinogens UCF = conversion factor 2 (365 daysyear)
2
Estimated hazard index (EHI) = (IR x ED x EF x UCF ) (RfD x AT) [Equation 3] total 2
Where IR = Total intake of contaminant from site-related fish and shellfish consumption
total
ED = exposure duration 70 years EF = exposure frequency 365 days per year RfD = Oral reference dose for contaminant AT = averaging time the same as exposure duration for non-carcinogenic effects UCF = conversion factor 2 (1 yr365 days)
2
46
HC-Fidalgo Bay
Table C1 Fidalgo Bay arsenic intake rate based on the Tulalip Tribe seafood consumption rate Anacortes Washington
Overall FishShellfish Consumption Rate gday
Category Percent of Consumption Rate Represented by Category
Site-related concentration of arsenic mgkg in tissue
Category Specific Exposure mgkg-day
194 Salmon 497 0 0 194 Pelagic Fish 42 0 0 194 Bottom Fish 39 015 00000139 194 Shellfish 422 0049 00000490 Sum IRtotal 00000629 Crabs tissues and clams average
Arsenic Estimated hazard index = 021
Arsenic Estimated cancer risk = 21E-3
Table C2 Fidalgo Bay cadmium intake rate based on the Tulalip Tribe seafood consumption rate Anacortes Washington
Overall FishShellfish Consumption Rate gday
Category Percent of Consumption Rate Represented by Category
Site-related concentration of cadmium mgkg in tissue
Category Specific Exposure mgkg-day
194 Salmon 497 0 0 194 Pelagic Fish 42 0 0 194 Bottom Fish 39 0 0 194 Shellfish 422 048 000048 Sum IRtotal 000048 Crabs tissues only average
Cadmium Estimated hazard index = 03
47
HC-Fidalgo Bay
Table C3 Fidalgo Bay chromium intake rate based on Tulalip Tribe seafood consumption rate Anacortes Washington
Overall FishShellfish Consumption Rate gday
Category Percent of Consumption Rate Represented by Category
Site-related concentration of chromium mgkg in tissue
Category Specific Exposure mgkg-day
194 Salmon 497 0 0 194 Pelagic Fish 42 0 0 194 Bottom Fish 39 0 0 194 Shellfish 422 184 000184 Sum IRtotal 000184 Clams tissues only average
Chromium Estimated hazard index = 061
Table C4 Fidalgo Bay dioxin intake rate based on the Tulalip Tribe seafood consumption rate Anacortes Washington
Overall FishShellfish Consumption Rate gday
Category Percent of Consumption Rate Represented by Category
Site-related concentration of dioxin mgkg in tissue
Category Specific Exposure mgkg-day
194 Salmon 497 0 0 194 Pelagic Fish 42 0 0 194 Bottom Fish 39 134E-7 124E-11 194 Shellfish 422 887E-8 888E-11 Sum IRtotal 101E-10 Crabs tissues and clams average
Dioxin Estimated hazard index = 010
Dioxin Estimated cancer risk = 152E-5
48
HC-Fidalgo Bay
Table C5 Fidalgo Bay mercury intake rate based on the Tulalip Tribe seafood consumption rate Anacortes Washington
Overall FishShellfish Consumption Rate gday
Category Percent of Consumption Rate Represented by Category
Site-related concentration of mercury mgkg in tissue
Category Specific Exposure mgkg-day
194 Salmon 497 0 0 194 Pelagic Fish 42 0 0 194 Bottom Fish 39 0042 000000388 194 Shellfish 422 0049 0000049 Sum IRtotal 00000529 Crabs tissues only average
Mercury Estimated hazard index = 053
49
HC-Fidalgo Bay
This section provides calculated exposure doses and assumptions used for exposure to chemicals in seafood at Fidalgo Bay using Suquamish Tribe consumption rates It is based on the EPA Tribal framework for fish and shellfish consumption rates for risk-based decisions
Intake of contaminant in mgkg-day (IR ) = (CF x CR x x UCF ) BW c i PS i 1
[Equation 1] Where IR = Intake rate of contaminant by category of fishshellfish
c
CF = contaminant concentration (mgkg) in the tissue of the particular fish or shellfish category i
CR = the total consumption rate of fish and shellfish harvested from Puget Sound 7668 grams per PS
day = the percentage of the ingestion rate that consists of the category of fish or shellfish unitless
i
BW = body weight 79 kilograms observed from the Suquamish Tribesrsquo study UCF = conversion factor 1 0001 kilograms per gram
1
Estimated cancer risk (ECR) = (IR x ED x EF x CSF) (AT x UCF ) [Equation 2] total 2
Where IR = Total intake of contaminant from site-related fish and shellfish consumption
total
ED = exposure duration 70 years EF = exposure frequency 365 days per year CSF = oral cancer slope factor for contaminant AT = averaging time 70 years for carcinogens UCF = conversion factor 2 (365 daysyear)
2
Estimated hazard index (EHI) = (IR x ED x EF x UCF ) (RfD x AT) [Equation 3] total 2
Where IR = Total intake of contaminant from site-related fish and shellfish consumption
total
ED = exposure duration 70 years EF = exposure frequency 365 days per year RfD = Oral reference dose for contaminant AT = averaging time the same as exposure duration for non-carcinogenic effects UCF = conversion factor 2 (1 yr365 days)
2
50
HC-Fidalgo Bay
Table C6 Fidalgo Bay arsenic intake rate based on Suquamish Tribe seafood consumption rate Anacortes Washington
Overall FishShellfish Consumption Rate gday
Category Percent of Consumption Rate Represented by Category
Site-related concentration of arsenic mgkg in tissue
Category Specific Exposure mgkg-day
7668 Salmon 239 0 0 7668 Pelagic Fish 73 0 0 7668 Bottom Fish 38 015 00000553 7668 Shellfish 65 0049 0000309 Sum IRtotal 0000364 Crabs tissues and clams average
Arsenic Estimated hazard index = 12
Arsenic Estimated cancer risk = 359E-4
Table C7 Fidalgo Bay cadmium intake rate based on Suquamish Tribe seafood consumption rate Anacortes Washington
Overall FishShellfish Consumption Rate gday
Category Percent of Consumption Rate Represented by Category
Site-related concentration of cadmium mgkg in tissue
Category Specific Exposure mgkg-day
7668 Salmon 239 0 0 7668 Pelagic Fish 73 0 0 7668 Bottom Fish 38 0 0 7668 Shellfish 65 048 0003 Sum IRtotal 0003 Crabs tissues only average
Cadmium Estimated hazard index = 3
51
HC-Fidalgo Bay
Table C8 Fidalgo Bay chromium intake rate based on Suquamish Tribe seafood consumption rate Anacortes Washington
Overall FishShellfish Consumption Rate gday
Category Percent of Consumption Rate Represented by Category
Site-related concentration of chromium mgkg in tissue
Category Specific Exposure mgkg-day
7668 Salmon 239 0 0 7668 Pelagic Fish 73 0 0 7668 Bottom Fish 38 0 0 7668 Shellfish 65 184 00116 Sum IRtotal 00116 Clams tissues only average
Chromium Estimated hazard index = 387
Table C9 Fidalgo Bay dioxin intake rate based on Suquamish Tribe seafood consumption rate Anacortes Washington
Overall FishShellfish Consumption Rate gday
Category Percent of Consumption Rate Represented by Category
Site-related concentration of dioxin mgkg in tissue
Category Specific Exposure mgkg-day
7668 Salmon 239 0 0 7668 Pelagic Fish 73 0 0 7668 Bottom Fish 38 134E-7 494E-11 7668 Shellfish 65 887E-8 56E-10 Sum IRtotal 609E-10 Crabs tissues and clams average
Dioxin Estimated hazard index = 061 Dioxin Estimated cancer risk = 914E-5
52
HC-Fidalgo Bay
Table C10 Fidalgo Bay mercury intake rate based on Suquamish Tribe seafood consumption rate Anacortes Washington
Overall FishShellfish Consumption Rate gday
Category Percent of Consumption Rate Represented by Category
Site-related concentration of mercury mgkg in tissue
Category Specific Exposure mgkg-day
7668 Salmon 239 0 0 7668 Pelagic Fish 73 0 0 7668 Bottom Fish 38 0042 00000155 7668 Shellfish 65 0049 0000309 Sum IRtotal 000032 Crabs tissues only average
Mercury Estimated hazard index = 32
53
HC-Fidalgo Bay
Appendix D
Lead exposure shellfish ingestion scenario used in the IEUBK model
This section provides inputs for the IEUBK model The following inputs to the model were used to account for the average shellfish ingestion lead exposure from Fidalgo Bay Anacortes Washington
Consumption rates shellfish general population child ndash 057 gday bottom fish general population child ndash 028 gday
The IEUBK model assumes that a childrsquos total meat intake is 935 gday EPArsquos target cleanup goal is no more than 5 of the community with BLLs above 10 microgdL Default assumptions were used unless noted
Table D1 Blood lead values determined using the IEUBK model for lead in seafood from Fidalgo Bay Anacortes Washington
Seafood Average
Concentration (ppm)
Percent meat intake as shellfish
()
Blood Lead level in percent above 10 ugdl Age range 0 - 84 months
Shellfish 121 061 14
Bottom fish
129 030 13
Average Blood Lead level in percent above 10ugdl Age range 0 - 84 months
135
PPM ndash parts per million Crabs tissues and clams average
54
HC-Fidalgo Bay
The IEUBK model assumes that a childrsquos total meat intake is 935 gday EPArsquos target cleanup goal is no more than 5 of the community with BLLs above 10 microgdL Default assumptions were used unless noted
Percent of consumption rates represented by category were obtained by using the mean because the 90th percentile did not add up to the total intake of seafood However the overall consumption rate was based on the 90th percentile consumers only
Consumption rates Tulalip Tribe child ndash shellfish (58 gday) and bottom fish (014 gday)
Table D2 Fidalgo Bay lead intake rate based on Tulalip Tribe child seafood consumption rate Anacortes Washington
Overall FishShellfish Consumption Rate gday
Category Percent of Consumption
Rate Represented by
Category
Site-related Consumption Rate gday
1107 Salmon 284 0 1107 Pelagic Fish 18 0 1107 Bottom Fish 13 014 1107 Shellfish 523 58
Crabs tissues and clams average
Table D3 Blood lead values determine using the IEUBK model for lead in seafood from Fidalgo Bay Anacortes Washington
Seafood Average
Concentration (ppm)
Percent meat intake as shellfish
()
Blood Lead level in percent above 10ugdl Age range 0 - 84 months
Shellfish 121 62 426
Bottom fish 129 015 125 Average Blood Lead level in percent above 10ugdl Age range 0 - 84 months
276
PPM ndash parts per million Crabs tissues and clams average
55
HC-Fidalgo Bay
The IEUBK model assumes that a childrsquos total meat intake is 935 gday EPArsquos target cleanup goal is no more than 5 of the community with BLLs above 10 microgdL Default assumptions were used unless noted
Percent of consumption rates represented by category were obtained by using the mean because the 90th percentile did not add up to the total intake of seafood However the overall consumption rate was based on the 90th percentile consumers only
Consumption rates Suquamish Tribe child ndash shellfish 2926 gday and bottom fish 108 gday
Table D4 Fidalgo Bay lead intake rate based on Suquamish Tribe child seafood consumption rate Anacortes Washington
Overall FishShellfish Consumption Rate gday
Category Percent of Consumption
Rate Represented by
Category
Site-related Consumption Rate gday
5398 Salmon 183 0 5398 Pelagic Fish 91 0 5398 Other 162 0 5398 Bottom Fish 2 108 5398 Shellfish 542 2926
Crabs tissues and clams average
Table D5 Blood lead values determine using the IEUBK model for lead in seafood from Fidalgo Bay Anacortes Washington
Seafood Average
Concentration (ppm)
Percent meat intake as shellfish
()
Blood Lead level in percent above 10ugdl Age range 0 - 84 months
Shellfish 121 3129 3243
Bottom fish 129 116 163 Average Blood Lead level in percent above 10ugdl Age range 0 - 84 months
1703
PPM ndash parts per million Crabs tissues and clams average
56
HC-Fidalgo Bay
Lead exposure shellfish ingestion scenario used in the Adult lead model
This section provides inputs for the Adult lead model EPArsquos target cleanup goal is no more than 5 of the community with BLLs above 10 microgdL Default assumptions were used unless noted
Table D6 Blood lead values determined using the Adult lead model for lead in seafood from Fidalgo Bay Anacortes Washington
Seafood Average
Concentration (ppm)
Motherrsquos blood lead concentration in ugdl
95th percentile fetal blood lead in ugdl
Shellfish 121 mother 19
fetus 48
Bottom fish 129
mother 15
fetus 46
Average motherrsquos blood lead concentration in ugdl
19
Average 95th percentile fetal blood lead in ugdl
47
PPM ndash parts per million Crabs tissues and clams average
57
HC-Fidalgo Bay
Table D7 Fidalgo Bay lead intake rate based on Tulalip Tribe adult seafood consumption rate Anacortes Washington
Overall FishShellfish Consumption Rate gday
Category Percent of Consumption
Rate Represented by
Category
Site-related Consumption Rate gday
194 Salmon 497 0 194 Pelagic Fish 42 0 194 Bottom Fish 39 757 194 Shellfish 422 8187
Crabs tissues and clams average
Table D8 Blood lead values determined using the Adult lead model for lead in seafood from Fidalgo Bay Anacortes Washington
Seafood Average
Concentration (ppm)
Motherrsquos blood lead concentration in ugdl
95th percentile fetal blood lead in ugdl
Shellfish 121 mother 62
fetus 190
Bottom fish
129 mother 19
fetus 59
Average motherrsquos blood lead concentration in ugdl
41
Average 95th percentile fetal blood lead in ugdl
125
PPM ndash parts per million Crabs tissues and clams average
58
HC-Fidalgo Bay
Table D9 Fidalgo Bay lead intake rate based on the Suquamish Tribe Adult seafood consumption rate Anacortes Washington
Overall FishShellfish Consumption Rate gday
Category Percent of Consumption
Rate Represented by
Category
Site-related Consumption Rate gday
7668 Salmon 239 0 7668 Pelagic Fish 73 0 7668 Bottom Fish 38 2914 7668 Shellfish 65 49842
Crabs tissues and clams average
Table D10 Blood lead values determined using the Adult lead model for lead in seafood from Fidalgo Bay Anacortes Washington
Seafood Average
Concentration (ppm)
Motherrsquos blood lead concentration in ugdl
95th percentile fetal blood lead in ugdl
Shellfish 121 mother 304
fetus 927
Bottom fish 129
mother 33
fetus 100
Average motherrsquos blood lead concentration in ugdl
169
Average 95th percentile fetal blood lead in ugdl
514
PPM ndash parts per million Crabs tissues and clams average
59
HC-Fidalgo Bay
Appendix E
Meal Limit Calculations for contaminants of concern (non-carcinogenic health effects)
Meal limits were calculated for clams crabs and bottom fish based on contaminants of concern in each species Additionally meal limits were calculated based on developmental and immunologic endpoints for dioxin and mercury Meal limits were calculated using the equation below in conjunction with the MRL or RfD as the target risk value and the exposure parameters provided in the Table E1 below The developmental and immunologic endpoints are based on the additive effects of dioxin and mercury as recommended in the ATSDR interaction profile for toxic contaminants found in fish Tables E2 E3 and E4 provides meal limits that would be protective of women and children who eat clams crabs and bottomfish from Fidalgo Bay based on contaminants of concern in each species
ML = [(RfD or MRL)BW DM]C MS ML = recommended fish meal limit per month (mealmonth) RfD = reference dose (EPA) MRL = minimal risk level (ATSDR)
Many factors must be considered when one is recommending limits on the consumption of fish including the health benefits of eating fish the quality and comprehensiveness of environmental data and the availability of alternate sources of nutrition In addition these limits do not consider that multiple species are consumed a consideration that would require weighting of the percent of each species consumed These allowable ingestion rates also do not consider the fact that cooking reduces exposure to some contaminants in fish Therefore allowable consumption limits for prepared fish would be greater than those shown in tables E2 E3 and E4
Table E1 Exposure parameters used to calculate recommended meal limits for clams crabs and bottom fish from Fidalgo Bay in Anacortes Washington
Exposure Parameter RfD Endpoint Units MRL Developmental
RfDMRL Immunological RfDMRL
Average Concentration (C) variable ugkg Arsenic 03
ugkgday Cadmium 1 Chromium 3 Dioxin 0000001 0000001 000002 Mercury 01 01 03 Days per month (DM) 304 304 304 daysmonth Mean Body Weight (BW) 60 60 60 kg Meal size (MS) 0227 0227 0227 kg
60
HC-Fidalgo Bay
Table E2 Calculated meal limits per month for clams from Fidalgo Bay in Anacortes Washington
Contamination Concentration (ppm)
Meals based on RfD MRL
Lowest meals per month (rounded to single digit)
Arsenic 0027 893 13Chromium 184 131
Dioxin 799E-8 1006
Table E3 Calculated meal limits per month for Crabs from Fidalgo Bay in Anacortes Washington
Contamination Concentration (ppm)
Meals based on RfD MRL
Meals based on Developmental additive endpoint
Meals based on Immune additive endpoint
Lowest meals per month (rounded to single digit)
Arsenic 0071 339 14Cadmium 048 167
Dioxin 975E-8 824 137 478 Mercury 0049 164
Table E4 Calculated meal limits per month for Bottom Fish from Fidalgo Bay in Anacortes Washington
Contamination Concentration (ppm)
Meals based on RfD MRL
Meals based on Developmental additive endpoint
Meals based on Immune additive endpoint
Lowest meals per month (rounded to single digit)
Arsenic 015 161 14Dioxin 134E-7 600 145 548
Mercury 0042 191
Applying the Table E2 E3 and E4 meal limits across the general population assumes that meal size will decrease or increase proportionately with body weight Such an assumption could result in underestimating exposure for consumers who eat proportionately more fish per unit of body weight Table E5 demonstrates how an eight-ounce meal for a 70-kilogram adult would change to remain proportional with body weight
61
HC-Fidalgo Bay
Table E5 Adjustment of fish meal size based on the body weight of the consumer
Body Weight Meal Size Pounds Kilograms Ounces Grams
19 9 1 28 39 18 2 57 58 26 3 85 77 35 4 113 96 44 5 142 116 53 6 170 135 61 7 199 154 70 8 227 173 79 9 255 193 88 10 284 212 96 11 312 231 105 12 340 250 113 13 369 270 123 14 397 289 131 15 425 308 140 16 454
62
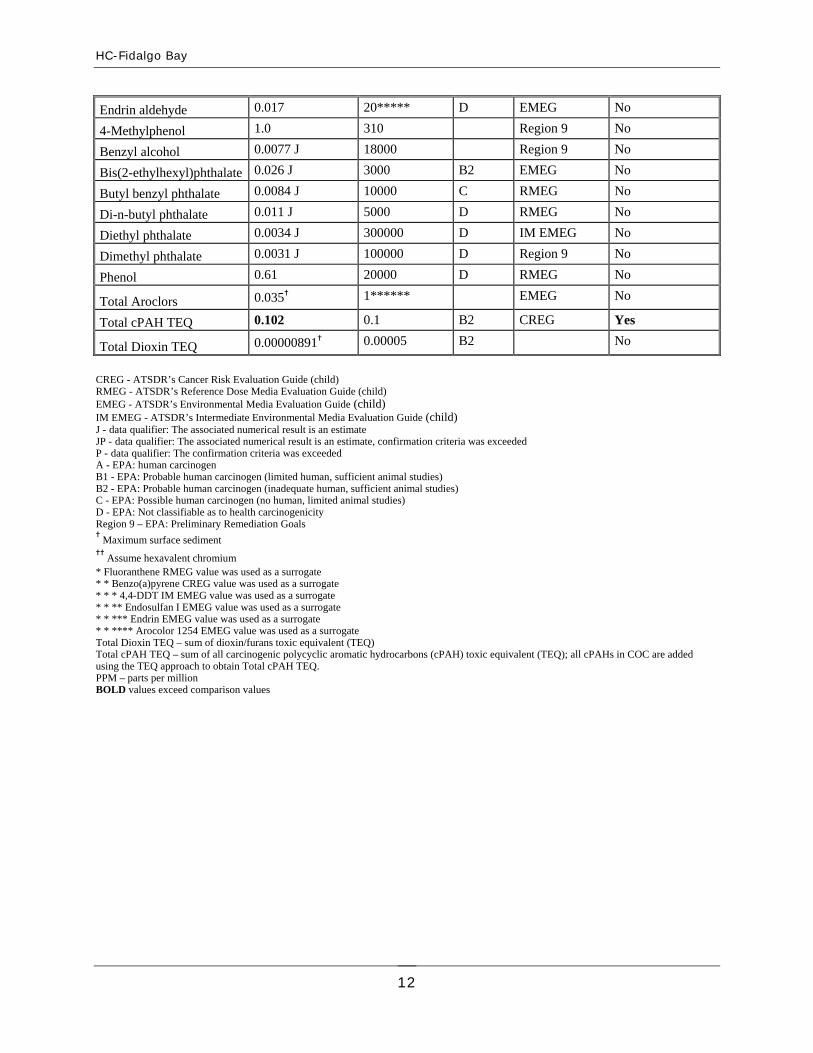
HC-Fidalgo Bay
from non-urban areas be consumed and do not eat the ldquocrab butterrdquo (hepatopancreas) and viscera
Comparison values for contaminants in fish were obtained from EPArsquos Guidance for Assessing Chemical Contaminant Data (subsistence fishers) [8] Bottom fish (English sole and Starry Flounder) shellfish (Bent Nose Horse Macoma and Manila clams) and crabs (Dungeness and Red Rock) were collected and tissue was analyzed for contaminants in these samples (see Tables 2 and 3)
As mentioned above in order for a contaminant to be a health concern it must be present at a high enough concentration to cause potential harm and there must be a completed route of exposure to people People may at times disregard these advisories and consume more fish and crab from Fidalgo Bay In the event of this scenario DOH evaluated bottom fish clams and crab contaminant exposure for the general population and for the Swinomish Tribe and Samish Indian Nation Aspects of EPArsquos Tribal Fish and Shellfish consumption framework were used to set rates (See Appendix C) [9] Horse and Manila clams are targeted shellfish species for human consumption Bent Nose and Macoma clams are not usually targeted shellfish species for human consumption
Appendix B details the methodology and assumptions used by DOH to estimate exposure from eating seafood from Fidalgo Bay For the general adult population average ingestion rates of 175 gday represent the 90th percentile per capita ingestion rates for people of age 18 or older in the United States including people that do and do not consume fish [10] Since there was only data for bottom fish it was assumed that bottom fish was consumed similarly to the tribal rate of about four percent of the total intake of seafood For the general adult population an average shellfish consumption rate of 17 gday was used to calculate exposure doses For the general child population an average fish consumption rate of 028 gday based on bottom fish data only was used The average shellfish consumption rate of 057 gday was used to calculate exposure doses (See Appendix B Table B1)
The tribal consumer scenario was based on the EPA Tribal framework for fish and shellfish consumption rates for risk-based decisions (See Appendix C) [15] The percent of their consumption rate was represented by the category of seafood for both the Tulalip and the Suquamish Tribes [9 11 12]
Benefits of Fish Consumption
It is important to consider the benefits of eating fish Fish are an excellent source of protein and are associated with reduced risk of coronary heart disease The health benefits of eating fish have also been associated with low levels of saturated versus unsaturated fats Saturated fats are linked with increased cholesterol levels and risk of heart disease while unsaturated fats (eg omega-3 polyunsaturated fatty acid) are an essential nutrient Fish also provide a good source of some vitamins and minerals [13 14] The American Heart Association recommends two servings of fish per week as part of a healthy diet [15]
16
HC-Fidalgo Bay
The health benefits of eating fish deserve particular consideration when one is dealing with subsistence consuming populations Removal of fish from the diet of subsistence consumers can have serious health social and economic consequences that must be considered in issuing fish advisories Consumption advisories for subsistence consumers could therefore significantly impact diet Any advice given to fish consumers to reduce the amount of fish they eat based on chemical contamination should attempt to balance the health benefits with the health risks In general people should eat fish low in contaminants and high in omega-3 fatty acid Fish consumption advice should also take into account that eating alternative sources of protein also has risks For instance increasing the consumption rate of beef or pork at the expense of eating fish can increase the risk of heart disease In addition some contaminants that are common in fish such as dioxin might also be present in other meats
The level of contaminant exposure from fish consumption varies with the species of fish whole fish or fillet consumption rate and preparation and cooking process Exposure to contaminants in fish can be significantly reduced through simple preparation measures Simply removing the skin of the fish can reduce PCB exposure [16] Cooking fish using fillets instead of whole fish can reduce PCB levels by more than 20 In some cases PCBs were removed up to 50 through cooking [17 18]
Chemical Specific Toxicity
The following sections are general summaries of COC health effects The public health implications of exposure to these COCs from sediments and tissues are discussed later Copper will not be evaluated since Bent Nose clams are not usually targeted shellfish species for human consumption In addition DOH recommends only Dungeness and Red Rock crab from non-urban areas be consumed and do not eat the ldquocrab butterrdquo (hepatopancreas) and viscera
Arsenic
Arsenic is a naturally occurring element in the earths soil In Washington normal soil background concentrations rarely exceed 20 ppm [19] However the widespread use of arsenic-containing pesticides and the emissions from smelters has resulted in significantly higher levels of arsenic on many properties in the state There are two forms of arsenic - organic and inorganic The EPA-established reference dose (RfD) for arsenic is 00003 mgkgday based on skin color changes and excessive growth of tissue (human data) [20] EPA classifies the inorganic form of arsenic as a human carcinogen DOH will not be using the slope factor of 15 per mgkgday due to the arsenic weight of evidence approach The recent EPA IRIS review draft for the Science Advisory Board presented a slope factor for combined lung and bladder cancer of 57 per mgkgday [21] The slope factor calculated from the work by the National Research Council is about 21 per mgkgday [22] These slope factors could be higher if the combined risk for all arsenic-associated cancers (bladder lung skin kidney liver etc) were evaluated For this or any other health consultation DOH will use a slope factor of 57 per mgkgday which appears to reflect EPAs Review DRAFT assessment
Inorganic arsenic is much more harmful than organic arsenic therefore DOH based health evaluations on the levels of inorganic arsenic present in fish samples Generally inorganic arsenic in fish and shellfish ranged from about 1-20 of total arsenic [20 22 23 24] The US
17
HC-Fidalgo Bay
Food and Drug Administration (FDA) proposed 10 of total arsenic estimated as inorganic arsenic [24] Ecologyrsquos evaluation of shellfish in Puget Sound indicated that less than 1 of total arsenic found was in the inorganic form of arsenic [25] For this health consultation DOH assumed that 1 of the total arsenic detected was inorganic arsenic Therefore 1 of the concentration was used to calculate the estimated dose from exposure to inorganic arsenic in shellfish Similarly Ecologyrsquos evaluation of English Sole fish in Puget Sound indicated that less than 1 of the total arsenic found was in the inorganic form of arsenic [25] However since there was no inorganic arsenic data for Starry Flounder DOH assumed that 10 of the total arsenic detected in bottom fish was inorganic arsenic (see Uncertainty section)
Consuming seafood from Fidalgo Bay could result in an exposure dose of 135 times 10-5 mgkgday (see Appendix B Table B4) for the general public Similarly consuming seafood from Fidalgo Bay could result in exposure doses ranging from 364 times 10-4 to 629 times 10-5 mgkgday (see Appendix C Table C1 and Table C6) for a tribal population Health effects of skin cancer changes in the skin vascular disease and liver enlargement occurred in humans chronically exposed to 14 times 10-2 mgkgday of arsenic in drinking water [20] Therefore DOH does not expect that exposures to arsenic in fish shellfish and crabs will cause harmful non-cancer health effects for the general population The tribal exposure scenario resulted in doses that are slightly above the RfD In addition there is the assumption that all the seafood consumed by the tribal members is from Fidalgo Bay only However DOH does not expect that exposures to arsenic in fish shellfish and crabs will cause harmful non-cancer health effects for tribal consumption population
Cadmium
Cadmium is a naturally occurring element in the earths crust Cadmium is used mainly in batteries pigments metal coatings and metal alloys Cadmium is found in most foods at low levels with the lowest levels found in fruits and the highest found in leafy vegetables and potatoes Shellfish have higher cadmium levels (up to 1 ppm) than other types of fish or meat Cadmium is stored in the liver and kidneys and slowly leaves the body in the urine and feces [26] However high levels of cadmium will cause kidney damage and cause bones to become fragile and break easily Studies of workers exposed to airborne cadmium also suggest a link with prostate cancer The ability of cadmium to cause cancer via the oral route is disputed by many studies The RfD for cadmium that is ingested with food is 0001 mgkgday
Consuming seafood from Fidalgo Bay could result in an exposure dose of 394 times 10-5 mgkgday (see Appendix B Table B4) for the general public Similarly consuming seafood from Fidalgo Bay could result in exposure doses ranging from 30 times 10-3 to 480 times 10-4 mgkgday (see Appendix C Table C2 and Table C7) for a tribal population A NOAEL of 21 times 10-3 mgkgday was established for exposure to cadmium Therefore DOH does not expect that exposures to cadmium in crabs will cause harmful non-cancer health effects for the general population However DOH does expect that exposures to cadmium in crabs will cause harmful non-cancer health effects for tribal consumption population
Chromium
Chromium is a naturally occurring element in the earths soil Chromium is found in three main forms chromium 0 (metal) chromium III (trivalent chromium) and chromium VI (hexavalent
18
HC-Fidalgo Bay
chromium) Chromium metal is used for making steel Chromium III is an essential nutrient required by the body Chromium VI is more easily absorbed and harmful Ingesting large amounts of chromium VI can cause stomach ulcers kidney and liver damage and even death However some ingested chromium VI is converted to chromium III and most will exit the body in feces within a few days and never enter the bloodstream Only about 2 percent of ingested chromium passes through the walls of the intestine and enters the bloodstream [27 28 29] The EPA established RfD for chromium VI is 0003 mgkgday The chromium evaluated here represents total chromium as opposed to chromium VI Dose calculations however do not attempt to fractionate the chromium concentrations DOH is being very conservative in the evaluation of total chromium and considers all chromium to be chromium VI
Consuming seafood from Fidalgo Bay could result in an exposure dose of 151 times 10-4 mgkgday (see Appendix B Table B4) for the general public Similarly consuming seafood from Fidalgo Bay could result in exposure doses ranging from 116 times 10-2 to 184 times 10-3 mgkgday (see Appendix C Table C3 and Table C8) for a tribal population A NOAEL of 25 times 100 mgkgday was established for exposure to chromium (VI) The tribal exposure scenario resulted in doses that exceed the RfD but falls below the actual toxic effect levels However since DOH was very conservative in its evaluation and assumed all chromium in the seafood was chromium IV and 100 percent of the chromium was absorbed In addition there is the assumption that all the seafood consumed by the tribal members is from Fidalgo Bay only Therefore DOH does not expect that exposures to chromium in crabs will cause harmful non-cancer health effects for the general population and tribal consumption population
Dioxins and furans
Dioxins Furans and cPAHs TEQ concentrations
Although several dioxin and furan congeners were analyzed in tissue only a single value called a dioxin toxic equivalent (TEQ) is presented in this health consultation Each dioxinfuran or dioxin-like PCB congener is multiplied by a Toxic Equivalency Factor (TEF) to produce the dioxin TEQ The TEQs for each chemical are then summed to give the overall 2378shytetrachlorodibenzo-p-dioxin TEQ The TEQ approach is based on the premise that many dioxinsfurans and dioxin-like PCB congeners are structurally and toxicologically similar to 2378-tetrachlorodibenzo-p-dioxin TEFs are used to account for the different potency of dioxins and furans relative to 2378-tetrachlorodibenzo-p-dioxin and are available for ten chlorinated dibenzofurans and seven chlorinated dibenzodioxins using the World Health Organization (WHO) methodology [7] A similar TEQ approach is developed for each cPAH based on the relative potency to benzo(a)pyrene
Dioxins and furans (dioxins) consist of about 210 structural variations of dioxin congeners which differ by the number and location of chlorine atoms on the chemical structure The primary sources of dioxin releases to the environment are the combustion of fossil fuels and wood the incineration of municipal medical and hazardous waste and certain pulp and paper processes Dioxins also occur at very low levels from naturally occurring sources and can be found in food water air and cigarette smoke
19
HC-Fidalgo Bay
The most toxic of the dioxin congeners 2378-tetrachlorodibenzo-p-dioxin (TCDD) can cause chloracne (a condition of acne like lesions on the face and neck) Exposure to high levels of dioxins can cause liver damage developmental effects and impaired immune function [30] Long-term exposure to dioxins could increase the likelihood of developing cancer Studies in rats and mice exposed to TCDD resulted in thyroid and liver cancer [31] EPA considers TCDD to be a probable human carcinogen and developed a cancer slope factor of 15x 10
5
mgkgday [32 33]
Consuming seafood from Fidalgo Bay could result in an exposure dose of 196 times 10-11
mgkgday (see Appendix B Table B4) for the general public Similarly consuming seafood from Fidalgo Bay could result in exposure doses ranging from 609 times 10-10 to 101 times 10-10
mgkgday (see Appendix C Table C4 and Table C9) for a tribal population Health effects of altered social behavior have been observed in monkeys exposed to 12 times 10-7 mgkgday of dioxin [30] The tribal exposure scenario resulted in doses that are below the MRL of 1x 10
9
mgkgday Therefore DOH does not expect that exposures to dioxin in fish shellfish and crabs will cause harmful non-cancer health effects for the general population and tribal consumption population
Lead ndash Occurrence Health Concerns and Risks
Lead is a naturally occurring chemical element that is normally found in soil In Washington normal background concentrations rarely exceed 20 ppm [19] However the widespread use of certain products (such as leaded gasoline lead-containing pesticides and lead-based paint) and the emissions from certain industrial operations (such as smelters) has resulted in significantly higher levels of lead in many areas of the state
Elimination of lead in gasoline and solder used in food and beverage cans has greatly reduced exposure to lead Currently the main pathways of lead exposure in children are ingestion of paint chips contaminated soil and house dust and drinking water in homes with old plumbing
Children less than seven years old are particularly vulnerable to the effects of lead Compared to older children and adults they tend to ingest more dust and soil absorb significantly more of the lead they swallow and more of the lead they absorb can enter their developing brain Pregnant women and women of childbearing age should also be aware of lead in their environment because lead ingested by a mother can affect the unborn fetus
Health effects
Exposure to lead can be monitored by measuring the level of lead in the blood In general blood lead rises 3-7 gdl for every 1000 ppm increase in soil or dust concentration [34] For children the Centers for Disease Control and Prevention (CDC) has defined an elevated blood lead level (BLL) as greater than or equal to 10 micrograms of lead per deciliter of blood (gdl) [35] However there is growing evidence that damage to the central nervous system resulting in learning problems can occur at blood lead levels less than 10 gdl About 22 percent of children in the US have blood lead levels greater than 10 gdl
20
HC-Fidalgo Bay
Lead poisoning can affect almost every system of the body and often occurs with no obvious or distinctive symptoms Depending on the amount of exposure a child has lead can cause behavior and learning problems central nervous system damage kidney damage reduced growth hearing impairment and anemia [36]
In adults lead can cause health problems such as high blood pressure kidney damage nerve disorders memory and concentration problems difficulties during pregnancy digestive problems and pain in the muscles and joints [36] These have usually been associated with blood lead levels greater than 30 gdl
Because of chemical similarities to calcium lead can be stored in bone for many years Even after exposure to environmental lead has been reduced lead stored in bone can be released back into the blood where it can have harmful effects Normally this release occurs relatively slowly However certain conditions such as pregnancy lactation menopause and hyperthyroidism can cause more rapid release of the lead which could lead to a significant rise in blood lead level [37]
EPArsquos target cleanup goal is no more than 5 of the community with BLLs above 10 microgdL Consuming seafood from Fidalgo Bay could result in the estimated BLL for the general population 13 to 14 percent above 10 μgdL for a child and 15 to 19 percent above 10 μgdL for an adult with a 95th percentile fetus BLL range of 46 to 48 μgdL (see Appendix D Tables D1 and D6) Consumption of seafood at tribal scenario rates from Fidalgo Bay could result in the estimated BLL 125 to 3243 percent above 10 μgdL for a child and 19 to 304 percent above 10 μgdL for an adult with a 95th percentile fetus BLL range of 59 to 927 μgdL (see Appendix D Tables D3 D5 D8 and D10)
Mercury
Mercury exists in the environment in three forms elemental inorganic and organic Methylmercury is the form of organic mercury related to exposure in fish Methylmercury is formed from inorganic mercury in the environment by microorganisms in aquatic systems In the aquatic food chain methylmercury biomagnifies as it is passed from lower to higher trophic levels through consumption of prey organisms Fish at the top of the food chain can biomagnify methlymercury which represents a potential health concern for consumers of fish
Ingested methlymercury is readily absorbed and complexed with the cysteine amino acid and crosses the blood-brain barrier In Minamata Bay Japan mothers who were exposed to high amounts of mercury but were asymptomatic gave birth to severely affected infants Other epidemiologic studies have shown developmental effects in both animal and human studies are the primary concern about methylmercury exposure The EPA established RfD for mercury is 00001 mgkgday
Mercury evaluated here represents total mercury as opposed to methylmercury Dose calculations however do not attempt to fractionate the mercury concentrations because almost all of the total mercury found in fish is methylmercury
Consuming seafood from Fidalgo Bay could result in an exposure dose of 559 times 10-6 mgkgday (see Appendix B Table B4) for the general public Similarly consuming seafood from Fidalgo
21
HC-Fidalgo Bay
Bay could result in exposure doses ranging from 320 times 10-4 to 529 times 10-5 mgkgday (see Appendix C Table C5 and Table C10) for a tribal population ATSDR has derived a NOAEL of 13 times 10-3 mgkgday for mercury Therefore DOH does not expect that exposures to mercury in fish and crabs will cause harmful non-cancer health effects for the general population The tribal exposure scenario resulted in doses that slightly exceed the RfD but falls below the actual toxic effect levels In addition there is the assumption that all the seafood consumed by the tribal members is from Fidalgo Bay only Therefore DOH does not expect that exposures to mercury in fish and crabs will cause harmful non-cancer health effects for tribal consumption populations
Polycyclic Aromatic Hydrocarbons (PAHs)
Polycyclic aromatic hydrocarbons (PAHs) are generated by the incomplete combustion of organic matter including oil wood and coal They are found in materials such as creosote coal coal tar and used motor oil Based on structural similarities metabolism and toxicity PAHs are often grouped together when one is evaluating their potential for adverse health effects EPA has classified some PAHs ndash called cPAHs ndash as probable human carcinogens (Cancer Class B2) as a result of sufficient evidence of carcinogenicity in animals and inadequate evidence in humans [38]
Benzo(a)pyrene is the only cPAH for which EPA has derived a cancer slope factor The benzo(a)pyrene cancer slope factor was used as a surrogate to estimate the total cancer risk of cPAHs in sediment It should be noted benzo(a)pyrene is considered the most carcinogenic of the cPAHs The use of its cancer slope factor as a surrogate for total cPAH carcinogenicity may overestimate risk To address this issue DOH made an adjustment for each cPAH based on the relative potency to benzo(a)pyrene or TEQ [38]
Dietary sources make up a large percentage of PAH exposure in the US population Smoked or barbecued meats and fish contain relatively high levels of PAHs The majority of dietary exposure to PAHs for the average person comes from ingestion of vegetables and grains (cereals) [39]
Sediment ingestion from Fidalgo Bay could result in lifetime non cancer exposure doses of 360 times 10-7 mgkgday (see Appendix A Table A2) A LOAEL of 10 times 101 mgkgday was established for PAH Therefore DOH does not expect that exposures to PAHs in sediment will cause harmful non-cancer health effects
Evaluating non-cancer hazards
Exposure assumptions for estimating contaminant doses from sediment and tissue exposures are found in Appendices A and B Tables A1 and B1 In order to evaluate the potential for non-cancer adverse health effects that may result from exposure to contaminated media (ie air water soil and sediment) a dose is estimated for each COC These doses are calculated for situations (scenarios) in which a person might be exposed to the contaminated media The estimated dose for each contaminant under each scenario is then compared to EPArsquos oral reference dose (RfD) RfDs are doses below which non-cancer adverse health effects are not expected to occur (considered ldquosaferdquo doses) They are derived from toxic effect levels obtained from human population and laboratory animal studies These toxic effect levels can be either the
22
HC-Fidalgo Bay
lowest-observed adverse effect level (LOAEL) or a no-observed adverse effect level (NOAEL) In human or animal studies the LOAEL is the lowest dose at which an adverse health effect is seen while the NOAEL is the highest dose that does not result in any adverse health effects
Because of data uncertainty the toxic effect level is divided by ldquosafety factorsrdquo to produce the lower and more protective RfD If a dose exceeds the RfD this indicates only the potential for adverse health effects The magnitude of this potential can be inferred from the degree to which this value is exceeded If the estimated exposure dose is only slightly above the RfD then that dose will fall well below the observed toxic effect level The higher the estimated dose is above the RfD the closer it will be to the actual observed toxic effect level This comparison is called a hazard quotient (HQ) and is given by the equation below
HQ = Estimated Dose (mgkg-day) RfD (mgkg-day)
Estimated exposure doses exposure assumptions and hazard quotients are presented in Appendix A for cPAHs found in sediment Based on exposure estimates quantified in Appendix A the general population is not likely to experience adverse non-cancer health effects from exposure to chemical contaminants in Fidalgo Bay since the exposure dose did not exceed the RfD
Similarly estimated exposure doses exposure assumptions and hazard quotients are presented in Appendices B and C for contaminants found in tissue Based on exposure estimates quantified in Appendix B the general population is not likely to experience adverse non-cancer health effects from exposure to chemical contaminants in Fidalgo Bay However the tribal exposure scenario results in doses that exceed the RfD and in some cases these exposures fall below the actual toxic effect levels (see Appendix C)
Evaluating Exposure to Lead
The biokinetics of lead are different from most toxicants because it is stored in bones and remains in the body long after it is ingested Childrenrsquos exposure to lead is evaluated through the use of the Integrated Exposure Uptake Biokinetic Model for Lead in Children (IEUBK) developed by the EPA The IEUBK predicts blood lead levels in a distribution of exposed children based on the amount of lead that is in environmental media (eg fish) [40] It is important to note that the IEUBK model is not expected to accurately predict the blood lead level of a child (or a small group of children) at a specific point in time In part this is because a child (or group of children) may behave differently and therefore have different amounts of exposure to contaminated soil and dust than the average group of children used by the model to calculate blood lead levels For example the model does not take into account reductions in exposure that could result from community education programs Despite this limitation the IEUBK model is a useful tool to help prevent lead poisoning because of the information it can provide about the hazards of environmental lead exposure For children who are regularly exposed to lead-contaminated fish the IEUBK model can estimate the percentage of young children who are likely to have blood lead concentrations that exceed a level that may be associated with health problems (usually 10 gdl)
23
HC-Fidalgo Bay
Average fish lead concentrations and estimated blood lead levels
The IEUBK model was used to estimate the percentage of children that could have elevated blood lead levels if they frequently eat lead contaminated fish Default parameters are used for all model inputs unless stated [40] Exposure was based on a general population and a tribal scenario for children eating shellfish and bottom fish containing an average concentration of lead (see Appendix D)
The adult lead model was used to estimate the 95th percentile Fetal Blood Lead and the average blood lead levels of women who consume lead contaminated seafood Exposure was based on a general population and a tribal scenario for adults eating shellfish and bottom fish containing an average concentration of lead (see Appendix D)
Evaluating Cancer Risk
Some chemicals have the ability to cause cancer Theoretical cancer risk is estimated by calculating a dose similar to that described above and multiplying it by a cancer potency factor also known as the cancer slope factor Some cancer potency factors are derived from human population data Others are derived from laboratory animal studies involving doses much higher than are encountered in the environment Use of animal data requires extrapolation of the cancer potency obtained from these high dose studies down to real-world exposures This process involves much uncertainty
Current regulatory practice assumes there is no ldquosafe doserdquo of a carcinogen Any dose of a carcinogen will result in some additional cancer risk Theoretical cancer risk estimates are therefore not yesno answers but measures of chance (probability) Such measures however uncertain are useful in determining the magnitude of a cancer threat because any level of a carcinogenic contaminant carries an associated risk The validity of the ldquono safe doserdquo assumption for all cancer-causing chemicals is not clear Some evidence suggests that certain chemicals considered to be carcinogenic must exceed a threshold of tolerance before
Theoretical Cancer Riskinitiating cancer For such chemicals risk estimates are not appropriate Recent Theoretical cancer risk estimates do not reach
zero no matter how low the level of exposure guidelines on cancer risk from EPA reflect the to a carcinogen Terms used to describe this
potential that thresholds for some risk are defined below as the number of excess carcinogenesis exist However EPA still cancers expected in a lifetime assumes no threshold unless sufficient data Term of Excess Cancers indicate otherwise [41] moderate is approximately equal to 1 in 1000
low is approximately equal to 1 in 10000 very low is approximately equal to 1 in 100000
This document describes theoretical cancer slight is approximately equal to 1 in 1000000risk that is attributable to site-related insignificant is less than 1 in 1000000
contaminants in qualitative terms like low very low slight and no significant increase in theoretical cancer risk These terms can be better understood by considering the population size required for such an estimate to result in a single cancer case For example a low increase in cancer risk indicates an estimate in the range
24
HC-Fidalgo Bay
of one cancer case per ten thousand persons exposed over a lifetime A very low estimate might result in one cancer case per several tens of thousands exposed over a lifetime and a slight estimate would require an exposed population of several hundreds of thousands to result in a single case DOH considers theoretical cancer risk insignificant when the estimate results in less than one cancer per one million exposed over a lifetime The reader should note that these estimates are for excess cancers that might result in addition to those normally expected in an unexposed population
Cancer is a common illness and its occurrence in a population increases with the age of the population There are many different forms of cancer resulting from a variety of causes not all are fatal Approximately 14 to 13 of people living in the United States will develop cancer at some point in their lives [42]
Theoretical cancer risk estimates for exposure to cPAHs in sediments is considered insignificant (2 cancers estimated per 10000000 exposed) (see Appendix A Table A3) Although exposure to cPAHs may occur the magnitude is likely to be considerably less than the estimated minimum background exposure from sources in food water air sediment and soil Many areas of Fidalgo Bay are already under Ecology Agreed Orders The Orders require an RIFS be conducted to guide the selection of a cleanup remedy
Theoretical cancer risk estimates for exposure to seafood by the general population is very low (2 cancers estimated per 100000 exposed) (see Appendix B Tables B5) This estimate is within EPArsquos acceptable risk for fish consumption However this is based on bottom fish and shellfish data only Theoretical cancer risk estimates for exposure to seafood by Tribal consumers range from low to moderate (4 cancers estimated per 10000 exposed) and moderate to high (2 cancers estimated per 1000 exposed) (see Appendix C)
Multiple Chemical Exposures
A person can be exposed to more than one chemical through more than one pathway Exposure to a chemical through multiple pathways occurs if a contaminant is present in more than one medium (ie air soil surface water groundwater and sediment) For example the dose of a contaminant received from drinking water might be combined with the dose received from contact with the same contaminant in fish
For many chemicals much information is available on how the individual chemical produces effects However it is much more difficult to assess exposure to multiple chemicals Due to the large number of chemicals in the environment it is impossible to measure all of the possible interactions between these chemicals The potential exists for these chemicals to interact in the body and increase or decrease the potential for adverse health effects Individual cancer risk estimates can be added since they are measures of probability However when estimating non-cancer risk similarities must exist between the chemicals if the doses are to be added Groups of chemicals that have similar toxic effects can be added such as volatile organic compounds (VOCs) which cause liver toxicity Polycyclic aromatic hydrocarbons (PAHs) are another group of compounds that can be assessed as one combined dose based on similarities in chemical structure and metabolites
25
HC-Fidalgo Bay
The ATSDR Interaction Profile for persistent chemicals found in fish evaluates the possibility of interactive effects from exposure to a mixture of contaminants including mercury PCBs and dioxins [43]
Uncertainty
Assessment of risks attributable to environmental exposures is filled with many uncertainties Uncertainty with regard to the health assessment process refers to the lack of knowledge about factors such as chemical toxicity human variability human behavior patterns and chemical concentrations in the environment Uncertainty can be reduced through further study
The majority of uncertainty comes from our knowledge of chemical toxicity For most chemicals there is little knowledge of the actual health impacts that can occur in humans from environmental exposures unless epidemiological or clinical evidence exists As a result toxicological experiments are performed on animals These animals are exposed to chemicals at much higher levels than found in the environment The critical doses in animal studies are often extrapolated to real world exposures for use in human health risk assessments In order to be protective of human health uncertainty factors are used to lower that dose in consideration of variability in sensitivity between animals and humans and the variability within humans These uncertainty factors can account for a difference of two to three orders of magnitude when calculating risk Furthermore there are hundreds of chemicals for which little toxicological information is known in animals or humans These chemicals may in fact be toxic at some level but risks to humans cannot be quantified due to uncertainty
The majority of arsenic found in seafood is organic arsenic Inorganic arsenic in fish and shellfish ranged from about 1 to 20 of the total arsenic [20 22 23 24] Ecologyrsquos evaluation of shellfish and English sole in the Puget Sound indicated that less than 1 of the total arsenic found was in the inorganic form of arsenic [25] However since there was no arsenic speciation data for starry flounder DOH assumed that 10 of the total arsenic detected in bottom fish was inorganic arsenic Inorganic arsenic is much more harmful than organic arsenic therefore the arsenic evaluation may be overestimated
The amount of contaminated media (fish water air soil) that people eat drink inhale or absorb through their skin is another source of uncertainty Although recent work has improved our understanding of these exposure factors they are still a source of uncertainty In the case of Fidalgo Bay uncertainty exists with respect to how much fish people eat from Fidalgo Bay how often they are eating it what species they are eating how often children use public access areas and how much sediment or soil children may inadvertently eat Estimates are based on best available information or worst-case scenarios This evaluation is based on the assumption that 100 percent of the type of seafood (bottom fish and shellfish) harvested and consumed was from Fidalgo Bay
Another source of uncertainty is how seafood is actually prepared for consumption and laboratory testing (ie whole fish with guts versus gutless or fillets large clams with skin and gut ball) Bottom fish and clams may contain sediments in their digestive tracts that can affect the concentration of heavy metals during analysis Horse clams are a large clam and may show similar heavy metal patterns to geoduck clams where the skin and gut ball contain the major
26
HC-Fidalgo Bay
portion of heavy metals Bottom fish species should be analyzed without the gut and large clams should be analyzed without skin and without the gut for human health purposes
The amount and type of chemical in contaminated media is another source of uncertainty Environmental samples are very costly so it is not practical or efficient to analyze an adequate number of samples for every existing chemical Instead sampling usually focuses on contaminants that are thought to be present based on historic land use or knowledge of specific chemical spills
Fish Meal Limits
Several contaminants of concern are present in seafood from Fidalgo Bay Meal limits were calculated using the RfDMRL as the target risk value and the exposure parameters provided in Appendix E Table E1
Many factors must be considered when one is recommending limits on the consumption of seafood including the health benefits of eating fish the quality and comprehensiveness of environmental data and the availability of alternate sources of nutrition In addition these limits do not consider that multiple species are consumed a consideration that would require weighting the percent of each species consumed
Childrenrsquos Health Concerns
The potential for exposure and subsequent adverse health effects often increases for younger children compared with older children or adults ATSDR and DOH recognize that children are susceptible to developmental toxicity that can occur at levels much lower than those causing other types of toxicity The following factors contribute to this vulnerability
Children are more likely to play outdoors in contaminated areas by disregarding signs and wandering onto restricted locations
Children often bring food into contaminated areas resulting in hand-to-mouth activities Children are smaller and receive higher doses of contaminant exposures per body
weight Children are shorter than adults therefore they have a higher possibility of breathing in
dust and soil Fetal and child exposure to contaminants can cause permanent damage during critical
growth stages
These unique vulnerabilities of infants and children demand special attention in communities that have contaminated water food soil or air Childrenrsquos health was considered in the writing of this health consultation and the exposure scenarios treated children as the most sensitive population being exposed
27
HC-Fidalgo Bay
Conclusions
Based on the information provided DOH concludes the following
1 DOH concludes that consumption of seafood at tribal scenario rates is expected to harm children and adults health The Swinomish Samish Lummi and the Upper Skagit are tribes or nations that fish in this area or it is in their usual and accustomed fishing rights areas If any of the tribes or nations are using Fidalgo Bay for harvesting and is consuming at tribal scenario rates this would represent a ldquopublic health hazardrdquo The Swinomish Indian Tribal Community has stated ldquoFidalgo Bay historically an important harvest site is now impacted by contamination and thus not used for harvest in recent yearsrdquo [6] It may also be unlikely that 100 of a subsistence consumer (tribes or nations) would be consuming and harvesting from Fidalgo Bay only
2 DOH concludes that consuming bottom fish or shellfish from Fidalgo Bay is not expected to harm the general populationrsquos (children or adults) This area also falls under the Puget Sound Crab Advisory DOH recommends consuming only Dungeness and Red Rock crab from non-urban areas and that ldquocrab butterrdquo and viscera should not be eaten Based on contaminants of concern in bottom fish or shellfish calculated meal limits are 13 clams per month 14 crabs per month and 14 bottom fish per month (see Appendix E Tables E2 E3 and E4) Table E5 shows the adjustment of meal size based on the body weight of the consumer
3 DOH concludes that touching breathing or accidentally eating sediment one-day-pershyweek or 52 days per year from Fidalgo Bay is not expected to harm peoplersquos health The maximum level of carcinogenic polycyclic aromatic hydrocarbons (cPAHs) in this exposure scenario is below levels known to result in non-cancer harmful health effects In addition the exposure scenario does not present an elevated theoretical cancer risk
Recommendations
1 DOH recommends Ecology perform the necessary site remedial investigation and feasibility study (RIFS) as they work through the process of cleaning up Fidalgo Bay Proceeding with the planned cleanup will contribute to a significant reduction in human health risk
2 DOH recommends Ecology perform long-term monitoring of Fidalgo Bay DOH is available to review a monitoring plan and monitoring results
3 DOH recommends following the Puget Sound Recreational Marine Area 7 Fish Consumption Advisory and the Puget Sound crab consumption advisory that states
Eat no more than one meal per week for rockfish and Chinook salmon and no more than one meal per month for resident (blackmouth) Chinook salmon
28
HC-Fidalgo Bay
Eat Dungeness and Red Rock crab from non-urban areas and do not eat the ldquocrab butterrdquo (viscera) More information regarding these advisories is available at httpwwwdohwagovehpoehasfishrma7htm or by calling toll-free 1-877-485shy7316
4 DOH also recommends following the meal limits calculated in Appendix E Eat no more than 13 or 14 eight-ounce meals per month of clams crabs bottom fish (English sole and Starry Flounder) or any combination thereof
General Advice
DOH encourages all Washingtonians to eat at least two fish meals per week as part of a heart healthy diet in accordance with American Heart Association (AHA) recommendations People may eat fish more than two times weekly but such frequent consumers should take the following steps to reduce exposure to contaminants in the fish that they eat
bull Eat a variety of fish that are low in contaminants according to guidance provided on our website at httpwwwdohwagovfish
bull Follow fish advisory advice provided by DOH (website listed below) and local health agencies for water bodies where you fish httpwwwdohwagovehpoehasfishfishadvisorieshtm
bull Young children and small adults should eat proportionally smaller meal sizes bull Grill bake or broil fish so that fat drips off while cooking bull Eat fillets without the skin bull Mercury and other metals are stored in the fillet of the fish and will not be reduced by preparing fish this way
Public Health Action Plan
Actions Planned
1 DOH will coordinate with Ecology to provide an educational materials fact sheet
2 DOH will provide copies of this health consultation to Ecology and concerned parties
3 DOH will be available at Ecologyrsquos planned public meetings in the Fidalgo Bay community
29
HC-Fidalgo Bay
Author
Lenford OrsquoGarro Washington State Department of Health
Office of Environmental Health Assessments Site Assessment Section
Designated Reviewer Dan Alexanian Manager Site Assessment Section
Office of Environmental Health Assessments Washington State Department of Health
ATSDR Technical Project Officer Audra Henry
Cooperative Agreement and Program Evaluation Branch Division of Health Assessment and Consultation
Agency for Toxic Substances and Disease Registry
30
HC-Fidalgo Bay
References
1 SAIC 2007 Fidalgo Bay Sediment Investigation Anacortes WA Sediment Sampling and Analysis Plan Prepared for the Washington State Department of Ecology Prepared by Science Applications International Corporation (SAIC) Bothell WA September 17 2007
2 Fidalgo Bay Causeway feasibility study Request for funding from Department of Ecology Prepared by Samish Indian Nation May 4 2007 httpwwwsamishtribensnusdnrDOE2042007pdf
3 Washington State Department of Natural Resources Fidalgo Bay Environmental Aquatic Reserve management plan Skagit County Washington April 2008 Prepared by Aquatic resources program httpwwwdnrwagovPublicationsaqr_rsve_fid_mgmt_planpdf
4 SAIC 2008 Fidalgo Bay Sediment Investigation Anacortes WA Final Report Prepared for the Washington State Department of Ecology Prepared by Science Applications International Corporation (SAIC) Bothell WA March 31 2008
5 SAIC 2008 Fidalgo Bay Sediment Investigation Anacortes WA Archived Sediment and Tissue Analytical Results Data Report Addendum Prepared for the Washington State Department of Ecology Prepared by Science Applications International Corporation (SAIC) Bothell WA September 2008
6 Swinomish Water Resources Program December 1 2006 Bioaccumulative Toxics in Subsistence-Harvested Shellfish ndash Contaminant Results and Risk Assessment Swinomish Indian Tribal Community La Conner WA
7 Van den Berg M Birnbaum LS Denison M De Vito M Farland W Feeley M Fiedler H Hakansson H Hanberg A Haws L Rose M Safe S Schrenk D Tohyama C Tritscher A Tuomisto J Tysklind M Walker N amp Peterson RE (2006) The 2005 World Health Organization Reevaluation of Human and Mammalian Toxic Equivalency Factors for Dioxins and Dioxin-Like Compounds Toxicol Sci 93 223-241 Available at httptoxscioxfordjournalsorgcgicontentabstract932223
8 US Environmental Protection Agency Guidance for assessing chemical contaminant data for use in fish advisories volume 2 risk assessment and fish consumption limits third edition Office of Water Washington DC EPA 823-B-00-008 2000b
9 United States Environmental Protection Agency Framework for Selecting and Using Tribal Fish and Shellfish Consumption Rates for Risk-Based Decision Making at CERCLA and RCRA Cleanup Sites in Puget Sound and the Strait of Georgia August 2007
10 United States Environmental Protection Agency Estimated Per Capita Fish Consumption in the United States EPA 821-C-02-003 2002
31
HC-Fidalgo Bay
11 Toy KA Polissar NL Liao S and Mittelstaedt GD 1996 A fish consumption survey of the Tulalip and Squaxin Island tribes of the Puget Sound region Tulalip Tribes Department of Environment 7615 Totem Beach Road Marysville WA 98271
12 The Suquamish Tribe 2000 Fish Consumption Survey of the Suquamish Tribe of the Port Madison Indian Reservation Puget Sound Region The Suquamish Tribe 15838 Sandy Hook Road Post Office Box 498 Suquamish WA 98392
13 Alaska Division of Public Health The use of traditional foods in a healthy diet in Alaska risks in perspective 1999 Jan15
14 US Environmental Protection Agency and Toxicology Excellence for Risk Assessment August comparative dietary risks balancing the risks and benefits of fish consumption1999 Aug
15 American Heart Association An eating plan for healthy Americans Available at httpwwwamericanheartorgdietary guidelinesimagesEatPlan2000pdf
16 Hora ME Reduction of polychlorinated biphenyl (PCB) concentrations in carp (Cyprinus carpio) fillets through skin removal Bull Environ Contam Toxicol 1981 Mar 26 (3)364shy6
17 Wilson ND Shear NM Paustenbach DJ Price PS The effect of cooking practices on the concentration of DDT and PCB compounds in the edible tissue of fish J Exp Anal Environ Epidemiol 1998 Jul-Sep 8(3) 423-40
18 Zabik ME Zabik MJ Polychlorinated biphenyls polybrominated biphenyls and dioxin reduction during processingcooking food Adv Exp Med Biol1999459213-31
19 Toxics Cleanup Program Department of Ecology Natural background soil metals concentrations in Washington State Publication No 94-115Olympia Washington State Department of Ecology October 1994
20 Agency for Toxic Substances and Disease Registry (ATSDR) Toxicological profile for arsenic (update) PB2000108021 Atlanta GA US Department of Health and Human Services Public Health Service September 2005
21 US Environmental Protection Agency Toxicological Review of Inorganic Arsenic In support of summary information on the Integrated Risk Information System July 2005 httpwwwepagovwatersciencecriteriaarsenicsabAsDraft_SABpdf
22 NAS 2001b Arsenic in Drinking Water 2001 Update National Academy Press Washington DC 2001 Available at httpbooksnapedubooks0309076293htmlindexhtml
23 Francesconi KA and Edmonds JS 1997 Arsenic and marine organisms Advances in Inorganic Chemistry 44147-189
32
HC-Fidalgo Bay
24 US Food and Drug Administration (FDA) 1993 Guidance document for arsenic in shellfish Department of Health and Human Services Public Health Service Food and Drug Administration Center for Food Safety and Applied Nutrition Washington DC January 1993 Available at httpwwwfoodsafetygov~frfguid-ashtml
25 Washington State Department of Ecology Environmental Assessment Program Inorganic arsenic levels in Puget Sound fish and shellfish from 303(d) listed water bodies and other areas Prepared by Art Johnson and Morgan Roose Publication No 02-03-057 Olympia Washington State Department of Ecology December 2002
26 US Department of Health and Human Services Agency for Toxic Substances and Disease Registry Toxicological profile for Cadmium (update) PB99166621 Atlanta US Department of Health and Human Services July 1999
27 Anderson RA Polansky MM Bryden NA Patterson KY Veillon C Glinsmann WH 1983 Effects of chromium supplementation on urinary Cr excretion of human subjects and correlation of Cr excretion with selected clinical parameters J Nutr 113276ndash81 Cited in Agency for Toxic Substances and Disease Registry 2000 Toxicological profile for chromium Atlanta US Department of Health and Human Services September 2000 Available at httpwwwatsdrcdcgovtoxprofilestp7html
28 Anderson RA 1986 Chromium metabolism and its role in disease processes in man Clin Physiol Biochem 431ndash41 Cited in Agency for Toxic Substances and Disease Registry 2000 Toxicological profile for chromium Atlanta US Department of Health and Human Services September 2000 Available at httpwwwatsdrcdcgovtoxprofilestp7html
29 Donaldson RM Barreras RF 1966 Intestinal absorption of trace quantities of chromium J Lab Clin Med 68484ndash493 Cited in Agency for Toxic Substances and Disease Registry 2000 Toxicological profile for chromium Atlanta US Department of Health and Human Services September 2000 Available at httpwwwatsdrcdcgovtoxprofilestp7html
30 Agency for Toxic Substances and Disease Registry Toxicological profile for chlorinated dibenzo-p-dioxins (update) Draft for public comment Atlanta US Department of Health and Human Services 2000
31 National Toxicology Program Carcinogenesis bioassay of 2378- tetrachlorodibenzo-pshydioxin in Swiss-Webster mice (gavage study) Carcinogenesis Testing Program National Cancer Institute National Institute of Health National Toxicology Program Bethesda MD DHHS publication no 82-1765 1982
32 United States Environmental Protection Agency Health assessment document for polychlorinated dibenzo-p-dioxins Washington DC US Environmental Protection Agency Office of Health and Environmental Assessment EPA report no 6008-84014 1985
33
HC-Fidalgo Bay
33 United States Environmental Protection Agency Report on the peer review of the dioxin reassessment documents toxicity equivalency factors for dioxin and related compounds (Chapter 9) and integrated risk characterization document Alexandria VA National Center for Environmental Assessment 2000
34 Agency for Toxic Substances and Disease Registry (ATSDR) Analysis Paper Impact of Lead-Contaminated Soil on Public Health US Department of Health and Human Services Public Health Service Atlanta Georgia May 1992
35 CDC Preventing lead poisoning in young children a statement by the Centers for Disease Control October 1991 Atlanta Georgia US Department of Health and Human Services Public Health Service CDC 1991
36 US Department of Health and Human Services Agency for Toxic Substances and Disease Registry Toxicological profile for Lead (update) PB99166704 Atlanta US Department of Health and Human Services July 1999
37 Agency for Toxic Substances and Disease Registry (ATSDR) Lead Toxicity (Case studies in environmental medicine Course) SS3059 Atlanta US Department of Health and Human Services Public Health Service October 2000
38 US Department of Health and Human Services Agency for Toxic Substances and Disease Registry Toxicological Profile for Polycyclic Aromatic Hydrocarbons (PAHs) (update) PB95264370 Atlanta US Department of Health and Human Services August 1995
39 Phillips D H Polycyclic Aromatic Hydrocarbons in the diet Mutation Research 1999 (443) 139-147
40 US Environmental Protection Agency Technical Review Workgroup for Lead Userrsquos Guide for the Integrated Exposure Uptake Biokinetic Model for Lead in Children (IEUBK) Windows version 10 OSWER Directive No92857-42 Document No EPA 540-K-01-005 Washington DC May 2002
41 US Environmental Protection Agency Guidelines for Carcinogen Risk Assessment (Review Draft) NCEA-F-0644 July 1999 Available at httpwwwepagovNCEArafcancerhtm
42 ATSDR Agency for Toxic Substances and Disease Registry ATSDR Fact Sheet Cancer Updated August 30 2002 Atlanta US Department of Health and Human Services Available at httpwwwatsdrcdcgovCOMcancer-fshtml
43 Agency for Toxic Substances and Disease Registry (ATSDR) Interaction Profile for persistent chemicals found in fish US Department of Health and Human Services Public Health Service May 2004
34
HC-Fidalgo Bay
44 National Center for Environmental Assessment Exposure Factors Handbook Volume 1 ndash General Factors EPA600P-95002Fa US Environmental Protection Agency August 1997
35
HC-Fidalgo Bay
Figure 1 Demographic statistics within three miles of the site - Fidalgo Bay Skagit County
Total Population 11704 White 10818 Black 33 American Indian Eskimo Aleut 143 Asian or Pacific Islander 211 Other Race 176 Hispanic Origin 386 Children Aged 6 and Younger 943 Adults Aged 65 and Older 2310 Females Aged 15 - 44 2088 Total Aged over 18 8900 Total Aged under 18 2804 Total Housing Units 5295
Calculated using the area proportion technique Source 2000 US CENSUS
36
HC-Fidalgo Bay
Figure 2 Red box indicates the Fidalgo Bay site location Skagit County Washington
37
HC-Fidalgo Bay
Figure 3 Ecologyrsquos sediment and biota sample areas within Fidalgo Bay Skagit County Washington
38
HC-Fidalgo Bay
Appendix A This section provides calculated exposure doses and assumptions used for exposure to chemicals in sediments at the Fidalgo Bay site Three different exposure scenarios were developed to model exposures that might occur These scenarios were devised to represent exposures to a child (0-5 yrs) an older child and an adult The following exposure parameters and dose equations were used to estimate exposure doses from direct contact with chemicals in sediments
Exposure to chemicals in soil via ingestion inhalation and dermal absorption
Total dose (non-cancer) = Ingested dose + inhaled dose + dermally absorbed dose
Ingestion Route
Dose(non-cancer (mgkg-day) = C x CF x IR x EF x ED BW x ATnon-cancer
Cancer Risk = C x CF x IR x EF x CPF x ED BW x ATcancer
Dermal Route
Dermal Transfer (DT) = C x AF x ABS x AD x CF ORAF
Dose(non-cancer (mgkg-day) = DT x SA x EF x ED BW x ATnon-cancer
Cancer Risk = DT x SA x EF x CPF x ED BW x ATcancer
Inhalation Route
Dosenon-cancer (mgkg-day) = C x SMF x IHR x EF x ED x 1PEF BW x ATnon-cancer
Cancer Risk = C x SMF x IHR x EF x ED x CPF x 1PEF BW x ATcancer
39
HC-Fidalgo Bay
Table A1 Exposure assumptions used to estimate cPAHs doses from direct contact with sediments in Fidalgo Bay Anacortes WA
Parameter Value Unit Comments Concentration (C) Variable mgkg Maximum detected value
Conversion Factor (CF) 0000001 kgmg Converts contaminant concentration from milligrams (mg) to kilograms (kg)
Ingestion Rate (IR) ndash adult 100 mgday Exposure Factors Handbook [44] Ingestion Rate (IR) ndash older child 100
Ingestion Rate (IR) - child 200 Exposure Frequency (EF) 52 Daysyear One days a week
Exposure Duration (Ed) 30 (5 1015) years Number of years at one residence (child older child adult yrs)
Body Weight (BW) - adult 72 kg
Adult mean body weight Body Weight (BW) ndash older child 41 Older child mean body weight Body Weight (BW) - child 15 0-5 year-old child average body weight Surface area (SA) - adult 5700
cm2 Exposure Factors Handbook Surface area (SA) ndash older child 2900 Surface area (SA) - child 2900 Averaging Timenon-cancer (AT) 1825 days 5 years Averaging Timecancer (AT) 27375 days 75 years Cancer Potency Factor (CPF) 73 mgkg-day-1 Source EPA 24 hr absorption factor (ABS) 013 unitless Source EPA (Chemical Specific) PAH Oral route adjustment factor (ORAF) 1 unitless Non-cancer (nc) cancer (c) - default Adherence duration (AD) 1 days Source EPA
Adherence factor (AF) 02
mgcm2 Child older child 007 Adult
Inhalation rate (IHR) - adult 152 m3day Exposure Factors Handbook [44] Inhalation rate (IHR) ndash older child 14
Inhalation rate (IHR) - child 83 Soil matrix factor (SMF) 1 unitless Non-cancer (nc) cancer (c) - default Particulate emission factor (PEF) 145E+7 m3kg Model Parameters
40
HC-Fidalgo Bay
Fidalgo Bay Sediment Exposure Route ndash Non-cancer
Table A2 Non-cancer hazard calculations resulting from exposure to cPAHs in sediments from Fidalgo Bay Anacortes WA
Contaminant
TEQ Concentra
tion (ppm)
(mgkg)
Scenarios
Estimated Dose (mgkgday)
Total Dose LOAEL
(mgkgday)
Total Dose LOAELIncidental
Ingestion of Soil
Dermal Contact
with Soil
Inhalation of Particulates
Child 194E-7 730E-8 134E-11 267E-7 000000003
cPAH 0102 Older Child 354E-8 267E-8 828E-12 622E-8 10E+1 0000000006
Adult 202E-8 105E-8 512E-12 307E-8 0000000003
Fidalgo Bay Sediment Exposure Route ndash Cancer
Table A3 Cancer hazard calculations resulting from exposure to cPAHs sediments from Fidalgo Bay Anacortes WA
Contaminant Concentra tion (ppm)
EPA cancer Group
Cancer Potency Factor
(mgkg-day-1)
Scenarios
Increased Cancer Risk Total
Cancer RiskIncidental
Ingestion of Soil
Dermal Contact
with Soil
Inhalation of Particulates
Child 943E-8 355E-8 653E-12 130E-7
Total cPAH TEQ 0102 B2 73 Older Child 345E-8 260E-8 806E-12 605E-8
Adult 295E-8 153E-8 747E-12 448E-8
Lifetime cancer risk 130E-7 + 605E-8 + 448E-8 = 235E-7
41
HC-Fidalgo Bay
Appendix B
This section provides calculated exposure doses and exposure assumptions used for chemicals in bottom fish shellfish and crab samples taken from Fidalgo Bay These exposure scenarios were developed to model exposures that might occur and were devised to represent exposures to the general population The following exposure parameters and dose equations were used to estimate exposure doses from ingestion of contaminants in bottom fish and shellfish
Ingestion Route
Dose(non-cancer (mgkg-day) = C x CF1 x IR x CF2 x EF x ED BW x ATnon-cancer
Cancer Risk = C x CF1 x IR x CF2 x EF x CPF x ED BW x ATcancer
Table B1 Exposure assumptions used in exposure evaluation of contaminants in bottom fish shellfish and crab samples taken from Fidalgo Bay in Anacortes Washington
Parameter Value Unit Comments Concentration (C) Variable ugkg Average detected value
Conversion Factor (CF1) 0001 mgkg Converts contaminant concentration from milligrams (mg) to kilograms (kg)
Conversion Factor (CF2) 0001 kgg Converts mass of shellfish from grams (g) to kilograms (kg)
Ingestion Rate (IR) 057
gday
Body weight-adjusted shellfish consumption rates to account for children eating nearly 16 times as much fish per body weight as do adults (see table B2)
Ingestion Rate (IR) 028 Average general population child ndash bottom fish (see table B3)
Ingestion Rate (IR) 081 Body weight-adjusted shellfish consumption rates to account for an older child eating 081 times as much fish per body weight as do adults (see table B2)
Ingestion Rate (IR) 036 Average general population older child ndash bottom fish (see table B3)
Ingestion Rate (IR) 17 Average general population adult - shellfish
Ingestion Rate (IR) 07 Average general population adult ndash bottom fish (see table B3)
Exposure Frequency (EF) 365 Daysyear Assumes daily exposure
Exposure Duration (ED) 6 years
Number of years at one residence (child) Exposure Duration (ED) 30 Number of years at one residence (adult) Body weight (BW) 15
kg Mean body weight child
Body weight (BW) 70 Mean body weight adult Averaging Timenon-cancer (AT) Variable days Equal to Exposure Duration Averaging Timecancer (AT) 25550 days 70 years Cancer Potency Factor (CPF) Variable mgkg-day-1 Source EPA ndash Chemical specific
42
HC-Fidalgo Bay
Table B2 Derivation of a childrsquos shellfish consumption rate for the general US population
Row Parameter Adult Older Child (6-17 yrs)
Child (0-6 yrs)
1 Reported All Fish Consumption Rate-gram fish per kg bodyweight per day (gkgday)
0277 0225 0433
2 Ratio to Adult All Fish Consumption Rate
1 081 16
3 Reported Shellfish Consumption (gday)
170 (average) Not Reported Not Reported
4 Average Body Weight (kg) 70 41 15 5 Ratio to Adult BW 1 059 021 6 Adjusted Shellfish Consumption Rates
(gday) = Row 2 x Row 3 x Row 5
170 (average) 081 (average) 057 (average)
Table B3 Derivation of bottom consumption rate for the general US population based on four percent of total fish intake
Row Parameter Adult Older Child (6-17 yrs)
Child (0-6 yrs)
1 Reported All Fish Consumption Rateshy(gday)
175 90 70
2 Assume bottom fish intake rate similar to tribal at about 4 percent [15]
004 004 004
3 Adjusted bottom fish rates (gday) = Row 1 x Row 2
070 036 028
43
HC-Fidalgo Bay
Table B4 Exposure dose and non-cancer risk from ingesting seafood at the average concentrations of contaminants in bottom fish clams and crab samples taken from Fidalgo Bay in Anacortes Washington
Species Contaminant Average Concentration
(ppm)
Estimated Dose (mgkgday)
General population Average
MRL or RfD (mgkgday)
Hazard quotient
General population Average
Clams
Arsenic
0027 Child 103E-6
300E-4
0003 Older child 533E-7 0002
Adult 656E-7 0002
Crabs 0071 Child 270E-6 0009
Older child 140E-6 0005 Adult 172E-6 0006
Bottom Fish 015 Child 260E-6 0009
Older child 132E-6 0004 Adult 150E-6 0005
Crabs Cadmium 048 Child 182E-5
100E-3 0018
Older child 948E-6 0009 Adult 117E-5 0012
Clams Chromium 184 Child 699E-5
300E-3 0023
Older child 364E-5 0012 Adult 447E-5 0015
Clams
Dioxin
799E-8 Child 304E-12
10E-9
0003 Older child 158E-12 00016
Adult 194E-12 00019
Crabs 975E-8 Child 371E-12 00037
Older child 193E-12 00019 Adult 237E-12 00024
Bottom Fish 134E-7 Child 250E-12 0003
Older child 118E-12 00012 Adult 134E-12 00013
Crabs
Mercury
0049 Child 186E-6
100E-4
0019 Older child 968E-7 00097
Adult 119E-6 0012
Bottom Fish 0042 Child 784E-7 0008
Older child 369E-7 00037 Adult 420E-7 00042
PPM ndash parts per million
44
HC-Fidalgo Bay
Table B5 Cancer risk from ingesting seafood at the average concentrations of contaminants in bottom fish clams and crab samples taken from Fidalgo Bay in Anacortes Washington
Species Contaminant Average Concentration
(ppm)
Cancer Potency Factor
(mgkg-day-1)
Increased Cancer Risk
General population Average
Total Cancer Risk General population
Average
Clams
Arsenic
0027
57
Child 501E-7
153E-5
Older child 434E-7 Adult 160E-6
Crabs 0071 Child 132E-6
Older child 114E-6 Adult 421E-6
Bottom Fish 015 Child 137E-6
Older child 107E-6 Adult 366E-6
Clams
Dioxin
799E-8
15E+5
Child 390E-8
582E-7
Older child 338E-8 Adult 125E-7
Crabs 975E-8 Child 476E-8
Older child 413E-8 Adult 152E-7
Bottom Fish 134E-7 Child 322E-8
Older child 252E-8 Adult 861E-8
Sum of cancer risk 159E-5
45
HC-Fidalgo Bay
Appendix C This section provides calculated exposure doses and assumptions used for exposure to chemicals in seafood at the Fidalgo Bay site using Tulalip Tribe consumption rates It is based on the EPA Tribal framework for fish and shellfish consumption rates for risk-based decisions
Intake of contaminant in mgkg-day (IR ) = (CF x CR x x UCF ) BW c i PS i 1
[Equation 1] Where IR = Intake rate of contaminant by category of fishshellfish
c
CF = contaminant concentration (mgkg) in the tissue of the particular fish or shellfish category i
CR = the total consumption rate of fish and shellfish harvested from Puget Sound 194 grams per PS
day = the percentage of the ingestion rate that consists of the category of fish or shellfish unitless
i
BW = body weight 818 kilograms observed from the Tulalip Tribesrsquo study UCF = conversion factor 1 0001 kilograms per gram
1
Estimated cancer risk (ECR) = (IR x ED x EF x CSF) (AT x UCF ) [Equation 2] total 2
Where IR = Total intake of contaminant from site-related fish and shellfish consumption
total
ED = exposure duration 70 years EF = exposure frequency 365 days per year CSF = oral cancer slope factor for contaminant AT = averaging time 70 years for carcinogens UCF = conversion factor 2 (365 daysyear)
2
Estimated hazard index (EHI) = (IR x ED x EF x UCF ) (RfD x AT) [Equation 3] total 2
Where IR = Total intake of contaminant from site-related fish and shellfish consumption
total
ED = exposure duration 70 years EF = exposure frequency 365 days per year RfD = Oral reference dose for contaminant AT = averaging time the same as exposure duration for non-carcinogenic effects UCF = conversion factor 2 (1 yr365 days)
2
46
HC-Fidalgo Bay
Table C1 Fidalgo Bay arsenic intake rate based on the Tulalip Tribe seafood consumption rate Anacortes Washington
Overall FishShellfish Consumption Rate gday
Category Percent of Consumption Rate Represented by Category
Site-related concentration of arsenic mgkg in tissue
Category Specific Exposure mgkg-day
194 Salmon 497 0 0 194 Pelagic Fish 42 0 0 194 Bottom Fish 39 015 00000139 194 Shellfish 422 0049 00000490 Sum IRtotal 00000629 Crabs tissues and clams average
Arsenic Estimated hazard index = 021
Arsenic Estimated cancer risk = 21E-3
Table C2 Fidalgo Bay cadmium intake rate based on the Tulalip Tribe seafood consumption rate Anacortes Washington
Overall FishShellfish Consumption Rate gday
Category Percent of Consumption Rate Represented by Category
Site-related concentration of cadmium mgkg in tissue
Category Specific Exposure mgkg-day
194 Salmon 497 0 0 194 Pelagic Fish 42 0 0 194 Bottom Fish 39 0 0 194 Shellfish 422 048 000048 Sum IRtotal 000048 Crabs tissues only average
Cadmium Estimated hazard index = 03
47
HC-Fidalgo Bay
Table C3 Fidalgo Bay chromium intake rate based on Tulalip Tribe seafood consumption rate Anacortes Washington
Overall FishShellfish Consumption Rate gday
Category Percent of Consumption Rate Represented by Category
Site-related concentration of chromium mgkg in tissue
Category Specific Exposure mgkg-day
194 Salmon 497 0 0 194 Pelagic Fish 42 0 0 194 Bottom Fish 39 0 0 194 Shellfish 422 184 000184 Sum IRtotal 000184 Clams tissues only average
Chromium Estimated hazard index = 061
Table C4 Fidalgo Bay dioxin intake rate based on the Tulalip Tribe seafood consumption rate Anacortes Washington
Overall FishShellfish Consumption Rate gday
Category Percent of Consumption Rate Represented by Category
Site-related concentration of dioxin mgkg in tissue
Category Specific Exposure mgkg-day
194 Salmon 497 0 0 194 Pelagic Fish 42 0 0 194 Bottom Fish 39 134E-7 124E-11 194 Shellfish 422 887E-8 888E-11 Sum IRtotal 101E-10 Crabs tissues and clams average
Dioxin Estimated hazard index = 010
Dioxin Estimated cancer risk = 152E-5
48
HC-Fidalgo Bay
Table C5 Fidalgo Bay mercury intake rate based on the Tulalip Tribe seafood consumption rate Anacortes Washington
Overall FishShellfish Consumption Rate gday
Category Percent of Consumption Rate Represented by Category
Site-related concentration of mercury mgkg in tissue
Category Specific Exposure mgkg-day
194 Salmon 497 0 0 194 Pelagic Fish 42 0 0 194 Bottom Fish 39 0042 000000388 194 Shellfish 422 0049 0000049 Sum IRtotal 00000529 Crabs tissues only average
Mercury Estimated hazard index = 053
49
HC-Fidalgo Bay
This section provides calculated exposure doses and assumptions used for exposure to chemicals in seafood at Fidalgo Bay using Suquamish Tribe consumption rates It is based on the EPA Tribal framework for fish and shellfish consumption rates for risk-based decisions
Intake of contaminant in mgkg-day (IR ) = (CF x CR x x UCF ) BW c i PS i 1
[Equation 1] Where IR = Intake rate of contaminant by category of fishshellfish
c
CF = contaminant concentration (mgkg) in the tissue of the particular fish or shellfish category i
CR = the total consumption rate of fish and shellfish harvested from Puget Sound 7668 grams per PS
day = the percentage of the ingestion rate that consists of the category of fish or shellfish unitless
i
BW = body weight 79 kilograms observed from the Suquamish Tribesrsquo study UCF = conversion factor 1 0001 kilograms per gram
1
Estimated cancer risk (ECR) = (IR x ED x EF x CSF) (AT x UCF ) [Equation 2] total 2
Where IR = Total intake of contaminant from site-related fish and shellfish consumption
total
ED = exposure duration 70 years EF = exposure frequency 365 days per year CSF = oral cancer slope factor for contaminant AT = averaging time 70 years for carcinogens UCF = conversion factor 2 (365 daysyear)
2
Estimated hazard index (EHI) = (IR x ED x EF x UCF ) (RfD x AT) [Equation 3] total 2
Where IR = Total intake of contaminant from site-related fish and shellfish consumption
total
ED = exposure duration 70 years EF = exposure frequency 365 days per year RfD = Oral reference dose for contaminant AT = averaging time the same as exposure duration for non-carcinogenic effects UCF = conversion factor 2 (1 yr365 days)
2
50
HC-Fidalgo Bay
Table C6 Fidalgo Bay arsenic intake rate based on Suquamish Tribe seafood consumption rate Anacortes Washington
Overall FishShellfish Consumption Rate gday
Category Percent of Consumption Rate Represented by Category
Site-related concentration of arsenic mgkg in tissue
Category Specific Exposure mgkg-day
7668 Salmon 239 0 0 7668 Pelagic Fish 73 0 0 7668 Bottom Fish 38 015 00000553 7668 Shellfish 65 0049 0000309 Sum IRtotal 0000364 Crabs tissues and clams average
Arsenic Estimated hazard index = 12
Arsenic Estimated cancer risk = 359E-4
Table C7 Fidalgo Bay cadmium intake rate based on Suquamish Tribe seafood consumption rate Anacortes Washington
Overall FishShellfish Consumption Rate gday
Category Percent of Consumption Rate Represented by Category
Site-related concentration of cadmium mgkg in tissue
Category Specific Exposure mgkg-day
7668 Salmon 239 0 0 7668 Pelagic Fish 73 0 0 7668 Bottom Fish 38 0 0 7668 Shellfish 65 048 0003 Sum IRtotal 0003 Crabs tissues only average
Cadmium Estimated hazard index = 3
51
HC-Fidalgo Bay
Table C8 Fidalgo Bay chromium intake rate based on Suquamish Tribe seafood consumption rate Anacortes Washington
Overall FishShellfish Consumption Rate gday
Category Percent of Consumption Rate Represented by Category
Site-related concentration of chromium mgkg in tissue
Category Specific Exposure mgkg-day
7668 Salmon 239 0 0 7668 Pelagic Fish 73 0 0 7668 Bottom Fish 38 0 0 7668 Shellfish 65 184 00116 Sum IRtotal 00116 Clams tissues only average
Chromium Estimated hazard index = 387
Table C9 Fidalgo Bay dioxin intake rate based on Suquamish Tribe seafood consumption rate Anacortes Washington
Overall FishShellfish Consumption Rate gday
Category Percent of Consumption Rate Represented by Category
Site-related concentration of dioxin mgkg in tissue
Category Specific Exposure mgkg-day
7668 Salmon 239 0 0 7668 Pelagic Fish 73 0 0 7668 Bottom Fish 38 134E-7 494E-11 7668 Shellfish 65 887E-8 56E-10 Sum IRtotal 609E-10 Crabs tissues and clams average
Dioxin Estimated hazard index = 061 Dioxin Estimated cancer risk = 914E-5
52
HC-Fidalgo Bay
Table C10 Fidalgo Bay mercury intake rate based on Suquamish Tribe seafood consumption rate Anacortes Washington
Overall FishShellfish Consumption Rate gday
Category Percent of Consumption Rate Represented by Category
Site-related concentration of mercury mgkg in tissue
Category Specific Exposure mgkg-day
7668 Salmon 239 0 0 7668 Pelagic Fish 73 0 0 7668 Bottom Fish 38 0042 00000155 7668 Shellfish 65 0049 0000309 Sum IRtotal 000032 Crabs tissues only average
Mercury Estimated hazard index = 32
53
HC-Fidalgo Bay
Appendix D
Lead exposure shellfish ingestion scenario used in the IEUBK model
This section provides inputs for the IEUBK model The following inputs to the model were used to account for the average shellfish ingestion lead exposure from Fidalgo Bay Anacortes Washington
Consumption rates shellfish general population child ndash 057 gday bottom fish general population child ndash 028 gday
The IEUBK model assumes that a childrsquos total meat intake is 935 gday EPArsquos target cleanup goal is no more than 5 of the community with BLLs above 10 microgdL Default assumptions were used unless noted
Table D1 Blood lead values determined using the IEUBK model for lead in seafood from Fidalgo Bay Anacortes Washington
Seafood Average
Concentration (ppm)
Percent meat intake as shellfish
()
Blood Lead level in percent above 10 ugdl Age range 0 - 84 months
Shellfish 121 061 14
Bottom fish
129 030 13
Average Blood Lead level in percent above 10ugdl Age range 0 - 84 months
135
PPM ndash parts per million Crabs tissues and clams average
54
HC-Fidalgo Bay
The IEUBK model assumes that a childrsquos total meat intake is 935 gday EPArsquos target cleanup goal is no more than 5 of the community with BLLs above 10 microgdL Default assumptions were used unless noted
Percent of consumption rates represented by category were obtained by using the mean because the 90th percentile did not add up to the total intake of seafood However the overall consumption rate was based on the 90th percentile consumers only
Consumption rates Tulalip Tribe child ndash shellfish (58 gday) and bottom fish (014 gday)
Table D2 Fidalgo Bay lead intake rate based on Tulalip Tribe child seafood consumption rate Anacortes Washington
Overall FishShellfish Consumption Rate gday
Category Percent of Consumption
Rate Represented by
Category
Site-related Consumption Rate gday
1107 Salmon 284 0 1107 Pelagic Fish 18 0 1107 Bottom Fish 13 014 1107 Shellfish 523 58
Crabs tissues and clams average
Table D3 Blood lead values determine using the IEUBK model for lead in seafood from Fidalgo Bay Anacortes Washington
Seafood Average
Concentration (ppm)
Percent meat intake as shellfish
()
Blood Lead level in percent above 10ugdl Age range 0 - 84 months
Shellfish 121 62 426
Bottom fish 129 015 125 Average Blood Lead level in percent above 10ugdl Age range 0 - 84 months
276
PPM ndash parts per million Crabs tissues and clams average
55
HC-Fidalgo Bay
The IEUBK model assumes that a childrsquos total meat intake is 935 gday EPArsquos target cleanup goal is no more than 5 of the community with BLLs above 10 microgdL Default assumptions were used unless noted
Percent of consumption rates represented by category were obtained by using the mean because the 90th percentile did not add up to the total intake of seafood However the overall consumption rate was based on the 90th percentile consumers only
Consumption rates Suquamish Tribe child ndash shellfish 2926 gday and bottom fish 108 gday
Table D4 Fidalgo Bay lead intake rate based on Suquamish Tribe child seafood consumption rate Anacortes Washington
Overall FishShellfish Consumption Rate gday
Category Percent of Consumption
Rate Represented by
Category
Site-related Consumption Rate gday
5398 Salmon 183 0 5398 Pelagic Fish 91 0 5398 Other 162 0 5398 Bottom Fish 2 108 5398 Shellfish 542 2926
Crabs tissues and clams average
Table D5 Blood lead values determine using the IEUBK model for lead in seafood from Fidalgo Bay Anacortes Washington
Seafood Average
Concentration (ppm)
Percent meat intake as shellfish
()
Blood Lead level in percent above 10ugdl Age range 0 - 84 months
Shellfish 121 3129 3243
Bottom fish 129 116 163 Average Blood Lead level in percent above 10ugdl Age range 0 - 84 months
1703
PPM ndash parts per million Crabs tissues and clams average
56
HC-Fidalgo Bay
Lead exposure shellfish ingestion scenario used in the Adult lead model
This section provides inputs for the Adult lead model EPArsquos target cleanup goal is no more than 5 of the community with BLLs above 10 microgdL Default assumptions were used unless noted
Table D6 Blood lead values determined using the Adult lead model for lead in seafood from Fidalgo Bay Anacortes Washington
Seafood Average
Concentration (ppm)
Motherrsquos blood lead concentration in ugdl
95th percentile fetal blood lead in ugdl
Shellfish 121 mother 19
fetus 48
Bottom fish 129
mother 15
fetus 46
Average motherrsquos blood lead concentration in ugdl
19
Average 95th percentile fetal blood lead in ugdl
47
PPM ndash parts per million Crabs tissues and clams average
57
HC-Fidalgo Bay
Table D7 Fidalgo Bay lead intake rate based on Tulalip Tribe adult seafood consumption rate Anacortes Washington
Overall FishShellfish Consumption Rate gday
Category Percent of Consumption
Rate Represented by
Category
Site-related Consumption Rate gday
194 Salmon 497 0 194 Pelagic Fish 42 0 194 Bottom Fish 39 757 194 Shellfish 422 8187
Crabs tissues and clams average
Table D8 Blood lead values determined using the Adult lead model for lead in seafood from Fidalgo Bay Anacortes Washington
Seafood Average
Concentration (ppm)
Motherrsquos blood lead concentration in ugdl
95th percentile fetal blood lead in ugdl
Shellfish 121 mother 62
fetus 190
Bottom fish
129 mother 19
fetus 59
Average motherrsquos blood lead concentration in ugdl
41
Average 95th percentile fetal blood lead in ugdl
125
PPM ndash parts per million Crabs tissues and clams average
58
HC-Fidalgo Bay
Table D9 Fidalgo Bay lead intake rate based on the Suquamish Tribe Adult seafood consumption rate Anacortes Washington
Overall FishShellfish Consumption Rate gday
Category Percent of Consumption
Rate Represented by
Category
Site-related Consumption Rate gday
7668 Salmon 239 0 7668 Pelagic Fish 73 0 7668 Bottom Fish 38 2914 7668 Shellfish 65 49842
Crabs tissues and clams average
Table D10 Blood lead values determined using the Adult lead model for lead in seafood from Fidalgo Bay Anacortes Washington
Seafood Average
Concentration (ppm)
Motherrsquos blood lead concentration in ugdl
95th percentile fetal blood lead in ugdl
Shellfish 121 mother 304
fetus 927
Bottom fish 129
mother 33
fetus 100
Average motherrsquos blood lead concentration in ugdl
169
Average 95th percentile fetal blood lead in ugdl
514
PPM ndash parts per million Crabs tissues and clams average
59
HC-Fidalgo Bay
Appendix E
Meal Limit Calculations for contaminants of concern (non-carcinogenic health effects)
Meal limits were calculated for clams crabs and bottom fish based on contaminants of concern in each species Additionally meal limits were calculated based on developmental and immunologic endpoints for dioxin and mercury Meal limits were calculated using the equation below in conjunction with the MRL or RfD as the target risk value and the exposure parameters provided in the Table E1 below The developmental and immunologic endpoints are based on the additive effects of dioxin and mercury as recommended in the ATSDR interaction profile for toxic contaminants found in fish Tables E2 E3 and E4 provides meal limits that would be protective of women and children who eat clams crabs and bottomfish from Fidalgo Bay based on contaminants of concern in each species
ML = [(RfD or MRL)BW DM]C MS ML = recommended fish meal limit per month (mealmonth) RfD = reference dose (EPA) MRL = minimal risk level (ATSDR)
Many factors must be considered when one is recommending limits on the consumption of fish including the health benefits of eating fish the quality and comprehensiveness of environmental data and the availability of alternate sources of nutrition In addition these limits do not consider that multiple species are consumed a consideration that would require weighting of the percent of each species consumed These allowable ingestion rates also do not consider the fact that cooking reduces exposure to some contaminants in fish Therefore allowable consumption limits for prepared fish would be greater than those shown in tables E2 E3 and E4
Table E1 Exposure parameters used to calculate recommended meal limits for clams crabs and bottom fish from Fidalgo Bay in Anacortes Washington
Exposure Parameter RfD Endpoint Units MRL Developmental
RfDMRL Immunological RfDMRL
Average Concentration (C) variable ugkg Arsenic 03
ugkgday Cadmium 1 Chromium 3 Dioxin 0000001 0000001 000002 Mercury 01 01 03 Days per month (DM) 304 304 304 daysmonth Mean Body Weight (BW) 60 60 60 kg Meal size (MS) 0227 0227 0227 kg
60
HC-Fidalgo Bay
Table E2 Calculated meal limits per month for clams from Fidalgo Bay in Anacortes Washington
Contamination Concentration (ppm)
Meals based on RfD MRL
Lowest meals per month (rounded to single digit)
Arsenic 0027 893 13Chromium 184 131
Dioxin 799E-8 1006
Table E3 Calculated meal limits per month for Crabs from Fidalgo Bay in Anacortes Washington
Contamination Concentration (ppm)
Meals based on RfD MRL
Meals based on Developmental additive endpoint
Meals based on Immune additive endpoint
Lowest meals per month (rounded to single digit)
Arsenic 0071 339 14Cadmium 048 167
Dioxin 975E-8 824 137 478 Mercury 0049 164
Table E4 Calculated meal limits per month for Bottom Fish from Fidalgo Bay in Anacortes Washington
Contamination Concentration (ppm)
Meals based on RfD MRL
Meals based on Developmental additive endpoint
Meals based on Immune additive endpoint
Lowest meals per month (rounded to single digit)
Arsenic 015 161 14Dioxin 134E-7 600 145 548
Mercury 0042 191
Applying the Table E2 E3 and E4 meal limits across the general population assumes that meal size will decrease or increase proportionately with body weight Such an assumption could result in underestimating exposure for consumers who eat proportionately more fish per unit of body weight Table E5 demonstrates how an eight-ounce meal for a 70-kilogram adult would change to remain proportional with body weight
61
HC-Fidalgo Bay
Table E5 Adjustment of fish meal size based on the body weight of the consumer
Body Weight Meal Size Pounds Kilograms Ounces Grams
19 9 1 28 39 18 2 57 58 26 3 85 77 35 4 113 96 44 5 142 116 53 6 170 135 61 7 199 154 70 8 227 173 79 9 255 193 88 10 284 212 96 11 312 231 105 12 340 250 113 13 369 270 123 14 397 289 131 15 425 308 140 16 454
62
HC-Fidalgo Bay
The health benefits of eating fish deserve particular consideration when one is dealing with subsistence consuming populations Removal of fish from the diet of subsistence consumers can have serious health social and economic consequences that must be considered in issuing fish advisories Consumption advisories for subsistence consumers could therefore significantly impact diet Any advice given to fish consumers to reduce the amount of fish they eat based on chemical contamination should attempt to balance the health benefits with the health risks In general people should eat fish low in contaminants and high in omega-3 fatty acid Fish consumption advice should also take into account that eating alternative sources of protein also has risks For instance increasing the consumption rate of beef or pork at the expense of eating fish can increase the risk of heart disease In addition some contaminants that are common in fish such as dioxin might also be present in other meats
The level of contaminant exposure from fish consumption varies with the species of fish whole fish or fillet consumption rate and preparation and cooking process Exposure to contaminants in fish can be significantly reduced through simple preparation measures Simply removing the skin of the fish can reduce PCB exposure [16] Cooking fish using fillets instead of whole fish can reduce PCB levels by more than 20 In some cases PCBs were removed up to 50 through cooking [17 18]
Chemical Specific Toxicity
The following sections are general summaries of COC health effects The public health implications of exposure to these COCs from sediments and tissues are discussed later Copper will not be evaluated since Bent Nose clams are not usually targeted shellfish species for human consumption In addition DOH recommends only Dungeness and Red Rock crab from non-urban areas be consumed and do not eat the ldquocrab butterrdquo (hepatopancreas) and viscera
Arsenic
Arsenic is a naturally occurring element in the earths soil In Washington normal soil background concentrations rarely exceed 20 ppm [19] However the widespread use of arsenic-containing pesticides and the emissions from smelters has resulted in significantly higher levels of arsenic on many properties in the state There are two forms of arsenic - organic and inorganic The EPA-established reference dose (RfD) for arsenic is 00003 mgkgday based on skin color changes and excessive growth of tissue (human data) [20] EPA classifies the inorganic form of arsenic as a human carcinogen DOH will not be using the slope factor of 15 per mgkgday due to the arsenic weight of evidence approach The recent EPA IRIS review draft for the Science Advisory Board presented a slope factor for combined lung and bladder cancer of 57 per mgkgday [21] The slope factor calculated from the work by the National Research Council is about 21 per mgkgday [22] These slope factors could be higher if the combined risk for all arsenic-associated cancers (bladder lung skin kidney liver etc) were evaluated For this or any other health consultation DOH will use a slope factor of 57 per mgkgday which appears to reflect EPAs Review DRAFT assessment
Inorganic arsenic is much more harmful than organic arsenic therefore DOH based health evaluations on the levels of inorganic arsenic present in fish samples Generally inorganic arsenic in fish and shellfish ranged from about 1-20 of total arsenic [20 22 23 24] The US
17
HC-Fidalgo Bay
Food and Drug Administration (FDA) proposed 10 of total arsenic estimated as inorganic arsenic [24] Ecologyrsquos evaluation of shellfish in Puget Sound indicated that less than 1 of total arsenic found was in the inorganic form of arsenic [25] For this health consultation DOH assumed that 1 of the total arsenic detected was inorganic arsenic Therefore 1 of the concentration was used to calculate the estimated dose from exposure to inorganic arsenic in shellfish Similarly Ecologyrsquos evaluation of English Sole fish in Puget Sound indicated that less than 1 of the total arsenic found was in the inorganic form of arsenic [25] However since there was no inorganic arsenic data for Starry Flounder DOH assumed that 10 of the total arsenic detected in bottom fish was inorganic arsenic (see Uncertainty section)
Consuming seafood from Fidalgo Bay could result in an exposure dose of 135 times 10-5 mgkgday (see Appendix B Table B4) for the general public Similarly consuming seafood from Fidalgo Bay could result in exposure doses ranging from 364 times 10-4 to 629 times 10-5 mgkgday (see Appendix C Table C1 and Table C6) for a tribal population Health effects of skin cancer changes in the skin vascular disease and liver enlargement occurred in humans chronically exposed to 14 times 10-2 mgkgday of arsenic in drinking water [20] Therefore DOH does not expect that exposures to arsenic in fish shellfish and crabs will cause harmful non-cancer health effects for the general population The tribal exposure scenario resulted in doses that are slightly above the RfD In addition there is the assumption that all the seafood consumed by the tribal members is from Fidalgo Bay only However DOH does not expect that exposures to arsenic in fish shellfish and crabs will cause harmful non-cancer health effects for tribal consumption population
Cadmium
Cadmium is a naturally occurring element in the earths crust Cadmium is used mainly in batteries pigments metal coatings and metal alloys Cadmium is found in most foods at low levels with the lowest levels found in fruits and the highest found in leafy vegetables and potatoes Shellfish have higher cadmium levels (up to 1 ppm) than other types of fish or meat Cadmium is stored in the liver and kidneys and slowly leaves the body in the urine and feces [26] However high levels of cadmium will cause kidney damage and cause bones to become fragile and break easily Studies of workers exposed to airborne cadmium also suggest a link with prostate cancer The ability of cadmium to cause cancer via the oral route is disputed by many studies The RfD for cadmium that is ingested with food is 0001 mgkgday
Consuming seafood from Fidalgo Bay could result in an exposure dose of 394 times 10-5 mgkgday (see Appendix B Table B4) for the general public Similarly consuming seafood from Fidalgo Bay could result in exposure doses ranging from 30 times 10-3 to 480 times 10-4 mgkgday (see Appendix C Table C2 and Table C7) for a tribal population A NOAEL of 21 times 10-3 mgkgday was established for exposure to cadmium Therefore DOH does not expect that exposures to cadmium in crabs will cause harmful non-cancer health effects for the general population However DOH does expect that exposures to cadmium in crabs will cause harmful non-cancer health effects for tribal consumption population
Chromium
Chromium is a naturally occurring element in the earths soil Chromium is found in three main forms chromium 0 (metal) chromium III (trivalent chromium) and chromium VI (hexavalent
18
HC-Fidalgo Bay
chromium) Chromium metal is used for making steel Chromium III is an essential nutrient required by the body Chromium VI is more easily absorbed and harmful Ingesting large amounts of chromium VI can cause stomach ulcers kidney and liver damage and even death However some ingested chromium VI is converted to chromium III and most will exit the body in feces within a few days and never enter the bloodstream Only about 2 percent of ingested chromium passes through the walls of the intestine and enters the bloodstream [27 28 29] The EPA established RfD for chromium VI is 0003 mgkgday The chromium evaluated here represents total chromium as opposed to chromium VI Dose calculations however do not attempt to fractionate the chromium concentrations DOH is being very conservative in the evaluation of total chromium and considers all chromium to be chromium VI
Consuming seafood from Fidalgo Bay could result in an exposure dose of 151 times 10-4 mgkgday (see Appendix B Table B4) for the general public Similarly consuming seafood from Fidalgo Bay could result in exposure doses ranging from 116 times 10-2 to 184 times 10-3 mgkgday (see Appendix C Table C3 and Table C8) for a tribal population A NOAEL of 25 times 100 mgkgday was established for exposure to chromium (VI) The tribal exposure scenario resulted in doses that exceed the RfD but falls below the actual toxic effect levels However since DOH was very conservative in its evaluation and assumed all chromium in the seafood was chromium IV and 100 percent of the chromium was absorbed In addition there is the assumption that all the seafood consumed by the tribal members is from Fidalgo Bay only Therefore DOH does not expect that exposures to chromium in crabs will cause harmful non-cancer health effects for the general population and tribal consumption population
Dioxins and furans
Dioxins Furans and cPAHs TEQ concentrations
Although several dioxin and furan congeners were analyzed in tissue only a single value called a dioxin toxic equivalent (TEQ) is presented in this health consultation Each dioxinfuran or dioxin-like PCB congener is multiplied by a Toxic Equivalency Factor (TEF) to produce the dioxin TEQ The TEQs for each chemical are then summed to give the overall 2378shytetrachlorodibenzo-p-dioxin TEQ The TEQ approach is based on the premise that many dioxinsfurans and dioxin-like PCB congeners are structurally and toxicologically similar to 2378-tetrachlorodibenzo-p-dioxin TEFs are used to account for the different potency of dioxins and furans relative to 2378-tetrachlorodibenzo-p-dioxin and are available for ten chlorinated dibenzofurans and seven chlorinated dibenzodioxins using the World Health Organization (WHO) methodology [7] A similar TEQ approach is developed for each cPAH based on the relative potency to benzo(a)pyrene
Dioxins and furans (dioxins) consist of about 210 structural variations of dioxin congeners which differ by the number and location of chlorine atoms on the chemical structure The primary sources of dioxin releases to the environment are the combustion of fossil fuels and wood the incineration of municipal medical and hazardous waste and certain pulp and paper processes Dioxins also occur at very low levels from naturally occurring sources and can be found in food water air and cigarette smoke
19
HC-Fidalgo Bay
The most toxic of the dioxin congeners 2378-tetrachlorodibenzo-p-dioxin (TCDD) can cause chloracne (a condition of acne like lesions on the face and neck) Exposure to high levels of dioxins can cause liver damage developmental effects and impaired immune function [30] Long-term exposure to dioxins could increase the likelihood of developing cancer Studies in rats and mice exposed to TCDD resulted in thyroid and liver cancer [31] EPA considers TCDD to be a probable human carcinogen and developed a cancer slope factor of 15x 10
5
mgkgday [32 33]
Consuming seafood from Fidalgo Bay could result in an exposure dose of 196 times 10-11
mgkgday (see Appendix B Table B4) for the general public Similarly consuming seafood from Fidalgo Bay could result in exposure doses ranging from 609 times 10-10 to 101 times 10-10
mgkgday (see Appendix C Table C4 and Table C9) for a tribal population Health effects of altered social behavior have been observed in monkeys exposed to 12 times 10-7 mgkgday of dioxin [30] The tribal exposure scenario resulted in doses that are below the MRL of 1x 10
9
mgkgday Therefore DOH does not expect that exposures to dioxin in fish shellfish and crabs will cause harmful non-cancer health effects for the general population and tribal consumption population
Lead ndash Occurrence Health Concerns and Risks
Lead is a naturally occurring chemical element that is normally found in soil In Washington normal background concentrations rarely exceed 20 ppm [19] However the widespread use of certain products (such as leaded gasoline lead-containing pesticides and lead-based paint) and the emissions from certain industrial operations (such as smelters) has resulted in significantly higher levels of lead in many areas of the state
Elimination of lead in gasoline and solder used in food and beverage cans has greatly reduced exposure to lead Currently the main pathways of lead exposure in children are ingestion of paint chips contaminated soil and house dust and drinking water in homes with old plumbing
Children less than seven years old are particularly vulnerable to the effects of lead Compared to older children and adults they tend to ingest more dust and soil absorb significantly more of the lead they swallow and more of the lead they absorb can enter their developing brain Pregnant women and women of childbearing age should also be aware of lead in their environment because lead ingested by a mother can affect the unborn fetus
Health effects
Exposure to lead can be monitored by measuring the level of lead in the blood In general blood lead rises 3-7 gdl for every 1000 ppm increase in soil or dust concentration [34] For children the Centers for Disease Control and Prevention (CDC) has defined an elevated blood lead level (BLL) as greater than or equal to 10 micrograms of lead per deciliter of blood (gdl) [35] However there is growing evidence that damage to the central nervous system resulting in learning problems can occur at blood lead levels less than 10 gdl About 22 percent of children in the US have blood lead levels greater than 10 gdl
20
HC-Fidalgo Bay
Lead poisoning can affect almost every system of the body and often occurs with no obvious or distinctive symptoms Depending on the amount of exposure a child has lead can cause behavior and learning problems central nervous system damage kidney damage reduced growth hearing impairment and anemia [36]
In adults lead can cause health problems such as high blood pressure kidney damage nerve disorders memory and concentration problems difficulties during pregnancy digestive problems and pain in the muscles and joints [36] These have usually been associated with blood lead levels greater than 30 gdl
Because of chemical similarities to calcium lead can be stored in bone for many years Even after exposure to environmental lead has been reduced lead stored in bone can be released back into the blood where it can have harmful effects Normally this release occurs relatively slowly However certain conditions such as pregnancy lactation menopause and hyperthyroidism can cause more rapid release of the lead which could lead to a significant rise in blood lead level [37]
EPArsquos target cleanup goal is no more than 5 of the community with BLLs above 10 microgdL Consuming seafood from Fidalgo Bay could result in the estimated BLL for the general population 13 to 14 percent above 10 μgdL for a child and 15 to 19 percent above 10 μgdL for an adult with a 95th percentile fetus BLL range of 46 to 48 μgdL (see Appendix D Tables D1 and D6) Consumption of seafood at tribal scenario rates from Fidalgo Bay could result in the estimated BLL 125 to 3243 percent above 10 μgdL for a child and 19 to 304 percent above 10 μgdL for an adult with a 95th percentile fetus BLL range of 59 to 927 μgdL (see Appendix D Tables D3 D5 D8 and D10)
Mercury
Mercury exists in the environment in three forms elemental inorganic and organic Methylmercury is the form of organic mercury related to exposure in fish Methylmercury is formed from inorganic mercury in the environment by microorganisms in aquatic systems In the aquatic food chain methylmercury biomagnifies as it is passed from lower to higher trophic levels through consumption of prey organisms Fish at the top of the food chain can biomagnify methlymercury which represents a potential health concern for consumers of fish
Ingested methlymercury is readily absorbed and complexed with the cysteine amino acid and crosses the blood-brain barrier In Minamata Bay Japan mothers who were exposed to high amounts of mercury but were asymptomatic gave birth to severely affected infants Other epidemiologic studies have shown developmental effects in both animal and human studies are the primary concern about methylmercury exposure The EPA established RfD for mercury is 00001 mgkgday
Mercury evaluated here represents total mercury as opposed to methylmercury Dose calculations however do not attempt to fractionate the mercury concentrations because almost all of the total mercury found in fish is methylmercury
Consuming seafood from Fidalgo Bay could result in an exposure dose of 559 times 10-6 mgkgday (see Appendix B Table B4) for the general public Similarly consuming seafood from Fidalgo
21
HC-Fidalgo Bay
Bay could result in exposure doses ranging from 320 times 10-4 to 529 times 10-5 mgkgday (see Appendix C Table C5 and Table C10) for a tribal population ATSDR has derived a NOAEL of 13 times 10-3 mgkgday for mercury Therefore DOH does not expect that exposures to mercury in fish and crabs will cause harmful non-cancer health effects for the general population The tribal exposure scenario resulted in doses that slightly exceed the RfD but falls below the actual toxic effect levels In addition there is the assumption that all the seafood consumed by the tribal members is from Fidalgo Bay only Therefore DOH does not expect that exposures to mercury in fish and crabs will cause harmful non-cancer health effects for tribal consumption populations
Polycyclic Aromatic Hydrocarbons (PAHs)
Polycyclic aromatic hydrocarbons (PAHs) are generated by the incomplete combustion of organic matter including oil wood and coal They are found in materials such as creosote coal coal tar and used motor oil Based on structural similarities metabolism and toxicity PAHs are often grouped together when one is evaluating their potential for adverse health effects EPA has classified some PAHs ndash called cPAHs ndash as probable human carcinogens (Cancer Class B2) as a result of sufficient evidence of carcinogenicity in animals and inadequate evidence in humans [38]
Benzo(a)pyrene is the only cPAH for which EPA has derived a cancer slope factor The benzo(a)pyrene cancer slope factor was used as a surrogate to estimate the total cancer risk of cPAHs in sediment It should be noted benzo(a)pyrene is considered the most carcinogenic of the cPAHs The use of its cancer slope factor as a surrogate for total cPAH carcinogenicity may overestimate risk To address this issue DOH made an adjustment for each cPAH based on the relative potency to benzo(a)pyrene or TEQ [38]
Dietary sources make up a large percentage of PAH exposure in the US population Smoked or barbecued meats and fish contain relatively high levels of PAHs The majority of dietary exposure to PAHs for the average person comes from ingestion of vegetables and grains (cereals) [39]
Sediment ingestion from Fidalgo Bay could result in lifetime non cancer exposure doses of 360 times 10-7 mgkgday (see Appendix A Table A2) A LOAEL of 10 times 101 mgkgday was established for PAH Therefore DOH does not expect that exposures to PAHs in sediment will cause harmful non-cancer health effects
Evaluating non-cancer hazards
Exposure assumptions for estimating contaminant doses from sediment and tissue exposures are found in Appendices A and B Tables A1 and B1 In order to evaluate the potential for non-cancer adverse health effects that may result from exposure to contaminated media (ie air water soil and sediment) a dose is estimated for each COC These doses are calculated for situations (scenarios) in which a person might be exposed to the contaminated media The estimated dose for each contaminant under each scenario is then compared to EPArsquos oral reference dose (RfD) RfDs are doses below which non-cancer adverse health effects are not expected to occur (considered ldquosaferdquo doses) They are derived from toxic effect levels obtained from human population and laboratory animal studies These toxic effect levels can be either the
22
HC-Fidalgo Bay
lowest-observed adverse effect level (LOAEL) or a no-observed adverse effect level (NOAEL) In human or animal studies the LOAEL is the lowest dose at which an adverse health effect is seen while the NOAEL is the highest dose that does not result in any adverse health effects
Because of data uncertainty the toxic effect level is divided by ldquosafety factorsrdquo to produce the lower and more protective RfD If a dose exceeds the RfD this indicates only the potential for adverse health effects The magnitude of this potential can be inferred from the degree to which this value is exceeded If the estimated exposure dose is only slightly above the RfD then that dose will fall well below the observed toxic effect level The higher the estimated dose is above the RfD the closer it will be to the actual observed toxic effect level This comparison is called a hazard quotient (HQ) and is given by the equation below
HQ = Estimated Dose (mgkg-day) RfD (mgkg-day)
Estimated exposure doses exposure assumptions and hazard quotients are presented in Appendix A for cPAHs found in sediment Based on exposure estimates quantified in Appendix A the general population is not likely to experience adverse non-cancer health effects from exposure to chemical contaminants in Fidalgo Bay since the exposure dose did not exceed the RfD
Similarly estimated exposure doses exposure assumptions and hazard quotients are presented in Appendices B and C for contaminants found in tissue Based on exposure estimates quantified in Appendix B the general population is not likely to experience adverse non-cancer health effects from exposure to chemical contaminants in Fidalgo Bay However the tribal exposure scenario results in doses that exceed the RfD and in some cases these exposures fall below the actual toxic effect levels (see Appendix C)
Evaluating Exposure to Lead
The biokinetics of lead are different from most toxicants because it is stored in bones and remains in the body long after it is ingested Childrenrsquos exposure to lead is evaluated through the use of the Integrated Exposure Uptake Biokinetic Model for Lead in Children (IEUBK) developed by the EPA The IEUBK predicts blood lead levels in a distribution of exposed children based on the amount of lead that is in environmental media (eg fish) [40] It is important to note that the IEUBK model is not expected to accurately predict the blood lead level of a child (or a small group of children) at a specific point in time In part this is because a child (or group of children) may behave differently and therefore have different amounts of exposure to contaminated soil and dust than the average group of children used by the model to calculate blood lead levels For example the model does not take into account reductions in exposure that could result from community education programs Despite this limitation the IEUBK model is a useful tool to help prevent lead poisoning because of the information it can provide about the hazards of environmental lead exposure For children who are regularly exposed to lead-contaminated fish the IEUBK model can estimate the percentage of young children who are likely to have blood lead concentrations that exceed a level that may be associated with health problems (usually 10 gdl)
23
HC-Fidalgo Bay
Average fish lead concentrations and estimated blood lead levels
The IEUBK model was used to estimate the percentage of children that could have elevated blood lead levels if they frequently eat lead contaminated fish Default parameters are used for all model inputs unless stated [40] Exposure was based on a general population and a tribal scenario for children eating shellfish and bottom fish containing an average concentration of lead (see Appendix D)
The adult lead model was used to estimate the 95th percentile Fetal Blood Lead and the average blood lead levels of women who consume lead contaminated seafood Exposure was based on a general population and a tribal scenario for adults eating shellfish and bottom fish containing an average concentration of lead (see Appendix D)
Evaluating Cancer Risk
Some chemicals have the ability to cause cancer Theoretical cancer risk is estimated by calculating a dose similar to that described above and multiplying it by a cancer potency factor also known as the cancer slope factor Some cancer potency factors are derived from human population data Others are derived from laboratory animal studies involving doses much higher than are encountered in the environment Use of animal data requires extrapolation of the cancer potency obtained from these high dose studies down to real-world exposures This process involves much uncertainty
Current regulatory practice assumes there is no ldquosafe doserdquo of a carcinogen Any dose of a carcinogen will result in some additional cancer risk Theoretical cancer risk estimates are therefore not yesno answers but measures of chance (probability) Such measures however uncertain are useful in determining the magnitude of a cancer threat because any level of a carcinogenic contaminant carries an associated risk The validity of the ldquono safe doserdquo assumption for all cancer-causing chemicals is not clear Some evidence suggests that certain chemicals considered to be carcinogenic must exceed a threshold of tolerance before
Theoretical Cancer Riskinitiating cancer For such chemicals risk estimates are not appropriate Recent Theoretical cancer risk estimates do not reach
zero no matter how low the level of exposure guidelines on cancer risk from EPA reflect the to a carcinogen Terms used to describe this
potential that thresholds for some risk are defined below as the number of excess carcinogenesis exist However EPA still cancers expected in a lifetime assumes no threshold unless sufficient data Term of Excess Cancers indicate otherwise [41] moderate is approximately equal to 1 in 1000
low is approximately equal to 1 in 10000 very low is approximately equal to 1 in 100000
This document describes theoretical cancer slight is approximately equal to 1 in 1000000risk that is attributable to site-related insignificant is less than 1 in 1000000
contaminants in qualitative terms like low very low slight and no significant increase in theoretical cancer risk These terms can be better understood by considering the population size required for such an estimate to result in a single cancer case For example a low increase in cancer risk indicates an estimate in the range
24
HC-Fidalgo Bay
of one cancer case per ten thousand persons exposed over a lifetime A very low estimate might result in one cancer case per several tens of thousands exposed over a lifetime and a slight estimate would require an exposed population of several hundreds of thousands to result in a single case DOH considers theoretical cancer risk insignificant when the estimate results in less than one cancer per one million exposed over a lifetime The reader should note that these estimates are for excess cancers that might result in addition to those normally expected in an unexposed population
Cancer is a common illness and its occurrence in a population increases with the age of the population There are many different forms of cancer resulting from a variety of causes not all are fatal Approximately 14 to 13 of people living in the United States will develop cancer at some point in their lives [42]
Theoretical cancer risk estimates for exposure to cPAHs in sediments is considered insignificant (2 cancers estimated per 10000000 exposed) (see Appendix A Table A3) Although exposure to cPAHs may occur the magnitude is likely to be considerably less than the estimated minimum background exposure from sources in food water air sediment and soil Many areas of Fidalgo Bay are already under Ecology Agreed Orders The Orders require an RIFS be conducted to guide the selection of a cleanup remedy
Theoretical cancer risk estimates for exposure to seafood by the general population is very low (2 cancers estimated per 100000 exposed) (see Appendix B Tables B5) This estimate is within EPArsquos acceptable risk for fish consumption However this is based on bottom fish and shellfish data only Theoretical cancer risk estimates for exposure to seafood by Tribal consumers range from low to moderate (4 cancers estimated per 10000 exposed) and moderate to high (2 cancers estimated per 1000 exposed) (see Appendix C)
Multiple Chemical Exposures
A person can be exposed to more than one chemical through more than one pathway Exposure to a chemical through multiple pathways occurs if a contaminant is present in more than one medium (ie air soil surface water groundwater and sediment) For example the dose of a contaminant received from drinking water might be combined with the dose received from contact with the same contaminant in fish
For many chemicals much information is available on how the individual chemical produces effects However it is much more difficult to assess exposure to multiple chemicals Due to the large number of chemicals in the environment it is impossible to measure all of the possible interactions between these chemicals The potential exists for these chemicals to interact in the body and increase or decrease the potential for adverse health effects Individual cancer risk estimates can be added since they are measures of probability However when estimating non-cancer risk similarities must exist between the chemicals if the doses are to be added Groups of chemicals that have similar toxic effects can be added such as volatile organic compounds (VOCs) which cause liver toxicity Polycyclic aromatic hydrocarbons (PAHs) are another group of compounds that can be assessed as one combined dose based on similarities in chemical structure and metabolites
25
HC-Fidalgo Bay
The ATSDR Interaction Profile for persistent chemicals found in fish evaluates the possibility of interactive effects from exposure to a mixture of contaminants including mercury PCBs and dioxins [43]
Uncertainty
Assessment of risks attributable to environmental exposures is filled with many uncertainties Uncertainty with regard to the health assessment process refers to the lack of knowledge about factors such as chemical toxicity human variability human behavior patterns and chemical concentrations in the environment Uncertainty can be reduced through further study
The majority of uncertainty comes from our knowledge of chemical toxicity For most chemicals there is little knowledge of the actual health impacts that can occur in humans from environmental exposures unless epidemiological or clinical evidence exists As a result toxicological experiments are performed on animals These animals are exposed to chemicals at much higher levels than found in the environment The critical doses in animal studies are often extrapolated to real world exposures for use in human health risk assessments In order to be protective of human health uncertainty factors are used to lower that dose in consideration of variability in sensitivity between animals and humans and the variability within humans These uncertainty factors can account for a difference of two to three orders of magnitude when calculating risk Furthermore there are hundreds of chemicals for which little toxicological information is known in animals or humans These chemicals may in fact be toxic at some level but risks to humans cannot be quantified due to uncertainty
The majority of arsenic found in seafood is organic arsenic Inorganic arsenic in fish and shellfish ranged from about 1 to 20 of the total arsenic [20 22 23 24] Ecologyrsquos evaluation of shellfish and English sole in the Puget Sound indicated that less than 1 of the total arsenic found was in the inorganic form of arsenic [25] However since there was no arsenic speciation data for starry flounder DOH assumed that 10 of the total arsenic detected in bottom fish was inorganic arsenic Inorganic arsenic is much more harmful than organic arsenic therefore the arsenic evaluation may be overestimated
The amount of contaminated media (fish water air soil) that people eat drink inhale or absorb through their skin is another source of uncertainty Although recent work has improved our understanding of these exposure factors they are still a source of uncertainty In the case of Fidalgo Bay uncertainty exists with respect to how much fish people eat from Fidalgo Bay how often they are eating it what species they are eating how often children use public access areas and how much sediment or soil children may inadvertently eat Estimates are based on best available information or worst-case scenarios This evaluation is based on the assumption that 100 percent of the type of seafood (bottom fish and shellfish) harvested and consumed was from Fidalgo Bay
Another source of uncertainty is how seafood is actually prepared for consumption and laboratory testing (ie whole fish with guts versus gutless or fillets large clams with skin and gut ball) Bottom fish and clams may contain sediments in their digestive tracts that can affect the concentration of heavy metals during analysis Horse clams are a large clam and may show similar heavy metal patterns to geoduck clams where the skin and gut ball contain the major
26
HC-Fidalgo Bay
portion of heavy metals Bottom fish species should be analyzed without the gut and large clams should be analyzed without skin and without the gut for human health purposes
The amount and type of chemical in contaminated media is another source of uncertainty Environmental samples are very costly so it is not practical or efficient to analyze an adequate number of samples for every existing chemical Instead sampling usually focuses on contaminants that are thought to be present based on historic land use or knowledge of specific chemical spills
Fish Meal Limits
Several contaminants of concern are present in seafood from Fidalgo Bay Meal limits were calculated using the RfDMRL as the target risk value and the exposure parameters provided in Appendix E Table E1
Many factors must be considered when one is recommending limits on the consumption of seafood including the health benefits of eating fish the quality and comprehensiveness of environmental data and the availability of alternate sources of nutrition In addition these limits do not consider that multiple species are consumed a consideration that would require weighting the percent of each species consumed
Childrenrsquos Health Concerns
The potential for exposure and subsequent adverse health effects often increases for younger children compared with older children or adults ATSDR and DOH recognize that children are susceptible to developmental toxicity that can occur at levels much lower than those causing other types of toxicity The following factors contribute to this vulnerability
Children are more likely to play outdoors in contaminated areas by disregarding signs and wandering onto restricted locations
Children often bring food into contaminated areas resulting in hand-to-mouth activities Children are smaller and receive higher doses of contaminant exposures per body
weight Children are shorter than adults therefore they have a higher possibility of breathing in
dust and soil Fetal and child exposure to contaminants can cause permanent damage during critical
growth stages
These unique vulnerabilities of infants and children demand special attention in communities that have contaminated water food soil or air Childrenrsquos health was considered in the writing of this health consultation and the exposure scenarios treated children as the most sensitive population being exposed
27
HC-Fidalgo Bay
Conclusions
Based on the information provided DOH concludes the following
1 DOH concludes that consumption of seafood at tribal scenario rates is expected to harm children and adults health The Swinomish Samish Lummi and the Upper Skagit are tribes or nations that fish in this area or it is in their usual and accustomed fishing rights areas If any of the tribes or nations are using Fidalgo Bay for harvesting and is consuming at tribal scenario rates this would represent a ldquopublic health hazardrdquo The Swinomish Indian Tribal Community has stated ldquoFidalgo Bay historically an important harvest site is now impacted by contamination and thus not used for harvest in recent yearsrdquo [6] It may also be unlikely that 100 of a subsistence consumer (tribes or nations) would be consuming and harvesting from Fidalgo Bay only
2 DOH concludes that consuming bottom fish or shellfish from Fidalgo Bay is not expected to harm the general populationrsquos (children or adults) This area also falls under the Puget Sound Crab Advisory DOH recommends consuming only Dungeness and Red Rock crab from non-urban areas and that ldquocrab butterrdquo and viscera should not be eaten Based on contaminants of concern in bottom fish or shellfish calculated meal limits are 13 clams per month 14 crabs per month and 14 bottom fish per month (see Appendix E Tables E2 E3 and E4) Table E5 shows the adjustment of meal size based on the body weight of the consumer
3 DOH concludes that touching breathing or accidentally eating sediment one-day-pershyweek or 52 days per year from Fidalgo Bay is not expected to harm peoplersquos health The maximum level of carcinogenic polycyclic aromatic hydrocarbons (cPAHs) in this exposure scenario is below levels known to result in non-cancer harmful health effects In addition the exposure scenario does not present an elevated theoretical cancer risk
Recommendations
1 DOH recommends Ecology perform the necessary site remedial investigation and feasibility study (RIFS) as they work through the process of cleaning up Fidalgo Bay Proceeding with the planned cleanup will contribute to a significant reduction in human health risk
2 DOH recommends Ecology perform long-term monitoring of Fidalgo Bay DOH is available to review a monitoring plan and monitoring results
3 DOH recommends following the Puget Sound Recreational Marine Area 7 Fish Consumption Advisory and the Puget Sound crab consumption advisory that states
Eat no more than one meal per week for rockfish and Chinook salmon and no more than one meal per month for resident (blackmouth) Chinook salmon
28
HC-Fidalgo Bay
Eat Dungeness and Red Rock crab from non-urban areas and do not eat the ldquocrab butterrdquo (viscera) More information regarding these advisories is available at httpwwwdohwagovehpoehasfishrma7htm or by calling toll-free 1-877-485shy7316
4 DOH also recommends following the meal limits calculated in Appendix E Eat no more than 13 or 14 eight-ounce meals per month of clams crabs bottom fish (English sole and Starry Flounder) or any combination thereof
General Advice
DOH encourages all Washingtonians to eat at least two fish meals per week as part of a heart healthy diet in accordance with American Heart Association (AHA) recommendations People may eat fish more than two times weekly but such frequent consumers should take the following steps to reduce exposure to contaminants in the fish that they eat
bull Eat a variety of fish that are low in contaminants according to guidance provided on our website at httpwwwdohwagovfish
bull Follow fish advisory advice provided by DOH (website listed below) and local health agencies for water bodies where you fish httpwwwdohwagovehpoehasfishfishadvisorieshtm
bull Young children and small adults should eat proportionally smaller meal sizes bull Grill bake or broil fish so that fat drips off while cooking bull Eat fillets without the skin bull Mercury and other metals are stored in the fillet of the fish and will not be reduced by preparing fish this way
Public Health Action Plan
Actions Planned
1 DOH will coordinate with Ecology to provide an educational materials fact sheet
2 DOH will provide copies of this health consultation to Ecology and concerned parties
3 DOH will be available at Ecologyrsquos planned public meetings in the Fidalgo Bay community
29
HC-Fidalgo Bay
Author
Lenford OrsquoGarro Washington State Department of Health
Office of Environmental Health Assessments Site Assessment Section
Designated Reviewer Dan Alexanian Manager Site Assessment Section
Office of Environmental Health Assessments Washington State Department of Health
ATSDR Technical Project Officer Audra Henry
Cooperative Agreement and Program Evaluation Branch Division of Health Assessment and Consultation
Agency for Toxic Substances and Disease Registry
30
HC-Fidalgo Bay
References
1 SAIC 2007 Fidalgo Bay Sediment Investigation Anacortes WA Sediment Sampling and Analysis Plan Prepared for the Washington State Department of Ecology Prepared by Science Applications International Corporation (SAIC) Bothell WA September 17 2007
2 Fidalgo Bay Causeway feasibility study Request for funding from Department of Ecology Prepared by Samish Indian Nation May 4 2007 httpwwwsamishtribensnusdnrDOE2042007pdf
3 Washington State Department of Natural Resources Fidalgo Bay Environmental Aquatic Reserve management plan Skagit County Washington April 2008 Prepared by Aquatic resources program httpwwwdnrwagovPublicationsaqr_rsve_fid_mgmt_planpdf
4 SAIC 2008 Fidalgo Bay Sediment Investigation Anacortes WA Final Report Prepared for the Washington State Department of Ecology Prepared by Science Applications International Corporation (SAIC) Bothell WA March 31 2008
5 SAIC 2008 Fidalgo Bay Sediment Investigation Anacortes WA Archived Sediment and Tissue Analytical Results Data Report Addendum Prepared for the Washington State Department of Ecology Prepared by Science Applications International Corporation (SAIC) Bothell WA September 2008
6 Swinomish Water Resources Program December 1 2006 Bioaccumulative Toxics in Subsistence-Harvested Shellfish ndash Contaminant Results and Risk Assessment Swinomish Indian Tribal Community La Conner WA
7 Van den Berg M Birnbaum LS Denison M De Vito M Farland W Feeley M Fiedler H Hakansson H Hanberg A Haws L Rose M Safe S Schrenk D Tohyama C Tritscher A Tuomisto J Tysklind M Walker N amp Peterson RE (2006) The 2005 World Health Organization Reevaluation of Human and Mammalian Toxic Equivalency Factors for Dioxins and Dioxin-Like Compounds Toxicol Sci 93 223-241 Available at httptoxscioxfordjournalsorgcgicontentabstract932223
8 US Environmental Protection Agency Guidance for assessing chemical contaminant data for use in fish advisories volume 2 risk assessment and fish consumption limits third edition Office of Water Washington DC EPA 823-B-00-008 2000b
9 United States Environmental Protection Agency Framework for Selecting and Using Tribal Fish and Shellfish Consumption Rates for Risk-Based Decision Making at CERCLA and RCRA Cleanup Sites in Puget Sound and the Strait of Georgia August 2007
10 United States Environmental Protection Agency Estimated Per Capita Fish Consumption in the United States EPA 821-C-02-003 2002
31
HC-Fidalgo Bay
11 Toy KA Polissar NL Liao S and Mittelstaedt GD 1996 A fish consumption survey of the Tulalip and Squaxin Island tribes of the Puget Sound region Tulalip Tribes Department of Environment 7615 Totem Beach Road Marysville WA 98271
12 The Suquamish Tribe 2000 Fish Consumption Survey of the Suquamish Tribe of the Port Madison Indian Reservation Puget Sound Region The Suquamish Tribe 15838 Sandy Hook Road Post Office Box 498 Suquamish WA 98392
13 Alaska Division of Public Health The use of traditional foods in a healthy diet in Alaska risks in perspective 1999 Jan15
14 US Environmental Protection Agency and Toxicology Excellence for Risk Assessment August comparative dietary risks balancing the risks and benefits of fish consumption1999 Aug
15 American Heart Association An eating plan for healthy Americans Available at httpwwwamericanheartorgdietary guidelinesimagesEatPlan2000pdf
16 Hora ME Reduction of polychlorinated biphenyl (PCB) concentrations in carp (Cyprinus carpio) fillets through skin removal Bull Environ Contam Toxicol 1981 Mar 26 (3)364shy6
17 Wilson ND Shear NM Paustenbach DJ Price PS The effect of cooking practices on the concentration of DDT and PCB compounds in the edible tissue of fish J Exp Anal Environ Epidemiol 1998 Jul-Sep 8(3) 423-40
18 Zabik ME Zabik MJ Polychlorinated biphenyls polybrominated biphenyls and dioxin reduction during processingcooking food Adv Exp Med Biol1999459213-31
19 Toxics Cleanup Program Department of Ecology Natural background soil metals concentrations in Washington State Publication No 94-115Olympia Washington State Department of Ecology October 1994
20 Agency for Toxic Substances and Disease Registry (ATSDR) Toxicological profile for arsenic (update) PB2000108021 Atlanta GA US Department of Health and Human Services Public Health Service September 2005
21 US Environmental Protection Agency Toxicological Review of Inorganic Arsenic In support of summary information on the Integrated Risk Information System July 2005 httpwwwepagovwatersciencecriteriaarsenicsabAsDraft_SABpdf
22 NAS 2001b Arsenic in Drinking Water 2001 Update National Academy Press Washington DC 2001 Available at httpbooksnapedubooks0309076293htmlindexhtml
23 Francesconi KA and Edmonds JS 1997 Arsenic and marine organisms Advances in Inorganic Chemistry 44147-189
32
HC-Fidalgo Bay
24 US Food and Drug Administration (FDA) 1993 Guidance document for arsenic in shellfish Department of Health and Human Services Public Health Service Food and Drug Administration Center for Food Safety and Applied Nutrition Washington DC January 1993 Available at httpwwwfoodsafetygov~frfguid-ashtml
25 Washington State Department of Ecology Environmental Assessment Program Inorganic arsenic levels in Puget Sound fish and shellfish from 303(d) listed water bodies and other areas Prepared by Art Johnson and Morgan Roose Publication No 02-03-057 Olympia Washington State Department of Ecology December 2002
26 US Department of Health and Human Services Agency for Toxic Substances and Disease Registry Toxicological profile for Cadmium (update) PB99166621 Atlanta US Department of Health and Human Services July 1999
27 Anderson RA Polansky MM Bryden NA Patterson KY Veillon C Glinsmann WH 1983 Effects of chromium supplementation on urinary Cr excretion of human subjects and correlation of Cr excretion with selected clinical parameters J Nutr 113276ndash81 Cited in Agency for Toxic Substances and Disease Registry 2000 Toxicological profile for chromium Atlanta US Department of Health and Human Services September 2000 Available at httpwwwatsdrcdcgovtoxprofilestp7html
28 Anderson RA 1986 Chromium metabolism and its role in disease processes in man Clin Physiol Biochem 431ndash41 Cited in Agency for Toxic Substances and Disease Registry 2000 Toxicological profile for chromium Atlanta US Department of Health and Human Services September 2000 Available at httpwwwatsdrcdcgovtoxprofilestp7html
29 Donaldson RM Barreras RF 1966 Intestinal absorption of trace quantities of chromium J Lab Clin Med 68484ndash493 Cited in Agency for Toxic Substances and Disease Registry 2000 Toxicological profile for chromium Atlanta US Department of Health and Human Services September 2000 Available at httpwwwatsdrcdcgovtoxprofilestp7html
30 Agency for Toxic Substances and Disease Registry Toxicological profile for chlorinated dibenzo-p-dioxins (update) Draft for public comment Atlanta US Department of Health and Human Services 2000
31 National Toxicology Program Carcinogenesis bioassay of 2378- tetrachlorodibenzo-pshydioxin in Swiss-Webster mice (gavage study) Carcinogenesis Testing Program National Cancer Institute National Institute of Health National Toxicology Program Bethesda MD DHHS publication no 82-1765 1982
32 United States Environmental Protection Agency Health assessment document for polychlorinated dibenzo-p-dioxins Washington DC US Environmental Protection Agency Office of Health and Environmental Assessment EPA report no 6008-84014 1985
33
HC-Fidalgo Bay
33 United States Environmental Protection Agency Report on the peer review of the dioxin reassessment documents toxicity equivalency factors for dioxin and related compounds (Chapter 9) and integrated risk characterization document Alexandria VA National Center for Environmental Assessment 2000
34 Agency for Toxic Substances and Disease Registry (ATSDR) Analysis Paper Impact of Lead-Contaminated Soil on Public Health US Department of Health and Human Services Public Health Service Atlanta Georgia May 1992
35 CDC Preventing lead poisoning in young children a statement by the Centers for Disease Control October 1991 Atlanta Georgia US Department of Health and Human Services Public Health Service CDC 1991
36 US Department of Health and Human Services Agency for Toxic Substances and Disease Registry Toxicological profile for Lead (update) PB99166704 Atlanta US Department of Health and Human Services July 1999
37 Agency for Toxic Substances and Disease Registry (ATSDR) Lead Toxicity (Case studies in environmental medicine Course) SS3059 Atlanta US Department of Health and Human Services Public Health Service October 2000
38 US Department of Health and Human Services Agency for Toxic Substances and Disease Registry Toxicological Profile for Polycyclic Aromatic Hydrocarbons (PAHs) (update) PB95264370 Atlanta US Department of Health and Human Services August 1995
39 Phillips D H Polycyclic Aromatic Hydrocarbons in the diet Mutation Research 1999 (443) 139-147
40 US Environmental Protection Agency Technical Review Workgroup for Lead Userrsquos Guide for the Integrated Exposure Uptake Biokinetic Model for Lead in Children (IEUBK) Windows version 10 OSWER Directive No92857-42 Document No EPA 540-K-01-005 Washington DC May 2002
41 US Environmental Protection Agency Guidelines for Carcinogen Risk Assessment (Review Draft) NCEA-F-0644 July 1999 Available at httpwwwepagovNCEArafcancerhtm
42 ATSDR Agency for Toxic Substances and Disease Registry ATSDR Fact Sheet Cancer Updated August 30 2002 Atlanta US Department of Health and Human Services Available at httpwwwatsdrcdcgovCOMcancer-fshtml
43 Agency for Toxic Substances and Disease Registry (ATSDR) Interaction Profile for persistent chemicals found in fish US Department of Health and Human Services Public Health Service May 2004
34
HC-Fidalgo Bay
44 National Center for Environmental Assessment Exposure Factors Handbook Volume 1 ndash General Factors EPA600P-95002Fa US Environmental Protection Agency August 1997
35
HC-Fidalgo Bay
Figure 1 Demographic statistics within three miles of the site - Fidalgo Bay Skagit County
Total Population 11704 White 10818 Black 33 American Indian Eskimo Aleut 143 Asian or Pacific Islander 211 Other Race 176 Hispanic Origin 386 Children Aged 6 and Younger 943 Adults Aged 65 and Older 2310 Females Aged 15 - 44 2088 Total Aged over 18 8900 Total Aged under 18 2804 Total Housing Units 5295
Calculated using the area proportion technique Source 2000 US CENSUS
36
HC-Fidalgo Bay
Figure 2 Red box indicates the Fidalgo Bay site location Skagit County Washington
37
HC-Fidalgo Bay
Figure 3 Ecologyrsquos sediment and biota sample areas within Fidalgo Bay Skagit County Washington
38
HC-Fidalgo Bay
Appendix A This section provides calculated exposure doses and assumptions used for exposure to chemicals in sediments at the Fidalgo Bay site Three different exposure scenarios were developed to model exposures that might occur These scenarios were devised to represent exposures to a child (0-5 yrs) an older child and an adult The following exposure parameters and dose equations were used to estimate exposure doses from direct contact with chemicals in sediments
Exposure to chemicals in soil via ingestion inhalation and dermal absorption
Total dose (non-cancer) = Ingested dose + inhaled dose + dermally absorbed dose
Ingestion Route
Dose(non-cancer (mgkg-day) = C x CF x IR x EF x ED BW x ATnon-cancer
Cancer Risk = C x CF x IR x EF x CPF x ED BW x ATcancer
Dermal Route
Dermal Transfer (DT) = C x AF x ABS x AD x CF ORAF
Dose(non-cancer (mgkg-day) = DT x SA x EF x ED BW x ATnon-cancer
Cancer Risk = DT x SA x EF x CPF x ED BW x ATcancer
Inhalation Route
Dosenon-cancer (mgkg-day) = C x SMF x IHR x EF x ED x 1PEF BW x ATnon-cancer
Cancer Risk = C x SMF x IHR x EF x ED x CPF x 1PEF BW x ATcancer
39
HC-Fidalgo Bay
Table A1 Exposure assumptions used to estimate cPAHs doses from direct contact with sediments in Fidalgo Bay Anacortes WA
Parameter Value Unit Comments Concentration (C) Variable mgkg Maximum detected value
Conversion Factor (CF) 0000001 kgmg Converts contaminant concentration from milligrams (mg) to kilograms (kg)
Ingestion Rate (IR) ndash adult 100 mgday Exposure Factors Handbook [44] Ingestion Rate (IR) ndash older child 100
Ingestion Rate (IR) - child 200 Exposure Frequency (EF) 52 Daysyear One days a week
Exposure Duration (Ed) 30 (5 1015) years Number of years at one residence (child older child adult yrs)
Body Weight (BW) - adult 72 kg
Adult mean body weight Body Weight (BW) ndash older child 41 Older child mean body weight Body Weight (BW) - child 15 0-5 year-old child average body weight Surface area (SA) - adult 5700
cm2 Exposure Factors Handbook Surface area (SA) ndash older child 2900 Surface area (SA) - child 2900 Averaging Timenon-cancer (AT) 1825 days 5 years Averaging Timecancer (AT) 27375 days 75 years Cancer Potency Factor (CPF) 73 mgkg-day-1 Source EPA 24 hr absorption factor (ABS) 013 unitless Source EPA (Chemical Specific) PAH Oral route adjustment factor (ORAF) 1 unitless Non-cancer (nc) cancer (c) - default Adherence duration (AD) 1 days Source EPA
Adherence factor (AF) 02
mgcm2 Child older child 007 Adult
Inhalation rate (IHR) - adult 152 m3day Exposure Factors Handbook [44] Inhalation rate (IHR) ndash older child 14
Inhalation rate (IHR) - child 83 Soil matrix factor (SMF) 1 unitless Non-cancer (nc) cancer (c) - default Particulate emission factor (PEF) 145E+7 m3kg Model Parameters
40
HC-Fidalgo Bay
Fidalgo Bay Sediment Exposure Route ndash Non-cancer
Table A2 Non-cancer hazard calculations resulting from exposure to cPAHs in sediments from Fidalgo Bay Anacortes WA
Contaminant
TEQ Concentra
tion (ppm)
(mgkg)
Scenarios
Estimated Dose (mgkgday)
Total Dose LOAEL
(mgkgday)
Total Dose LOAELIncidental
Ingestion of Soil
Dermal Contact
with Soil
Inhalation of Particulates
Child 194E-7 730E-8 134E-11 267E-7 000000003
cPAH 0102 Older Child 354E-8 267E-8 828E-12 622E-8 10E+1 0000000006
Adult 202E-8 105E-8 512E-12 307E-8 0000000003
Fidalgo Bay Sediment Exposure Route ndash Cancer
Table A3 Cancer hazard calculations resulting from exposure to cPAHs sediments from Fidalgo Bay Anacortes WA
Contaminant Concentra tion (ppm)
EPA cancer Group
Cancer Potency Factor
(mgkg-day-1)
Scenarios
Increased Cancer Risk Total
Cancer RiskIncidental
Ingestion of Soil
Dermal Contact
with Soil
Inhalation of Particulates
Child 943E-8 355E-8 653E-12 130E-7
Total cPAH TEQ 0102 B2 73 Older Child 345E-8 260E-8 806E-12 605E-8
Adult 295E-8 153E-8 747E-12 448E-8
Lifetime cancer risk 130E-7 + 605E-8 + 448E-8 = 235E-7
41
HC-Fidalgo Bay
Appendix B
This section provides calculated exposure doses and exposure assumptions used for chemicals in bottom fish shellfish and crab samples taken from Fidalgo Bay These exposure scenarios were developed to model exposures that might occur and were devised to represent exposures to the general population The following exposure parameters and dose equations were used to estimate exposure doses from ingestion of contaminants in bottom fish and shellfish
Ingestion Route
Dose(non-cancer (mgkg-day) = C x CF1 x IR x CF2 x EF x ED BW x ATnon-cancer
Cancer Risk = C x CF1 x IR x CF2 x EF x CPF x ED BW x ATcancer
Table B1 Exposure assumptions used in exposure evaluation of contaminants in bottom fish shellfish and crab samples taken from Fidalgo Bay in Anacortes Washington
Parameter Value Unit Comments Concentration (C) Variable ugkg Average detected value
Conversion Factor (CF1) 0001 mgkg Converts contaminant concentration from milligrams (mg) to kilograms (kg)
Conversion Factor (CF2) 0001 kgg Converts mass of shellfish from grams (g) to kilograms (kg)
Ingestion Rate (IR) 057
gday
Body weight-adjusted shellfish consumption rates to account for children eating nearly 16 times as much fish per body weight as do adults (see table B2)
Ingestion Rate (IR) 028 Average general population child ndash bottom fish (see table B3)
Ingestion Rate (IR) 081 Body weight-adjusted shellfish consumption rates to account for an older child eating 081 times as much fish per body weight as do adults (see table B2)
Ingestion Rate (IR) 036 Average general population older child ndash bottom fish (see table B3)
Ingestion Rate (IR) 17 Average general population adult - shellfish
Ingestion Rate (IR) 07 Average general population adult ndash bottom fish (see table B3)
Exposure Frequency (EF) 365 Daysyear Assumes daily exposure
Exposure Duration (ED) 6 years
Number of years at one residence (child) Exposure Duration (ED) 30 Number of years at one residence (adult) Body weight (BW) 15
kg Mean body weight child
Body weight (BW) 70 Mean body weight adult Averaging Timenon-cancer (AT) Variable days Equal to Exposure Duration Averaging Timecancer (AT) 25550 days 70 years Cancer Potency Factor (CPF) Variable mgkg-day-1 Source EPA ndash Chemical specific
42
HC-Fidalgo Bay
Table B2 Derivation of a childrsquos shellfish consumption rate for the general US population
Row Parameter Adult Older Child (6-17 yrs)
Child (0-6 yrs)
1 Reported All Fish Consumption Rate-gram fish per kg bodyweight per day (gkgday)
0277 0225 0433
2 Ratio to Adult All Fish Consumption Rate
1 081 16
3 Reported Shellfish Consumption (gday)
170 (average) Not Reported Not Reported
4 Average Body Weight (kg) 70 41 15 5 Ratio to Adult BW 1 059 021 6 Adjusted Shellfish Consumption Rates
(gday) = Row 2 x Row 3 x Row 5
170 (average) 081 (average) 057 (average)
Table B3 Derivation of bottom consumption rate for the general US population based on four percent of total fish intake
Row Parameter Adult Older Child (6-17 yrs)
Child (0-6 yrs)
1 Reported All Fish Consumption Rateshy(gday)
175 90 70
2 Assume bottom fish intake rate similar to tribal at about 4 percent [15]
004 004 004
3 Adjusted bottom fish rates (gday) = Row 1 x Row 2
070 036 028
43
HC-Fidalgo Bay
Table B4 Exposure dose and non-cancer risk from ingesting seafood at the average concentrations of contaminants in bottom fish clams and crab samples taken from Fidalgo Bay in Anacortes Washington
Species Contaminant Average Concentration
(ppm)
Estimated Dose (mgkgday)
General population Average
MRL or RfD (mgkgday)
Hazard quotient
General population Average
Clams
Arsenic
0027 Child 103E-6
300E-4
0003 Older child 533E-7 0002
Adult 656E-7 0002
Crabs 0071 Child 270E-6 0009
Older child 140E-6 0005 Adult 172E-6 0006
Bottom Fish 015 Child 260E-6 0009
Older child 132E-6 0004 Adult 150E-6 0005
Crabs Cadmium 048 Child 182E-5
100E-3 0018
Older child 948E-6 0009 Adult 117E-5 0012
Clams Chromium 184 Child 699E-5
300E-3 0023
Older child 364E-5 0012 Adult 447E-5 0015
Clams
Dioxin
799E-8 Child 304E-12
10E-9
0003 Older child 158E-12 00016
Adult 194E-12 00019
Crabs 975E-8 Child 371E-12 00037
Older child 193E-12 00019 Adult 237E-12 00024
Bottom Fish 134E-7 Child 250E-12 0003
Older child 118E-12 00012 Adult 134E-12 00013
Crabs
Mercury
0049 Child 186E-6
100E-4
0019 Older child 968E-7 00097
Adult 119E-6 0012
Bottom Fish 0042 Child 784E-7 0008
Older child 369E-7 00037 Adult 420E-7 00042
PPM ndash parts per million
44
HC-Fidalgo Bay
Table B5 Cancer risk from ingesting seafood at the average concentrations of contaminants in bottom fish clams and crab samples taken from Fidalgo Bay in Anacortes Washington
Species Contaminant Average Concentration
(ppm)
Cancer Potency Factor
(mgkg-day-1)
Increased Cancer Risk
General population Average
Total Cancer Risk General population
Average
Clams
Arsenic
0027
57
Child 501E-7
153E-5
Older child 434E-7 Adult 160E-6
Crabs 0071 Child 132E-6
Older child 114E-6 Adult 421E-6
Bottom Fish 015 Child 137E-6
Older child 107E-6 Adult 366E-6
Clams
Dioxin
799E-8
15E+5
Child 390E-8
582E-7
Older child 338E-8 Adult 125E-7
Crabs 975E-8 Child 476E-8
Older child 413E-8 Adult 152E-7
Bottom Fish 134E-7 Child 322E-8
Older child 252E-8 Adult 861E-8
Sum of cancer risk 159E-5
45
HC-Fidalgo Bay
Appendix C This section provides calculated exposure doses and assumptions used for exposure to chemicals in seafood at the Fidalgo Bay site using Tulalip Tribe consumption rates It is based on the EPA Tribal framework for fish and shellfish consumption rates for risk-based decisions
Intake of contaminant in mgkg-day (IR ) = (CF x CR x x UCF ) BW c i PS i 1
[Equation 1] Where IR = Intake rate of contaminant by category of fishshellfish
c
CF = contaminant concentration (mgkg) in the tissue of the particular fish or shellfish category i
CR = the total consumption rate of fish and shellfish harvested from Puget Sound 194 grams per PS
day = the percentage of the ingestion rate that consists of the category of fish or shellfish unitless
i
BW = body weight 818 kilograms observed from the Tulalip Tribesrsquo study UCF = conversion factor 1 0001 kilograms per gram
1
Estimated cancer risk (ECR) = (IR x ED x EF x CSF) (AT x UCF ) [Equation 2] total 2
Where IR = Total intake of contaminant from site-related fish and shellfish consumption
total
ED = exposure duration 70 years EF = exposure frequency 365 days per year CSF = oral cancer slope factor for contaminant AT = averaging time 70 years for carcinogens UCF = conversion factor 2 (365 daysyear)
2
Estimated hazard index (EHI) = (IR x ED x EF x UCF ) (RfD x AT) [Equation 3] total 2
Where IR = Total intake of contaminant from site-related fish and shellfish consumption
total
ED = exposure duration 70 years EF = exposure frequency 365 days per year RfD = Oral reference dose for contaminant AT = averaging time the same as exposure duration for non-carcinogenic effects UCF = conversion factor 2 (1 yr365 days)
2
46
HC-Fidalgo Bay
Table C1 Fidalgo Bay arsenic intake rate based on the Tulalip Tribe seafood consumption rate Anacortes Washington
Overall FishShellfish Consumption Rate gday
Category Percent of Consumption Rate Represented by Category
Site-related concentration of arsenic mgkg in tissue
Category Specific Exposure mgkg-day
194 Salmon 497 0 0 194 Pelagic Fish 42 0 0 194 Bottom Fish 39 015 00000139 194 Shellfish 422 0049 00000490 Sum IRtotal 00000629 Crabs tissues and clams average
Arsenic Estimated hazard index = 021
Arsenic Estimated cancer risk = 21E-3
Table C2 Fidalgo Bay cadmium intake rate based on the Tulalip Tribe seafood consumption rate Anacortes Washington
Overall FishShellfish Consumption Rate gday
Category Percent of Consumption Rate Represented by Category
Site-related concentration of cadmium mgkg in tissue
Category Specific Exposure mgkg-day
194 Salmon 497 0 0 194 Pelagic Fish 42 0 0 194 Bottom Fish 39 0 0 194 Shellfish 422 048 000048 Sum IRtotal 000048 Crabs tissues only average
Cadmium Estimated hazard index = 03
47
HC-Fidalgo Bay
Table C3 Fidalgo Bay chromium intake rate based on Tulalip Tribe seafood consumption rate Anacortes Washington
Overall FishShellfish Consumption Rate gday
Category Percent of Consumption Rate Represented by Category
Site-related concentration of chromium mgkg in tissue
Category Specific Exposure mgkg-day
194 Salmon 497 0 0 194 Pelagic Fish 42 0 0 194 Bottom Fish 39 0 0 194 Shellfish 422 184 000184 Sum IRtotal 000184 Clams tissues only average
Chromium Estimated hazard index = 061
Table C4 Fidalgo Bay dioxin intake rate based on the Tulalip Tribe seafood consumption rate Anacortes Washington
Overall FishShellfish Consumption Rate gday
Category Percent of Consumption Rate Represented by Category
Site-related concentration of dioxin mgkg in tissue
Category Specific Exposure mgkg-day
194 Salmon 497 0 0 194 Pelagic Fish 42 0 0 194 Bottom Fish 39 134E-7 124E-11 194 Shellfish 422 887E-8 888E-11 Sum IRtotal 101E-10 Crabs tissues and clams average
Dioxin Estimated hazard index = 010
Dioxin Estimated cancer risk = 152E-5
48
HC-Fidalgo Bay
Table C5 Fidalgo Bay mercury intake rate based on the Tulalip Tribe seafood consumption rate Anacortes Washington
Overall FishShellfish Consumption Rate gday
Category Percent of Consumption Rate Represented by Category
Site-related concentration of mercury mgkg in tissue
Category Specific Exposure mgkg-day
194 Salmon 497 0 0 194 Pelagic Fish 42 0 0 194 Bottom Fish 39 0042 000000388 194 Shellfish 422 0049 0000049 Sum IRtotal 00000529 Crabs tissues only average
Mercury Estimated hazard index = 053
49
HC-Fidalgo Bay
This section provides calculated exposure doses and assumptions used for exposure to chemicals in seafood at Fidalgo Bay using Suquamish Tribe consumption rates It is based on the EPA Tribal framework for fish and shellfish consumption rates for risk-based decisions
Intake of contaminant in mgkg-day (IR ) = (CF x CR x x UCF ) BW c i PS i 1
[Equation 1] Where IR = Intake rate of contaminant by category of fishshellfish
c
CF = contaminant concentration (mgkg) in the tissue of the particular fish or shellfish category i
CR = the total consumption rate of fish and shellfish harvested from Puget Sound 7668 grams per PS
day = the percentage of the ingestion rate that consists of the category of fish or shellfish unitless
i
BW = body weight 79 kilograms observed from the Suquamish Tribesrsquo study UCF = conversion factor 1 0001 kilograms per gram
1
Estimated cancer risk (ECR) = (IR x ED x EF x CSF) (AT x UCF ) [Equation 2] total 2
Where IR = Total intake of contaminant from site-related fish and shellfish consumption
total
ED = exposure duration 70 years EF = exposure frequency 365 days per year CSF = oral cancer slope factor for contaminant AT = averaging time 70 years for carcinogens UCF = conversion factor 2 (365 daysyear)
2
Estimated hazard index (EHI) = (IR x ED x EF x UCF ) (RfD x AT) [Equation 3] total 2
Where IR = Total intake of contaminant from site-related fish and shellfish consumption
total
ED = exposure duration 70 years EF = exposure frequency 365 days per year RfD = Oral reference dose for contaminant AT = averaging time the same as exposure duration for non-carcinogenic effects UCF = conversion factor 2 (1 yr365 days)
2
50
HC-Fidalgo Bay
Table C6 Fidalgo Bay arsenic intake rate based on Suquamish Tribe seafood consumption rate Anacortes Washington
Overall FishShellfish Consumption Rate gday
Category Percent of Consumption Rate Represented by Category
Site-related concentration of arsenic mgkg in tissue
Category Specific Exposure mgkg-day
7668 Salmon 239 0 0 7668 Pelagic Fish 73 0 0 7668 Bottom Fish 38 015 00000553 7668 Shellfish 65 0049 0000309 Sum IRtotal 0000364 Crabs tissues and clams average
Arsenic Estimated hazard index = 12
Arsenic Estimated cancer risk = 359E-4
Table C7 Fidalgo Bay cadmium intake rate based on Suquamish Tribe seafood consumption rate Anacortes Washington
Overall FishShellfish Consumption Rate gday
Category Percent of Consumption Rate Represented by Category
Site-related concentration of cadmium mgkg in tissue
Category Specific Exposure mgkg-day
7668 Salmon 239 0 0 7668 Pelagic Fish 73 0 0 7668 Bottom Fish 38 0 0 7668 Shellfish 65 048 0003 Sum IRtotal 0003 Crabs tissues only average
Cadmium Estimated hazard index = 3
51
HC-Fidalgo Bay
Table C8 Fidalgo Bay chromium intake rate based on Suquamish Tribe seafood consumption rate Anacortes Washington
Overall FishShellfish Consumption Rate gday
Category Percent of Consumption Rate Represented by Category
Site-related concentration of chromium mgkg in tissue
Category Specific Exposure mgkg-day
7668 Salmon 239 0 0 7668 Pelagic Fish 73 0 0 7668 Bottom Fish 38 0 0 7668 Shellfish 65 184 00116 Sum IRtotal 00116 Clams tissues only average
Chromium Estimated hazard index = 387
Table C9 Fidalgo Bay dioxin intake rate based on Suquamish Tribe seafood consumption rate Anacortes Washington
Overall FishShellfish Consumption Rate gday
Category Percent of Consumption Rate Represented by Category
Site-related concentration of dioxin mgkg in tissue
Category Specific Exposure mgkg-day
7668 Salmon 239 0 0 7668 Pelagic Fish 73 0 0 7668 Bottom Fish 38 134E-7 494E-11 7668 Shellfish 65 887E-8 56E-10 Sum IRtotal 609E-10 Crabs tissues and clams average
Dioxin Estimated hazard index = 061 Dioxin Estimated cancer risk = 914E-5
52
HC-Fidalgo Bay
Table C10 Fidalgo Bay mercury intake rate based on Suquamish Tribe seafood consumption rate Anacortes Washington
Overall FishShellfish Consumption Rate gday
Category Percent of Consumption Rate Represented by Category
Site-related concentration of mercury mgkg in tissue
Category Specific Exposure mgkg-day
7668 Salmon 239 0 0 7668 Pelagic Fish 73 0 0 7668 Bottom Fish 38 0042 00000155 7668 Shellfish 65 0049 0000309 Sum IRtotal 000032 Crabs tissues only average
Mercury Estimated hazard index = 32
53
HC-Fidalgo Bay
Appendix D
Lead exposure shellfish ingestion scenario used in the IEUBK model
This section provides inputs for the IEUBK model The following inputs to the model were used to account for the average shellfish ingestion lead exposure from Fidalgo Bay Anacortes Washington
Consumption rates shellfish general population child ndash 057 gday bottom fish general population child ndash 028 gday
The IEUBK model assumes that a childrsquos total meat intake is 935 gday EPArsquos target cleanup goal is no more than 5 of the community with BLLs above 10 microgdL Default assumptions were used unless noted
Table D1 Blood lead values determined using the IEUBK model for lead in seafood from Fidalgo Bay Anacortes Washington
Seafood Average
Concentration (ppm)
Percent meat intake as shellfish
()
Blood Lead level in percent above 10 ugdl Age range 0 - 84 months
Shellfish 121 061 14
Bottom fish
129 030 13
Average Blood Lead level in percent above 10ugdl Age range 0 - 84 months
135
PPM ndash parts per million Crabs tissues and clams average
54
HC-Fidalgo Bay
The IEUBK model assumes that a childrsquos total meat intake is 935 gday EPArsquos target cleanup goal is no more than 5 of the community with BLLs above 10 microgdL Default assumptions were used unless noted
Percent of consumption rates represented by category were obtained by using the mean because the 90th percentile did not add up to the total intake of seafood However the overall consumption rate was based on the 90th percentile consumers only
Consumption rates Tulalip Tribe child ndash shellfish (58 gday) and bottom fish (014 gday)
Table D2 Fidalgo Bay lead intake rate based on Tulalip Tribe child seafood consumption rate Anacortes Washington
Overall FishShellfish Consumption Rate gday
Category Percent of Consumption
Rate Represented by
Category
Site-related Consumption Rate gday
1107 Salmon 284 0 1107 Pelagic Fish 18 0 1107 Bottom Fish 13 014 1107 Shellfish 523 58
Crabs tissues and clams average
Table D3 Blood lead values determine using the IEUBK model for lead in seafood from Fidalgo Bay Anacortes Washington
Seafood Average
Concentration (ppm)
Percent meat intake as shellfish
()
Blood Lead level in percent above 10ugdl Age range 0 - 84 months
Shellfish 121 62 426
Bottom fish 129 015 125 Average Blood Lead level in percent above 10ugdl Age range 0 - 84 months
276
PPM ndash parts per million Crabs tissues and clams average
55
HC-Fidalgo Bay
The IEUBK model assumes that a childrsquos total meat intake is 935 gday EPArsquos target cleanup goal is no more than 5 of the community with BLLs above 10 microgdL Default assumptions were used unless noted
Percent of consumption rates represented by category were obtained by using the mean because the 90th percentile did not add up to the total intake of seafood However the overall consumption rate was based on the 90th percentile consumers only
Consumption rates Suquamish Tribe child ndash shellfish 2926 gday and bottom fish 108 gday
Table D4 Fidalgo Bay lead intake rate based on Suquamish Tribe child seafood consumption rate Anacortes Washington
Overall FishShellfish Consumption Rate gday
Category Percent of Consumption
Rate Represented by
Category
Site-related Consumption Rate gday
5398 Salmon 183 0 5398 Pelagic Fish 91 0 5398 Other 162 0 5398 Bottom Fish 2 108 5398 Shellfish 542 2926
Crabs tissues and clams average
Table D5 Blood lead values determine using the IEUBK model for lead in seafood from Fidalgo Bay Anacortes Washington
Seafood Average
Concentration (ppm)
Percent meat intake as shellfish
()
Blood Lead level in percent above 10ugdl Age range 0 - 84 months
Shellfish 121 3129 3243
Bottom fish 129 116 163 Average Blood Lead level in percent above 10ugdl Age range 0 - 84 months
1703
PPM ndash parts per million Crabs tissues and clams average
56
HC-Fidalgo Bay
Lead exposure shellfish ingestion scenario used in the Adult lead model
This section provides inputs for the Adult lead model EPArsquos target cleanup goal is no more than 5 of the community with BLLs above 10 microgdL Default assumptions were used unless noted
Table D6 Blood lead values determined using the Adult lead model for lead in seafood from Fidalgo Bay Anacortes Washington
Seafood Average
Concentration (ppm)
Motherrsquos blood lead concentration in ugdl
95th percentile fetal blood lead in ugdl
Shellfish 121 mother 19
fetus 48
Bottom fish 129
mother 15
fetus 46
Average motherrsquos blood lead concentration in ugdl
19
Average 95th percentile fetal blood lead in ugdl
47
PPM ndash parts per million Crabs tissues and clams average
57
HC-Fidalgo Bay
Table D7 Fidalgo Bay lead intake rate based on Tulalip Tribe adult seafood consumption rate Anacortes Washington
Overall FishShellfish Consumption Rate gday
Category Percent of Consumption
Rate Represented by
Category
Site-related Consumption Rate gday
194 Salmon 497 0 194 Pelagic Fish 42 0 194 Bottom Fish 39 757 194 Shellfish 422 8187
Crabs tissues and clams average
Table D8 Blood lead values determined using the Adult lead model for lead in seafood from Fidalgo Bay Anacortes Washington
Seafood Average
Concentration (ppm)
Motherrsquos blood lead concentration in ugdl
95th percentile fetal blood lead in ugdl
Shellfish 121 mother 62
fetus 190
Bottom fish
129 mother 19
fetus 59
Average motherrsquos blood lead concentration in ugdl
41
Average 95th percentile fetal blood lead in ugdl
125
PPM ndash parts per million Crabs tissues and clams average
58
HC-Fidalgo Bay
Table D9 Fidalgo Bay lead intake rate based on the Suquamish Tribe Adult seafood consumption rate Anacortes Washington
Overall FishShellfish Consumption Rate gday
Category Percent of Consumption
Rate Represented by
Category
Site-related Consumption Rate gday
7668 Salmon 239 0 7668 Pelagic Fish 73 0 7668 Bottom Fish 38 2914 7668 Shellfish 65 49842
Crabs tissues and clams average
Table D10 Blood lead values determined using the Adult lead model for lead in seafood from Fidalgo Bay Anacortes Washington
Seafood Average
Concentration (ppm)
Motherrsquos blood lead concentration in ugdl
95th percentile fetal blood lead in ugdl
Shellfish 121 mother 304
fetus 927
Bottom fish 129
mother 33
fetus 100
Average motherrsquos blood lead concentration in ugdl
169
Average 95th percentile fetal blood lead in ugdl
514
PPM ndash parts per million Crabs tissues and clams average
59
HC-Fidalgo Bay
Appendix E
Meal Limit Calculations for contaminants of concern (non-carcinogenic health effects)
Meal limits were calculated for clams crabs and bottom fish based on contaminants of concern in each species Additionally meal limits were calculated based on developmental and immunologic endpoints for dioxin and mercury Meal limits were calculated using the equation below in conjunction with the MRL or RfD as the target risk value and the exposure parameters provided in the Table E1 below The developmental and immunologic endpoints are based on the additive effects of dioxin and mercury as recommended in the ATSDR interaction profile for toxic contaminants found in fish Tables E2 E3 and E4 provides meal limits that would be protective of women and children who eat clams crabs and bottomfish from Fidalgo Bay based on contaminants of concern in each species
ML = [(RfD or MRL)BW DM]C MS ML = recommended fish meal limit per month (mealmonth) RfD = reference dose (EPA) MRL = minimal risk level (ATSDR)
Many factors must be considered when one is recommending limits on the consumption of fish including the health benefits of eating fish the quality and comprehensiveness of environmental data and the availability of alternate sources of nutrition In addition these limits do not consider that multiple species are consumed a consideration that would require weighting of the percent of each species consumed These allowable ingestion rates also do not consider the fact that cooking reduces exposure to some contaminants in fish Therefore allowable consumption limits for prepared fish would be greater than those shown in tables E2 E3 and E4
Table E1 Exposure parameters used to calculate recommended meal limits for clams crabs and bottom fish from Fidalgo Bay in Anacortes Washington
Exposure Parameter RfD Endpoint Units MRL Developmental
RfDMRL Immunological RfDMRL
Average Concentration (C) variable ugkg Arsenic 03
ugkgday Cadmium 1 Chromium 3 Dioxin 0000001 0000001 000002 Mercury 01 01 03 Days per month (DM) 304 304 304 daysmonth Mean Body Weight (BW) 60 60 60 kg Meal size (MS) 0227 0227 0227 kg
60
HC-Fidalgo Bay
Table E2 Calculated meal limits per month for clams from Fidalgo Bay in Anacortes Washington
Contamination Concentration (ppm)
Meals based on RfD MRL
Lowest meals per month (rounded to single digit)
Arsenic 0027 893 13Chromium 184 131
Dioxin 799E-8 1006
Table E3 Calculated meal limits per month for Crabs from Fidalgo Bay in Anacortes Washington
Contamination Concentration (ppm)
Meals based on RfD MRL
Meals based on Developmental additive endpoint
Meals based on Immune additive endpoint
Lowest meals per month (rounded to single digit)
Arsenic 0071 339 14Cadmium 048 167
Dioxin 975E-8 824 137 478 Mercury 0049 164
Table E4 Calculated meal limits per month for Bottom Fish from Fidalgo Bay in Anacortes Washington
Contamination Concentration (ppm)
Meals based on RfD MRL
Meals based on Developmental additive endpoint
Meals based on Immune additive endpoint
Lowest meals per month (rounded to single digit)
Arsenic 015 161 14Dioxin 134E-7 600 145 548
Mercury 0042 191
Applying the Table E2 E3 and E4 meal limits across the general population assumes that meal size will decrease or increase proportionately with body weight Such an assumption could result in underestimating exposure for consumers who eat proportionately more fish per unit of body weight Table E5 demonstrates how an eight-ounce meal for a 70-kilogram adult would change to remain proportional with body weight
61
HC-Fidalgo Bay
Table E5 Adjustment of fish meal size based on the body weight of the consumer
Body Weight Meal Size Pounds Kilograms Ounces Grams
19 9 1 28 39 18 2 57 58 26 3 85 77 35 4 113 96 44 5 142 116 53 6 170 135 61 7 199 154 70 8 227 173 79 9 255 193 88 10 284 212 96 11 312 231 105 12 340 250 113 13 369 270 123 14 397 289 131 15 425 308 140 16 454
62
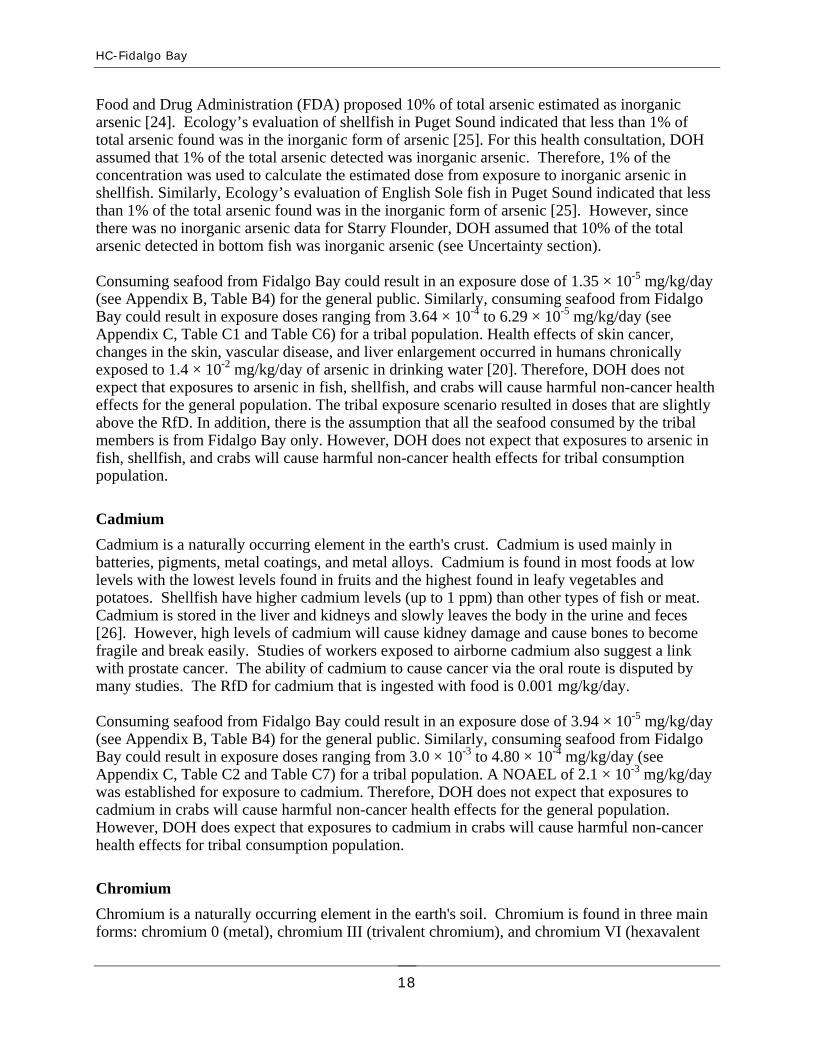
HC-Fidalgo Bay
of one cancer case per ten thousand persons exposed over a lifetime A very low estimate might result in one cancer case per several tens of thousands exposed over a lifetime and a slight estimate would require an exposed population of several hundreds of thousands to result in a single case DOH considers theoretical cancer risk insignificant when the estimate results in less than one cancer per one million exposed over a lifetime The reader should note that these estimates are for excess cancers that might result in addition to those normally expected in an unexposed population
Cancer is a common illness and its occurrence in a population increases with the age of the population There are many different forms of cancer resulting from a variety of causes not all are fatal Approximately 14 to 13 of people living in the United States will develop cancer at some point in their lives [42]
Theoretical cancer risk estimates for exposure to cPAHs in sediments is considered insignificant (2 cancers estimated per 10000000 exposed) (see Appendix A Table A3) Although exposure to cPAHs may occur the magnitude is likely to be considerably less than the estimated minimum background exposure from sources in food water air sediment and soil Many areas of Fidalgo Bay are already under Ecology Agreed Orders The Orders require an RIFS be conducted to guide the selection of a cleanup remedy
Theoretical cancer risk estimates for exposure to seafood by the general population is very low (2 cancers estimated per 100000 exposed) (see Appendix B Tables B5) This estimate is within EPArsquos acceptable risk for fish consumption However this is based on bottom fish and shellfish data only Theoretical cancer risk estimates for exposure to seafood by Tribal consumers range from low to moderate (4 cancers estimated per 10000 exposed) and moderate to high (2 cancers estimated per 1000 exposed) (see Appendix C)
Multiple Chemical Exposures
A person can be exposed to more than one chemical through more than one pathway Exposure to a chemical through multiple pathways occurs if a contaminant is present in more than one medium (ie air soil surface water groundwater and sediment) For example the dose of a contaminant received from drinking water might be combined with the dose received from contact with the same contaminant in fish
For many chemicals much information is available on how the individual chemical produces effects However it is much more difficult to assess exposure to multiple chemicals Due to the large number of chemicals in the environment it is impossible to measure all of the possible interactions between these chemicals The potential exists for these chemicals to interact in the body and increase or decrease the potential for adverse health effects Individual cancer risk estimates can be added since they are measures of probability However when estimating non-cancer risk similarities must exist between the chemicals if the doses are to be added Groups of chemicals that have similar toxic effects can be added such as volatile organic compounds (VOCs) which cause liver toxicity Polycyclic aromatic hydrocarbons (PAHs) are another group of compounds that can be assessed as one combined dose based on similarities in chemical structure and metabolites
25
HC-Fidalgo Bay
The ATSDR Interaction Profile for persistent chemicals found in fish evaluates the possibility of interactive effects from exposure to a mixture of contaminants including mercury PCBs and dioxins [43]
Uncertainty
Assessment of risks attributable to environmental exposures is filled with many uncertainties Uncertainty with regard to the health assessment process refers to the lack of knowledge about factors such as chemical toxicity human variability human behavior patterns and chemical concentrations in the environment Uncertainty can be reduced through further study
The majority of uncertainty comes from our knowledge of chemical toxicity For most chemicals there is little knowledge of the actual health impacts that can occur in humans from environmental exposures unless epidemiological or clinical evidence exists As a result toxicological experiments are performed on animals These animals are exposed to chemicals at much higher levels than found in the environment The critical doses in animal studies are often extrapolated to real world exposures for use in human health risk assessments In order to be protective of human health uncertainty factors are used to lower that dose in consideration of variability in sensitivity between animals and humans and the variability within humans These uncertainty factors can account for a difference of two to three orders of magnitude when calculating risk Furthermore there are hundreds of chemicals for which little toxicological information is known in animals or humans These chemicals may in fact be toxic at some level but risks to humans cannot be quantified due to uncertainty
The majority of arsenic found in seafood is organic arsenic Inorganic arsenic in fish and shellfish ranged from about 1 to 20 of the total arsenic [20 22 23 24] Ecologyrsquos evaluation of shellfish and English sole in the Puget Sound indicated that less than 1 of the total arsenic found was in the inorganic form of arsenic [25] However since there was no arsenic speciation data for starry flounder DOH assumed that 10 of the total arsenic detected in bottom fish was inorganic arsenic Inorganic arsenic is much more harmful than organic arsenic therefore the arsenic evaluation may be overestimated
The amount of contaminated media (fish water air soil) that people eat drink inhale or absorb through their skin is another source of uncertainty Although recent work has improved our understanding of these exposure factors they are still a source of uncertainty In the case of Fidalgo Bay uncertainty exists with respect to how much fish people eat from Fidalgo Bay how often they are eating it what species they are eating how often children use public access areas and how much sediment or soil children may inadvertently eat Estimates are based on best available information or worst-case scenarios This evaluation is based on the assumption that 100 percent of the type of seafood (bottom fish and shellfish) harvested and consumed was from Fidalgo Bay
Another source of uncertainty is how seafood is actually prepared for consumption and laboratory testing (ie whole fish with guts versus gutless or fillets large clams with skin and gut ball) Bottom fish and clams may contain sediments in their digestive tracts that can affect the concentration of heavy metals during analysis Horse clams are a large clam and may show similar heavy metal patterns to geoduck clams where the skin and gut ball contain the major
26
HC-Fidalgo Bay
portion of heavy metals Bottom fish species should be analyzed without the gut and large clams should be analyzed without skin and without the gut for human health purposes
The amount and type of chemical in contaminated media is another source of uncertainty Environmental samples are very costly so it is not practical or efficient to analyze an adequate number of samples for every existing chemical Instead sampling usually focuses on contaminants that are thought to be present based on historic land use or knowledge of specific chemical spills
Fish Meal Limits
Several contaminants of concern are present in seafood from Fidalgo Bay Meal limits were calculated using the RfDMRL as the target risk value and the exposure parameters provided in Appendix E Table E1
Many factors must be considered when one is recommending limits on the consumption of seafood including the health benefits of eating fish the quality and comprehensiveness of environmental data and the availability of alternate sources of nutrition In addition these limits do not consider that multiple species are consumed a consideration that would require weighting the percent of each species consumed
Childrenrsquos Health Concerns
The potential for exposure and subsequent adverse health effects often increases for younger children compared with older children or adults ATSDR and DOH recognize that children are susceptible to developmental toxicity that can occur at levels much lower than those causing other types of toxicity The following factors contribute to this vulnerability
Children are more likely to play outdoors in contaminated areas by disregarding signs and wandering onto restricted locations
Children often bring food into contaminated areas resulting in hand-to-mouth activities Children are smaller and receive higher doses of contaminant exposures per body
weight Children are shorter than adults therefore they have a higher possibility of breathing in
dust and soil Fetal and child exposure to contaminants can cause permanent damage during critical
growth stages
These unique vulnerabilities of infants and children demand special attention in communities that have contaminated water food soil or air Childrenrsquos health was considered in the writing of this health consultation and the exposure scenarios treated children as the most sensitive population being exposed
27
HC-Fidalgo Bay
Conclusions
Based on the information provided DOH concludes the following
1 DOH concludes that consumption of seafood at tribal scenario rates is expected to harm children and adults health The Swinomish Samish Lummi and the Upper Skagit are tribes or nations that fish in this area or it is in their usual and accustomed fishing rights areas If any of the tribes or nations are using Fidalgo Bay for harvesting and is consuming at tribal scenario rates this would represent a ldquopublic health hazardrdquo The Swinomish Indian Tribal Community has stated ldquoFidalgo Bay historically an important harvest site is now impacted by contamination and thus not used for harvest in recent yearsrdquo [6] It may also be unlikely that 100 of a subsistence consumer (tribes or nations) would be consuming and harvesting from Fidalgo Bay only
2 DOH concludes that consuming bottom fish or shellfish from Fidalgo Bay is not expected to harm the general populationrsquos (children or adults) This area also falls under the Puget Sound Crab Advisory DOH recommends consuming only Dungeness and Red Rock crab from non-urban areas and that ldquocrab butterrdquo and viscera should not be eaten Based on contaminants of concern in bottom fish or shellfish calculated meal limits are 13 clams per month 14 crabs per month and 14 bottom fish per month (see Appendix E Tables E2 E3 and E4) Table E5 shows the adjustment of meal size based on the body weight of the consumer
3 DOH concludes that touching breathing or accidentally eating sediment one-day-pershyweek or 52 days per year from Fidalgo Bay is not expected to harm peoplersquos health The maximum level of carcinogenic polycyclic aromatic hydrocarbons (cPAHs) in this exposure scenario is below levels known to result in non-cancer harmful health effects In addition the exposure scenario does not present an elevated theoretical cancer risk
Recommendations
1 DOH recommends Ecology perform the necessary site remedial investigation and feasibility study (RIFS) as they work through the process of cleaning up Fidalgo Bay Proceeding with the planned cleanup will contribute to a significant reduction in human health risk
2 DOH recommends Ecology perform long-term monitoring of Fidalgo Bay DOH is available to review a monitoring plan and monitoring results
3 DOH recommends following the Puget Sound Recreational Marine Area 7 Fish Consumption Advisory and the Puget Sound crab consumption advisory that states
Eat no more than one meal per week for rockfish and Chinook salmon and no more than one meal per month for resident (blackmouth) Chinook salmon
28
HC-Fidalgo Bay
Eat Dungeness and Red Rock crab from non-urban areas and do not eat the ldquocrab butterrdquo (viscera) More information regarding these advisories is available at httpwwwdohwagovehpoehasfishrma7htm or by calling toll-free 1-877-485shy7316
4 DOH also recommends following the meal limits calculated in Appendix E Eat no more than 13 or 14 eight-ounce meals per month of clams crabs bottom fish (English sole and Starry Flounder) or any combination thereof
General Advice
DOH encourages all Washingtonians to eat at least two fish meals per week as part of a heart healthy diet in accordance with American Heart Association (AHA) recommendations People may eat fish more than two times weekly but such frequent consumers should take the following steps to reduce exposure to contaminants in the fish that they eat
bull Eat a variety of fish that are low in contaminants according to guidance provided on our website at httpwwwdohwagovfish
bull Follow fish advisory advice provided by DOH (website listed below) and local health agencies for water bodies where you fish httpwwwdohwagovehpoehasfishfishadvisorieshtm
bull Young children and small adults should eat proportionally smaller meal sizes bull Grill bake or broil fish so that fat drips off while cooking bull Eat fillets without the skin bull Mercury and other metals are stored in the fillet of the fish and will not be reduced by preparing fish this way
Public Health Action Plan
Actions Planned
1 DOH will coordinate with Ecology to provide an educational materials fact sheet
2 DOH will provide copies of this health consultation to Ecology and concerned parties
3 DOH will be available at Ecologyrsquos planned public meetings in the Fidalgo Bay community
29
HC-Fidalgo Bay
Author
Lenford OrsquoGarro Washington State Department of Health
Office of Environmental Health Assessments Site Assessment Section
Designated Reviewer Dan Alexanian Manager Site Assessment Section
Office of Environmental Health Assessments Washington State Department of Health
ATSDR Technical Project Officer Audra Henry
Cooperative Agreement and Program Evaluation Branch Division of Health Assessment and Consultation
Agency for Toxic Substances and Disease Registry
30
HC-Fidalgo Bay
References
1 SAIC 2007 Fidalgo Bay Sediment Investigation Anacortes WA Sediment Sampling and Analysis Plan Prepared for the Washington State Department of Ecology Prepared by Science Applications International Corporation (SAIC) Bothell WA September 17 2007
2 Fidalgo Bay Causeway feasibility study Request for funding from Department of Ecology Prepared by Samish Indian Nation May 4 2007 httpwwwsamishtribensnusdnrDOE2042007pdf
3 Washington State Department of Natural Resources Fidalgo Bay Environmental Aquatic Reserve management plan Skagit County Washington April 2008 Prepared by Aquatic resources program httpwwwdnrwagovPublicationsaqr_rsve_fid_mgmt_planpdf
4 SAIC 2008 Fidalgo Bay Sediment Investigation Anacortes WA Final Report Prepared for the Washington State Department of Ecology Prepared by Science Applications International Corporation (SAIC) Bothell WA March 31 2008
5 SAIC 2008 Fidalgo Bay Sediment Investigation Anacortes WA Archived Sediment and Tissue Analytical Results Data Report Addendum Prepared for the Washington State Department of Ecology Prepared by Science Applications International Corporation (SAIC) Bothell WA September 2008
6 Swinomish Water Resources Program December 1 2006 Bioaccumulative Toxics in Subsistence-Harvested Shellfish ndash Contaminant Results and Risk Assessment Swinomish Indian Tribal Community La Conner WA
7 Van den Berg M Birnbaum LS Denison M De Vito M Farland W Feeley M Fiedler H Hakansson H Hanberg A Haws L Rose M Safe S Schrenk D Tohyama C Tritscher A Tuomisto J Tysklind M Walker N amp Peterson RE (2006) The 2005 World Health Organization Reevaluation of Human and Mammalian Toxic Equivalency Factors for Dioxins and Dioxin-Like Compounds Toxicol Sci 93 223-241 Available at httptoxscioxfordjournalsorgcgicontentabstract932223
8 US Environmental Protection Agency Guidance for assessing chemical contaminant data for use in fish advisories volume 2 risk assessment and fish consumption limits third edition Office of Water Washington DC EPA 823-B-00-008 2000b
9 United States Environmental Protection Agency Framework for Selecting and Using Tribal Fish and Shellfish Consumption Rates for Risk-Based Decision Making at CERCLA and RCRA Cleanup Sites in Puget Sound and the Strait of Georgia August 2007
10 United States Environmental Protection Agency Estimated Per Capita Fish Consumption in the United States EPA 821-C-02-003 2002
31
HC-Fidalgo Bay
11 Toy KA Polissar NL Liao S and Mittelstaedt GD 1996 A fish consumption survey of the Tulalip and Squaxin Island tribes of the Puget Sound region Tulalip Tribes Department of Environment 7615 Totem Beach Road Marysville WA 98271
12 The Suquamish Tribe 2000 Fish Consumption Survey of the Suquamish Tribe of the Port Madison Indian Reservation Puget Sound Region The Suquamish Tribe 15838 Sandy Hook Road Post Office Box 498 Suquamish WA 98392
13 Alaska Division of Public Health The use of traditional foods in a healthy diet in Alaska risks in perspective 1999 Jan15
14 US Environmental Protection Agency and Toxicology Excellence for Risk Assessment August comparative dietary risks balancing the risks and benefits of fish consumption1999 Aug
15 American Heart Association An eating plan for healthy Americans Available at httpwwwamericanheartorgdietary guidelinesimagesEatPlan2000pdf
16 Hora ME Reduction of polychlorinated biphenyl (PCB) concentrations in carp (Cyprinus carpio) fillets through skin removal Bull Environ Contam Toxicol 1981 Mar 26 (3)364shy6
17 Wilson ND Shear NM Paustenbach DJ Price PS The effect of cooking practices on the concentration of DDT and PCB compounds in the edible tissue of fish J Exp Anal Environ Epidemiol 1998 Jul-Sep 8(3) 423-40
18 Zabik ME Zabik MJ Polychlorinated biphenyls polybrominated biphenyls and dioxin reduction during processingcooking food Adv Exp Med Biol1999459213-31
19 Toxics Cleanup Program Department of Ecology Natural background soil metals concentrations in Washington State Publication No 94-115Olympia Washington State Department of Ecology October 1994
20 Agency for Toxic Substances and Disease Registry (ATSDR) Toxicological profile for arsenic (update) PB2000108021 Atlanta GA US Department of Health and Human Services Public Health Service September 2005
21 US Environmental Protection Agency Toxicological Review of Inorganic Arsenic In support of summary information on the Integrated Risk Information System July 2005 httpwwwepagovwatersciencecriteriaarsenicsabAsDraft_SABpdf
22 NAS 2001b Arsenic in Drinking Water 2001 Update National Academy Press Washington DC 2001 Available at httpbooksnapedubooks0309076293htmlindexhtml
23 Francesconi KA and Edmonds JS 1997 Arsenic and marine organisms Advances in Inorganic Chemistry 44147-189
32
HC-Fidalgo Bay
24 US Food and Drug Administration (FDA) 1993 Guidance document for arsenic in shellfish Department of Health and Human Services Public Health Service Food and Drug Administration Center for Food Safety and Applied Nutrition Washington DC January 1993 Available at httpwwwfoodsafetygov~frfguid-ashtml
25 Washington State Department of Ecology Environmental Assessment Program Inorganic arsenic levels in Puget Sound fish and shellfish from 303(d) listed water bodies and other areas Prepared by Art Johnson and Morgan Roose Publication No 02-03-057 Olympia Washington State Department of Ecology December 2002
26 US Department of Health and Human Services Agency for Toxic Substances and Disease Registry Toxicological profile for Cadmium (update) PB99166621 Atlanta US Department of Health and Human Services July 1999
27 Anderson RA Polansky MM Bryden NA Patterson KY Veillon C Glinsmann WH 1983 Effects of chromium supplementation on urinary Cr excretion of human subjects and correlation of Cr excretion with selected clinical parameters J Nutr 113276ndash81 Cited in Agency for Toxic Substances and Disease Registry 2000 Toxicological profile for chromium Atlanta US Department of Health and Human Services September 2000 Available at httpwwwatsdrcdcgovtoxprofilestp7html
28 Anderson RA 1986 Chromium metabolism and its role in disease processes in man Clin Physiol Biochem 431ndash41 Cited in Agency for Toxic Substances and Disease Registry 2000 Toxicological profile for chromium Atlanta US Department of Health and Human Services September 2000 Available at httpwwwatsdrcdcgovtoxprofilestp7html
29 Donaldson RM Barreras RF 1966 Intestinal absorption of trace quantities of chromium J Lab Clin Med 68484ndash493 Cited in Agency for Toxic Substances and Disease Registry 2000 Toxicological profile for chromium Atlanta US Department of Health and Human Services September 2000 Available at httpwwwatsdrcdcgovtoxprofilestp7html
30 Agency for Toxic Substances and Disease Registry Toxicological profile for chlorinated dibenzo-p-dioxins (update) Draft for public comment Atlanta US Department of Health and Human Services 2000
31 National Toxicology Program Carcinogenesis bioassay of 2378- tetrachlorodibenzo-pshydioxin in Swiss-Webster mice (gavage study) Carcinogenesis Testing Program National Cancer Institute National Institute of Health National Toxicology Program Bethesda MD DHHS publication no 82-1765 1982
32 United States Environmental Protection Agency Health assessment document for polychlorinated dibenzo-p-dioxins Washington DC US Environmental Protection Agency Office of Health and Environmental Assessment EPA report no 6008-84014 1985
33
HC-Fidalgo Bay
33 United States Environmental Protection Agency Report on the peer review of the dioxin reassessment documents toxicity equivalency factors for dioxin and related compounds (Chapter 9) and integrated risk characterization document Alexandria VA National Center for Environmental Assessment 2000
34 Agency for Toxic Substances and Disease Registry (ATSDR) Analysis Paper Impact of Lead-Contaminated Soil on Public Health US Department of Health and Human Services Public Health Service Atlanta Georgia May 1992
35 CDC Preventing lead poisoning in young children a statement by the Centers for Disease Control October 1991 Atlanta Georgia US Department of Health and Human Services Public Health Service CDC 1991
36 US Department of Health and Human Services Agency for Toxic Substances and Disease Registry Toxicological profile for Lead (update) PB99166704 Atlanta US Department of Health and Human Services July 1999
37 Agency for Toxic Substances and Disease Registry (ATSDR) Lead Toxicity (Case studies in environmental medicine Course) SS3059 Atlanta US Department of Health and Human Services Public Health Service October 2000
38 US Department of Health and Human Services Agency for Toxic Substances and Disease Registry Toxicological Profile for Polycyclic Aromatic Hydrocarbons (PAHs) (update) PB95264370 Atlanta US Department of Health and Human Services August 1995
39 Phillips D H Polycyclic Aromatic Hydrocarbons in the diet Mutation Research 1999 (443) 139-147
40 US Environmental Protection Agency Technical Review Workgroup for Lead Userrsquos Guide for the Integrated Exposure Uptake Biokinetic Model for Lead in Children (IEUBK) Windows version 10 OSWER Directive No92857-42 Document No EPA 540-K-01-005 Washington DC May 2002
41 US Environmental Protection Agency Guidelines for Carcinogen Risk Assessment (Review Draft) NCEA-F-0644 July 1999 Available at httpwwwepagovNCEArafcancerhtm
42 ATSDR Agency for Toxic Substances and Disease Registry ATSDR Fact Sheet Cancer Updated August 30 2002 Atlanta US Department of Health and Human Services Available at httpwwwatsdrcdcgovCOMcancer-fshtml
43 Agency for Toxic Substances and Disease Registry (ATSDR) Interaction Profile for persistent chemicals found in fish US Department of Health and Human Services Public Health Service May 2004
34
HC-Fidalgo Bay
44 National Center for Environmental Assessment Exposure Factors Handbook Volume 1 ndash General Factors EPA600P-95002Fa US Environmental Protection Agency August 1997
35
HC-Fidalgo Bay
Figure 1 Demographic statistics within three miles of the site - Fidalgo Bay Skagit County
Total Population 11704 White 10818 Black 33 American Indian Eskimo Aleut 143 Asian or Pacific Islander 211 Other Race 176 Hispanic Origin 386 Children Aged 6 and Younger 943 Adults Aged 65 and Older 2310 Females Aged 15 - 44 2088 Total Aged over 18 8900 Total Aged under 18 2804 Total Housing Units 5295
Calculated using the area proportion technique Source 2000 US CENSUS
36
HC-Fidalgo Bay
Figure 2 Red box indicates the Fidalgo Bay site location Skagit County Washington
37
HC-Fidalgo Bay
Figure 3 Ecologyrsquos sediment and biota sample areas within Fidalgo Bay Skagit County Washington
38
HC-Fidalgo Bay
Appendix A This section provides calculated exposure doses and assumptions used for exposure to chemicals in sediments at the Fidalgo Bay site Three different exposure scenarios were developed to model exposures that might occur These scenarios were devised to represent exposures to a child (0-5 yrs) an older child and an adult The following exposure parameters and dose equations were used to estimate exposure doses from direct contact with chemicals in sediments
Exposure to chemicals in soil via ingestion inhalation and dermal absorption
Total dose (non-cancer) = Ingested dose + inhaled dose + dermally absorbed dose
Ingestion Route
Dose(non-cancer (mgkg-day) = C x CF x IR x EF x ED BW x ATnon-cancer
Cancer Risk = C x CF x IR x EF x CPF x ED BW x ATcancer
Dermal Route
Dermal Transfer (DT) = C x AF x ABS x AD x CF ORAF
Dose(non-cancer (mgkg-day) = DT x SA x EF x ED BW x ATnon-cancer
Cancer Risk = DT x SA x EF x CPF x ED BW x ATcancer
Inhalation Route
Dosenon-cancer (mgkg-day) = C x SMF x IHR x EF x ED x 1PEF BW x ATnon-cancer
Cancer Risk = C x SMF x IHR x EF x ED x CPF x 1PEF BW x ATcancer
39
HC-Fidalgo Bay
Table A1 Exposure assumptions used to estimate cPAHs doses from direct contact with sediments in Fidalgo Bay Anacortes WA
Parameter Value Unit Comments Concentration (C) Variable mgkg Maximum detected value
Conversion Factor (CF) 0000001 kgmg Converts contaminant concentration from milligrams (mg) to kilograms (kg)
Ingestion Rate (IR) ndash adult 100 mgday Exposure Factors Handbook [44] Ingestion Rate (IR) ndash older child 100
Ingestion Rate (IR) - child 200 Exposure Frequency (EF) 52 Daysyear One days a week
Exposure Duration (Ed) 30 (5 1015) years Number of years at one residence (child older child adult yrs)
Body Weight (BW) - adult 72 kg
Adult mean body weight Body Weight (BW) ndash older child 41 Older child mean body weight Body Weight (BW) - child 15 0-5 year-old child average body weight Surface area (SA) - adult 5700
cm2 Exposure Factors Handbook Surface area (SA) ndash older child 2900 Surface area (SA) - child 2900 Averaging Timenon-cancer (AT) 1825 days 5 years Averaging Timecancer (AT) 27375 days 75 years Cancer Potency Factor (CPF) 73 mgkg-day-1 Source EPA 24 hr absorption factor (ABS) 013 unitless Source EPA (Chemical Specific) PAH Oral route adjustment factor (ORAF) 1 unitless Non-cancer (nc) cancer (c) - default Adherence duration (AD) 1 days Source EPA
Adherence factor (AF) 02
mgcm2 Child older child 007 Adult
Inhalation rate (IHR) - adult 152 m3day Exposure Factors Handbook [44] Inhalation rate (IHR) ndash older child 14
Inhalation rate (IHR) - child 83 Soil matrix factor (SMF) 1 unitless Non-cancer (nc) cancer (c) - default Particulate emission factor (PEF) 145E+7 m3kg Model Parameters
40
HC-Fidalgo Bay
Fidalgo Bay Sediment Exposure Route ndash Non-cancer
Table A2 Non-cancer hazard calculations resulting from exposure to cPAHs in sediments from Fidalgo Bay Anacortes WA
Contaminant
TEQ Concentra
tion (ppm)
(mgkg)
Scenarios
Estimated Dose (mgkgday)
Total Dose LOAEL
(mgkgday)
Total Dose LOAELIncidental
Ingestion of Soil
Dermal Contact
with Soil
Inhalation of Particulates
Child 194E-7 730E-8 134E-11 267E-7 000000003
cPAH 0102 Older Child 354E-8 267E-8 828E-12 622E-8 10E+1 0000000006
Adult 202E-8 105E-8 512E-12 307E-8 0000000003
Fidalgo Bay Sediment Exposure Route ndash Cancer
Table A3 Cancer hazard calculations resulting from exposure to cPAHs sediments from Fidalgo Bay Anacortes WA
Contaminant Concentra tion (ppm)
EPA cancer Group
Cancer Potency Factor
(mgkg-day-1)
Scenarios
Increased Cancer Risk Total
Cancer RiskIncidental
Ingestion of Soil
Dermal Contact
with Soil
Inhalation of Particulates
Child 943E-8 355E-8 653E-12 130E-7
Total cPAH TEQ 0102 B2 73 Older Child 345E-8 260E-8 806E-12 605E-8
Adult 295E-8 153E-8 747E-12 448E-8
Lifetime cancer risk 130E-7 + 605E-8 + 448E-8 = 235E-7
41
HC-Fidalgo Bay
Appendix B
This section provides calculated exposure doses and exposure assumptions used for chemicals in bottom fish shellfish and crab samples taken from Fidalgo Bay These exposure scenarios were developed to model exposures that might occur and were devised to represent exposures to the general population The following exposure parameters and dose equations were used to estimate exposure doses from ingestion of contaminants in bottom fish and shellfish
Ingestion Route
Dose(non-cancer (mgkg-day) = C x CF1 x IR x CF2 x EF x ED BW x ATnon-cancer
Cancer Risk = C x CF1 x IR x CF2 x EF x CPF x ED BW x ATcancer
Table B1 Exposure assumptions used in exposure evaluation of contaminants in bottom fish shellfish and crab samples taken from Fidalgo Bay in Anacortes Washington
Parameter Value Unit Comments Concentration (C) Variable ugkg Average detected value
Conversion Factor (CF1) 0001 mgkg Converts contaminant concentration from milligrams (mg) to kilograms (kg)
Conversion Factor (CF2) 0001 kgg Converts mass of shellfish from grams (g) to kilograms (kg)
Ingestion Rate (IR) 057
gday
Body weight-adjusted shellfish consumption rates to account for children eating nearly 16 times as much fish per body weight as do adults (see table B2)
Ingestion Rate (IR) 028 Average general population child ndash bottom fish (see table B3)
Ingestion Rate (IR) 081 Body weight-adjusted shellfish consumption rates to account for an older child eating 081 times as much fish per body weight as do adults (see table B2)
Ingestion Rate (IR) 036 Average general population older child ndash bottom fish (see table B3)
Ingestion Rate (IR) 17 Average general population adult - shellfish
Ingestion Rate (IR) 07 Average general population adult ndash bottom fish (see table B3)
Exposure Frequency (EF) 365 Daysyear Assumes daily exposure
Exposure Duration (ED) 6 years
Number of years at one residence (child) Exposure Duration (ED) 30 Number of years at one residence (adult) Body weight (BW) 15
kg Mean body weight child
Body weight (BW) 70 Mean body weight adult Averaging Timenon-cancer (AT) Variable days Equal to Exposure Duration Averaging Timecancer (AT) 25550 days 70 years Cancer Potency Factor (CPF) Variable mgkg-day-1 Source EPA ndash Chemical specific
42
HC-Fidalgo Bay
Table B2 Derivation of a childrsquos shellfish consumption rate for the general US population
Row Parameter Adult Older Child (6-17 yrs)
Child (0-6 yrs)
1 Reported All Fish Consumption Rate-gram fish per kg bodyweight per day (gkgday)
0277 0225 0433
2 Ratio to Adult All Fish Consumption Rate
1 081 16
3 Reported Shellfish Consumption (gday)
170 (average) Not Reported Not Reported
4 Average Body Weight (kg) 70 41 15 5 Ratio to Adult BW 1 059 021 6 Adjusted Shellfish Consumption Rates
(gday) = Row 2 x Row 3 x Row 5
170 (average) 081 (average) 057 (average)
Table B3 Derivation of bottom consumption rate for the general US population based on four percent of total fish intake
Row Parameter Adult Older Child (6-17 yrs)
Child (0-6 yrs)
1 Reported All Fish Consumption Rateshy(gday)
175 90 70
2 Assume bottom fish intake rate similar to tribal at about 4 percent [15]
004 004 004
3 Adjusted bottom fish rates (gday) = Row 1 x Row 2
070 036 028
43
HC-Fidalgo Bay
Table B4 Exposure dose and non-cancer risk from ingesting seafood at the average concentrations of contaminants in bottom fish clams and crab samples taken from Fidalgo Bay in Anacortes Washington
Species Contaminant Average Concentration
(ppm)
Estimated Dose (mgkgday)
General population Average
MRL or RfD (mgkgday)
Hazard quotient
General population Average
Clams
Arsenic
0027 Child 103E-6
300E-4
0003 Older child 533E-7 0002
Adult 656E-7 0002
Crabs 0071 Child 270E-6 0009
Older child 140E-6 0005 Adult 172E-6 0006
Bottom Fish 015 Child 260E-6 0009
Older child 132E-6 0004 Adult 150E-6 0005
Crabs Cadmium 048 Child 182E-5
100E-3 0018
Older child 948E-6 0009 Adult 117E-5 0012
Clams Chromium 184 Child 699E-5
300E-3 0023
Older child 364E-5 0012 Adult 447E-5 0015
Clams
Dioxin
799E-8 Child 304E-12
10E-9
0003 Older child 158E-12 00016
Adult 194E-12 00019
Crabs 975E-8 Child 371E-12 00037
Older child 193E-12 00019 Adult 237E-12 00024
Bottom Fish 134E-7 Child 250E-12 0003
Older child 118E-12 00012 Adult 134E-12 00013
Crabs
Mercury
0049 Child 186E-6
100E-4
0019 Older child 968E-7 00097
Adult 119E-6 0012
Bottom Fish 0042 Child 784E-7 0008
Older child 369E-7 00037 Adult 420E-7 00042
PPM ndash parts per million
44
HC-Fidalgo Bay
Table B5 Cancer risk from ingesting seafood at the average concentrations of contaminants in bottom fish clams and crab samples taken from Fidalgo Bay in Anacortes Washington
Species Contaminant Average Concentration
(ppm)
Cancer Potency Factor
(mgkg-day-1)
Increased Cancer Risk
General population Average
Total Cancer Risk General population
Average
Clams
Arsenic
0027
57
Child 501E-7
153E-5
Older child 434E-7 Adult 160E-6
Crabs 0071 Child 132E-6
Older child 114E-6 Adult 421E-6
Bottom Fish 015 Child 137E-6
Older child 107E-6 Adult 366E-6
Clams
Dioxin
799E-8
15E+5
Child 390E-8
582E-7
Older child 338E-8 Adult 125E-7
Crabs 975E-8 Child 476E-8
Older child 413E-8 Adult 152E-7
Bottom Fish 134E-7 Child 322E-8
Older child 252E-8 Adult 861E-8
Sum of cancer risk 159E-5
45
HC-Fidalgo Bay
Appendix C This section provides calculated exposure doses and assumptions used for exposure to chemicals in seafood at the Fidalgo Bay site using Tulalip Tribe consumption rates It is based on the EPA Tribal framework for fish and shellfish consumption rates for risk-based decisions
Intake of contaminant in mgkg-day (IR ) = (CF x CR x x UCF ) BW c i PS i 1
[Equation 1] Where IR = Intake rate of contaminant by category of fishshellfish
c
CF = contaminant concentration (mgkg) in the tissue of the particular fish or shellfish category i
CR = the total consumption rate of fish and shellfish harvested from Puget Sound 194 grams per PS
day = the percentage of the ingestion rate that consists of the category of fish or shellfish unitless
i
BW = body weight 818 kilograms observed from the Tulalip Tribesrsquo study UCF = conversion factor 1 0001 kilograms per gram
1
Estimated cancer risk (ECR) = (IR x ED x EF x CSF) (AT x UCF ) [Equation 2] total 2
Where IR = Total intake of contaminant from site-related fish and shellfish consumption
total
ED = exposure duration 70 years EF = exposure frequency 365 days per year CSF = oral cancer slope factor for contaminant AT = averaging time 70 years for carcinogens UCF = conversion factor 2 (365 daysyear)
2
Estimated hazard index (EHI) = (IR x ED x EF x UCF ) (RfD x AT) [Equation 3] total 2
Where IR = Total intake of contaminant from site-related fish and shellfish consumption
total
ED = exposure duration 70 years EF = exposure frequency 365 days per year RfD = Oral reference dose for contaminant AT = averaging time the same as exposure duration for non-carcinogenic effects UCF = conversion factor 2 (1 yr365 days)
2
46
HC-Fidalgo Bay
Table C1 Fidalgo Bay arsenic intake rate based on the Tulalip Tribe seafood consumption rate Anacortes Washington
Overall FishShellfish Consumption Rate gday
Category Percent of Consumption Rate Represented by Category
Site-related concentration of arsenic mgkg in tissue
Category Specific Exposure mgkg-day
194 Salmon 497 0 0 194 Pelagic Fish 42 0 0 194 Bottom Fish 39 015 00000139 194 Shellfish 422 0049 00000490 Sum IRtotal 00000629 Crabs tissues and clams average
Arsenic Estimated hazard index = 021
Arsenic Estimated cancer risk = 21E-3
Table C2 Fidalgo Bay cadmium intake rate based on the Tulalip Tribe seafood consumption rate Anacortes Washington
Overall FishShellfish Consumption Rate gday
Category Percent of Consumption Rate Represented by Category
Site-related concentration of cadmium mgkg in tissue
Category Specific Exposure mgkg-day
194 Salmon 497 0 0 194 Pelagic Fish 42 0 0 194 Bottom Fish 39 0 0 194 Shellfish 422 048 000048 Sum IRtotal 000048 Crabs tissues only average
Cadmium Estimated hazard index = 03
47
HC-Fidalgo Bay
Table C3 Fidalgo Bay chromium intake rate based on Tulalip Tribe seafood consumption rate Anacortes Washington
Overall FishShellfish Consumption Rate gday
Category Percent of Consumption Rate Represented by Category
Site-related concentration of chromium mgkg in tissue
Category Specific Exposure mgkg-day
194 Salmon 497 0 0 194 Pelagic Fish 42 0 0 194 Bottom Fish 39 0 0 194 Shellfish 422 184 000184 Sum IRtotal 000184 Clams tissues only average
Chromium Estimated hazard index = 061
Table C4 Fidalgo Bay dioxin intake rate based on the Tulalip Tribe seafood consumption rate Anacortes Washington
Overall FishShellfish Consumption Rate gday
Category Percent of Consumption Rate Represented by Category
Site-related concentration of dioxin mgkg in tissue
Category Specific Exposure mgkg-day
194 Salmon 497 0 0 194 Pelagic Fish 42 0 0 194 Bottom Fish 39 134E-7 124E-11 194 Shellfish 422 887E-8 888E-11 Sum IRtotal 101E-10 Crabs tissues and clams average
Dioxin Estimated hazard index = 010
Dioxin Estimated cancer risk = 152E-5
48
HC-Fidalgo Bay
Table C5 Fidalgo Bay mercury intake rate based on the Tulalip Tribe seafood consumption rate Anacortes Washington
Overall FishShellfish Consumption Rate gday
Category Percent of Consumption Rate Represented by Category
Site-related concentration of mercury mgkg in tissue
Category Specific Exposure mgkg-day
194 Salmon 497 0 0 194 Pelagic Fish 42 0 0 194 Bottom Fish 39 0042 000000388 194 Shellfish 422 0049 0000049 Sum IRtotal 00000529 Crabs tissues only average
Mercury Estimated hazard index = 053
49
HC-Fidalgo Bay
This section provides calculated exposure doses and assumptions used for exposure to chemicals in seafood at Fidalgo Bay using Suquamish Tribe consumption rates It is based on the EPA Tribal framework for fish and shellfish consumption rates for risk-based decisions
Intake of contaminant in mgkg-day (IR ) = (CF x CR x x UCF ) BW c i PS i 1
[Equation 1] Where IR = Intake rate of contaminant by category of fishshellfish
c
CF = contaminant concentration (mgkg) in the tissue of the particular fish or shellfish category i
CR = the total consumption rate of fish and shellfish harvested from Puget Sound 7668 grams per PS
day = the percentage of the ingestion rate that consists of the category of fish or shellfish unitless
i
BW = body weight 79 kilograms observed from the Suquamish Tribesrsquo study UCF = conversion factor 1 0001 kilograms per gram
1
Estimated cancer risk (ECR) = (IR x ED x EF x CSF) (AT x UCF ) [Equation 2] total 2
Where IR = Total intake of contaminant from site-related fish and shellfish consumption
total
ED = exposure duration 70 years EF = exposure frequency 365 days per year CSF = oral cancer slope factor for contaminant AT = averaging time 70 years for carcinogens UCF = conversion factor 2 (365 daysyear)
2
Estimated hazard index (EHI) = (IR x ED x EF x UCF ) (RfD x AT) [Equation 3] total 2
Where IR = Total intake of contaminant from site-related fish and shellfish consumption
total
ED = exposure duration 70 years EF = exposure frequency 365 days per year RfD = Oral reference dose for contaminant AT = averaging time the same as exposure duration for non-carcinogenic effects UCF = conversion factor 2 (1 yr365 days)
2
50
HC-Fidalgo Bay
Table C6 Fidalgo Bay arsenic intake rate based on Suquamish Tribe seafood consumption rate Anacortes Washington
Overall FishShellfish Consumption Rate gday
Category Percent of Consumption Rate Represented by Category
Site-related concentration of arsenic mgkg in tissue
Category Specific Exposure mgkg-day
7668 Salmon 239 0 0 7668 Pelagic Fish 73 0 0 7668 Bottom Fish 38 015 00000553 7668 Shellfish 65 0049 0000309 Sum IRtotal 0000364 Crabs tissues and clams average
Arsenic Estimated hazard index = 12
Arsenic Estimated cancer risk = 359E-4
Table C7 Fidalgo Bay cadmium intake rate based on Suquamish Tribe seafood consumption rate Anacortes Washington
Overall FishShellfish Consumption Rate gday
Category Percent of Consumption Rate Represented by Category
Site-related concentration of cadmium mgkg in tissue
Category Specific Exposure mgkg-day
7668 Salmon 239 0 0 7668 Pelagic Fish 73 0 0 7668 Bottom Fish 38 0 0 7668 Shellfish 65 048 0003 Sum IRtotal 0003 Crabs tissues only average
Cadmium Estimated hazard index = 3
51
HC-Fidalgo Bay
Table C8 Fidalgo Bay chromium intake rate based on Suquamish Tribe seafood consumption rate Anacortes Washington
Overall FishShellfish Consumption Rate gday
Category Percent of Consumption Rate Represented by Category
Site-related concentration of chromium mgkg in tissue
Category Specific Exposure mgkg-day
7668 Salmon 239 0 0 7668 Pelagic Fish 73 0 0 7668 Bottom Fish 38 0 0 7668 Shellfish 65 184 00116 Sum IRtotal 00116 Clams tissues only average
Chromium Estimated hazard index = 387
Table C9 Fidalgo Bay dioxin intake rate based on Suquamish Tribe seafood consumption rate Anacortes Washington
Overall FishShellfish Consumption Rate gday
Category Percent of Consumption Rate Represented by Category
Site-related concentration of dioxin mgkg in tissue
Category Specific Exposure mgkg-day
7668 Salmon 239 0 0 7668 Pelagic Fish 73 0 0 7668 Bottom Fish 38 134E-7 494E-11 7668 Shellfish 65 887E-8 56E-10 Sum IRtotal 609E-10 Crabs tissues and clams average
Dioxin Estimated hazard index = 061 Dioxin Estimated cancer risk = 914E-5
52
HC-Fidalgo Bay
Table C10 Fidalgo Bay mercury intake rate based on Suquamish Tribe seafood consumption rate Anacortes Washington
Overall FishShellfish Consumption Rate gday
Category Percent of Consumption Rate Represented by Category
Site-related concentration of mercury mgkg in tissue
Category Specific Exposure mgkg-day
7668 Salmon 239 0 0 7668 Pelagic Fish 73 0 0 7668 Bottom Fish 38 0042 00000155 7668 Shellfish 65 0049 0000309 Sum IRtotal 000032 Crabs tissues only average
Mercury Estimated hazard index = 32
53
HC-Fidalgo Bay
Appendix D
Lead exposure shellfish ingestion scenario used in the IEUBK model
This section provides inputs for the IEUBK model The following inputs to the model were used to account for the average shellfish ingestion lead exposure from Fidalgo Bay Anacortes Washington
Consumption rates shellfish general population child ndash 057 gday bottom fish general population child ndash 028 gday
The IEUBK model assumes that a childrsquos total meat intake is 935 gday EPArsquos target cleanup goal is no more than 5 of the community with BLLs above 10 microgdL Default assumptions were used unless noted
Table D1 Blood lead values determined using the IEUBK model for lead in seafood from Fidalgo Bay Anacortes Washington
Seafood Average
Concentration (ppm)
Percent meat intake as shellfish
()
Blood Lead level in percent above 10 ugdl Age range 0 - 84 months
Shellfish 121 061 14
Bottom fish
129 030 13
Average Blood Lead level in percent above 10ugdl Age range 0 - 84 months
135
PPM ndash parts per million Crabs tissues and clams average
54
HC-Fidalgo Bay
The IEUBK model assumes that a childrsquos total meat intake is 935 gday EPArsquos target cleanup goal is no more than 5 of the community with BLLs above 10 microgdL Default assumptions were used unless noted
Percent of consumption rates represented by category were obtained by using the mean because the 90th percentile did not add up to the total intake of seafood However the overall consumption rate was based on the 90th percentile consumers only
Consumption rates Tulalip Tribe child ndash shellfish (58 gday) and bottom fish (014 gday)
Table D2 Fidalgo Bay lead intake rate based on Tulalip Tribe child seafood consumption rate Anacortes Washington
Overall FishShellfish Consumption Rate gday
Category Percent of Consumption
Rate Represented by
Category
Site-related Consumption Rate gday
1107 Salmon 284 0 1107 Pelagic Fish 18 0 1107 Bottom Fish 13 014 1107 Shellfish 523 58
Crabs tissues and clams average
Table D3 Blood lead values determine using the IEUBK model for lead in seafood from Fidalgo Bay Anacortes Washington
Seafood Average
Concentration (ppm)
Percent meat intake as shellfish
()
Blood Lead level in percent above 10ugdl Age range 0 - 84 months
Shellfish 121 62 426
Bottom fish 129 015 125 Average Blood Lead level in percent above 10ugdl Age range 0 - 84 months
276
PPM ndash parts per million Crabs tissues and clams average
55
HC-Fidalgo Bay
The IEUBK model assumes that a childrsquos total meat intake is 935 gday EPArsquos target cleanup goal is no more than 5 of the community with BLLs above 10 microgdL Default assumptions were used unless noted
Percent of consumption rates represented by category were obtained by using the mean because the 90th percentile did not add up to the total intake of seafood However the overall consumption rate was based on the 90th percentile consumers only
Consumption rates Suquamish Tribe child ndash shellfish 2926 gday and bottom fish 108 gday
Table D4 Fidalgo Bay lead intake rate based on Suquamish Tribe child seafood consumption rate Anacortes Washington
Overall FishShellfish Consumption Rate gday
Category Percent of Consumption
Rate Represented by
Category
Site-related Consumption Rate gday
5398 Salmon 183 0 5398 Pelagic Fish 91 0 5398 Other 162 0 5398 Bottom Fish 2 108 5398 Shellfish 542 2926
Crabs tissues and clams average
Table D5 Blood lead values determine using the IEUBK model for lead in seafood from Fidalgo Bay Anacortes Washington
Seafood Average
Concentration (ppm)
Percent meat intake as shellfish
()
Blood Lead level in percent above 10ugdl Age range 0 - 84 months
Shellfish 121 3129 3243
Bottom fish 129 116 163 Average Blood Lead level in percent above 10ugdl Age range 0 - 84 months
1703
PPM ndash parts per million Crabs tissues and clams average
56
HC-Fidalgo Bay
Lead exposure shellfish ingestion scenario used in the Adult lead model
This section provides inputs for the Adult lead model EPArsquos target cleanup goal is no more than 5 of the community with BLLs above 10 microgdL Default assumptions were used unless noted
Table D6 Blood lead values determined using the Adult lead model for lead in seafood from Fidalgo Bay Anacortes Washington
Seafood Average
Concentration (ppm)
Motherrsquos blood lead concentration in ugdl
95th percentile fetal blood lead in ugdl
Shellfish 121 mother 19
fetus 48
Bottom fish 129
mother 15
fetus 46
Average motherrsquos blood lead concentration in ugdl
19
Average 95th percentile fetal blood lead in ugdl
47
PPM ndash parts per million Crabs tissues and clams average
57
HC-Fidalgo Bay
Table D7 Fidalgo Bay lead intake rate based on Tulalip Tribe adult seafood consumption rate Anacortes Washington
Overall FishShellfish Consumption Rate gday
Category Percent of Consumption
Rate Represented by
Category
Site-related Consumption Rate gday
194 Salmon 497 0 194 Pelagic Fish 42 0 194 Bottom Fish 39 757 194 Shellfish 422 8187
Crabs tissues and clams average
Table D8 Blood lead values determined using the Adult lead model for lead in seafood from Fidalgo Bay Anacortes Washington
Seafood Average
Concentration (ppm)
Motherrsquos blood lead concentration in ugdl
95th percentile fetal blood lead in ugdl
Shellfish 121 mother 62
fetus 190
Bottom fish
129 mother 19
fetus 59
Average motherrsquos blood lead concentration in ugdl
41
Average 95th percentile fetal blood lead in ugdl
125
PPM ndash parts per million Crabs tissues and clams average
58
HC-Fidalgo Bay
Table D9 Fidalgo Bay lead intake rate based on the Suquamish Tribe Adult seafood consumption rate Anacortes Washington
Overall FishShellfish Consumption Rate gday
Category Percent of Consumption
Rate Represented by
Category
Site-related Consumption Rate gday
7668 Salmon 239 0 7668 Pelagic Fish 73 0 7668 Bottom Fish 38 2914 7668 Shellfish 65 49842
Crabs tissues and clams average
Table D10 Blood lead values determined using the Adult lead model for lead in seafood from Fidalgo Bay Anacortes Washington
Seafood Average
Concentration (ppm)
Motherrsquos blood lead concentration in ugdl
95th percentile fetal blood lead in ugdl
Shellfish 121 mother 304
fetus 927
Bottom fish 129
mother 33
fetus 100
Average motherrsquos blood lead concentration in ugdl
169
Average 95th percentile fetal blood lead in ugdl
514
PPM ndash parts per million Crabs tissues and clams average
59
HC-Fidalgo Bay
Appendix E
Meal Limit Calculations for contaminants of concern (non-carcinogenic health effects)
Meal limits were calculated for clams crabs and bottom fish based on contaminants of concern in each species Additionally meal limits were calculated based on developmental and immunologic endpoints for dioxin and mercury Meal limits were calculated using the equation below in conjunction with the MRL or RfD as the target risk value and the exposure parameters provided in the Table E1 below The developmental and immunologic endpoints are based on the additive effects of dioxin and mercury as recommended in the ATSDR interaction profile for toxic contaminants found in fish Tables E2 E3 and E4 provides meal limits that would be protective of women and children who eat clams crabs and bottomfish from Fidalgo Bay based on contaminants of concern in each species
ML = [(RfD or MRL)BW DM]C MS ML = recommended fish meal limit per month (mealmonth) RfD = reference dose (EPA) MRL = minimal risk level (ATSDR)
Many factors must be considered when one is recommending limits on the consumption of fish including the health benefits of eating fish the quality and comprehensiveness of environmental data and the availability of alternate sources of nutrition In addition these limits do not consider that multiple species are consumed a consideration that would require weighting of the percent of each species consumed These allowable ingestion rates also do not consider the fact that cooking reduces exposure to some contaminants in fish Therefore allowable consumption limits for prepared fish would be greater than those shown in tables E2 E3 and E4
Table E1 Exposure parameters used to calculate recommended meal limits for clams crabs and bottom fish from Fidalgo Bay in Anacortes Washington
Exposure Parameter RfD Endpoint Units MRL Developmental
RfDMRL Immunological RfDMRL
Average Concentration (C) variable ugkg Arsenic 03
ugkgday Cadmium 1 Chromium 3 Dioxin 0000001 0000001 000002 Mercury 01 01 03 Days per month (DM) 304 304 304 daysmonth Mean Body Weight (BW) 60 60 60 kg Meal size (MS) 0227 0227 0227 kg
60
HC-Fidalgo Bay
Table E2 Calculated meal limits per month for clams from Fidalgo Bay in Anacortes Washington
Contamination Concentration (ppm)
Meals based on RfD MRL
Lowest meals per month (rounded to single digit)
Arsenic 0027 893 13Chromium 184 131
Dioxin 799E-8 1006
Table E3 Calculated meal limits per month for Crabs from Fidalgo Bay in Anacortes Washington
Contamination Concentration (ppm)
Meals based on RfD MRL
Meals based on Developmental additive endpoint
Meals based on Immune additive endpoint
Lowest meals per month (rounded to single digit)
Arsenic 0071 339 14Cadmium 048 167
Dioxin 975E-8 824 137 478 Mercury 0049 164
Table E4 Calculated meal limits per month for Bottom Fish from Fidalgo Bay in Anacortes Washington
Contamination Concentration (ppm)
Meals based on RfD MRL
Meals based on Developmental additive endpoint
Meals based on Immune additive endpoint
Lowest meals per month (rounded to single digit)
Arsenic 015 161 14Dioxin 134E-7 600 145 548
Mercury 0042 191
Applying the Table E2 E3 and E4 meal limits across the general population assumes that meal size will decrease or increase proportionately with body weight Such an assumption could result in underestimating exposure for consumers who eat proportionately more fish per unit of body weight Table E5 demonstrates how an eight-ounce meal for a 70-kilogram adult would change to remain proportional with body weight
61
HC-Fidalgo Bay
Table E5 Adjustment of fish meal size based on the body weight of the consumer
Body Weight Meal Size Pounds Kilograms Ounces Grams
19 9 1 28 39 18 2 57 58 26 3 85 77 35 4 113 96 44 5 142 116 53 6 170 135 61 7 199 154 70 8 227 173 79 9 255 193 88 10 284 212 96 11 312 231 105 12 340 250 113 13 369 270 123 14 397 289 131 15 425 308 140 16 454
62
HC-Fidalgo Bay
The ATSDR Interaction Profile for persistent chemicals found in fish evaluates the possibility of interactive effects from exposure to a mixture of contaminants including mercury PCBs and dioxins [43]
Uncertainty
Assessment of risks attributable to environmental exposures is filled with many uncertainties Uncertainty with regard to the health assessment process refers to the lack of knowledge about factors such as chemical toxicity human variability human behavior patterns and chemical concentrations in the environment Uncertainty can be reduced through further study
The majority of uncertainty comes from our knowledge of chemical toxicity For most chemicals there is little knowledge of the actual health impacts that can occur in humans from environmental exposures unless epidemiological or clinical evidence exists As a result toxicological experiments are performed on animals These animals are exposed to chemicals at much higher levels than found in the environment The critical doses in animal studies are often extrapolated to real world exposures for use in human health risk assessments In order to be protective of human health uncertainty factors are used to lower that dose in consideration of variability in sensitivity between animals and humans and the variability within humans These uncertainty factors can account for a difference of two to three orders of magnitude when calculating risk Furthermore there are hundreds of chemicals for which little toxicological information is known in animals or humans These chemicals may in fact be toxic at some level but risks to humans cannot be quantified due to uncertainty
The majority of arsenic found in seafood is organic arsenic Inorganic arsenic in fish and shellfish ranged from about 1 to 20 of the total arsenic [20 22 23 24] Ecologyrsquos evaluation of shellfish and English sole in the Puget Sound indicated that less than 1 of the total arsenic found was in the inorganic form of arsenic [25] However since there was no arsenic speciation data for starry flounder DOH assumed that 10 of the total arsenic detected in bottom fish was inorganic arsenic Inorganic arsenic is much more harmful than organic arsenic therefore the arsenic evaluation may be overestimated
The amount of contaminated media (fish water air soil) that people eat drink inhale or absorb through their skin is another source of uncertainty Although recent work has improved our understanding of these exposure factors they are still a source of uncertainty In the case of Fidalgo Bay uncertainty exists with respect to how much fish people eat from Fidalgo Bay how often they are eating it what species they are eating how often children use public access areas and how much sediment or soil children may inadvertently eat Estimates are based on best available information or worst-case scenarios This evaluation is based on the assumption that 100 percent of the type of seafood (bottom fish and shellfish) harvested and consumed was from Fidalgo Bay
Another source of uncertainty is how seafood is actually prepared for consumption and laboratory testing (ie whole fish with guts versus gutless or fillets large clams with skin and gut ball) Bottom fish and clams may contain sediments in their digestive tracts that can affect the concentration of heavy metals during analysis Horse clams are a large clam and may show similar heavy metal patterns to geoduck clams where the skin and gut ball contain the major
26
HC-Fidalgo Bay
portion of heavy metals Bottom fish species should be analyzed without the gut and large clams should be analyzed without skin and without the gut for human health purposes
The amount and type of chemical in contaminated media is another source of uncertainty Environmental samples are very costly so it is not practical or efficient to analyze an adequate number of samples for every existing chemical Instead sampling usually focuses on contaminants that are thought to be present based on historic land use or knowledge of specific chemical spills
Fish Meal Limits
Several contaminants of concern are present in seafood from Fidalgo Bay Meal limits were calculated using the RfDMRL as the target risk value and the exposure parameters provided in Appendix E Table E1
Many factors must be considered when one is recommending limits on the consumption of seafood including the health benefits of eating fish the quality and comprehensiveness of environmental data and the availability of alternate sources of nutrition In addition these limits do not consider that multiple species are consumed a consideration that would require weighting the percent of each species consumed
Childrenrsquos Health Concerns
The potential for exposure and subsequent adverse health effects often increases for younger children compared with older children or adults ATSDR and DOH recognize that children are susceptible to developmental toxicity that can occur at levels much lower than those causing other types of toxicity The following factors contribute to this vulnerability
Children are more likely to play outdoors in contaminated areas by disregarding signs and wandering onto restricted locations
Children often bring food into contaminated areas resulting in hand-to-mouth activities Children are smaller and receive higher doses of contaminant exposures per body
weight Children are shorter than adults therefore they have a higher possibility of breathing in
dust and soil Fetal and child exposure to contaminants can cause permanent damage during critical
growth stages
These unique vulnerabilities of infants and children demand special attention in communities that have contaminated water food soil or air Childrenrsquos health was considered in the writing of this health consultation and the exposure scenarios treated children as the most sensitive population being exposed
27
HC-Fidalgo Bay
Conclusions
Based on the information provided DOH concludes the following
1 DOH concludes that consumption of seafood at tribal scenario rates is expected to harm children and adults health The Swinomish Samish Lummi and the Upper Skagit are tribes or nations that fish in this area or it is in their usual and accustomed fishing rights areas If any of the tribes or nations are using Fidalgo Bay for harvesting and is consuming at tribal scenario rates this would represent a ldquopublic health hazardrdquo The Swinomish Indian Tribal Community has stated ldquoFidalgo Bay historically an important harvest site is now impacted by contamination and thus not used for harvest in recent yearsrdquo [6] It may also be unlikely that 100 of a subsistence consumer (tribes or nations) would be consuming and harvesting from Fidalgo Bay only
2 DOH concludes that consuming bottom fish or shellfish from Fidalgo Bay is not expected to harm the general populationrsquos (children or adults) This area also falls under the Puget Sound Crab Advisory DOH recommends consuming only Dungeness and Red Rock crab from non-urban areas and that ldquocrab butterrdquo and viscera should not be eaten Based on contaminants of concern in bottom fish or shellfish calculated meal limits are 13 clams per month 14 crabs per month and 14 bottom fish per month (see Appendix E Tables E2 E3 and E4) Table E5 shows the adjustment of meal size based on the body weight of the consumer
3 DOH concludes that touching breathing or accidentally eating sediment one-day-pershyweek or 52 days per year from Fidalgo Bay is not expected to harm peoplersquos health The maximum level of carcinogenic polycyclic aromatic hydrocarbons (cPAHs) in this exposure scenario is below levels known to result in non-cancer harmful health effects In addition the exposure scenario does not present an elevated theoretical cancer risk
Recommendations
1 DOH recommends Ecology perform the necessary site remedial investigation and feasibility study (RIFS) as they work through the process of cleaning up Fidalgo Bay Proceeding with the planned cleanup will contribute to a significant reduction in human health risk
2 DOH recommends Ecology perform long-term monitoring of Fidalgo Bay DOH is available to review a monitoring plan and monitoring results
3 DOH recommends following the Puget Sound Recreational Marine Area 7 Fish Consumption Advisory and the Puget Sound crab consumption advisory that states
Eat no more than one meal per week for rockfish and Chinook salmon and no more than one meal per month for resident (blackmouth) Chinook salmon
28
HC-Fidalgo Bay
Eat Dungeness and Red Rock crab from non-urban areas and do not eat the ldquocrab butterrdquo (viscera) More information regarding these advisories is available at httpwwwdohwagovehpoehasfishrma7htm or by calling toll-free 1-877-485shy7316
4 DOH also recommends following the meal limits calculated in Appendix E Eat no more than 13 or 14 eight-ounce meals per month of clams crabs bottom fish (English sole and Starry Flounder) or any combination thereof
General Advice
DOH encourages all Washingtonians to eat at least two fish meals per week as part of a heart healthy diet in accordance with American Heart Association (AHA) recommendations People may eat fish more than two times weekly but such frequent consumers should take the following steps to reduce exposure to contaminants in the fish that they eat
bull Eat a variety of fish that are low in contaminants according to guidance provided on our website at httpwwwdohwagovfish
bull Follow fish advisory advice provided by DOH (website listed below) and local health agencies for water bodies where you fish httpwwwdohwagovehpoehasfishfishadvisorieshtm
bull Young children and small adults should eat proportionally smaller meal sizes bull Grill bake or broil fish so that fat drips off while cooking bull Eat fillets without the skin bull Mercury and other metals are stored in the fillet of the fish and will not be reduced by preparing fish this way
Public Health Action Plan
Actions Planned
1 DOH will coordinate with Ecology to provide an educational materials fact sheet
2 DOH will provide copies of this health consultation to Ecology and concerned parties
3 DOH will be available at Ecologyrsquos planned public meetings in the Fidalgo Bay community
29
HC-Fidalgo Bay
Author
Lenford OrsquoGarro Washington State Department of Health
Office of Environmental Health Assessments Site Assessment Section
Designated Reviewer Dan Alexanian Manager Site Assessment Section
Office of Environmental Health Assessments Washington State Department of Health
ATSDR Technical Project Officer Audra Henry
Cooperative Agreement and Program Evaluation Branch Division of Health Assessment and Consultation
Agency for Toxic Substances and Disease Registry
30
HC-Fidalgo Bay
References
1 SAIC 2007 Fidalgo Bay Sediment Investigation Anacortes WA Sediment Sampling and Analysis Plan Prepared for the Washington State Department of Ecology Prepared by Science Applications International Corporation (SAIC) Bothell WA September 17 2007
2 Fidalgo Bay Causeway feasibility study Request for funding from Department of Ecology Prepared by Samish Indian Nation May 4 2007 httpwwwsamishtribensnusdnrDOE2042007pdf
3 Washington State Department of Natural Resources Fidalgo Bay Environmental Aquatic Reserve management plan Skagit County Washington April 2008 Prepared by Aquatic resources program httpwwwdnrwagovPublicationsaqr_rsve_fid_mgmt_planpdf
4 SAIC 2008 Fidalgo Bay Sediment Investigation Anacortes WA Final Report Prepared for the Washington State Department of Ecology Prepared by Science Applications International Corporation (SAIC) Bothell WA March 31 2008
5 SAIC 2008 Fidalgo Bay Sediment Investigation Anacortes WA Archived Sediment and Tissue Analytical Results Data Report Addendum Prepared for the Washington State Department of Ecology Prepared by Science Applications International Corporation (SAIC) Bothell WA September 2008
6 Swinomish Water Resources Program December 1 2006 Bioaccumulative Toxics in Subsistence-Harvested Shellfish ndash Contaminant Results and Risk Assessment Swinomish Indian Tribal Community La Conner WA
7 Van den Berg M Birnbaum LS Denison M De Vito M Farland W Feeley M Fiedler H Hakansson H Hanberg A Haws L Rose M Safe S Schrenk D Tohyama C Tritscher A Tuomisto J Tysklind M Walker N amp Peterson RE (2006) The 2005 World Health Organization Reevaluation of Human and Mammalian Toxic Equivalency Factors for Dioxins and Dioxin-Like Compounds Toxicol Sci 93 223-241 Available at httptoxscioxfordjournalsorgcgicontentabstract932223
8 US Environmental Protection Agency Guidance for assessing chemical contaminant data for use in fish advisories volume 2 risk assessment and fish consumption limits third edition Office of Water Washington DC EPA 823-B-00-008 2000b
9 United States Environmental Protection Agency Framework for Selecting and Using Tribal Fish and Shellfish Consumption Rates for Risk-Based Decision Making at CERCLA and RCRA Cleanup Sites in Puget Sound and the Strait of Georgia August 2007
10 United States Environmental Protection Agency Estimated Per Capita Fish Consumption in the United States EPA 821-C-02-003 2002
31
HC-Fidalgo Bay
11 Toy KA Polissar NL Liao S and Mittelstaedt GD 1996 A fish consumption survey of the Tulalip and Squaxin Island tribes of the Puget Sound region Tulalip Tribes Department of Environment 7615 Totem Beach Road Marysville WA 98271
12 The Suquamish Tribe 2000 Fish Consumption Survey of the Suquamish Tribe of the Port Madison Indian Reservation Puget Sound Region The Suquamish Tribe 15838 Sandy Hook Road Post Office Box 498 Suquamish WA 98392
13 Alaska Division of Public Health The use of traditional foods in a healthy diet in Alaska risks in perspective 1999 Jan15
14 US Environmental Protection Agency and Toxicology Excellence for Risk Assessment August comparative dietary risks balancing the risks and benefits of fish consumption1999 Aug
15 American Heart Association An eating plan for healthy Americans Available at httpwwwamericanheartorgdietary guidelinesimagesEatPlan2000pdf
16 Hora ME Reduction of polychlorinated biphenyl (PCB) concentrations in carp (Cyprinus carpio) fillets through skin removal Bull Environ Contam Toxicol 1981 Mar 26 (3)364shy6
17 Wilson ND Shear NM Paustenbach DJ Price PS The effect of cooking practices on the concentration of DDT and PCB compounds in the edible tissue of fish J Exp Anal Environ Epidemiol 1998 Jul-Sep 8(3) 423-40
18 Zabik ME Zabik MJ Polychlorinated biphenyls polybrominated biphenyls and dioxin reduction during processingcooking food Adv Exp Med Biol1999459213-31
19 Toxics Cleanup Program Department of Ecology Natural background soil metals concentrations in Washington State Publication No 94-115Olympia Washington State Department of Ecology October 1994
20 Agency for Toxic Substances and Disease Registry (ATSDR) Toxicological profile for arsenic (update) PB2000108021 Atlanta GA US Department of Health and Human Services Public Health Service September 2005
21 US Environmental Protection Agency Toxicological Review of Inorganic Arsenic In support of summary information on the Integrated Risk Information System July 2005 httpwwwepagovwatersciencecriteriaarsenicsabAsDraft_SABpdf
22 NAS 2001b Arsenic in Drinking Water 2001 Update National Academy Press Washington DC 2001 Available at httpbooksnapedubooks0309076293htmlindexhtml
23 Francesconi KA and Edmonds JS 1997 Arsenic and marine organisms Advances in Inorganic Chemistry 44147-189
32
HC-Fidalgo Bay
24 US Food and Drug Administration (FDA) 1993 Guidance document for arsenic in shellfish Department of Health and Human Services Public Health Service Food and Drug Administration Center for Food Safety and Applied Nutrition Washington DC January 1993 Available at httpwwwfoodsafetygov~frfguid-ashtml
25 Washington State Department of Ecology Environmental Assessment Program Inorganic arsenic levels in Puget Sound fish and shellfish from 303(d) listed water bodies and other areas Prepared by Art Johnson and Morgan Roose Publication No 02-03-057 Olympia Washington State Department of Ecology December 2002
26 US Department of Health and Human Services Agency for Toxic Substances and Disease Registry Toxicological profile for Cadmium (update) PB99166621 Atlanta US Department of Health and Human Services July 1999
27 Anderson RA Polansky MM Bryden NA Patterson KY Veillon C Glinsmann WH 1983 Effects of chromium supplementation on urinary Cr excretion of human subjects and correlation of Cr excretion with selected clinical parameters J Nutr 113276ndash81 Cited in Agency for Toxic Substances and Disease Registry 2000 Toxicological profile for chromium Atlanta US Department of Health and Human Services September 2000 Available at httpwwwatsdrcdcgovtoxprofilestp7html
28 Anderson RA 1986 Chromium metabolism and its role in disease processes in man Clin Physiol Biochem 431ndash41 Cited in Agency for Toxic Substances and Disease Registry 2000 Toxicological profile for chromium Atlanta US Department of Health and Human Services September 2000 Available at httpwwwatsdrcdcgovtoxprofilestp7html
29 Donaldson RM Barreras RF 1966 Intestinal absorption of trace quantities of chromium J Lab Clin Med 68484ndash493 Cited in Agency for Toxic Substances and Disease Registry 2000 Toxicological profile for chromium Atlanta US Department of Health and Human Services September 2000 Available at httpwwwatsdrcdcgovtoxprofilestp7html
30 Agency for Toxic Substances and Disease Registry Toxicological profile for chlorinated dibenzo-p-dioxins (update) Draft for public comment Atlanta US Department of Health and Human Services 2000
31 National Toxicology Program Carcinogenesis bioassay of 2378- tetrachlorodibenzo-pshydioxin in Swiss-Webster mice (gavage study) Carcinogenesis Testing Program National Cancer Institute National Institute of Health National Toxicology Program Bethesda MD DHHS publication no 82-1765 1982
32 United States Environmental Protection Agency Health assessment document for polychlorinated dibenzo-p-dioxins Washington DC US Environmental Protection Agency Office of Health and Environmental Assessment EPA report no 6008-84014 1985
33
HC-Fidalgo Bay
33 United States Environmental Protection Agency Report on the peer review of the dioxin reassessment documents toxicity equivalency factors for dioxin and related compounds (Chapter 9) and integrated risk characterization document Alexandria VA National Center for Environmental Assessment 2000
34 Agency for Toxic Substances and Disease Registry (ATSDR) Analysis Paper Impact of Lead-Contaminated Soil on Public Health US Department of Health and Human Services Public Health Service Atlanta Georgia May 1992
35 CDC Preventing lead poisoning in young children a statement by the Centers for Disease Control October 1991 Atlanta Georgia US Department of Health and Human Services Public Health Service CDC 1991
36 US Department of Health and Human Services Agency for Toxic Substances and Disease Registry Toxicological profile for Lead (update) PB99166704 Atlanta US Department of Health and Human Services July 1999
37 Agency for Toxic Substances and Disease Registry (ATSDR) Lead Toxicity (Case studies in environmental medicine Course) SS3059 Atlanta US Department of Health and Human Services Public Health Service October 2000
38 US Department of Health and Human Services Agency for Toxic Substances and Disease Registry Toxicological Profile for Polycyclic Aromatic Hydrocarbons (PAHs) (update) PB95264370 Atlanta US Department of Health and Human Services August 1995
39 Phillips D H Polycyclic Aromatic Hydrocarbons in the diet Mutation Research 1999 (443) 139-147
40 US Environmental Protection Agency Technical Review Workgroup for Lead Userrsquos Guide for the Integrated Exposure Uptake Biokinetic Model for Lead in Children (IEUBK) Windows version 10 OSWER Directive No92857-42 Document No EPA 540-K-01-005 Washington DC May 2002
41 US Environmental Protection Agency Guidelines for Carcinogen Risk Assessment (Review Draft) NCEA-F-0644 July 1999 Available at httpwwwepagovNCEArafcancerhtm
42 ATSDR Agency for Toxic Substances and Disease Registry ATSDR Fact Sheet Cancer Updated August 30 2002 Atlanta US Department of Health and Human Services Available at httpwwwatsdrcdcgovCOMcancer-fshtml
43 Agency for Toxic Substances and Disease Registry (ATSDR) Interaction Profile for persistent chemicals found in fish US Department of Health and Human Services Public Health Service May 2004
34
HC-Fidalgo Bay
44 National Center for Environmental Assessment Exposure Factors Handbook Volume 1 ndash General Factors EPA600P-95002Fa US Environmental Protection Agency August 1997
35
HC-Fidalgo Bay
Figure 1 Demographic statistics within three miles of the site - Fidalgo Bay Skagit County
Total Population 11704 White 10818 Black 33 American Indian Eskimo Aleut 143 Asian or Pacific Islander 211 Other Race 176 Hispanic Origin 386 Children Aged 6 and Younger 943 Adults Aged 65 and Older 2310 Females Aged 15 - 44 2088 Total Aged over 18 8900 Total Aged under 18 2804 Total Housing Units 5295
Calculated using the area proportion technique Source 2000 US CENSUS
36
HC-Fidalgo Bay
Figure 2 Red box indicates the Fidalgo Bay site location Skagit County Washington
37
HC-Fidalgo Bay
Figure 3 Ecologyrsquos sediment and biota sample areas within Fidalgo Bay Skagit County Washington
38
HC-Fidalgo Bay
Appendix A This section provides calculated exposure doses and assumptions used for exposure to chemicals in sediments at the Fidalgo Bay site Three different exposure scenarios were developed to model exposures that might occur These scenarios were devised to represent exposures to a child (0-5 yrs) an older child and an adult The following exposure parameters and dose equations were used to estimate exposure doses from direct contact with chemicals in sediments
Exposure to chemicals in soil via ingestion inhalation and dermal absorption
Total dose (non-cancer) = Ingested dose + inhaled dose + dermally absorbed dose
Ingestion Route
Dose(non-cancer (mgkg-day) = C x CF x IR x EF x ED BW x ATnon-cancer
Cancer Risk = C x CF x IR x EF x CPF x ED BW x ATcancer
Dermal Route
Dermal Transfer (DT) = C x AF x ABS x AD x CF ORAF
Dose(non-cancer (mgkg-day) = DT x SA x EF x ED BW x ATnon-cancer
Cancer Risk = DT x SA x EF x CPF x ED BW x ATcancer
Inhalation Route
Dosenon-cancer (mgkg-day) = C x SMF x IHR x EF x ED x 1PEF BW x ATnon-cancer
Cancer Risk = C x SMF x IHR x EF x ED x CPF x 1PEF BW x ATcancer
39
HC-Fidalgo Bay
Table A1 Exposure assumptions used to estimate cPAHs doses from direct contact with sediments in Fidalgo Bay Anacortes WA
Parameter Value Unit Comments Concentration (C) Variable mgkg Maximum detected value
Conversion Factor (CF) 0000001 kgmg Converts contaminant concentration from milligrams (mg) to kilograms (kg)
Ingestion Rate (IR) ndash adult 100 mgday Exposure Factors Handbook [44] Ingestion Rate (IR) ndash older child 100
Ingestion Rate (IR) - child 200 Exposure Frequency (EF) 52 Daysyear One days a week
Exposure Duration (Ed) 30 (5 1015) years Number of years at one residence (child older child adult yrs)
Body Weight (BW) - adult 72 kg
Adult mean body weight Body Weight (BW) ndash older child 41 Older child mean body weight Body Weight (BW) - child 15 0-5 year-old child average body weight Surface area (SA) - adult 5700
cm2 Exposure Factors Handbook Surface area (SA) ndash older child 2900 Surface area (SA) - child 2900 Averaging Timenon-cancer (AT) 1825 days 5 years Averaging Timecancer (AT) 27375 days 75 years Cancer Potency Factor (CPF) 73 mgkg-day-1 Source EPA 24 hr absorption factor (ABS) 013 unitless Source EPA (Chemical Specific) PAH Oral route adjustment factor (ORAF) 1 unitless Non-cancer (nc) cancer (c) - default Adherence duration (AD) 1 days Source EPA
Adherence factor (AF) 02
mgcm2 Child older child 007 Adult
Inhalation rate (IHR) - adult 152 m3day Exposure Factors Handbook [44] Inhalation rate (IHR) ndash older child 14
Inhalation rate (IHR) - child 83 Soil matrix factor (SMF) 1 unitless Non-cancer (nc) cancer (c) - default Particulate emission factor (PEF) 145E+7 m3kg Model Parameters
40
HC-Fidalgo Bay
Fidalgo Bay Sediment Exposure Route ndash Non-cancer
Table A2 Non-cancer hazard calculations resulting from exposure to cPAHs in sediments from Fidalgo Bay Anacortes WA
Contaminant
TEQ Concentra
tion (ppm)
(mgkg)
Scenarios
Estimated Dose (mgkgday)
Total Dose LOAEL
(mgkgday)
Total Dose LOAELIncidental
Ingestion of Soil
Dermal Contact
with Soil
Inhalation of Particulates
Child 194E-7 730E-8 134E-11 267E-7 000000003
cPAH 0102 Older Child 354E-8 267E-8 828E-12 622E-8 10E+1 0000000006
Adult 202E-8 105E-8 512E-12 307E-8 0000000003
Fidalgo Bay Sediment Exposure Route ndash Cancer
Table A3 Cancer hazard calculations resulting from exposure to cPAHs sediments from Fidalgo Bay Anacortes WA
Contaminant Concentra tion (ppm)
EPA cancer Group
Cancer Potency Factor
(mgkg-day-1)
Scenarios
Increased Cancer Risk Total
Cancer RiskIncidental
Ingestion of Soil
Dermal Contact
with Soil
Inhalation of Particulates
Child 943E-8 355E-8 653E-12 130E-7
Total cPAH TEQ 0102 B2 73 Older Child 345E-8 260E-8 806E-12 605E-8
Adult 295E-8 153E-8 747E-12 448E-8
Lifetime cancer risk 130E-7 + 605E-8 + 448E-8 = 235E-7
41
HC-Fidalgo Bay
Appendix B
This section provides calculated exposure doses and exposure assumptions used for chemicals in bottom fish shellfish and crab samples taken from Fidalgo Bay These exposure scenarios were developed to model exposures that might occur and were devised to represent exposures to the general population The following exposure parameters and dose equations were used to estimate exposure doses from ingestion of contaminants in bottom fish and shellfish
Ingestion Route
Dose(non-cancer (mgkg-day) = C x CF1 x IR x CF2 x EF x ED BW x ATnon-cancer
Cancer Risk = C x CF1 x IR x CF2 x EF x CPF x ED BW x ATcancer
Table B1 Exposure assumptions used in exposure evaluation of contaminants in bottom fish shellfish and crab samples taken from Fidalgo Bay in Anacortes Washington
Parameter Value Unit Comments Concentration (C) Variable ugkg Average detected value
Conversion Factor (CF1) 0001 mgkg Converts contaminant concentration from milligrams (mg) to kilograms (kg)
Conversion Factor (CF2) 0001 kgg Converts mass of shellfish from grams (g) to kilograms (kg)
Ingestion Rate (IR) 057
gday
Body weight-adjusted shellfish consumption rates to account for children eating nearly 16 times as much fish per body weight as do adults (see table B2)
Ingestion Rate (IR) 028 Average general population child ndash bottom fish (see table B3)
Ingestion Rate (IR) 081 Body weight-adjusted shellfish consumption rates to account for an older child eating 081 times as much fish per body weight as do adults (see table B2)
Ingestion Rate (IR) 036 Average general population older child ndash bottom fish (see table B3)
Ingestion Rate (IR) 17 Average general population adult - shellfish
Ingestion Rate (IR) 07 Average general population adult ndash bottom fish (see table B3)
Exposure Frequency (EF) 365 Daysyear Assumes daily exposure
Exposure Duration (ED) 6 years
Number of years at one residence (child) Exposure Duration (ED) 30 Number of years at one residence (adult) Body weight (BW) 15
kg Mean body weight child
Body weight (BW) 70 Mean body weight adult Averaging Timenon-cancer (AT) Variable days Equal to Exposure Duration Averaging Timecancer (AT) 25550 days 70 years Cancer Potency Factor (CPF) Variable mgkg-day-1 Source EPA ndash Chemical specific
42
HC-Fidalgo Bay
Table B2 Derivation of a childrsquos shellfish consumption rate for the general US population
Row Parameter Adult Older Child (6-17 yrs)
Child (0-6 yrs)
1 Reported All Fish Consumption Rate-gram fish per kg bodyweight per day (gkgday)
0277 0225 0433
2 Ratio to Adult All Fish Consumption Rate
1 081 16
3 Reported Shellfish Consumption (gday)
170 (average) Not Reported Not Reported
4 Average Body Weight (kg) 70 41 15 5 Ratio to Adult BW 1 059 021 6 Adjusted Shellfish Consumption Rates
(gday) = Row 2 x Row 3 x Row 5
170 (average) 081 (average) 057 (average)
Table B3 Derivation of bottom consumption rate for the general US population based on four percent of total fish intake
Row Parameter Adult Older Child (6-17 yrs)
Child (0-6 yrs)
1 Reported All Fish Consumption Rateshy(gday)
175 90 70
2 Assume bottom fish intake rate similar to tribal at about 4 percent [15]
004 004 004
3 Adjusted bottom fish rates (gday) = Row 1 x Row 2
070 036 028
43
HC-Fidalgo Bay
Table B4 Exposure dose and non-cancer risk from ingesting seafood at the average concentrations of contaminants in bottom fish clams and crab samples taken from Fidalgo Bay in Anacortes Washington
Species Contaminant Average Concentration
(ppm)
Estimated Dose (mgkgday)
General population Average
MRL or RfD (mgkgday)
Hazard quotient
General population Average
Clams
Arsenic
0027 Child 103E-6
300E-4
0003 Older child 533E-7 0002
Adult 656E-7 0002
Crabs 0071 Child 270E-6 0009
Older child 140E-6 0005 Adult 172E-6 0006
Bottom Fish 015 Child 260E-6 0009
Older child 132E-6 0004 Adult 150E-6 0005
Crabs Cadmium 048 Child 182E-5
100E-3 0018
Older child 948E-6 0009 Adult 117E-5 0012
Clams Chromium 184 Child 699E-5
300E-3 0023
Older child 364E-5 0012 Adult 447E-5 0015
Clams
Dioxin
799E-8 Child 304E-12
10E-9
0003 Older child 158E-12 00016
Adult 194E-12 00019
Crabs 975E-8 Child 371E-12 00037
Older child 193E-12 00019 Adult 237E-12 00024
Bottom Fish 134E-7 Child 250E-12 0003
Older child 118E-12 00012 Adult 134E-12 00013
Crabs
Mercury
0049 Child 186E-6
100E-4
0019 Older child 968E-7 00097
Adult 119E-6 0012
Bottom Fish 0042 Child 784E-7 0008
Older child 369E-7 00037 Adult 420E-7 00042
PPM ndash parts per million
44
HC-Fidalgo Bay
Table B5 Cancer risk from ingesting seafood at the average concentrations of contaminants in bottom fish clams and crab samples taken from Fidalgo Bay in Anacortes Washington
Species Contaminant Average Concentration
(ppm)
Cancer Potency Factor
(mgkg-day-1)
Increased Cancer Risk
General population Average
Total Cancer Risk General population
Average
Clams
Arsenic
0027
57
Child 501E-7
153E-5
Older child 434E-7 Adult 160E-6
Crabs 0071 Child 132E-6
Older child 114E-6 Adult 421E-6
Bottom Fish 015 Child 137E-6
Older child 107E-6 Adult 366E-6
Clams
Dioxin
799E-8
15E+5
Child 390E-8
582E-7
Older child 338E-8 Adult 125E-7
Crabs 975E-8 Child 476E-8
Older child 413E-8 Adult 152E-7
Bottom Fish 134E-7 Child 322E-8
Older child 252E-8 Adult 861E-8
Sum of cancer risk 159E-5
45
HC-Fidalgo Bay
Appendix C This section provides calculated exposure doses and assumptions used for exposure to chemicals in seafood at the Fidalgo Bay site using Tulalip Tribe consumption rates It is based on the EPA Tribal framework for fish and shellfish consumption rates for risk-based decisions
Intake of contaminant in mgkg-day (IR ) = (CF x CR x x UCF ) BW c i PS i 1
[Equation 1] Where IR = Intake rate of contaminant by category of fishshellfish
c
CF = contaminant concentration (mgkg) in the tissue of the particular fish or shellfish category i
CR = the total consumption rate of fish and shellfish harvested from Puget Sound 194 grams per PS
day = the percentage of the ingestion rate that consists of the category of fish or shellfish unitless
i
BW = body weight 818 kilograms observed from the Tulalip Tribesrsquo study UCF = conversion factor 1 0001 kilograms per gram
1
Estimated cancer risk (ECR) = (IR x ED x EF x CSF) (AT x UCF ) [Equation 2] total 2
Where IR = Total intake of contaminant from site-related fish and shellfish consumption
total
ED = exposure duration 70 years EF = exposure frequency 365 days per year CSF = oral cancer slope factor for contaminant AT = averaging time 70 years for carcinogens UCF = conversion factor 2 (365 daysyear)
2
Estimated hazard index (EHI) = (IR x ED x EF x UCF ) (RfD x AT) [Equation 3] total 2
Where IR = Total intake of contaminant from site-related fish and shellfish consumption
total
ED = exposure duration 70 years EF = exposure frequency 365 days per year RfD = Oral reference dose for contaminant AT = averaging time the same as exposure duration for non-carcinogenic effects UCF = conversion factor 2 (1 yr365 days)
2
46
HC-Fidalgo Bay
Table C1 Fidalgo Bay arsenic intake rate based on the Tulalip Tribe seafood consumption rate Anacortes Washington
Overall FishShellfish Consumption Rate gday
Category Percent of Consumption Rate Represented by Category
Site-related concentration of arsenic mgkg in tissue
Category Specific Exposure mgkg-day
194 Salmon 497 0 0 194 Pelagic Fish 42 0 0 194 Bottom Fish 39 015 00000139 194 Shellfish 422 0049 00000490 Sum IRtotal 00000629 Crabs tissues and clams average
Arsenic Estimated hazard index = 021
Arsenic Estimated cancer risk = 21E-3
Table C2 Fidalgo Bay cadmium intake rate based on the Tulalip Tribe seafood consumption rate Anacortes Washington
Overall FishShellfish Consumption Rate gday
Category Percent of Consumption Rate Represented by Category
Site-related concentration of cadmium mgkg in tissue
Category Specific Exposure mgkg-day
194 Salmon 497 0 0 194 Pelagic Fish 42 0 0 194 Bottom Fish 39 0 0 194 Shellfish 422 048 000048 Sum IRtotal 000048 Crabs tissues only average
Cadmium Estimated hazard index = 03
47
HC-Fidalgo Bay
Table C3 Fidalgo Bay chromium intake rate based on Tulalip Tribe seafood consumption rate Anacortes Washington
Overall FishShellfish Consumption Rate gday
Category Percent of Consumption Rate Represented by Category
Site-related concentration of chromium mgkg in tissue
Category Specific Exposure mgkg-day
194 Salmon 497 0 0 194 Pelagic Fish 42 0 0 194 Bottom Fish 39 0 0 194 Shellfish 422 184 000184 Sum IRtotal 000184 Clams tissues only average
Chromium Estimated hazard index = 061
Table C4 Fidalgo Bay dioxin intake rate based on the Tulalip Tribe seafood consumption rate Anacortes Washington
Overall FishShellfish Consumption Rate gday
Category Percent of Consumption Rate Represented by Category
Site-related concentration of dioxin mgkg in tissue
Category Specific Exposure mgkg-day
194 Salmon 497 0 0 194 Pelagic Fish 42 0 0 194 Bottom Fish 39 134E-7 124E-11 194 Shellfish 422 887E-8 888E-11 Sum IRtotal 101E-10 Crabs tissues and clams average
Dioxin Estimated hazard index = 010
Dioxin Estimated cancer risk = 152E-5
48
HC-Fidalgo Bay
Table C5 Fidalgo Bay mercury intake rate based on the Tulalip Tribe seafood consumption rate Anacortes Washington
Overall FishShellfish Consumption Rate gday
Category Percent of Consumption Rate Represented by Category
Site-related concentration of mercury mgkg in tissue
Category Specific Exposure mgkg-day
194 Salmon 497 0 0 194 Pelagic Fish 42 0 0 194 Bottom Fish 39 0042 000000388 194 Shellfish 422 0049 0000049 Sum IRtotal 00000529 Crabs tissues only average
Mercury Estimated hazard index = 053
49
HC-Fidalgo Bay
This section provides calculated exposure doses and assumptions used for exposure to chemicals in seafood at Fidalgo Bay using Suquamish Tribe consumption rates It is based on the EPA Tribal framework for fish and shellfish consumption rates for risk-based decisions
Intake of contaminant in mgkg-day (IR ) = (CF x CR x x UCF ) BW c i PS i 1
[Equation 1] Where IR = Intake rate of contaminant by category of fishshellfish
c
CF = contaminant concentration (mgkg) in the tissue of the particular fish or shellfish category i
CR = the total consumption rate of fish and shellfish harvested from Puget Sound 7668 grams per PS
day = the percentage of the ingestion rate that consists of the category of fish or shellfish unitless
i
BW = body weight 79 kilograms observed from the Suquamish Tribesrsquo study UCF = conversion factor 1 0001 kilograms per gram
1
Estimated cancer risk (ECR) = (IR x ED x EF x CSF) (AT x UCF ) [Equation 2] total 2
Where IR = Total intake of contaminant from site-related fish and shellfish consumption
total
ED = exposure duration 70 years EF = exposure frequency 365 days per year CSF = oral cancer slope factor for contaminant AT = averaging time 70 years for carcinogens UCF = conversion factor 2 (365 daysyear)
2
Estimated hazard index (EHI) = (IR x ED x EF x UCF ) (RfD x AT) [Equation 3] total 2
Where IR = Total intake of contaminant from site-related fish and shellfish consumption
total
ED = exposure duration 70 years EF = exposure frequency 365 days per year RfD = Oral reference dose for contaminant AT = averaging time the same as exposure duration for non-carcinogenic effects UCF = conversion factor 2 (1 yr365 days)
2
50
HC-Fidalgo Bay
Table C6 Fidalgo Bay arsenic intake rate based on Suquamish Tribe seafood consumption rate Anacortes Washington
Overall FishShellfish Consumption Rate gday
Category Percent of Consumption Rate Represented by Category
Site-related concentration of arsenic mgkg in tissue
Category Specific Exposure mgkg-day
7668 Salmon 239 0 0 7668 Pelagic Fish 73 0 0 7668 Bottom Fish 38 015 00000553 7668 Shellfish 65 0049 0000309 Sum IRtotal 0000364 Crabs tissues and clams average
Arsenic Estimated hazard index = 12
Arsenic Estimated cancer risk = 359E-4
Table C7 Fidalgo Bay cadmium intake rate based on Suquamish Tribe seafood consumption rate Anacortes Washington
Overall FishShellfish Consumption Rate gday
Category Percent of Consumption Rate Represented by Category
Site-related concentration of cadmium mgkg in tissue
Category Specific Exposure mgkg-day
7668 Salmon 239 0 0 7668 Pelagic Fish 73 0 0 7668 Bottom Fish 38 0 0 7668 Shellfish 65 048 0003 Sum IRtotal 0003 Crabs tissues only average
Cadmium Estimated hazard index = 3
51
HC-Fidalgo Bay
Table C8 Fidalgo Bay chromium intake rate based on Suquamish Tribe seafood consumption rate Anacortes Washington
Overall FishShellfish Consumption Rate gday
Category Percent of Consumption Rate Represented by Category
Site-related concentration of chromium mgkg in tissue
Category Specific Exposure mgkg-day
7668 Salmon 239 0 0 7668 Pelagic Fish 73 0 0 7668 Bottom Fish 38 0 0 7668 Shellfish 65 184 00116 Sum IRtotal 00116 Clams tissues only average
Chromium Estimated hazard index = 387
Table C9 Fidalgo Bay dioxin intake rate based on Suquamish Tribe seafood consumption rate Anacortes Washington
Overall FishShellfish Consumption Rate gday
Category Percent of Consumption Rate Represented by Category
Site-related concentration of dioxin mgkg in tissue
Category Specific Exposure mgkg-day
7668 Salmon 239 0 0 7668 Pelagic Fish 73 0 0 7668 Bottom Fish 38 134E-7 494E-11 7668 Shellfish 65 887E-8 56E-10 Sum IRtotal 609E-10 Crabs tissues and clams average
Dioxin Estimated hazard index = 061 Dioxin Estimated cancer risk = 914E-5
52
HC-Fidalgo Bay
Table C10 Fidalgo Bay mercury intake rate based on Suquamish Tribe seafood consumption rate Anacortes Washington
Overall FishShellfish Consumption Rate gday
Category Percent of Consumption Rate Represented by Category
Site-related concentration of mercury mgkg in tissue
Category Specific Exposure mgkg-day
7668 Salmon 239 0 0 7668 Pelagic Fish 73 0 0 7668 Bottom Fish 38 0042 00000155 7668 Shellfish 65 0049 0000309 Sum IRtotal 000032 Crabs tissues only average
Mercury Estimated hazard index = 32
53
HC-Fidalgo Bay
Appendix D
Lead exposure shellfish ingestion scenario used in the IEUBK model
This section provides inputs for the IEUBK model The following inputs to the model were used to account for the average shellfish ingestion lead exposure from Fidalgo Bay Anacortes Washington
Consumption rates shellfish general population child ndash 057 gday bottom fish general population child ndash 028 gday
The IEUBK model assumes that a childrsquos total meat intake is 935 gday EPArsquos target cleanup goal is no more than 5 of the community with BLLs above 10 microgdL Default assumptions were used unless noted
Table D1 Blood lead values determined using the IEUBK model for lead in seafood from Fidalgo Bay Anacortes Washington
Seafood Average
Concentration (ppm)
Percent meat intake as shellfish
()
Blood Lead level in percent above 10 ugdl Age range 0 - 84 months
Shellfish 121 061 14
Bottom fish
129 030 13
Average Blood Lead level in percent above 10ugdl Age range 0 - 84 months
135
PPM ndash parts per million Crabs tissues and clams average
54
HC-Fidalgo Bay
The IEUBK model assumes that a childrsquos total meat intake is 935 gday EPArsquos target cleanup goal is no more than 5 of the community with BLLs above 10 microgdL Default assumptions were used unless noted
Percent of consumption rates represented by category were obtained by using the mean because the 90th percentile did not add up to the total intake of seafood However the overall consumption rate was based on the 90th percentile consumers only
Consumption rates Tulalip Tribe child ndash shellfish (58 gday) and bottom fish (014 gday)
Table D2 Fidalgo Bay lead intake rate based on Tulalip Tribe child seafood consumption rate Anacortes Washington
Overall FishShellfish Consumption Rate gday
Category Percent of Consumption
Rate Represented by
Category
Site-related Consumption Rate gday
1107 Salmon 284 0 1107 Pelagic Fish 18 0 1107 Bottom Fish 13 014 1107 Shellfish 523 58
Crabs tissues and clams average
Table D3 Blood lead values determine using the IEUBK model for lead in seafood from Fidalgo Bay Anacortes Washington
Seafood Average
Concentration (ppm)
Percent meat intake as shellfish
()
Blood Lead level in percent above 10ugdl Age range 0 - 84 months
Shellfish 121 62 426
Bottom fish 129 015 125 Average Blood Lead level in percent above 10ugdl Age range 0 - 84 months
276
PPM ndash parts per million Crabs tissues and clams average
55
HC-Fidalgo Bay
The IEUBK model assumes that a childrsquos total meat intake is 935 gday EPArsquos target cleanup goal is no more than 5 of the community with BLLs above 10 microgdL Default assumptions were used unless noted
Percent of consumption rates represented by category were obtained by using the mean because the 90th percentile did not add up to the total intake of seafood However the overall consumption rate was based on the 90th percentile consumers only
Consumption rates Suquamish Tribe child ndash shellfish 2926 gday and bottom fish 108 gday
Table D4 Fidalgo Bay lead intake rate based on Suquamish Tribe child seafood consumption rate Anacortes Washington
Overall FishShellfish Consumption Rate gday
Category Percent of Consumption
Rate Represented by
Category
Site-related Consumption Rate gday
5398 Salmon 183 0 5398 Pelagic Fish 91 0 5398 Other 162 0 5398 Bottom Fish 2 108 5398 Shellfish 542 2926
Crabs tissues and clams average
Table D5 Blood lead values determine using the IEUBK model for lead in seafood from Fidalgo Bay Anacortes Washington
Seafood Average
Concentration (ppm)
Percent meat intake as shellfish
()
Blood Lead level in percent above 10ugdl Age range 0 - 84 months
Shellfish 121 3129 3243
Bottom fish 129 116 163 Average Blood Lead level in percent above 10ugdl Age range 0 - 84 months
1703
PPM ndash parts per million Crabs tissues and clams average
56
HC-Fidalgo Bay
Lead exposure shellfish ingestion scenario used in the Adult lead model
This section provides inputs for the Adult lead model EPArsquos target cleanup goal is no more than 5 of the community with BLLs above 10 microgdL Default assumptions were used unless noted
Table D6 Blood lead values determined using the Adult lead model for lead in seafood from Fidalgo Bay Anacortes Washington
Seafood Average
Concentration (ppm)
Motherrsquos blood lead concentration in ugdl
95th percentile fetal blood lead in ugdl
Shellfish 121 mother 19
fetus 48
Bottom fish 129
mother 15
fetus 46
Average motherrsquos blood lead concentration in ugdl
19
Average 95th percentile fetal blood lead in ugdl
47
PPM ndash parts per million Crabs tissues and clams average
57
HC-Fidalgo Bay
Table D7 Fidalgo Bay lead intake rate based on Tulalip Tribe adult seafood consumption rate Anacortes Washington
Overall FishShellfish Consumption Rate gday
Category Percent of Consumption
Rate Represented by
Category
Site-related Consumption Rate gday
194 Salmon 497 0 194 Pelagic Fish 42 0 194 Bottom Fish 39 757 194 Shellfish 422 8187
Crabs tissues and clams average
Table D8 Blood lead values determined using the Adult lead model for lead in seafood from Fidalgo Bay Anacortes Washington
Seafood Average
Concentration (ppm)
Motherrsquos blood lead concentration in ugdl
95th percentile fetal blood lead in ugdl
Shellfish 121 mother 62
fetus 190
Bottom fish
129 mother 19
fetus 59
Average motherrsquos blood lead concentration in ugdl
41
Average 95th percentile fetal blood lead in ugdl
125
PPM ndash parts per million Crabs tissues and clams average
58
HC-Fidalgo Bay
Table D9 Fidalgo Bay lead intake rate based on the Suquamish Tribe Adult seafood consumption rate Anacortes Washington
Overall FishShellfish Consumption Rate gday
Category Percent of Consumption
Rate Represented by
Category
Site-related Consumption Rate gday
7668 Salmon 239 0 7668 Pelagic Fish 73 0 7668 Bottom Fish 38 2914 7668 Shellfish 65 49842
Crabs tissues and clams average
Table D10 Blood lead values determined using the Adult lead model for lead in seafood from Fidalgo Bay Anacortes Washington
Seafood Average
Concentration (ppm)
Motherrsquos blood lead concentration in ugdl
95th percentile fetal blood lead in ugdl
Shellfish 121 mother 304
fetus 927
Bottom fish 129
mother 33
fetus 100
Average motherrsquos blood lead concentration in ugdl
169
Average 95th percentile fetal blood lead in ugdl
514
PPM ndash parts per million Crabs tissues and clams average
59
HC-Fidalgo Bay
Appendix E
Meal Limit Calculations for contaminants of concern (non-carcinogenic health effects)
Meal limits were calculated for clams crabs and bottom fish based on contaminants of concern in each species Additionally meal limits were calculated based on developmental and immunologic endpoints for dioxin and mercury Meal limits were calculated using the equation below in conjunction with the MRL or RfD as the target risk value and the exposure parameters provided in the Table E1 below The developmental and immunologic endpoints are based on the additive effects of dioxin and mercury as recommended in the ATSDR interaction profile for toxic contaminants found in fish Tables E2 E3 and E4 provides meal limits that would be protective of women and children who eat clams crabs and bottomfish from Fidalgo Bay based on contaminants of concern in each species
ML = [(RfD or MRL)BW DM]C MS ML = recommended fish meal limit per month (mealmonth) RfD = reference dose (EPA) MRL = minimal risk level (ATSDR)
Many factors must be considered when one is recommending limits on the consumption of fish including the health benefits of eating fish the quality and comprehensiveness of environmental data and the availability of alternate sources of nutrition In addition these limits do not consider that multiple species are consumed a consideration that would require weighting of the percent of each species consumed These allowable ingestion rates also do not consider the fact that cooking reduces exposure to some contaminants in fish Therefore allowable consumption limits for prepared fish would be greater than those shown in tables E2 E3 and E4
Table E1 Exposure parameters used to calculate recommended meal limits for clams crabs and bottom fish from Fidalgo Bay in Anacortes Washington
Exposure Parameter RfD Endpoint Units MRL Developmental
RfDMRL Immunological RfDMRL
Average Concentration (C) variable ugkg Arsenic 03
ugkgday Cadmium 1 Chromium 3 Dioxin 0000001 0000001 000002 Mercury 01 01 03 Days per month (DM) 304 304 304 daysmonth Mean Body Weight (BW) 60 60 60 kg Meal size (MS) 0227 0227 0227 kg
60
HC-Fidalgo Bay
Table E2 Calculated meal limits per month for clams from Fidalgo Bay in Anacortes Washington
Contamination Concentration (ppm)
Meals based on RfD MRL
Lowest meals per month (rounded to single digit)
Arsenic 0027 893 13Chromium 184 131
Dioxin 799E-8 1006
Table E3 Calculated meal limits per month for Crabs from Fidalgo Bay in Anacortes Washington
Contamination Concentration (ppm)
Meals based on RfD MRL
Meals based on Developmental additive endpoint
Meals based on Immune additive endpoint
Lowest meals per month (rounded to single digit)
Arsenic 0071 339 14Cadmium 048 167
Dioxin 975E-8 824 137 478 Mercury 0049 164
Table E4 Calculated meal limits per month for Bottom Fish from Fidalgo Bay in Anacortes Washington
Contamination Concentration (ppm)
Meals based on RfD MRL
Meals based on Developmental additive endpoint
Meals based on Immune additive endpoint
Lowest meals per month (rounded to single digit)
Arsenic 015 161 14Dioxin 134E-7 600 145 548
Mercury 0042 191
Applying the Table E2 E3 and E4 meal limits across the general population assumes that meal size will decrease or increase proportionately with body weight Such an assumption could result in underestimating exposure for consumers who eat proportionately more fish per unit of body weight Table E5 demonstrates how an eight-ounce meal for a 70-kilogram adult would change to remain proportional with body weight
61
HC-Fidalgo Bay
Table E5 Adjustment of fish meal size based on the body weight of the consumer
Body Weight Meal Size Pounds Kilograms Ounces Grams
19 9 1 28 39 18 2 57 58 26 3 85 77 35 4 113 96 44 5 142 116 53 6 170 135 61 7 199 154 70 8 227 173 79 9 255 193 88 10 284 212 96 11 312 231 105 12 340 250 113 13 369 270 123 14 397 289 131 15 425 308 140 16 454
62

HC-Fidalgo Bay
Figure 3 Ecologyrsquos sediment and biota sample areas within Fidalgo Bay Skagit County Washington
38
HC-Fidalgo Bay
Appendix A This section provides calculated exposure doses and assumptions used for exposure to chemicals in sediments at the Fidalgo Bay site Three different exposure scenarios were developed to model exposures that might occur These scenarios were devised to represent exposures to a child (0-5 yrs) an older child and an adult The following exposure parameters and dose equations were used to estimate exposure doses from direct contact with chemicals in sediments
Exposure to chemicals in soil via ingestion inhalation and dermal absorption
Total dose (non-cancer) = Ingested dose + inhaled dose + dermally absorbed dose
Ingestion Route
Dose(non-cancer (mgkg-day) = C x CF x IR x EF x ED BW x ATnon-cancer
Cancer Risk = C x CF x IR x EF x CPF x ED BW x ATcancer
Dermal Route
Dermal Transfer (DT) = C x AF x ABS x AD x CF ORAF
Dose(non-cancer (mgkg-day) = DT x SA x EF x ED BW x ATnon-cancer
Cancer Risk = DT x SA x EF x CPF x ED BW x ATcancer
Inhalation Route
Dosenon-cancer (mgkg-day) = C x SMF x IHR x EF x ED x 1PEF BW x ATnon-cancer
Cancer Risk = C x SMF x IHR x EF x ED x CPF x 1PEF BW x ATcancer
39
HC-Fidalgo Bay
Table A1 Exposure assumptions used to estimate cPAHs doses from direct contact with sediments in Fidalgo Bay Anacortes WA
Parameter Value Unit Comments Concentration (C) Variable mgkg Maximum detected value
Conversion Factor (CF) 0000001 kgmg Converts contaminant concentration from milligrams (mg) to kilograms (kg)
Ingestion Rate (IR) ndash adult 100 mgday Exposure Factors Handbook [44] Ingestion Rate (IR) ndash older child 100
Ingestion Rate (IR) - child 200 Exposure Frequency (EF) 52 Daysyear One days a week
Exposure Duration (Ed) 30 (5 1015) years Number of years at one residence (child older child adult yrs)
Body Weight (BW) - adult 72 kg
Adult mean body weight Body Weight (BW) ndash older child 41 Older child mean body weight Body Weight (BW) - child 15 0-5 year-old child average body weight Surface area (SA) - adult 5700
cm2 Exposure Factors Handbook Surface area (SA) ndash older child 2900 Surface area (SA) - child 2900 Averaging Timenon-cancer (AT) 1825 days 5 years Averaging Timecancer (AT) 27375 days 75 years Cancer Potency Factor (CPF) 73 mgkg-day-1 Source EPA 24 hr absorption factor (ABS) 013 unitless Source EPA (Chemical Specific) PAH Oral route adjustment factor (ORAF) 1 unitless Non-cancer (nc) cancer (c) - default Adherence duration (AD) 1 days Source EPA
Adherence factor (AF) 02
mgcm2 Child older child 007 Adult
Inhalation rate (IHR) - adult 152 m3day Exposure Factors Handbook [44] Inhalation rate (IHR) ndash older child 14
Inhalation rate (IHR) - child 83 Soil matrix factor (SMF) 1 unitless Non-cancer (nc) cancer (c) - default Particulate emission factor (PEF) 145E+7 m3kg Model Parameters
40
HC-Fidalgo Bay
Fidalgo Bay Sediment Exposure Route ndash Non-cancer
Table A2 Non-cancer hazard calculations resulting from exposure to cPAHs in sediments from Fidalgo Bay Anacortes WA
Contaminant
TEQ Concentra
tion (ppm)
(mgkg)
Scenarios
Estimated Dose (mgkgday)
Total Dose LOAEL
(mgkgday)
Total Dose LOAELIncidental
Ingestion of Soil
Dermal Contact
with Soil
Inhalation of Particulates
Child 194E-7 730E-8 134E-11 267E-7 000000003
cPAH 0102 Older Child 354E-8 267E-8 828E-12 622E-8 10E+1 0000000006
Adult 202E-8 105E-8 512E-12 307E-8 0000000003
Fidalgo Bay Sediment Exposure Route ndash Cancer
Table A3 Cancer hazard calculations resulting from exposure to cPAHs sediments from Fidalgo Bay Anacortes WA
Contaminant Concentra tion (ppm)
EPA cancer Group
Cancer Potency Factor
(mgkg-day-1)
Scenarios
Increased Cancer Risk Total
Cancer RiskIncidental
Ingestion of Soil
Dermal Contact
with Soil
Inhalation of Particulates
Child 943E-8 355E-8 653E-12 130E-7
Total cPAH TEQ 0102 B2 73 Older Child 345E-8 260E-8 806E-12 605E-8
Adult 295E-8 153E-8 747E-12 448E-8
Lifetime cancer risk 130E-7 + 605E-8 + 448E-8 = 235E-7
41
HC-Fidalgo Bay
Appendix B
This section provides calculated exposure doses and exposure assumptions used for chemicals in bottom fish shellfish and crab samples taken from Fidalgo Bay These exposure scenarios were developed to model exposures that might occur and were devised to represent exposures to the general population The following exposure parameters and dose equations were used to estimate exposure doses from ingestion of contaminants in bottom fish and shellfish
Ingestion Route
Dose(non-cancer (mgkg-day) = C x CF1 x IR x CF2 x EF x ED BW x ATnon-cancer
Cancer Risk = C x CF1 x IR x CF2 x EF x CPF x ED BW x ATcancer
Table B1 Exposure assumptions used in exposure evaluation of contaminants in bottom fish shellfish and crab samples taken from Fidalgo Bay in Anacortes Washington
Parameter Value Unit Comments Concentration (C) Variable ugkg Average detected value
Conversion Factor (CF1) 0001 mgkg Converts contaminant concentration from milligrams (mg) to kilograms (kg)
Conversion Factor (CF2) 0001 kgg Converts mass of shellfish from grams (g) to kilograms (kg)
Ingestion Rate (IR) 057
gday
Body weight-adjusted shellfish consumption rates to account for children eating nearly 16 times as much fish per body weight as do adults (see table B2)
Ingestion Rate (IR) 028 Average general population child ndash bottom fish (see table B3)
Ingestion Rate (IR) 081 Body weight-adjusted shellfish consumption rates to account for an older child eating 081 times as much fish per body weight as do adults (see table B2)
Ingestion Rate (IR) 036 Average general population older child ndash bottom fish (see table B3)
Ingestion Rate (IR) 17 Average general population adult - shellfish
Ingestion Rate (IR) 07 Average general population adult ndash bottom fish (see table B3)
Exposure Frequency (EF) 365 Daysyear Assumes daily exposure
Exposure Duration (ED) 6 years
Number of years at one residence (child) Exposure Duration (ED) 30 Number of years at one residence (adult) Body weight (BW) 15
kg Mean body weight child
Body weight (BW) 70 Mean body weight adult Averaging Timenon-cancer (AT) Variable days Equal to Exposure Duration Averaging Timecancer (AT) 25550 days 70 years Cancer Potency Factor (CPF) Variable mgkg-day-1 Source EPA ndash Chemical specific
42
HC-Fidalgo Bay
Table B2 Derivation of a childrsquos shellfish consumption rate for the general US population
Row Parameter Adult Older Child (6-17 yrs)
Child (0-6 yrs)
1 Reported All Fish Consumption Rate-gram fish per kg bodyweight per day (gkgday)
0277 0225 0433
2 Ratio to Adult All Fish Consumption Rate
1 081 16
3 Reported Shellfish Consumption (gday)
170 (average) Not Reported Not Reported
4 Average Body Weight (kg) 70 41 15 5 Ratio to Adult BW 1 059 021 6 Adjusted Shellfish Consumption Rates
(gday) = Row 2 x Row 3 x Row 5
170 (average) 081 (average) 057 (average)
Table B3 Derivation of bottom consumption rate for the general US population based on four percent of total fish intake
Row Parameter Adult Older Child (6-17 yrs)
Child (0-6 yrs)
1 Reported All Fish Consumption Rateshy(gday)
175 90 70
2 Assume bottom fish intake rate similar to tribal at about 4 percent [15]
004 004 004
3 Adjusted bottom fish rates (gday) = Row 1 x Row 2
070 036 028
43
HC-Fidalgo Bay
Table B4 Exposure dose and non-cancer risk from ingesting seafood at the average concentrations of contaminants in bottom fish clams and crab samples taken from Fidalgo Bay in Anacortes Washington
Species Contaminant Average Concentration
(ppm)
Estimated Dose (mgkgday)
General population Average
MRL or RfD (mgkgday)
Hazard quotient
General population Average
Clams
Arsenic
0027 Child 103E-6
300E-4
0003 Older child 533E-7 0002
Adult 656E-7 0002
Crabs 0071 Child 270E-6 0009
Older child 140E-6 0005 Adult 172E-6 0006
Bottom Fish 015 Child 260E-6 0009
Older child 132E-6 0004 Adult 150E-6 0005
Crabs Cadmium 048 Child 182E-5
100E-3 0018
Older child 948E-6 0009 Adult 117E-5 0012
Clams Chromium 184 Child 699E-5
300E-3 0023
Older child 364E-5 0012 Adult 447E-5 0015
Clams
Dioxin
799E-8 Child 304E-12
10E-9
0003 Older child 158E-12 00016
Adult 194E-12 00019
Crabs 975E-8 Child 371E-12 00037
Older child 193E-12 00019 Adult 237E-12 00024
Bottom Fish 134E-7 Child 250E-12 0003
Older child 118E-12 00012 Adult 134E-12 00013
Crabs
Mercury
0049 Child 186E-6
100E-4
0019 Older child 968E-7 00097
Adult 119E-6 0012
Bottom Fish 0042 Child 784E-7 0008
Older child 369E-7 00037 Adult 420E-7 00042
PPM ndash parts per million
44
HC-Fidalgo Bay
Table B5 Cancer risk from ingesting seafood at the average concentrations of contaminants in bottom fish clams and crab samples taken from Fidalgo Bay in Anacortes Washington
Species Contaminant Average Concentration
(ppm)
Cancer Potency Factor
(mgkg-day-1)
Increased Cancer Risk
General population Average
Total Cancer Risk General population
Average
Clams
Arsenic
0027
57
Child 501E-7
153E-5
Older child 434E-7 Adult 160E-6
Crabs 0071 Child 132E-6
Older child 114E-6 Adult 421E-6
Bottom Fish 015 Child 137E-6
Older child 107E-6 Adult 366E-6
Clams
Dioxin
799E-8
15E+5
Child 390E-8
582E-7
Older child 338E-8 Adult 125E-7
Crabs 975E-8 Child 476E-8
Older child 413E-8 Adult 152E-7
Bottom Fish 134E-7 Child 322E-8
Older child 252E-8 Adult 861E-8
Sum of cancer risk 159E-5
45
HC-Fidalgo Bay
Appendix C This section provides calculated exposure doses and assumptions used for exposure to chemicals in seafood at the Fidalgo Bay site using Tulalip Tribe consumption rates It is based on the EPA Tribal framework for fish and shellfish consumption rates for risk-based decisions
Intake of contaminant in mgkg-day (IR ) = (CF x CR x x UCF ) BW c i PS i 1
[Equation 1] Where IR = Intake rate of contaminant by category of fishshellfish
c
CF = contaminant concentration (mgkg) in the tissue of the particular fish or shellfish category i
CR = the total consumption rate of fish and shellfish harvested from Puget Sound 194 grams per PS
day = the percentage of the ingestion rate that consists of the category of fish or shellfish unitless
i
BW = body weight 818 kilograms observed from the Tulalip Tribesrsquo study UCF = conversion factor 1 0001 kilograms per gram
1
Estimated cancer risk (ECR) = (IR x ED x EF x CSF) (AT x UCF ) [Equation 2] total 2
Where IR = Total intake of contaminant from site-related fish and shellfish consumption
total
ED = exposure duration 70 years EF = exposure frequency 365 days per year CSF = oral cancer slope factor for contaminant AT = averaging time 70 years for carcinogens UCF = conversion factor 2 (365 daysyear)
2
Estimated hazard index (EHI) = (IR x ED x EF x UCF ) (RfD x AT) [Equation 3] total 2
Where IR = Total intake of contaminant from site-related fish and shellfish consumption
total
ED = exposure duration 70 years EF = exposure frequency 365 days per year RfD = Oral reference dose for contaminant AT = averaging time the same as exposure duration for non-carcinogenic effects UCF = conversion factor 2 (1 yr365 days)
2
46
HC-Fidalgo Bay
Table C1 Fidalgo Bay arsenic intake rate based on the Tulalip Tribe seafood consumption rate Anacortes Washington
Overall FishShellfish Consumption Rate gday
Category Percent of Consumption Rate Represented by Category
Site-related concentration of arsenic mgkg in tissue
Category Specific Exposure mgkg-day
194 Salmon 497 0 0 194 Pelagic Fish 42 0 0 194 Bottom Fish 39 015 00000139 194 Shellfish 422 0049 00000490 Sum IRtotal 00000629 Crabs tissues and clams average
Arsenic Estimated hazard index = 021
Arsenic Estimated cancer risk = 21E-3
Table C2 Fidalgo Bay cadmium intake rate based on the Tulalip Tribe seafood consumption rate Anacortes Washington
Overall FishShellfish Consumption Rate gday
Category Percent of Consumption Rate Represented by Category
Site-related concentration of cadmium mgkg in tissue
Category Specific Exposure mgkg-day
194 Salmon 497 0 0 194 Pelagic Fish 42 0 0 194 Bottom Fish 39 0 0 194 Shellfish 422 048 000048 Sum IRtotal 000048 Crabs tissues only average
Cadmium Estimated hazard index = 03
47
HC-Fidalgo Bay
Table C3 Fidalgo Bay chromium intake rate based on Tulalip Tribe seafood consumption rate Anacortes Washington
Overall FishShellfish Consumption Rate gday
Category Percent of Consumption Rate Represented by Category
Site-related concentration of chromium mgkg in tissue
Category Specific Exposure mgkg-day
194 Salmon 497 0 0 194 Pelagic Fish 42 0 0 194 Bottom Fish 39 0 0 194 Shellfish 422 184 000184 Sum IRtotal 000184 Clams tissues only average
Chromium Estimated hazard index = 061
Table C4 Fidalgo Bay dioxin intake rate based on the Tulalip Tribe seafood consumption rate Anacortes Washington
Overall FishShellfish Consumption Rate gday
Category Percent of Consumption Rate Represented by Category
Site-related concentration of dioxin mgkg in tissue
Category Specific Exposure mgkg-day
194 Salmon 497 0 0 194 Pelagic Fish 42 0 0 194 Bottom Fish 39 134E-7 124E-11 194 Shellfish 422 887E-8 888E-11 Sum IRtotal 101E-10 Crabs tissues and clams average
Dioxin Estimated hazard index = 010
Dioxin Estimated cancer risk = 152E-5
48
HC-Fidalgo Bay
Table C5 Fidalgo Bay mercury intake rate based on the Tulalip Tribe seafood consumption rate Anacortes Washington
Overall FishShellfish Consumption Rate gday
Category Percent of Consumption Rate Represented by Category
Site-related concentration of mercury mgkg in tissue
Category Specific Exposure mgkg-day
194 Salmon 497 0 0 194 Pelagic Fish 42 0 0 194 Bottom Fish 39 0042 000000388 194 Shellfish 422 0049 0000049 Sum IRtotal 00000529 Crabs tissues only average
Mercury Estimated hazard index = 053
49
HC-Fidalgo Bay
This section provides calculated exposure doses and assumptions used for exposure to chemicals in seafood at Fidalgo Bay using Suquamish Tribe consumption rates It is based on the EPA Tribal framework for fish and shellfish consumption rates for risk-based decisions
Intake of contaminant in mgkg-day (IR ) = (CF x CR x x UCF ) BW c i PS i 1
[Equation 1] Where IR = Intake rate of contaminant by category of fishshellfish
c
CF = contaminant concentration (mgkg) in the tissue of the particular fish or shellfish category i
CR = the total consumption rate of fish and shellfish harvested from Puget Sound 7668 grams per PS
day = the percentage of the ingestion rate that consists of the category of fish or shellfish unitless
i
BW = body weight 79 kilograms observed from the Suquamish Tribesrsquo study UCF = conversion factor 1 0001 kilograms per gram
1
Estimated cancer risk (ECR) = (IR x ED x EF x CSF) (AT x UCF ) [Equation 2] total 2
Where IR = Total intake of contaminant from site-related fish and shellfish consumption
total
ED = exposure duration 70 years EF = exposure frequency 365 days per year CSF = oral cancer slope factor for contaminant AT = averaging time 70 years for carcinogens UCF = conversion factor 2 (365 daysyear)
2
Estimated hazard index (EHI) = (IR x ED x EF x UCF ) (RfD x AT) [Equation 3] total 2
Where IR = Total intake of contaminant from site-related fish and shellfish consumption
total
ED = exposure duration 70 years EF = exposure frequency 365 days per year RfD = Oral reference dose for contaminant AT = averaging time the same as exposure duration for non-carcinogenic effects UCF = conversion factor 2 (1 yr365 days)
2
50
HC-Fidalgo Bay
Table C6 Fidalgo Bay arsenic intake rate based on Suquamish Tribe seafood consumption rate Anacortes Washington
Overall FishShellfish Consumption Rate gday
Category Percent of Consumption Rate Represented by Category
Site-related concentration of arsenic mgkg in tissue
Category Specific Exposure mgkg-day
7668 Salmon 239 0 0 7668 Pelagic Fish 73 0 0 7668 Bottom Fish 38 015 00000553 7668 Shellfish 65 0049 0000309 Sum IRtotal 0000364 Crabs tissues and clams average
Arsenic Estimated hazard index = 12
Arsenic Estimated cancer risk = 359E-4
Table C7 Fidalgo Bay cadmium intake rate based on Suquamish Tribe seafood consumption rate Anacortes Washington
Overall FishShellfish Consumption Rate gday
Category Percent of Consumption Rate Represented by Category
Site-related concentration of cadmium mgkg in tissue
Category Specific Exposure mgkg-day
7668 Salmon 239 0 0 7668 Pelagic Fish 73 0 0 7668 Bottom Fish 38 0 0 7668 Shellfish 65 048 0003 Sum IRtotal 0003 Crabs tissues only average
Cadmium Estimated hazard index = 3
51
HC-Fidalgo Bay
Table C8 Fidalgo Bay chromium intake rate based on Suquamish Tribe seafood consumption rate Anacortes Washington
Overall FishShellfish Consumption Rate gday
Category Percent of Consumption Rate Represented by Category
Site-related concentration of chromium mgkg in tissue
Category Specific Exposure mgkg-day
7668 Salmon 239 0 0 7668 Pelagic Fish 73 0 0 7668 Bottom Fish 38 0 0 7668 Shellfish 65 184 00116 Sum IRtotal 00116 Clams tissues only average
Chromium Estimated hazard index = 387
Table C9 Fidalgo Bay dioxin intake rate based on Suquamish Tribe seafood consumption rate Anacortes Washington
Overall FishShellfish Consumption Rate gday
Category Percent of Consumption Rate Represented by Category
Site-related concentration of dioxin mgkg in tissue
Category Specific Exposure mgkg-day
7668 Salmon 239 0 0 7668 Pelagic Fish 73 0 0 7668 Bottom Fish 38 134E-7 494E-11 7668 Shellfish 65 887E-8 56E-10 Sum IRtotal 609E-10 Crabs tissues and clams average
Dioxin Estimated hazard index = 061 Dioxin Estimated cancer risk = 914E-5
52
HC-Fidalgo Bay
Table C10 Fidalgo Bay mercury intake rate based on Suquamish Tribe seafood consumption rate Anacortes Washington
Overall FishShellfish Consumption Rate gday
Category Percent of Consumption Rate Represented by Category
Site-related concentration of mercury mgkg in tissue
Category Specific Exposure mgkg-day
7668 Salmon 239 0 0 7668 Pelagic Fish 73 0 0 7668 Bottom Fish 38 0042 00000155 7668 Shellfish 65 0049 0000309 Sum IRtotal 000032 Crabs tissues only average
Mercury Estimated hazard index = 32
53
HC-Fidalgo Bay
Appendix D
Lead exposure shellfish ingestion scenario used in the IEUBK model
This section provides inputs for the IEUBK model The following inputs to the model were used to account for the average shellfish ingestion lead exposure from Fidalgo Bay Anacortes Washington
Consumption rates shellfish general population child ndash 057 gday bottom fish general population child ndash 028 gday
The IEUBK model assumes that a childrsquos total meat intake is 935 gday EPArsquos target cleanup goal is no more than 5 of the community with BLLs above 10 microgdL Default assumptions were used unless noted
Table D1 Blood lead values determined using the IEUBK model for lead in seafood from Fidalgo Bay Anacortes Washington
Seafood Average
Concentration (ppm)
Percent meat intake as shellfish
()
Blood Lead level in percent above 10 ugdl Age range 0 - 84 months
Shellfish 121 061 14
Bottom fish
129 030 13
Average Blood Lead level in percent above 10ugdl Age range 0 - 84 months
135
PPM ndash parts per million Crabs tissues and clams average
54
HC-Fidalgo Bay
The IEUBK model assumes that a childrsquos total meat intake is 935 gday EPArsquos target cleanup goal is no more than 5 of the community with BLLs above 10 microgdL Default assumptions were used unless noted
Percent of consumption rates represented by category were obtained by using the mean because the 90th percentile did not add up to the total intake of seafood However the overall consumption rate was based on the 90th percentile consumers only
Consumption rates Tulalip Tribe child ndash shellfish (58 gday) and bottom fish (014 gday)
Table D2 Fidalgo Bay lead intake rate based on Tulalip Tribe child seafood consumption rate Anacortes Washington
Overall FishShellfish Consumption Rate gday
Category Percent of Consumption
Rate Represented by
Category
Site-related Consumption Rate gday
1107 Salmon 284 0 1107 Pelagic Fish 18 0 1107 Bottom Fish 13 014 1107 Shellfish 523 58
Crabs tissues and clams average
Table D3 Blood lead values determine using the IEUBK model for lead in seafood from Fidalgo Bay Anacortes Washington
Seafood Average
Concentration (ppm)
Percent meat intake as shellfish
()
Blood Lead level in percent above 10ugdl Age range 0 - 84 months
Shellfish 121 62 426
Bottom fish 129 015 125 Average Blood Lead level in percent above 10ugdl Age range 0 - 84 months
276
PPM ndash parts per million Crabs tissues and clams average
55
HC-Fidalgo Bay
The IEUBK model assumes that a childrsquos total meat intake is 935 gday EPArsquos target cleanup goal is no more than 5 of the community with BLLs above 10 microgdL Default assumptions were used unless noted
Percent of consumption rates represented by category were obtained by using the mean because the 90th percentile did not add up to the total intake of seafood However the overall consumption rate was based on the 90th percentile consumers only
Consumption rates Suquamish Tribe child ndash shellfish 2926 gday and bottom fish 108 gday
Table D4 Fidalgo Bay lead intake rate based on Suquamish Tribe child seafood consumption rate Anacortes Washington
Overall FishShellfish Consumption Rate gday
Category Percent of Consumption
Rate Represented by
Category
Site-related Consumption Rate gday
5398 Salmon 183 0 5398 Pelagic Fish 91 0 5398 Other 162 0 5398 Bottom Fish 2 108 5398 Shellfish 542 2926
Crabs tissues and clams average
Table D5 Blood lead values determine using the IEUBK model for lead in seafood from Fidalgo Bay Anacortes Washington
Seafood Average
Concentration (ppm)
Percent meat intake as shellfish
()
Blood Lead level in percent above 10ugdl Age range 0 - 84 months
Shellfish 121 3129 3243
Bottom fish 129 116 163 Average Blood Lead level in percent above 10ugdl Age range 0 - 84 months
1703
PPM ndash parts per million Crabs tissues and clams average
56
HC-Fidalgo Bay
Lead exposure shellfish ingestion scenario used in the Adult lead model
This section provides inputs for the Adult lead model EPArsquos target cleanup goal is no more than 5 of the community with BLLs above 10 microgdL Default assumptions were used unless noted
Table D6 Blood lead values determined using the Adult lead model for lead in seafood from Fidalgo Bay Anacortes Washington
Seafood Average
Concentration (ppm)
Motherrsquos blood lead concentration in ugdl
95th percentile fetal blood lead in ugdl
Shellfish 121 mother 19
fetus 48
Bottom fish 129
mother 15
fetus 46
Average motherrsquos blood lead concentration in ugdl
19
Average 95th percentile fetal blood lead in ugdl
47
PPM ndash parts per million Crabs tissues and clams average
57
HC-Fidalgo Bay
Table D7 Fidalgo Bay lead intake rate based on Tulalip Tribe adult seafood consumption rate Anacortes Washington
Overall FishShellfish Consumption Rate gday
Category Percent of Consumption
Rate Represented by
Category
Site-related Consumption Rate gday
194 Salmon 497 0 194 Pelagic Fish 42 0 194 Bottom Fish 39 757 194 Shellfish 422 8187
Crabs tissues and clams average
Table D8 Blood lead values determined using the Adult lead model for lead in seafood from Fidalgo Bay Anacortes Washington
Seafood Average
Concentration (ppm)
Motherrsquos blood lead concentration in ugdl
95th percentile fetal blood lead in ugdl
Shellfish 121 mother 62
fetus 190
Bottom fish
129 mother 19
fetus 59
Average motherrsquos blood lead concentration in ugdl
41
Average 95th percentile fetal blood lead in ugdl
125
PPM ndash parts per million Crabs tissues and clams average
58
HC-Fidalgo Bay
Table D9 Fidalgo Bay lead intake rate based on the Suquamish Tribe Adult seafood consumption rate Anacortes Washington
Overall FishShellfish Consumption Rate gday
Category Percent of Consumption
Rate Represented by
Category
Site-related Consumption Rate gday
7668 Salmon 239 0 7668 Pelagic Fish 73 0 7668 Bottom Fish 38 2914 7668 Shellfish 65 49842
Crabs tissues and clams average
Table D10 Blood lead values determined using the Adult lead model for lead in seafood from Fidalgo Bay Anacortes Washington
Seafood Average
Concentration (ppm)
Motherrsquos blood lead concentration in ugdl
95th percentile fetal blood lead in ugdl
Shellfish 121 mother 304
fetus 927
Bottom fish 129
mother 33
fetus 100
Average motherrsquos blood lead concentration in ugdl
169
Average 95th percentile fetal blood lead in ugdl
514
PPM ndash parts per million Crabs tissues and clams average
59
HC-Fidalgo Bay
Appendix E
Meal Limit Calculations for contaminants of concern (non-carcinogenic health effects)
Meal limits were calculated for clams crabs and bottom fish based on contaminants of concern in each species Additionally meal limits were calculated based on developmental and immunologic endpoints for dioxin and mercury Meal limits were calculated using the equation below in conjunction with the MRL or RfD as the target risk value and the exposure parameters provided in the Table E1 below The developmental and immunologic endpoints are based on the additive effects of dioxin and mercury as recommended in the ATSDR interaction profile for toxic contaminants found in fish Tables E2 E3 and E4 provides meal limits that would be protective of women and children who eat clams crabs and bottomfish from Fidalgo Bay based on contaminants of concern in each species
ML = [(RfD or MRL)BW DM]C MS ML = recommended fish meal limit per month (mealmonth) RfD = reference dose (EPA) MRL = minimal risk level (ATSDR)
Many factors must be considered when one is recommending limits on the consumption of fish including the health benefits of eating fish the quality and comprehensiveness of environmental data and the availability of alternate sources of nutrition In addition these limits do not consider that multiple species are consumed a consideration that would require weighting of the percent of each species consumed These allowable ingestion rates also do not consider the fact that cooking reduces exposure to some contaminants in fish Therefore allowable consumption limits for prepared fish would be greater than those shown in tables E2 E3 and E4
Table E1 Exposure parameters used to calculate recommended meal limits for clams crabs and bottom fish from Fidalgo Bay in Anacortes Washington
Exposure Parameter RfD Endpoint Units MRL Developmental
RfDMRL Immunological RfDMRL
Average Concentration (C) variable ugkg Arsenic 03
ugkgday Cadmium 1 Chromium 3 Dioxin 0000001 0000001 000002 Mercury 01 01 03 Days per month (DM) 304 304 304 daysmonth Mean Body Weight (BW) 60 60 60 kg Meal size (MS) 0227 0227 0227 kg
60
HC-Fidalgo Bay
Table E2 Calculated meal limits per month for clams from Fidalgo Bay in Anacortes Washington
Contamination Concentration (ppm)
Meals based on RfD MRL
Lowest meals per month (rounded to single digit)
Arsenic 0027 893 13Chromium 184 131
Dioxin 799E-8 1006
Table E3 Calculated meal limits per month for Crabs from Fidalgo Bay in Anacortes Washington
Contamination Concentration (ppm)
Meals based on RfD MRL
Meals based on Developmental additive endpoint
Meals based on Immune additive endpoint
Lowest meals per month (rounded to single digit)
Arsenic 0071 339 14Cadmium 048 167
Dioxin 975E-8 824 137 478 Mercury 0049 164
Table E4 Calculated meal limits per month for Bottom Fish from Fidalgo Bay in Anacortes Washington
Contamination Concentration (ppm)
Meals based on RfD MRL
Meals based on Developmental additive endpoint
Meals based on Immune additive endpoint
Lowest meals per month (rounded to single digit)
Arsenic 015 161 14Dioxin 134E-7 600 145 548
Mercury 0042 191
Applying the Table E2 E3 and E4 meal limits across the general population assumes that meal size will decrease or increase proportionately with body weight Such an assumption could result in underestimating exposure for consumers who eat proportionately more fish per unit of body weight Table E5 demonstrates how an eight-ounce meal for a 70-kilogram adult would change to remain proportional with body weight
61
HC-Fidalgo Bay
Table E5 Adjustment of fish meal size based on the body weight of the consumer
Body Weight Meal Size Pounds Kilograms Ounces Grams
19 9 1 28 39 18 2 57 58 26 3 85 77 35 4 113 96 44 5 142 116 53 6 170 135 61 7 199 154 70 8 227 173 79 9 255 193 88 10 284 212 96 11 312 231 105 12 340 250 113 13 369 270 123 14 397 289 131 15 425 308 140 16 454
62
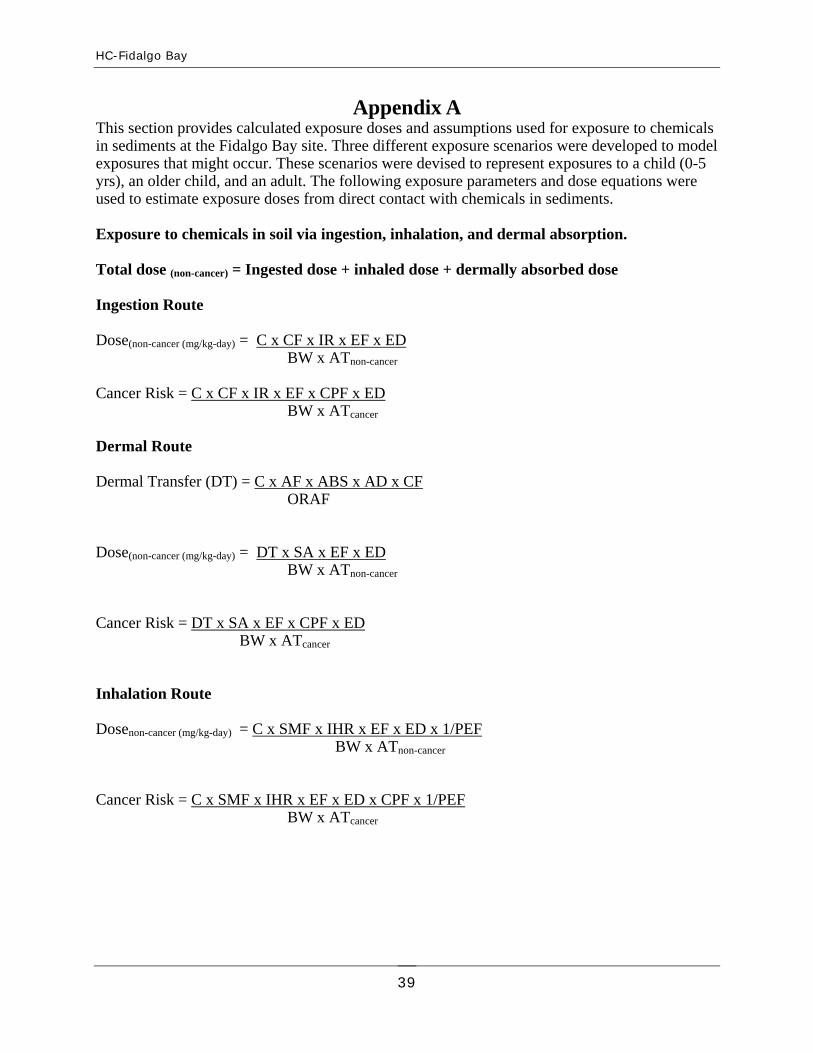
HC-Fidalgo Bay
The IEUBK model assumes that a childrsquos total meat intake is 935 gday EPArsquos target cleanup goal is no more than 5 of the community with BLLs above 10 microgdL Default assumptions were used unless noted
Percent of consumption rates represented by category were obtained by using the mean because the 90th percentile did not add up to the total intake of seafood However the overall consumption rate was based on the 90th percentile consumers only
Consumption rates Tulalip Tribe child ndash shellfish (58 gday) and bottom fish (014 gday)
Table D2 Fidalgo Bay lead intake rate based on Tulalip Tribe child seafood consumption rate Anacortes Washington
Overall FishShellfish Consumption Rate gday
Category Percent of Consumption
Rate Represented by
Category
Site-related Consumption Rate gday
1107 Salmon 284 0 1107 Pelagic Fish 18 0 1107 Bottom Fish 13 014 1107 Shellfish 523 58
Crabs tissues and clams average
Table D3 Blood lead values determine using the IEUBK model for lead in seafood from Fidalgo Bay Anacortes Washington
Seafood Average
Concentration (ppm)
Percent meat intake as shellfish
()
Blood Lead level in percent above 10ugdl Age range 0 - 84 months
Shellfish 121 62 426
Bottom fish 129 015 125 Average Blood Lead level in percent above 10ugdl Age range 0 - 84 months
276
PPM ndash parts per million Crabs tissues and clams average
55
HC-Fidalgo Bay
The IEUBK model assumes that a childrsquos total meat intake is 935 gday EPArsquos target cleanup goal is no more than 5 of the community with BLLs above 10 microgdL Default assumptions were used unless noted
Percent of consumption rates represented by category were obtained by using the mean because the 90th percentile did not add up to the total intake of seafood However the overall consumption rate was based on the 90th percentile consumers only
Consumption rates Suquamish Tribe child ndash shellfish 2926 gday and bottom fish 108 gday
Table D4 Fidalgo Bay lead intake rate based on Suquamish Tribe child seafood consumption rate Anacortes Washington
Overall FishShellfish Consumption Rate gday
Category Percent of Consumption
Rate Represented by
Category
Site-related Consumption Rate gday
5398 Salmon 183 0 5398 Pelagic Fish 91 0 5398 Other 162 0 5398 Bottom Fish 2 108 5398 Shellfish 542 2926
Crabs tissues and clams average
Table D5 Blood lead values determine using the IEUBK model for lead in seafood from Fidalgo Bay Anacortes Washington
Seafood Average
Concentration (ppm)
Percent meat intake as shellfish
()
Blood Lead level in percent above 10ugdl Age range 0 - 84 months
Shellfish 121 3129 3243
Bottom fish 129 116 163 Average Blood Lead level in percent above 10ugdl Age range 0 - 84 months
1703
PPM ndash parts per million Crabs tissues and clams average
56
HC-Fidalgo Bay
Lead exposure shellfish ingestion scenario used in the Adult lead model
This section provides inputs for the Adult lead model EPArsquos target cleanup goal is no more than 5 of the community with BLLs above 10 microgdL Default assumptions were used unless noted
Table D6 Blood lead values determined using the Adult lead model for lead in seafood from Fidalgo Bay Anacortes Washington
Seafood Average
Concentration (ppm)
Motherrsquos blood lead concentration in ugdl
95th percentile fetal blood lead in ugdl
Shellfish 121 mother 19
fetus 48
Bottom fish 129
mother 15
fetus 46
Average motherrsquos blood lead concentration in ugdl
19
Average 95th percentile fetal blood lead in ugdl
47
PPM ndash parts per million Crabs tissues and clams average
57
HC-Fidalgo Bay
Table D7 Fidalgo Bay lead intake rate based on Tulalip Tribe adult seafood consumption rate Anacortes Washington
Overall FishShellfish Consumption Rate gday
Category Percent of Consumption
Rate Represented by
Category
Site-related Consumption Rate gday
194 Salmon 497 0 194 Pelagic Fish 42 0 194 Bottom Fish 39 757 194 Shellfish 422 8187
Crabs tissues and clams average
Table D8 Blood lead values determined using the Adult lead model for lead in seafood from Fidalgo Bay Anacortes Washington
Seafood Average
Concentration (ppm)
Motherrsquos blood lead concentration in ugdl
95th percentile fetal blood lead in ugdl
Shellfish 121 mother 62
fetus 190
Bottom fish
129 mother 19
fetus 59
Average motherrsquos blood lead concentration in ugdl
41
Average 95th percentile fetal blood lead in ugdl
125
PPM ndash parts per million Crabs tissues and clams average
58
HC-Fidalgo Bay
Table D9 Fidalgo Bay lead intake rate based on the Suquamish Tribe Adult seafood consumption rate Anacortes Washington
Overall FishShellfish Consumption Rate gday
Category Percent of Consumption
Rate Represented by
Category
Site-related Consumption Rate gday
7668 Salmon 239 0 7668 Pelagic Fish 73 0 7668 Bottom Fish 38 2914 7668 Shellfish 65 49842
Crabs tissues and clams average
Table D10 Blood lead values determined using the Adult lead model for lead in seafood from Fidalgo Bay Anacortes Washington
Seafood Average
Concentration (ppm)
Motherrsquos blood lead concentration in ugdl
95th percentile fetal blood lead in ugdl
Shellfish 121 mother 304
fetus 927
Bottom fish 129
mother 33
fetus 100
Average motherrsquos blood lead concentration in ugdl
169
Average 95th percentile fetal blood lead in ugdl
514
PPM ndash parts per million Crabs tissues and clams average
59
HC-Fidalgo Bay
Appendix E
Meal Limit Calculations for contaminants of concern (non-carcinogenic health effects)
Meal limits were calculated for clams crabs and bottom fish based on contaminants of concern in each species Additionally meal limits were calculated based on developmental and immunologic endpoints for dioxin and mercury Meal limits were calculated using the equation below in conjunction with the MRL or RfD as the target risk value and the exposure parameters provided in the Table E1 below The developmental and immunologic endpoints are based on the additive effects of dioxin and mercury as recommended in the ATSDR interaction profile for toxic contaminants found in fish Tables E2 E3 and E4 provides meal limits that would be protective of women and children who eat clams crabs and bottomfish from Fidalgo Bay based on contaminants of concern in each species
ML = [(RfD or MRL)BW DM]C MS ML = recommended fish meal limit per month (mealmonth) RfD = reference dose (EPA) MRL = minimal risk level (ATSDR)
Many factors must be considered when one is recommending limits on the consumption of fish including the health benefits of eating fish the quality and comprehensiveness of environmental data and the availability of alternate sources of nutrition In addition these limits do not consider that multiple species are consumed a consideration that would require weighting of the percent of each species consumed These allowable ingestion rates also do not consider the fact that cooking reduces exposure to some contaminants in fish Therefore allowable consumption limits for prepared fish would be greater than those shown in tables E2 E3 and E4
Table E1 Exposure parameters used to calculate recommended meal limits for clams crabs and bottom fish from Fidalgo Bay in Anacortes Washington
Exposure Parameter RfD Endpoint Units MRL Developmental
RfDMRL Immunological RfDMRL
Average Concentration (C) variable ugkg Arsenic 03
ugkgday Cadmium 1 Chromium 3 Dioxin 0000001 0000001 000002 Mercury 01 01 03 Days per month (DM) 304 304 304 daysmonth Mean Body Weight (BW) 60 60 60 kg Meal size (MS) 0227 0227 0227 kg
60
HC-Fidalgo Bay
Table E2 Calculated meal limits per month for clams from Fidalgo Bay in Anacortes Washington
Contamination Concentration (ppm)
Meals based on RfD MRL
Lowest meals per month (rounded to single digit)
Arsenic 0027 893 13Chromium 184 131
Dioxin 799E-8 1006
Table E3 Calculated meal limits per month for Crabs from Fidalgo Bay in Anacortes Washington
Contamination Concentration (ppm)
Meals based on RfD MRL
Meals based on Developmental additive endpoint
Meals based on Immune additive endpoint
Lowest meals per month (rounded to single digit)
Arsenic 0071 339 14Cadmium 048 167
Dioxin 975E-8 824 137 478 Mercury 0049 164
Table E4 Calculated meal limits per month for Bottom Fish from Fidalgo Bay in Anacortes Washington
Contamination Concentration (ppm)
Meals based on RfD MRL
Meals based on Developmental additive endpoint
Meals based on Immune additive endpoint
Lowest meals per month (rounded to single digit)
Arsenic 015 161 14Dioxin 134E-7 600 145 548
Mercury 0042 191
Applying the Table E2 E3 and E4 meal limits across the general population assumes that meal size will decrease or increase proportionately with body weight Such an assumption could result in underestimating exposure for consumers who eat proportionately more fish per unit of body weight Table E5 demonstrates how an eight-ounce meal for a 70-kilogram adult would change to remain proportional with body weight
61
HC-Fidalgo Bay
Table E5 Adjustment of fish meal size based on the body weight of the consumer
Body Weight Meal Size Pounds Kilograms Ounces Grams
19 9 1 28 39 18 2 57 58 26 3 85 77 35 4 113 96 44 5 142 116 53 6 170 135 61 7 199 154 70 8 227 173 79 9 255 193 88 10 284 212 96 11 312 231 105 12 340 250 113 13 369 270 123 14 397 289 131 15 425 308 140 16 454
62
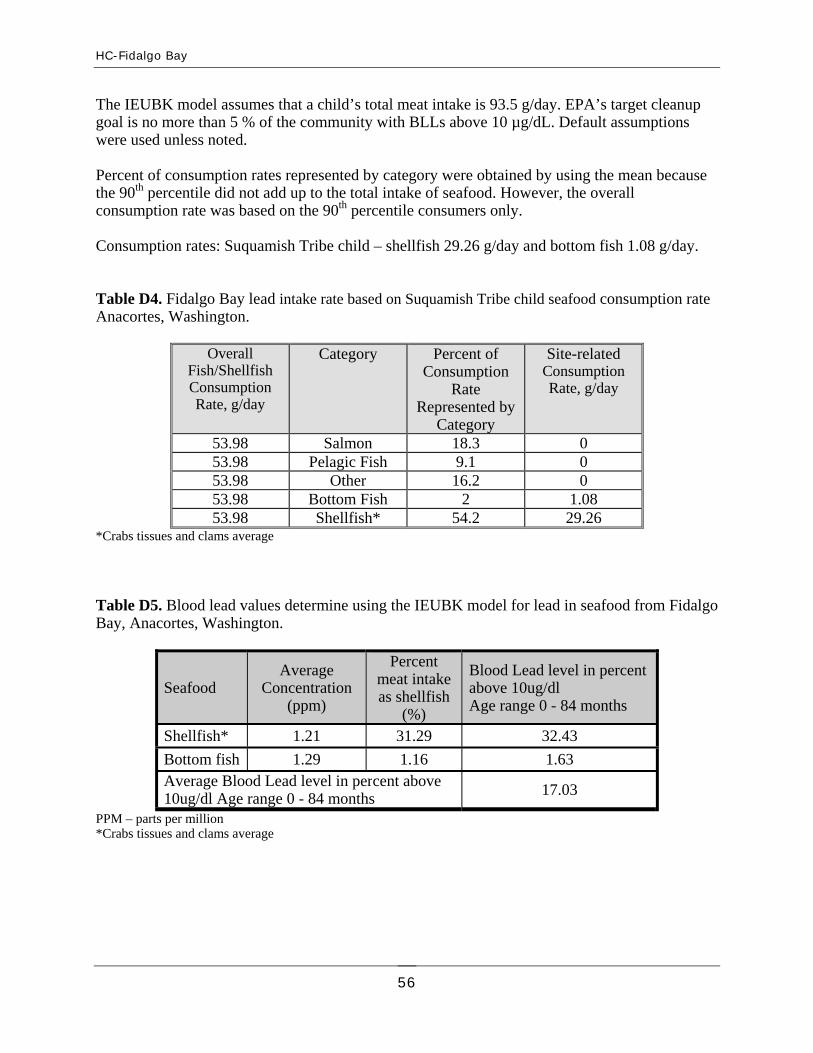
HC-Fidalgo Bay
The IEUBK model assumes that a childrsquos total meat intake is 935 gday EPArsquos target cleanup goal is no more than 5 of the community with BLLs above 10 microgdL Default assumptions were used unless noted
Percent of consumption rates represented by category were obtained by using the mean because the 90th percentile did not add up to the total intake of seafood However the overall consumption rate was based on the 90th percentile consumers only
Consumption rates Suquamish Tribe child ndash shellfish 2926 gday and bottom fish 108 gday
Table D4 Fidalgo Bay lead intake rate based on Suquamish Tribe child seafood consumption rate Anacortes Washington
Overall FishShellfish Consumption Rate gday
Category Percent of Consumption
Rate Represented by
Category
Site-related Consumption Rate gday
5398 Salmon 183 0 5398 Pelagic Fish 91 0 5398 Other 162 0 5398 Bottom Fish 2 108 5398 Shellfish 542 2926
Crabs tissues and clams average
Table D5 Blood lead values determine using the IEUBK model for lead in seafood from Fidalgo Bay Anacortes Washington
Seafood Average
Concentration (ppm)
Percent meat intake as shellfish
()
Blood Lead level in percent above 10ugdl Age range 0 - 84 months
Shellfish 121 3129 3243
Bottom fish 129 116 163 Average Blood Lead level in percent above 10ugdl Age range 0 - 84 months
1703
PPM ndash parts per million Crabs tissues and clams average
56
HC-Fidalgo Bay
Lead exposure shellfish ingestion scenario used in the Adult lead model
This section provides inputs for the Adult lead model EPArsquos target cleanup goal is no more than 5 of the community with BLLs above 10 microgdL Default assumptions were used unless noted
Table D6 Blood lead values determined using the Adult lead model for lead in seafood from Fidalgo Bay Anacortes Washington
Seafood Average
Concentration (ppm)
Motherrsquos blood lead concentration in ugdl
95th percentile fetal blood lead in ugdl
Shellfish 121 mother 19
fetus 48
Bottom fish 129
mother 15
fetus 46
Average motherrsquos blood lead concentration in ugdl
19
Average 95th percentile fetal blood lead in ugdl
47
PPM ndash parts per million Crabs tissues and clams average
57
HC-Fidalgo Bay
Table D7 Fidalgo Bay lead intake rate based on Tulalip Tribe adult seafood consumption rate Anacortes Washington
Overall FishShellfish Consumption Rate gday
Category Percent of Consumption
Rate Represented by
Category
Site-related Consumption Rate gday
194 Salmon 497 0 194 Pelagic Fish 42 0 194 Bottom Fish 39 757 194 Shellfish 422 8187
Crabs tissues and clams average
Table D8 Blood lead values determined using the Adult lead model for lead in seafood from Fidalgo Bay Anacortes Washington
Seafood Average
Concentration (ppm)
Motherrsquos blood lead concentration in ugdl
95th percentile fetal blood lead in ugdl
Shellfish 121 mother 62
fetus 190
Bottom fish
129 mother 19
fetus 59
Average motherrsquos blood lead concentration in ugdl
41
Average 95th percentile fetal blood lead in ugdl
125
PPM ndash parts per million Crabs tissues and clams average
58
HC-Fidalgo Bay
Table D9 Fidalgo Bay lead intake rate based on the Suquamish Tribe Adult seafood consumption rate Anacortes Washington
Overall FishShellfish Consumption Rate gday
Category Percent of Consumption
Rate Represented by
Category
Site-related Consumption Rate gday
7668 Salmon 239 0 7668 Pelagic Fish 73 0 7668 Bottom Fish 38 2914 7668 Shellfish 65 49842
Crabs tissues and clams average
Table D10 Blood lead values determined using the Adult lead model for lead in seafood from Fidalgo Bay Anacortes Washington
Seafood Average
Concentration (ppm)
Motherrsquos blood lead concentration in ugdl
95th percentile fetal blood lead in ugdl
Shellfish 121 mother 304
fetus 927
Bottom fish 129
mother 33
fetus 100
Average motherrsquos blood lead concentration in ugdl
169
Average 95th percentile fetal blood lead in ugdl
514
PPM ndash parts per million Crabs tissues and clams average
59
HC-Fidalgo Bay
Appendix E
Meal Limit Calculations for contaminants of concern (non-carcinogenic health effects)
Meal limits were calculated for clams crabs and bottom fish based on contaminants of concern in each species Additionally meal limits were calculated based on developmental and immunologic endpoints for dioxin and mercury Meal limits were calculated using the equation below in conjunction with the MRL or RfD as the target risk value and the exposure parameters provided in the Table E1 below The developmental and immunologic endpoints are based on the additive effects of dioxin and mercury as recommended in the ATSDR interaction profile for toxic contaminants found in fish Tables E2 E3 and E4 provides meal limits that would be protective of women and children who eat clams crabs and bottomfish from Fidalgo Bay based on contaminants of concern in each species
ML = [(RfD or MRL)BW DM]C MS ML = recommended fish meal limit per month (mealmonth) RfD = reference dose (EPA) MRL = minimal risk level (ATSDR)
Many factors must be considered when one is recommending limits on the consumption of fish including the health benefits of eating fish the quality and comprehensiveness of environmental data and the availability of alternate sources of nutrition In addition these limits do not consider that multiple species are consumed a consideration that would require weighting of the percent of each species consumed These allowable ingestion rates also do not consider the fact that cooking reduces exposure to some contaminants in fish Therefore allowable consumption limits for prepared fish would be greater than those shown in tables E2 E3 and E4
Table E1 Exposure parameters used to calculate recommended meal limits for clams crabs and bottom fish from Fidalgo Bay in Anacortes Washington
Exposure Parameter RfD Endpoint Units MRL Developmental
RfDMRL Immunological RfDMRL
Average Concentration (C) variable ugkg Arsenic 03
ugkgday Cadmium 1 Chromium 3 Dioxin 0000001 0000001 000002 Mercury 01 01 03 Days per month (DM) 304 304 304 daysmonth Mean Body Weight (BW) 60 60 60 kg Meal size (MS) 0227 0227 0227 kg
60
HC-Fidalgo Bay
Table E2 Calculated meal limits per month for clams from Fidalgo Bay in Anacortes Washington
Contamination Concentration (ppm)
Meals based on RfD MRL
Lowest meals per month (rounded to single digit)
Arsenic 0027 893 13Chromium 184 131
Dioxin 799E-8 1006
Table E3 Calculated meal limits per month for Crabs from Fidalgo Bay in Anacortes Washington
Contamination Concentration (ppm)
Meals based on RfD MRL
Meals based on Developmental additive endpoint
Meals based on Immune additive endpoint
Lowest meals per month (rounded to single digit)
Arsenic 0071 339 14Cadmium 048 167
Dioxin 975E-8 824 137 478 Mercury 0049 164
Table E4 Calculated meal limits per month for Bottom Fish from Fidalgo Bay in Anacortes Washington
Contamination Concentration (ppm)
Meals based on RfD MRL
Meals based on Developmental additive endpoint
Meals based on Immune additive endpoint
Lowest meals per month (rounded to single digit)
Arsenic 015 161 14Dioxin 134E-7 600 145 548
Mercury 0042 191
Applying the Table E2 E3 and E4 meal limits across the general population assumes that meal size will decrease or increase proportionately with body weight Such an assumption could result in underestimating exposure for consumers who eat proportionately more fish per unit of body weight Table E5 demonstrates how an eight-ounce meal for a 70-kilogram adult would change to remain proportional with body weight
61
HC-Fidalgo Bay
Table E5 Adjustment of fish meal size based on the body weight of the consumer
Body Weight Meal Size Pounds Kilograms Ounces Grams
19 9 1 28 39 18 2 57 58 26 3 85 77 35 4 113 96 44 5 142 116 53 6 170 135 61 7 199 154 70 8 227 173 79 9 255 193 88 10 284 212 96 11 312 231 105 12 340 250 113 13 369 270 123 14 397 289 131 15 425 308 140 16 454
62
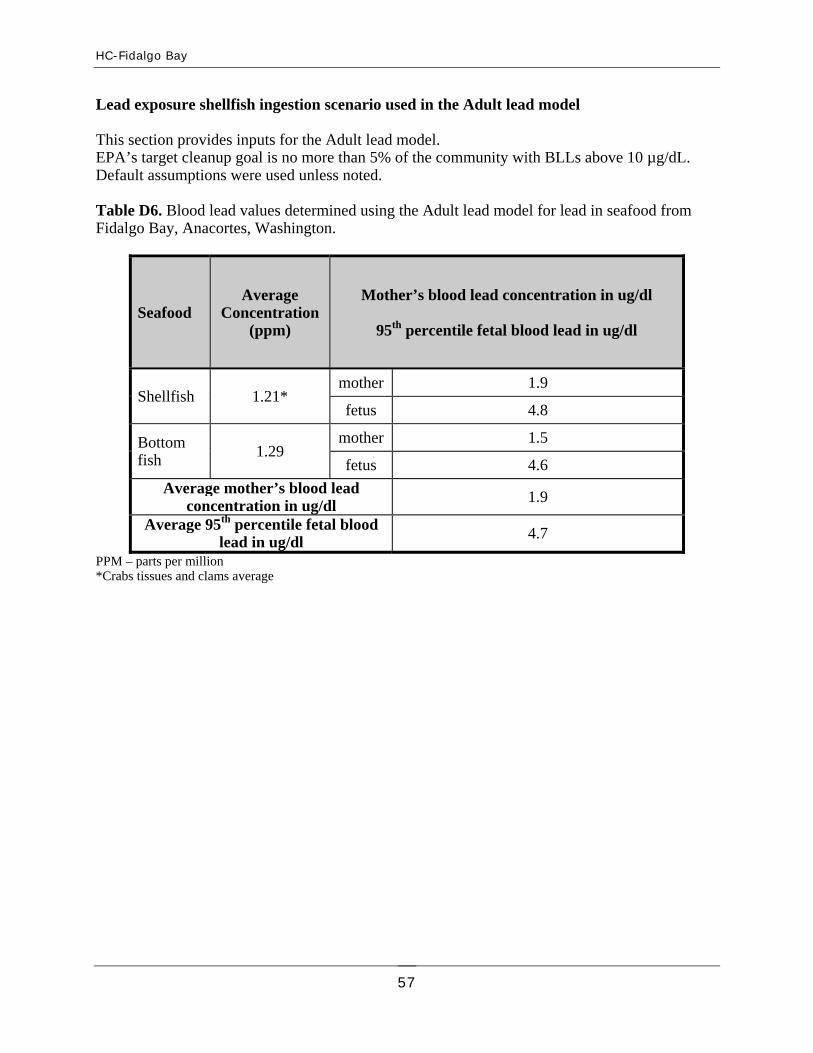
HC-Fidalgo Bay
Lead exposure shellfish ingestion scenario used in the Adult lead model
This section provides inputs for the Adult lead model EPArsquos target cleanup goal is no more than 5 of the community with BLLs above 10 microgdL Default assumptions were used unless noted
Table D6 Blood lead values determined using the Adult lead model for lead in seafood from Fidalgo Bay Anacortes Washington
Seafood Average
Concentration (ppm)
Motherrsquos blood lead concentration in ugdl
95th percentile fetal blood lead in ugdl
Shellfish 121 mother 19
fetus 48
Bottom fish 129
mother 15
fetus 46
Average motherrsquos blood lead concentration in ugdl
19
Average 95th percentile fetal blood lead in ugdl
47
PPM ndash parts per million Crabs tissues and clams average
57
HC-Fidalgo Bay
Table D7 Fidalgo Bay lead intake rate based on Tulalip Tribe adult seafood consumption rate Anacortes Washington
Overall FishShellfish Consumption Rate gday
Category Percent of Consumption
Rate Represented by
Category
Site-related Consumption Rate gday
194 Salmon 497 0 194 Pelagic Fish 42 0 194 Bottom Fish 39 757 194 Shellfish 422 8187
Crabs tissues and clams average
Table D8 Blood lead values determined using the Adult lead model for lead in seafood from Fidalgo Bay Anacortes Washington
Seafood Average
Concentration (ppm)
Motherrsquos blood lead concentration in ugdl
95th percentile fetal blood lead in ugdl
Shellfish 121 mother 62
fetus 190
Bottom fish
129 mother 19
fetus 59
Average motherrsquos blood lead concentration in ugdl
41
Average 95th percentile fetal blood lead in ugdl
125
PPM ndash parts per million Crabs tissues and clams average
58
HC-Fidalgo Bay
Table D9 Fidalgo Bay lead intake rate based on the Suquamish Tribe Adult seafood consumption rate Anacortes Washington
Overall FishShellfish Consumption Rate gday
Category Percent of Consumption
Rate Represented by
Category
Site-related Consumption Rate gday
7668 Salmon 239 0 7668 Pelagic Fish 73 0 7668 Bottom Fish 38 2914 7668 Shellfish 65 49842
Crabs tissues and clams average
Table D10 Blood lead values determined using the Adult lead model for lead in seafood from Fidalgo Bay Anacortes Washington
Seafood Average
Concentration (ppm)
Motherrsquos blood lead concentration in ugdl
95th percentile fetal blood lead in ugdl
Shellfish 121 mother 304
fetus 927
Bottom fish 129
mother 33
fetus 100
Average motherrsquos blood lead concentration in ugdl
169
Average 95th percentile fetal blood lead in ugdl
514
PPM ndash parts per million Crabs tissues and clams average
59
HC-Fidalgo Bay
Appendix E
Meal Limit Calculations for contaminants of concern (non-carcinogenic health effects)
Meal limits were calculated for clams crabs and bottom fish based on contaminants of concern in each species Additionally meal limits were calculated based on developmental and immunologic endpoints for dioxin and mercury Meal limits were calculated using the equation below in conjunction with the MRL or RfD as the target risk value and the exposure parameters provided in the Table E1 below The developmental and immunologic endpoints are based on the additive effects of dioxin and mercury as recommended in the ATSDR interaction profile for toxic contaminants found in fish Tables E2 E3 and E4 provides meal limits that would be protective of women and children who eat clams crabs and bottomfish from Fidalgo Bay based on contaminants of concern in each species
ML = [(RfD or MRL)BW DM]C MS ML = recommended fish meal limit per month (mealmonth) RfD = reference dose (EPA) MRL = minimal risk level (ATSDR)
Many factors must be considered when one is recommending limits on the consumption of fish including the health benefits of eating fish the quality and comprehensiveness of environmental data and the availability of alternate sources of nutrition In addition these limits do not consider that multiple species are consumed a consideration that would require weighting of the percent of each species consumed These allowable ingestion rates also do not consider the fact that cooking reduces exposure to some contaminants in fish Therefore allowable consumption limits for prepared fish would be greater than those shown in tables E2 E3 and E4
Table E1 Exposure parameters used to calculate recommended meal limits for clams crabs and bottom fish from Fidalgo Bay in Anacortes Washington
Exposure Parameter RfD Endpoint Units MRL Developmental
RfDMRL Immunological RfDMRL
Average Concentration (C) variable ugkg Arsenic 03
ugkgday Cadmium 1 Chromium 3 Dioxin 0000001 0000001 000002 Mercury 01 01 03 Days per month (DM) 304 304 304 daysmonth Mean Body Weight (BW) 60 60 60 kg Meal size (MS) 0227 0227 0227 kg
60
HC-Fidalgo Bay
Table E2 Calculated meal limits per month for clams from Fidalgo Bay in Anacortes Washington
Contamination Concentration (ppm)
Meals based on RfD MRL
Lowest meals per month (rounded to single digit)
Arsenic 0027 893 13Chromium 184 131
Dioxin 799E-8 1006
Table E3 Calculated meal limits per month for Crabs from Fidalgo Bay in Anacortes Washington
Contamination Concentration (ppm)
Meals based on RfD MRL
Meals based on Developmental additive endpoint
Meals based on Immune additive endpoint
Lowest meals per month (rounded to single digit)
Arsenic 0071 339 14Cadmium 048 167
Dioxin 975E-8 824 137 478 Mercury 0049 164
Table E4 Calculated meal limits per month for Bottom Fish from Fidalgo Bay in Anacortes Washington
Contamination Concentration (ppm)
Meals based on RfD MRL
Meals based on Developmental additive endpoint
Meals based on Immune additive endpoint
Lowest meals per month (rounded to single digit)
Arsenic 015 161 14Dioxin 134E-7 600 145 548
Mercury 0042 191
Applying the Table E2 E3 and E4 meal limits across the general population assumes that meal size will decrease or increase proportionately with body weight Such an assumption could result in underestimating exposure for consumers who eat proportionately more fish per unit of body weight Table E5 demonstrates how an eight-ounce meal for a 70-kilogram adult would change to remain proportional with body weight
61
HC-Fidalgo Bay
Table E5 Adjustment of fish meal size based on the body weight of the consumer
Body Weight Meal Size Pounds Kilograms Ounces Grams
19 9 1 28 39 18 2 57 58 26 3 85 77 35 4 113 96 44 5 142 116 53 6 170 135 61 7 199 154 70 8 227 173 79 9 255 193 88 10 284 212 96 11 312 231 105 12 340 250 113 13 369 270 123 14 397 289 131 15 425 308 140 16 454
62
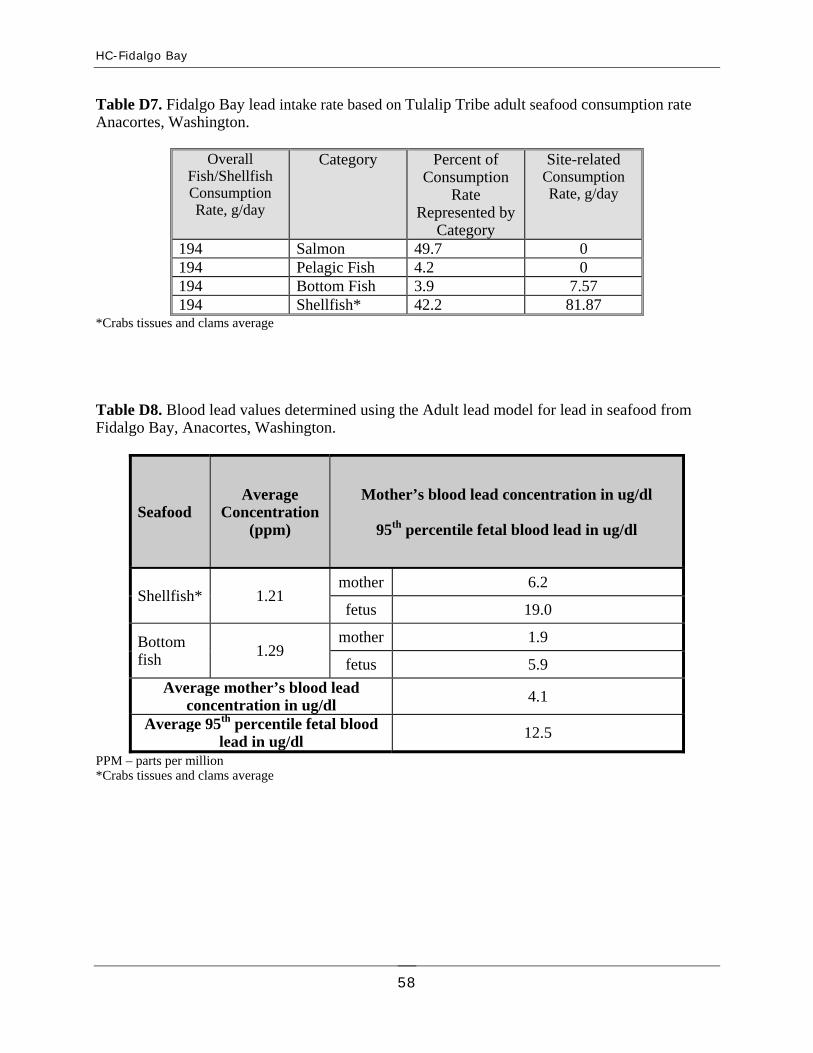
HC-Fidalgo Bay
Table D7 Fidalgo Bay lead intake rate based on Tulalip Tribe adult seafood consumption rate Anacortes Washington
Overall FishShellfish Consumption Rate gday
Category Percent of Consumption
Rate Represented by
Category
Site-related Consumption Rate gday
194 Salmon 497 0 194 Pelagic Fish 42 0 194 Bottom Fish 39 757 194 Shellfish 422 8187
Crabs tissues and clams average
Table D8 Blood lead values determined using the Adult lead model for lead in seafood from Fidalgo Bay Anacortes Washington
Seafood Average
Concentration (ppm)
Motherrsquos blood lead concentration in ugdl
95th percentile fetal blood lead in ugdl
Shellfish 121 mother 62
fetus 190
Bottom fish
129 mother 19
fetus 59
Average motherrsquos blood lead concentration in ugdl
41
Average 95th percentile fetal blood lead in ugdl
125
PPM ndash parts per million Crabs tissues and clams average
58
HC-Fidalgo Bay
Table D9 Fidalgo Bay lead intake rate based on the Suquamish Tribe Adult seafood consumption rate Anacortes Washington
Overall FishShellfish Consumption Rate gday
Category Percent of Consumption
Rate Represented by
Category
Site-related Consumption Rate gday
7668 Salmon 239 0 7668 Pelagic Fish 73 0 7668 Bottom Fish 38 2914 7668 Shellfish 65 49842
Crabs tissues and clams average
Table D10 Blood lead values determined using the Adult lead model for lead in seafood from Fidalgo Bay Anacortes Washington
Seafood Average
Concentration (ppm)
Motherrsquos blood lead concentration in ugdl
95th percentile fetal blood lead in ugdl
Shellfish 121 mother 304
fetus 927
Bottom fish 129
mother 33
fetus 100
Average motherrsquos blood lead concentration in ugdl
169
Average 95th percentile fetal blood lead in ugdl
514
PPM ndash parts per million Crabs tissues and clams average
59
HC-Fidalgo Bay
Appendix E
Meal Limit Calculations for contaminants of concern (non-carcinogenic health effects)
Meal limits were calculated for clams crabs and bottom fish based on contaminants of concern in each species Additionally meal limits were calculated based on developmental and immunologic endpoints for dioxin and mercury Meal limits were calculated using the equation below in conjunction with the MRL or RfD as the target risk value and the exposure parameters provided in the Table E1 below The developmental and immunologic endpoints are based on the additive effects of dioxin and mercury as recommended in the ATSDR interaction profile for toxic contaminants found in fish Tables E2 E3 and E4 provides meal limits that would be protective of women and children who eat clams crabs and bottomfish from Fidalgo Bay based on contaminants of concern in each species
ML = [(RfD or MRL)BW DM]C MS ML = recommended fish meal limit per month (mealmonth) RfD = reference dose (EPA) MRL = minimal risk level (ATSDR)
Many factors must be considered when one is recommending limits on the consumption of fish including the health benefits of eating fish the quality and comprehensiveness of environmental data and the availability of alternate sources of nutrition In addition these limits do not consider that multiple species are consumed a consideration that would require weighting of the percent of each species consumed These allowable ingestion rates also do not consider the fact that cooking reduces exposure to some contaminants in fish Therefore allowable consumption limits for prepared fish would be greater than those shown in tables E2 E3 and E4
Table E1 Exposure parameters used to calculate recommended meal limits for clams crabs and bottom fish from Fidalgo Bay in Anacortes Washington
Exposure Parameter RfD Endpoint Units MRL Developmental
RfDMRL Immunological RfDMRL
Average Concentration (C) variable ugkg Arsenic 03
ugkgday Cadmium 1 Chromium 3 Dioxin 0000001 0000001 000002 Mercury 01 01 03 Days per month (DM) 304 304 304 daysmonth Mean Body Weight (BW) 60 60 60 kg Meal size (MS) 0227 0227 0227 kg
60
HC-Fidalgo Bay
Table E2 Calculated meal limits per month for clams from Fidalgo Bay in Anacortes Washington
Contamination Concentration (ppm)
Meals based on RfD MRL
Lowest meals per month (rounded to single digit)
Arsenic 0027 893 13Chromium 184 131
Dioxin 799E-8 1006
Table E3 Calculated meal limits per month for Crabs from Fidalgo Bay in Anacortes Washington
Contamination Concentration (ppm)
Meals based on RfD MRL
Meals based on Developmental additive endpoint
Meals based on Immune additive endpoint
Lowest meals per month (rounded to single digit)
Arsenic 0071 339 14Cadmium 048 167
Dioxin 975E-8 824 137 478 Mercury 0049 164
Table E4 Calculated meal limits per month for Bottom Fish from Fidalgo Bay in Anacortes Washington
Contamination Concentration (ppm)
Meals based on RfD MRL
Meals based on Developmental additive endpoint
Meals based on Immune additive endpoint
Lowest meals per month (rounded to single digit)
Arsenic 015 161 14Dioxin 134E-7 600 145 548
Mercury 0042 191
Applying the Table E2 E3 and E4 meal limits across the general population assumes that meal size will decrease or increase proportionately with body weight Such an assumption could result in underestimating exposure for consumers who eat proportionately more fish per unit of body weight Table E5 demonstrates how an eight-ounce meal for a 70-kilogram adult would change to remain proportional with body weight
61
HC-Fidalgo Bay
Table E5 Adjustment of fish meal size based on the body weight of the consumer
Body Weight Meal Size Pounds Kilograms Ounces Grams
19 9 1 28 39 18 2 57 58 26 3 85 77 35 4 113 96 44 5 142 116 53 6 170 135 61 7 199 154 70 8 227 173 79 9 255 193 88 10 284 212 96 11 312 231 105 12 340 250 113 13 369 270 123 14 397 289 131 15 425 308 140 16 454
62
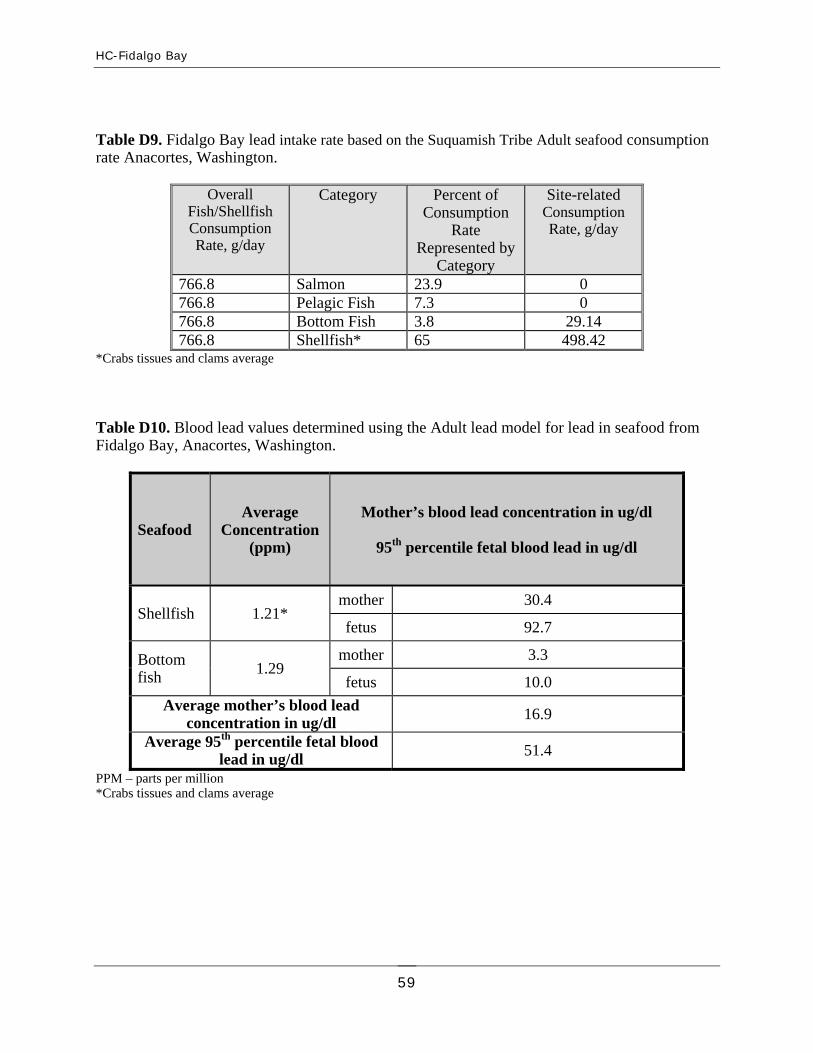
HC-Fidalgo Bay
Table E5 Adjustment of fish meal size based on the body weight of the consumer
Body Weight Meal Size Pounds Kilograms Ounces Grams
19 9 1 28 39 18 2 57 58 26 3 85 77 35 4 113 96 44 5 142 116 53 6 170 135 61 7 199 154 70 8 227 173 79 9 255 193 88 10 284 212 96 11 312 231 105 12 340 250 113 13 369 270 123 14 397 289 131 15 425 308 140 16 454
62


![Semiótica Geral [António Fidalgo]](https://img.dokumen.tips/doc/110x75/579072d21a28ab6874a88eb0/semiotica-geral-antonio-fidalgo.jpg)