Embed Size (px)
Citation preview
FHCA 2014 Annual Conference & Trade Show
CE Session #48 – Inspiring the CULTURE of How and When We CULTURE Thursday, July 10 – 4:00 to 6:00 p.m.
Canary 4 – Clinical/Care Practice
Upon completion of this presentation, the learner will be able to:
discuss key lessons learned through retrospective and prospective data analysis and comprehensive review of facility systems regarding UTI management;
review strategies to reframe the culture of culturing unnecessarily; and
review selected protocols to facilitate accurate assessment and symptom identification and appropriate specimen collection techniques.
Seminar Description: The CDC reports that 30-50 percent of long term care residents have a positive urine culture without any symptoms of a urinary tract infection (UTI). Many residents are inappropriately placed on antibiotics and overuse can lead to antibiotic resistant infections and related morbidity and mortality. Staff in 11 Florida facilities are working with the state health department to reframe the resident care environment to promote critical thinking, nursing assessment and awareness of key protocols that can influence a decrease in antibiotic use for asymptomatic bacteriuria and urinary tract infections which do not meet the 2012 McGeer criteria. This session will discuss the data findings and strategies recommended. Presenter Bio(s): Deborah Afasano, BSN, RNC, RAC-CT, HCRM, is Vice President of Clinical Services for Avante Group, Inc. Debbie is a certified director of nursing, end-of-life trainer through ELNEC and a licensed health care risk manager. Her diverse nursing background spans 30 plus years in acute and long term care settings. Debbie is the immediate past chair of the FHCA Quality Foundation Senior Clinicians' Council. A.C. Burke, MA is the health care-associated infection prevention program manager for the Florida Department of Health. She has been working in the health care field for over 15 years and has experience in both the private and public sectors. In her role with FDOH, she and her staff have established a multi-disciplinary advisory board, developed partnerships across the continuum of care and produced collaboratives for the prevention of health care-associated infections in both acute and long term care facilities. Marty Casper is Vice President of Operations for Avante Group, Inc. where he is responsible for the operations of their 20 skilled nursing facilities and 4 assisted living facilities in Florida, North Carolina and Virginia. He has over 40 years of progressively responsible experience in administration of health care facilities, including analysis and evaluation of systems and procedures followed by implementation of innovative programs for the betterment of patient care and service. He is a certified nursing home administrator and earned his Master's Degree in Public Health and Hospital Administration from Yale University.

Wendy Davis, RN-BC, RAC-CT is currently the Regional Director of Clinical Services – FL for the Avante Group. She has a diverse background in nursing spanning 20+ years with an extensive history in LTC nursing management. Her current responsibilities entail regional oversight of the clinical management of 11 Skilled Nursing and 2 Assisted Living facilities in the state of Florida. Wendy’s focus has remained on the collaborative team development of quality focused clinical systems and strengthening quality care delivery to the bedside through on site leadership, nurse mentoring and training.
5/27/2014
1
Division of Disease Control and Health Protection
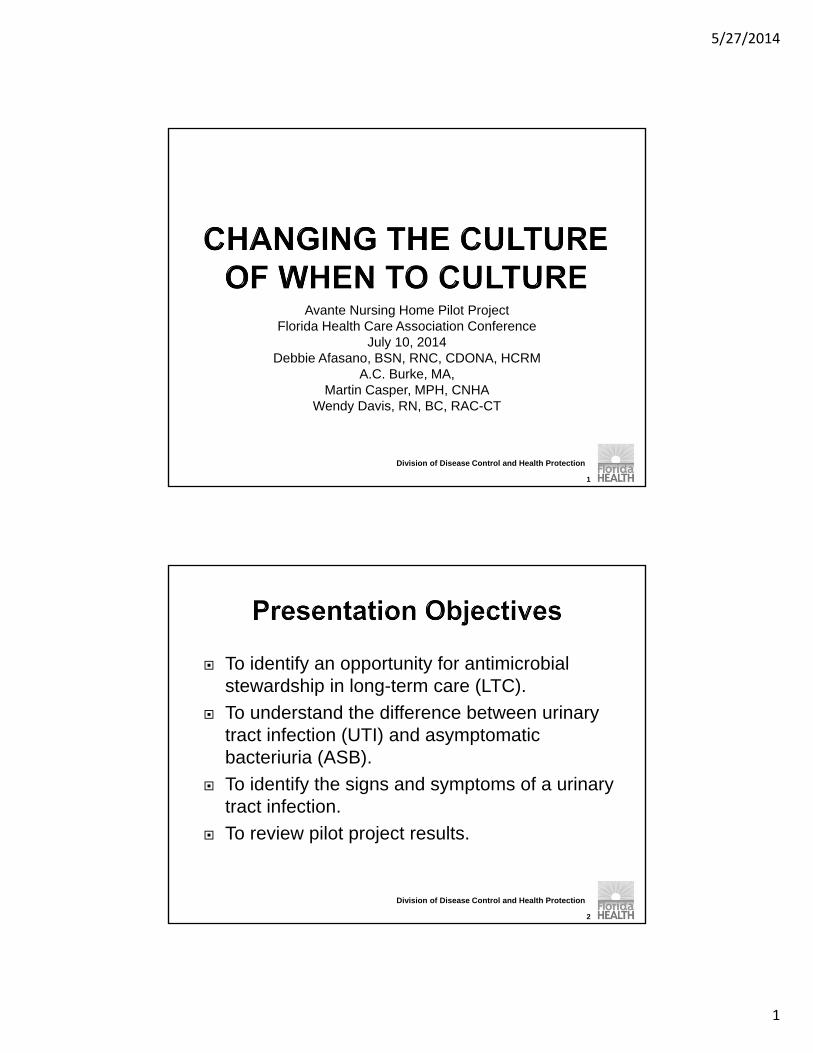
Avante Nursing Home Pilot Project Florida Health Care Association Conference
July 10, 2014Debbie Afasano, BSN, RNC, CDONA, HCRM
A.C. Burke, MA, Martin Casper, MPH, CNHA
Wendy Davis, RN, BC, RAC-CT
1
Division of Disease Control and Health Protection
To identify an opportunity for antimicrobial stewardship in long-term care (LTC).
To understand the difference between urinary tract infection (UTI) and asymptomatic bacteriuria (ASB).
To identify the signs and symptoms of a urinary tract infection.
To review pilot project results.
2
5/27/2014
2
Division of Disease Control and Health Protection
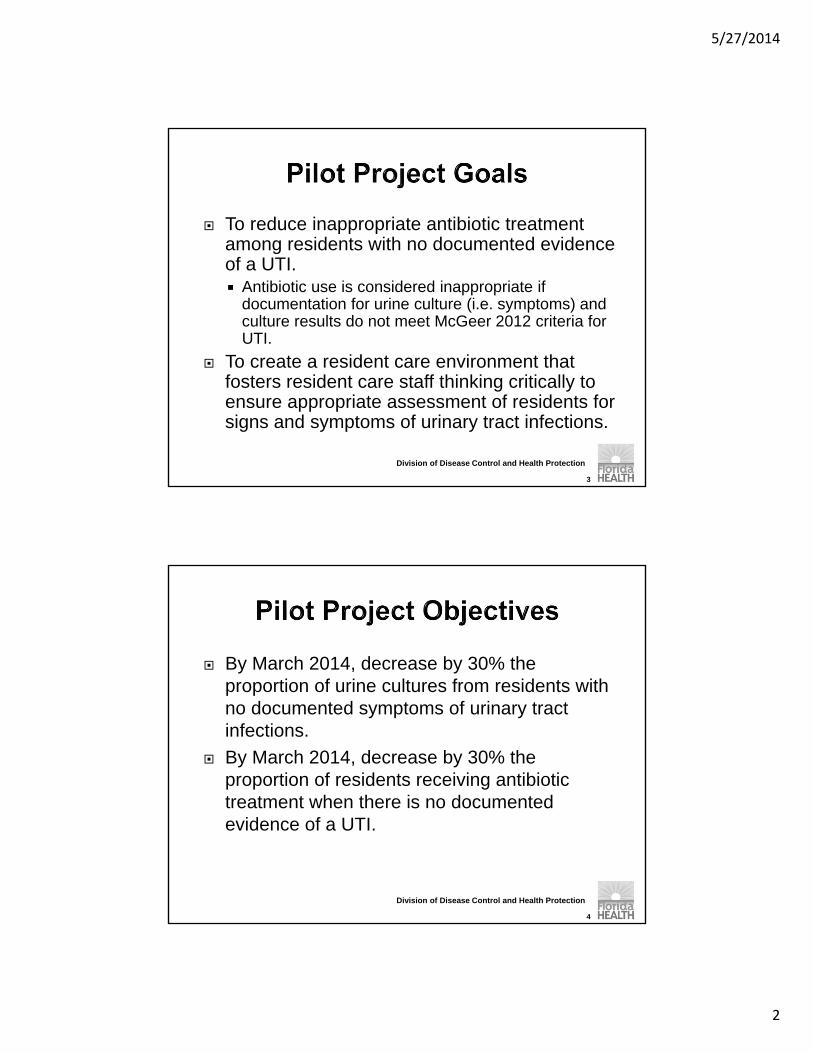
To reduce inappropriate antibiotic treatment among residents with no documented evidence of a UTI. Antibiotic use is considered inappropriate if
documentation for urine culture (i.e. symptoms) and culture results do not meet McGeer 2012 criteria for UTI.
To create a resident care environment that fosters resident care staff thinking critically to ensure appropriate assessment of residents for signs and symptoms of urinary tract infections.
3
Division of Disease Control and Health Protection
By March 2014, decrease by 30% the proportion of urine cultures from residents with no documented symptoms of urinary tract infections.
By March 2014, decrease by 30% the proportion of residents receiving antibiotic treatment when there is no documented evidence of a UTI.
4

5/27/2014
3
Division of Disease Control and Health Protection
Retrospective baseline measurement period January-March 2013
Prospective data collection July 2013-March 2014
Outcome measurement period January-March 2014
Training July 2013
5
Division of Disease Control and Health Protection
Why focus on antibiotic stewardship for asymptomatic bacteriuria and urinary tract infections?
6 6

5/27/2014
4
Division of Disease Control and Health Protection
7
1 Centers for Medicare and Medicaid Services, Long Term Care Minimum Data Set, Resident profile table as of 05/02/2055. Baltimore. MD. 2 Loeb, M et.al. Antibiotic use in Ontario facilities that provide chronic care. J Gen Intern Med 2001; 16: 376-383. 3 Centers for Disease Control and Prevention, National Center for Health statistics, 1999 National Nursing Home Survey. Nursing Home Residents, number, percent distribution, and rate per 10,000, by age at interview, according to sex, race, and region: United States, 1999. 4. Centers for Disease Control and Prevention, National Center for Health statistics, 1999 National Nursing Home Survey. Nursing Home Residents, number, percent distribution, and rate per 10,000, by age at interview, according to sex, race, and region: United States, 1999.
Division of Disease Control and Health Protection
8
67%
16%
1 Centers for Medicare and Medicaid Services, Long Term Care Minimum Data Set, Resident profile table as of 05/02/2055. Baltimore. MD. 2 Loeb, M et.al. Antibiotic use in Ontario facilities that provide chronic care. J Gen Intern Med 2001; 16: 376-383. 3 Centers for Disease Control and Prevention, National Center for Health statistics, 1999 National Nursing Home Survey. Nursing Home Residents, number, percent distribution, and rate per 10,000, by age at interview, according to sex, race, and region: United States, 1999. 4. Centers for Disease Control and Prevention, National Center for Health statistics, 1999 National Nursing Home Survey. Nursing Home Residents, number, percent distribution, and rate per 10,000, by age at interview, according to sex, race, and region: United States, 1999.

5/27/2014
5
Division of Disease Control and Health Protection
UTI is one of the most common infections treated with antibiotics each year in nursing homes.
Estimates of the cost of antibiotics in the long-term care setting range from $38 million to $137 million per year.
9
Division of Disease Control and Health Protection
Inconsistent use of criteria for diagnosing infection and/or initiating antibiotics
Challenges with separating colonization from true infection Colonization does not require treatment!
Antibiotics for prophylaxis
10
5/27/2014
6
Division of Disease Control and Health Protection
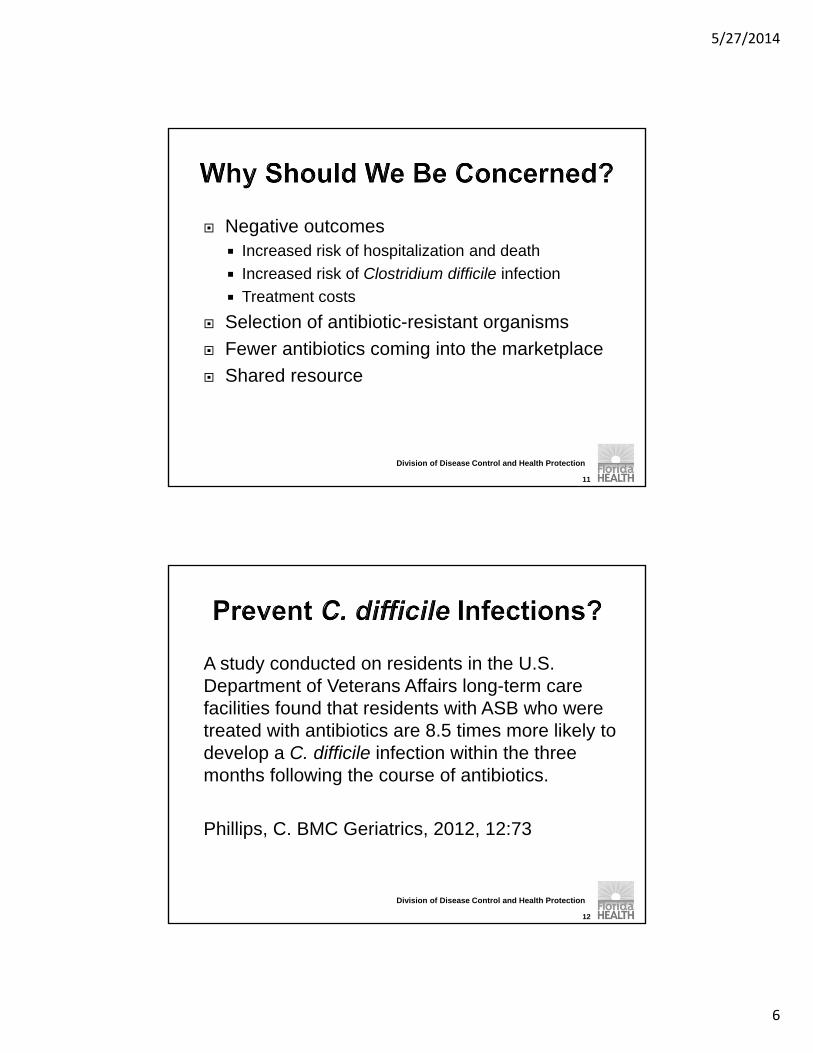
Negative outcomes Increased risk of hospitalization and death
Increased risk of Clostridium difficile infection
Treatment costs
Selection of antibiotic-resistant organisms
Fewer antibiotics coming into the marketplace
Shared resource
11
Division of Disease Control and Health Protection
A study conducted on residents in the U.S. Department of Veterans Affairs long-term care facilities found that residents with ASB who were treated with antibiotics are 8.5 times more likely to develop a C. difficile infection within the three months following the course of antibiotics.
Phillips, C. BMC Geriatrics, 2012, 12:73
12
5/27/2014
7
Division of Disease Control and Health Protection
13
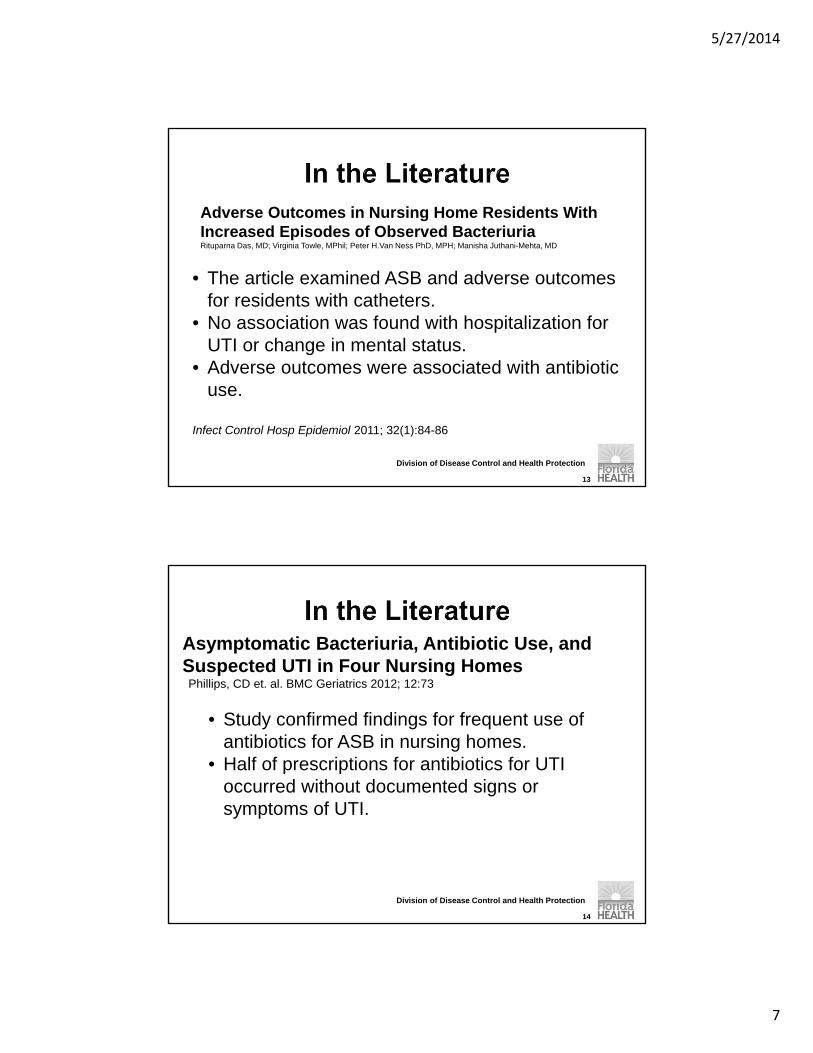
Adverse Outcomes in Nursing Home Residents With Increased Episodes of Observed BacteriuriaRituparna Das, MD; Virginia Towle, MPhil; Peter H.Van Ness PhD, MPH; Manisha Juthani-Mehta, MD
• The article examined ASB and adverse outcomes for residents with catheters.
• No association was found with hospitalization for UTI or change in mental status.
• Adverse outcomes were associated with antibiotic use.
Infect Control Hosp Epidemiol 2011; 32(1):84-86
Division of Disease Control and Health Protection
14
Asymptomatic Bacteriuria, Antibiotic Use, and Suspected UTI in Four Nursing HomesPhillips, CD et. al. BMC Geriatrics 2012; 12:73
• Study confirmed findings for frequent use of antibiotics for ASB in nursing homes.
• Half of prescriptions for antibiotics for UTI occurred without documented signs or symptoms of UTI.

5/27/2014
8
Division of Disease Control and Health Protection
The most common bacterial infection in LTC.
UTI is also the most common cause of bacteremia.
Studies have consistently shown that about 30%-50% of frail, elderly long-term care residents can have a positive urine culture even without any symptoms of a urinary tract infection (bacteriuria).
Asymptomatic bacteriuria is more common than UTI.
15
Division of Disease Control and Health Protection
Presence of bacteria in the urine which may result in a positive urine culture, in the absenceof new signs and symptoms of urinary tract infection
Prevalence
Up to 50% of females in LTC have ASB
Most common patient group to have ASB is elderly, diabetic women
14-40% of males in LTC have ASB
16

5/27/2014
9
Division of Disease Control and Health Protection
ASYMPTOMATIC BACTERIURIA
URINARY TRACT INFECTION
17
NO SYMPTOMS Documented bacteria in
the urine
Do not treat with antibiotics
Exception: pregnancy and urological procedures
SYMPTOMS Documented bacteria in
the urine
Treat with antibiotics
Division of Disease Control and Health Protection
18

5/27/2014
10
Division of Disease Control and Health Protection
Because many residents have chronic bacteriuria, the research-based literature suggests treating only symptomatic UTIs.
Both Society for Healthcare Epidemiology of America (SHEA) and Infectious Disease Society of America (IDSA) reflect this statement in their recommendations.
19
Division of Disease Control and Health Protection
Treatment
20

5/27/2014
11
Division of Disease Control and Health Protection
Surveillance Criteria for LTC Stone, Nimalie, MD et. al., Surveillance Definitions
of Infections in Long-Term Care Facilities: Revisiting the McGeer Criteria, Infection Control and Hospital Epidemiology, Vol. 33, No. 10 (October 2012), pp. 965-977
National Healthcare Safety Network (NHSN) LTC Module
Do not replace clinical decision making
21
Division of Disease Control and Health Protection
At least 1 sign or symptom described below +microbiologic criteria (i.e. positive urine analysis)
Symptoms
Acute dysuria or acute pain, swelling, or tenderness of the testes, epididymis, or prostate
OR…22
5/27/2014
12
Division of Disease Control and Health Protection
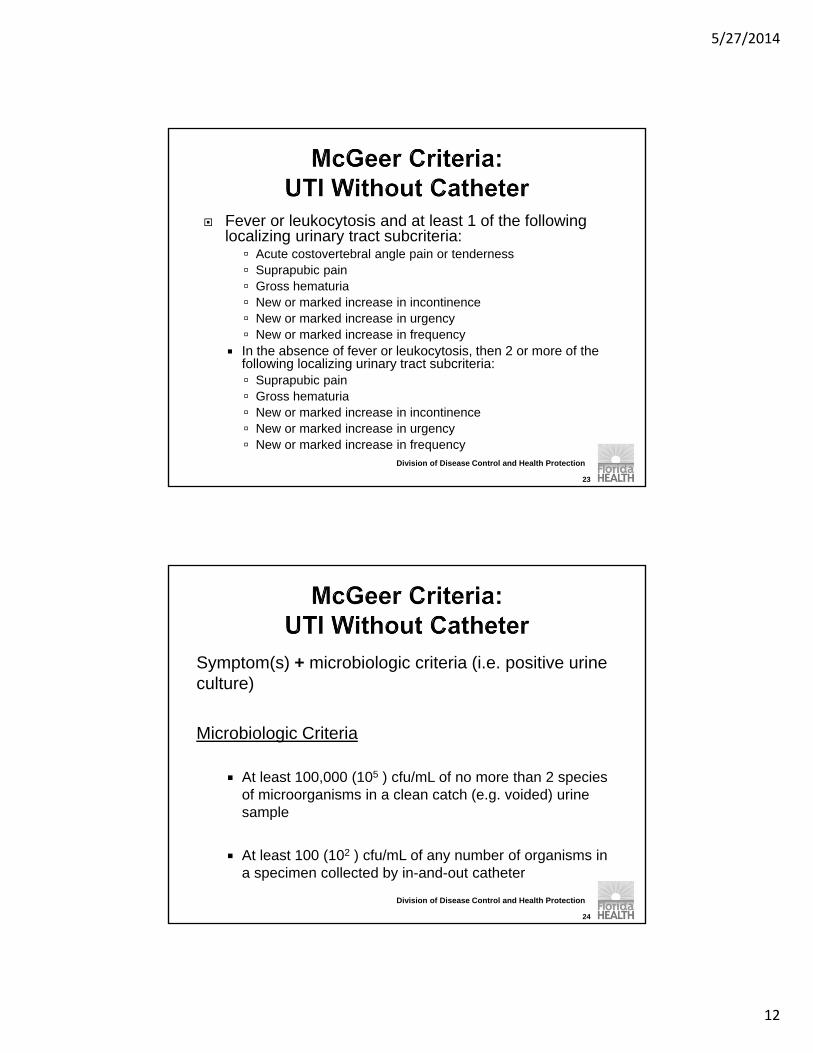
Fever or leukocytosis and at least 1 of the following localizing urinary tract subcriteria: Acute costovertebral angle pain or tenderness Suprapubic pain Gross hematuria New or marked increase in incontinence New or marked increase in urgency New or marked increase in frequency
In the absence of fever or leukocytosis, then 2 or more of the following localizing urinary tract subcriteria: Suprapubic pain Gross hematuria New or marked increase in incontinence New or marked increase in urgency New or marked increase in frequency
23
Division of Disease Control and Health Protection
Symptom(s) + microbiologic criteria (i.e. positive urine culture)
Microbiologic Criteria
At least 100,000 (105 ) cfu/mL of no more than 2 species of microorganisms in a clean catch (e.g. voided) urine sample
At least 100 (102 ) cfu/mL of any number of organisms in a specimen collected by in-and-out catheter
24

5/27/2014
13
Division of Disease Control and Health Protection
At least one sign or symptom described below: Fever, rigors, or new-onset hypotension, with
no alternate site of infection Either acute change in mental status or acute
functional decline, with no alternate diagnosis and leukocytosis
New-onset suprapubic pain or costovertebralangle pain or tenderness
Purulent discharge from around the catheter or acute pain, swelling, or tenderness of the testes, epididymis, or prostate
25
Division of Disease Control and Health Protection
At least 1 sign or symptom previously described +microbiologic criteria (i.e. positive urine culture)
Microbiologic Criteria
At least 100,000 (105) cfu/mL of any number of organisms
26

5/27/2014
14
Division of Disease Control and Health Protection
27
Division of Disease Control and Health Protection
Not on the list of symptoms Urine odor or color
Falls
Caution for mental status UTI less likely without specific symptoms
Non-specific symptoms may be due to a variety of causes: pain, depression, constipation, dehydration, poor sleep, or medication side effects
Must consider range of possible causes
UTI should be at the bottom of the list
28

5/27/2014
15
Division of Disease Control and Health Protection
Decrease antibiotic use for ASB
Properly identify UTI and ASB using national criteria.
Implement appropriate pericare and hydration protocols.
Properly collect and handle urine specimens.
Limit screening and treatment with antimicrobials only to residents with symptomatic UTI.
29
Division of Disease Control and Health Protection
30

5/27/2014
16
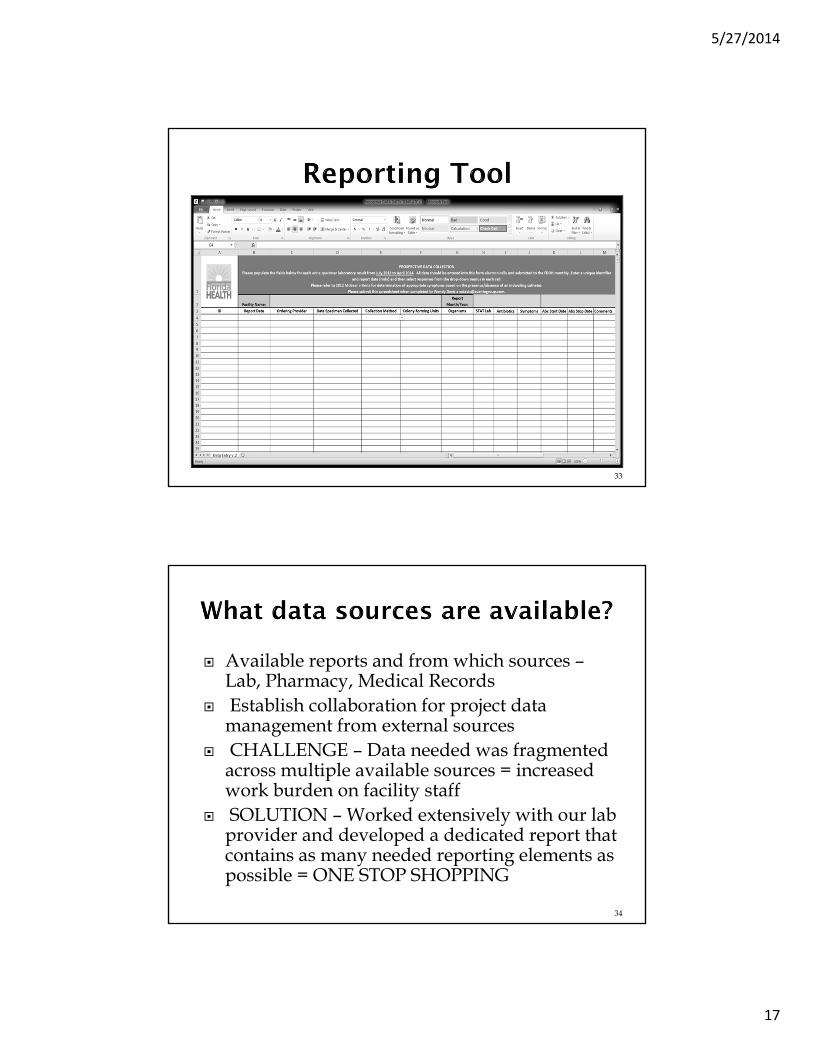
Establish the critical data necessary to facilitate goal evaluation and develop approved reporting tool within the scope of HIPPA compliance.
CHALLENGE – Meaningful data needed shifted and evolved in the 1st quarter.
SOLUTION – Ongoing revisions to the reporting template.
SOLUTION – Consistent use of medical record numbers for HIPPA compliance. Identifier for internal purposes/corrections and planned data validation activities.
31
Added antibiotic start and stop dates-November 2013 Try to identify potential empiric antibiotic use=less
than 3 days
Added comments column Identify alternate reasons for urine culture
Ongoing data challenge: identifying antibiotic use for other infections (i.e. not UTI) and how accounted for in data collection and ensuring consistency in reporting
32
5/27/2014
17
33
Available reports and from which sources –Lab, Pharmacy, Medical Records
Establish collaboration for project data management from external sources
CHALLENGE – Data needed was fragmented across multiple available sources = increased work burden on facility staff
SOLUTION – Worked extensively with our lab provider and developed a dedicated report that contains as many needed reporting elements as possible = ONE STOP SHOPPING
34
5/27/2014
18
Who will be responsible? How much time is it estimated to take on a monthly basis?
CHALLENGE – Maintaining consistent clinical oversight and organized reporting compliance 2-4 hour monthly time burden after learning curve needs
were met
CHALLENGE – Nursing leadership turnover SOLUTIONS –
Monthly follow-up and interaction with regional support via calls and e-mails
Integration of pilot study tasks into DON onboarding
35
Establish time line for facility receipt of devoted lab report.
Establish time line for DOH receipt of approved reporting tool.
Establish feedback mechanisms based on aggregate facility data information via webinars.
CHALLENGE – Receipt of DOH reporting tool on time
SOLUTION – Monthly assistance as needed
36
5/27/2014
19
Data Quality/Data Validation How do we “measure up”? Can the results be validated…..
37
Division of Disease Control and Health Protection
Results reflect data from 100% (11/11) nursing homes.
38

5/27/2014
20
Division of Disease Control and Health Protection
113 13298 103 97 82
104 104 119
2720
27 24 2228
21 2928
9499
6894
61 7062
7879
8 6
2
3
73 2
38
0
50
100
150
200
250
300
Jul-13 Aug-13 Sep-13 Oct-13 Nov-13 Dec-13 Jan-14 Feb-14 Mar-14
Figure 1: Total Number of Urine Cultures by Collection Method, July 2013-March 2014
Clean Catch Foley Catheter Straight Catheter Suprapubic Catheter
39
Number of urine cultures
Division of Disease Control and Health Protection
40
7.057.51
5.856.5
5.46 5.21 5.31
6.63 6.53
0
1
2
3
4
5
6
7
8
Jul-13 Aug-13 Sep-13 Oct-13 Nov-13 Dec-13 Jan-14 Feb-14 Mar-14
Figure 2: Urine Cultures Collected Per 1000 Resident Days, July 2013-March 2014
Urine Culture collection rate
5/27/2014
21
Division of Disease Control and Health Protection
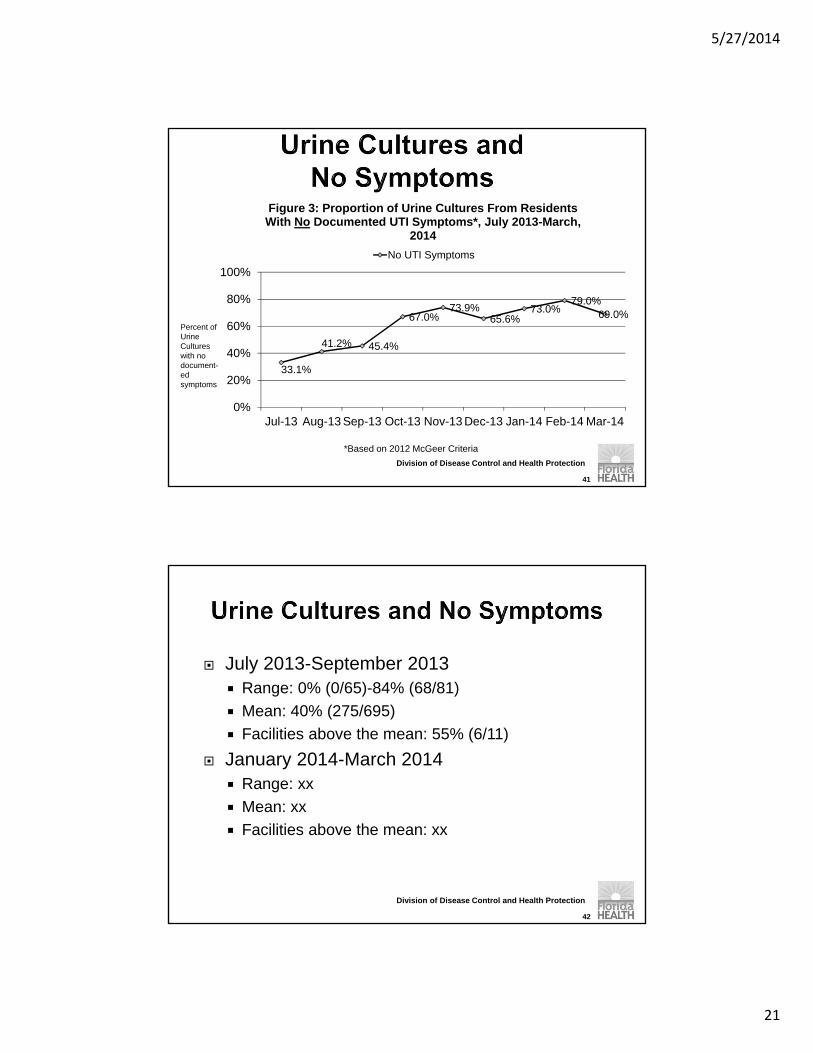
33.1%
41.2% 45.4%
67.0%73.9%
65.6%73.0%
79.0%69.0%
0%
20%
40%
60%
80%
100%
Jul-13 Aug-13 Sep-13 Oct-13 Nov-13 Dec-13 Jan-14 Feb-14 Mar-14
Figure 3: Proportion of Urine Cultures From Residents With No Documented UTI Symptoms*, July 2013-March,
2014
No UTI Symptoms
*Based on 2012 McGeer Criteria
41
Percent of Urine Cultures with no document-edsymptoms
Division of Disease Control and Health Protection
July 2013-September 2013 Range: 0% (0/65)-84% (68/81)
Mean: 40% (275/695)
Facilities above the mean: 55% (6/11)
January 2014-March 2014 Range: xx
Mean: xx
Facilities above the mean: xx
42

5/27/2014
22
Division of Disease Control and Health Protection
69.8%
72.8%
81.6% 82.6% 83.5% 82.5%88.0% 90.0%
86.0%
50%
60%
70%
80%
90%
100%
Figure 4: Proportion of Urine Cultures From Residents With No Documented UTI*, July 2013-March
2014
No UTI
43
*Based on 2012 McGeer Criteria
43
Percent of urine cultures from residents with no document-ed UTI
Division of Disease Control and Health Protection
*Based on 2012 McGeer Criteria
28.4%25.7%
28.1% 26.5%23.6%
18.5% 20.0%24.0% 25.0%
0%5%
10%15%20%25%30%35%40%
Figure 5: Proportion of Urine Cultures With No UTI* and Received Antibiotic Therapy, July 2013– March
2014
44
Percent of inappro-priateantibiotic use
5/27/2014
23
Division of Disease Control and Health Protection
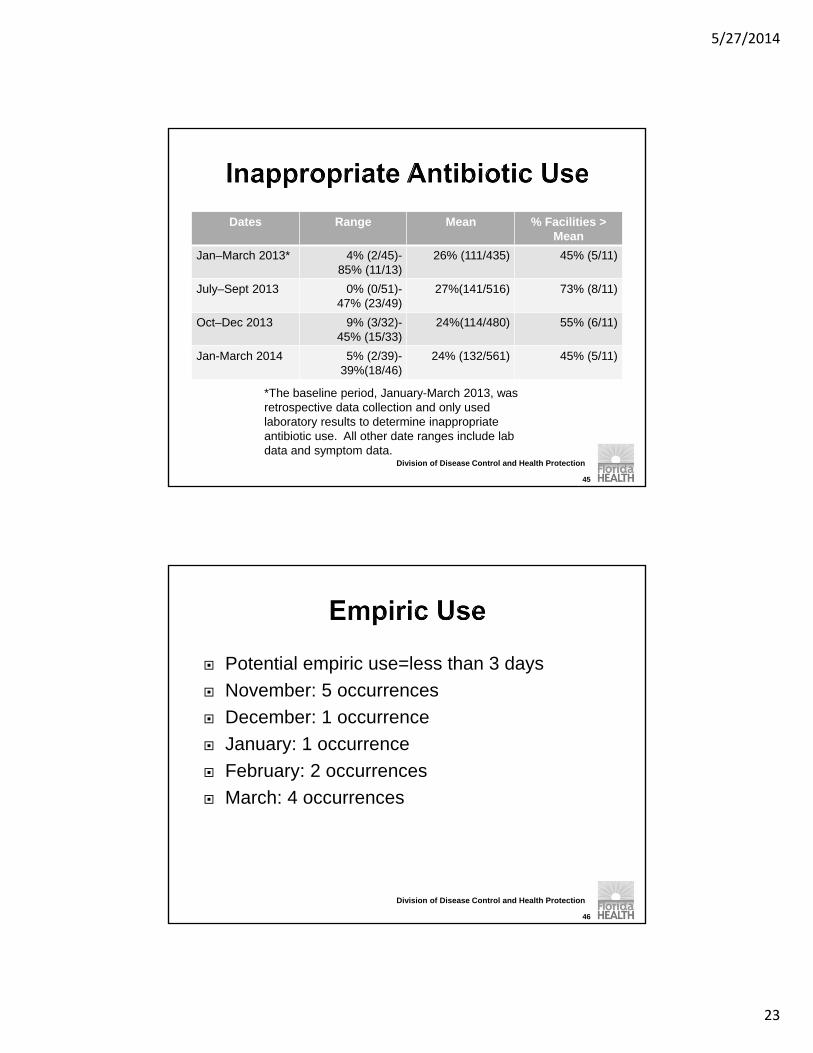
Dates Range Mean % Facilities > Mean
Jan–March 2013* 4% (2/45)-85% (11/13)
26% (111/435) 45% (5/11)
July–Sept 2013 0% (0/51)-47% (23/49)
27%(141/516) 73% (8/11)
Oct–Dec 2013 9% (3/32)-45% (15/33)
24%(114/480) 55% (6/11)
Jan-March 2014 5% (2/39)-39%(18/46)
24% (132/561) 45% (5/11)
45
*The baseline period, January-March 2013, was retrospective data collection and only used laboratory results to determine inappropriate antibiotic use. All other date ranges include lab data and symptom data.
Division of Disease Control and Health Protection
Potential empiric use=less than 3 days
November: 5 occurrences
December: 1 occurrence
January: 1 occurrence
February: 2 occurrences
March: 4 occurrences
46

5/27/2014
24
Division of Disease Control and Health Protection
ParameterBaseline Q1
2013(Jan-Mar)
2013 Q3(July-Sep)
2013 Q4 (Oct-Dec)
2014 Q1(Jan-Mar)
# Urine cultures 833 695 595 XX/XX
Urine cultures per 1000 resident days
8.83 6.81 5.72 xxx
% No UTI symptoms
Not applicable40%
(275/695)69%
(409/595)XXX
% No UTI52% (435/833)
*Lab results only*
74% (516/695)
83% (493/595)
XXX
% Urine contamination
39% (322/833)36%
(248/695)47%
(278/595)XXX
Antibiotics with no UTI (symptoms and/or positive labs)
26% (111/435)*Lab results
only*
27% (141/516)
23% (114/493)
XXX
47
Division of Disease Control and Health Protection
48

5/27/2014
25
Division of Disease Control and Health Protection
Line list for urine cultures and antibiotic use
Random, stratified sample Symptoms
Collection method/catheter status
Approximately 15 medical records per facility Range: 11-16
Culture results from July 2013-December 2013
49
Division of Disease Control and Health Protection
50
Correct line list X% correct entries
Most common error: correctly identifying symptoms
All except 1 facility had > 80% of lab results correctly listed
Inappropriate antibiotic use X% inappropriate antibiotic use
Range: 33%-60%

5/27/2014
26
Changing Direction To Effect Change
51
We have made some positive clinical changes but we are far from done…
Our data supports the need to continue to drive change and support a culture that advocates for antibiotic stewardship.
Our data indicates the need to better manage specimen collection to reduce contamination.
Today we are closer to the bedside and able to influence outcomes through heightened awareness of current culturing norms in LTC
52
5/27/2014
27
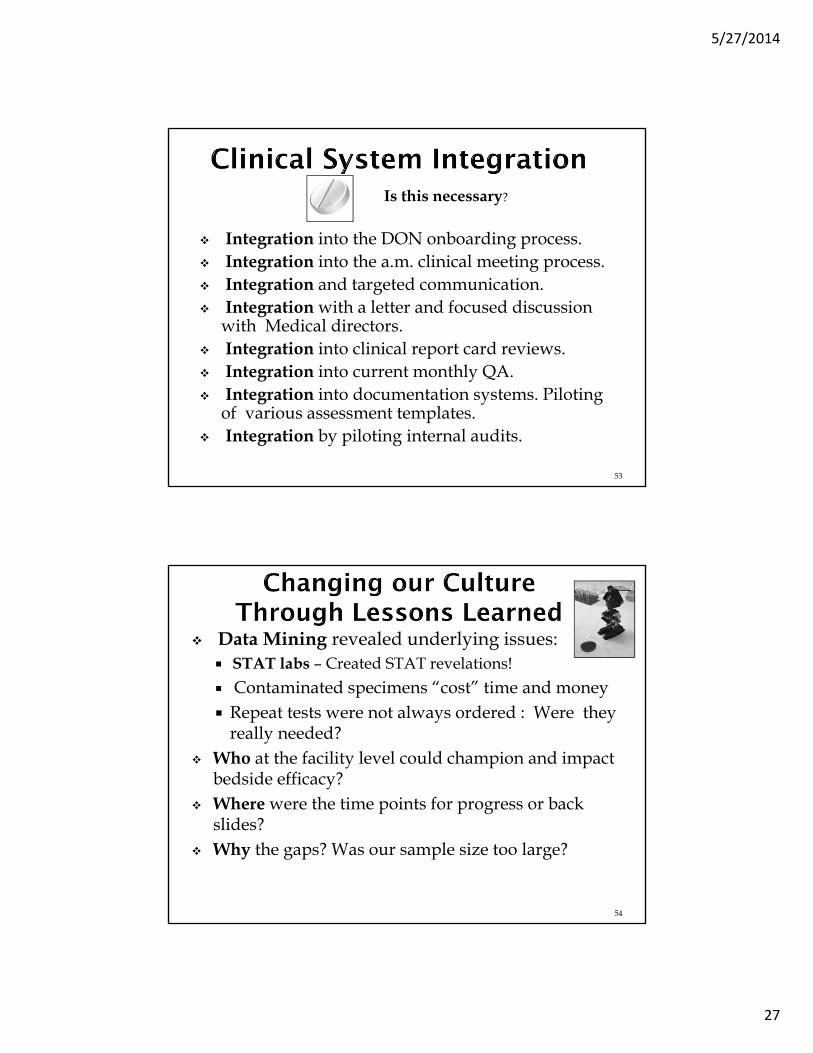
Integration into the DON onboarding process. Integration into the a.m. clinical meeting process. Integration and targeted communication. Integration with a letter and focused discussion
with Medical directors. Integration into clinical report card reviews. Integration into current monthly QA. Integration into documentation systems. Piloting
of various assessment templates. Integration by piloting internal audits.
Is this necessary?
53
Data Mining revealed underlying issues: STAT labs – Created STAT revelations!
Contaminated specimens “cost” time and money Repeat tests were not always ordered : Were they
really needed? Who at the facility level could champion and impact
bedside efficacy? Where were the time points for progress or back
slides? Why the gaps? Was our sample size too large?
54
5/27/2014
28
An immediate revelation in the 1st quarter was the incidence of STAT urines. Outsourced STAT labs = increased cost! WHY STAT?
Contaminated specimens is often not included in IC discussions.
No clinical criteria is applicable to contaminated specimens. Discovery and awareness was a BIG success
of the pilot.
55
What is the cause and effect? Did the resident receive antibiotics
and feel better? Or did the staff encourage fluids;
increase toileting efforts; provide other comfort measures that calmed the clinical presentation on a case by case basis? What really happened?
56

5/27/2014
29
What does a contaminated urine cost? Estimated lab processing cost = $12.00 per
specimen. Licensed nurse time – assessment; physician
contact; order processing time; specimen collection/oversight; follow-up = cost.
Resident care: What is really required? ADD MOST CURRENT CONTAMINATION
RATE X COST X 11 FACILITIES = POTENTIAL SAVINGS.
57
Eliminate myths: DONs persist in accepting and attempt outdated changes. For example, all urines obtained via straight cath.
It is time to stop and understand HOW and WHY this occurs.
We must ensure physicians stay informed of the results and the outcomes.
58

5/27/2014
30
We have looked closer at the process: Training for the “right” staff Oversight to the people most closely involved.
(e.g. select 11-7 staff who normally collect urine)
Criteria to address how to handle follow up regarding contaminated specimens
59
Extend the study for an additional 90 days. Reduce the sample size to 3 facilities for
implementation of further targeted action. Develop, write and implement a specific Quality
Plan for the targeted sample. Increase the feedback via webinar display of
aggregate results to the facilities. Require the facilities to present updated data to
medical directors and process through internal QA.
Apply QAPI Thinking through systematic analysis and oversight.
60

5/27/2014
31
That Knows, Why, When, and How To Culture
61
62

5/27/2014
32
Design & Scope: Comprehensive Plan Governance & Leadership: Buy in; training climate,
resources, sustainability>>>>>>>>>>>>>>>>>>is a work in progress
Feedback, Data Systems and Monitoring: Multiple sources, benchmarking, reaching targets, managing adverse events
Performance Improvement Projects (PIPs): Prioritize improvement opportunities, drive the change through a team, apply PDCA
Systematic Analysis & Systemic Action: Understand why! Root cause applications, systems approach and thinking, systematic changes as needed
63
Design and Scope Assign a Champion/Co Champion’s on all shiftsIdentify when the specimens most often occurRecorder, Timekeeper, Facilitator Determine what is the problem to be solved
Why is it important? Write an opportunity statement with a
beginning and end point .
64

5/27/2014
33
Who will be good team members? Who might be a champion and co champion?
Who would be a Collection Specialist? What resources might you need? Are there any special supply or equipment
needs? Are residents aware of the plan?
65
WhatIs the problem?
What is the goal?
Who are the resources?
What is required?
66

5/27/2014
34
Have the Right Team
Commit to the Change
67
An opportunity exists to reduce the rate of contaminated urine specimens (following review and analysis of ASB pilot data collected) and to utilize our knowledge to further influence change and establish more effective ways to obtain specimens
An opportunity exists to reduce the rate of antibiotic use to treat residents for UTI (when clinical criteria items standardized per the McGreer criteria are not met )and to use our knowledge to mobilize expertise, sustain critical thinking, and continue to move outcomes in a positive direction
68

5/27/2014
35
What are you aiming for? Where are the other types of resources you will
use to solve the problem, educate, or better manage the process?
Communication systems to support?
69
PERI CARE RETURN DEMONSTRATION
1. Knocked on door. Screened resident. Pulled window curtain if necessary. 2. Addressed resident, introduced self and explained what was being done. 3. Gathered equipment 4. Washed hands and put on gloves (universal precautions). 5. Removed soiled incontinence product and disposed of properly (put in trash bag, tied shut). 6. Did not put soiled incontinence product or linen on floor. 7. Told resident before using wipes/washcloth/perineal wash, “Wipe may feel cold.” 8. Used clean section for each wipe/washcloth or used a new wipe/washcloth each time. 9. Used correct technique for peri-care on female vs. male residents.
Female: Spread labia, wipe one side, then the other, and then the middle, wiping toward the rectal are and never wiping back and forth. Proceed to clean the rectal and buttocks area.
Male: Pull foreskin back if resident is uncircumcised. Clean the tip of the penis using a circular motion starting at the urethra and working outward. Clean shaft of the penis with firm downward strokes. Clean the scrotum.
10. Used no other products unless resident has order. 11. Removed gloves before touching clothing, bed rail, cubicle curtain, etc. 12. Washed hands before leaving room. 13. Correctly disposed of incontinence product in soiled utility room or if in isolation in red barrel in
room. 14. Used proper body mechanics and proper positioning for resident during entire procedure. 15. Maintained resident dignity and privacy throughout entire procedure.
Staff Name:__________________________________ Score:__________________
Evaluator:___________________________________ Date:___________________
Comments:_______________________________________________________________________________________________________________________________________________________________________________________________________________________________________________________________________________________________________________________________________________________
SBAR
STOP AND WATCH
McGeer Criteria
Asymptomatic Bacteruria?
Collection Methods………………….Coding Symptoms
Physician Philosophy70
5/27/2014
36
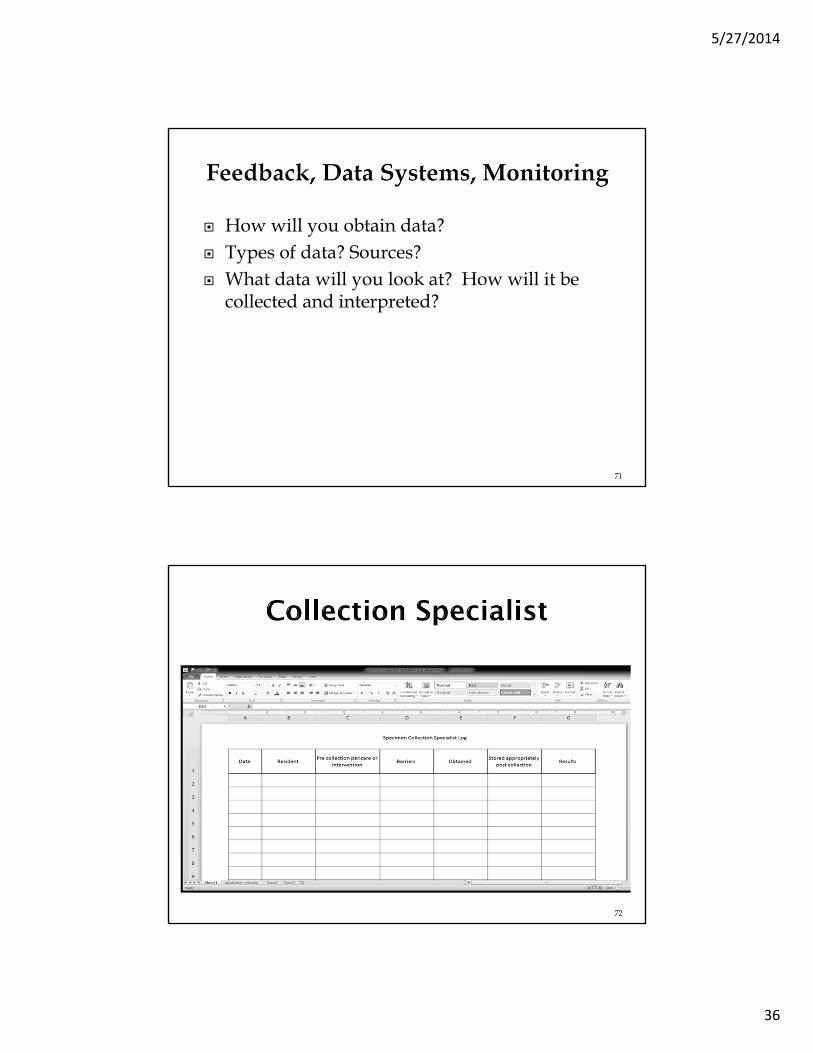
How will you obtain data? Types of data? Sources? What data will you look at? How will it be
collected and interpreted?
71
72

5/27/2014
37
What will you do to help root cause? How will you assign responsibility? How will you measure success? How will you get feedback on the outcomes? How will it be captured and reported? How will you determine next steps and
maintain the gain How will you celebrate the success? How will it flow to QAPI as part of your QAA?
73
74

5/27/2014
38
75
Division of Disease Control and Health Protection
1. Nicolle LE et. al. Infectious Diseases Society of America Guidelines for the Diagnosis and Treatment of Asymptomatic Bacteriuria in Adults, Clinical Infectious Diseases 2005; 40:643–54.
2. Nicolle LE, the SHEA Long-Term–Care Committee. Urinary tract infections in long-term–care facilities. Infect Control Hosp Epidemiol2001;22:167-175.
3. Nicolle LE, Bentley DW, Garibaldi R, Neuhaus EG, Smith PW, the SHEA Long-Term–Care Committee. Antimicrobial Use in Long-Term–Care Facilities. Infect Control Hosp Epidemiol 2000;21:537-545.
4. McGeer A et al: Definitions of Infection for Surveillance in Long-term Care Facilities, Am J Infect Control 19(1):1-7, 1991.
5. Stone, Nimalie, MD et. al., Surveillance Definitions of Infections in Long-Term Care Facilities: Revisiting the McGeer Criteria, Infection Control and Hospital Epidemiology, Vol. 33, No. 10 (October 2012), pp. 965-977.
6. Boucher HW et al. Clin Infect Dis. 2009;48:1-127. Nicolle et al. Clin Infect Dis 2005; 40:643-54
76
5/27/2014
39
77
For being part of our presentation and sharing our Vision for a New Culture of
Culturing!