Embed Size (px)
Citation preview


p-ear1-05 TDD (for hearing and speech impaired only): 651-282-5332
Printed on recycled paper containing 30% fibers from paper recycled by consumers
Alternative EAW Form for Animal Feedlots
ENVIRONMENTAL ASSESSMENT WORKSHEET
Note to reviewers: The Environmental Assessment Worksheet (EAW) provides information about a project that may have the potential for significant environmental effects. This EAW was prepared by the Minnesota Pollution Control Agency (MPCA), acting as the Responsible Governmental Unit (RGU), to determine whether an Environmental Impact Statement (EIS) should be prepared. The project proposer supplied reasonably accessible data for, but did not complete the final worksheet. Comments on the EAW must be submitted to the MPCA during the 30-day comment period which begins with notice of the availability of the EAW in the Minnesota Environmental Quality Board (EQB) Monitor. Comments on the EAW should address the accuracy and completeness of information, potential impacts that are reasonably expected to occur that warrant further investigation, and the need for an EIS. A copy of the EAW may be obtained from the MPCA by calling 651-297-8510. An electronic version of the completed EAW is available at the MPCA Web site http://www.pca.state.mn.us/news/eaw/index.html#open-eaw. 1. Basic Project Information.
A. Feedlot Name: Feist Livestock, LLC Expansion Project B.
Feedlot Proposer:
Feist Livestock, LLC
C.
RGU:
Minnesota Pollution Control Agency
Technical
Contact Person Ryan Feist
Contact Person
Jim Sullivan
and
Title Project Proposer
and Title
Project Manager
Address 59398 170th Street Address 520 Lafayette Road North Wells, Minnesota 56097 St. Paul, Minnesota 55155 Phone 507-525-5020 Phone 651-297-1788 Fax Fax 651-297-2343 E-mail [email protected] E-mail [email protected]
D. Reason for EAW Preparation: (check one)
EIS
Scoping
Mandatory EAW
X
Citizen Petition
RGU Discretion
Proposer Volunteered
If EAW or EIS is mandatory give EQB rule
category subpart number and name: Minn. R. 4410.4300, subp. 29 Animal Feedlots
E. Project Location: County Faribault Twp Clark NE 1/4 NE 1/4 Section 15 Township 123N Range 47W Watershed (name and 4-digit code):
Le Sueur 07020011

Feist Livestock, LLC Feedlot Expansion Environmental Assessment Clark Township, Minnesota 2 Worksheet
F. Attach each of the following to the EAW:
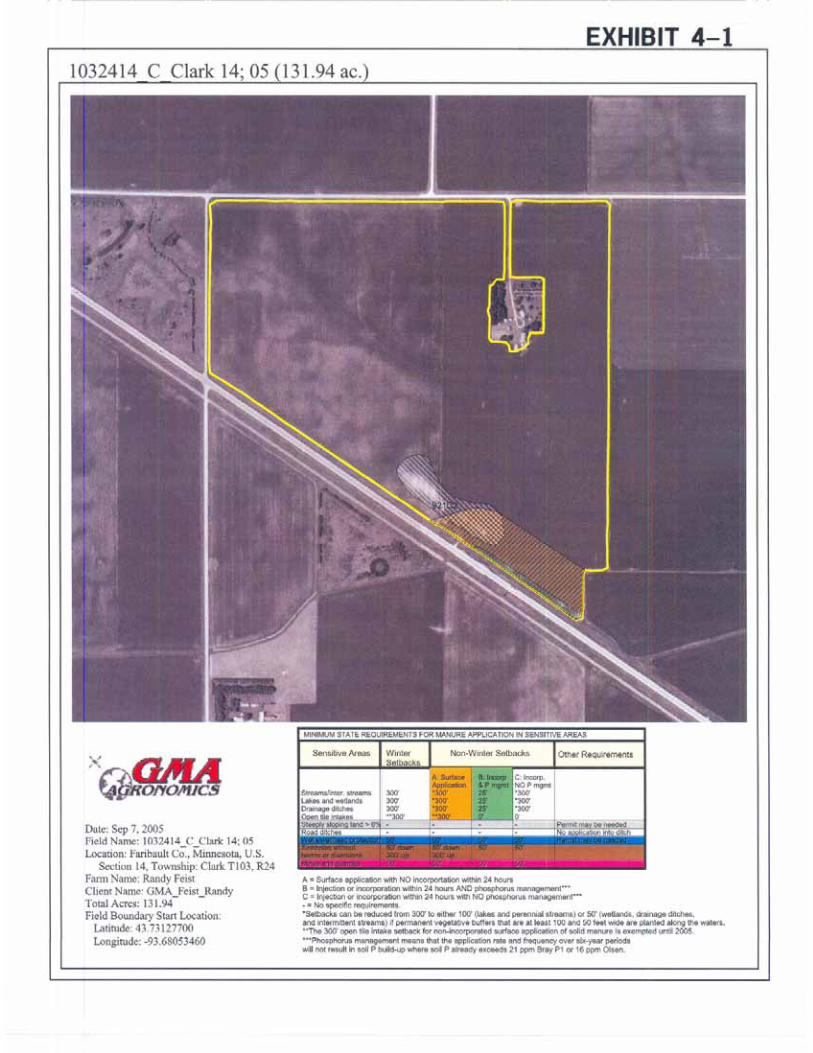
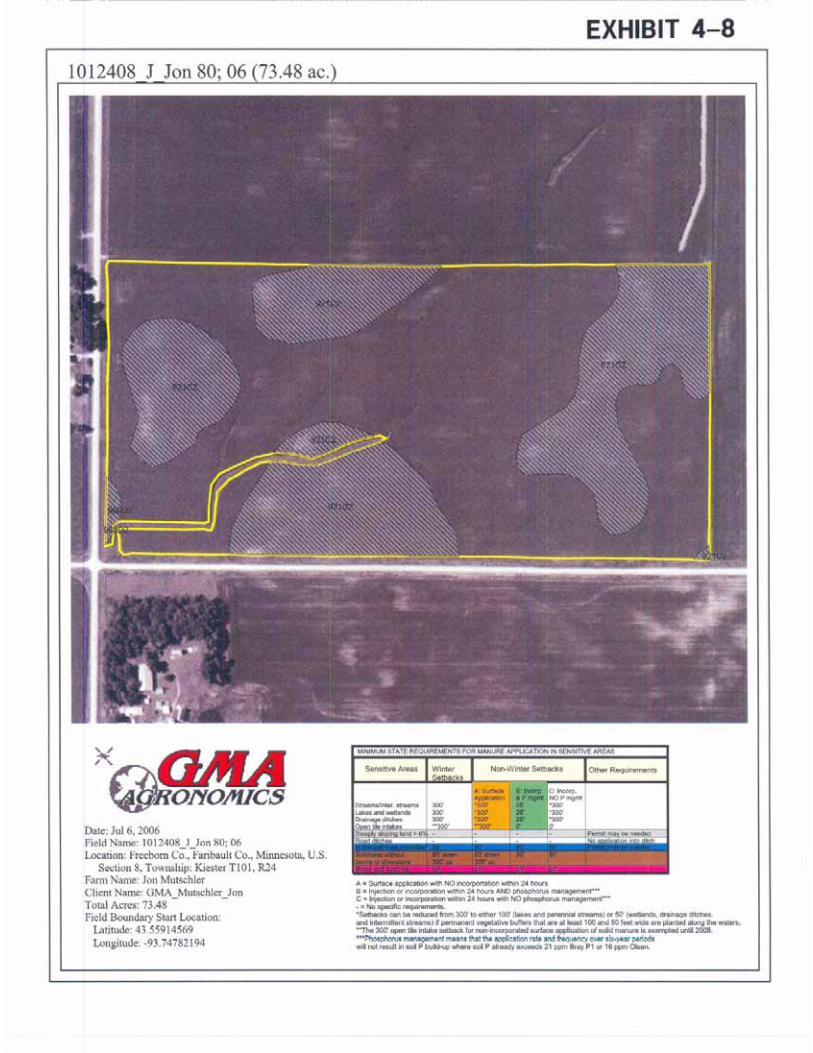
Exhibit 1: Map of Faribault County, showing general location of the project; Exhibit 2: Site plan, showing significant project and natural features, and drainage; Exhibit 3: United States Geological Survey (USGS) topographic map showing project location; Exhibit 4: Map showing location of manure application sites, wells, tile inlets, residences, and sensitive
receptors on or adjacent to the manure application sites (see Exhibits 4-1 through 4-9); Exhibit 5: Minnesota Department of Natural Resources (DNR) Natural Heritage database letter; Exhibit 6: Minnesota Historical Society e-mail; Exhibit 7: Minnesota Department of Health letter; Exhibit 8: Ambient Air Quality Modeling Report (MPCA); and Exhibit 9: Cumulative Potential Effects Analysis Map. The National Pollutant Discharge Elimination System/ State Disposal System (NPDES/SDS) Permit Application and associated documents, which include the Air Emission Plan, Emergency Response Plan, and Manure Management Plan (MMP), are available for review by contacting Chuck Peterson, MPCA Rochester Office, 18 Wood Lake Drive Southeast, Rochester, Minnesota, 55904. He can be reached at 507-280-3591.
G. Project summary of 50 words or less to be published in the EQB Monitor.
Feist Livestock, LLC proposes to construct an 82-foot by 230-foot total confinement barn that is designed to house 2,400 finishing swine (720 animal units). The barn will store manure in a concrete pit located beneath the barn. The new barn is an expansion of the facility. The existing site contains an 82-foot by 230-foot total confinement finishing barn. The total animal unit count after expansion will be 4,800 head of finishing swine, or 1,440 animal units. Manure will be land applied as fertilizer in the fall of the year.
H. Please check all boxes that apply and fill in requested data: Animal Type Number Proposed Type of Confinement
Finishing hogs 2,400 2,400 in a new total confinement/deep-pitted facility with tunnel ventilation.
Sows Nursery pigs Dairy cows Beef cattle Turkeys Layer hens Chickens Pullets Other (Boars)
I. Project magnitude data.
Total acreage of farm: 194 Number of animal units proposed in this project: 720 Total animal unit capacity at this location after project construction: 1,440 Acreage required for manure application: 1,284

Feist Livestock, LLC Feedlot Expansion Environmental Assessment Clark Township, Minnesota 3 Worksheet
J. Describe construction methods and timing.
The additional single story barn will be built with concrete manure storage pits under the slatted floors, for the storage of liquid manure. The area occupied by the barn and construction activity will involve about one acre of land. Construction will take approximately three months.
K. Past and future stages.
Is this project an expansion or addition to an existing feedlot? Yes No Are future expansions of this feedlot planned or likely? Yes No If either question is answered yes, briefly describe the existing feedlot (species, number of animals and animal units, and type of operation) and any past environmental review or the anticipated expansion. The project has never undergone any previous environmental review process. The project proposer currently holds a Certificate of Registration from Faribault County for a livestock operation that consists of 998.8 animal units. The operation consists of three barns: • Barn #1 is a 40-foot by 64-foot total confinement barn that houses 82 finishing swine. Manure is stored in
a 12-foot by 72-foot by 8-foot concrete pit located beneath the barn. • Barn #2 is a 12-foot by 20-foot total confinement barn that houses 15 finishing swine. It has a 20-foot by
20-foot by 8-foot concrete manure storage pit located beneath the barn. • Barn #3 is an 82-foot by 230-foot total confinement barn that is designed to house 2,400 (720 animal
units) finishing swine. This barn has an 82-foot by 230-foot by 8-foot concrete manure storage tank located beneath the barn. This barn was constructed in 2006.
The project proposer intends to renovate Barn #1 for non-livestock uses (e.g., office). The proposed livestock unit will be an 82-foot by 230-foot total confinement system with an 82-foot by 230-foot by 8-foot concrete manure storage tank located beneath the barn. Barn #2 will be renovated to machine shed. Upon completion of the project, the facility will maintain three livestock units that include the existing Barn #3 and the new proposed 82-foot by 230-foot total confinement system. The final animal count for the completed facility will be 4,800 head or 1,440 animal units. No further expansions are expected after this phase of production.
2. Land uses and noteworthy resources in proximity to the site. A. Adjacent land uses. Describe the uses of adjacent lands and give the distances and directions to nearby
residences, schools, daycare facilities, senior citizen housing, places of worship, and other places accessible to the public (including roads) within one mile of the feedlot and within or adjacent to the boundaries of the manure application sites. The adjacent land to the west, east, and south are all used for farm land. Land directly to the north features farmland and the Wells Wildlife Management Area (Wells WMA). The project and the Wells WMA are separated by Highway 109 and land owned by the railroad. The project is completely surrounded by farmland owned by Randy Feist, an owner of the facility. The project is located in land that is zoned for agricultural use (see Exhibit 1).
Feist Livestock, LLC Feedlot Expansion Environmental Assessment Clark Township, Minnesota 4 Worksheet
B. Compatibility with plans and land use regulations. Is the project subject to any of the following adopted plans or ordinances? Check all that apply:
Local comprehensive plan Land use plan or ordinance1 Shoreland zoning ordinance2 Flood plain ordinance Wild or scenic river land use district ordinance Local wellhead protection plan
Is there anything about the proposed feedlot that is not consistent with any provision of any ordinance or plan checked? Yes No. If yes, describe the inconsistency and how it will be resolved. Are there any lands in proximity to the feedlot that are officially planned for or zoned for future uses that might be incompatible with a feedlot (such as residential development)? Yes No If yes, describe the potentially affected use and its location relative to the feedlot, its anticipated development schedule, and any plans to avoid or minimize potential conflicts with the feedlot.
C. Nearby resources. Are any of the following resources on or in proximity to the feedlot, manure storage areas, or within or adjacent to the boundaries of the manure application sites?
• Drinking Water Supply Management Areas designated by the Minnesota Department of Health?
Yes No • Public water supply wells (within two miles)? Yes No • Archaeological, historical or architectural resources? Yes No • Designated public parks, recreation areas or trails? Yes No • Lakes or WMAs? Yes No3 • State-listed (endangered, threatened or special concern) species, rare plant communities, or other
sensitive ecological resources such as native prairie habitat, colonial waterbird nesting colonies, or regionally rare plant communities? Yes No
• Scenic views and vistas? Yes No • Other unique resources? Yes No If yes, describe the resource and identify any project-related impacts on the resource. Describe any measures to minimize or avoid adverse impacts. Wells WMA The Wells WMA was identified from information provided by the DNR and is located to the northeast of the proposed project across Highway 109 (see Exhibit 2). The Wells WMA is approximately 27 acres in size and contains designated hunting options, which include small game and pheasant. It also provides an opportunity to view wetland wildlife. The Faribault County Ordinance requires a 500-foot setback distance between the
1 The project is located on land that is zoned as an A-2 General Agricultural District under the Section 7 of the Faribault County Ordinance. 2 According to Faribault County Ordinance Section 20.G.2.b. (Shoreland Regulations), “Modifications or expansions to existing feedlots that are located within three hundred (300) feet of the OHWL [Ordinary High Water Level] or within a bluff impact zone are allowed if they do not further encroach into the existing OHWL setback or encroach on bluff impact zones.” The proposed project is not within 300 feet of an OHWL.

Feist Livestock, LLC Feedlot Expansion Environmental Assessment Clark Township, Minnesota 5 Worksheet
wildlife area and the feedlot.4 A buffer of approximately 70 feet exists between the land application fields and the Wells WMA. Manure will be incorporated immediately to eliminate any risk of surface water runoff impacts. Air quality impacts to the Wells WMA are not expected to be significant (see Exhibit 8). Cultural Resources The Minnesota State Historic Preservation Office was contacted and as far as on or in proximity to the feedlot, manure storage areas, or within or adjacent to the boundaries of the manure application sites, they responded: “No archaeological sites or historic structures were identified in a search of the Minnesota Archaeological Inventory and Historic Structures Inventory for the search area requested.” Drinking Water Supply Management Area (DWSMA) and Public Water Supply Based on information provided by the Minnesota Department of Health, livestock site and land application areas are not within any DWSMAs. Two public water supply wells exist within two miles of the project. One of the wells is the community well for the city of Wells and the other is a drinking water supply well for Dairy Queen. The city of Wells has not been phased into the Minnesota Department of Health’s Wellhead Protection Program. The wellhead protection for Dairy Queen encompasses a 200-foot radius around the Dairy Queen water supply well. The land application activities will not be conducted within the Dairy Queen wellhead protection radius. Endangered, Threatened, or Special Concern Species The plant species listed by the DNR are Mesic Prairie, Tuberous Indian-plantain, rattlesnake-master, and Sullivants Milkweed. These plant species are located in the railroad property. The railroad property is located greater than 100 yards from the project. According to the DNR, as long as construction activities avoid the railroad right-of-way, the project should not negatively impact any known occurrences of rare features.
3. Geologic and soil conditions.
A. Approximate depth (in feet) to: Feedlot Manure Storage Area Manure Application Sites Ground Water (minimum)* 6 6 5 (average) >6 >6 >6 Bedrock (minimum) >11 >11 >9 (average) >11 >11 >12
*Exhibit 7 – On site soil boring report indicates no ground water present. Above information is based on general Natural Resources Conservation Service (NRCS) data for soil types.
B. NRCS Soil Feedlot Manure Storage
Area Manure Application Sites
Classifications (if known) Gonvick Loam
Gonvick Loam Various soil types. Please refer to the MMP for details.
4 See Faribault County Ordinance Section 22.B.4.1 regarding setback distances for new and existing feedlots.

Feist Livestock, LLC Feedlot Expansion Environmental Assessment Clark Township, Minnesota 6 Worksheet
C. Indicate with a yes or no whether any of the following geologic site hazards to ground water are present
at the feedlot, manure storage area, or manure application sites. Feedlot Manure Storage Area Manure Application Sites Karst features (sinkhole, cave, resurgent spring, disappearing spring, karst window, blind valley, or dry valley)
No No No
Exposed bedrock No No No Soils developed in bedrock (as shown on soils maps)
No No No
For items answered yes (in C), describe the features, show them on a map, and discuss proposed design and mitigation measures to avoid or minimize potential impacts.
4. Water Use, Tiling and Drainage, and Physical Alterations.
A. Will the project involve installation or abandonment of any water wells, appropriation of any ground or surface water (including dewatering), or connection to any public water supply? Yes No
If yes, as applicable, give location and purpose of any new wells; the source, duration, quantity and purpose of any appropriations or public supply connections; and unique well numbers and the DNR appropriation permit numbers, if available. Identify any existing and new wells on the site map. If there are no wells known on-site, explain methodology used to determine that none are present. There are currently two drinking water wells on site. Well #1 is 115 feet deep with 108 feet of 5-inch casing and has been used for livestock watering and domestic usage. This well does not currently appear on the Minnesota Department of Health County Well Index (CWI). Well #2 (#714561), also located on site, extends to 135 feet and finishes in the Galena Group. This well is designated as the water source for both the existing and proposed livestock units. As noted above, both wells are completed in the Galena formation. The Galena Group, which is an important regional aquifer, comprises the Stewartville Formation, Prosser Limestone, and Cummingsville Formation.5 Based on work conducted in the southeastern region of Minnesota, it was noted that “…in shallow bedrock conditions the carbonate strata in the Galena through Cedar Valley Groups contain large, interconnected conduits that can accommodate enormous volumes of water traveling at rates measured in hundreds of feet per day to several miles per day…”6 The recharge characteristics of the aquifer typically takes place in situations where the bedrock has little overburden or is exposed and “…occurs relatively rapidly through fractures and dissolution cavities, and ground water laterally at rates commonly measured in miles per day…”7 Based on the information reviewed, the Galena Group is covered by an approximately 100 feet of glacial drift, thereby reducing the potential for contamination from land application or manure storage activities.
5 Campion, M. 2002. Geologic atlas of Mower County: Bedrock Hydrogeology. Atlas C-11, Part B, Plate 7 of 10. Minnesota Geological Survey/DNR. 6 Runkel, A.C., Tipping, R.G., Alexander, E.C., Green, J.A., Mossler, J.H., and Alexander, S.C. 2003. Hydrogeology of the Paleozoic bedrock in southeastern Minnesota. Report of Investigations 61. Saint Paul: University of Minnesota. p. 84. 7 Runkel, A.C., Tipping, R.G., Alexander, E.C., Green, J.A., Mossler, J.H., and Alexander, S.C. 2003. Hydrogeology of the Paleozoic bedrock in southeastern Minnesota. Report of Investigations 61. Saint Paul: University of Minnesota. p. 87.

Feist Livestock, LLC Feedlot Expansion Environmental Assessment Clark Township, Minnesota 7 Worksheet
Well #1 will not be used for livestock and will remain as a water source for domestic use. Well #2 is designated as the water source for the livestock facility. The pump-rate for well #2 is 20 gallons per minute. The projected water use for the project is approximately 4,380,000 gallons per year with a 25-year service life usage of 109,500,000 gallons using a water consumption rate of 2.5 gallons per day per animal. Based on the published aquifer characteristics, the nature of the water usage, the Project is not expected to create any adverse impact to water resources.
B. Will the project involve installation of drain tiling, tile inlets or outlets? Yes No If yes, describe.
According to MPCA feedlot regulations,8 a drain tile must be placed around the livestock building perimeter. The consulting engineer’s design includes a perimeter tile to be installed around the footing of the concrete pits in order to relieve hydrostatic pressure and discharge the ground water away from the livestock unit. Without a perimeter tile, hydrostatic pressure could crack the concrete pit and destroy the structure. Under this design, ground water will be pumped from the perimeter tile sump pits located next to each of the barns and then onto a storm water diversion area that will be seeded to grass and planted to shelter belt trees and shrubs where the water can be utilized as a source of irrigation. The ground water diverted via the perimeter tile is ground water that has not come into contact with manure and should reflect the ground-water quality of the existing surficial aquifer.
C. Will the project involve the physical or hydrologic alteration — dredging, filling, stream diversion, outfall structure, diking, and impoundment — of any surface waters such as a lake, pond, wetland, stream or drainage ditch? Yes No
If yes, identify water resource affected and give the DNR Protected Waters Inventory number(s) if the water resources affected are on the PWI. Describe proposed mitigation measures to avoid or minimize impacts.
5. Manure management.
A. Check the box or boxes below which best describe the manure management system proposed for this feedlot.
Stockpiling for land application Containment storage under barns for land application Containment storage outside of barns for land application Dry litter pack on barn floors for eventual land application Composting system Treatment of manure to remove solids and/or to recover energy Other (please describe)
B. Manure collection, handling, and storage.
Quantities of manure generated (both barns): total
2,245,096 gal/year
by species 1
by species 2
Frequency and duration of manure removal: number of days per cycle 10 days Total days per year 10 days
8 See generally Minn. R. 7020.2100
Feist Livestock, LLC Feedlot Expansion Environmental Assessment Clark Township, Minnesota 8 Worksheet
Give a brief description of how manures will be collected, handled (including methods of removal), and stored at this feedlot: All manure will fall directly through slat floor into an underground concrete pit below the barns. There is enough storage capacity for a 12-month period. During the fall after crops are removed, manure will be agitated and pumped into a slurry tank to be incorporated immediately.
C. Manure utilization.
Physical state of manure to be applied: liquid solid other, describe: _________________
D. Manure application. 1. Describe application technology, technique, frequency, time of year, and locations.
The land application for this project is designed to occur once a year, during the autumn months after crops are removed from the field. The location of the land application acres are noted in Exhibit 4. The manure will be applied with a slurry tank and immediately incorporated. The incorporation will be conducted using sweeps, or a possible chisel shank with disk closers. The decision to use a chisel shank with disk closers will be determined based on the ability to maintain nutrient content at or above 80 percent.
2. Describe the agronomic rates of application (per acre) to be used and whether the rates are based on
nitrogen or phosphorus. Will there be a nutrient management plan? Yes No
The MPCA has reviewed the Nutrient Management Plan as part of the NPDES/SDS Feedlot Permit for this facility. The facility will operate under a nitrogen-based land application plan based on soil chemistry and cropping practices. The nitrogen-based application rate is 206.5 pounds of nitrogen per acre (with 149 pounds per acre the first year) consistent with corn cropping practice. Corn yields are expected to be 200 bushels per acre. Soybeans are expected to yield 55 bushels per acre. A copy of the Nutrient Management Plan is available upon request.
3. Discuss the capacity of the sites to handle the volume and composition of manure. Identify any improvements necessary. Both the manure storage system and the land identified in the MMP have been evaluated for the suitability of their intended purpose. There are approximately 12 months of storage available in the concrete pits. The concrete pits are a design that meets the MPCA feedlot regulations. The land identified in the MMP includes soil types that are suitable for land application of manure and consistent with the cropping practices employed. No improvement to either the land base used in the MMP or at the feedlot construction site will be required.
4. Describe any required setbacks for land application systems. All of the setbacks described in Minn. R. ch. 7020 (see Table 1) and the Faribault County Feedlot Management ordinance (see Table 2) will be followed.
Feist Livestock, LLC Feedlot Expansion Environmental Assessment Clark Township, Minnesota 9 Worksheet
Table 1. MPCA Setback Distances for Land Application of Manure (in feet)
Non-Winter With Immediate
Incorporation (<24 hours)
Non-Winter Not incorporated within 24 hours
Feature Winter
With P Mgmt.
No P Mgmt.
With Vegetated Buffer
Inadequate Vegetated
Buffer Lake, Stream 300 25 300 100 300 Intermittent Stream* DNR protected wetlands** Drainage ditch w/o quarry*
300 25 300 50 300
Open Tile Intake*** 300 0 0 300 300 Well, mine or quarry 50 50 50 50 50 Sinkhole with no diversion
Downslope 50 Upslope 300
50 50 Downslope 50 Upslope 300
Downslope 50 Upslope 300
Source: Minn. R. ch. 7020 Feedlot Rules
* Intermittent streams and ditches pertain to those identified on USGS quadrangle maps, excluding drainage ditches with berms that protect from runoff into the ditch and segments of intermittent streams which are grassed waterways. USGS quadrangle maps can be found at County Soil and Water Conservation District Offices or can be viewed on the internet at http://www.terraserver.microsoft.com (January 28, 2005).
**Wetland setbacks pertain to all protected wetlands identified on DNR protected waters and wetlands maps (these maps are often located in County Soil and Water Conservation District offices and typically include all wetlands over ten acres).
Table 2. Faribault County Setback Distances for Land Application of Manure (in feet)
Location Surface Applied
Incorporation or injection
Watercourses, streams, rivers, lakes, wetlands and ditches 300 100 Municipal wells 1,000 1,000 Private wells 200 200 Residential area or municipality 500 200 Uncomposted poultry manure from municipality 5,280 5,280 Residence, neighboring residence 300 200 Cemeteries 300 200 100 year flood plain Prohibited 200 Field Tile Intake 100 10 Drainage Ditches (with one rod buffer) 50 Edge/buffer Drainages Ditches (without buffer) 100 16.5
E. Other methods of manure utilization. If the project will utilize manure other than by land
application, please describe the methods.
No other method of manure utilization has been identified with this project.

Feist Livestock, LLC Feedlot Expansion Environmental Assessment Clark Township, Minnesota 10 Worksheet
6. Air/odor emissions.
A. Identify the major sources of air or odor emissions from this feedlot.
The confinement barns and the manure storage basin will be the sources of potential air and odor emissions from the proposed facility. The types of materials emitted will include dust, non-odorous gases, and odorous gases. These types of emissions are common to animal production facilities with liquid storage basins. Some odorous gases (e.g., ammonia, hydrogen sulfide, and volatile organic compounds) will be emitted during the land application of manure. Injecting the manure into the soil below the surface will minimize the release of odorous gases. Composting may be a source of odor if improperly conducted or managed. The project proposer will follow the Minnesota Department of Agriculture guidance on livestock composting to ensure that the process is properly managed.9
B. Describe any proposed feedlot design features or air or odor emission mitigation measures to be implemented to avoid or minimize potential adverse impacts and discuss their anticipated effectiveness. All manure will be stored in covered concrete pits to minimize potential odor emissions. Tunnel ventilation will be used in the buildings. Manure from the project will be injected, rather than spread on the surface. The practice of injecting manure greatly reduces odor potential from this activity.
C. Provide a summary of the results of an air emissions modeling study designed to compare predicted emissions at the property boundaries with state standards, health risk values, or odor threshold concentrations. The modeling must incorporate an appropriate background concentration for hydrogen sulfide to account for potential cumulative air quality impacts. Air quality modeling estimated the atmospheric concentrations of hydrogen sulfide, ammonia, and selected odorous gases at the property lines for the proposed Project and at 30 of the proposed feedlot’s nearest neighbors. A complete report of the air quality modeling findings is found in Exhibit 8. The table below is provided as a summary of the air quality modeling findings.
Project Modeling Results Property Boundary
Hydrogen Sulfide Results (ppb)1
Acute Ammonia Results (µg/m3)2
North 21.71 669 Northeast 22.29 1,077 East 19.93 634 South 19.05 490 West 22.20 929
1State ambient hydrogen sulfide air quality standard: 30 ppb half-hour average 2 Acute inhalation health risk value for ammonia: one hour average of 3,200 µg/m3
ppb = parts per billion µg/m3 = micrograms per cubic meter It is important to note that each modeling exercise took into account nearby livestock facilities to better represent the potential air quality impacts. In summary, the CALPUFF modeling results suggest that the proposed project will comply with the ambient air quality standard for hydrogen sulfide and will not exceed the applicable inhalation healthy risk values for ammonia or hydrogen sulfide.
9 http://www.mda.state.mn.us/composting/compostguide.pdf (July 24, 2006).

Feist Livestock, LLC Feedlot Expansion Environmental Assessment Clark Township, Minnesota 11 Worksheet
D. Describe any plans to notify neighbors of operational events (such as manure storage agitation and pumpout) that may result in higher-than-usual levels of air or odor emissions. The nearest neighbors will be notified prior to agitation and manure application. Application activity will be avoided during weekends and holidays. This information will be included the project proposer’s Good Neighbor Plan, required under the county Conditional Use Permit.10 The project proposer will employ the agitation and pumpout exemption under Minn. R. 7020.2002 to gain a temporary exemption of the Minnesota Ambient Hydrogen Sulfide Air Quality rules.11
E. Noise and dust. Describe sources, characteristics, duration, quantities or intensity and any proposed measures to mitigate adverse impacts. During construction, normal noise and dust associated with earth moving equipment and construction will be generated. Adverse impacts as a result of these activities are not anticipated. Following construction, fugitive dust sources are expected to be minimal due to grass seeding, confinement of livestock to the barns, and graveled driveways helping control fugitive dust. The noise levels present after construction will be consistent with other operations in the area.
7. Dead Animal Disposal
Describe the quantities of dead animals anticipated, the method for storing and disposing of carcasses, and frequency of disposal. Anticipated mortality rate is at 4 percent (approximately 200 finishing hogs) with a goal of 2 percent (approximately 100 finishing hogs) per year. The dead animals will be placed in the compost building as they are discovered in the livestock units. The capacity of the compost system is designed to accommodate more than the anticipated facility mortality rate. The additional compost loading space was designed in case of emergencies. In the unlikely event that a catastrophic death loss of 50 percent or higher occurs, a rendering service will be utilized to maintain disease control. The current compost building is a NRCS design and was inspected by the NRCS upon completion. This structure has the capabilities of being expanded if necessary.
8. Surface Water Runoff.
Compare the quantity and quality of site runoff before and after the project. Describe permanent controls to manage or treat runoff. Project Site The proposed project site is located within a minor watershed of the Blue Earth watershed. This project proposal is a total confinement swine operation, meaning that swine will not be raised outside the animal housing unit. As a result, surface water will not have the ability to come in contact with the animals or manure. The quantity of surface-water runoff will increase on the site due to an increase in impervious surfaces. (e.g., roofs and gravel driveways). The quality of the stormwater runoff will likely improve as it will not come into contact with crop or fertilizer residue or manure. It is anticipated that the grass will absorb and filter the water. In the event of a large rainfall, the surrounding agricultural fields in the area will act as infiltration/water storage sites through a combination of crops and soil. Construction of the proposed livestock units will be regulated under the construction stormwater provision of the NPDES/SDS Permit for the project.
10 See Section 22.D.5.M of the Faribault County Ordinance regarding feedlots and the Good Neighbor Plan requirement. 11 Minn. R. 7009.0080.

Feist Livestock, LLC Feedlot Expansion Environmental Assessment Clark Township, Minnesota 12 Worksheet
Land application areas The land application of manure if improperly applied can adversely impact surface water resources through manure-laden runoff or manure residue leaching into drain tile lines that outfall to surface waters. The project contains land application areas that are located within four minor watersheds of the Blue Earth River watershed. The minor watersheds have been farmed for several decades. The change in stormwater runoff characteristics (physically and chemically) from the project land application areas is expected to remain the same and under certain circumstances, may improve as a result of the regulated land application activities (e.g., agronomic rate, injection of manure) under the MPCA NPDES/SDS Permit. The improvements would occur by developing better soil tilth12 through the use of organic fertilizer and the uniform practice of injecting manure over the acres identified in the MMP. The potential impact to surface-water resources from the project’s land application activities is not expected to create a significant impact as it will be regulated by an NPDES/SDS Permit that operates under a “no discharge” standard. The “no discharge” standard is managed through the following practices. Manure will be injected into the soil at agronomic rates, meaning that only the amount of manure that can be used by the growing crop as nutrient will be applied. The agronomic rate is based on the type of crop grown, the soil type, and the soil chemistry. In addition, land application will occur during the fall of the year after crops are removed from the field, rather than in the spring when runoff potential is greater due to increased precipitation and soil moisture. Additional details or land application activities are found in Item 5 of the EAW. The information presented in Item 5 will be incorporated into the MMP for the proposed project. The MMP will be an enforceable provision of the NPDES/SDS Feedlot Permit for the project.
9. Traffic and Public Infrastructure Impacts.
A. Estimate the number of heavy truck trips generated per week and describes their routing over local roads. Describe any road improvements to be made. Depending on stage of pig development and rate of gain, there will be 2-3 semi loads of feed entering the facility once a week. The primary service corridor is State Highway 109, a ten-ton rated road. The heavy traffic period will occur during loadouts, which happens once every six months. This would be around 24-28 semi loads over a period of 2-4 weeks, (1-3 semi’s a day). This should not impact road traffic because of the time of day this will occur (e.g., minimal traffic) from the facility on a daily basis. The Faribault County Engineer stated that the road restriction in the spring is ten-ton per axle load. The axle weight restriction will not impact the traffic from the proposed project. It was also noted that the additional traffic from the project will not be an impact to the normal road use.13
B. Will new or expanded utilities, roads, other infrastructure, or public services be required to serve the project? Yes No If yes, please describe. Power will need to be provided to the site, which will require a spur off the power line adjacent to County Road 60. A private water line from the owners residential/farm site will also need to be run to the project.
12 Good tilth is a sign of healthy soil organisms. While digesting organic material, bacteria secrete gum and slime-like matter in the soil. This works like glue, binding soil particles and humus together to form aggregates. The aggregates are crumb-like and allow for good air circulation and water drainage in the soil. Well-aggregated soil is regarded as having good tilth. The addition of organic material will feed micro-organisms and thus improve tilth. www.earthandtable.com/glossary/soil/qualities.html (retrieved May 2, 2007). 13 E-mail from Faribault County Highway Engineer, John McDonald, to project proposer Ryan Feist, dated August 31, 2007. September 26, 2007, e-mail from Mark Scheidel, Minnesota Department of Transportation/Mankato Office, to Jim Sullivan, MPCA/St. Paul, noting that based on the proposed traffic load, no adverse impacts are considered likely.

Feist Livestock, LLC Feedlot Expansion Environmental Assessment Clark Township, Minnesota 13 Worksheet
10. Permits and approvals required. Mark required permits and give status of application:
Unit of government Type of Application Status MPCA NPDES/SDS Feedlot/Construction
Stormwater Permit Submitted
Faribault County Faribault County Conditional Use Permit Submitted DNR Water Appropriation Applied for after EAW approval
11. Other potential environmental impacts, including cumulative impacts. If the project may cause any
adverse environmental impacts not addressed by items 1 to 10, identify and discuss them here, along with any proposed mitigation. This includes any cumulative impacts caused by the project in combination with other existing, proposed, and reasonably foreseeable future projects that may interact with the project described in this EAW in such a way as to cause cumulative impacts. Examples of cumulative impacts to consider include air quality, stormwater volume or quality, and surface water quality.
The MPCA is required to inquire whether a proposed project, which may not individually have the potential to cause significant environmental effects, could have a significant effect when considered along with other projects. This type of impact is known as a cumulative potential effect. In order to assess the proposed project’s “cumulative potential effects of related or anticipated future projects,” the MPCA conducted an analysis that addressed other projects or operations in context to the potential direct or indirect impacts of the proposed project that: (1) are already in existence or planned for the future; (2) are located in the surrounding area; and (3) might reasonably be expected to affect the same natural resources. The following is a review of the analysis conducted to determine if the proposed project would contribute to an adverse cumulative potential effect. Projects that “are already in existence or planned for the future”and “are located in the surrounding area.” The MPCA reviewed existing public data to identify the number of feedlots and other projects within the same sub-watersheds of the proposed project. The public data reviewed included the most recent MPCA feedlot registration database and related project or permit databases for other operations that may hold an air quality, water quality, hazardous waste, or solid waste permit. The proposed livestock production facility and land application acres are located in four minor watersheds of the Blue Earth River watershed. The Blue Earth River watershed drains into the Upper Mississippi River. The following projects were noted:
• The city of Wells wastewater treatment facility, which discharges to County Ditch #3; • Seven facilities within the city of Wells that operate under the MPCA Air Quality Registration permit
program; • Former city of Wells dump, located southeast of Wells ½ mile southeast of Highway 109; and • A total of 46 registered livestock operations located within the four minor watersheds based on a review of
the MPCA feedlot registration database. The total animal units registered in all four of the minor watersheds were 9,609.5 over an area of approximately 32,434 acres. The livestock production sites located within the four catchments may use land available within the identified minor watersheds, but are not required to do so. Based on information provided by Faribault County, there are no other proposed projects that are planned for the future within the Project area. Lastly, the MPCA reviewed the proposed and existing projects to determine whether collectively they “might reasonably be expected to affect the same natural resources. The natural resources of concern included ground water, surface waters, air quality, and land use. The following is a brief discussion of each.

Feist Livestock, LLC Feedlot Expansion Environmental Assessment Clark Township, Minnesota 14 Worksheet
Ground-water Appropriation Based on information provided by the project proposer, the proposed livestock operation will extract ground water from the Galena formation (see Item 4.A.). The Galena Group is composed of the Galena Group, which is an important regional aquifer, comprises the Stewartville Formation, Prosser Limestone, and Cummingsville Formation.14 Most drinking water wells in the area extend through approximately 100 feet of glacial drift into the Galena Group. The aquifers are recharged through infiltration of precipitation and subsurface ground-water movement. Some surface water bodies and wetlands may also act as points of aquifer recharge.15 The MPCA reviewed the CWI to explore the nature of well depth and type to account for other users of the same or nearby resources identified within approximately a one-mile radius of the project.16 The following table is a summary of selected findings from the CWI data:
Name Unique Well #
Well Depth/Unit Well Use
Randall Feist 714561 Soil from the surface to 2 feet; yellow clay from 2 to 18 feet; gray clay and sand from 18 feet to 105 feet; Galena formation from 105 feet to 130 feet.
Livestock
Kevin Voight 142873 Soil from surface to 3 feet; yellow clay from 3 to 14 feet; blue clay from 14 to 102 feet; limestone from 102 feet to 150 feet.
Domestic
A. Prescher CL-2
221107 Drift from the surface to 92 feet; Galena formation from 92 feet to 262 feet; Decorah from 262 feet to 309 feet; Platteville formation from 309 feet to 328 feet; St. Peter formation from 328 feet to 420 feet; Shakopee from 420 feet to 445 feet.
Abandoned MGS test hole
Howard Boyles CL-13
221118 Drift from the surface to 97 feet; Galena formation from 97 feet to 194 feet; Decorah formation from 194 feet to 241 feet; Platteville formation from 241 feet to 251 feet; Glenwood formation from 251feet to 260 feet; St. Peter formation from 260 feet to 354 feet; Shakopee formation from 354 feet to 611 feet; Jordan formation from 611 feet to 644 feet.
Abandoned MGS test hole
M. Voight CL-14
221119 Drift from the surface to 99 feet; Galena formation from 99 feet to 210 feet; Decorah formation from 210 feet to 259 nine feet; Platteville formation from 259 feet to 266 feet; Glenwood formation from 266 feet to 276 feet; St. Peter formation from 276 feet to 368 feet; Shakopee formation from 368 feet to 622 feet; Jordan formation from 622 feet to 655 feet.
Abandoned MGS test hole
Marvin Ganzkow CL-10
221115 Glacial drift from the surface to 102 feet; Galena formation from 102 feet to 181 feet; Decorah formation from 181 feet to 226 feet; Platteville formation from 226 feet to 235 feet; Glenwood formation from 235 feet to 244 feet; St. Peter formation from 244 feet to 336 feet; Shakopee formation from 336 feet to 593 feet; Jordan formation from 593 feet to 625 feet.
Abandoned MGS test hole
MGS = Minnesota Geological Survey
14 Campion, M. 2002. Geologic atlas of Mower County: Bedrock Hydrogeology. Atlas C-11, Part B, Plate 7 of 10. Minnesota Geological Survey/DNR. 15 Bradt, R., Berg, J., 2000. Surficial hydrogeology. Regional Hydrogeologic Assessment Series, Upper Minnesota River Basin. RH-4. Part B, Plate 3 of 4. 16 The MPCA used the Minnesota Department of Health CWI – June, 2006. The one-mile radius was employed based on the working assumption of a one-mile zone of depletion for a livestock production well.
Feist Livestock, LLC Feedlot Expansion Environmental Assessment Clark Township, Minnesota 15 Worksheet
The existing ground-water use is domestic with an assumed consumption rate of 100 gallons per person per day.17 As previously discussed in Item 4.A., the project is designed to consume 4,380,000 million gallons of water a year, for a total of 109 million gallons over the 25-year service life of the proposed facility. A review of published geologic and hydrogeologic data indicates that the water-bearing characteristics of the surficial aquifer (including recharge) and the nature of its existing use as a ground-water source, water use for this project is not expected to interfere with other ground-water users. The DNR concurs with this analysis. It is important to note that the local ground-water users in and around the proposed project area are domestic users. Minn. Stat. § 103G.261 establishes domestic water use as the highest priority of the state's water when supplies are limited.18 In addition, the proposed project will be required to obtain a Water Appropriation Permit from the DNR for the use of more than 10,000 gallons per day or one million gallons per year, which includes agricultural uses. The purpose of the permit program is to ensure water resources are managed so that adequate supply is provided to long-range seasonal requirements for domestic, agricultural, fish and wildlife, recreational, power, navigational, and quality control. The program exists to balance competing management objectives, including both the development and protection of water resources. In light of the projected project water use, aquifer characteristics, existing water uses and the water appropriation statute, the proposed project is not expected to contribute to an adverse or irreversible cumulative potential impact of ground-water resources. Ground-water Quality Ground-water resources can be adversely impacted by land application activities where ground-water resources are at or near the surface or are accessible through conduits and fractures commonly associated with karst topography or through the texture and structure of soils and sediment. The 1989 Minnesota Groundwater Protection Act authorized the DNR to map geographic areas defined by natural features where there is risk to ground water from activities conducted at or near the land surface.19 The MPCA has reviewed information compiled by the DNR to determine whether the proposed project has the potential to contribute pollutants to the underlying aquifer creating to an adverse cumulative potential effect. The soil type and depth to bedrock were considered as factors in the review to determine ground-water sensitivity and pollutant impacts. The designation reflects the surfical geology of the area, which is, in this case, primarily glacial lake sediment and till. The risk to ground-water quality is further reduced by the land application practices that will be employed by the project proposer (see Item 5 of the EAW). In light of the potential risk of contamination to ground-water resources and the manner in which land application will be managed for the facility, the project will not contribute to an adverse cumulative potential effect to ground-water resources in the area. Surface-water Impacts The land application areas are located within four minor watersheds of the Blue Earth River Watershed. The Blue Earth River Watershed drains a land area of approximately 774,115 acres. Land use within the Blue Earth River watershed is primarily agricultural, accounting for approximately 84 percent of the available acres. Two-year corn/soybean rotations comprise approximately 92 percent of cropped lands with the watershed; small grains, hay and grasslands enrolled in the Conservation Reserve Program make up the majority of the balance.20 The Blue Earth River and its major tributaries, in particular, are having a large impact on the Minnesota River, which, in turn, is contributing large amounts of pollution to the Mississippi River. Data collected during the Minnesota River Assessment Project showed that the Blue Earth River delivered 46 percent of the flow in the
17 See Minn. R. 7080. 0125 subpart 2. 18 http://www.dnr.state.mn.us/waters/watermgmt_section/appropriations/interference.html (retrieved April 25, 2007). 19 See generally Minn. Stat. §103H. 20 http://www.pca.state.mn.us/water/basins/mnriver/watershed-blueearth.pdf (retrieved August 29, 2007).

Feist Livestock, LLC Feedlot Expansion Environmental Assessment Clark Township, Minnesota 16 Worksheet
Minnesota River at Mankato, while delivering 55 percent of the suspended sediment load and 69 percent of the nitrate nitrogen load.19 Brush Creek, located within the minor watersheds containing land application sites in Keister Township, is listed as impaired for biological integrity affecting fish.21 The activities related to the surface water impairments in the Blue Earth River watershed are a combination of point source (e.g., wastewater treatment plants) and non-point source (e.g., agricultural activities) discharges. The proposed project is not expected to contribute to the existing water quality issues discussed above. The project will minimize its potential impact to surface water quality through the land application activities discussed in Item 5 of the EAW, which include storage in an engineered concrete structure, fall land application, injection of manure, and observation of setback distances, as well as the use of an agronomic rate for land application. These practices will be included in the project’s NPDES/SDS Permit, which requires a producer to operate a facility under a “no discharge” standard. As a result, the MPCA concludes that the project will not contribute to an adverse cumulative potential effect of surface water quality. Air Quality Impacts Air quality computer modeling was performed that estimated ambient air concentrations for hydrogen sulfide, ammonia, and selected odorous gases from the proposed project. The model estimated pollutant concentrations from the proposed project, along with an ambient hydrogen sulfide and ammonia background concentration, to account for any off-site air emission sources or activities. A background concentration is the amount of pollutants already in the air from other sources and is used in this evaluation to address cumulative air effects. Hydrogen sulfide and ammonia may be present from other feedlot barns, the agitation, pump out and land application activities of a neighboring feedlot, or the pumping of a municipal wastewater treatment facility. Air emissions from other emission sources may affect the compliance status of the proposed facility, or impact downwind human and environmental receptors. The background level for hydrogen sulfide that was used in the computer model was derived from monitoring at other feedlot facilities in Minnesota. The modeling adds the background air pollutant concentration to the emission concentration predicted from the proposed project. The results of the modeling study indicate that no significant air quality impacts are expected from the proposed project and that the proposed project will not contribute to any adverse cumulative potential effects of air quality (Exhibit 8).
Land Use The land identified for the purpose of this project includes the site of the project proper, along with the land application acreage. The overall project, including land application sites, is reviewed in context to other existing or proposed projects within the watershed. Three issues have been identified with respect to land resources – wildlife habitat, row crop agriculture, and traffic.
Habitat There is a competing issue in rural landscapes to maintain a balance between agricultural demands and preserving natural resources. In this case, the location of the proposed project is in an area that is currently being used for agricultural production. All land, including land application areas, has been used for agricultural purposes for more than 20 years. The proposed project will not displace or disrupt any wildlife habitat and, as a result, will not contribute to an adverse cumulative potential effect related to habitat fragmentation and loss.
Row Crop Agriculture The project is designed to utilize existing row crop feedstock, rather than to cultivate fallow or marginal land to meet crop use needs. As a result, existing row crop agriculture practices are not expected to create an additional new impact to environmental quality. There is no indication that any other projects in the area will be converting fallow or marginal cropland into row crop production within the project area. The proposed project will not modify land use and will not contribute to an adverse cumulative potential effect related to row crop agriculture.
Traffic
21 http://www.pca.state.mn.us/publications/maps/tmdl-gb-conv-06.pdf (retrieved August 29, 2007).


Air Quality Modeling Report
Feist Livestock
Hog Feedlot Expansion
Faribault County
Clark Township
NE � Section 15
October 2007
EXHIBIT 8

Table of Contents
......................................................................................................................................Introduction 1
............................................................................................................General Modeling Approach 3
..............................................................................................................................Site Descriptions 6
.......................................................................................................................Feist Hog Feedlot 6
..................................................................................................................................Feedlot #1 9
..................................................................................................................................Feedlot #2 9
..................................................................................................................................Feedlot #3 9
................................................................................................................................Feedlot #4 11
................................................................................................................................Feedlot #5 11
........................................................................................................................Gas Emission Rates 13
................................................................................................................................Hog Barns 13
.............................................................................................................................Cattle Barns 14
......................................................................Hydrogen Sulfide at Property Lines and Neighbors 14
...................................................................................Ammonia at Property Lines and Neighbors 16
..........................................................................Odorous Gases at Property Lines and Neighbors 17
.........................................................Total VOOCs at Northeast Property Line and Neighbor AU 18
........................................................................................................................................Summary 19

Introduction
Based on a protocol reviewed and approved by
the Minnesota Pollution Control Agency (MPCA)
on September 27, 2007, air quality modeling es-
timated the concentrations of hydrogen sulfide,
ammonia, and selected volatile odorous organic
compounds at the property lines for the expanded
Feist Livestock (Feist) hog feedlot and at 30 of
the expanded feedlot’s nearest neighbors. Pres-
ently, the feedlot consists of one 2,400-head hog-
finishing barn and one 200-head hog-finishing
barn. The proposed expansion would add a second
2,400-head hog-finishing barn. The modeling also
considered the gaseous emissions from five
neighboring feedlots. The locations of the Feist
feedlot and the five neighboring feedlots are pro-
vided in Figure 1.
The following atmospheric concentrations were
calculated:
1. the maximum hourly hydrogen sulfide
concentration at the expanded feedlot’s
property lines to assess the potential to
comply with Minnesota’s ambient air
quality standard for hydrogen sulfide of
30 ppb (v/v);
2. the maximum 13-week time-averaged
hydrogen sulfide concentration at 30 of
the expanded feedlot’s nearest neighbors
to assess the potential to exceed Minne-
sota’s subchronic inhalation Health Risk
Value (iHRV) of 10 �g/m3;
3. the maximum hourly ammonia concentra-
tion at the expanded feedlot’s property
lines to assess the potential to exceed
Minnesota’s acute iHRV for ammonia of
3,200 �g/m3;
4. the maximum annual-averaged ammonia
concentration at 30 of the expanded feed-
lot’s nearest neighbors to assess the po-
tential to exceed Minnesota’s chronic
iHRV for ammonia of 80 �g/m3; and
5. the maximum hourly concentrations of
selected odorous organic gases (including
n-butyric acid and para-cresol) at the ex-
panded feedlot’s property lines and at 30
of the expanded feedlot’s nearest neigh-
bors to access the potential for off-site
odor episodes.
The above calculations were performed using the
CALPUFF air quality model, based on 5 years of
historical meteorological data.
The modeling results suggest that the expanded
Feist feedlot will comply with the Minnesota am-
bient air quality standard for hydrogen sulfide.
CALPUFF predicted a maximum hourly property-
line hydrogen sulfide concentration of 5.29 ppb
(v/v). When a background concentration of
17 ppb (v/v) is added to the CALPUFF prediction,
the maximum property-line hydrogen sulfide con-
centration is 22.29 ppb (v/v), which is below the
ambient standard of 30 ppb (v/v).
The CALPUFF results indicate that the expanded
Feist feedlot and the five neighboring feedlots
will not create exceedences of the subchronic hy-
drogen sulfide iHRV at the neighboring resi-
dences. The estimated maximum 13-week time-
averaged hydrogen sulfide concentration for the
feedlots’ neighbors is 0.56 �g/m3. When a back-
ground concentration of 1.00 �g/m3 is added to
the CALPUFF estimate, the maximum 13-week
neighbor hydrogen sulfide concentration is
1.56 �g/m3, which is below the subchronic hy-
drogen sulfide iHRV of 10 �g/m3.
The modeling results suggest that the expanded
Feist feedlot will not create exceedences of the
acute ammonia iHRV. CALPUFF predicted a
maximum hourly property-line ammonia concen-
tration of 929 �g/m3. When a background concen-
tration of 148 �g/m3 is added to the CALPUFF
prediction, the maximum property-line ammonia
concentration is 1,077 �g/m3, which is below the
acute ammonia iHRV of 3,200 �g/m3.
1 Feist Hog Feedlot Report

2 Feist Hog Feedlot Report
Figure 1. Modeled locations of the Feist hog feedlot and the five neighboring feedlots.

The CALPUFF results indicate that the expanded
Feist feedlot and the neighboring five feedlots
will create exceedences of the chronic ammonia
iHRV at two neighboring residences. These two
residences are almost entirely impacted by the
ammonia emitted by their own hog barns. The
estimated maximum one-year time-averaged am-
monia concentration for the feedlot residences is
106.00 �g/m3. When a background ammonia con-
centration of 5.72 �g/m3 is added to the CAL-
PUFF estimate, the maximum annual ammonia
concentration for a neighbor is 111.72 �g/m3,
which is above the chronic ammonia iHRV of
80 �g/m3.
Excluding all residences on feedlots, the esti-
mated maximum annual ammonia concentration
for the nearest neighbors is 10.40 �g/m3. When a
background ammonia concentration of 5.72 �g/m3
is added to the CALPUFF estimate, the maximum
annual ammonia concentration for a non-feedlot
residence is 16.12 �g/m3, which is below the
chronic ammonia iHRV of 80 �g/m3.
Thus, the modeling results for the expanded Feist
feedlot suggest compliance with the hydrogen
sulfide air quality standard and no exceedences of
the acute ammonia iHRV at the feedlot’s property
lines. The modeling also suggests that the ex-
panded Feist feedlot and the five neighboring
feedlots will not create exceedences of the sub-
chronic hydrogen sulfide iHRV and chronic am-
monia iHRVs at the nearest residences not located
on feedlots.
General Modeling Approach
The modeling approach considered the gaseous
emissions from the expanded Feist hog feedlot
and the five neighboring feedlots as the only sig-
nificant and quantifiable emission sources within
a 3-mile by 3-mile grid. The air quality impacts
associated with the six feedlots were explicitly
modeled. The expanded Feist feedlot was located
in the middle square mile of the grid. The air
quality impacts associated with any other sources
in the modeled 3-mile by 3-mile grid were con-
sidered implicitly as contributors to the back-
ground concentrations that are added to the mod-
eling results. Hence, the background concentra-
tions of hydrogen sulfide and ammonia include
the impacts associated with sources such as small
feedlots, septic tank vents, fertilizer and manure
application to cropland, and wetlands.
The CALPUFF (version 6.112, level 060412)
air quality model1,2,3 was used to estimate the
property-line and nearest-neighbor odorous gas
concentrations. The estimated concentrations
were based on historical wind speeds, wind direc-
tions, atmospheric stabilities, and rural mixing
heights. The historical weather data consisted of
five years (1985-1989) of surface meteorological
data from the National Weather Surface station in
Rochester, Minnesota and of upper air data from
the National Weather Surface station in St. Cloud,
Minnesota. The surface and upper air weather
data sets were combined into an ISC-type mete-
orological file by the U.S. Environmental Protec-
tion Agency’s (EPA’s) PCRAMMET software.4
The surface and upper air weather data sets were
3 Feist Hog Feedlot Report
1 U.S. EPA. 1995. A User’s Guide for the CALPUFF Dispersion Model. U.S. Environmental Protection Agency, Office of Air Quality Planning and Standards, Research Triangle Park, NC, EPA-454/B-95-006.
2 Scire J. S., Strimaitis D. G., and Yamarino R. J. 2000. A User’s Guide for the CALPUFF Dispersion Model (Ver-sion 5). Earth Tech, Inc., Concord, MA. 496 pp.
3 U.S. EPA. 2003. Revision to the Guideline for Air Quality Models. 40 CFR Ch. 1, Part 51, Appendix W (April 15, 2004 Edition).
4 U.S. EPA. 1999. PCRAMMET User’s Guide. U.S. Environmental Protection Agency, Office of Air Quality Plan-ning and Standards, Research Triangle Park, NC. EPA-454-B-96-001 (Revised June 1999).

obtained from the EPA’s Support Center for Regu-
latory Air Models.5
Maximum one-hour, 13-week, and annual aver-
age concentrations were calculated. Rural disper-
sion coefficients were used to characterize atmos-
pheric mixing. The modeling assumed no decay
of any modeled gas due to chemical reactions.
The modeled receptor height was 0 meters, i.e.,
ground level. A flat terrain was assumed. All
modeled property-line and nearest-neighbor re-
ceptors were defined as discrete receptors.
Property-line receptors were less than or equal to
25 meters apart. An arbitrary Cartesian coordinate
system (x, y) was used with the southwest corner
of Section 15 (Clark Township, Faribault County)
as the origin (0, 0). Positive values of x represent
distance east of the origin. Positive values of y
represent distance north of the origin.
To assess the potential for environmental im-
pacts, the atmospheric concentrations of hydrogen
sulfide, ammonia, and selected volatile odorous
organic compounds (VOOC) generated by the air
quality modeling were compared to air quality
standards, inhalation Health Risk Values (iHRVs),
and published odor threshold concentrations. The
direct comparison of model-generated concentra-
tions to these environmental threshold concentra-
tions does not consider the impact of different
averaging times. EPA guidelines do not allow
concentrations to be time averaged for time peri-
ods less than an hour.6 This is important because
the Minnesota ambient air quality standards for
hydrogen sulfide are based on average concentra-
tions over a 30-minute time period and because
the published odor intensity correlations are often
based on instantaneous measurements. For exam-
ple, an hourly model-generated hydrogen sulfide
concentration of 29 ppb (v/v) may contain a half-
hour average concentration that exceeds the
30 ppb standard. Also, a compound’s odor inten-
sity that an odor panelist may find to be merely
detectable in a short-term field measurement
could be annoying if present for an hour or longer.
The background concentrations of hydrogen
sulfide and ammonia provided in Table 1 were
added to the CALPUFF estimated concentrations
as described in EPA guidelines.7 The listed con-
centrations represent background concentrations
for rural Minnesota. The listed 17-ppb back-
4 Feist Hog Feedlot Report
5 www.epa.gov/scram001
6 U.S. EPA. 2003. Revision to the Guideline for Air Quality Models. 40 CFR Ch. 1, Part 51, Appendix W (April 15, 2004 Edition).
7 Ibid.
Table 1. Background concentrations.
GasHourly
BackgroundConcentration
13-WeekBackground
Concentration
AnnualBackground
Concentration
Hydrogen Sulfide 17 ppb (v/v)(24.3 �g/m3)
0.70 ppb (v/v)(1.00 �g/m3)
Not Required
Ammonia 208 ppb (v/v)(148 �g/m3)
Not Required 8.07 ppb (v/v)(5.72 �g/m3)

ground hydrogen sulfide concentration is appro-
priate when assessing a feedlot’s potential to
comply with the 30-ppb standard. A background
concentration of 18 ppb should be used when as-
sessing the potential to comply with the 50-ppb
hydrogen sulfide standard.
The background concentrations listed in Table 1
are not the time-averaged concentrations obtained
from monitoring. Instead, the listed concentra-
tions reflect the monitored data expressed in the
terms of the “exceedence or violation condition”
for the corresponding iHRV guideline or ambient
standard. For example, the background 208-ppb
ammonia concentration for the acute ammonia
iHRV represents the maximum hourly concentra-
tion that occurred within the entire length of
monitoring. This is the appropriate interpretation
of background for the acute ammonia iHRV, be-
cause the guidance is concerned with any poten-
tial exceedence of the iHRV. Also, the 17-ppb
hydrogen sulfide background represents the
third highest 30-minute concentration that oc-
curred within any 5-day period. This is appro-
priate, because the ambient hydrogen sulfide
standard defines a violation as the third ex-
ceedence of 30-ppb within any 5-day period.
To assess the potential for odor episodes, the
estimated atmospheric concentrations of hydrogen
sulfide, ammonia, and the VOOCs were compared
to each gas’s reported odor threshold concentra-
tion. The odor threshold concentration is defined
as the gas-phase concentration at which 50 per-
cent of the population can detect the gas’s odor.
For this presentation, odor number is defined as
the ratio of the estimated atmospheric concentra-
tion for a specific odorous gas divided by the
gas’s odor threshold concentration. An odor num-
ber equal to 1 suggests that 50 percent of the
population can detect the estimated atmospheric
concentration for a specific gas. An odor number
greater than 1 suggests that more than 50 percent
of the population can detect the gas, while a value
less than 1 indicates that less than 50 percent of
the population can detect the gas. Typically, an
odor number below about 0.1 suggests that less
than 1 percent of the population can detect the
gas.8 The odor threshold concentrations used in
this assessment are presented in Table 2.
The odor-number assessment of odor intensity
does not consider the interactions between gases.
Gas mixtures can intensify or mitigate certain
odors. The Zahn correlation9,10 was used to ac-
count for the odor intensity associated with the
mixture of gases released from the hog barn pits.
The total concentration of volatile odorous or-
ganic compounds (VOOCs) required for the Zahn
correlation was calculated from the modeled
concentrations of the 12 organic gases listed in
Table 2.
5 Feist Hog Feedlot Report
8 Nagy G. Z. 1991. The odor impact model. Journal of Air & Waste Management Association 41(10): 1360-1362.
9 Zahn J. A. 1997. Swine odor and emissions from pork production. In: McGuire K. (ed.), Environmental Assurance Program, National Pork Producers Council, Des Moines, IA, pp. 20-122.
10 Zahn J. A., Hatfield J. L., Laird D. A., Hart T. T., Do Y. S., and DiSpirito A. A. 2001. Functional classification of swine manure management systems based on effluent and gas emission characteristics. Journal of Environmental Quality 30: 635-647.

Table 2. Odor threshold concentrations for the modeled gases.11
Odorous Gas
Odor Threshold Concentration
(ppb, v/v)
Acetic Acid 200
n-Propanoic Acid 17
iso-Butyric Acid 11
n-Butyric Acid 0.69
iso-Valeric Acid 4.8
n-Valeric Acid 0.28
iso-Caproic Acid 7.7
n-Caproic Acid 21
n-Heptanoic Acid 5
Phenol 76
para-Cresol 0.25
para-Ethyl Phenol 1.2
Hydrogen Sulfide 3.7
Ammonia 1,500
Site Descriptions
Feist Hog Feedlot
The Feist presently consists of one 2,400-head
hog-finishing barn and one 200-head hog-
finishing barn. The proposed expansion would
add a second 2,400-head finishing barn. The
physical characteristics of the existing and pro-
posed hog-finishing barns are provided in Table 3.
The modeled locations of the barns are provided
in Figure 2. The setback distances from the prop-
erty lines range from 486 to 2,735 feet.
The air quality modeling estimated the odorous
gas concentrations at the 30 neighboring resi-
dences shown in Figure 3.
The city of Wells, Minnesota is located north-
west of the Feist feedlot. Within the modeled 3-
mile by 3-mile grid, Well’s residents are located
within the 1-mile by �-mile rectangle illustrated
in Figure 3. A 33-row by 17-column grid of dis-
crete receptors with a spacing of 50 meters repre-
sented the locations of the town’s residents.
6 Feist Hog Feedlot Report
11 Minnesota Environmental Quality Board. 1999. A Summary of the Literature Related to the Social, Environmen-tal, Economic and Health Effects: Volume 2. Generic Environmental Impact Statement on Animal Agriculture, Prepared by the University of Minnesota, September 1999. Table 2 presents the geometric mean of the lower and upper odor threshold concentrations obtained from this reference.
Hog-Finishing
Barn
BarnLength(feet)
BarnWidth(feet)
BarnHeight(feet)
Number ofHoused
Finishing Pigs
Barn #1 (existing) 65 41 17 200
Barn #2 (existing) 230 82 22 2,400
Barn #2 (proposed) 230 82 22 2,400
Table 3. Dimensions and capacities of the hog-finishing barn at the expanded Feist feedlot.

7 Feist Hog Feedlot Report
(2640', 1320')
2735'
80'
3960'
2731' 11"
327'
2455'
2607'
N
E
S
W
Barn #2
(existing)
Barn #3
(proposed)
Barn #1
(existing) 50'
700'
486' 6"
Figure 2. Modeled emission sources and property lines for the expanded Feist hog feedlot. The blue-filled squares represent the square volume subsources used to characterize the emissions from the barns. The red-bordered polygon represents the feedlot’s property lines.

8 Feist Hog Feedlot Report
Figure 3. Modeled locations of the Feist hog feedlot, the five neighboring feedlots (not la-beled), and 30 of the Feist feedlot’s nearest neighbors. Residences AC, AD, AU, BB, and BD are located on feedlots. The green-shaded rectangle represents the Wells residences located within the modeled 3-mile by 3-mile grid.

Feedlot #1
Feedlot #1 consists of five hog barns. The mod-
eled locations of the hog barns are provided in
Figure 4. The physical characteristics of the barns
are provided in Table 4.
(4013', 6428')
N
E
S
W
128'
150'
35'
255'
500'
492'
Gestation #1
Nursery #1
Gestation #2
Gestation #3
Gestation #4
Figure 4. Modeled gaseous emission sources for Feedlot #1.
Feedlot #2
Feedlot #2 consists of six hog barns. The mod-
eled locations of the hog barns are provided in
Figure 5. The location of Nursery #1 could not be
determined from the 2003 aerial photograph of
the area. Hence, the location of the barn is
guessed. The physical characteristics of the barns
are provided in Table 5.
(6558', 6060')
N
E
S
W
100' 100'
100'
250'
140'
385'
770'
601'
Finishing #1 Nursery #1 Finishing #2
Nursery #2
Finishing #3
Finishing #4
Figure 5. Modeled gaseous emission sources for Feedlot #2.
Feedlot #3
Feedlot #3 consists of seven hog barns. The
modeled locations of the hog barns are provided
in Figure 6. The locations of the two nursery
barns could not be determined from the 2003 aer-
ial photograph of the area. Hence, the locations of
the two nursery barns are guessed. The physical
characteristics of the barns are provided in Ta-
ble 6.
(-1707', -5444')
N
E
S
W
45'
180'100'
Finishing #1
Finishing #2 Finishing #3
Nursery #1 Nursery #2
Finishing #4 Finishing #5
100'
660'
450'
Figure 6. Modeled gaseous emission sources for Feedlot #3.
9 Feist Hog Feedlot Report

10 Feist Hog Feedlot Report
Table 4. Dimensions and capacities of the hog barns at Feedlot #1.
HogBarn
BarnLength(feet)
BarnWidth(feet)
BarnHeight(feet)
Number ofHoused
Pigs
Gestation #1 40 18 14 50 sows
Gestation #2 72 58 19 25 sows
Gestation #3 72 38 17 100 sows
Gestation #4 40 12 13 50 sows
Nursery #1 44 18 14 300
Table 5. Dimensions and capacities of the hog barns at Feedlot #2.
HogBarn
BarnLength(feet)
BarnWidth(feet)
BarnHeight(feet)
Number ofHoused
Pigs
Nursery #1 160 41 17 725
Nursery #2 80 40 17 450
Finishing #1 160 41 17 725
Finishing #2 160 41 17 725
Finishing #3 120 30 16 450
Finishing #4 120 30 16 450
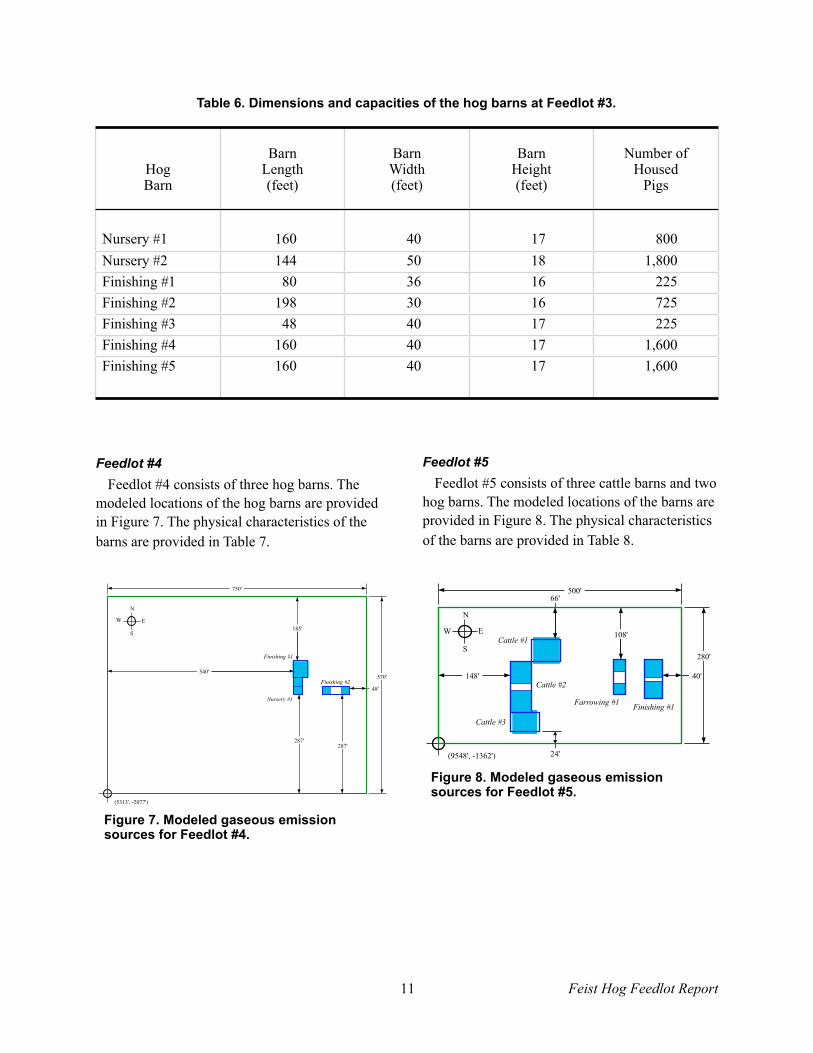
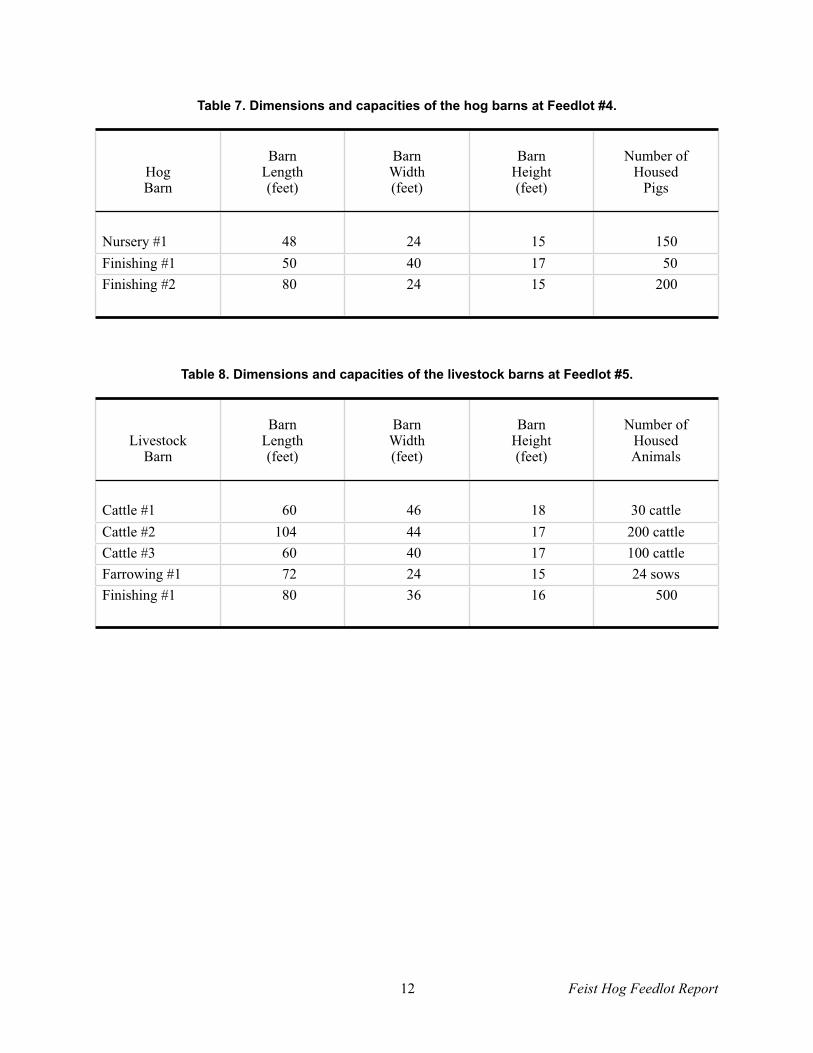
Feedlot #4
Feedlot #4 consists of three hog barns. The
modeled locations of the hog barns are provided
in Figure 7. The physical characteristics of the
barns are provided in Table 7.
(5313', -2077')
N
E
S
W
185'
287'287'
540'
Finishing #1
Nursery #1
Finishing #2
750'
570'
48'
Figure 7. Modeled gaseous emission sources for Feedlot #4.
Feedlot #5
Feedlot #5 consists of three cattle barns and two
hog barns. The modeled locations of the barns are
provided in Figure 8. The physical characteristics
of the barns are provided in Table 8.
(9548', -1362')
66'
24'
148'
N
E
S
W
500'
Cattle #1
Cattle #2
Cattle #3
Farrowing #1
108'
40'
Finishing #1
280'
Figure 8. Modeled gaseous emission sources for Feedlot #5.
11 Feist Hog Feedlot Report
Table 6. Dimensions and capacities of the hog barns at Feedlot #3.
HogBarn
BarnLength(feet)
BarnWidth(feet)
BarnHeight(feet)
Number ofHoused
Pigs
Nursery #1 160 40 17 800
Nursery #2 144 50 18 1,800
Finishing #1 80 36 16 225
Finishing #2 198 30 16 725
Finishing #3 48 40 17 225
Finishing #4 160 40 17 1,600
Finishing #5 160 40 17 1,600
12 Feist Hog Feedlot Report
Table 7. Dimensions and capacities of the hog barns at Feedlot #4.
HogBarn
BarnLength(feet)
BarnWidth(feet)
BarnHeight(feet)
Number ofHoused
Pigs
Nursery #1 48 24 15 150
Finishing #1 50 40 17 50
Finishing #2 80 24 15 200
Table 8. Dimensions and capacities of the livestock barns at Feedlot #5.
LivestockBarn
BarnLength(feet)
BarnWidth(feet)
BarnHeight(feet)
Number ofHousedAnimals
Cattle #1 60 46 18 30 cattle
Cattle #2 104 44 17 200 cattle
Cattle #3 60 40 17 100 cattle
Farrowing #1 72 24 15 24 sows
Finishing #1 80 36 16 500

Gas Emission Rates
Hog Barns
The hog barns at the expanded Feist feedlot and
the five neighboring feedlots were modeled as
sources of hydrogen sulfide, ammonia, and
VOOCs. For the hog-finishing barns, the emission
rates of hydrogen sulfide and 12 VOOCs from the
manure pits were estimated using the PitEmis-
sions software (version 4.1) based on the chemi-
cal characteristics of manure stored in pits located
beneath the hog-finishing barns. PitEmissions is
based on the mass-transfer algorithms recom-
mended by the EPA to estimate emission rates.12
For west-central Minnesota, the typical character-
istics of stored hog manure are provided in Ta-
ble 9. For the gestation, farrowing, and nursery
barns at the neighboring feedlots, the emission
rates for hydrogen sulfide and the VOOCs were
estimated based on the emission flux rates ob-
tained from a hog-breeding site near Hancock,
Minnesota13 and on the floor surface area of the
modeled barn.
Table 9. Chemical characteristics of manure in pitted hog-finishing barns.14
Parameter Units Value
Temperature °C 10.5
pH -log10[H+] 7.2
Volatile Acids mg HOAc/L 19,000
Phenolics mg/L 64.2
The ammonia emission rate for the hog-
finishing barns were based on the finishing-
pig ammonia emission rate factor of
3.7 kg NH3/head/yr.15 This emission factor repre-
sents the ammonia emissions on an annual basis.
The annual ammonia emission rates for the far-
rowing and gestation barns were based on the
“stable + manure” ammonia emission factor of
8.09 kg NH3/sow/year.16 Battye et al. (1994) does
not provide an ammonia emission factor for nurs-
ery pigs. However, an emission factor of
2.42 kg NH3/head/yr for breeding sows of 20-
50 kg is provided. This lower value was used as
the ammonia emission factor for nursery pigs. To
13 Feist Hog Feedlot Report
12 U.S. EPA. 1994. Air Emissions Models for Waste and Wastewater. U.S. Environmental Protection Agency, Office of Air Quality Planning and Standards, Research Triangle Park, NC, EPA-453/R-94-080A.
13 MPCA. 2003. Hancock Pro-Pork Hog Feedlot Project. Final Environmental Impact Statement. Minnesota Pollu-tion Control Agency, September 15, 2003.
14 Ibid.
15 U.S. EPA. 2002. Review of Emissions Factors and Methodologies to Estimate Ammonia Emissions from Animal Waste Handling. U.S. Environmental Protection Agency, Office of Research and Development, Research Triangle Park, NC, EPA-600/R-02-017.
16 Battye R., Battye W., Overcash C. and Fudge S. 1994. Development and selection of ammonia emission factors. Final Report. Prepared by EC/R Incorporated, Durham, NC for the U. S. Environmental Protection Agency, Of-fice of Research and Development, Washington D.C., 112 pp.
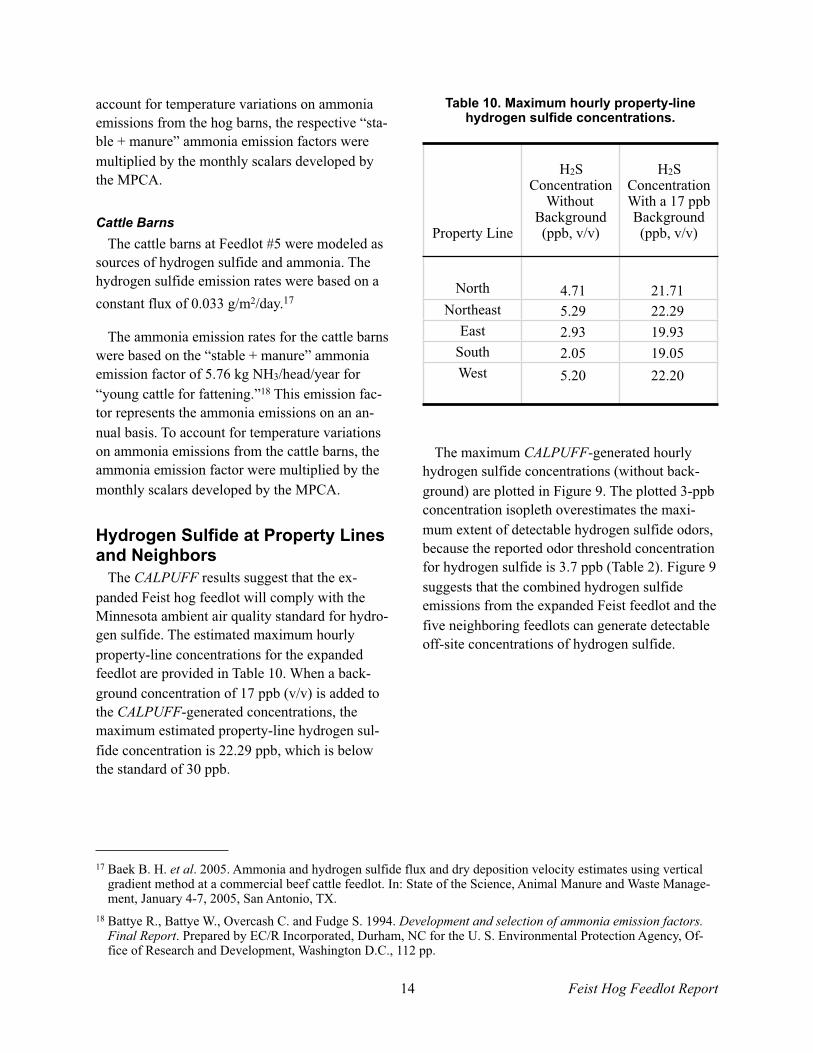
account for temperature variations on ammonia
emissions from the hog barns, the respective “sta-
ble + manure” ammonia emission factors were
multiplied by the monthly scalars developed by
the MPCA.
Cattle Barns
The cattle barns at Feedlot #5 were modeled as
sources of hydrogen sulfide and ammonia. The
hydrogen sulfide emission rates were based on a
constant flux of 0.033 g/m2/day.17
The ammonia emission rates for the cattle barns
were based on the “stable + manure” ammonia
emission factor of 5.76 kg NH3/head/year for
“young cattle for fattening.”18 This emission fac-
tor represents the ammonia emissions on an an-
nual basis. To account for temperature variations
on ammonia emissions from the cattle barns, the
ammonia emission factor were multiplied by the
monthly scalars developed by the MPCA.
Hydrogen Sulfide at Property Lines and Neighbors
The CALPUFF results suggest that the ex-
panded Feist hog feedlot will comply with the
Minnesota ambient air quality standard for hydro-
gen sulfide. The estimated maximum hourly
property-line concentrations for the expanded
feedlot are provided in Table 10. When a back-
ground concentration of 17 ppb (v/v) is added to
the CALPUFF-generated concentrations, the
maximum estimated property-line hydrogen sul-
fide concentration is 22.29 ppb, which is below
the standard of 30 ppb.
Table 10. Maximum hourly property-line hydrogen sulfide concentrations.
Property Line
H2SConcentration
WithoutBackground(ppb, v/v)
H2SConcentrationWith a 17 ppb Background(ppb, v/v)
North 4.71 21.71
Northeast 5.29 22.29
East 2.93 19.93
South 2.05 19.05
West 5.20 22.20
The maximum CALPUFF-generated hourly
hydrogen sulfide concentrations (without back-
ground) are plotted in Figure 9. The plotted 3-ppb
concentration isopleth overestimates the maxi-
mum extent of detectable hydrogen sulfide odors,
because the reported odor threshold concentration
for hydrogen sulfide is 3.7 ppb (Table 2). Figure 9
suggests that the combined hydrogen sulfide
emissions from the expanded Feist feedlot and the
five neighboring feedlots can generate detectable
off-site concentrations of hydrogen sulfide.
14 Feist Hog Feedlot Report
17 Baek B. H. et al. 2005. Ammonia and hydrogen sulfide flux and dry deposition velocity estimates using vertical gradient method at a commercial beef cattle feedlot. In: State of the Science, Animal Manure and Waste Manage-ment, January 4-7, 2005, San Antonio, TX.
18 Battye R., Battye W., Overcash C. and Fudge S. 1994. Development and selection of ammonia emission factors. Final Report. Prepared by EC/R Incorporated, Durham, NC for the U. S. Environmental Protection Agency, Of-fice of Research and Development, Washington D.C., 112 pp.

3
3
3
3
8
-1
0
1
2
-1 0 1 2
North/SouthDistance (miles)
EEast/West Distance (miles)
Figure 9. Maximum CALPUFF-generated hourly hydrogen sulfide concentrations in ppb (v/v) for the expanded Feist feedlot and the five neighboring feedlots. The con-tour lines represent 3 and 8 ppb (v/v) of hydrogen sulfide. The plotted concentra-tions do not include the 17-ppb back-ground hydrogen sulfide concentration. The point (0, 0) is the southwest corner of Section 15.
The CALPUFF results also suggest that the
combined emissions from the expanded Feist
feedlot and the five neighboring feedlots will not
cause exceedences of the subchronic hydrogen
sulfide iHRV at 30 of the feedlots’ nearest neigh-
bors and within the City of Wells, MN. When a
background concentration of 1.00 �g/m3 is added
to the CALPUFF-generated concentrations, the
maximum 13-week hydrogen sulfide concentra-
tion for a neighbor is 1.56 �g/m3, which is below
the subchronic iHRV for hydrogen sulfide of
10 �g/m3. The estimated maximum 13-week time-
averaged hydrogen sulfide concentrations for each
of the modeled nearest neighbors are provided in
Table 11.
Table 11. Maximum 13-week H2S concentra-tions for neighbors. (* = feedlot residences)
Neighbor
H2SConcentration
WithoutBackground
(�g/m3)
H2SConcentrationWith a 1 �g/m3
Background(�g/m3)
AA 0.02 1.02
AB 0.01 1.01
AC* 0.07 1.07
AD* 0.56 1.56
AE 0.03 1.03
AF 0.01 1.01
AG 0.03 1.03
AH 0.03 1.03
AI 0.03 1.03
AJ 0.02 1.02
AK 0.02 1.02
AL 0.02 1.02
AM 0.01 1.01
AN 0.01 1.01
AO 0.01 1.01
AP 0.01 1.01
AQ 0.01 1.01
AR 0.01 1.01
AS 0.01 1.01
AT 0.02 1.02
AU* 0.32 1.32
AV 0.03 1.03
AW 0.01 1.01
AX 0.01 1.01
AY 0.01 1.01
AZ 0.01 1.01
BA 0.01 1.01
BB* 0.07 1.07
BC 0.01 1.01
BD* 0.15 1.15
City 0.01 1.01
15 Feist Hog Feedlot Report

Ammonia at Property Lines and Neighbors
The CALPUFF-generated maximum hourly
property-line ammonia concentrations are pro-
vided in Table 12. The highest estimated property-
line concentration with a background concentra-
tion of 148 �g/m3 is 1,077 �g/m3, which is below
the acute iHRV for ammonia of 3,200 �g/m3.
Thus, the modeling results suggest that the ex-
panded Feist feedlot will not result in exceedences
of the acute ammonia iHRV.
Table 12. Maximum hourly property-lineammonia concentrations.
Property Line
NH3
ConcentrationWithout
Background(�g/m3)
NH3
ConcentrationWith a
148 �g/m3 Background
(�g/m3)
North 521 669
Northeast 929 1,077
East 486 634
South 342 490
West 781 929
The maximum CALPUFF-generated hourly
ammonia concentrations (without background)
are plotted in Figure 10. The reported odor
threshold concentration for ammonia is
1,067 �g/m3 or 1,500 ppb v/v (Table 2). The plot-
ted 1,000-�g/m3 isopleth overestimates the maxi-
mum extent of detectable ammonia odors. Fig-
ure 10 suggests that detectable ammonia concen-
trations would be confined to within the Feist
feedlot’s property lines.
500
1,000500
500
1,000
500
5001,000
500
-1
0
1
2
-1 0 1 2
North/SouthDistance (miles)
East/West Distance (miles)
Figure 10. Maximum CALPUFF-generated hourly ammonia concentration in �g/m3 for the expanded Feist feedlot and the five neighboring feedlots. The contour lines represent 500 and 1,000 �g/m3 of ammonia. The plotted concentrations do not include the 148 �g/m3 background ammonia concentration. The point (0, 0) is the southwest corner of Section 15.
The CALPUFF results also suggest that the
combined emissions from the expanded Feist
feedlot and the five neighboring feedlots will not
cause exceedences of the chronic ammonia iHRV
at the 30 nearest neighbors, except at the resi-
dences located on Feedlot #2 (neighbor AD) and
Feedlot #3 (neighbor AU). Figure 10 suggests that
the ammonia concentrations estimated for neigh-
bors AD and AU are due to the ammonia emis-
sions from their own hog barns. The highest an-
nual ammonia concentration for a non-feedlot
neighbor with a background concentration of
5.72 �g/m3 is 16.12 �g/m3, which is below the
chronic ammonia iHRV of 80 �g/m3. The esti-
mated maximum 13-week time-averaged hydro-
gen sulfide concentrations for each of the mod-
eled nearest neighbors are provided in Table 13.
16 Feist Hog Feedlot Report

Table 13. Maximum annual NH3 concentrations for neighbors. (* = feedlot residences)
Neighbor
NH3
ConcentrationWithout
Background(�g/m3)
NH3
ConcentrationWith a 5.72 �g/m3
Background(�g/m3)
AA 5.80 11.52
AB 3.27 8.99
AC* 38.20 43.92
AD* 95.80 101.52
AE 4.87 10.59
AF 3.35 9.07
AG 4.61 10.33
AH 4.46 10.18
AI 9.54 15.26
AJ 4.11 9.83
AK 8.84 14.56
AL 7.10 12.82
AM 4.22 9.94
AN 5.79 11.51
AO 2.72 8.44
AP 3.57 9.29
AQ 3.72 9.44
AR 3.65 9.37
AS 5.22 10.94
AT 8.16 13.88
AU* 106.00 111.72
AV 10.40 16.12
AW 3.23 8.95
AX 4.40 10.12
AY 4.07 9.79
AZ 3.25 8.97
BA 2.89 8.61
BB* 21.40 27.12
BC 3.97 9.69
BD* 58.50 64.22
City 3.17 8.89
Odorous Gases at Property Lines and Neighbors
The CALPUFF modeling effort estimated the
atmospheric concentrations of selected odorous
gases at the property lines for the expanded Feist
and at 30 of the feedlot’s nearest neighbors. The
estimated maximum property-line concentrations
for the 6 gases with the highest concentrations
relative to their odor threshold concentration are
provided in Figure 11. The highest property-line
concentrations are for ammonia (1,300 ppb, with-
out background), hydrogen sulfide (5.29 ppb,
without background), propanoic acid (1.34 ppb),
n-butyric acid (0.78 ppb), para-cresol
(0.40 ppb),and n-valeric acid (0.13 ppb).
The corresponding odor numbers for the maxi-
mum property-line concentrations are provided in
Figure 12. The gases with an odor number greater
than 0.1 were para-cresol (1.6), hydrogen sulfide
(1.4), n-butyric acid (1.1), ammonia (0.9), and
n-valeric acid (0.5). Population response curves
suggest that 75 percent of the population could
detect the estimated maximum property-line para-
cresol concentration, 70 percent the hydrogen sul-
fide concentration, 57 percent the n-butyric acid
concentration, 42 percent the ammonia concentra-
tion, and 15 percent the n-valeric acid concentra-
tion.
Pro
pa
no
ic
Acid
Bu
tyric
Acid
Va
leric
Acid
pa
ra-
Cre
so
l
Hyd
rog
en
Su
lfid
e
Am
mo
nia
0.01
0.1
1
10
100
1,000
10,000
GasConcentration
(ppb, v/v)
Figure 11. Maximum hourly property-line concentrations.
17 Feist Hog Feedlot Report

Pro
pa
no
ic
Acid
Bu
tyric
Acid
Va
leric
Acid
pa
ra-
Cre
so
l
Hyd
rog
en
Su
lfid
e
Am
mo
nia
0.01
0.1
1
10
100
OdorNumber
Figure 12. Maximum hourly property-line odor numbers.
The estimated maximum hourly nearest-
neighbor concentrations (i.e., concentrations at
Neighbor AU) for the 6 gases with highest con-
centrations relative to their odor threshold con-
centration are provided in Figure 13. Neighbor Au
is located on Feedlot #3. The highest maximum
estimated hourly concentrations were for ammo-
nia (1,708 ppb, without background), hydrogen
sulfide (6.30 ppb, without background), propanoic
acid (1.47 ppb), n-butyric acid (0.86 ppb), para-
cresol (0.33 ppb), and n-valeric acid (0.17 ppb).
The calculated odor numbers corresponding to
the maximum hourly concentrations are provided
in Figure 14. The individual gases with an odor
number greater than 0.1 were hydrogen sulfide
(1.7), para-cresol (1.3), n-butyric acid (1.3), am-
monia (1.1), and n-valeric acid (0.6). The other
modeled gases are assumed to be non-detectable,
because their individual odor numbers were less
than 0.1. Population response curves suggest that
78 percent of the population could detect the es-
timated maximum neighbor hydrogen sulfide
concentration, 66 percent the para-cresol concen-
tration, 63 percent the n-butyric acid concentra-
tion, 58 percent the ammonia concentration, and
24 percent the n-valeric acid. The population re-
sponse curves assume the presence of individual
gases.
Pro
pa
no
ic
Acid
Bu
tyric
Acid
Va
leric
Acid
pa
ra-
Cre
so
l
Hyd
rog
en
Su
lfid
e
Am
mo
nia
0.01
0.1
1
10
100
1,000
10,000
GasConcentration
(ppb, v/v)
Figure 13. Maximum hourly concentrations at Neighbor AU.
Pro
pa
no
ic
Acid
Bu
tyric
Acid
Va
leric
Acid
pa
ra-
Cre
so
l
Hyd
rog
en
Su
lfid
e
Am
mo
nia
0.01
0.1
1
10
100
OdorNumber
Figure 14. Maximum hourly odor numbers at Neighbor AU.
Total VOOCs at Northeast Property Line and Neighbor AU
The empirical Zahn correlation relates the total
gas-phase volatile odorous organic compound
(VOOC) concentrations for the gases emitted
from manure storage facilities to the perceived
odor intensity as determined by odor panels. The
sum of the individual maximum VOOC concen-
trations from the CALPUFF modeling effort was
multiplied by 1.18 to account for all of the VOOC
gases included in the Zahn correlation. As indi-
cated in Figure 15, the maximum VOOC concen-
trations (with the 1.18 correction) obtained from
the CALPUFF modeling effort are 16.4 �g/m3 for
18 Feist Hog Feedlot Report
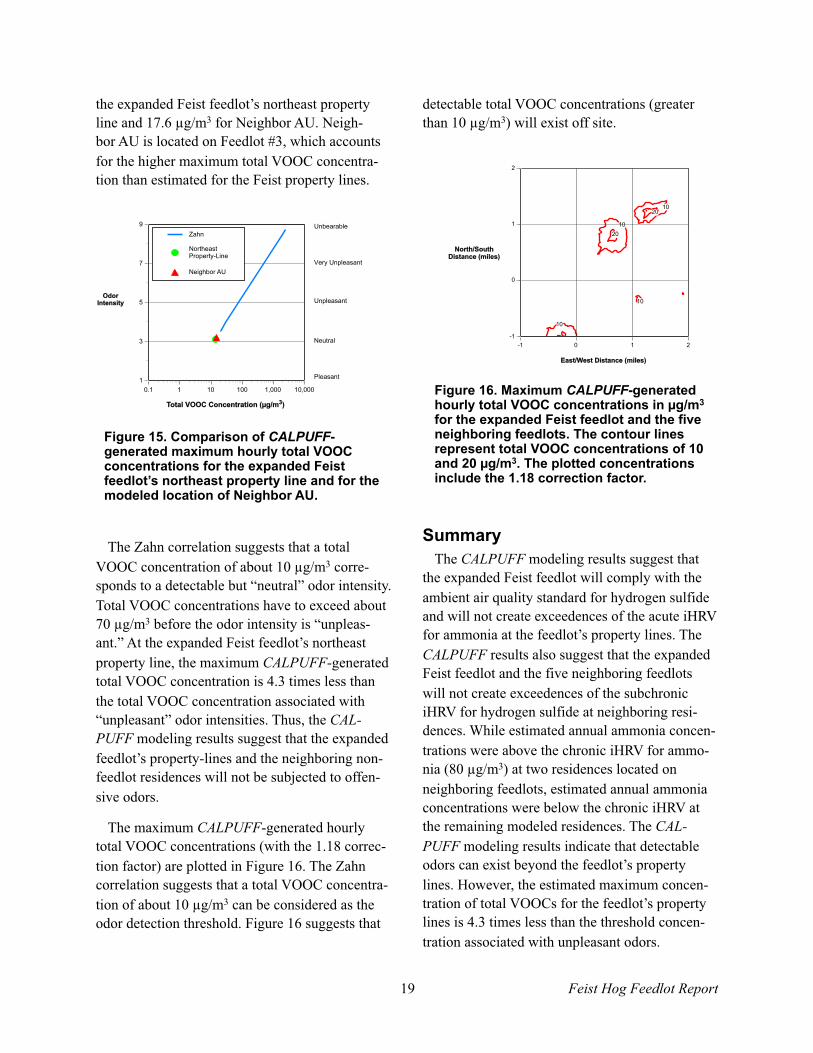
the expanded Feist feedlot’s northeast property
line and 17.6 �g/m3 for Neighbor AU. Neigh-
bor AU is located on Feedlot #3, which accounts
for the higher maximum total VOOC concentra-
tion than estimated for the Feist property lines.
1
3
5
7
9
0.1 1 10 100 1,000 10,000
OdorIntensity
Total VOOC Concentration (�g/m3)
Zahn
Northeast
Property-Line
Neighbor AU
Unbearable
Very Unpleasant
Unpleasant
Neutral
Pleasant
Figure 15. Comparison of CALPUFF-generated maximum hourly total VOOC concentrations for the expanded Feist feedlot’s northeast property line and for the modeled location of Neighbor AU.
The Zahn correlation suggests that a total
VOOC concentration of about 10 �g/m3 corre-
sponds to a detectable but “neutral” odor intensity.
Total VOOC concentrations have to exceed about
70 �g/m3 before the odor intensity is “unpleas-
ant.” At the expanded Feist feedlot’s northeast
property line, the maximum CALPUFF-generated
total VOOC concentration is 4.3 times less than
the total VOOC concentration associated with
“unpleasant” odor intensities. Thus, the CAL-
PUFF modeling results suggest that the expanded
feedlot’s property-lines and the neighboring non-
feedlot residences will not be subjected to offen-
sive odors.
The maximum CALPUFF-generated hourly
total VOOC concentrations (with the 1.18 correc-
tion factor) are plotted in Figure 16. The Zahn
correlation suggests that a total VOOC concentra-
tion of about 10 �g/m3 can be considered as the
odor detection threshold. Figure 16 suggests that
detectable total VOOC concentrations (greater
than 10 �g/m3) will exist off site.
10
10
20
10
1020
-1
0
1
2
-1 0 1 2
North/SouthDistance (miles)
East/West Distance (miles)
Figure 16. Maximum CALPUFF-generated hourly total VOOC concentrations in �g/m3 for the expanded Feist feedlot and the five neighboring feedlots. The contour lines represent total VOOC concentrations of 10 and 20 �g/m3. The plotted concentrations include the 1.18 correction factor.
Summary
The CALPUFF modeling results suggest that
the expanded Feist feedlot will comply with the
ambient air quality standard for hydrogen sulfide
and will not create exceedences of the acute iHRV
for ammonia at the feedlot’s property lines. The
CALPUFF results also suggest that the expanded
Feist feedlot and the five neighboring feedlots
will not create exceedences of the subchronic
iHRV for hydrogen sulfide at neighboring resi-
dences. While estimated annual ammonia concen-
trations were above the chronic iHRV for ammo-
nia (80 �g/m3) at two residences located on
neighboring feedlots, estimated annual ammonia
concentrations were below the chronic iHRV at
the remaining modeled residences. The CAL-
PUFF modeling results indicate that detectable
odors can exist beyond the feedlot’s property
lines. However, the estimated maximum concen-
tration of total VOOCs for the feedlot’s property
lines is 4.3 times less than the threshold concen-
tration associated with unpleasant odors.
19 Feist Hog Feedlot Report