Embed Size (px)
Citation preview

FEI Annual Review of 2017 Rates
Workshop
October 12, 2016
B-10

- 2 -
Agenda
PBR Overview and Initiatives Diane Roy Dawn Mehrer
Vice President, Regulatory Affairs Director, Customer Contact Centres
Revenue Requirements & Rates Jeff May Controller, Financial Accounting
Demand Forecast Methodology Review David Bailey Customer Energy and Forecasting Manager
LNG Update Mike Bains Darren Julyan
Business Development Manager Director, Gas Plant Operations & PMO
Service Quality Indicators (SQIs) James Wong John Himmel Dean Stevenson
Director, Strategic Initiatives & Budgeting Manager, Business Performance Director, OH&S and Technical Training
Open Question Period All
PBR Overview and Initiatives
Diane Roy, Vice President, Regulatory Affairs
Dawn Mehrer, Director, Customer Contact Centres

- 4 -
FEI Annual Review
PBR Term from 2014 to 2019 (Vancouver Island and Whistler starting in 2015)
2017 Delivery Rates Held at 2016 Levels
Formula-Driven Items (Earnings
Sharing)
Forecast Items (Flow-through
Deferral)
Service Quality
Indicators
Responsiveness to Customers Needs
Reliability and Safety

- 5 -
Approvals Sought • Delivery rate freeze for 2017, with revenue surplus applied to 2018
• Five deferral account requests: 2017 Rate Smoothing - new
All-Inclusive Code of Conduct/Transfer Pricing Policy regulatory proceeding - new
Cost of Capital Application - three year amortization period
Emissions Regulations - five year amortization period
Kingsvale-Oliver Reinforcement Project Feasibility Costs - discontinuation
• Rate Stabilization Deferral Account (RSDA) riders for 2017
• Phase-In Rate riders for 2017 for Mainland, Vancouver Island and Whistler customers
• Revenue Stabilization Adjustment Mechanism (RSAM) riders for 2017

- 6 -
Summary of PBR Results • 2016 Earnings Sharing Results Projection
O&M below formula by $11.1 million
Capital expenditures above formula by $13.8 million ($32.5 million cumulative) and 2 year cumulative dead band projected to be exceeded
2016 total earnings sharing of $5.1 million
• Major Initiatives for 2016 Phase 2 of Regionalization
Training and Development (Joint with FBC)
Online Service Application
• Service Quality All Service Quality Indicators were above threshold in 2015

- 7 -
Capital Expenditures under the PBR Decision
Annual 10% capital dead band Two year cumulative 15% capital dead band
Base Capital (2013/2014 Approved)
Inflation and 50% of Growth
Productivity Improvement Factor of 1.1%
Current Year Capital
From the Prior Year
- 8 -
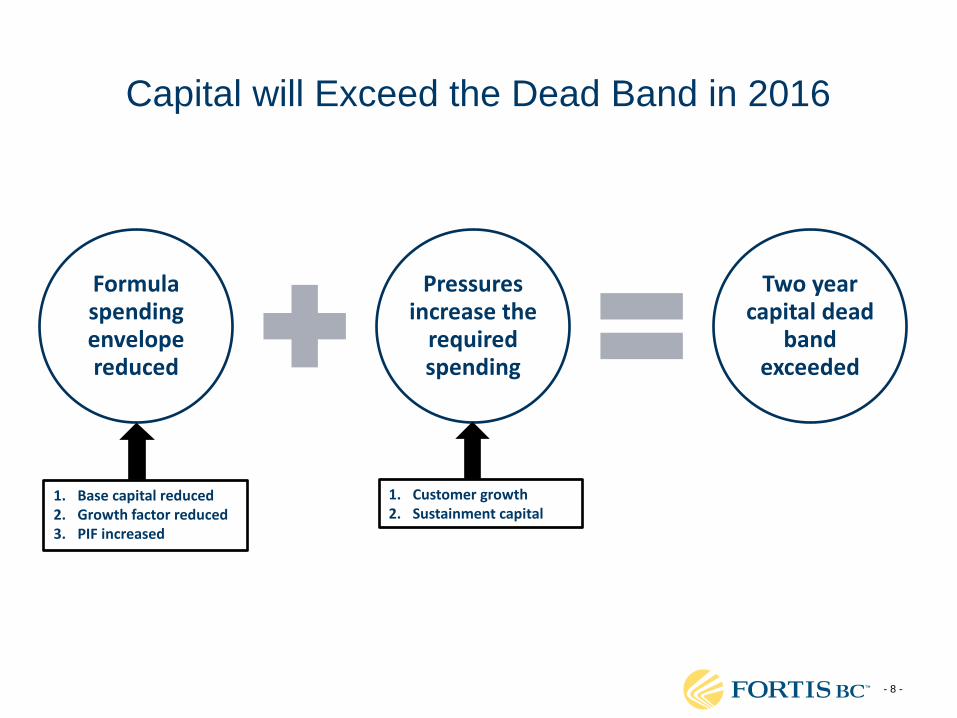
Capital will Exceed the Dead Band in 2016
Formula spending envelope reduced
Pressures increase the
required spending
Two year capital dead
band exceeded
1. Base capital reduced 2. Growth factor reduced 3. PIF increased
1. Customer growth 2. Sustainment capital

- 9 -
How the Capital Dead Band Works • Spending within the capital dead band is subject to
earnings sharing
• Spending outside of the capital dead band: Excluded from earnings sharing
Opening plant in service in the following year is adjusted up or down by the amount outside of the dead band
• Alternative to adjust (or “rebase”) the following years’ capital formula FEI’s recommendation is to not rebase the formula
- 10 -
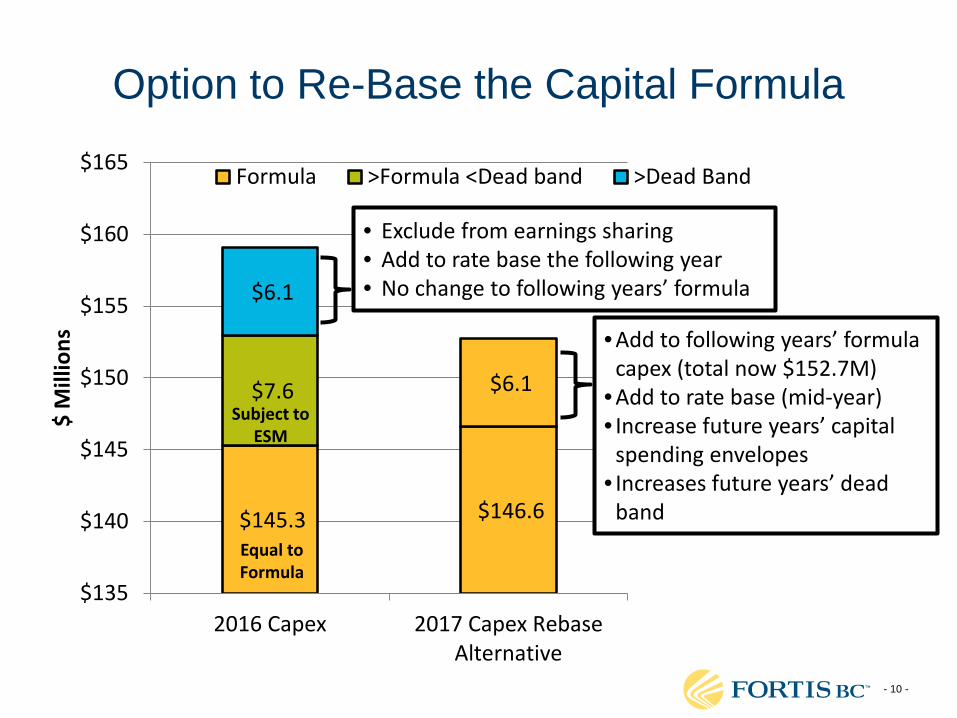
Option to Re-Base the Capital Formula
$145.3 $146.6
$7.6
$6.1
$6.1
$135
$140
$145
$150
$155
$160
$165
2016 Capex 2017 Capex RebaseAlternative
$ M
illio
ns
Formula >Formula <Dead band >Dead Band
• Exclude from earnings sharing • Add to rate base the following year • No change to following years’ formula
Equal to Formula
Subject to ESM
• Add to following years’ formula capex (total now $152.7M)
• Add to rate base (mid-year) • Increase future years’ capital
spending envelopes • Increases future years’ dead
band

- 11 -
Major Initiatives
Name Implementation Anticipated O&M Savings
Year Capital O&M 2014 2015 2016+
Regionalization (Phase 1) 14/15 $1.3 $0.9 $1.0 $1.0 $1.0
Regionalization (Phase 2) 16 $0.3 $0.8 $1.1
Project Blue Pencil 14/15 < $0.3 < $0.1 $1.0 $1.0
Review of Technical and Infrastructure Provider 14/15 $1.5 $1.8 $2.0
Training and Development Initiative (FEI and FBC cost sharing)
15 $0.2
Online Service Application 16 Full year savings starting 2018; $0.2 m O&M, $0.2 m Capital
* Costs and Savings are expressed in $ millions.

- 12 -
Commission Directive – Contact Centre Staff
• FEI contact centre agents in Prince George answering overflow electric calls
• Approximately 18 trained resources Answering electric calls
Doing gas work between calls
• Benefits of cross-utilization include: Cost-effective way to address variable work volumes
Provides development opportunities for staff
Customers experience lower wait times and lower costs
- 13 -
Commission Directive – Contact Centre Staff • Costs currently being charged on a “per-transaction”
basis
• Directive to re-visit alternate cost allocation methods if actual charges exceed $100 thousand in one year
• 2016 projected actuals are approximately $50 thousand

Revenue Requirements & Rates
Jeff May, Controller, Financial Accounting

- 15 -
Evidentiary Update October 5, 2016 Evidentiary Update - 2017 Rates
Line Item Reference
Revenue Surplus Impact
($ millions)
Delivery Rate
ImpactAugust 2, 2016 Filing 9.319$ 1.19%Tilbury Completion Date (44.116) -5.69%LNG Volumes BCUC IR 1.23.1, CEC IR 1.19.1 & 1.19.3 4.619 0.60%LT Debt Reduction (1.358) -0.18%Revelstoke Demand BCUC IR 1.14.1 (0.167) -0.02%LNG Asset Transfer Order G-138-16 and Appendix B, Page 13 0.122 0.02%LNG Station O&M 0.054 0.01%Update May/June AWE-BC Application, Page 18 0.044 0.01%System Extension Fund Order G-147-16 0.027 0.00%October 5, 2016 Evidentiary Update (before Revenue Surplus deferral) (31.456)$ -4.06%Deferred Revenue Surplus 31.456 4.06%October 5, 2016 Evidentiary Update -$ 0.00%

- 16 -
Summary of Revenue Surplus (14.892)
(1.106)(2.017) 0.455
(7.933)
(5.963)
(31.456)
(34.000)
(32.000)
(30.000)
(28.000)
(26.000)
(24.000)
(22.000)
(20.000)
(18.000)
(16.000)
(14.000)
(12.000)
(10.000)
(8.000)
(6.000)
(4.000)
(2.000)
-
Demand Forecast Other Revenue O&M Depreciation &Amortization
Financing andReturn on Equity
Taxes 2017 Surplus
$ M
illio
ns
2017 Surplus
Formula2.063
Forecast(4.080)
Surplus Deficiency Total Surplus

- 17 -
Emissions Regulations Deferral Account Approved in 2012/2013 FEI Revenue Requirement Application
proceeding
Requesting 5 year amortization period in this Application
Captures revenue collected from credits earned under the Renewable Low Carbon Fuel Requirements Regulation (RLCFRR)
First sale of credits earned under the RLCFRR was $2.4 million received in 2016
100% of revenue flows to ratepayers
Captures external costs (i.e. consulting costs) related to RLCFRR sales
Does not include internal costs, such as labour, which would already be embedded in formula O&M
To date, no costs incurred during the PBR period

Demand Forecast Methodology Review
David Bailey, Customer Energy and Forecasting Manager

- 19 -
Forecast Methods • FEI was directed by the Commission to review
residential and commercial forecasting methods
1. Through our analysis we determined that the existing forecasting methods performed better than comparison utilities
2. We determined that one other method (Exponential Smoothing or “ETS”) shows promise
3. FEI recommends further testing of the ETS method for the remainder of the PBR term

- 20 -
Sample Group Survey • Two new surveys, plus the 2014 ITRON Survey
• Results demonstrate that FEI’s forecasting accuracy is better than the Sample Group

- 21 -
Alternate Forecasting Methods • Several methods were examined.
Time Series Linear Regression (TSLR): A regular time series linear regression
Naïve: Next year’s forecast same as last year’s actuals
Smooth/Trend: Smooth the historic data first, and then apply a trend
Retail Sales: Econometric regression with Retail Sales forecast and residential UPC
Exponential Smoothing (ETS): A dynamic smoothing method that uses the full historic data set
• Integration Testing: Evaluated methods based on how well they did from 2012-2015
Tested only one input at a time (i.e.. Commercial UPC)
Used the Forecast Information System (FIS) to compute the complete demand forecast

- 22 -
Alternate Method Results Exponential Smoothing (ETS) is the best performing
alternate method

- 23 -
Exponential Smoothing

- 24 -
Conclusion • Through our analysis we determined that the existing
forecasting methods performed better than the Sample Group utilities
• We determined that one other method (Exponential Smoothing or “ETS”) shows promise
• FEI will continue to use the existing method, but will test ETS for remainder of the PBR term
Liquefied Natural Gas Update
Mike Bains, Business Development Manager
Darren Julyan, Director, Gas Plant Operations & Project Management Office

- 26 -
NGT/LNG Demand Forecast • Volume forecast based on customer demand contracted
under Rate Schedule 46 for both Firm and Spot supply customers
1. A forecast of Spot volumes was directed by the Commission to be included in the forecast
2. Firm demand is under take-or-pay commitment
• Spot demand is not subject to take-or-pay commitment, therefore forecast is based on:
1. Customer survey of future demand expectations, or
2. Historical consumption patterns

- 27 -
NGT/LNG Demand Forecast
• Tote Maritime was scheduled to begin LNG service under Rate Schedule 46 on May 1, 2017
• Due to operational delays, Tote is expected to enter service May 1, 2018
• Result is a reduction of 1,204,088 GJ to 2017 forecast LNG volume
• FEI was informed of this operational delay in August 2016
2017F - Original (GJ) 2017F - Evidentiary Update (GJ)
Variance (GJ)
CNG 769,467 769,467 - LNG 2,136,388 932,300 (1,204,088) Total NGT Demand 2,905,855 1,701,767 (1,204,088) Non-NGT CNG/LNG Demand 165,866 165,866 - Total CNG & LNG Demand 3,071,721 1,867,633 (1,204,088)

- 28 -
LNG Rate Schedule 46 O&M Update

- 29 -
Tilbury 2016 Rate Schedule 46 O&M Projection ($ millions)
Original Projection
Revised Projection
Labour 0.673 0.542 Materials 0.091 0.094 Contractor 0.320 0.266 Power 0.438 0.438 Fuel Gas 0.040 0.040 Fees & Admin. 0.058 0.050 Total 1.620 1.430

- 30 -
Original Projection
Revised Projection
Labour 2.160 1.480 Materials 0.170 0.150 Contractor 0.420 0.335 Power 4.060 2.590 Fuel Gas 0.260 0.160 Fees & Admin. 0.120 0.120 Total 7.190 4.835
Tilbury 2017 Rate Schedule 46 O&M Forecast ($ millions)

- 31 -
Rate Schedule 46 O&M Labour Cost Allocation
PBR Formula O&M
• Tilbury Base Plant • Mt. Hayes Plant
O&M Outside PBR Formula
• Tilbury Expansion • Truck Loading at
all 3 Plants
The O&M costs to support Rate 46 include all incremental costs associated with the liquefaction of natural gas, the dispensing of LNG and the handling and loading of tankers to transport LNG

Service Quality Indicators
James Wong, Director, Strategic Initiatives & Budgeting
John Himmel, Manager, Business Performance
Dean Stevenson, Director, OH&S and Technical Training

- 33 -
Overview of Service Quality Indicators • SQI Benchmarks
Approved in PBR Plan
Based on historical performance
• Satisfactory Performance Ranges Range between approved benchmark and threshold
BCUC directed stakeholder consultation process
Factors taken into consideration include historical variances, historical trend, etc.
• Consensus Agreement Agreed ranges for SQIs with benchmarks where performance is
considered satisfactory
Outlined process for examination of SQI results at each Annual Review

- 34 -
Service Quality Indicator
2015 (Relative to
Benchmark and Threshold)
2016 Aug YTD (Relative to
Benchmark and Threshold)
Safety SQIs Emergency Response Time Within Range Within Range
Telephone Service Factor (Emergency) Meets Meets
All Injury Frequency Rate (AIFR) Within Range Meets
Public Contacts with Pipelines Meets Meets
Responsiveness to Customer Needs SQIs First Contact Resolution Meets Meets
Billing Index Meets Meets
Meter Reading Accuracy Meets Meets
Telephone Service Factor (Non-Emergency) Meets Meets
Meter Exchange Appointment Meets Meets
Customer Satisfaction Index - informational n/a n/a
Telephone Abandon Rate - informational n/a n/a
Reliability SQIs Transmission Reportable Incidents - informational n/a n/a
Leaks per KM of Distribution System Mains - informational n/a n/a
SQI Performance

- 35 -
Responsiveness to Customer Needs
Service Quality Indicator
2015 Results
2015 Status
(Relative to Benchmark and
Threshold)
2016 Aug YTD Results
2016 Status
(Relative to Benchmark and
Threshold)
Benchmark Threshold
Responsiveness to Customer Needs SQIs First Contact Resolution 81% Meets 81% Meets 78% 74%
Billing Index 1.06 Meets 0.55 Meets 5.0 <=5.0
Meter Reading Accuracy 97.5% Meets 97.3% Meets 95% 92% Telephone Service Factor
(Non-Emergency) 71% Meets 70% Meets 70% 68%
Meter Exchange Appointment 96.6% Meets 97.0% Meets 95% 93.8%
Informational Indicators 2015
Results
2016 Aug YTD Results
2013 Actuals
2014 Actuals
Customer Satisfaction Index 8.6 n/a 8.7 n/a 8.3 8.5
Telephone Abandon Rate 2.0% n/a 2.3% n/a 2.1% 1.8%

- 36 -
Safety and Reliability
Service Quality Indicator
2015 Results
Status (Relative to Benchmark
and Threshold)
2016 Aug YTD Results
Status (Relative to Benchmark
and Threshold)
Benchmark Threshold
Safety SQIs
Emergency Response Time 97.3% Within Range 97.4% Within
Range 97.7% 96.2%
Telephone Service Factor (Emergency) 97.6% Meets 98.8% Meets 95% 92.8%
All Injury Frequency Rate 2.42 Within Range 2.05 Meets 2.08 2.95
Public Contacts with Pipelines 9 Meets 9 Meets 16 16
Informational Indicators 2015
Results
2016 Aug YTD Results
2013 Actuals
2014 Actuals
Reliability SQIs
Transmission Reportable Incidents 3 n/a 2 n/a 0 2 Leaks per KM of Distribution System Mains 0.0045 n/a 0.0031 n/a 0.0075 0.0059

- 37 -
Emergency Response Time

- 38 -
Emergency Response Time (within 1 hour)
97.7% 97.9% 97.4% 97.4% 96.7% 97.3% 97.4%
97.7%
96.2%
90%
91%
92%
93%
94%
95%
96%
97%
98%
99%
100%
2010 2011 2012 2013 2014 2015 2016 YTD
Result Benchmark Threshold
• Improvement from 96.7% in 2014 to 97.3% in 2015 • Continued improvement to 97.4% Aug 2016 YTD
- 39 -
Transmission Reportable Incidents

- 40 -
Three Transmission Reportable Incidents YTD
• Brentlawn Dr. Burnaby Leak on 508mm IP system
• 168th St. Surrey 3rd party damage to 26mm steel IP service
• 168th St. Surrey 3rd party damage to 26mm steel IP Branch service

- 41 -
IP Damage at 168th Street
To Main
Directional drill path
90 Degree elbow crack

- 42 -
Safety

- 43 -
All Injury Frequency Rate (AIFR)
2015 AIFR is between the Benchmark and Threshold
• WorkSafeBC Certificate of Recognition retained in 2015
• Target Zero implemented
• 2016 YTD results trending positively
Description 2009 2010 2011 2012 2013 2014 2015 August 2016
YTD Annual Results 2.49 2.66 1.66 1.91 3.02 1.73 2.52 1.91 Three Year Rolling Average 2.55 2.26 2.27 2.08 2.20 2.22 2.42 2.05
Benchmark n/a n/a n/a n/a n/a 2.08 2.08 2.08
Threshold n/a n/a n/a n/a n/a 2.95 2.95 2.95

Question Period