Embed Size (px)
Citation preview
Z
Fd
PSJa
b
c
d
e
a
ARR1A
KRSPF
1
lbtbhp
I
3
V
0d
ARTICLE IN PRESSG ModelOOL-25212; No. of Pages 14
Zoology xxx (2010) xxx–xxx
Contents lists available at ScienceDirect
Zoology
journa l homepage: www.e lsev ier .de /zool
eeding anatomy, filter-feeding rate, and diet of whale sharks Rhincodon typusuring surface ram filter feeding off the Yucatan Peninsula, Mexico
hilip J. Mottaa,∗, Michael Maslankab,1, Robert E. Hueterc, Ray L. Davisb,2, Rafael de la Parrad,amantha L. Mulvanya, Maria Laura Habeggera, James A. Strothere, Kyle R. Maraa,ayne M. Gardinera, John P. Tyminskic,3, Leslie D. Zeiglerb,4
Department of Integrative Biology, University of South Florida, 4202 East Fowler Avenue, Tampa, FL 33620, USAGeorgia Aquarium, 225 Baker Street, Atlanta, GA 30313, USACenter for Shark Research, Mote Marine Laboratory, 1600 Ken Thompson Parkway, Sarasota, FL 34236, USAProyecto Domino, Comision Nacional de Areas Naturales Protegidas, P.O. Box 518, Cancun, Quintana Roo, Mexico 77500, MexicoDepartment of Ecology and Evolution, University of California, Irvine, CA 92697, USA
r t i c l e i n f o
rticle history:eceived 5 October 2009eceived in revised form5 December 2009ccepted 22 December 2009
eywords:am filter feedinghark diet
a b s t r a c t
The feeding anatomy, behavior and diet of the whale shark Rhincodon typus were studied off Cabo Catoche,Yucatan Peninsula, Mexico. The filtering apparatus is composed of 20 unique filtering pads that com-pletely occlude the pharyngeal cavity. A reticulated mesh lies on the proximal surface of the pads, withopenings averaging 1.2 mm in diameter. Superficial to this, a series of primary and secondary cartilagi-nous vanes support the pads and direct the water across the primary gill filaments. During surface ramfilter feeding, sharks swam at an average velocity of 1.1 m/s with 85% of the open mouth below thewater’s surface. Sharks on average spent approximately 7.5 h/day feeding at the surface on dense plank-ton dominated by sergestids, calanoid copepods, chaetognaths and fish larvae. Based on calculated flowspeed and underwater mouth area, it was estimated that a whale shark of 443 cm total length (TL) filters
lanktoneeding rate 326 m3/h, and a 622 cm TL shark 614 m3/h. With an average plankton biomass of 4.5 g/m3 at the feedingsite, the two sizes of sharks on average would ingest 1467 and 2763 g of plankton per hour, and theirdaily ration would be approximately 14,931 and 28,121 kJ, respectively. These values are consistent withindependently derived feeding rations of captive, growing whale sharks in an aquarium. A feeding mech-anism utilizing cross-flow filtration of plankton is described, allowing the sharks to ingest plankton that
while
is smaller than the mesh. Introduction
The whale shark Rhincodon typus (Smith, 1828) is the world’sargest fish as well as the largest filter feeding fish, yet its feedingiology is still poorly understood. Denison (1937) provided one of
Please cite this article in press as: Motta, P.J., et al., Feeding anatomy, fisurface ram filter feeding off the Yucatan Peninsula, Mexico. Zoology
he earliest and most thorough descriptions of the head, followedy seminal work by Gudger (1941a,b) who described the shark asaving a huge mouth, small teeth and “curious gill arches” com-osed of sponge-like masses of filtering gill sieves through which
∗ Corresponding author. Tel.: +1 813 974 2878; fax: +1 813 974 3263.E-mail address: [email protected] (P.J. Motta).
1 Current address: Department of Nutrition, Smithsonian Conservation Biologynstitute, Washington, DC 20013, USA.
2 Current address: Marine Science Center, 100 Lighthouse Drive, Ponce Inlet, FL2127, USA.3 Current address: 14271 Appalachian Trail, Davie, FL 33325, USA.4 Current address: Disney’s Animal Kingdom, Animal Nutrition Center, Lake Buenaista, FL 32830, USA.
944-2006/$ – see front matter © 2010 Elsevier GmbH. All rights reserved.oi:10.1016/j.zool.2009.12.001
reducing clogging of the filtering apparatus.© 2010 Elsevier GmbH. All rights reserved.
the water must pass, and upon which the prey are supposedlytrapped before swallowing (Gudger, 1941b, p. 86). The very detaileddescriptions of the cranial anatomy by both authors are at odds withthe poorly described filtering apparatus. To date Gudger’s descrip-tion remains the most complete description of a unique filteringapparatus found in no other fish. Comparing this filtering apparatusto that of the basking shark Cetorhinus maximus and the megamouthshark Megachasma pelagios, Taylor et al. (1983) and Sanderson andWassersug (1993) both concluded that the filtering apparatus ofthe whale shark is incapable of sustaining a high rate of water flowthrough it.
Better understood, but still controversial, is the diet of this cir-cumglobal giant. Early scientists recognized that, despite its size,it had a unique filtering apparatus and subsisted on plankton
lter-feeding rate, and diet of whale sharks Rhincodon typus during(2010), doi:10.1016/j.zool.2009.12.001
near the surface (Gill, 1905). Gudger (1941a) noted that in addi-tion to planktonic crustaceans, Rhincodon had been conclusivelydemonstrated to feed on squid and cuttlefish. He postulated thatan invertebrate diet is insufficient to maintain this species, andsummarized observations of whale sharks purportedly ingesting

INZ
2 ology
sisfcocat1a2ae
fiststmrt“rNsamosHp(t2mio
totifutaaatefa
2
2
c
bf
ARTICLEG ModelOOL-25212; No. of Pages 14
P.J. Motta et al. / Zo
chooling clupeids. Since those early, and often anecdotal, stud-es, numerous dietary analyses have been conducted at whalehark aggregation sites. These analyses, based on stomach contents,ecal samples, behavioral observations, and plankton tows, indi-ated that whale sharks primarily feed on a variety of planktonicrganisms. These include euphausids, copepods, chaetognaths,rab larvae, molluscs, siphonophores, salps, sergestids, isopods,mphipods, stomatopods, coral spawn, and fish eggs. In addition,hey also feed on small squid and fish (Silas and Rajagopalan,963; Taylor, 1994, 1996, 2007; Clark and Nelson, 1997; Taylornd Pearce, 1999; Heyman et al., 2001; Wilson and Newbound,001; Duffy, 2002; Jarman and Wilson, 2004; Hacohen-Domene etl., 2006; Hoffmayer et al., 2007; Nelson and Eckert, 2007; Meekant al., 2009).
We now know that whale sharks use at least three methods oflter feeding. The most readily observable, due to its location, isurface ram filter feeding or surface active feeding. When feeding inhis manner, the whale shark swims at the surface with the dor-al surface of the head and usually the dorsal fin and upper lobe ofhe caudal fin exposed. With its body pitched upwards, the open
outh is held partially out of the water, and the animal swims atelatively slow speeds (0.3–1.5 m/s),1 ramming the water and foodhrough its filtering apparatus. The shark is occasionally seen tocough”, back-flushing water and particles out of its mouth beforeesuming feeding (Clark and Nelson, 1997; Heyman et al., 2001;elson and Eckert, 2007; Taylor, 2007). During stationary/vertical
uction feeding the shark either remains relatively horizontal orssumes a nearly vertical position, stops or almost ceases swim-ing, and actively suctions in plankton or small fish with repeated
pening and closing of its mouth. When in the vertical position, thehark’s mouth is positioned just below the surface (Gudger, 1941a;eyman et al., 2001; Nelson and Eckert, 2007). During sub-surfaceassive feeding/passive feeding, the shark swims slowly (0.2–0.5 m/s)see footnote 1) below the surface with the mouth wide open, fil-ering the food from the water (Nelson and Eckert, 2007; Taylor,007). Nelson and Eckert (2007) noted that every few minutes theouth would close and the shark appear to swallow, and no gulp-
ng or suction feeding was noted during this behavior. They alsobserved “coughing” during this feeding behavior.
Despite the growing body of literature on the feeding biology ofhe whale shark, there is scant detailed information on the anatomyf the filtering apparatus, or the amount and nutrient content ofhe food ingested. There are no estimates of daily dietary intake,nformation that is important not only with regards to its basiceeding biology but also its captive husbandry. In this regard wendertook a study of whale shark surface ram filter feeding offhe Yucatan Peninsula, Mexico, where one of the largest knownggregations occurs during summer plankton blooms (Hueter etl., 2007). The goals of this study were to: (i) better describe thenatomy of the filtering apparatus; (ii) relate plankton size to fil-er mesh dimensions; (iii) describe fluid flow into the mouth; (iv)stimate plankton ingestion per unit time during surface ram filtereeding; and (v) estimate nutrient uptake based on ingestion ratend nutrient analysis of the plankton.
. Materials and methods
Please cite this article in press as: Motta, P.J., et al., Feeding anatomy, fisurface ram filter feeding off the Yucatan Peninsula, Mexico. Zoology
.1. Study area and field methods
Field work was conducted in 2006, 2007, and 2008 on theontinental shelf near Isla Holbox and Isla Contoy, north of Cabo
1 The swimming velocities in Taylor (2007) are incorrectly printed and shoulde 0.2–0.5 and 1.0–1.5 m/s for sub-surface passive feeding and surface ram-filtereeding, respectively (personal communication).
PRESSxxx (2010) xxx–xxx
Catoche, on the northeastern corner of the Yucatan Peninsula, Mex-ico. The area sampled ranged from 21◦41.545′ to 21◦45.811′N and86◦59.898′ to 87◦09.866′W, where bottom depth ranged between10 and 20 m. Between April and September each year at least sev-eral hundred whale sharks aggregate in the area to feed on planktonassociated with a seasonal upwelling. Population estimates rangeas high as 1400 sharks visiting the region every summer, withsharks ranging in size from 1.5 to 13 m total length (TL) and asex ratio of approximately 1 female per 2.6 males (Hueter et al.,2008). Observations were confined to surface ram filter feedingas low underwater visibility (due to dense plankton abundance)mostly prevented sub-surface observations. Observations gener-ally occurred between 07:00 and 14:00 h. Feeding sharks weretracked with a motor vessel at a distance of approximately 2–5 m,taking care not to alter the shark’s natural behavior. With the vesselmoving at the same rate as, and parallel to, the animal, swimmingspeed was recorded for 33 sharks with either a Garmin GPS MAP276C or a Garmin eTrex Venture GPS (Garmin International Inc.,Olathe, KA, USA). The swimming speed of each shark was recordedtwo to three times and an average taken. Swimming speed recordedin this manner closely matched water flow velocity independentlyrecorded by means of calibrated lasers, as described below. SharkTL was estimated to the nearest half-meter for each shark two tothree times by motoring within 2–3 m of, and parallel to, the sharkand comparing its total length to one-meter markings on the boatgunwale. The average of these length estimates was recorded. Inaddition, for a subset of these sharks, a pair of calibrated greenlaser pointers set 50 cm apart were projected on the head, allowingtotal length to be estimated later from still or video pictures usingthe ratio of internasal distance or distance of snout to pectoral finorigin, first gill slit, or dorsal fin origin to total length (see Section2.5).
Above-water video of bubbles or pieces of flotsam was recordedas they entered a shark’s open mouth (see electronic supplement,Shark 9 2007 aerial view surface ram filter feeding). In addition, stillimages were taken of feeding whale sharks from an anterior view,visualizing the exposed portion of the mouth above the water’s sur-face as the animal swam toward the observer. Using the distancemeasures from the green lasers along with these images, the fol-lowing data were obtained: percent of open mouth area above thewater; absolute mouth width and height (based on internasal width– see Section 2.5) when the laser lights were visible; and velocityof water flow in front of the shark, to compare to swimming speedof the shark as measured by motoring beside the feeding shark.Underwater observations of the shark’s mouth while surface ramfilter feeding were made by snorkeling within one meter of thehead, and lateral images of the feeding sharks were used to cal-culate the pitch angle. Video images were recorded with either aSony DCR-TRV 103 or a JVC DVL 9800u digital video camera andstill pictures with a Canon A 710IS digital camera, and both videoand still images were downloaded to a computer and analyzed fieldby field with BioMechanica DV-R version 2.4 (BioMechanica, Port-land, OR, USA) and SigmaScan Pro software, version 4.01.003 (SystatSoftware, Inc., San Jose, CA, USA).
2.2. Habitat use
Between May and September from 2006 to 2008, whale sharkcounts were conducted in the study area for a total of 70 days byeither boat or airplane. On only two of these days no whale sharkswere seen. Locations of sharks were recorded with a Garmin GPS
lter-feeding rate, and diet of whale sharks Rhincodon typus during(2010), doi:10.1016/j.zool.2009.12.001
MAP76 or Garmin GPS V.D. During boat observations each sharkwas identified by observable characteristics including size, sex,fin shape, spot patterns and other distinctive markings, and wasphotographed and/or marked by a snorkeler with a conventionalexternal, numbered tag to prevent re-sampling of the same ani-
INZ
ology x
murwbnobio
wPUe(AmwmattPamtaepmthrrnis
2
i(PIs(wdm
eEgsbtom(fiw
cp
open mouth width and height to internasal distance. From theseratios we were able to calculate the average percent mouth areaabove the water from the video and still pictures, validate the
ARTICLEG ModelOOL-25212; No. of Pages 14
P.J. Motta et al. / Zo
al. Aerial surveys were conducted from a Cessna 207 airplane orltralight aircraft, flying at 250 m altitude in order to get a 500 mange of visibility on each side of the plane. A total of 689 sharksere observed surface ram filter feeding over 274 h of observation
y boat, and 2474 sharks during 72 h of observation by plane. Theumber of sharks sighted per hour of observation for each hourf the day from 08:00 to 16:00 was compiled for the combinedoat and aerial observations. The aerial observations most likely
ncluded pseudoreplicated sharks that were counted more thannce on different days.
In addition, between 2003 and 2007, a total of 16 whale sharksere tagged with pop-up satellite archival transmitting tags (PAT2,
AT4 and Mk10-PAT versions; Wildlife Computers, Redmond, WA,SA) in the study area, following procedures outlined by Wilsont al. (2006). Each PAT tag was attached to a stainless steel dartType SSD, 34 × 8.5 mm; Hallprint Pty. Ltd., Victor Harbor, Southustralia) by a 15 cm tether comprising segments of monofila-ent leader and coated wire. When a surface-swimming sharkas spotted and selected for PAT tagging, the research vessel wasaneuvered to drop one or two snorkelers off at a position just
head of the moving shark. Using a pole spear, the tagger insertedhe tag’s dart through the shark’s skin and anchored it several cen-imeters into the subdermal tissue just below the dorsal fin. TheAT tag archived depth, temperature, and light level measurementst regular intervals (every 30 or 60 s) while attached to the ani-al for a user-determined duration. After the tag detached from its
ether and came to the sea surface, it transmitted summaries of itsrchived data through the Argos satellite system. Physically recov-red PAT tags enabled the retrieval of the full archived data set,roviding a detailed profile of the animal’s diving behavior. Deptheasurements from recovered tags were analyzed to determine
he number of minutes spent in surface waters (0–1 m) for eachour of the day. PAT tags had a resolution of ±0.5 m and an accu-acy of ±1% of the recorded depth. Only data from when the sharksemained in the study area were utilized in the analysis (N = 4). Theumber of surface minutes for all the recovered tags was combined
n a weighted average to estimate the percent of time that the whaleharks spent in surface waters while utilizing the study site.
.3. Plankton sampling
Plankton samples were taken directly beside, and in some casesn front of, the feeding sharks and subsequently in non-feedingcontrol) areas at least 1–10 km away from the sharks. A squareVC frame neuston net (0.5 m × 0.5 m, 200 �m; Aquatic Researchnstruments, Hope, ID, USA) was used to collect 16 and 23 planktonamples in 2007 and 2008, respectively. A mechanical flowmeterModel MF315; SeaLite Instruments, Inc., Fort Lauderdale, FL, USA)as used to determine water flow through the mouth of the neturing tows. Tows lasted 240 s. Duration of tow, speed of tow, floweter reading, and GPS coordinates were recorded for each tow.Immediately after collection, the plankton sample was homog-
nized in the cod end and two 4 ml subsamples were collected.ach subsample was placed in a light-protected 30 ml plastic (Nal-ene) bottle with 18 ml of 10% buffered formalin. The remainingample was collected in a 500 ml light-protected plastic (Nalgene)ottle and placed on ice for later nutrient analysis. Samples forhe determination of nutrient content were frozen for transportnce returned to port. Total plankton weight per tow was deter-ined using the sum of frozen samples and preserved subsamples
drained of 10% buffered formalin). Knowing the volume of water
Please cite this article in press as: Motta, P.J., et al., Feeding anatomy, fisurface ram filter feeding off the Yucatan Peninsula, Mexico. Zoology
ltered by the net for each tow allowed a calculation of planktoneight per cubic liter of seawater.
From the two 4 ml subsamples, plankton were identified andounted according to Johnson and Allen (2005) under an Olym-us CX stereo microscope. Prey items were identified to taxa and
PRESSxx (2010) xxx–xxx 3
expressed as a percent count of total composition. Extrapolatingto the complete sample, the number of plankters per cubic literof seawater was calculated. In addition, plankton size was mea-sured from 50 random individuals from each of the 39 subsamples(total 1950 plankters measured). Random sampling was ensuredby marking the sorting dish into subsections and using a randomnumber generator to pick which subsections, and subsequentlyplankters, to sample. Length and width were taken for most ofthe plankters except for shrimp where depth replaced width. Allmeasurements were performed with a Wild M5 stereo microscopeand reticle. Measuring criteria varied among species. For shrimp,length was taken from the base of the eyes to the tip of the telson,and depth was taken at the posterior region of the cephalothorax.For copepods, amphipods and chaetognaths, length was taken fromthe most anterior to the most posterior portion of the body. Setae,antennae or other types of flexible structures were not accountedfor in these measurements. Lastly, for fish eggs, the diameter wasmeasured.
2.4. Nutrient analysis
A subsample of plankton (preserved frozen) was used to deter-mine nutrient content (carried out by NP Aanalytical Laboratories,St. Louis, MO, USA; and by Omaha’s Henry Doorly Zoo, Omaha, NE,USA). Total dry matter was measured using a forced air oven at105 or 133 ◦C (AOAC, 1984). Total fat was determined using a hex-ane extraction process (AOAC, 1984), protein was determined usinga Leco nitrogen/protein determinator (model FP-2000; Leco Cor-poration, St. Joseph, MI, USA) (AOAC, 1995), ash was determinedusing a muffle furnace (500–550 ◦C, AOAC, 1984), and fatty acidprofiles were determined using gas chromatography (model 5880;Hewlett-Packard, Palo Alto, CA, USA). Gross energy was determinedby calculation (Church and Pond, 1988).
2.5. Anatomical measures
Four whale sharks (shark A, male, TL2 ∼622 cm; shark B, male, TL(see footnote 2) ∼593 cm; shark C, female, TL ∼443 cm; and shark D,female, TL ∼482 cm) acquired off Hualien, Taiwan and housed at theGeorgia Aquarium, Atlanta, were used for morphological measuresin addition to a fifth male captive whale shark at the Georgia Aquar-ium (TL 486 cm) and incomplete but published measurements for17 whale sharks (TL 394–975 cm) (Smith, 1829, 1849; Haly, 1883;Thurston, 1894; Bean, 1905; Gudger, 1915; Mowbray, 1923; Gudgerand Mowbray, 1930; Gudger, 1931; Silas and Rajagopalan, 1963;Bass et al., 1975; Uchida, 1990). Open mouth width-to-height ratiowas also measured from five additional underwater photographsof feeding whale sharks (size not determined). Morphometricsincluded: TL; distance from snout to first dorsal fin, first gill slitand origin of pectoral fin; open mouth width and height; internasaldistance; and dorsal fin height. The two male captive sharks (A andB) were anesthetized with 125 mg/l of MS222 (tricaine methane-sulphonate), and while restrained in a submerged pen their mouthswere opened maximally and dimensions were taken with a tapemeasure. The two female specimens (C and D) were restrainedwithout anesthesia and measurements were taken. From the abovemeasurements various ratios of each measure to total length werecalculated and means taken, as well as ratios of landmarks such as
lter-feeding rate, and diet of whale sharks Rhincodon typus during(2010), doi:10.1016/j.zool.2009.12.001
approximate total lengths of field-observed sharks measured with
2 These are average estimated total lengths as the measurements taken live andat necropsy (sharks A and B) differ slightly.
IN PRESSZ
4 ology xxx (2010) xxx–xxx
tw
twrfwtDsSatamgwpmpaiwpffifltswlfcmtTstvD
2
sFfRim
p
wsflivas
p
ents
from
the
filt
erin
gp
ads
oftw
om
ale
wh
ale
shar
ks,b
oth
left
and
righ
tsi
des
com
bin
ed.
Up
per
pad
sLo
wer
pad
sU
pp
erto
tal
area
Low
erto
tal
area
Mea
n
U1
U2
U3
U4
U5
L1L2
L3L4
L5
(cm
2)
1058
.44
1001
.74
991.
1610
02.1
011
80.3
211
00.5
410
66.9
210
40.5
810
06.6
813
49.9
852
33.7
655
64.7
00.
460.
500.
480.
440.
470.
440.
470.
490.
490.
320.
46d
iam
eter
(cm
)0.
110.
100.
100.
090.
080.
080.
090.
100.
100.
090.
09
(cm
2)
1130
.81
1274
.95
1028
.87
1015
.53
1004
.30a
1065
.05a
1311
.58
1110
.83
1218
.31
1647
.20
5454
.46
6352
.97
0.61
0.59
0.61
0.54
–0.
570.
540.
690.
58–
0.60
dia
met
er(c
m)
0.17
0.15
0.14
0.12
–0.
140.
150.
140.
12–
0.14
ere
du
pli
cate
dfo
ru
nav
aila
ble
con
tral
ater
alp
ads.
late
dfr
omn
on-d
amag
edco
ntr
alat
eral
pad
;d
ash
esd
enot
eab
sen
tp
ads.
ARTICLEG ModelOOL-25212; No. of Pages 14
P.J. Motta et al. / Zo
he calibrated lasers, and calculate open mouth area from under-ater frontal pictures of feeding sharks.
After two of the male specimens died for reasons unrelated tohis study (shark A, June 2007; shark B, January 2007), necropsiesere performed, including a partial dissection of the filtering appa-
atus. The complete pharyngeal filtering apparatus was removedrom one side, as well as portions from the opposite side. In caseshere an upper or lower filtering pad was missing from one side,
he equivalent pad from the other side was used for measurement.igital pictures of the filtering pads were taken of the freshly dead
pecimens and the area of each filtering pad was measured withigmaScan Pro software. The tissue was subsequently stored frozennd thawed for the following measures. Of the 21 available of 40otal pads (10 from shark A, 11 from shark B), nine 1 cm2 samplingreas per pad were recorded with digital macro photography andesh3 diameter was measured. The mesh possesses an irregular
eometry so the mesh diameter was measured at the shortest oridest regions of 50 openings selected haphazardly from each sam-ling area, totaling 9450 diameter measures (Table 1 and Fig. 1). Alleasurements were averaged to estimate mean mesh diameter per
ad and for all pads combined. For each of the nine sub-sampledreas per pad an open area ratio ˇ was calculated. Open area ratios the open area per unit area of pad. The mean ˇ for each pad
as then calculated by averaging the ratio for all of the nine sam-led areas, and an overall ˇ was calculated for all available padsor each shark. When multiplied by the combined total area of allltering pads, the total area through which water can potentiallyow is expressed, providing the openings are not blocked by plank-on or other material. The height and spacing of the primary andecondary vanes (Fig. 1) on the undersurface of each available padas measured with a digital caliper at three equidistant midline
ocations for each of the pads (24 measurements for shark A and 36or shark B). To estimate the dimensions of the outflow respiratoryhannel distal to the filtering pads, the distances between the pri-ary lamellae (width of the channel) were measured between the
hird and fourth holobranch on shark A (the only pair still intact).he height of the channel was taken as the length of the under-ide of the upper plus lower filtering pads on arches I to IV, andhe channel depth was the distance from the edge of the secondaryanes to the distal edge of the primary filaments on arches I and III.igital images were analyzed with SigmaScan Pro software.
.6. Fluid flow through the filtering apparatus
The volume of water entering the mouth was calculated using aimple hydrodynamic model of flow through the respiratory tract.luid particles were assumed to be negligibly affected by viscousorces as they passed into the buccal cavity of the animal (theeynolds number based on mouth diameter and swimming speed
s ∼5 × 10⁵). Thus, the pressure within the buccal cavity was esti-ated using Bernoulli’s equation:
m = 12
�(U2s − U2
m), (1)
here pm is the pressure in the buccal cavity, � is the density ofeawater, Us is the swimming speed of the animal, and Um is theow velocity at the mouth. Conversely, the flow through the filter-
ng pad was assumed to be laminar and subject to relatively large
Please cite this article in press as: Motta, P.J., et al., Feeding anatomy, filter-feeding rate, and diet of whale sharks Rhincodon typus duringsurface ram filter feeding off the Yucatan Peninsula, Mexico. Zoology (2010), doi:10.1016/j.zool.2009.12.001
iscous forces (the Reynolds number based on the mesh diameternd the flow velocity at the pad given Um = Us is ∼3 × 10²). The pres-ure across the filtering pad was then calculated by estimating the
3 The term mesh is used instead of pore when describing the holes in the filteringads as they are irregular in shape. Ta
ble
1M
orp
hom
etri
cm
easu
rem
Shar
kA
Are
a(6
22cm
TL)
� Mes
h
Shar
kB
Are
a(5
93cm
TL)
� Mes
h
Are
ava
lues
for
shar
kA
wa
Are
ap
arti
ally
extr
apo

Please cite this article in press as: Motta, P.J., et al., Feeding anatomy, filter-feeding rate, and diet of whale sharks Rhincodon typus duringsurface ram filter feeding off the Yucatan Peninsula, Mexico. Zoology (2010), doi:10.1016/j.zool.2009.12.001
ARTICLE IN PRESSG ModelZOOL-25212; No. of Pages 14
P.J. Motta et al. / Zoology xxx (2010) xxx–xxx 5
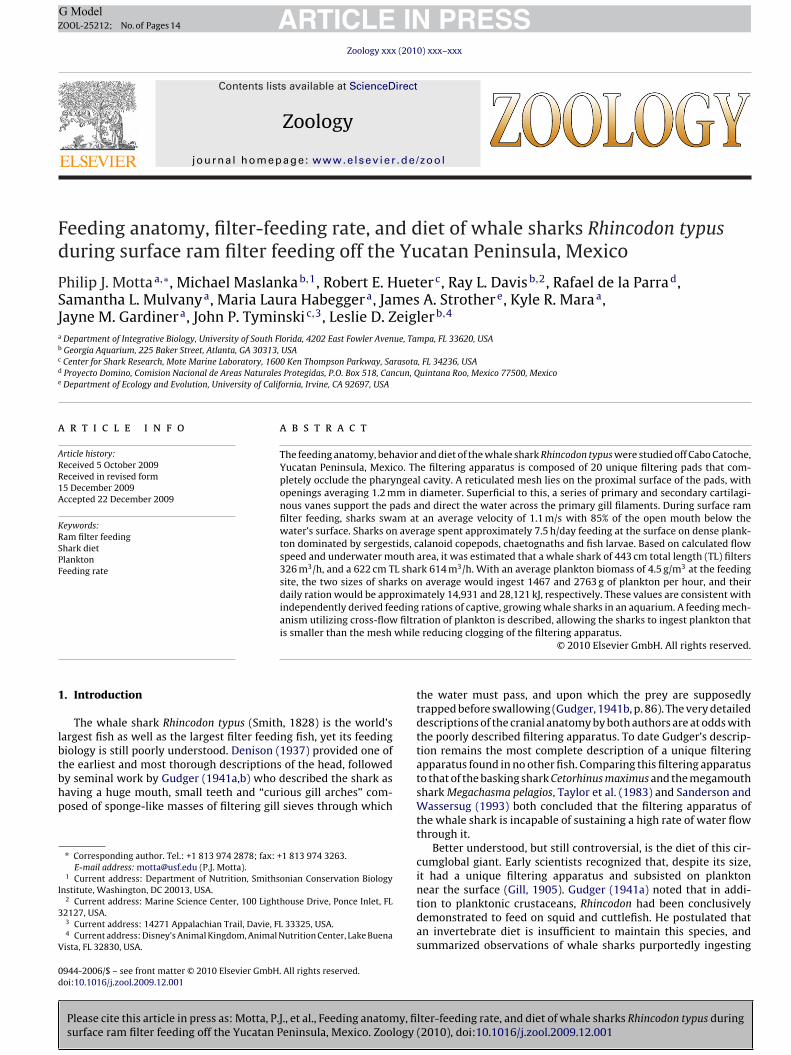
Fig. 1. (a) Schematic representation of a surface ram filter feeding whale shark, showing the approximate position of the filtering pads and the direction of water flow throughthem. Detail drawing shows a lateral view of the vanes deep to the filtering mesh, as well as the primary gill filaments on the first branchial arch over which the water flows.(This illustration is, with permission, based upon a copyrighted illustration by Emily S. Damstra.) (b) Gross morphology of the whale shark filtering pads. Dorsal view of thelower filtering pads of shark A. The most posterior lower pad at the bottom is triangular in shape, and the lateral side of the pads is to the left. The lateral raphe between thelower and upper pads is visible toward the left. All other soft tissue has been removed. White ruler is 15 cm. (c) The upper second filtering pad of shark B. Because it is anupper pad, lateral is to the left and posterior toward the top. Upper pads are not as falcate on their medial margin as the lower pads. The squares (1 cm × 1 cm) indicate areassampled to measure mesh diameter, and the detail is a representative square area showing the irregularly shaped holes of the reticulated mesh. (d) External view of the firstupper left pad of shark A with lateral margin toward the left. Note that the secondary vanes direct water laterally into the parabranchial chamber and over the gill tissue (gt)before it exits the pharyngeal slit (not shown). White square is 1 cm × 1 cm in size. (e) Close-up of a section through the third left lower filtering pad of shark A showing thereticulated mesh (rm), primary vanes (pv), secondary vanes (sv), and gill tissue (gt). Water flow is through the mesh, between the primary and secondary vanes, and overthe gill tissue. White square is 1 cm.

Please cite this article in press as: Motta, P.J., et al., Feeding anatomy, filter-feeding rate, and diet of whale sharks Rhincodon typus duringsurface ram filter feeding off the Yucatan Peninsula, Mexico. Zoology (2010), doi:10.1016/j.zool.2009.12.001
ARTICLE IN PRESSG ModelZOOL-25212; No. of Pages 14
6 P.J. Motta et al. / Zoology xxx (2010) xxx–xxx
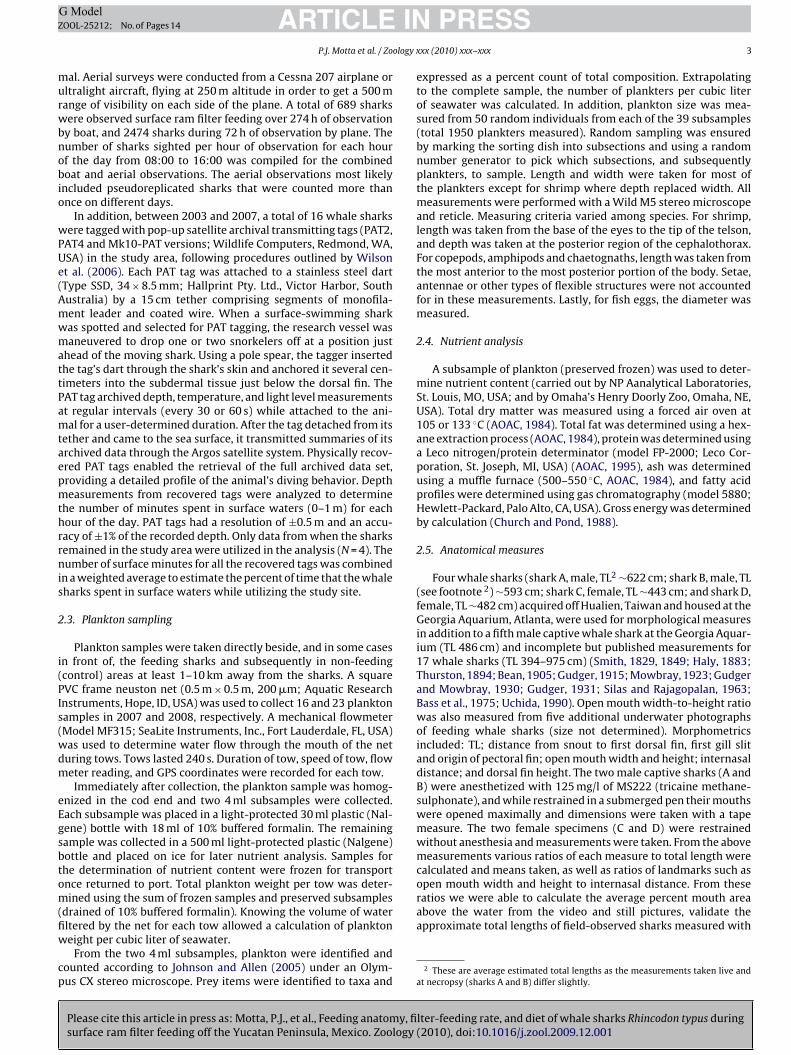
Fig. 2. Surface (a) and sub-surface (b) view of two surface ram filter feeding whale sharks (size between 5 and 8 m TL). Note that the majority of the open mouth is underwaterand a bow wave is formed by the lateral edges of the mouth.

IN PRESSZ
ology xxx (2010) xxx–xxx 7
h
p
w�avftiidltmtwtetlpaatwaparpv(
2
avnftaaearaC
rt2AArA
3
3
ff2
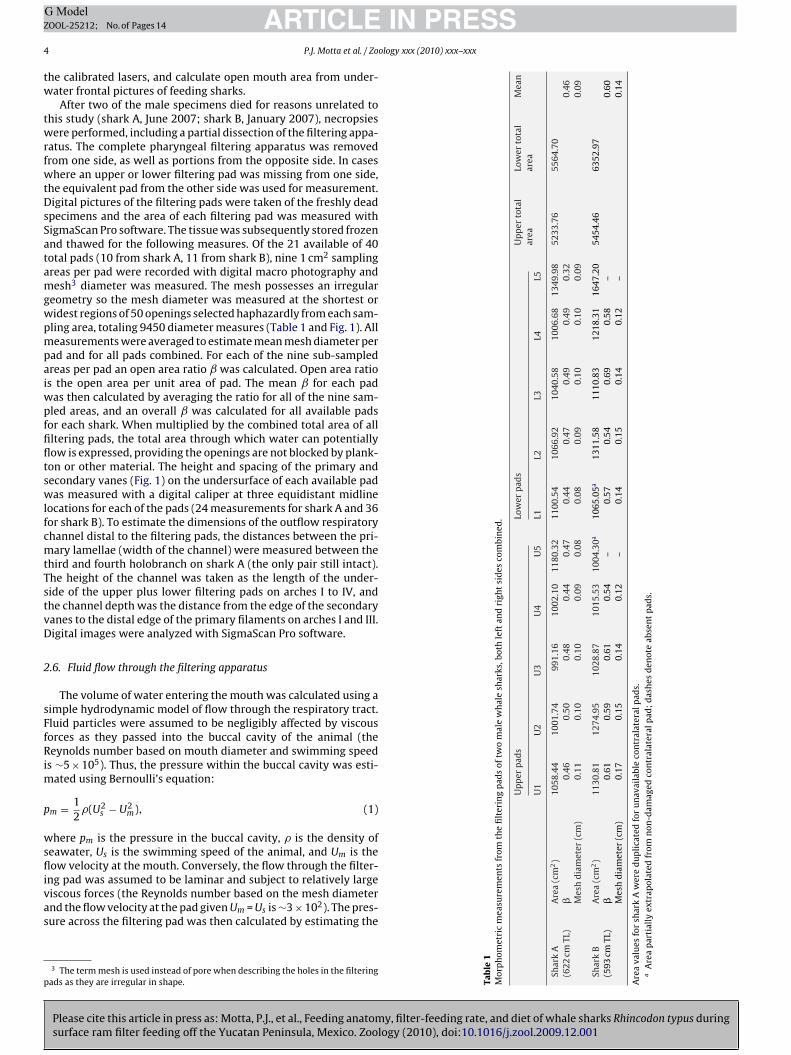
Fig. 3. Hourly percent time spent in surface waters (0–1 m) by satellite tagged whalesharks in the study area. The reported percentages are weighted averages of four
ARTICLEG ModelOOL-25212; No. of Pages 14
P.J. Motta et al. / Zo
ydraulic resistance of the mesh entrance and the mesh length:
m − pe = �ps(Um) + �pp(Um), (2)
here pe is the pressure downstream of the filtering pad, andps(Um) and �pp(Um) are the pressure drops at the mesh entrance
nd across the mesh length, respectively, as a function of the flowelocity at the mouth. The pressure drop at the mesh entrance, �ps,rom losses associated with the constriction of the flow as it entershe mesh, was calculated from an empirical model of flow passingnto a regularly spaced grid of openings (Idelchik, 1986). This modelncorporates the effects of the mesh’s Reynolds number, hydrauliciameter, and open area ratio. The pressure drop across the mesh
ength, �pp, was calculated from an analytical model of the flow athe entrance of a cylindrical tube (Fargie and Martin, 1971). This
odel differs from the commonly used Hagen–Poiseuille equa-ion in that it accounts for the increasing boundary layer thicknessithin the entrance region of the tube, which makes it consis-
ent with both experimental and numerical studies of flow in thentrance region (Ward-Smith, 1980). Lastly, it was assumed thathe hydraulic resistance downstream of the filtering pad was neg-igible and that fluid at the gill openings remained at ambientressure, such that the downstream pressure, pe, was also equal tombient pressure. Mouth and mesh dimensions were taken as theverage of the measured morphologies, mesh holes were assumedo be circular, and the fluid density and viscosity were that of sea-ater at 25.5 ◦C (Dietrich et al., 1980). This model makes use ofnumber of simplifying assumptions regarding the mesh mor-
hology. The sensitivity of the calculated mouth velocity to thesessumptions was examined by varying mesh parameters within aealistic range; the resulting range in predicted mouth velocity isresented in Section 3.4. Eqs. (1) and (2) were solved for the flowelocity at the mouth, Um, using a numerical root-finding algorithmMATLAB 7.6.0; Mathworks, Inc., Natick, MA, USA).
.7. Statistics
Plankton lengths and widths between feeding and non-feedingreas were compared by Mann–Whitney rank sum test due to theery unbalanced sample sizes. Amphipod and crab measures wereot tested due to small sample size. Plankton densities between
eeding and non-feeding (control) sites were compared by a two-ailed t test after ln transformation, and similarly, plankton biomassfter square root transformation. Swimming speed of the feedingnimals was related to total length with a linear regression. Nutri-nt data, being very unbalanced with only 2 samples at non-feedingreas and 24 at feeding areas, were tested with a Mann–Whitneyank sum test. All tests were conducted with an alpha level of 0.05nd tests were performed with SigmaStat version 3.1 (SSI, San Jose,A, USA).
The experiments and observations conducted during thisesearch comply with the Animal Care and Use Committee ofhe University of South Florida protocol numbers W 3170 and W255; the knowledge and permission of the Comision Nacional dereas Naturales Protegidas (CONANP) of the Secretaria de Mediombiente y Recursos Naturales (SEMARNAT), Mexico; and theequirements of the Georgia Aquarium Conservation, Research andnimal Care Committee.
. Results
.1. Field observations
Please cite this article in press as: Motta, P.J., et al., Feeding anatomy, fisurface ram filter feeding off the Yucatan Peninsula, Mexico. Zoology
In 2006, 2007 and 2008, a total of 33 whale sharks ranging in sizerom 450 to 850 cm TL were tracked by boat while surface ram filtereeding north of Cabo Catoche. The average water temperature was5.5 ◦C and average swimming speed during this feeding behavior
sharks representing 67 days of archival depth data. Standard error bars for the foursharks are indicated by hour. Overall, the four sharks spent an average of 31.1% or7.5 h/day in surface waters.
was 1.1 ± 0.04 m/s (mean ± s.e.m.); range 0.5–1.6 m/s). Swimmingspeed was not related to total length (F = 0.201, df = 1, p = 0.657).The sharks (N = 20) swam at an average angle of ∼13 ± 0.3◦ upwardpitch with their heads at or slightly above the water surface suchthat the dorsal surface of their head and part or all of the dor-sum between the rostrum and the first dorsal fin was exposed (seeelectronic supplement Shark 11 2006 underwater view of surfaceram filter feeding). Underwater and surface observations duringsurface ram filter feeding indicated that the open mouth formedan ellipse with the internal width greater than the height. Duringthe surface ram filter feeding, an average of 15.3 ± 1.0% (N = 27, 105measures) of the vertical height of the open mouth was above thewater’s surface; however, many sharks surface fed with the openmouth completely underwater with only the dorsum of the headand anterior body above water. When visible, the laser calibrationindicated flow rate in front of the shark matched swim speed ofthe shark as measured by GPS. Flow around the lateral edges of themouth (formed by the labial cartilages) formed a bow wave suchthat water medial to each bow wave entered the mouth (Fig. 2;see also electronic supplements Shark 6 2008 aerial view of surfaceram filter feeding and Shark 9 2007 aerial view of surface ram filterfeeding). Coughing during surface ram filter feeding, resulting inmaterial being forcefully expelled out of the mouth, was observedon numerous occasions (see electronic supplement Shark 8 2008coughing behavior). Time between coughs ranged from 3.25 to13 min (mean = 7.4 min, ±1.6 s.e.m., N = 5). Vertical suction feedingwas not observed.
Four deployed PAT tags were physically recovered from whalesharks tagged at the study site, comprising three males (5.5–7 mTL) and one female (7 m TL). The archived surface depth data(0–1 m depth range) were only analyzed for the periods of 1, 2,18, and 46 days after tagging, respectively, for a combined totalof 67 days of data where the sharks remained in the study area.Expressing these combined data as an hourly weighted averagerevealed a pattern of greater surface swimming in the morning(06:00–10:59, 46.3%), a decrease around mid-day (11:00–13:59,33.2%), followed by increased surface swimming in the mid- to lateafternoon (14:00–18:59, 48.0%), and the least surface swimming atnight (19:00–05:59 = 16.0%) (Fig. 3). Overall, these sharks spent on
lter-feeding rate, and diet of whale sharks Rhincodon typus during(2010), doi:10.1016/j.zool.2009.12.001
average 31.1% of the time, equal to 7.5 h/day, in surface waters.Combined aerial and boat counts indicated a pattern similar to
the satellite-tagged sharks with the number of sharks per hourof observation peaking during mid-morning, the sharks retreat-

ARTICLE IN PRESSG ModelZOOL-25212; No. of Pages 14
8 P.J. Motta et al. / Zoology xxx (2010) xxx–xxx
Table 2Combined length and width (mm) data of plankters in feeding and non-feeding areas.
2007 + 2008 Feeding area Non-feeding area
Length (mm) Width (mm) N Length (mm) Width (mm) N
Sergestids 10.38a 0.66a 842 9.72 0.60 187Chaetognaths 10.74 0.69a 237 10.73 0.62 72Copepods 1.07a 0.34a 188 0.86 0.26 239Fish eggs 1.03 1.03 13 0.94 0.94 133Crabs 2.28 1.14 7 1.59 1.11 2
N ces wi
iiotf
3
sans
f0f0atpt(
nbnM8cm
Fooi
Amphipods 0.82 0.34
is the number of plankters measured in each category; for sergestids depth replaa Significantly greater in feeding sites.
ng to sub-surface waters about noon, and again increasing slightlyn number at the surface in mid-afternoon (Fig. 4). The few boatbservations of sub-surface swimming, obscured by low underwa-er visibility, indicated some sharks were using sub-surface passiveeeding while the majority swam with their mouths mostly closed.
.2. Plankton composition, size and nutrient analysis
In the feeding areas, plankton was dominated by sergestidhrimp (57.2%), calanoid copepods (15.9%), chaetognaths (12.8%),nd fish larvae (12.2%). In non-feeding areas, plankton was domi-ated by calanoid copepods (45.4%), fish larvae (20.8%), sergestidhrimp (15.9%), and chaetognaths (12.1%).
In 2007 and 2008, the median length of plankters in theeeding areas ranged from 0.82 to 10.74 mm, and width from.34 to 1.14 mm. In the non-feeding areas the length rangedrom 0.57 to 10.73 mm, and the width ranged from 0.15 to.94 mm. The three dominant prey items, sergestids, copepods,nd chaetognaths, were greater in width at feeding sites comparedo non-feeding sites for the two years combined (t = 80337.500,< 0.001; t = 44595.500, p < 0.001; t = 9217.000, p = 0.003, respec-
ively), and sergestids and copepods were greater in lengtht = 76888.000, p < 0.001; t = 44742.000, p < 0.001) (Table 2).
Nutrient content (protein, lipid, ash, kJ) as well as moisture didot differ between feeding and non-feeding areas (p = 0.163–0.885),ut this result must be viewed with caution as only 2 samples at
Please cite this article in press as: Motta, P.J., et al., Feeding anatomy, fisurface ram filter feeding off the Yucatan Peninsula, Mexico. Zoology
on-feeding sites were compared to samples at 24 feeding sites.oisture content of plankton samples from feeding areas was
8.9 ± 0.46%, mean crude protein content was 6.3 ± 0.32% (as a per-ent of total wet weight), mean lipid content was 0.8 ± 0.05%, andean ash content was 3.5 ± 0.10%. Mean calculated gross energy
ig. 4. Number of sightings of sharks surface ram filter feeding per unit hour ofbservation from 08:00 to 16:00 h, based on combined boat and aerial observationsf 3163 sightings over 346 h of observation from 2006 to 2008. Standard errors arendicated.
2 0.57 0.15 2
dth; crabs include both zoea and megalopae.
of the plankton was 1.357 ± 0.084 kJ/g (wet weight) or 12.225 kJ/gdry weight.4
Mean plankton density was greater (1841 ± 616 per m3) in thefeeding areas than in the non-feeding (control) areas (752 ± 429per m3; t = −2.171, 32 df, p = 0.037). Likewise, plankton biomass wasabout 2.5 times greater at feeding sites (4.5 ± 0.6 g/m3 wet weight)than at non-feeding sites (1.8 ± 0.7 g/m3 wet weight; t = 3.232, 32df, p = 0.003).
3.3. Anatomy
Anatomical measurements indicated maximum internal mouthwidth was 12.0% (N = 8), and mouth height 6.3% (N = 10) of TL, andthe open mouth width to height ratio was 1.9 (N = 10). Internasalwidth was 10.0% of TL (N = 11), and vertical mouth height/internasalwidth was 0.61 (N = 11). Based on open mouth internal heights, theestimated total open mouth area was 2035 cm2 for shark A (622 cmTL), 1841 cm2 for shark B (593 cm TL), and 1079 cm2 for shark C(443 cm TL) (N = 4 frontal pictures of feeding sharks).
The anterior margin of the mouth is funnel-shaped with thelabial cartilages forming the lateral walls of the funnel. Mouthwidth, as recorded here, refers to the narrowest aperture of thefunnel, in essence the anterior dimensions of a “tube” throughwhich water may flow.5 Posterior to the upper and lower bandsof tiny teeth are two upper and two lower passive buccal valves.In the 593 cm TL male shark, the anterior lower buccal valve was3 cm wide, and attached by a frenulum at the midline, and theposterior lower valve was 10 cm wide and also was attached atthe midline. The anterior upper valve was 3 cm and the poste-rior upper valve was 4 cm wide and neither was attached at themidline.
On each side of the pharynx there are five lower and five upperfiltering pads. The lower pads were larger in area than the cor-responding upper pads (Table 1). The most posterior pads werethe largest. The first four pads were approximately rectangularin shape, whereas the fifth pads were somewhat triangular withtheir apex pointed posteriorly (Fig. 1). Adjacent pads from ante-rior to posterior were jointed by a flexible raphe of connectivetissue. A similar raphe also ran medially, joining the right andleft pads dorsally and ventrally. This tissue was connected to thepharyngeal wall anteriorly and to the entrance of the esophagusposteriorly, such that water must pass through the pads to exit tothe parabranchial chamber and eventually out through the pha-
lter-feeding rate, and diet of whale sharks Rhincodon typus during(2010), doi:10.1016/j.zool.2009.12.001
ryngeal clefts. The entire pharyngeal basket is therefore flexibleand can collapse or expand, particularly in the sagittal plane. Thecartilaginous branchial arches I–IV were lateral to and between thefiltering pads I–V and their raphes.
4 Total dry weight, not ash-free dry weight.5 Consequently, other authors either refer to mouth width as the widest part of
the funnel or the narrow aperture, without clearly explaining which measure theyare taking.

INZ
ology x
aSmsiGtmpabcbcofltb
mo1onamtrsbT(sa
3
flsoiTvaapt
iftastnhiotaa
ot
ARTICLEG ModelOOL-25212; No. of Pages 14
P.J. Motta et al. / Zo
The pharyngeal surface of each filtering pad was composed ofdenticle-covered reticulated mesh with irregularly shaped holes.uperficial to this mesh were uniformly arranged cartilaginous pri-ary vanes which merged to form a series of larger cartilaginous
econdary vanes, which in turn opened into the parabranchial cav-ty (Fig. 1). These secondary vanes, the “ladder-rung partitions” ofudger (1941b, p. 94), spanned the branchial arches and supported
he filtering pad laterally. Water must therefore flow through theesh, between the primary and secondary vanes, and over the
rimary gill filaments of four holobranchs which lay betweendjacent pads, lateral to the cartilaginous branchial arches. A hemi-ranch was located on the anterior surface of the first pharyngealleft. The fifth and most posterior pads were supported externallyy greatly flattened cartilaginous pharyngobranchials (upper) anderatobranchials (lower). Water flowing through the posterior endf the fifth triangular filtering pad is directed anteriorly by theseattened cartilages and a connective tissue floor. It must flow overhe most posterior hemibranch and into the parabranchial chamberefore exiting through the pharyngeal clefts.
The total area of the filtering pad for shark A and B was esti-ated at 10,799 and 11,807 cm2, respectively, with an average area
f 11,303 cm2. Average mesh diameter was 0.9 mm for shark A and.4 mm for shark B, with a mean of 1.2 ± 0.1 mm (Table 1). Somef the filtering pads of shark B were superficially abraded duringecropsy, perhaps leading to the slightly larger diameter. The openrea ratio ˇ was 0.46 ± 0.02 for shark A and 0.60 ± 0.02 for B, with aean of 0.52 ± 0.02 for both sharks. The average height and width of
he primary vanes for both sharks was 12.0 ± 0.2 and 5.2 ± 0.1 mm,espectively, and the average combined height of the primary andecondary vanes was 33.6 ± 0.5 mm (Fig. 1). The average distanceetween the spacing of the secondary vanes was 16.9 ± 1.6 mm.he ratio of combined height (primary + secondary vanes) to widthprimary vanes) was 6.5. The excurrent parabranchial channel ofhark A had a width of ∼6 cm, a dorso-ventral height of ∼80 cm,nd a streamwise depth of ∼20 cm.
.4. Filtering volume and energetics
The hydrodynamical model presented above indicated that theow velocity of water entering the mouth was nearly equal to thewimming speed and was relatively constant over a realistic rangef parameter values. For the measured morphology, the flow veloc-ty at the mouth was calculated to be 90.4% of the swimming speed.he sensitivity of these calculations was assessed by independentlyarying the mesh diameter (0.9–1.5 mm), mesh length (5–15 mm),nd mesh opening shape (elliptical or rectangular geometry, withfineness ratio that varied between 1.0 and 5.0). Such calculationsroduced a range of mouth velocities between 86.1% and 93.5% ofhe swimming speed.
Given the measured morphology and the calculated flow veloc-ty at the mouth, it was possible to calculate the Reynolds numberor each element of the flow tract. Using the mouth width andhe mean flow velocity through the mouth, the Reynolds numbert the mouth opening was estimated to be 7.3 × 10⁵ for a whalehark swimming at 1.1 m/s. Using the mesh opening diameter andhe mean flow velocity through each mesh opening, the Reynoldsumber within the mesh was estimated to be 3.0 × 10². Using thealf-width of the parabranchial chamber and the mean flow veloc-
ty through this channel, the Reynolds number within the outflowf the filtering apparatus was estimated as 1.0 × 10⁴. Additionally,he hydrodynamical model was used to calculate the pressure head
Please cite this article in press as: Motta, P.J., et al., Feeding anatomy, fisurface ram filter feeding off the Yucatan Peninsula, Mexico. Zoology
cross the filtering apparatus, which was estimated to be 113 Pa forwhale shark swimming at 1.1 m/s.
The biomass ingested was estimated by calculating the volumef water passing through the partially submerged mouth per unitime multiplied by the mean biomass of plankton per unit volume.
PRESSxx (2010) xxx–xxx 9
With an average of 84.7% of the open mouth underwater duringsurface ram filter feeding, a 443 cm TL shark would present an openmouth area of ∼914 cm2 (84.7% of 1079) and a 622 cm TL sharkan open mouth area of ∼1724 cm2 (84.7% of 2035) to the water.With a flow velocity at the mouth of 0.99 m/s (90.4% of 1.1 m/s) thesmaller shark would filter 0.0914 m2 × 0.99 m/s or 0.0905 m3/s ofwater = 326 m3/h, and the larger shark would filter 614 m3/h. Withan average plankton biomass of 4.5 g/m3 at the feeding sites, thesharks would, on average, ingest 1467 and 2763 g of plankton perhour, respectively, and for an average feeding time of 7.5 h per day,a total of 11,003 and 20,723 g of plankton/day, which at 1.357 kJ/gequates to 14,931 and 28,121 kJ per day, respectively.
4. Discussion
4.1. Feeding behavior
The aggregation of juvenile and adult male and female whalesharks off the Yucatan Peninsula is among the most importantpopulation centers for the species and is the largest whale sharkaggregation site known in the world (Hueter et al., 2008). Duringthe course of this study the sharks spent the majority of daylighthours in the summer months surface ram filter feeding or swim-ming just below the surface in the shallow, plankton-rich watersnorth of Cabo Catoche. This aggregation of sharks appears to occurin response to upwelling currents off the eastern Campeche Bank,which bring nutrient-rich waters that produce abundant plank-ton (Merino, 1997; Pérez et al., 1999; Zavala-Hidalgo et al., 2006;Cardenas-Palomo, 2007). The plankton tends to concentrate ator just below the surface, particularly before 11:30–12:00 h eachday during the summer months (de la Parra, personal observa-tion). Similar aggregations in response to plankton blooms or massspawning events also occur at: Ningaloo Reef, Australia (Colman,1997; Wilson et al., 2001; Taylor, 2007); Gulf of Tadjoura, Djibouti(Rowat et al., 2007); off the Seychelles, Mozambique, and Mal-dives (Rowat and Gore, 2007); Gladden Spit, Belize (Heyman et al.,2001); the Galapagos Islands (Arnbom and Papastavrou, 1988); theGulf of California (Clark and Nelson, 1997; Hacohen-Domene et al.,2006; Nelson and Eckert, 2007); and the northern Gulf of Mexico(Hoffmayer et al., 2007).
The behavior of whale sharks swimming with the body inclinedupward and the open mouth partially or totally submerged isconsistent with the reports from other localities where plankton-rich surface waters occur (Clark and Nelson, 1997; Heyman etal., 2001; Nelson and Eckert, 2007; Taylor, 2007). The swimmingspeeds observed during this type of feeding ranged from 0.5 to1.6 m/s (average 1.03 m/s) and are remarkably similar to speedsof surface feeding whale sharks in the north central Gulf of Mex-ico (average speed 1.03 m/s; Hoffmayer et al., 2007), off BajaCalifornia (0.3–1.1 m/s; Nelson and Eckert, 2007) and NingalooReef, Australia (1.0–1.5 m/s; Taylor, 2007). This average swimmingspeed for 29 sharks of average TL 6.7 m is slightly less than thepredicted optimum swimming speed (1.13 m/s) for energy conser-vation for swimming fish (U0 = 0.503L0.43; Weihs, 1977; Weihs etal., 1981). The latter theoretical predictions are, however, based onsmaller bony fishes and would be an overestimate for larger sharkswith lower maintenance costs (Weihs, personal communication),although the estimates have been shown to be very accurate for2 m standard length Carcharhinus leucas and C. plumbeus (Weihset al., 1981). Eckert and Stewart (2001) also found that whale
lter-feeding rate, and diet of whale sharks Rhincodon typus during(2010), doi:10.1016/j.zool.2009.12.001
sharks had occasional travel rates of 1.1 m/s but when traversinglonger distances averaged 0.3 m/s. Rowat and Gore (2007) sim-ilarly found ground speeds between 0.3 and 0.7 m/s for whalesharks traversing long distances. However, these long distanceaverages include periods of vertical movement including deep

INZ
1 ology
dWdthms(dwaw(opabafirwshmifspewlrt
wdrflanbtdtamsiioiO7i(twwaudt(a
ARTICLEG ModelOOL-25212; No. of Pages 14
0 P.J. Motta et al. / Zo
ives (Eckert and Stewart, 2001; Graham et al., 2006; Wilson, 2006;ilson et al., 2006; Brunnschweiler et al., 2009), and time and
istance required to execute dives is generally not considered inhese swimming speed calculations. Thus, whale sharks may makeorizontal oceanic crossings at higher speeds than localized move-ents suggest (Rowat and Gore, 2007). The average swimming
peed for filter feeding basking sharks (4–6.5 m TL) is 0.85 m/srange 0.76–0.94 m/s), which is 29–39% slower than the speed pre-icted by the model of Weihs and Webb (1983) (Sims, 2000b). Asas suggested for basking sharks, we expect that swimming with
n open mouth and swimming at the surface increases drag onhale sharks, effectively reducing the optimum swimming speed
Videler, 1993; Sims, 2000b). While the pressure at the mouthpening is reduced by the flow of water into the buccal cavity, theressure head over the mesh imparts a drag force onto the filteringpparatus. It would seem likely that the total drag is increased bothy the passage of water through the small mesh openings as wells by any flow separation that may occur as a result of the outflowrom the gill openings. This is consistent with studies of filter feed-ng bony fishes, in which filter feeding animals have a metabolicate elevated above that of non-feeding animals even beyond thathich would be expected simply from differences in swimming
peed (James and Probyn, 1989; Macy et al., 1999). On the otherand, a lower than expected swimming rate may represent theost efficient speed for filtering plankton through the unique filter-
ng pads. Although not recorded, it appeared that surface ram filtereeding whale sharks at the Yucatan Peninsula site reduced theirwimming speed when encountering a particularly dense planktonatch, as do whale sharks feeding on fish spawn off Belize (Heymant al., 2001) and plankton-feeding basking sharks (Sims, 1999). Thehale shark body pitch of approximately 13◦ most likely permits
ift generation by the ventral body surface and pectoral fins at theseelatively low speeds (Wilga and Lauder, 2000), allowing the sharkso keep their open mouths at the water’s surface.
Our satellite tags and observational data both indicate thathale sharks off Cabo Catoche approach the surface to filter feeduring the early morning, peak in abundance during mid-morning,eturn to slightly deeper waters around noon, and resurface toeed in the afternoon, returning to deeper waters again in theate afternoon. Although on-water observations were not madet night, satellite tag data indicate limited surface activity duringight hours. In almost all cases, when the sharks were swimmingetween 0 and 1 m depth in the daytime they were surface ram fil-er feeding at the study site. When the sharks retreated to slightlyeeper waters (∼2–6 m) and were still visible from the surface,hey were often swimming with their mouths slightly open andpparently not filter feeding. These diurnal vertical movements areost likely related to diel vertical migrations of the plankton. Time
pent at the surface by basking sharks depends largely on the min-mum abundance of prey in the surface layer and time of day ands timed to plankton migration, and lower, near threshold, levelsf zooplankton abundance may be more important in determin-ng surface duration than higher levels (Sims et al., 2003, 2005).ur satellite tag estimate of four whale sharks spending on average.5 h/day within 0–1 m depth, presumably feeding at the surface,
s in close agreement with Rowat and Gore (2007) and Rowat et al.2009), who found from pop-up archival tags that whale sharks offhe Seychelles spent on average 60% of daylight hours (7.2 h/day)ithin 10 m of the surface. In the Gulf of California (Sea of Cortez),hale sharks spend more than or equal to 80% of their time (24 h)
t depths less than 10 m; however, the satellite tracking method
Please cite this article in press as: Motta, P.J., et al., Feeding anatomy, fisurface ram filter feeding off the Yucatan Peninsula, Mexico. Zoology
sed to determine this was admittedly biased towards shallowerepths (Eckert and Stewart, 2001). In the western Indian Ocean,wo tagged whale sharks spent on average 7.8 h/day at the surfaceshark 1 = 5.6 h/day, shark 2 = 10.0 h/day at surface) and an aver-ge of 13.9 h/day between 0 and 5 m depth (Brunnschweiler et al.,
PRESSxxx (2010) xxx–xxx
2009, personal communication). These accounts, however, do notdifferentiate between feeding and non-feeding behavior.
4.2. Diet and foraging behavior
The surface ram filter feeding whale sharks observed off theYucatan Peninsula sought out surface aggregations of planktondominated by sergestid shrimp, calanoid copepods, chaetognaths,and fish larvae. The three dominant prey items (sergestids, cope-pods and chaetognaths) were greater in width at feeding sitescompared to non-feeding sites, and shrimp and copepods weregreater in length. The sharks were often observed to turn repeatedlyto stay within the denser plankton patches, which were visibly red-dish in color. Off La Paz, Mexico, whale sharks have been observedsuction feeding in dense patches of plankton, primarily copepods,and they stayed in the patches with frequent turns (Clark andNelson, 1997). At Bahía de Los Angeles, Baja California, whalesharks also fed on dense plankton patches primarily composedof copepods, but interestingly varied feeding method with plank-ton density (Nelson and Eckert, 2007). Surface ram filter feedingoccurred at a mean plankton density of 86.9 × 10³ m−3, which wasover 4 times greater than densities observed during vertical suctionfeeding, and 14 times greater than during sub-surface passive feed-ing. Our recorded mean plankton density off the Yucatan Peninsulawas much lower (1841 ± 616 per m3), and even lower than den-sities recorded during the sub-surface feeding by sharks off BajaCalifornia (5900 per m3) (Nelson and Eckert, 2007). In the north-ern Gulf of Mexico, whale sharks surface ram filter feed on eggs oflittle tunny Euthynnus alletteratus at densities of 9000 eggs per m3
(Hoffmayer et al., 2007). Our relatively low densities could be in partdue to the plankton being primarily confined to the very surfacewaters whereas the plankton net sampled to a depth of approxi-mately 45 cm.
4.3. Anatomy, prey and mesh diameter
The whale shark’s filtering pads are a unique autapomorphiccharacter. Although their homology is unclear, Denison (1937),Gudger (1941b) and Compagno (1984) referred to them as gill rak-ers. During filter feeding, water enters the elliptical mouth, passesinto the pharynx, proceeds through the 20 filtering pads exitingbetween the primary and secondary vanes, passes over the pri-mary gill filaments and into the parabranchial chamber, and exitsthe external gill slits. The flexible raphe joining the filtering padslaterally and mid-sagittally prevents water discharge anywherebut through the filtering pads and allows the pharyngeal cavityto expand in the sagittal plane. The large labial cartilages laterallyocclude the mouth opening, directing water into the funnel-shapedoral cavity, and the passive buccal valves help to prevent the back-flow of water when the mouth is closed. Similar labial cartilages andbuccal valves are found in the orectolobid suction feeding nurseshark Ginglymostoma cirratum (Motta and Wilga, 1999). Whenobserved inside the pharyngeal cavity of an actively feeding whaleshark, the upper filtering pads are more horizontal in orientationthan the ventral pads, which tend to be ventrally displaced and pre-sented to the incoming water at an acute angle due to the ventrallybulging pharyngeal cavity (Figs. 1 and 5).
During surface ram filter feeding we observed little or noevidence of pulsatile suction feeding. This is in agreement withobservations by Taylor (2007). The gill slits remained open andgently fluttering as the animals swam forward and there was no
lter-feeding rate, and diet of whale sharks Rhincodon typus during(2010), doi:10.1016/j.zool.2009.12.001
indication of rhythmical pumping as has been seen during station-ary/vertical suction feeding and in some cases sub-surface passivefeeding (Clark and Nelson, 1997; Heyman et al., 2001). On oneoccasion, when a shark encountered what appeared to be a par-ticularly dense plankton patch the shark slowed to a near stop

ARTICLE ING ModelZOOL-25212; No. of Pages 14
P.J. Motta et al. / Zoology x
Ficp
aua
ab2T8wtstat0wfpop2
4
hhdatCamtttbet
ig. 5. Anterolateral view into the pharynx of an actively feeding whale shark show-ng the angle of the lower pads relative to open mouth. The branchiohyoid apparatusan depress ventrally, thereby enlarging the cavity and orienting the lower pads, inarticular, so that they face the incoming water at an acute angle.
nd commenced pulsatile suction feeding while remaining at thesual swimming angle, with the dorsal surface of the head and bodybove the water’s surface.
Total filtering area of the pads greatly exceeds the open mouthrea, which is expected to reduce the flow resistance incurredy the filtering pads. The estimated total open mouth area was035 cm2 for shark A (622 cm TL), and 1841 cm2 for shark B (593 cmL). Even during surface ram filter feeding, in which an average of4.7% of the open mouth was underwater, the area through whichater passes into the buccal cavity (∼1724 and 1559 cm2, respec-
ively) was notably smaller than the total filtering pad area in bothharks (10,799 cm2 and 11,807 cm2, respectively). However, theotal filtering pad area includes both the area of the mesh openingsnd the area of the mesh itself. The ratio of the area of the openingso the total area, the open area ratio ˇ, was 0.46 for shark A and.60 for shark B. Accounting for this, the open area through whichater can pass through the filtering pads was 4924 and 7096 cm2
or sharks A and B, respectively. As the pads become clogged withlankton, the effective mesh diameter would decrease as the totalpen area, leading to the “coughing” behavior that back-flushes theads and clears them (Hoffmayer et al., 2007; Nelson and Eckert,007; Taylor, 2007; this study).
.4. Filtering mechanism
Consideration of the filter feeding mechanism in whale sharksas focused on two potential methods: dead-end sieving andydrosol filtration (Gudger, 1941a,b; Clark and Nelson, 1997). Inead-end sieving, water and the entrained particles approachpproximately perpendicular to the filter and particles largerhan the pores are trapped while smaller particles pass through.onversely, in a hydrosol filter, the filtering surfaces have somedhesive properties, possibly as a result of being covered with stickyucus, such that any particle that contacts a filtering element sticks
o it and is captured. The particles encounter the hydrosol filter due
Please cite this article in press as: Motta, P.J., et al., Feeding anatomy, fisurface ram filter feeding off the Yucatan Peninsula, Mexico. Zoology
o hydrodynamic processes such as direct interception and iner-ial impaction, allowing particles even smaller than the pores toe retained (Rubenstein and Koehl, 1977; LaBarbera, 1984). How-ver, recent work on filter feeding in bony fishes has implicated ahird potential filtering mechanism known as cross-flow filtration.
PRESSxx (2010) xxx–xxx 11
In this method, the water and entrained particles pass approxi-mately parallel to the gill arches or filter pads while traveling athigh velocities. As the suspension travels posteriorly, the waterexits between the gill rakers or through the filtering pads, and theparticles are concentrated into a bolus at the rear of the pharynxwhere they can be swallowed (Brainerd, 2001; Sanderson et al.,2001; Callan and Sanderson, 2003; Cheer et al., 2006). This mecha-nism results in the entrapment of both larger and smaller particles,reduces fouling of the filtering apparatus, concentrates particlesin the posterior pharyngeal cavity, and transports the food to theentrance of the esophagus. It has been demonstrated to functionduring suspension feeding in some bony fishes (Sanderson et al.,2001; Callan and Sanderson, 2003; Smith and Sanderson, 2007)and has been hypothesized to contribute to filter feeding in finwhales (Goldbogen et al., 2007). Cross-flow filtration is also used innumerous industrial applications, particularly where it is necessaryto reduce clogging of the filter element (Ripperger and Altmann,2002).
The hydrodynamics of filter feeding in whale sharks appear tobe comparable to that observed in filter feeding bony fishes andbaleen whales. The Reynolds number for flow through a single meshopening of the filtering apparatus was estimated to be ∼300. This iswithin the range of 150–600 observed for flow past the gill rakersof suspension feeding bony fishes (Sanderson et al., 2001) and iscomparable to the value of 570 reported for flow past the baleenfringes of fin whales (Goldbogen et al., 2007). At such a Reynoldsnumber, flow through the channel is expected to remain laminareven for ducts with rough surfaces (Ward-Smith, 1980). The pres-sure drop across the mesh was calculated to be 113 Pa for a whaleshark swimming at 1.1 m/s. This relatively small pressure head isconsistent with the absence of a large bow wave, as was observedin videos of surface feeding whale sharks. Interestingly, this dif-ferential is markedly less than the ∼2000 Pa pressure head thatwas calculated for bowhead whales during continuous filter feed-ing (for a 10 m body length swimming at 1.1 m/s; Werth, 2004). Itis unclear whether this disparity arises from morphological differ-ences or differences in how the flow through the respiratory tractwas modeled. However, the pressure head of 113 Pa calculated forwhale sharks is consistent with the pressure observed across fishgills during routine ventilation, which falls between 30 and 200 Pafor a diverse range of taxa (Hughes, 1960a,b; Burggren and Bemis,1992; Ferry-Graham, 1999).
Several workers have questioned the effectiveness of the whaleshark’s filtering pads at sustaining a high flow of water throughthem during ram filter feeding (Taylor et al., 1983; Sanderson andWassersug, 1993) and their ability to filter out plankton smallerthan the holes in the filtering pads (Clark and Nelson, 1997).Although the majority of plankters ingested by the whale sharks offCabo Catoche are greater in length than the average mesh diameterof the filter pads (1.2 mm), the ability to feed on plankton less thanthe diameter of the openings in the filter pads enhances the foodresources available to the whale shark. At Gladden Spit in Belize,the sharks were observed feeding in areas dominated by fish eggs of0.75–0.78 mm diameter (Heyman et al., 2001) and in the northernGulf of Mexico whale sharks surface ram filter feed in water abun-dant with fish eggs of 0.70–0.80 mm diameter (Hoffmayer et al.,2007). If whale sharks relied on dead-end sieving to perform filterfeeding, the majority of such plankton would likely not be cap-tured. However, if whale sharks are able to utilize either hydrosolfiltration or cross-flow filtration, then it is possible that such itemscould be effectively retained. There is no direct evidence for cross-
lter-feeding rate, and diet of whale sharks Rhincodon typus during(2010), doi:10.1016/j.zool.2009.12.001
flow filtration in whale sharks, but the morphology suggests thismay be an important mechanism in their filter feeding. The fil-tering pads of the whale shark, particularly the lower pads, lie atan acute angle to the incoming water when the mouth is openand the pharynx distended, such that the bulk of the water flow

INZ
1 ology
mpfotpisnup(wtfbwsw(
oogtaspwotddpltaahocitnbaftflbaabrorbp
4
lvni
ARTICLEG ModelOOL-25212; No. of Pages 14
2 P.J. Motta et al. / Zo
ight be expected to be parallel or near parallel to the filteringads (Figs. 1 and 5). Additionally, in computational models of filtereeding in bony fishes, vortices were observed near the esophagealpening (Cheer et al., 2001). If such vortices exist in whale sharks,hey could act to increase the flow velocities parallel to the filteringads. As a feeding mechanism in whale sharks, cross-flow filtration
s an intriguing hypothesis in part because it might explain how theharks are able to feed on very dense aggregations of plankton andot quickly clog their filter pads. In three species of bony fishessing cross-flow filtration only a very small amount of the ingestedarticles contacted the filtering apparatus and accumulated thereSanderson et al., 2001). Such a mechanism would explain howhale sharks ingest large volumes of plankton yet “cough” rela-
ively infrequently to clear the filtering pads. By comparison, filtereeding bowhead whales (Balaena mysticetus) pause to clean thealeen about every 2.5 min (Simon et al., 2009). Such coughs byhale sharks may perform a role similar to the temporary rever-
als of flow within the oropharyngeal cavity of some bony fishes,hich lift and clear mucus and particles from the branchial arches
Smith and Sanderson, 2008).The consequences of the filtering pads and primary and sec-
ndary vanes for the excurrent flow also remain unclear. The effectf flow passing through mesh-like bodies has been studied to thereatest extent in the context of water and wind tunnel design. Inhe construction of wind tunnels, thin screens are used to produceuniform flow across a section by imposing a uniform, static pres-
ure drop. However, while the screens improve uniformity they alsoroduce small-scale turbulence. It has been observed that screensith an open area ratio ˇ greater than 0.57 reduce this production
f excess turbulence (Mehta and Bradshaw, 1979). Thick collima-ors are used to dissipate upstream vortices larger than the celliameter by restricting the lateral velocities. However, while theyissipate vortices larger than the cell diameter, collimators will alsoroduce vortices that are smaller than the cell diameter. Thus, col-
imators are most effective at reducing the total turbulence whenhe cell length is approximately 6–8 times the cell diameter (Mehtand Bradshaw, 1979). Interestingly, the filtering pad has an openrea ratio of 0.53 while the vanes form “cells” with a combinedeight (primary + secondary vanes) to width (primary vanes) ratiof 6.5. While the geometry of the filtering pads is certain to beonstrained by their role in filtering plankton, it is possible thatt also serves to “condition” the outflow. The Reynolds number ofhe excurrent channels was estimated to be∼104. At these Reynoldsumbers the flow is very likely turbulent, but the nature of that tur-ulence is uncertain. In the initial length of a parallel channel, suchs the parabranchial chamber, the flow is characterized by high-requency, small-scale turbulence and reduced boundary layerhickness (Byrne et al., 1969). However, after this initial length, theow is dominated by low-frequency, large-scale turbulence and theoundary layer extends the entire channel width (Clark, 1968; Moinnd Kim, 1985). It is possible that the primary and secondary vanesct to reduce the upstream turbulence in the parabranchial cham-er and delay the formation of low-frequency vortices within theelatively short outflow tract (∼4 channel widths long). Reductionf such turbulence within the outflow tract may be important ineducing the hydrodynamic losses that would otherwise increaseackpressure and reduce the flow of water through the filteringad.
.5. Energetics
Please cite this article in press as: Motta, P.J., et al., Feeding anatomy, fisurface ram filter feeding off the Yucatan Peninsula, Mexico. Zoology
The whale, basking, and megamouth sharks are among theargest fishes and all are planktivores. As such they must filter largeolumes of water and consume large quantities of prey for mainte-ance and growth. A surface ram filter feeding whale shark of 4.4 m
s estimated to filter 326 m3/h, and a 6.2 m shark 614 m3/h. In com-
PRESSxxx (2010) xxx–xxx
parison, 5 m basking sharks are calculated to filter 432 m3/h duringsub-surface ram filter feeding (Sims, 1999). The estimated dailyration of 14,931 kJ for a 443 cm TL whale shark and 28,121 kJ for a622 cm TL whale shark are the first in situ estimates for the species.These are probably conservative estimates when considering thatsharks at other localities may feed in much higher plankton densi-ties (Hoffmayer et al., 2007; Nelson and Eckert, 2007). However,a similarly analyzed and independently derived daily ration forcaptive and growing whale sharks (515–664 cm TL) at the GeorgiaAquarium is 17,287–31,238 kJ/day) (Zeigler, personal observation).The similarity in daily ration for these sharks is surprising con-sidering metabolic differences due to captivity, temperature andother environmental factors (Cortes and Gruber, 1994; Schmid andMurru, 1994; Carlson et al., 2004). In contrast, an 8.4 m TL whaleshark at the Okinawa Churaumi Aquarium is fed a daily ration of50,242–83,736 kJ/day (S. Uchida and K. Sato, pers. comm.). Unfor-tunately, lacking length–weight data for these whale sharks, directcomparison of daily ration to other elasmobranchs, which is usu-ally expressed as a proportion of mean body weight per day, isimpossible (Wetherbee and Cortes, 2004). These caloric estimatesmust be taken with caution because of possible errors that couldinclude an underestimate of the number of hours feeding per day,not accounting for sub-surface feeding which could contribute tothe former, and variance and errors in calculating mouth areafrom digital photographs of sharks with their mouths apparentlyfully open. Taylor (2007) observed whale sharks with their mouthsapproximately 50% open when surface ram filter feeding; how-ever, during our underwater observations these surface-feedingsharks appeared to have their mouths fully open the majority ofthe time. In addition, plankton counts will vary by site and time,and energy per gram will vary with plankton composition (Davis,1993).
In contrast to whale and megamouth sharks, which can use suc-tion and ram feeding to collect plankton, basking sharks rely solelyon forward swimming to ram filter feed their prey (Taylor et al.,1983; Compagno, 1990; Sims, 2000a; Nakaya et al., 2008). As such,for basking sharks that only ram filter feed and incur high dragfrom the open mouth, there is a threshold prey density estimatedat approximately 0.62 g wet weight/m3, below which the animalsshould cease feeding because net energy gain can no longer beachieved (Sims and Quayle, 1998; Sims, 1999, 2000a). Off Plymouth,UK, basking sharks forage in areas with zooplankton densities rang-ing from 0.47 to 8.29 g wet weight/m3, and when density was belowthe background level of 0.50–0.80 g/m3, the sharks ceased feeding(Sims, 1999). This predicted foraging threshold for basking sharksis much lower than the plankton density observed at the whaleshark feeding sites off the Yucatan Peninsula (4.5 ± 0.6 g/m3) andeven lower than at non-feeding sites (1.8 ± 0.7 g/m3). By contrast,basking sharks in Monterey Bay, California, off the Pacific coast ofVancouver Island, Gulf of Maine, and north of Santa Cruz Island,California select plankton patches (primarily copepods) with den-sities ranging from 739 to 2647 plankters/m3, very similar to ourrecorded average density of 1841 per m3 (Baduini, 1995). The lat-ter plankton biomass was recorded in a region of upwelling andhigh plankton density and during surface ram filter feeding, whichis reported to occur at the highest plankton densities (Nelson andEckert, 2007). Missing in our data are plankton densities for feed-ing areas not characterized by upwelling and plankton blooms,values which would be instructive in gaining a better understand-ing of overall energetic costs for the whale shark. Nevertheless,we hypothesize that whale sharks, similar to basking sharks (Simsand Merrett, 1997; Sims and Quayle, 1998; Sims, 1999), may avoid
lter-feeding rate, and diet of whale sharks Rhincodon typus during(2010), doi:10.1016/j.zool.2009.12.001
feeding at an energetic loss by moving within ocean basins to for-age in high productivity regions. This leads to patchiness in whaleshark distribution and potentially an erosion of population struc-ture, heightening the need to manage conservation plans for these

INZ
ology x
mSa
4
atitrnfchtbsr
A
ppWsiPCtdMmo(
A
t
R
A
A
A
B
B
B
BB
B
B
C
ARTICLEG ModelOOL-25212; No. of Pages 14
P.J. Motta et al. / Zo
agnificent animals on a global scale (Taylor, 1996; Eckert andtewart, 2001; Eckert et al., 2002; Castro et al., 2007; Schmidt etl., 2009).
.6. Future directions
Utilizing fluid models, fluid flow through the filtering padsnd the putative cross-flow filtration mechanism should be inves-igated. Further estimates of daily ration would provide insightnto the energetics of the world’s largest fish and augment cap-ive husbandry. Future studies should also investigate nutritionalequirements and feeding on a longer time and area scale, span-ing not only these regions of rich plankton biomass but also other
eeding sites. We must also consider the possibility of feeding, preyhoice and energetics during deep dives of whale sharks, whichave been recorded to depths of more than 1700 m and ambientemperatures of about 4 ◦C (Tyminski et al., 2008). Lastly, it woulde instructive to determine if diel vertical migrations of the whalehark, even on such a small scale as occurs off Cabo Catoche, iselated to vertical movements of its plankton food base.
cknowledgements
We sincerely thank Jeronimo Aviles and Eugenio Aceves forroviding photographs of whale sharks, Juerg Brunnschweiler forroviding us his satellite tag data on two whale sharks, and Lisahitenack for help with whale shark dissections. This project was
upported by generous contributions from: the Georgia Aquar-um; Proyecto Domino, Comision Nacional de Areas Naturalesrotegidas, Mexico; NOAA/NMFS to the National Shark Researchonsortium; Mote Marine Laboratory; University of South Florida;he Porter Family Foundation; and an additional anonymous foun-ation. We sincerely thank Jaime Gonzalez, Paco Remolina, andontserrat Trigo for their unrelenting support and encourage-ent. Emily Damstra generously allowed us to base our illustration
f the feeding whale shark on her marvelous original illustrationwww.emilydamstra.com).
ppendix A. Supplementary data
Supplementary data associated with this article can be found, inhe online version, at doi:10.1016/j.zool.2009.12.001.
eferences
OAC, 1984. Official Methods of Analysis, 14th edition. Association of Official Ana-lytical Chemists, Washington, DC.
OAC, 1995. Official Methods of Analysis, 15th edition. Association of Official Ana-lytical Chemists, Washington, DC.
rnbom, T., Papastavrou, V., 1988. Fish in association with whale sharks Rhincodontypus near the Galápagos Islands. Notic. Galápagos 46, 3–15.
aduini, C.L., 1995. Feeding ecology of basking sharks (Cetorhinus maximus) rela-tive to distribution and abundance of prey. M.S. Thesis, Moss Landing MarineLaboratories, San Jose State University, San Jose.
ass, A.J., D’Aubrey, J.D., Kistnasamy, N., 1975. Sharks of the east coast of south-ern Africa. IV. The families Odontaspididae, Scapanorhynchidae, Isuridae,Cetorhinidae, Alopiidae, Orectolobidae and Rhiniodontidae. S. Afr. Assoc. Mar.Biol. Res., Oceanogr. Res. Inst., Invest. Rep., 39.
ean, B.A., 1905. The history of the whale shark (Rhinodon typicus Smith). Smiths.Misc. Coll. 48, 139–148.
rainerd, E.L., 2001. Caught in the crossflow. Nature 412, 387–388.runnschweiler, J.M., Baensch, H., Pierce, S.J., Sims, D.W., 2009. Deep-diving
behaviour of a whale shark Rhincodon typus during long-distance movementin the western Indian Ocean. J. Fish Biol. 74, 706–714.
urggren, W.W., Bemis, W.E., 1992. Metabolism and ram gill ventilation in juvenile
Please cite this article in press as: Motta, P.J., et al., Feeding anatomy, fisurface ram filter feeding off the Yucatan Peninsula, Mexico. Zoology
paddlefish, Polyodon spathula (Chondrostei: Polyodontidae). Physiol. Zool. 65,515–539.
yrne, J., Hatton, A.P., Marriott, P.G., 1969. Turbulent flow and heat transfer in theentrance region of a parallel wall passage. Proc. Instn. Mech. Engrs. 184, 697–712.
allan, W.T., Sanderson, S.L., 2003. Feeding mechanisms in carp: crossflow filtration,palatal protrusions and flow reversals. J. Exp. Biol. 206, 883–892.
PRESSxx (2010) xxx–xxx 13
Cardenas-Palomo, N., 2007. Distribucion espacio-temporal de variables hidrobio-logicas asociadas con el uso del habitat del tiburon ballena (Rhinocodon typus)en el noreste de la peninsula de Yucatan. Tesis de Maestría, Instituto PolitécnicoNacional, Merida, Mexico.
Carlson, J.K., Goldman, K.J., Lowe, C.G., 2004. Metabolism, energetic demand, andendothermy. In: Carrier, J.C., Musick, J.A., Heithaus, M.R. (Eds.), Biology of Sharksand Their Relatives. CRC Press, Boca Raton, pp. 203–224.
Castro, A.L.F., Stewart, B.S., Wilson, S.G., Hueter, R.E., Meekan, M.G., Motta, P.J.,Bowen, B.W., Karl, S.A., 2007. Population genetic structure of the Earth’s largestfish, the whale shark (Rhincodon typus). Mol. Ecol. 16, 5183–5192.
Cheer, A.Y., Ogami, Y., Sanderson, S.L., 2001. Computational fluid dynamics in theoral cavity of ram suspension-feeding fishes. J. Theor. Biol. 210, 463–474.
Cheer, A.Y., Cheung, S., Sanderson, S.L., 2006. Computational fluid dynamics 2004.In: Proceedings of the Third International Conference on Computational FluidDynamics, ICCFD3, Toronto, 12–16 July 2004, In: Groth, C., Zingg, D.W. (Eds.),Computational Fluid Dynamics of Crossflow Filtration in Suspension-FeedingFishes. Springer, Berlin Heidelberg, pp. 301–306.
Church, D.C., Pond, W.G., 1988. Basic Animal Feeding and Nutrition. John Wiley andSons, New York.
Clark, E., Nelson, D.R., 1997. Young whale sharks, Rhincodon typus, feeding on acopepod bloom near La Paz, Mexico. Environ. Biol. Fishes 50, 63–73.
Clark, J.A., 1968. A study of incompressible turbulent boundary layers in channelflow. Trans. ASME J. Basic Eng. 90, 455–468.
Colman, J.G., 1997. A review of the biology and ecology of the whale shark. J. FishBiol. 51, 1219–1234.
Compagno, L.J.V., 1984. FAO Species Catalogue. Vol. 4. Sharks of the World. Part 1.Hexanchiformes to Lamniformes. FAO Fisheries Synopsis 125, Vol. 4, Part 1. Foodand Agriculture Organization of the United Nations, Rome.
Compagno, L.J.V., 1990. Relationships of the megamouth shark Megachasma pela-gios (Lamniformes: Megachasmidae), with comments on its feeding habits. In:Pratt, H.L.J., Gruber, S.H., Tamiuchi, T. (Eds.), Elasmobranchs as a Living Resource:Advances in the Biology, Ecology, Systematics, and the Status of the Fisheries,vol. 90. National Marine Fisheries Service, pp. 357–379.
Cortes, E., Gruber, S.H., 1994. Effect of ration size on growth and gross conversionefficiency of young lemon sharks, Negaprion brevirostris. J. Fish Biol. 44, 331–341.
Davis, N.D., 1993. Caloric Content of Oceanic Zooplankton and Fishes for Studiesof Salmonid Food Habits and Their Ecologically Related Species (NPAFC Doc.)FRI-UW-9312. Fisheries Research Institute, University of Washington, Seattle.
Denison, R.H., 1937. Anatomy of the head and pelvic fin of the whale shark Rhineodon.Bull. Am. Mus. Nat. Hist. 73, 477–515.
Dietrich, G., Kalle, K., Krauss, W., Siedler, G., 1980. General Oceanography. John Wiley& Sons, Inc., New York.
Duffy, J.C.A., 2002. Distribution, seasonality, lengths, and feeding behaviour of whalesharks (Rhincodon typus) observed in New Zealand waters. N. Z. J. Mar. Freshw.Res. 36, 565–570.
Eckert, S.A., Stewart, B.S., 2001. Telemetry and satellite tracking of whale sharks,Rhincodon typus, in the Sea of Cortez, Mexico, and the northern Pacific Ocean.Environ. Biol. Fishes 60, 299–308.
Eckert, S.A., Dolar, L.L., Kooyman, G.L., Perrin, W., Rahman, A., 2002. Movements ofwhale sharks (Rhincodon typus) in South-east Asian waters as determined bysatellite telemetry. J. Zool. London 257, 111–115.
Fargie, D., Martin, B.W., 1971. Developing laminar flow in a pipe of circular cross-section. Proc. R. Soc. A 321, 461–476.
Ferry-Graham, L.A., 1999. Mechanics of ventilation in swellsharks, Cephaloscylliumventriosum (Scyliorhinidae). J. Exp. Biol. 202, 1501–1510.
Gill, T., 1905. On the habits of the great whale shark (Rhineodon typus). Science 21,790–791.
Goldbogen, J.A., Pyenson, N.D., Shadwick, R.E., 2007. Big gulps require high drag forfin whale lunge feeding. Mar. Ecol. Prog. Ser. 349, 289–301.
Graham, R.T., Roberts, C.M., Smart, J.C.R., 2006. Diving behaviour of whale sharks inrelation to a predictable food pulse. J. Royal Soc. Interface 3, 109–116.
Gudger, E.W., 1915. Natural history of the whale shark, Rhineodon typus Smith.Zoologica 1, 345–389.
Gudger, E.W., 1931. The fourth Florida whale shark, Rhineodon typus, and the Amer-ican Museum model based on it. Bull. Am. Mus. Nat. Hist. 61, 613–637.
Gudger, E.W., 1941a. The food and feeding habits of the whale shark Rhineodon typus.J. Elisha Mitchell Sci. Soc. 57, 57–72.
Gudger, E.W., 1941b. The feeding organs of the whale shark, Rhineodon typus. J.Morphol. 68, 81–99.
Gudger, E.W., Mowbray, L.L., 1930. Whale shark! How a specimen of the greatest ofliving sharks, Rhineodon typus, was captured near Marathon, Florida; and howit was towed near Key West. Nat. Hist. 30, 182–192.
Hacohen-Domene, A., Galvan-Magana, F., Ketchum-Mejia, J., 2006. Abundance ofwhale shark (Rhincodon typus) preferred prey species in the southern Gulf ofCalifornia, Mexico. Cybium 30, 99–102.
Haly, A., 1883. On the occurrence of Rhincodon typicus Smith on the west coast ofCeylon. Ann. Mag. Nat. Hist. Ser. 5, 48–49.
Heyman, W.D., Graham, R.T., Kjerfve, B., Johannes, R.E., 2001. Whale sharks Rhin-codon typus aggregate to feed on fish spawn in Belize. Mar. Ecol. Prog. Ser. 215,275–282.
lter-feeding rate, and diet of whale sharks Rhincodon typus during(2010), doi:10.1016/j.zool.2009.12.001
Hoffmayer, E.R., Franks, J.S., Driggers III, W.B., Oswald, K.J., Quattro, J.M., 2007. Obser-vations of a feeding aggregation of whale sharks, Rhincodon typus, in the northcentral Gulf of Mexico. Gulf Caribb. Res. 19, 1–5.
Hueter, R., Gonzalez Cano, J., De la Parra, R., Tyminski, J., Perez-Ramirez, J., Remolina-Suarez, F., 2007. Biological studies of large feeding aggregations of whale sharks(Rhincodon typus) in the southern Gulf of Mexico. In: Irvine, T.R., Keesing, J.K.

INZ
1 ology
H
H
H
I
J
J
J
L
M
M
M
M
M
M
M
N
N
P
R
R
R
R
R
S
S
S
S
S
S
S
Wilson, S.G., Polovina, J.J., Stewart, B.S., Meekan, M.G., 2006. Movements of whalesharks (Rhincodon typus) tagged at Ningaloo reef, Western Australia. Mar. Biol.
ARTICLEG ModelOOL-25212; No. of Pages 14
4 P.J. Motta et al. / Zo
(Eds.), The First International Whale Shark Conference: Promoting InternationalCollaboration in Whale Shark Conservation, Science and Management. Confer-ence Overview, Abstracts and Supplementary Proceedings. CSIRO Marine andAtmospheric Research, Australia.
ueter, R.E., Tyminski, J.P., de la Parra, R., 2008. The geographical movementsof whale sharks tagged with pop-up archival satellite tags off QuintanaRoo, Mexico. In: Proceedings of the 2nd International Whale Shark Con-ference, Holbox, Quintana Roo, Mexico, 15–20 July 2008, Available at:http://www.domino.conanp.gob.mx/doc conf/Bob.pdf.
ughes, G.M., 1960a. The mechanism of gill ventilation in the dogfish and skate. J.Exp. Biol. 37, 11–27.
ughes, G.M., 1960b. The mechanism of gill ventilation in marine teleosts. J. Exp.Biol. 37, 28–45.
delchik, I.E., 1986. Handbook of Hydraulic Resistance. Hemisphere Publishing, NewYork.
ames, A.G., Probyn, T., 1989. The relationship between respiration rate, swimmingspeed and feeding behaviour in the Cape anchovy Engraulis capensis Gilchrist. J.Exp. Mar. Biol. Ecol. 131, 81–100.
arman, S.N., Wilson, S.G., 2004. DNA-based species identification of krill consumedby whale sharks. J. Fish Biol. 65, 586–591.
ohnson, W.S., Allen, D.M., 2005. Zooplankton of the Atlantic and Gulf Coasts: A Guideto Their Identification and Ecology. Johns Hopkins University Press, Baltimore.
aBarbera, M., 1984. Feeding currents and particle capture mechanisms in suspen-sion feeding animals. Am. Zool. 24, 71–84.
acy, W.K., Durbin, A.G., Durbin, E.G., 1999. Metabolic rate in relation to tempera-ture and swimming speed, and the cost of filter feeding in Atlantic menhaden,Brevoortia tyrannus. Fish. Bull 97, 282–293.
eekan, M.G., Jarman, S.N., McLean, C., Schultz, M.B., 2009. DNA evidence of whalesharks (Rhincodon typus) feeding on red crab (Gecarcoidea natalis) larvae atChristmas Island. Australia. Mar. Freshw. Res. 60, 607–609.
ehta, R.D., Bradshaw, P., 1979. Design rules for small low speed wind tunnels.Aeronaut. J. Roy. Aeronaut. Soc. 73, 443–449.
erino, M., 1997. Upwelling on the Yucatan shelf: hydrographic evidence. J. Mar.Sys. 13, 101–121.
oin, P., Kim, J., 1985. The structure of the vorticity field in turbulent channel flow.Part I. Analysis of instantaneous fields and statistic correlations. J. Fluid Mech.155, 441–464.
otta, P.J., Wilga, C.D., 1999. Anatomy of the feeding apparatus of the nurse shark,Ginglymostoma cirratum. J. Morphol. 241, 1–29.
owbray, L.L., 1923. The taking of a whale shark (Rhiniodon typus) in SouthernFlorida. Bull. New York Zool. Soc. 26, 82–83.
akaya, K., Matsumoto, R., Suda, K., 2008. Feeding strategy of the megamouth sharkMegachasma pelagios (Lamniformes: Megachasmidae). J. Fish Biol. 73, 17–34.
elson, J.D., Eckert, S.A., 2007. Foraging ecology of whale sharks (Rhincodon typus)within Bahia de Los Angeles, Baja California Norte. Mexico. Fish. Res 84, 47–64.
érez, R., Muller-Karger, F.E., Victoria, I., Melo, N., Cerdeira, S., 1999. Cuban, Mexi-can, U.S. researchers probing mysteries of Yucatan current. EOS Trans. AGU 80,153–158.
ipperger, S., Altmann, J., 2002. Crossflow microfiltration—state of the art. Sep. Purif.Technol. 26, 19–31.
owat, D., Gore, M., 2007. Regional scale horizontal and local scale vertical move-ments of whale sharks in the Indian Ocean off Seychelles. Fish. Res. 84, 32–40.
owat, D., Meekan, M.G., Engelhardt, U., Pardigon, B., Vely, M., 2007. Aggregationsof juvenile whale sharks (Rhincodon typus) in the Gulf of Tadjoura. Djibouti.Environ. Biol. Fishes 80, 465–472.
owat, D., Gore, M., Meekan, M.G., Lawler, I.R., Bradshaw, C.J.A., 2009. Aerial surveyas a tool to estimate whale shark abundance trends. J. Exp. Mar. Biol. Ecol. 368,1–8.
ubenstein, D.I., Koehl, M.A.R., 1977. The mechanisms of filter-feeding: some theo-retical considerations. Am. Nat. 111, 981–994.
anderson, S.L., Wassersug, R., 1993. Convergent and alternative designs for ver-tebrate suspension feeding. In: Hanken, J., Hall, B.K. (Eds.), The Skull, vol. 3,Functional and Evolutionary Mechanisms. The University of Chicago Press,Chicago, pp. 37–112.
anderson, S.L., Cheer, A.Y., Goodrich, J.S., Graziano, J.D., Callan, W.T., 2001. Crossflowfiltration in suspension-feeding fishes. Nature 412, 439–441.
chmid, T.H., Murru, F.L., 1994. Bioenergetics of the bull shark, Carcharhinus leucas,maintained in captivity. Zoo Biol. 13, 177–185.
chmidt, J.V., Schmidt, C.L., Ozer, F., Ernst, R.E., Feldheim, K.A., Ashley, M.V.,Levine, M., 2009. Low genetic differentiation across three major oceanpopulations of the whale shark, Rhincodon typus. PLoS ONE 4, e4988,doi:10.1371/journal.pone.0004988.
ilas, E.G., Rajagopalan, M.S., 1963. On a recent capture of a whale shark (Rhincodontypus Smith) at Tuticorin, with a note on information to be obtained on whale
Please cite this article in press as: Motta, P.J., et al., Feeding anatomy, fisurface ram filter feeding off the Yucatan Peninsula, Mexico. Zoology
sharks from Indian waters. J. Mar. Biol. Assoc. India 5, 153–157.imon, M., Johnson, M., Tyack, P., Madsen, P.T., 2009. Behaviour and kinematics of
continuous ram filtration in bowhead whales (Balaena mysticetus). Proc. R. Soc.B 276, 3819–3828.
ims, D.W., 1999. Threshold foraging behavior of basking sharks on zooplankton:life on an energetic knife-edge? Proc. R. Soc. Lond. B 266, 1437–1443.
PRESSxxx (2010) xxx–xxx
Sims, D.W., 2000a. Can threshold foraging responses of basking sharks be used toestimate their metabolic rate? Mar. Ecol. Prog. Ser. 200, 289–296.
Sims, D.W., 2000b. Filter-feeding and cruising swimming speeds of basking sharkscompared with optimal models: they filter-feed slower than predicted for theirsize. J. Exp. Mar. Biol. Ecol. 249, 65–76.
Sims, D.W., Merrett, D.A., 1997. Determination of zooplankton characteristics in thepresence of surface feeding basking sharks Cetorhinus maximus. Mar. Ecol. Prog.Ser. 158, 297–302.
Sims, D.W., Quayle, V.A., 1998. Selective foraging behaviour of basking sharks onzooplankton in a small-scale front. Nature 393, 460–464.
Sims, D.W., Southall, E.J., Merrett, D.A., Sanders, J., 2003. Effects of zooplankton den-sity and diel period on surface-swimming duration of basking sharks. J. Mar.Biol. Assoc. U. K. 83, 643–646.
Sims, D.W., Southall, E.J., Tarling, G.A., Metcalfe, J.D., 2005. Habitat-specific normaland reverse diel vertical migration in the plankton-feeding basking shark. J.Anim. Ecol. 74, 755–761.
Smith, A., 1829. Contributions to the natural history of South Africa. Zool. J. 16,443–444.
Smith, A., 1849. Illustrations of the zoology of South Africa, vol. 4. In: Pisces. Smith,Elder and Co., London.
Smith, J.C., Sanderson, S.L., 2007. Mucus function and crossflow filtration in a fishwith gill rakers removed versus intact. J. Exp. Biol. 210, 2706–2713.
Smith, J.C., Sanderson, S.L., 2008. Intra-oral flow patterns and speeds in asuspension-feeding fish with gill rakers removed versus intact. Biol. Bull. 215,309–318.
Taylor, G., 1994. Whale Sharks, The Giants of Ningaloo Reef. Angus and Robertson,Sydney, Australia.
Taylor, J.G., 1996. Seasonal occurrence, distribution, and movements of the whaleshark Rhincodon typus, at Ningaloo Reef, Western Australia. Mar. Freshw. Res 47,637–642.
Taylor, J.G., 2007. Ram filter-feeding and nocturnal feeding of whale sharks (Rhin-codon typus) at Ningaloo Reef, Western Australia. Fish. Res. 84, 65–70.
Taylor, J.G., Pearce, A.F., 1999. Ningaloo Reef currents: implications for coral spawndispersal, zooplankton and whale shark abundance. J. R. Soc. West. Aust. 82,57–65.
Taylor, L.R., Compagno, L.J.V., Struhsaker, P.J., 1983. Megamouth—a new species,genus, and family of lamnoid shark (Megachasma pelagios, family Megachasmi-dae) from the Hawaiian Islands. Proc. Calif. Acad. Sci. 43, 87–110.
Thurston, E., 1894. Inspection of Ceylon Pearl Banks. Bull. Madras Gov. Mus. 1,36–38.
Tyminski, J., Hueter, R., de la Parra, R., 2008. The vertical movements of whale sharkstagged with pop-up archival satellite tags off Quintana Roo, Mexico. In: Proceed-ings of the 2nd International Whale Shark Conference, Holbox, Quintana Roo,Mexico, 15–20 July 2008, Available at: http://www.domino.conanp.gob.mx/doc conf/John T Holbox Vertical Movements Talk Final.pdf.
Uchida, S., 1990. On the morphology of the whale shark, Rhincodon typus Smith.Okinawa Expo Aquarium. Collected Reprints 1976–1989 5, 165–173.
Videler, J.J., 1993. Fish Swimming. Chapman and Hall, London.Ward-Smith, A.J., 1980. Internal Fluid Flow: The Fluid Dynamics of Flow in Pipes and
Ducts. Oxford University Press, New York.Weihs, D., 1977. Effects of size on sustained swimming speeds of aquatic organisms.
In: Pedley, T.J. (Ed.), Scale Effects in Animal Locomotion. Academic Press, NewYork, pp. 333–338.
Weihs, D., Webb, P.W., 1983. Optimization of locomotion. In: Webb, P.W., Weihs, D.(Eds.), Fish Biomechanics. Praeger Publishers, New York, pp. 339–371.
Weihs, D., Keyes, R.S., Stalls, D.M., 1981. Voluntary swimming speeds of two speciesof large carcharhinid sharks. Copeia 1981, 219–222.
Werth, A.J., 2004. Models of hydrodynamic flow in the bowhead whale filter feedingapparatus. J. Exp. Biol. 207, 3569–3580.
Wetherbee, B.M., Cortes, E., 2004. Food consumption and feeding habits. In: Carrier,J.C., Musick, J.A., Heithaus, M.R. (Eds.), Biology of Sharks and Their Relatives. CRCPress, Boca Raton, pp. 225–246.
Wilga, C.D., Lauder, G.V., 2000. Three-dimensional kinematics and wake structureof the pectoral fins during locomotion in leopard sharks Triakis semifasciata. J.Exp. Biol. 203, 2261–2278.
Wilson, S.G., 2006. The biggest fish: unraveling the mysteries of the whale shark.Nat. Hist. 115, 42–47.
Wilson, S.G., Newbound, D.R., 2001. Two whale shark faecal samples from NingalooReef, Western Australia. Bull. Mar. Sci. 68, 361–362.
Wilson, S.G., Taylor, J.G., Pearce, A.F., 2001. The seasonal aggregation of whalesharks at Ningaloo Reef, Western Australia: currents, migrations and the ElNino/Southern Oscillation. Environ. Biol. Fishes 61, 1–11.
lter-feeding rate, and diet of whale sharks Rhincodon typus during(2010), doi:10.1016/j.zool.2009.12.001
148, 1157–1166.Zavala-Hidalgo, J., Gallegos-Garcia, A., Martinez-Lopez, B., Morey, S.L., O’Brien, J.J.,
2006. Seasonal upwelling on the western and southern shelves of the Gulf ofMexico. Ocean Dyn. 56, 333–338.