Embed Size (px)
Citation preview
Important disclosures appear on the last page of this report.
November 20, 2008 Industrial: Air Freight and Logistics
Henry Fund Research
FedEx Corp. (FDX) Investment Recommendation HOLD
Hanu Shyam Mehrotra & Sumit Mundhra
[email protected] & [email protected]
Current Price $60.91
Target Price $87.40
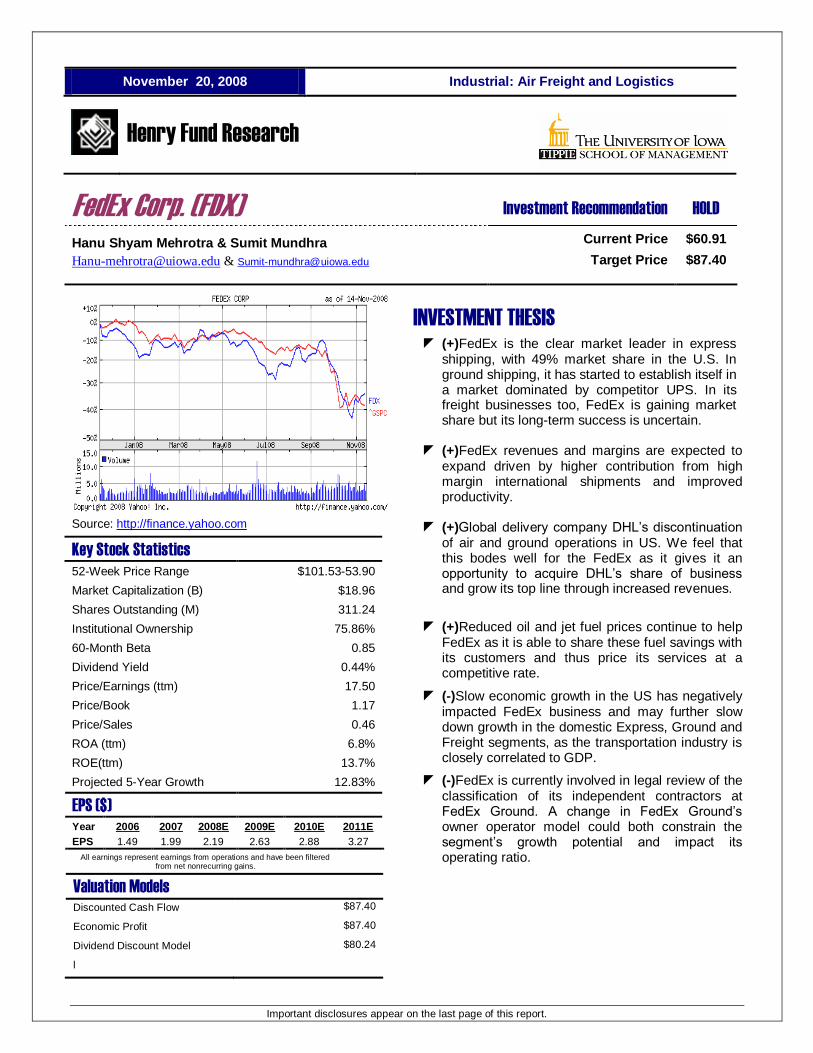
Source: http://finance.yahoo.com
Key Stock Statistics
52-Week Price Range $101.53-53.90
Market Capitalization (B) $18.96
Shares Outstanding (M) 311.24
Institutional Ownership 75.86%
60-Month Beta 0.85
Dividend Yield 0.44%
Price/Earnings (ttm) 17.50
Price/Book 1.17
Price/Sales 0.46
ROA (ttm) 6.8%
ROE(ttm) 13.7%
Projected 5-Year Growth 12.83%
EPS ($)
Year 2006 2007 2008E 2009E 2010E 2011E
EPS 1.49 1.99 2.19 2.63 2.88 3.27
All earnings represent earnings from operations and have been filtered from net nonrecurring gains.
Valuation Models
Discounted Cash Flow $87.40
Economic Profit $87.40
Dividend Discount Model $80.24
l
INVESTMENT THESIS
(+)FedEx is the clear market leader in express shipping, with 49% market share in the U.S. In ground shipping, it has started to establish itself in a market dominated by competitor UPS. In its freight businesses too, FedEx is gaining market share but its long-term success is uncertain.
(+)FedEx revenues and margins are expected to expand driven by higher contribution from high margin international shipments and improved productivity.
(+)Global delivery company DHL‘s discontinuation
of air and ground operations in US. We feel that this bodes well for the FedEx as it gives it an opportunity to acquire DHL‘s share of business and grow its top line through increased revenues.
(+)Reduced oil and jet fuel prices continue to help FedEx as it is able to share these fuel savings with its customers and thus price its services at a competitive rate.
(-)Slow economic growth in the US has negatively impacted FedEx business and may further slow down growth in the domestic Express, Ground and Freight segments, as the transportation industry is closely correlated to GDP.
(-)FedEx is currently involved in legal review of the classification of its independent contractors at FedEx Ground. A change in FedEx Ground‘s owner operator model could both constrain the segment‘s growth potential and impact its operating ratio.
Henry Fund Research
THE UNIVERSITY OF IOWA
Henry B. Tippie School of Management
2
COMPANY DESCRIPTION
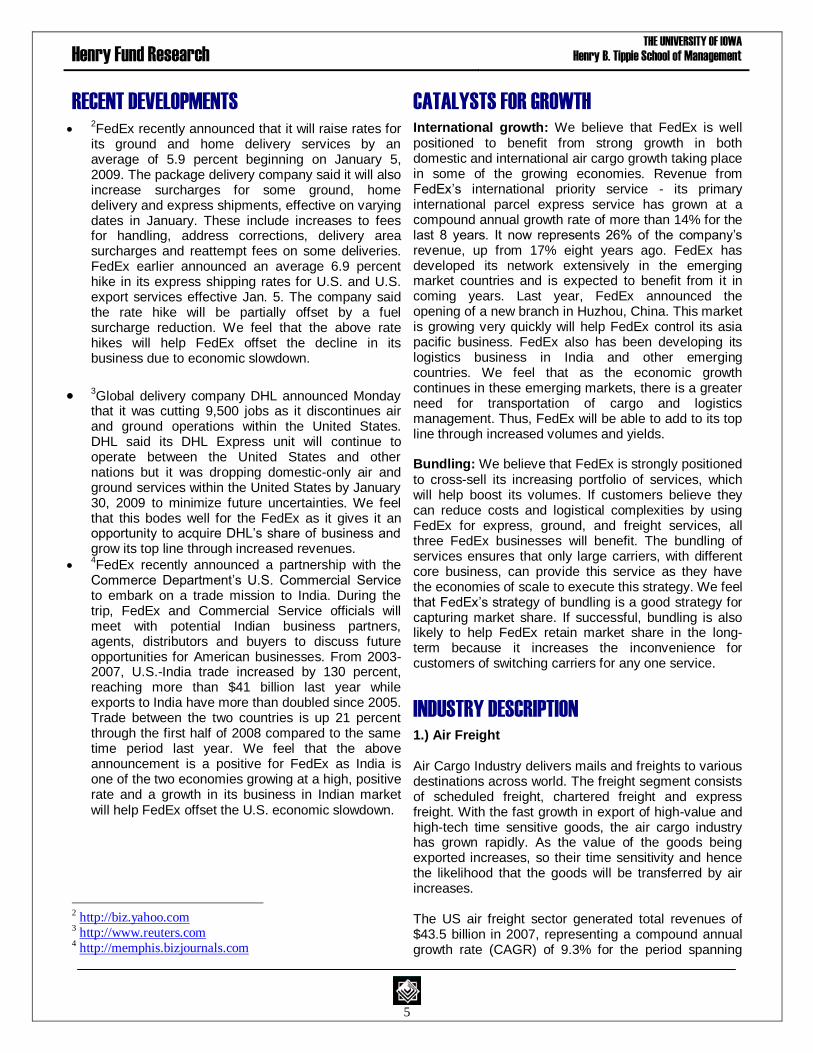
FedEx Corporation provides transportation, e-commerce and business services to customers and business around the world. These include providing global time-definite air express services for packages, documents and freight; ground based delivery of small packages in North America, expedited critical shipment delivery, customs brokerage solutions, less-than-truckload freight transportation, and customized logistics. FedEx acquired Kinko‘s in February 2004, which operates about 1200 copy centers and also provide business services. FedEx Corporation has annual revenues of above $38 billion and operates in 220 countries worldwide. The company operates in four different segments: FedEx Express, FedEx Ground, FedEx Freight and FedEx Services.
Source: Company annual Report 1.) FedEx Express
FedEx Express offers package delivery to every address in the U.S. and to more than 220 countries and territories. Express services offered range from ―First Overnight‖—for next day delivery by 8 a.m.--to three day ―Express Saver‖ service, which is often no faster than ground service. Slower express services differ from ground service in that they are time-definite. For each, arrival time is guaranteed and rates vary according to the distance a package travels. FedEx Express is the world‘s largest express transportation company and by far the largest FedEx company. FedEx Express earned $24.4 billion of FedEx‘s $37.9 billion for year ended in May 31 2008.
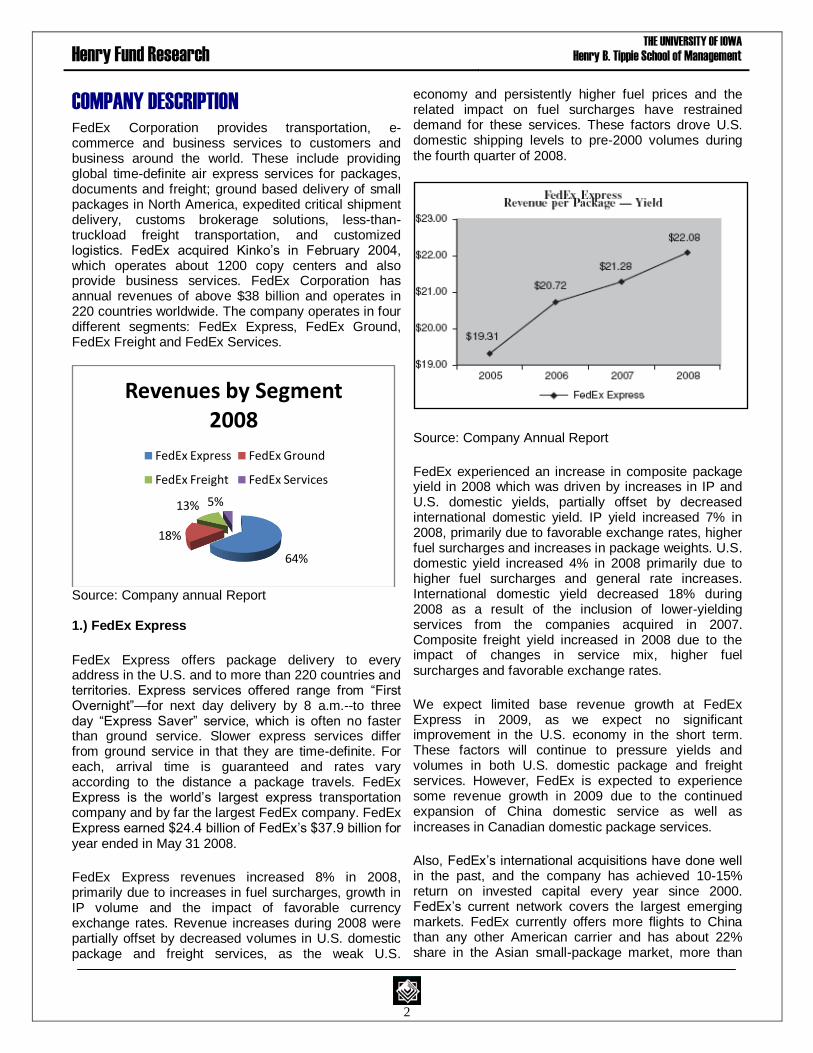
FedEx Express revenues increased 8% in 2008, primarily due to increases in fuel surcharges, growth in IP volume and the impact of favorable currency exchange rates. Revenue increases during 2008 were partially offset by decreased volumes in U.S. domestic package and freight services, as the weak U.S.
economy and persistently higher fuel prices and the related impact on fuel surcharges have restrained demand for these services. These factors drove U.S. domestic shipping levels to pre-2000 volumes during the fourth quarter of 2008.
Source: Company Annual Report
FedEx experienced an increase in composite package yield in 2008 which was driven by increases in IP and U.S. domestic yields, partially offset by decreased international domestic yield. IP yield increased 7% in 2008, primarily due to favorable exchange rates, higher fuel surcharges and increases in package weights. U.S. domestic yield increased 4% in 2008 primarily due to higher fuel surcharges and general rate increases. International domestic yield decreased 18% during 2008 as a result of the inclusion of lower-yielding services from the companies acquired in 2007. Composite freight yield increased in 2008 due to the impact of changes in service mix, higher fuel surcharges and favorable exchange rates.
We expect limited base revenue growth at FedEx Express in 2009, as we expect no significant improvement in the U.S. economy in the short term. These factors will continue to pressure yields and volumes in both U.S. domestic package and freight services. However, FedEx is expected to experience some revenue growth in 2009 due to the continued expansion of China domestic service as well as increases in Canadian domestic package services.
Also, FedEx‘s international acquisitions have done well in the past, and the company has achieved 10-15% return on invested capital every year since 2000. FedEx‘s current network covers the largest emerging markets. FedEx currently offers more flights to China than any other American carrier and has about 22% share in the Asian small-package market, more than
64%
18%
13% 5%
Revenues by Segment 2008
FedEx Express FedEx Ground
FedEx Freight FedEx Services
Henry Fund Research
THE UNIVERSITY OF IOWA
Henry B. Tippie School of Management
3
any carrier except DHL, which has 32% share. In November 2007 FedEx announced the opening of a new branch in Huzhou, China. This market however, is growing very quickly and the opening of this branch reflects FedEx's goal to expand into growing markets internationally.
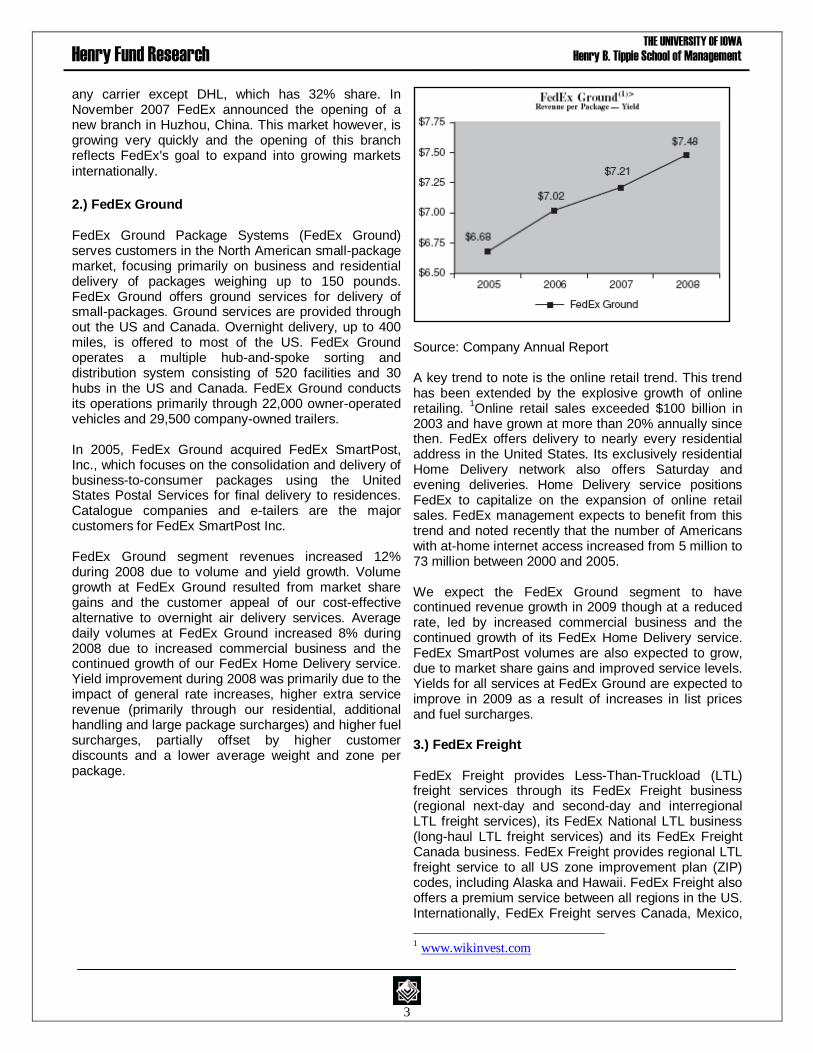
2.) FedEx Ground FedEx Ground Package Systems (FedEx Ground) serves customers in the North American small-package market, focusing primarily on business and residential delivery of packages weighing up to 150 pounds. FedEx Ground offers ground services for delivery of small-packages. Ground services are provided through out the US and Canada. Overnight delivery, up to 400 miles, is offered to most of the US. FedEx Ground operates a multiple hub-and-spoke sorting and distribution system consisting of 520 facilities and 30 hubs in the US and Canada. FedEx Ground conducts its operations primarily through 22,000 owner-operated vehicles and 29,500 company-owned trailers. In 2005, FedEx Ground acquired FedEx SmartPost, Inc., which focuses on the consolidation and delivery of business-to-consumer packages using the United States Postal Services for final delivery to residences. Catalogue companies and e-tailers are the major customers for FedEx SmartPost Inc. FedEx Ground segment revenues increased 12% during 2008 due to volume and yield growth. Volume growth at FedEx Ground resulted from market share gains and the customer appeal of our cost-effective alternative to overnight air delivery services. Average daily volumes at FedEx Ground increased 8% during 2008 due to increased commercial business and the continued growth of our FedEx Home Delivery service. Yield improvement during 2008 was primarily due to the impact of general rate increases, higher extra service revenue (primarily through our residential, additional handling and large package surcharges) and higher fuel surcharges, partially offset by higher customer discounts and a lower average weight and zone per package.
Source: Company Annual Report A key trend to note is the online retail trend. This trend has been extended by the explosive growth of online retailing.
1Online retail sales exceeded $100 billion in
2003 and have grown at more than 20% annually since then. FedEx offers delivery to nearly every residential address in the United States. Its exclusively residential Home Delivery network also offers Saturday and evening deliveries. Home Delivery service positions FedEx to capitalize on the expansion of online retail sales. FedEx management expects to benefit from this trend and noted recently that the number of Americans with at-home internet access increased from 5 million to 73 million between 2000 and 2005. We expect the FedEx Ground segment to have continued revenue growth in 2009 though at a reduced rate, led by increased commercial business and the continued growth of its FedEx Home Delivery service. FedEx SmartPost volumes are also expected to grow, due to market share gains and improved service levels. Yields for all services at FedEx Ground are expected to improve in 2009 as a result of increases in list prices and fuel surcharges. 3.) FedEx Freight FedEx Freight provides Less-Than-Truckload (LTL) freight services through its FedEx Freight business (regional next-day and second-day and interregional LTL freight services), its FedEx National LTL business (long-haul LTL freight services) and its FedEx Freight Canada business. FedEx Freight provides regional LTL freight service to all US zone improvement plan (ZIP) codes, including Alaska and Hawaii. FedEx Freight also offers a premium service between all regions in the US. Internationally, FedEx Freight serves Canada, Mexico,
1 www.wikinvest.com
Henry Fund Research
THE UNIVERSITY OF IOWA
Henry B. Tippie School of Management
4
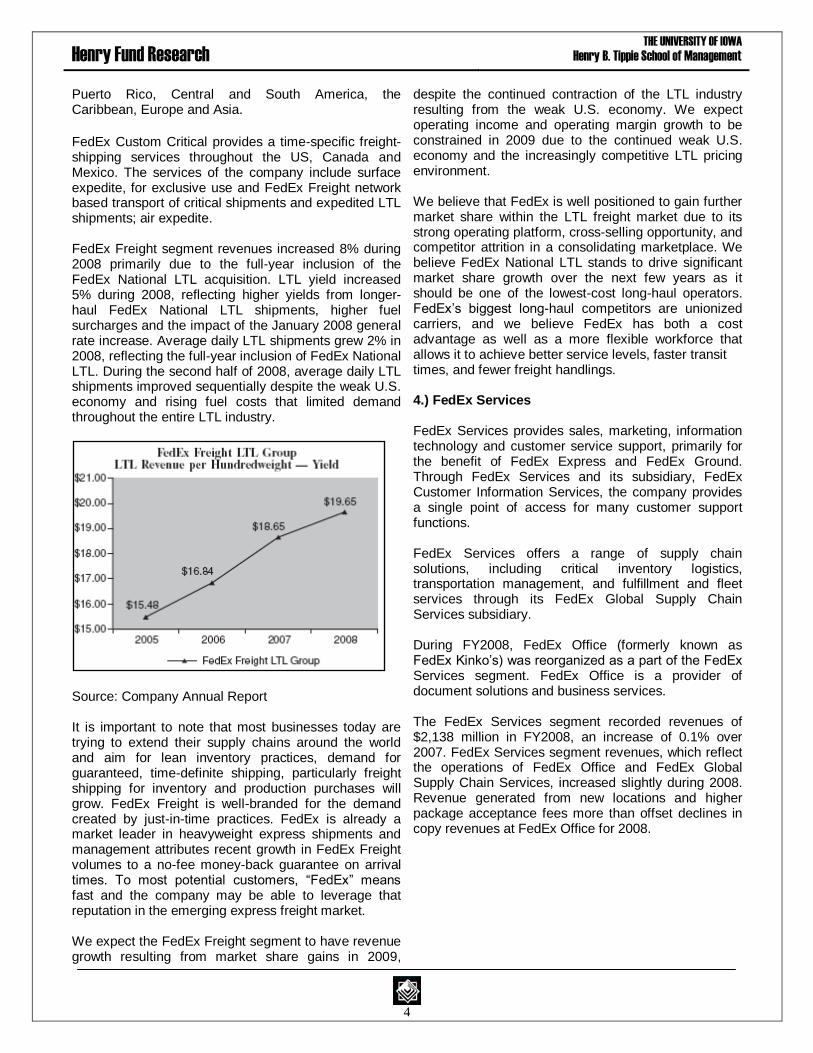
Puerto Rico, Central and South America, the Caribbean, Europe and Asia. FedEx Custom Critical provides a time-specific freight-shipping services throughout the US, Canada and Mexico. The services of the company include surface expedite, for exclusive use and FedEx Freight network based transport of critical shipments and expedited LTL shipments; air expedite. FedEx Freight segment revenues increased 8% during 2008 primarily due to the full-year inclusion of the FedEx National LTL acquisition. LTL yield increased 5% during 2008, reflecting higher yields from longer-haul FedEx National LTL shipments, higher fuel surcharges and the impact of the January 2008 general rate increase. Average daily LTL shipments grew 2% in 2008, reflecting the full-year inclusion of FedEx National LTL. During the second half of 2008, average daily LTL shipments improved sequentially despite the weak U.S. economy and rising fuel costs that limited demand throughout the entire LTL industry.
Source: Company Annual Report It is important to note that most businesses today are trying to extend their supply chains around the world and aim for lean inventory practices, demand for guaranteed, time-definite shipping, particularly freight shipping for inventory and production purchases will grow. FedEx Freight is well-branded for the demand created by just-in-time practices. FedEx is already a market leader in heavyweight express shipments and management attributes recent growth in FedEx Freight volumes to a no-fee money-back guarantee on arrival times. To most potential customers, ―FedEx‖ means fast and the company may be able to leverage that reputation in the emerging express freight market. We expect the FedEx Freight segment to have revenue growth resulting from market share gains in 2009,
despite the continued contraction of the LTL industry resulting from the weak U.S. economy. We expect operating income and operating margin growth to be constrained in 2009 due to the continued weak U.S. economy and the increasingly competitive LTL pricing environment. We believe that FedEx is well positioned to gain further market share within the LTL freight market due to its strong operating platform, cross-selling opportunity, and competitor attrition in a consolidating marketplace. We believe FedEx National LTL stands to drive significant market share growth over the next few years as it should be one of the lowest-cost long-haul operators. FedEx‘s biggest long-haul competitors are unionized carriers, and we believe FedEx has both a cost advantage as well as a more flexible workforce that allows it to achieve better service levels, faster transit times, and fewer freight handlings. 4.) FedEx Services FedEx Services provides sales, marketing, information technology and customer service support, primarily for the benefit of FedEx Express and FedEx Ground. Through FedEx Services and its subsidiary, FedEx Customer Information Services, the company provides a single point of access for many customer support functions. FedEx Services offers a range of supply chain solutions, including critical inventory logistics, transportation management, and fulfillment and fleet services through its FedEx Global Supply Chain Services subsidiary. During FY2008, FedEx Office (formerly known as FedEx Kinko‘s) was reorganized as a part of the FedEx Services segment. FedEx Office is a provider of document solutions and business services. The FedEx Services segment recorded revenues of $2,138 million in FY2008, an increase of 0.1% over 2007. FedEx Services segment revenues, which reflect the operations of FedEx Office and FedEx Global Supply Chain Services, increased slightly during 2008. Revenue generated from new locations and higher package acceptance fees more than offset declines in copy revenues at FedEx Office for 2008.
Henry Fund Research
THE UNIVERSITY OF IOWA
Henry B. Tippie School of Management
5
RECENT DEVELOPMENTS
2FedEx recently announced that it will raise rates for
its ground and home delivery services by an average of 5.9 percent beginning on January 5, 2009. The package delivery company said it will also increase surcharges for some ground, home delivery and express shipments, effective on varying dates in January. These include increases to fees for handling, address corrections, delivery area surcharges and reattempt fees on some deliveries. FedEx earlier announced an average 6.9 percent hike in its express shipping rates for U.S. and U.S. export services effective Jan. 5. The company said the rate hike will be partially offset by a fuel surcharge reduction. We feel that the above rate hikes will help FedEx offset the decline in its business due to economic slowdown.
3Global delivery company DHL announced Monday
that it was cutting 9,500 jobs as it discontinues air and ground operations within the United States. DHL said its DHL Express unit will continue to operate between the United States and other nations but it was dropping domestic-only air and ground services within the United States by January 30, 2009 to minimize future uncertainties. We feel that this bodes well for the FedEx as it gives it an opportunity to acquire DHL‘s share of business and grow its top line through increased revenues.
4FedEx recently announced a partnership with the
Commerce Department‘s U.S. Commercial Service to embark on a trade mission to India. During the trip, FedEx and Commercial Service officials will meet with potential Indian business partners, agents, distributors and buyers to discuss future opportunities for American businesses. From 2003-2007, U.S.-India trade increased by 130 percent, reaching more than $41 billion last year while exports to India have more than doubled since 2005. Trade between the two countries is up 21 percent through the first half of 2008 compared to the same time period last year. We feel that the above announcement is a positive for FedEx as India is one of the two economies growing at a high, positive rate and a growth in its business in Indian market will help FedEx offset the U.S. economic slowdown.
2 http://biz.yahoo.com 3 http://www.reuters.com 4 http://memphis.bizjournals.com
CATALYSTS FOR GROWTH
International growth: We believe that FedEx is well positioned to benefit from strong growth in both domestic and international air cargo growth taking place in some of the growing economies. Revenue from FedEx‘s international priority service - its primary international parcel express service has grown at a compound annual growth rate of more than 14% for the last 8 years. It now represents 26% of the company‘s revenue, up from 17% eight years ago. FedEx has developed its network extensively in the emerging market countries and is expected to benefit from it in coming years. Last year, FedEx announced the opening of a new branch in Huzhou, China. This market is growing very quickly will help FedEx control its asia pacific business. FedEx also has been developing its logistics business in India and other emerging countries. We feel that as the economic growth continues in these emerging markets, there is a greater need for transportation of cargo and logistics management. Thus, FedEx will be able to add to its top line through increased volumes and yields. Bundling: We believe that FedEx is strongly positioned to cross-sell its increasing portfolio of services, which will help boost its volumes. If customers believe they can reduce costs and logistical complexities by using FedEx for express, ground, and freight services, all three FedEx businesses will benefit. The bundling of services ensures that only large carriers, with different core business, can provide this service as they have the economies of scale to execute this strategy. We feel that FedEx‘s strategy of bundling is a good strategy for capturing market share. If successful, bundling is also likely to help FedEx retain market share in the long-term because it increases the inconvenience for customers of switching carriers for any one service.
INDUSTRY DESCRIPTION
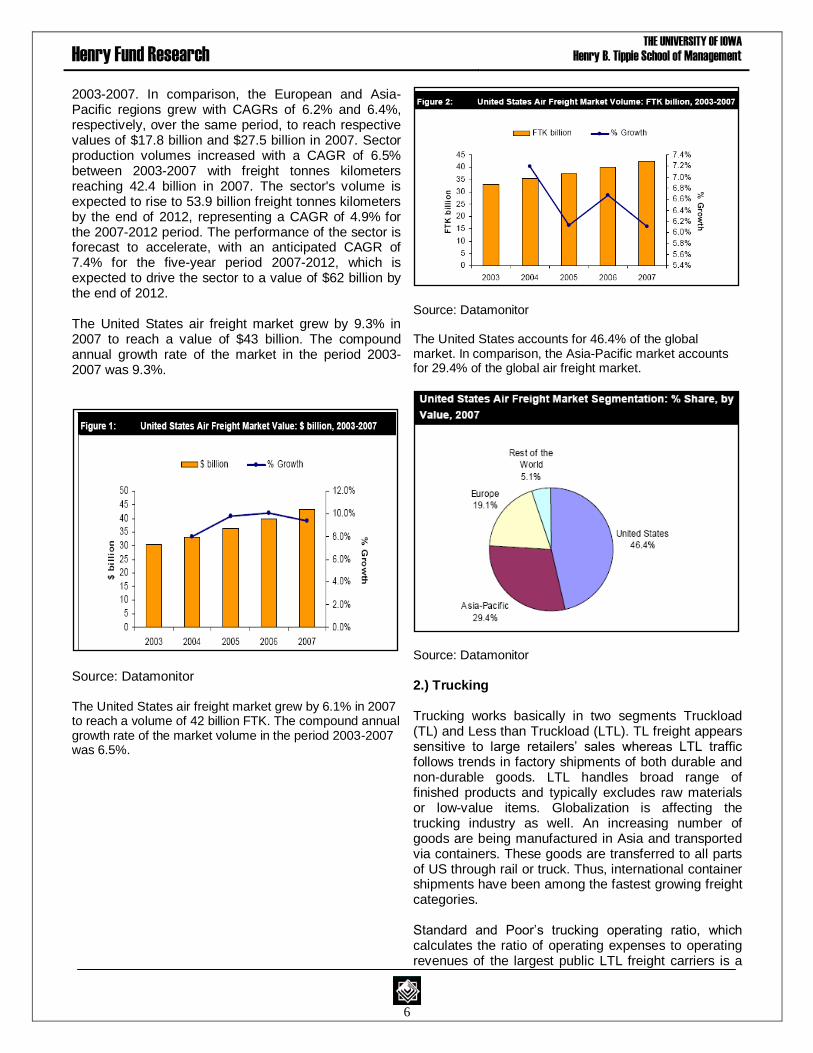
1.) Air Freight Air Cargo Industry delivers mails and freights to various destinations across world. The freight segment consists of scheduled freight, chartered freight and express freight. With the fast growth in export of high-value and high-tech time sensitive goods, the air cargo industry has grown rapidly. As the value of the goods being exported increases, so their time sensitivity and hence the likelihood that the goods will be transferred by air increases. The US air freight sector generated total revenues of $43.5 billion in 2007, representing a compound annual growth rate (CAGR) of 9.3% for the period spanning
Henry Fund Research
THE UNIVERSITY OF IOWA
Henry B. Tippie School of Management
6
2003-2007. In comparison, the European and Asia-Pacific regions grew with CAGRs of 6.2% and 6.4%, respectively, over the same period, to reach respective values of $17.8 billion and $27.5 billion in 2007. Sector production volumes increased with a CAGR of 6.5% between 2003-2007 with freight tonnes kilometers reaching 42.4 billion in 2007. The sector's volume is expected to rise to 53.9 billion freight tonnes kilometers by the end of 2012, representing a CAGR of 4.9% for the 2007-2012 period. The performance of the sector is forecast to accelerate, with an anticipated CAGR of 7.4% for the five-year period 2007-2012, which is expected to drive the sector to a value of $62 billion by the end of 2012. The United States air freight market grew by 9.3% in 2007 to reach a value of $43 billion. The compound annual growth rate of the market in the period 2003-2007 was 9.3%.
Source: Datamonitor The United States air freight market grew by 6.1% in 2007 to reach a volume of 42 billion FTK. The compound annual growth rate of the market volume in the period 2003-2007 was 6.5%.
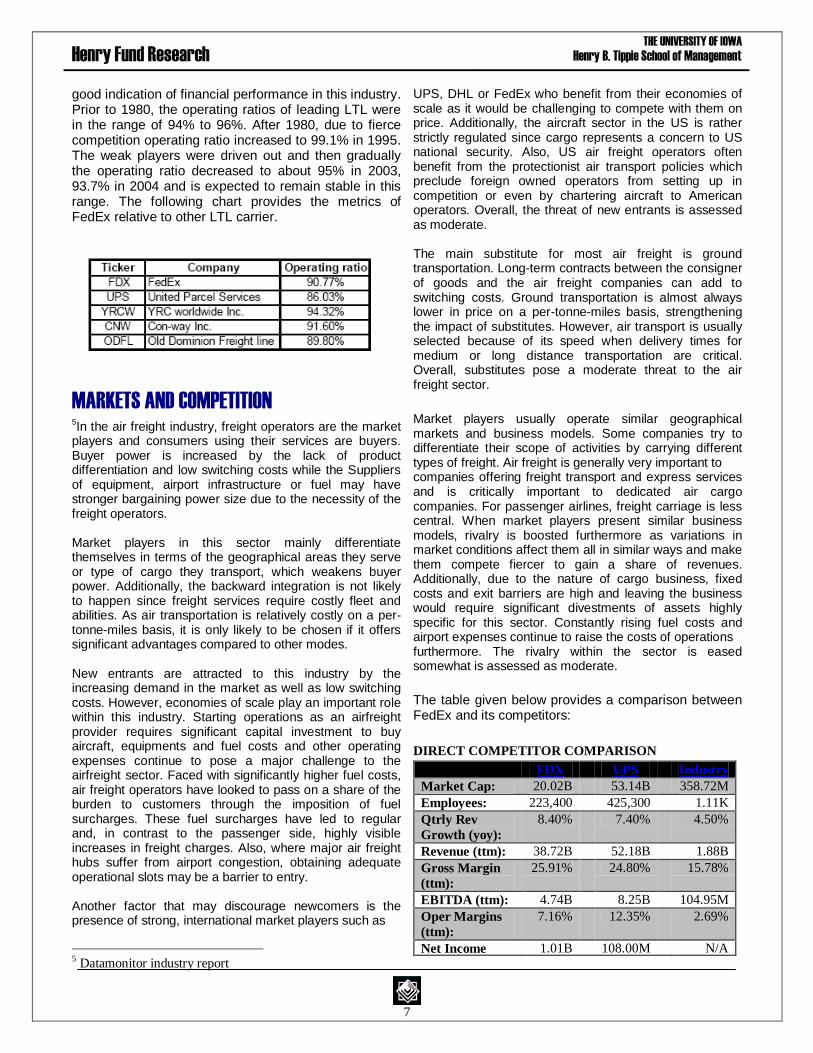
Source: Datamonitor The United States accounts for 46.4% of the global market. In comparison, the Asia-Pacific market accounts for 29.4% of the global air freight market.
Source: Datamonitor 2.) Trucking Trucking works basically in two segments Truckload (TL) and Less than Truckload (LTL). TL freight appears sensitive to large retailers‘ sales whereas LTL traffic follows trends in factory shipments of both durable and non-durable goods. LTL handles broad range of finished products and typically excludes raw materials or low-value items. Globalization is affecting the trucking industry as well. An increasing number of goods are being manufactured in Asia and transported via containers. These goods are transferred to all parts of US through rail or truck. Thus, international container shipments have been among the fastest growing freight categories. Standard and Poor‘s trucking operating ratio, which calculates the ratio of operating expenses to operating revenues of the largest public LTL freight carriers is a
Henry Fund Research
THE UNIVERSITY OF IOWA
Henry B. Tippie School of Management
7
good indication of financial performance in this industry. Prior to 1980, the operating ratios of leading LTL were in the range of 94% to 96%. After 1980, due to fierce competition operating ratio increased to 99.1% in 1995. The weak players were driven out and then gradually the operating ratio decreased to about 95% in 2003, 93.7% in 2004 and is expected to remain stable in this range. The following chart provides the metrics of FedEx relative to other LTL carrier.
MARKETS AND COMPETITION 5In the air freight industry, freight operators are the market
players and consumers using their services are buyers. Buyer power is increased by the lack of product differentiation and low switching costs while the Suppliers of equipment, airport infrastructure or fuel may have stronger bargaining power size due to the necessity of the freight operators. Market players in this sector mainly differentiate themselves in terms of the geographical areas they serve or type of cargo they transport, which weakens buyer power. Additionally, the backward integration is not likely to happen since freight services require costly fleet and abilities. As air transportation is relatively costly on a per-tonne-miles basis, it is only likely to be chosen if it offers significant advantages compared to other modes. New entrants are attracted to this industry by the increasing demand in the market as well as low switching costs. However, economies of scale play an important role within this industry. Starting operations as an airfreight provider requires significant capital investment to buy aircraft, equipments and fuel costs and other operating expenses continue to pose a major challenge to the airfreight sector. Faced with significantly higher fuel costs, air freight operators have looked to pass on a share of the burden to customers through the imposition of fuel surcharges. These fuel surcharges have led to regular and, in contrast to the passenger side, highly visible increases in freight charges. Also, where major air freight hubs suffer from airport congestion, obtaining adequate operational slots may be a barrier to entry. Another factor that may discourage newcomers is the presence of strong, international market players such as
5 Datamonitor industry report
UPS, DHL or FedEx who benefit from their economies of scale as it would be challenging to compete with them on price. Additionally, the aircraft sector in the US is rather strictly regulated since cargo represents a concern to US national security. Also, US air freight operators often benefit from the protectionist air transport policies which preclude foreign owned operators from setting up in competition or even by chartering aircraft to American operators. Overall, the threat of new entrants is assessed as moderate. The main substitute for most air freight is ground transportation. Long-term contracts between the consigner of goods and the air freight companies can add to switching costs. Ground transportation is almost always lower in price on a per-tonne-miles basis, strengthening the impact of substitutes. However, air transport is usually selected because of its speed when delivery times for medium or long distance transportation are critical. Overall, substitutes pose a moderate threat to the air freight sector.
Market players usually operate similar geographical markets and business models. Some companies try to differentiate their scope of activities by carrying different types of freight. Air freight is generally very important to companies offering freight transport and express services and is critically important to dedicated air cargo companies. For passenger airlines, freight carriage is less central. When market players present similar business models, rivalry is boosted furthermore as variations in market conditions affect them all in similar ways and make them compete fiercer to gain a share of revenues. Additionally, due to the nature of cargo business, fixed costs and exit barriers are high and leaving the business would require significant divestments of assets highly specific for this sector. Constantly rising fuel costs and airport expenses continue to raise the costs of operations furthermore. The rivalry within the sector is eased somewhat is assessed as moderate.
The table given below provides a comparison between FedEx and its competitors:
DIRECT COMPETITOR COMPARISON
FDX UPS Industry
Market Cap: 20.02B 53.14B 358.72M Employees: 223,400 425,300 1.11K Qtrly Rev
Growth (yoy): 8.40% 7.40% 4.50%
Revenue (ttm): 38.72B 52.18B 1.88B Gross Margin
(ttm): 25.91% 24.80% 15.78%
EBITDA (ttm): 4.74B 8.25B 104.95M Oper Margins
(ttm): 7.16% 12.35% 2.69%
Net Income 1.01B 108.00M N/A
Henry Fund Research
THE UNIVERSITY OF IOWA
Henry B. Tippie School of Management
8
(ttm): EPS (ttm): 3.251 0.104 0.10 P/E (ttm): 19.80 510.96 15.87 PEG (5 yr
expected): 0.98 1.24 1.24
P/S (ttm): 0.54 1.06 0.22
UPS = United Parcel Service, Inc.
ECONOMIC OUTLOOK
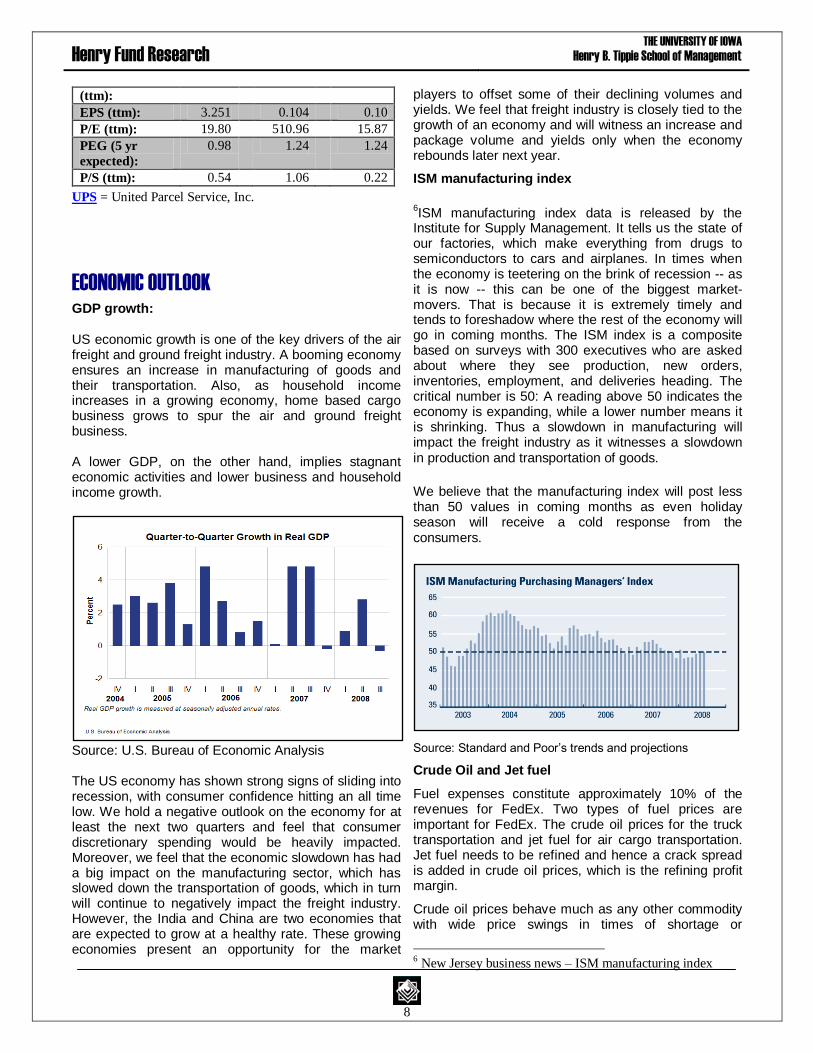
GDP growth: US economic growth is one of the key drivers of the air freight and ground freight industry. A booming economy ensures an increase in manufacturing of goods and their transportation. Also, as household income increases in a growing economy, home based cargo business grows to spur the air and ground freight business. A lower GDP, on the other hand, implies stagnant economic activities and lower business and household income growth.
Source: U.S. Bureau of Economic Analysis The US economy has shown strong signs of sliding into recession, with consumer confidence hitting an all time low. We hold a negative outlook on the economy for at least the next two quarters and feel that consumer discretionary spending would be heavily impacted. Moreover, we feel that the economic slowdown has had a big impact on the manufacturing sector, which has slowed down the transportation of goods, which in turn will continue to negatively impact the freight industry. However, the India and China are two economies that are expected to grow at a healthy rate. These growing economies present an opportunity for the market
players to offset some of their declining volumes and yields. We feel that freight industry is closely tied to the growth of an economy and will witness an increase and package volume and yields only when the economy rebounds later next year.
ISM manufacturing index
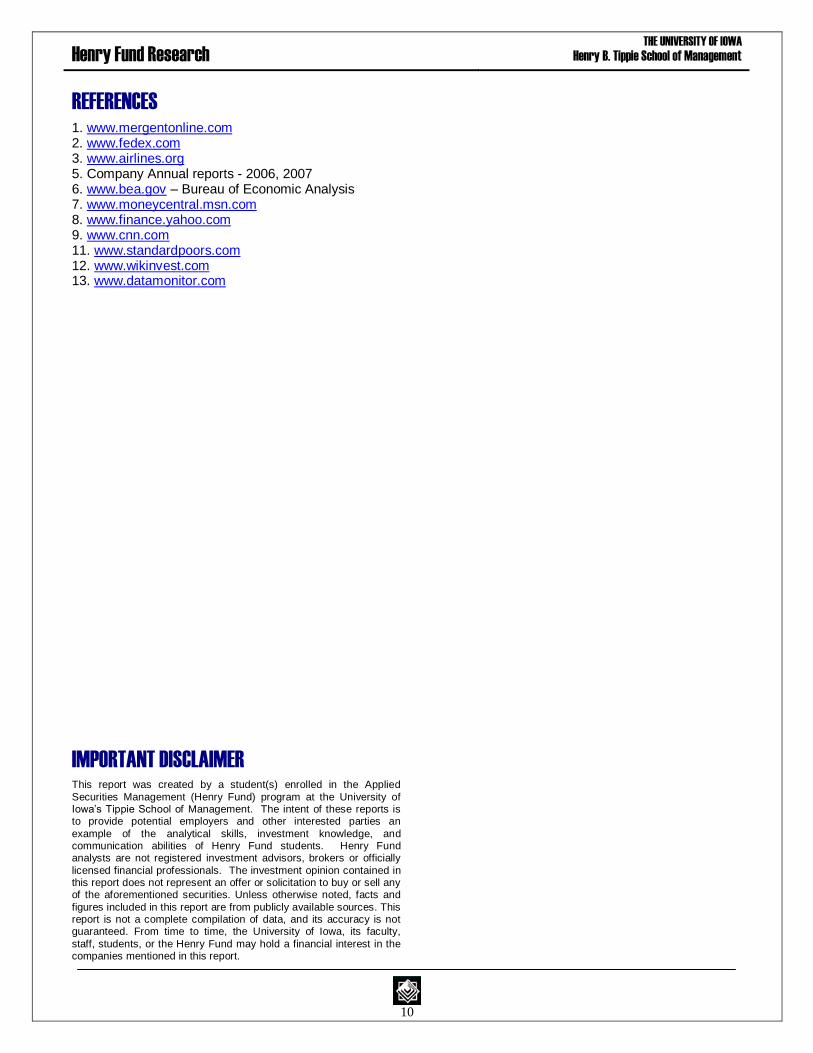
6ISM manufacturing index data is released by the
Institute for Supply Management. It tells us the state of our factories, which make everything from drugs to semiconductors to cars and airplanes. In times when the economy is teetering on the brink of recession -- as it is now -- this can be one of the biggest market-movers. That is because it is extremely timely and tends to foreshadow where the rest of the economy will go in coming months. The ISM index is a composite based on surveys with 300 executives who are asked about where they see production, new orders, inventories, employment, and deliveries heading. The critical number is 50: A reading above 50 indicates the economy is expanding, while a lower number means it is shrinking. Thus a slowdown in manufacturing will impact the freight industry as it witnesses a slowdown in production and transportation of goods.
We believe that the manufacturing index will post less than 50 values in coming months as even holiday season will receive a cold response from the consumers.
Source: Standard and Poor‘s trends and projections
Crude Oil and Jet fuel
Fuel expenses constitute approximately 10% of the revenues for FedEx. Two types of fuel prices are important for FedEx. The crude oil prices for the truck transportation and jet fuel for air cargo transportation. Jet fuel needs to be refined and hence a crack spread is added in crude oil prices, which is the refining profit margin.
Crude oil prices behave much as any other commodity with wide price swings in times of shortage or
6 New Jersey business news – ISM manufacturing index

Henry Fund Research
THE UNIVERSITY OF IOWA
Henry B. Tippie School of Management
9
oversupply. The crude oil price cycle may extend over several years responding to changes in demand as well as OPEC and non-OPEC supply.
Source: NYMEX
The price paid for jet fuel is a function of long-term contracts, spot market prices and point of sale, among other factors. Fluctuations in the market price of jet fuel are highly correlated with movements in the price of home heating oil.
Source: NYMEX
Oil prices have plunged in recent weeks and with them the cost of fuel for the airlines. Jet fuel fell to an average $2.16 a gallon last month, down 45% from its peak this July. But major airlines have been slow to share this good fortune with fliers. We feel that as air freight operators will begin to share these cost savings with the customers soon by reducing their fuel surcharge. We expect the oil and jet fuel prices to stay low for next few months as the demand for oil is expected to be constrained by the global economic recession. However, in the long term, we feel that growing economies will once again and drive up the demand and oil prices.
INVESTMENT POSITIVES
FedEx margins are expected to expand driven by higher contribution from high margin international shipments and improved productivity.
Global delivery company DHL‘s discontinuation of air and ground operations in US. We feel that this bodes well for the FedEx as it gives it an opportunity
to acquire DHL‘s share of business and grow its top line through increased revenues.
Revenue from FedEx‘s international priority service - its primary international parcel express service has grown at a compound annual growth rate of more than 14% for the last 8 years. We believe that FedEx is well positioned to benefit from strong growth in both domestic and international air cargo growth taking place in some of the growing economies.
Reduced oil and jet fuel prices continue to help FedEx as it is able to share these fuel savings with its customers and thus price its services at a competitive rate.
INVESTMENT NEGATIVES
Slow economic growth in the US has negatively impacted FedEx business and may further slow down growth in the domestic Express, Ground and Freight segments, as the transportation industry is closely correlated to GDP. DHL is very aggressive in China with its strong strategic relationships. Hence, FedEx might have to face stiff competition as it tries to expand in this new market.
FedEx is currently involved in legal review of the classification of its independent contractors at FedEx Ground. A change in FedEx Ground‘s owner operator model could both constrain the segment‘s growth potential and impact its operating ratio.
VALUATION
DCF and Economic Profit Valuation: We recommend a ‗HOLD‘ on the FedEx stock based on its intrinsic price of $87.40. We have derived our intrinsic stock price based on the Discounted Cash Flow analysis and Economic Profit analysis of FedEx‘s business. Overall, we have forecasted FedEx‘s revenue growth at 7.84% for our forecast period and a terminal growth rate of 3%. We have incorporated a discount rate of 6.47%, beta of 0.85 and a risk free rate of ten-year treasury at 4.29%.
Henry Fund Research
THE UNIVERSITY OF IOWA
Henry B. Tippie School of Management
10
REFERENCES
1. www.mergentonline.com 2. www.fedex.com 3. www.airlines.org 5. Company Annual reports - 2006, 2007 6. www.bea.gov – Bureau of Economic Analysis 7. www.moneycentral.msn.com 8. www.finance.yahoo.com 9. www.cnn.com 11. www.standardpoors.com 12. www.wikinvest.com 13. www.datamonitor.com
IMPORTANT DISCLAIMER
This report was created by a student(s) enrolled in the Applied
Securities Management (Henry Fund) program at the University of Iowa‘s Tippie School of Management. The intent of these reports is to provide potential employers and other interested parties an
example of the analytical skills, investment knowledge, and communication abilities of Henry Fund students. Henry Fund analysts are not registered investment advisors, brokers or officially
licensed financial professionals. The investment opinion contained in this report does not represent an offer or solicitation to buy or sell any of the aforementioned securities. Unless otherwise noted, facts and
figures included in this report are from publicly available sources. This report is not a complete compilation of data, and its accuracy is not guaranteed. From time to time, the University of Iowa, its faculty,
staff, students, or the Henry Fund may hold a financial interest in the companies mentioned in this report.

Henry Fund Research
THE UNIVERSITY OF IOWA
Henry B. Tippie School of Management
11
Revenue Driver – 2009 – 2010, Quarterly Forecast
FedEx Corp
2009Q1 2009Q2 2009Q3 2009Q4 2010Q1 2010Q2 2010Q3 2010Q4
Average daily package volume (ADV)
FedEx Express
Domestic 2,560 2,602 2,570 2,527 2,496 2,468 2,493 2,462
YoY Growth 1.650% -1.250% -1.650% -1.250% -1.100% 1.000% -1.250%
International 495 503 497 505 499 493 498 492
YoY Growth 1.650% -1.250% 1.650% -1.250% -1.100% 1.000% -1.250%
International Domestic 307 318 327 336 341 345 350 357
YoY Growth 3.500% 3.000% 2.775% 1.500% 1.000% 1.500% 1.875%
Average Revenues
FedEx Express
Domestic 18.30 18.8 19.2 19.8 20.2 20.6 21.0 21.4
YoY Growth 9.712% 3.000% 2.000% 3.000% 2.000% 2.000% 2.000% 2.000%
International 64.54 66.5 67.8 69.8 71.2 72.7 74.5 76.3
YoY Growth 11.065% 3.000% 2.000% 3.000% 2.000% 2.000% 2.500% 2.500%
International Domestic 8.6 8.6 8.5 8.5 8.5 8.4 8.4 8.4
YoY Growth -1.932% -0.500% -0.500% -0.500% -0.500% -0.500% -0.500% 0.500%
Average daily package volume (ADV)
FedEx Ground 3,339 3,389.1 3,439.9 3,491.5 3,526.4 3,561.7 3,597.3 3,633.3
YoY Growth -0.773% 1.500% 1.500% 1.500% 1.000% 1.000% 1.000% 1.000%
FedEx Smartpost 584 581.1 578.2 581.6 585.1 588.6 592.2 595.7
YoY Growth -5.502% -0.500% -0.500% 0.600% 0.600% 0.600% 0.600% 0.600%
Average Revenues
FedEx Ground 7.86 8.0 8.0 8.1 8.2 8.3 8.4 8.5
YoY Growth 5.080% 1.200% 1.200% 1.200% 1.200% 1.200% 1.200% 1.200%
FedEx Smartpost 2.14 2.14 2.15 2.1 2.15 2.15 2.16 2.16
YoY Growth 2.392% 0.120% 0.120% 0.120% 0.120% 0.120% 0.120% 0.120%
Average daily LTL shipments
FedEx Freight 83 83.7 84.7 85.7 86.8 87.6 88.7 89.8
YoY Growth 3.808% 1.200% 1.200% 1.200% 1.200% 1.000% 1.200% 1.200%
Revenue per hundredweight
FedEx Freight 20.44 20.7 20.9 21.1 21.4 21.6 21.8 22.0
YoY Growth 4.020% 1.100% 1.100% 1.100% 1.100% 1.000% 1.100% 1.100%
Revenues
FedEx Express 6,419,000 6,392,004 6,441,947 6,613,626 6,662,149 6,719,813 6,931,914 6,999,558
YoY Growth -0.421% 0.781% 2.665% 0.734% 0.866% 3.156% 0.976%
FedEx Ground 1,761,000 1,896,643 1,945,599 1,996,815 2,039,732 2,083,589 2,128,407 2,174,207
YoY Growth 7.703% 2.581% 2.632% 2.149% 2.150% 2.151% 2.152%
FedEx Freight 1,353,000$ 1,397,154$ 1,429,473$ 1,462,540$ 1,496,371$ 1,526,448$ 1,561,758$ 1,597,885$
YoY Growth 3.263% 2.313% 2.313% 2.313% 2.010% 2.313% 2.313%
FedEx Services Segment 513,000$ 514,282.5 515,568.2 516,857.1 518,149.3 519,444.6 520,743.3 522,045.1
YoY Growth 0.250% 0.250% 0.250% 0.250% 0.250% 0.250% 0.250%
Other (76,000)$ (25,000)$ (25,000)$ (25,000)$ (35,000)$ (35,000)$ (35,000)$ (35,000)$
YoY Growth
Total Revenue 9,970,000 10,175,083 10,307,588 10,564,838 10,681,401 10,814,295 11,107,822 11,258,695
YoY Growth 2.057% 1.302% 2.496% 1.103% 1.244% 2.714% 1.358%
Henry Fund Research
THE UNIVERSITY OF IOWA
Henry B. Tippie School of Management
12
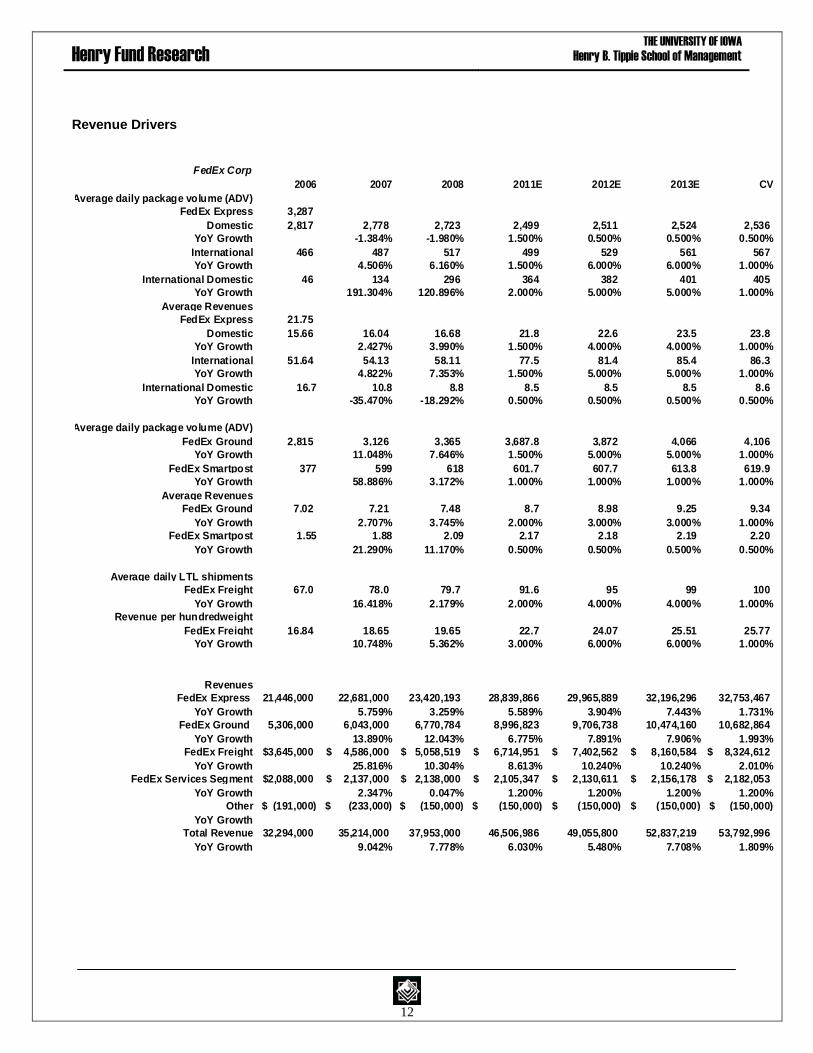
Revenue Drivers
FedEx Corp
2006 2007 2008 2011E 2012E 2013E CV
Average daily package volume (ADV)
FedEx Express 3,287
Domestic 2,817 2,778 2,723 2,499 2,511 2,524 2,536
YoY Growth -1.384% -1.980% 1.500% 0.500% 0.500% 0.500%
International 466 487 517 499 529 561 567
YoY Growth 4.506% 6.160% 1.500% 6.000% 6.000% 1.000%
International Domestic 46 134 296 364 382 401 405
YoY Growth 191.304% 120.896% 2.000% 5.000% 5.000% 1.000%
Average Revenues
FedEx Express 21.75
Domestic 15.66 16.04 16.68 21.8 22.6 23.5 23.8
YoY Growth 2.427% 3.990% 1.500% 4.000% 4.000% 1.000%
International 51.64 54.13 58.11 77.5 81.4 85.4 86.3
YoY Growth 4.822% 7.353% 1.500% 5.000% 5.000% 1.000%
International Domestic 16.7 10.8 8.8 8.5 8.5 8.5 8.6
YoY Growth -35.470% -18.292% 0.500% 0.500% 0.500% 0.500%
Average daily package volume (ADV)
FedEx Ground 2,815 3,126 3,365 3,687.8 3,872 4,066 4,106
YoY Growth 11.048% 7.646% 1.500% 5.000% 5.000% 1.000%
FedEx Smartpost 377 599 618 601.7 607.7 613.8 619.9
YoY Growth 58.886% 3.172% 1.000% 1.000% 1.000% 1.000%
Average Revenues
FedEx Ground 7.02 7.21 7.48 8.7 8.98 9.25 9.34
YoY Growth 2.707% 3.745% 2.000% 3.000% 3.000% 1.000%
FedEx Smartpost 1.55 1.88 2.09 2.17 2.18 2.19 2.20
YoY Growth 21.290% 11.170% 0.500% 0.500% 0.500% 0.500%
Average daily LTL shipments
FedEx Freight 67.0 78.0 79.7 91.6 95 99 100
YoY Growth 16.418% 2.179% 2.000% 4.000% 4.000% 1.000%
Revenue per hundredweight
FedEx Freight 16.84 18.65 19.65 22.7 24.07 25.51 25.77
YoY Growth 10.748% 5.362% 3.000% 6.000% 6.000% 1.000%
Revenues
FedEx Express 21,446,000 22,681,000 23,420,193 28,839,866 29,965,889 32,196,296 32,753,467
YoY Growth 5.759% 3.259% 5.589% 3.904% 7.443% 1.731%
FedEx Ground 5,306,000 6,043,000 6,770,784 8,996,823 9,706,738 10,474,160 10,682,864
YoY Growth 13.890% 12.043% 6.775% 7.891% 7.906% 1.993%
FedEx Freight 3,645,000$ 4,586,000$ 5,058,519$ 6,714,951$ 7,402,562$ 8,160,584$ 8,324,612$
YoY Growth 25.816% 10.304% 8.613% 10.240% 10.240% 2.010%
FedEx Services Segment 2,088,000$ 2,137,000$ 2,138,000$ 2,105,347$ 2,130,611$ 2,156,178$ 2,182,053$
YoY Growth 2.347% 0.047% 1.200% 1.200% 1.200% 1.200%
Other (191,000)$ (233,000)$ (150,000)$ (150,000)$ (150,000)$ (150,000)$ (150,000)$
YoY Growth
Total Revenue 32,294,000 35,214,000 37,953,000 46,506,986 49,055,800 52,837,219 53,792,996
YoY Growth 9.042% 7.778% 6.030% 5.480% 7.708% 1.809%
Henry Fund Research
THE UNIVERSITY OF IOWA
Henry B. Tippie School of Management
13
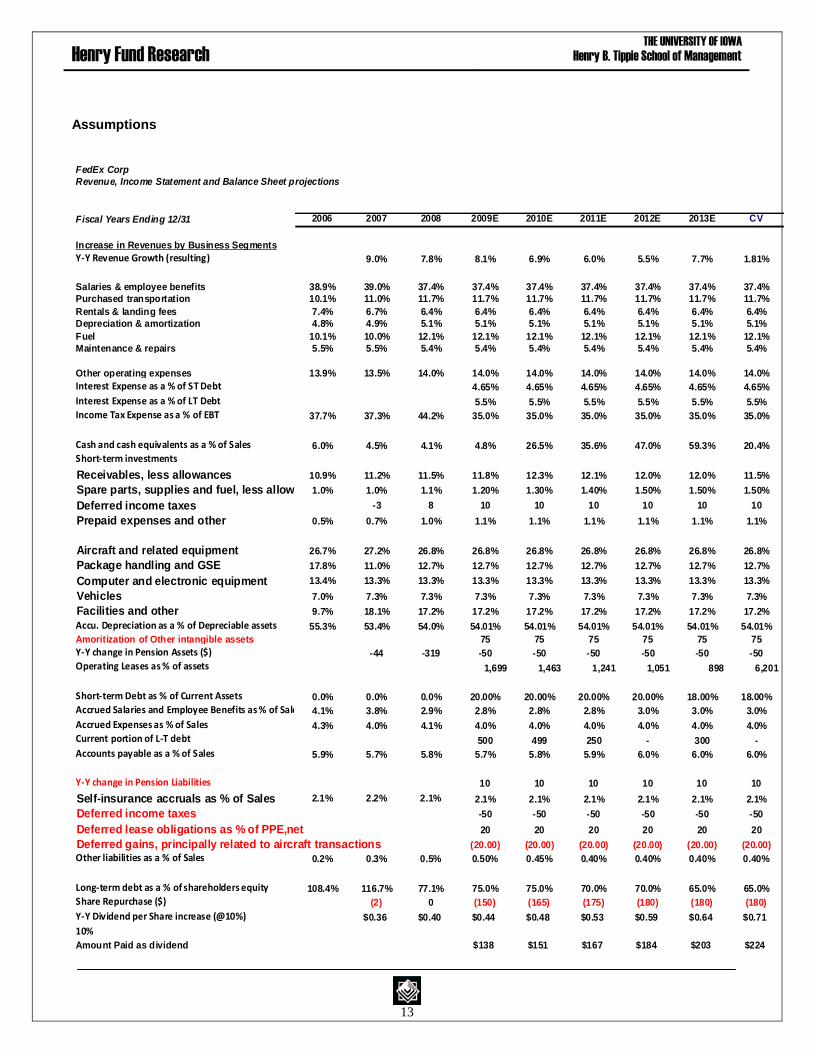
Assumptions
FedEx Corp
Revenue, Income Statement and Balance Sheet projections
Fiscal Years Ending 12/31 2006 2007 2008 2009E 2010E 2011E 2012E 2013E CV
Increase in Revenues by Business Segments
Y-Y Revenue Growth (resulting) 9.0% 7.8% 8.1% 6.9% 6.0% 5.5% 7.7% 1.81%
Salaries & employee benefits 38.9% 39.0% 37.4% 37.4% 37.4% 37.4% 37.4% 37.4% 37.4%
Purchased transportation 10.1% 11.0% 11.7% 11.7% 11.7% 11.7% 11.7% 11.7% 11.7%
Rentals & landing fees 7.4% 6.7% 6.4% 6.4% 6.4% 6.4% 6.4% 6.4% 6.4%
Depreciation & amortization 4.8% 4.9% 5.1% 5.1% 5.1% 5.1% 5.1% 5.1% 5.1%
Fuel 10.1% 10.0% 12.1% 12.1% 12.1% 12.1% 12.1% 12.1% 12.1%
Maintenance & repairs 5.5% 5.5% 5.4% 5.4% 5.4% 5.4% 5.4% 5.4% 5.4%
Other operating expenses 13.9% 13.5% 14.0% 14.0% 14.0% 14.0% 14.0% 14.0% 14.0%
Interest Expense as a % of ST Debt 4.65% 4.65% 4.65% 4.65% 4.65% 4.65%
Interest Expense as a % of LT Debt 5.5% 5.5% 5.5% 5.5% 5.5% 5.5%
Income Tax Expense as a % of EBT 37.7% 37.3% 44.2% 35.0% 35.0% 35.0% 35.0% 35.0% 35.0%
Cash and cash equivalents as a % of Sales 6.0% 4.5% 4.1% 4.8% 26.5% 35.6% 47.0% 59.3% 20.4%
Short-term investments
Receivables, less allowances 10.9% 11.2% 11.5% 11.8% 12.3% 12.1% 12.0% 12.0% 11.5%
Spare parts, supplies and fuel, less allowances1.0% 1.0% 1.1% 1.20% 1.30% 1.40% 1.50% 1.50% 1.50%
Deferred income taxes -3 8 10 10 10 10 10 10
Prepaid expenses and other 0.5% 0.7% 1.0% 1.1% 1.1% 1.1% 1.1% 1.1% 1.1%
Aircraft and related equipment 26.7% 27.2% 26.8% 26.8% 26.8% 26.8% 26.8% 26.8% 26.8%
Package handling and GSE 17.8% 11.0% 12.7% 12.7% 12.7% 12.7% 12.7% 12.7% 12.7%
Computer and electronic equipment 13.4% 13.3% 13.3% 13.3% 13.3% 13.3% 13.3% 13.3% 13.3%
Vehicles 7.0% 7.3% 7.3% 7.3% 7.3% 7.3% 7.3% 7.3% 7.3%
Facilities and other 9.7% 18.1% 17.2% 17.2% 17.2% 17.2% 17.2% 17.2% 17.2%
Accu. Depreciation as a % of Depreciable assets 55.3% 53.4% 54.0% 54.01% 54.01% 54.01% 54.01% 54.01% 54.01%
Amoritization of Other intangible assets 75 75 75 75 75 75
Y-Y change in Pension Assets ($) -44 -319 -50 -50 -50 -50 -50 -50
Operating Leases as % of assets 1,699 1,463 1,241 1,051 898 6,201
Short-term Debt as % of Current Assets 0.0% 0.0% 0.0% 20.00% 20.00% 20.00% 20.00% 18.00% 18.00%
Accrued Salaries and Employee Benefits as % of Sales 4.1% 3.8% 2.9% 2.8% 2.8% 2.8% 3.0% 3.0% 3.0%
Accrued Expenses as % of Sales 4.3% 4.0% 4.1% 4.0% 4.0% 4.0% 4.0% 4.0% 4.0%
Current portion of L-T debt 500 499 250 - 300 -
Accounts payable as a % of Sales 5.9% 5.7% 5.8% 5.7% 5.8% 5.9% 6.0% 6.0% 6.0%
Y-Y change in Pension Liabilities 10 10 10 10 10 10
Self-insurance accruals as % of Sales 2.1% 2.2% 2.1% 2.1% 2.1% 2.1% 2.1% 2.1% 2.1%
Deferred income taxes -50 -50 -50 -50 -50 -50
Deferred lease obligations as % of PPE,net 20 20 20 20 20 20
Deferred gains, principally related to aircraft transactions (20.00) (20.00) (20.00) (20.00) (20.00) (20.00)
Other liabilities as a % of Sales 0.2% 0.3% 0.5% 0.50% 0.45% 0.40% 0.40% 0.40% 0.40%
Long-term debt as a % of shareholders equity 108.4% 116.7% 77.1% 75.0% 75.0% 70.0% 70.0% 65.0% 65.0%
Share Repurchase ($) (2) 0 (150) (165) (175) (180) (180) (180)
Y-Y Dividend per Share increase (@10%) $0.36 $0.40 $0.44 $0.48 $0.53 $0.59 $0.64 $0.71
10%
Amount Paid as dividend $138 $151 $167 $184 $203 $224

Henry Fund Research
THE UNIVERSITY OF IOWA
Henry B. Tippie School of Management
14
Income Statement 2009 – 2010, Quarterly
FedEx Corp
Income Statement (Millions)
Estimated Estimated Estimated Estimated Estimated Estimated Estimated Estimated Estimated EstimatedFiscal Years Ending 05/31 2009Q1 2009Q2 2009Q3 2009Q4 2009E 2010Q1 2010Q2 2010Q3 2010Q4 2010E
Total revenues 9970 10175 10308 10565 41018 10681 10814 11108 11259 43862
Salaries & employee benefits 3,585 3808 3857 3953 15203 3997 4047 4157 4213 16413
Purchased transportation 1,207 1192 1208 1238 4845 1252 1267 1302 1319 5139
Rentals & landing fees 617 654 663 679 2614 687 696 714 724 2821
Depreciation & amortization 492 522 529 542 2084 548 554 570 577 2249
Fuel 1,599 1232 1248 1279 5359 1293 1310 1345 1363 5312
Maintenance & repairs 537 554 562 576 2229 582 589 605 613 2390
Impairment charges 0 0 0 0 0 0 0 0 0 0
Other operating expenses 1,303 1420 1438 1474 5635 1490 1509 1550 1571 6121
Total costs, expenses & other 9340 9382 9505 9742 37969 9849 9972 10242 10382 40445
Interest expense 0 0 0 0 0 0 0 0 0 0
Interest income -9 -9 -9 -9 -36 -11 -11 -11 -11 -44
Other income (expense), net -3 (1) (1) (1) -6 (1) (1) (1) (1) -4
Income (loss) before taxes 618 783 793 813 3007 820 831 853 865 3369
Tax expense (benefit) 234 274 278 285 1070 287 291 299 303 1179
Income (loss) from continuing operations 384 509 516 529 1937 533 540 555 562 2190
Income (loss) from discontinued operations, net of taxes 0 0 0 0 0 0 0 0 0 0
Net income (loss) 384 509 516 529 1937 533 540 555 562 2190
Weighted average shares outstanding 312.51 312.51 312.51 312.51 313 313 313 313 313 313
Net earnings (loss) per share 1.23 1.63 1.65 1.69 6.20 1.70 1.72 1.77 1.80 7.00
Dividends per common share $0.44 $0.48
Henry Fund Research
THE UNIVERSITY OF IOWA
Henry B. Tippie School of Management
15
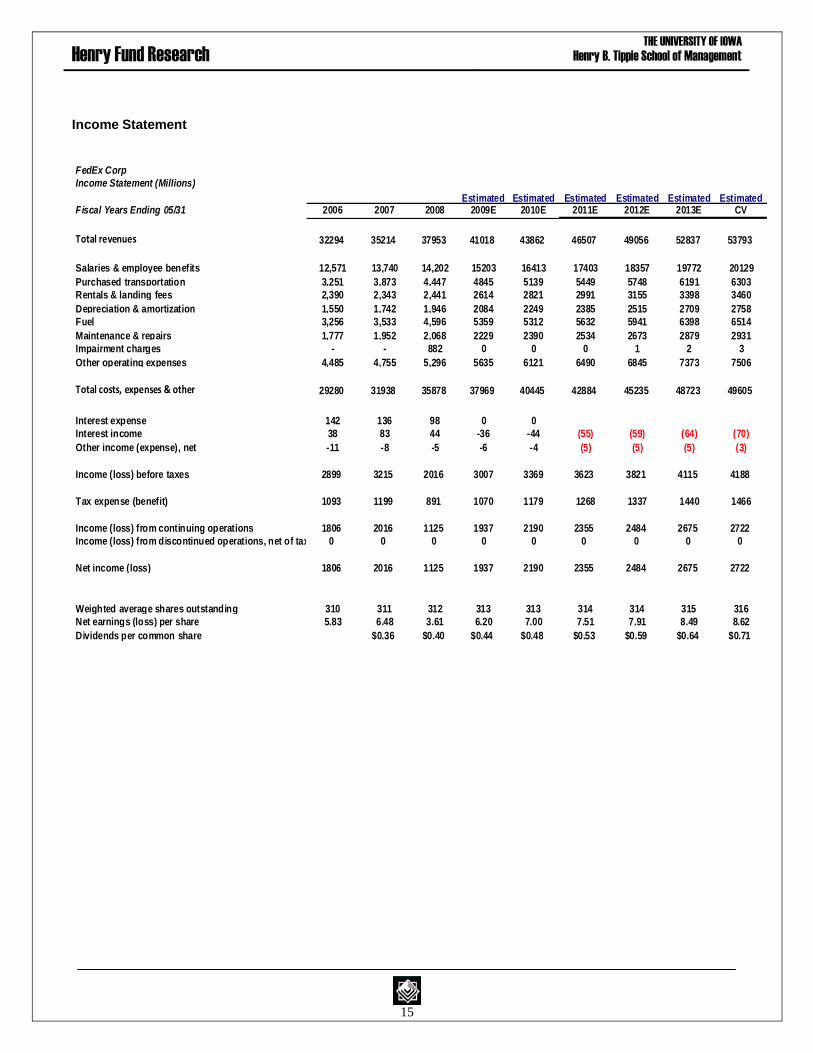
Income Statement
FedEx Corp
Income Statement (Millions)
Estimated Estimated Estimated Estimated Estimated EstimatedFiscal Years Ending 05/31 2006 2007 2008 2009E 2010E 2011E 2012E 2013E CV
Total revenues 32294 35214 37953 41018 43862 46507 49056 52837 53793
Salaries & employee benefits 12,571 13,740 14,202 15203 16413 17403 18357 19772 20129
Purchased transportation 3,251 3,873 4,447 4845 5139 5449 5748 6191 6303
Rentals & landing fees 2,390 2,343 2,441 2614 2821 2991 3155 3398 3460
Depreciation & amortization 1,550 1,742 1,946 2084 2249 2385 2515 2709 2758
Fuel 3,256 3,533 4,596 5359 5312 5632 5941 6398 6514
Maintenance & repairs 1,777 1,952 2,068 2229 2390 2534 2673 2879 2931
Impairment charges - - 882 0 0 0 1 2 3
Other operating expenses 4,485 4,755 5,296 5635 6121 6490 6845 7373 7506
Total costs, expenses & other 29280 31938 35878 37969 40445 42884 45235 48723 49605
Interest expense 142 136 98 0 0
Interest income 38 83 44 -36 -44 (55) (59) (64) (70)
Other income (expense), net -11 -8 -5 -6 -4 (5) (5) (5) (3)
Income (loss) before taxes 2899 3215 2016 3007 3369 3623 3821 4115 4188
Tax expense (benefit) 1093 1199 891 1070 1179 1268 1337 1440 1466
Income (loss) from continuing operations 1806 2016 1125 1937 2190 2355 2484 2675 2722
Income (loss) from discontinued operations, net of taxes 0 0 0 0 0 0 0 0 0
Net income (loss) 1806 2016 1125 1937 2190 2355 2484 2675 2722
Weighted average shares outstanding 310 311 312 313 313 314 314 315 316
Net earnings (loss) per share 5.83 6.48 3.61 6.20 7.00 7.51 7.91 8.49 8.62
Dividends per common share $0.36 $0.40 $0.44 $0.48 $0.53 $0.59 $0.64 $0.71
Henry Fund Research
THE UNIVERSITY OF IOWA
Henry B. Tippie School of Management
16
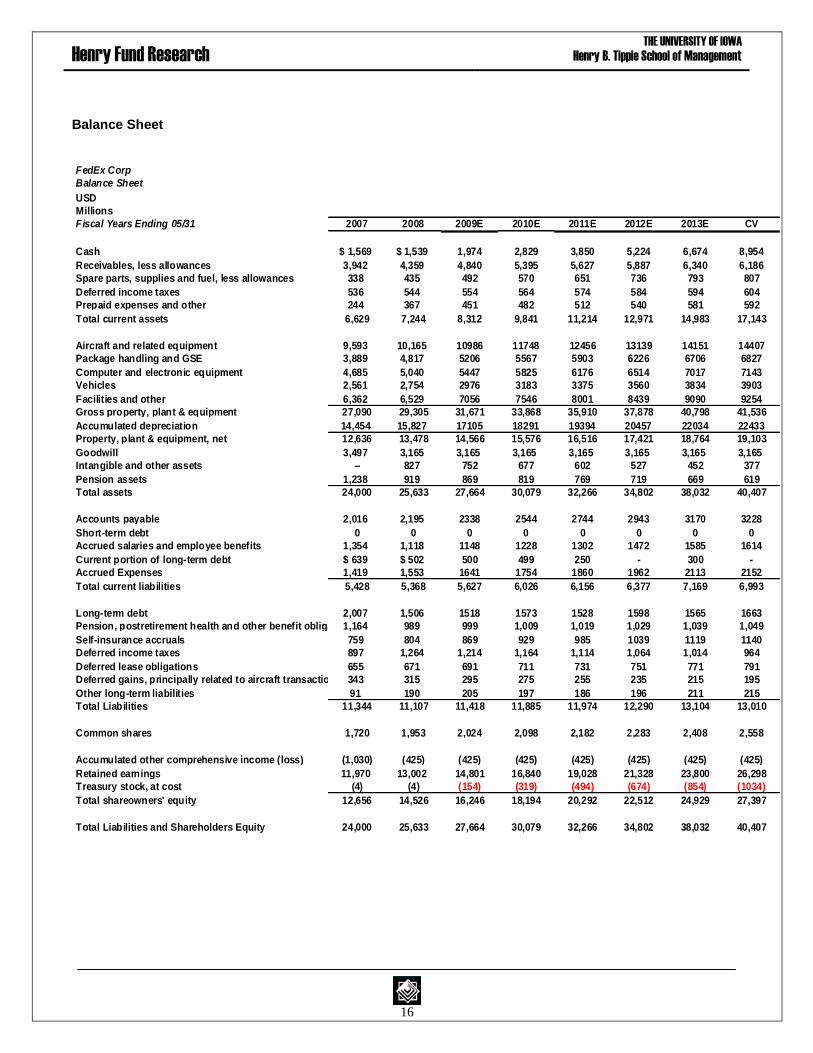
Balance Sheet
FedEx Corp
Balance Sheet
USD
Millions
Fiscal Years Ending 05/31 2007 2008 2009E 2010E 2011E 2012E 2013E CV
Cash $ 1,569 $ 1,539 1,974 2,829 3,850 5,224 6,674 8,954
Receivables, less allowances 3,942 4,359 4,840 5,395 5,627 5,887 6,340 6,186
Spare parts, supplies and fuel, less allowances 338 435 492 570 651 736 793 807
Deferred income taxes 536 544 554 564 574 584 594 604
Prepaid expenses and other 244 367 451 482 512 540 581 592
Total current assets 6,629 7,244 8,312 9,841 11,214 12,971 14,983 17,143
Aircraft and related equipment 9,593 10,165 10986 11748 12456 13139 14151 14407
Package handling and GSE 3,889 4,817 5206 5567 5903 6226 6706 6827
Computer and electronic equipment 4,685 5,040 5447 5825 6176 6514 7017 7143
Vehicles 2,561 2,754 2976 3183 3375 3560 3834 3903
Facilities and other 6,362 6,529 7056 7546 8001 8439 9090 9254
Gross property, plant & equipment 27,090 29,305 31,671 33,868 35,910 37,878 40,798 41,536
Accumulated depreciation 14,454 15,827 17105 18291 19394 20457 22034 22433
Property, plant & equipment, net 12,636 13,478 14,566 15,576 16,516 17,421 18,764 19,103
Goodwill 3,497 3,165 3,165 3,165 3,165 3,165 3,165 3,165
Intangible and other assets – 827 752 677 602 527 452 377
Pension assets 1,238 919 869 819 769 719 669 619
Total assets 24,000 25,633 27,664 30,079 32,266 34,802 38,032 40,407
Accounts payable 2,016 2,195 2338 2544 2744 2943 3170 3228
Short-term debt 0 0 0 0 0 0 0 0
Accrued salaries and employee benefits 1,354 1,118 1148 1228 1302 1472 1585 1614
Current portion of long-term debt $ 639 $ 502 500 499 250 - 300 -
Accrued Expenses 1,419 1,553 1641 1754 1860 1962 2113 2152
Total current liabilities 5,428 5,368 5,627 6,026 6,156 6,377 7,169 6,993
Long-term debt 2,007 1,506 1518 1573 1528 1598 1565 1663
Pension, postretirement health and other benefit obligations1,164 989 999 1,009 1,019 1,029 1,039 1,049
Self-insurance accruals 759 804 869 929 985 1039 1119 1140
Deferred income taxes 897 1,264 1,214 1,164 1,114 1,064 1,014 964
Deferred lease obligations 655 671 691 711 731 751 771 791
Deferred gains, principally related to aircraft transactions 343 315 295 275 255 235 215 195
Other long-term liabilities 91 190 205 197 186 196 211 215
Total Liabilities 11,344 11,107 11,418 11,885 11,974 12,290 13,104 13,010
Common shares 1,720 1,953 2,024 2,098 2,182 2,283 2,408 2,558
Accumulated other comprehensive income (loss) (1,030) (425) (425) (425) (425) (425) (425) (425)
Retained earnings 11,970 13,002 14,801 16,840 19,028 21,328 23,800 26,298
Treasury stock, at cost (4) (4) (154) (319) (494) (674) (854) (1034)
Total shareowners' equity 12,656 14,526 16,246 18,194 20,292 22,512 24,929 27,397
Total Liabilities and Shareholders Equity 24,000 25,633 27,664 30,079 32,266 34,802 38,032 40,407

Henry Fund Research
THE UNIVERSITY OF IOWA
Henry B. Tippie School of Management
17
Value Driver
2007 2008 2009E 2010E 2011E 2012E 2013E CV
$ Mil $ Mil $ Mil $ Mil $ Mil $ Mil $ Mil $ Mil
NOPLAT
Pre-Tax Earnings 3,215 2,016 3,007 3,369 3,623 3,821 4,115 4,188
Add: Interest Expense 53 54 36 44 55 59 64 70
EBITA 3,268 2,070 3,043 3,413 3,678 3,880 4,179 4,258
Less: Tax on EBITA
Marginal Tax Rate 37.29% 44.20% 35.00% 35.00% 35.00% 35.00% 35.00% 35.00%
Total Income Tax Provision 1,199 891 1,070 1,179 1,268 1,337 1,440 1,466
Add: Tax Shield on Interest Expense 20 24 13 15 19 21 22 25
Add: Tax Shield on Amoritization 429 607 447 415 386 372 552 140
Less: Tax Shield on non-operating income 3 2 1 0 0 0 2 0
Taxes on EBITA 1,651 1,524 1,531 1,610 1,674 1,730 2,017 1,630
Add: Changes in Deferred Tax 359 (60) (60) (60) (60) (60) (60)
NOPLAT 1,617 905 1,452 1,743 1,945 2,090 2,102 2,568
INVESTED CAPITAL
Operating Working Capital
Plus: Normal Cash * 1,569 949 1,025 1,097 1,163 1,226 1,321 1,345
Plus: Receivables 3,942 4,359 4,840 5,395 5,627 5,887 6,340 6,186
Plus: Spares 338 435 492 570 651 736 793 807
Plus: Prepaid Expenses and Other 244 367 451 482 512 540 581 592
Less: Accounts Payable (2,016) (2,195) (2,338) (2,544) (2,744) (2,943) (3,170) (3,228)
Less: Other current liabilities (1,419) (1,553) (1,641) (1,754) (1,860) (1,962) (2,113) (2,152)
Less: Accrued salaries and employee benefits (1,354) (1,118) (1,148) (1,228) (1,302) (1,472) (1,585) (1,614)
Net Operating Working Capital 1,304 1,244 1,682 2,018 2,046 2,011 2,166 1,937
Net Property Plant Equipment 12,636 13,478 14,566 15,576 16,516 17,421 18,764 19,103
Add:Other Long Term Op. Assets - - - - - - - -
Add: Operating Leases 1,803 1,647 1,482 1,332 1,208 8,338
Net Invested Capital 13,940 14,722 18,051 19,241 20,044 20,764 22,138 29,378
ROIC (Return on Invested Capital)
NOPLAT 1,617 905 1,452 1,743 1,945 2,090 2,102 2,568
Invested Capital (Beginning) 13,940 14,722 18,051 19,241 20,044 20,764 22,138
ROIC (NOPLAT/Invested Capital) 6.49% 9.86% 9.66% 10.11% 10.43% 10.12% 11.60%
FREE CASH FLOWS
NOPLAT 1,617 905 1,452 1,743 1,945 2,090 2,102 2,568
Net Investment (Change in Invested Capital) 782 3,329 1,190 803 720 1,374 7,240
Free Cashflows (NOPLAT - NI) 123 (1,877) 553 1,142 1,370 728 (4,672)
ECONOMIC PROFIT
Invested Capital (Beginning) 13,940 14,722 18,051 19,241 20,044 20,764 22,138
ROIC 6.49% 9.86% 9.66% 10.11% 10.43% 10.12% 11.60%
WACC 6.47% 6.47% 6.47% 6.47% 6.47% 6.47% 6.47% 6.47%
EP (Invested Capital*(ROIC - WACC)) - 4 500 576 701 794 760 1,137
NON-OPERATING ASSETS
Cash on Hand 1569 1539 1974 2829 3850 5224 6674 8954
"Normal" Cash 1569 949 1025 1097 1163 1226 1321 1345
Excess Cash 0 590 949 1733 2687 3998 5353 7609
Investments & LT Recievables
Non-Operating Assets 0 590 949 1733 2687 3998 5353 7609
FedEx CorpValue Driver Calculations
Henry Fund Research
THE UNIVERSITY OF IOWA
Henry B. Tippie School of Management
18
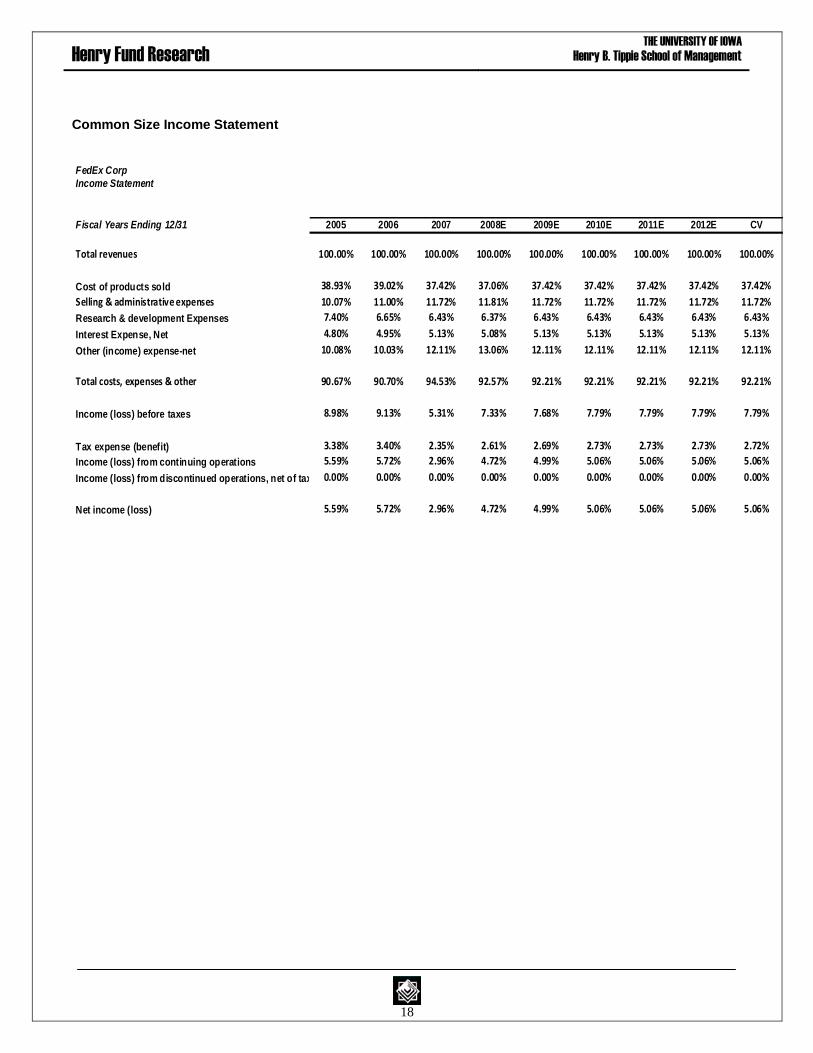
Common Size Income Statement
FedEx Corp
Income Statement
Fiscal Years Ending 12/31 2005 2006 2007 2008E 2009E 2010E 2011E 2012E CV
Total revenues 100.00% 100.00% 100.00% 100.00% 100.00% 100.00% 100.00% 100.00% 100.00%
Cost of products sold 38.93% 39.02% 37.42% 37.06% 37.42% 37.42% 37.42% 37.42% 37.42%
Selling & administrative expenses 10.07% 11.00% 11.72% 11.81% 11.72% 11.72% 11.72% 11.72% 11.72%
Research & development Expenses 7.40% 6.65% 6.43% 6.37% 6.43% 6.43% 6.43% 6.43% 6.43%
Interest Expense, Net 4.80% 4.95% 5.13% 5.08% 5.13% 5.13% 5.13% 5.13% 5.13%
Other (income) expense-net 10.08% 10.03% 12.11% 13.06% 12.11% 12.11% 12.11% 12.11% 12.11%
Total costs, expenses & other 90.67% 90.70% 94.53% 92.57% 92.21% 92.21% 92.21% 92.21% 92.21%
Income (loss) before taxes 8.98% 9.13% 5.31% 7.33% 7.68% 7.79% 7.79% 7.79% 7.79%
Tax expense (benefit) 3.38% 3.40% 2.35% 2.61% 2.69% 2.73% 2.73% 2.73% 2.72%
Income (loss) from continuing operations 5.59% 5.72% 2.96% 4.72% 4.99% 5.06% 5.06% 5.06% 5.06%
Income (loss) from discontinued operations, net of taxes 0.00% 0.00% 0.00% 0.00% 0.00% 0.00% 0.00% 0.00% 0.00%
Net income (loss) 5.59% 5.72% 2.96% 4.72% 4.99% 5.06% 5.06% 5.06% 5.06%
Henry Fund Research
THE UNIVERSITY OF IOWA
Henry B. Tippie School of Management
19
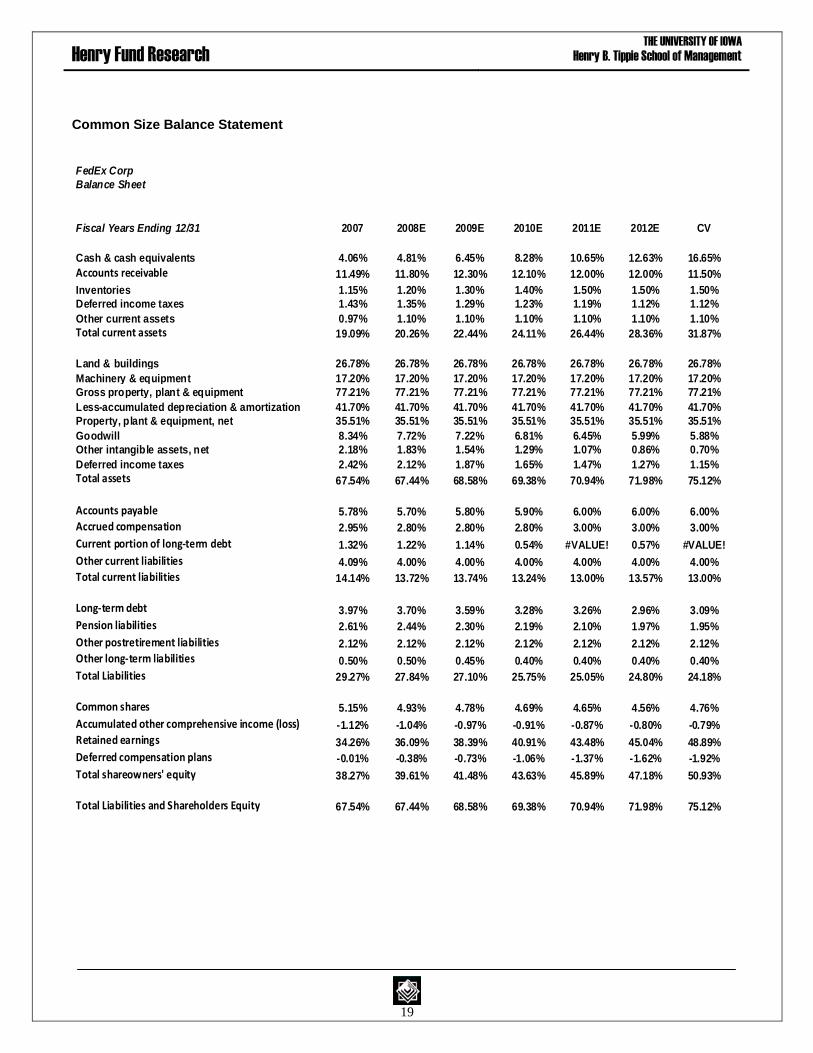
Common Size Balance Statement
FedEx Corp
Balance Sheet
Fiscal Years Ending 12/31 2007 2008E 2009E 2010E 2011E 2012E CV
Cash & cash equivalents 4.06% 4.81% 6.45% 8.28% 10.65% 12.63% 16.65%
Accounts receivable 11.49% 11.80% 12.30% 12.10% 12.00% 12.00% 11.50%
Inventories 1.15% 1.20% 1.30% 1.40% 1.50% 1.50% 1.50%
Deferred income taxes 1.43% 1.35% 1.29% 1.23% 1.19% 1.12% 1.12%
Other current assets 0.97% 1.10% 1.10% 1.10% 1.10% 1.10% 1.10%
Total current assets 19.09% 20.26% 22.44% 24.11% 26.44% 28.36% 31.87%
Land & buildings 26.78% 26.78% 26.78% 26.78% 26.78% 26.78% 26.78%
Machinery & equipment 17.20% 17.20% 17.20% 17.20% 17.20% 17.20% 17.20%
Gross property, plant & equipment 77.21% 77.21% 77.21% 77.21% 77.21% 77.21% 77.21%
Less-accumulated depreciation & amortization 41.70% 41.70% 41.70% 41.70% 41.70% 41.70% 41.70%
Property, plant & equipment, net 35.51% 35.51% 35.51% 35.51% 35.51% 35.51% 35.51%
Goodwill 8.34% 7.72% 7.22% 6.81% 6.45% 5.99% 5.88%
Other intangible assets, net 2.18% 1.83% 1.54% 1.29% 1.07% 0.86% 0.70%
Deferred income taxes 2.42% 2.12% 1.87% 1.65% 1.47% 1.27% 1.15%
Total assets 67.54% 67.44% 68.58% 69.38% 70.94% 71.98% 75.12%
Accounts payable 5.78% 5.70% 5.80% 5.90% 6.00% 6.00% 6.00%
Accrued compensation 2.95% 2.80% 2.80% 2.80% 3.00% 3.00% 3.00%
Current portion of long-term debt 1.32% 1.22% 1.14% 0.54% #VALUE! 0.57% #VALUE!
Other current liabilities 4.09% 4.00% 4.00% 4.00% 4.00% 4.00% 4.00%
Total current liabilities 14.14% 13.72% 13.74% 13.24% 13.00% 13.57% 13.00%
Long-term debt 3.97% 3.70% 3.59% 3.28% 3.26% 2.96% 3.09%
Pension liabilities 2.61% 2.44% 2.30% 2.19% 2.10% 1.97% 1.95%
Other postretirement liabilities 2.12% 2.12% 2.12% 2.12% 2.12% 2.12% 2.12%
Other long-term liabilities 0.50% 0.50% 0.45% 0.40% 0.40% 0.40% 0.40%
Total Liabilities 29.27% 27.84% 27.10% 25.75% 25.05% 24.80% 24.18%
Common shares 5.15% 4.93% 4.78% 4.69% 4.65% 4.56% 4.76%
Accumulated other comprehensive income (loss) -1.12% -1.04% -0.97% -0.91% -0.87% -0.80% -0.79%
Retained earnings 34.26% 36.09% 38.39% 40.91% 43.48% 45.04% 48.89%
Deferred compensation plans -0.01% -0.38% -0.73% -1.06% -1.37% -1.62% -1.92%
Total shareowners' equity 38.27% 39.61% 41.48% 43.63% 45.89% 47.18% 50.93%
Total Liabilities and Shareholders Equity 67.54% 67.44% 68.58% 69.38% 70.94% 71.98% 75.12%
Henry Fund Research
THE UNIVERSITY OF IOWA
Henry B. Tippie School of Management
20
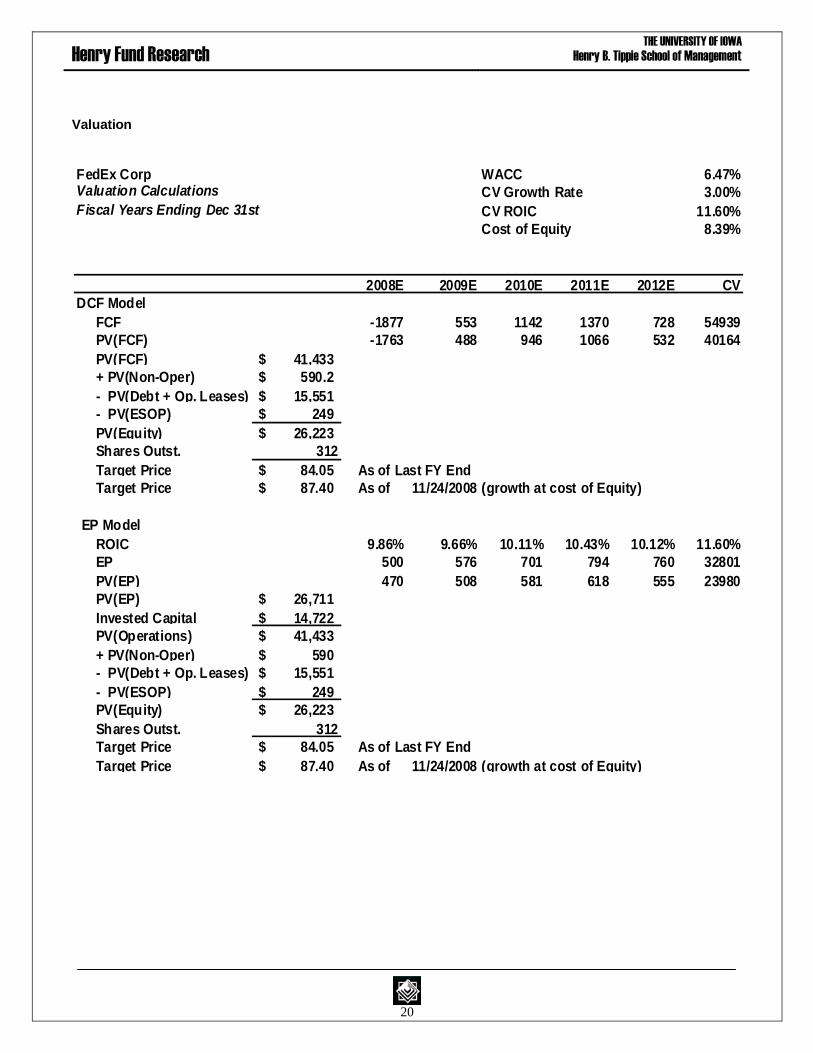
Valuation
FedEx Corp WACC 6.47%Valuation Calculations CV Growth Rate 3.00%
Fiscal Years Ending Dec 31st CV ROIC 11.60%
Cost of Equity 8.39%
2008E 2009E 2010E 2011E 2012E CV
DCF Model
FCF -1877 553 1142 1370 728 54939
PV(FCF) -1763 488 946 1066 532 40164
PV(FCF) 41,433$
+ PV(Non-Oper) 590.2$
- PV(Debt + Op. Leases) 15,551$
- PV(ESOP) 249$
PV(Equity) 26,223$
Shares Outst. 312
Target Price 84.05$ As of Last FY End
Target Price 87.40$ As of 11/24/2008 (growth at cost of Equity)
EP Model
ROIC 9.86% 9.66% 10.11% 10.43% 10.12% 11.60%
EP 500 576 701 794 760 32801
PV(EP) 470 508 581 618 555 23980
PV(EP) 26,711$
Invested Capital 14,722$
PV(Operations) 41,433$
+ PV(Non-Oper) 590$
- PV(Debt + Op. Leases) 15,551$
- PV(ESOP) 249$
PV(Equity) 26,223$
Shares Outst. 312
Target Price 84.05$ As of Last FY End
Target Price 87.40$ As of 11/24/2008 (growth at cost of Equity)
Henry Fund Research
THE UNIVERSITY OF IOWA
Henry B. Tippie School of Management
21
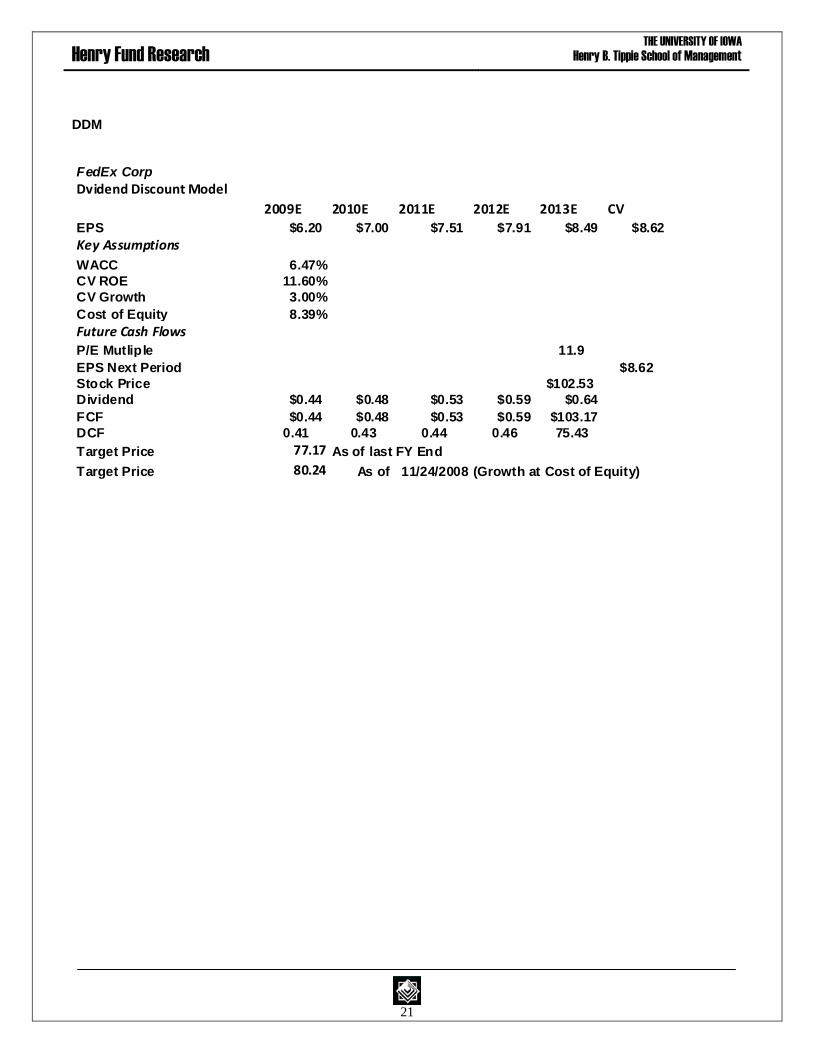
DDM
FedEx Corp
Dvidend Discount Model
2009E 2010E 2011E 2012E 2013E CV
EPS $6.20 $7.00 $7.51 $7.91 $8.49 $8.62
Key Assumptions
WACC 6.47%
CV ROE 11.60%
CV Growth 3.00%
Cost of Equity 8.39%
Future Cash Flows
P/E Mutliple 11.9
EPS Next Period $8.62
Stock Price $102.53
Dividend $0.44 $0.48 $0.53 $0.59 $0.64
FCF $0.44 $0.48 $0.53 $0.59 $103.17
DCF 0.41 0.43 0.44 0.46 75.43
Target Price 77.17 As of last FY End
Target Price 80.24 As of 11/24/2008 (Growth at Cost of Equity)
Henry Fund Research
THE UNIVERSITY OF IOWA
Henry B. Tippie School of Management
22
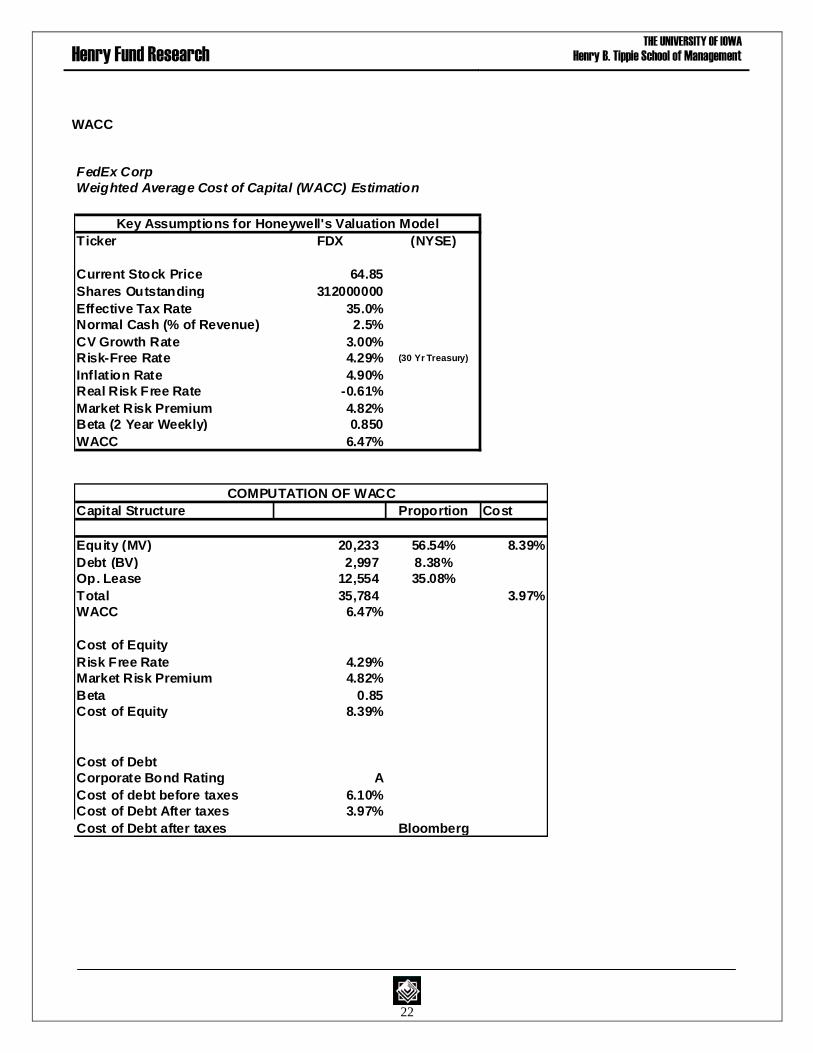
WACC
FedEx Corp
Weighted Average Cost of Capital (WACC) Estimation
Ticker FDX (NYSE)
Current Stock Price 64.85
Shares Outstanding 312000000
Effective Tax Rate 35.0%
Normal Cash (% of Revenue) 2.5%
CV Growth Rate 3.00%
Risk-Free Rate 4.29% (30 Yr Treasury)
Inflation Rate 4.90%
Real Risk Free Rate -0.61%
Market Risk Premium 4.82%
Beta (2 Year Weekly) 0.850
WACC 6.47%
Capital Structure Proportion Cost
Equity (MV) 20,233 56.54% 8.39%
Debt (BV) 2,997 8.38%
Op. Lease 12,554 35.08%
Total 35,784 3.97%
WACC 6.47%
Cost of Equity
Risk Free Rate 4.29%
Market Risk Premium 4.82%
Beta 0.85
Cost of Equity 8.39%
Cost of Debt
Corporate Bond Rating A
Cost of debt before taxes 6.10%
Cost of Debt After taxes 3.97%
Cost of Debt after taxes Bloomberg
Key Assumptions for Honeywell's Valuation Model
COMPUTATION OF WACC
Henry Fund Research
THE UNIVERSITY OF IOWA
Henry B. Tippie School of Management
23
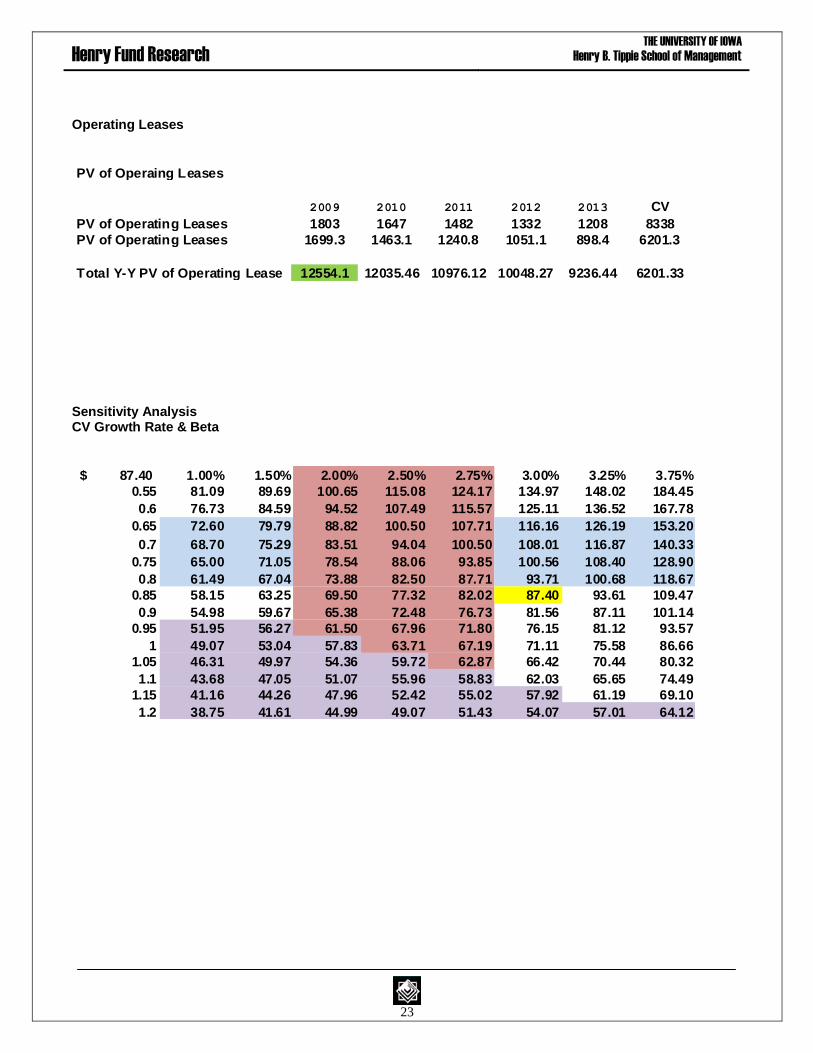
Operating Leases
Sensitivity Analysis CV Growth Rate & Beta
PV of Operaing Leases
2009 2010 2011 2012 2013 CV
PV of Operating Leases 1803 1647 1482 1332 1208 8338
PV of Operating Leases 1699.3 1463.1 1240.8 1051.1 898.4 6201.3
Total Y-Y PV of Operating Lease 12554.1 12035.46 10976.12 10048.27 9236.44 6201.33
87.40$ 1.00% 1.50% 2.00% 2.50% 2.75% 3.00% 3.25% 3.75%
0.55 81.09 89.69 100.65 115.08 124.17 134.97 148.02 184.45
0.6 76.73 84.59 94.52 107.49 115.57 125.11 136.52 167.78
0.65 72.60 79.79 88.82 100.50 107.71 116.16 126.19 153.20
0.7 68.70 75.29 83.51 94.04 100.50 108.01 116.87 140.33
0.75 65.00 71.05 78.54 88.06 93.85 100.56 108.40 128.90
0.8 61.49 67.04 73.88 82.50 87.71 93.71 100.68 118.67
0.85 58.15 63.25 69.50 77.32 82.02 87.40 93.61 109.47
0.9 54.98 59.67 65.38 72.48 76.73 81.56 87.11 101.14
0.95 51.95 56.27 61.50 67.96 71.80 76.15 81.12 93.57
1 49.07 53.04 57.83 63.71 67.19 71.11 75.58 86.66
1.05 46.31 49.97 54.36 59.72 62.87 66.42 70.44 80.32
1.1 43.68 47.05 51.07 55.96 58.83 62.03 65.65 74.49
1.15 41.16 44.26 47.96 52.42 55.02 57.92 61.19 69.10
1.2 38.75 41.61 44.99 49.07 51.43 54.07 57.01 64.12

Henry Fund Research
THE UNIVERSITY OF IOWA
Henry B. Tippie School of Management
24
Marginal Tax Rate & Risk Free Rate
87.40$ 31.00% 32.00% 33.00% 34.00% 35.00% 36.00% 37.00% 38.00% 39.00% 40.00% 41.00% 42.00% 43.00%
2.6% 137.45 139.56 141.72 143.93 146.18 148.48 150.83 153.23 155.68 158.19 160.76 163.38 166.07
2.8% 128.99 130.93 132.91 134.94 137.00 139.11 141.25 143.45 145.69 147.98 150.32 152.71 155.15
3.0% 121.20 122.99 124.82 126.68 128.58 130.51 132.49 134.50 136.55 138.65 140.79 142.98 145.21
3.2% 114.00 115.66 117.35 119.07 120.82 122.60 124.42 126.28 128.17 130.10 132.06 134.07 136.11
3.4% 107.33 108.87 110.44 112.03 113.65 115.30 116.99 118.70 120.44 122.22 124.03 125.88 127.76
3.6% 101.14 102.57 104.02 105.50 107.01 108.54 110.10 111.69 113.30 114.95 116.62 118.33 120.07
3.8% 95.36 96.70 98.05 99.43 100.83 102.26 103.71 105.18 106.69 108.21 109.77 111.35 112.96
4.0% 89.97 91.21 92.48 93.77 95.08 96.41 97.76 99.13 100.53 101.95 103.40 104.87 106.36
4.2% 84.92 86.09 87.27 88.48 89.70 90.95 92.21 93.49 94.80 96.12 97.47 98.84 100.23
4.4% 80.18 81.28 82.39 83.52 84.67 85.83 87.02 88.22 89.44 90.68 91.94 93.22 94.52
4.6% 75.72 76.76 77.80 78.87 79.94 81.04 82.15 83.28 84.42 85.58 86.76 87.96 89.17
4.8% 71.53 72.50 73.49 74.49 75.50 76.53 77.57 78.63 79.71 80.80 81.91 83.03 84.17
5.0% 67.57 68.48 69.42 70.36 71.32 72.29 73.27 74.27 75.28 76.31 77.35 78.40 79.48
5.2% 63.82 64.69 65.57 66.46 67.37 68.28 69.21 70.15 71.11 72.07 73.06 74.05 75.06
5.4% 60.28 61.10 61.93 62.78 63.63 64.50 65.38 66.27 67.17 68.08 69.01 69.95 70.90
5.6% 56.92 57.70 58.49 59.29 60.10 60.92 61.75 62.59 63.44 64.31 65.18 66.07 66.97
Henry Fund Research
THE UNIVERSITY OF IOWA
Henry B. Tippie School of Management
25
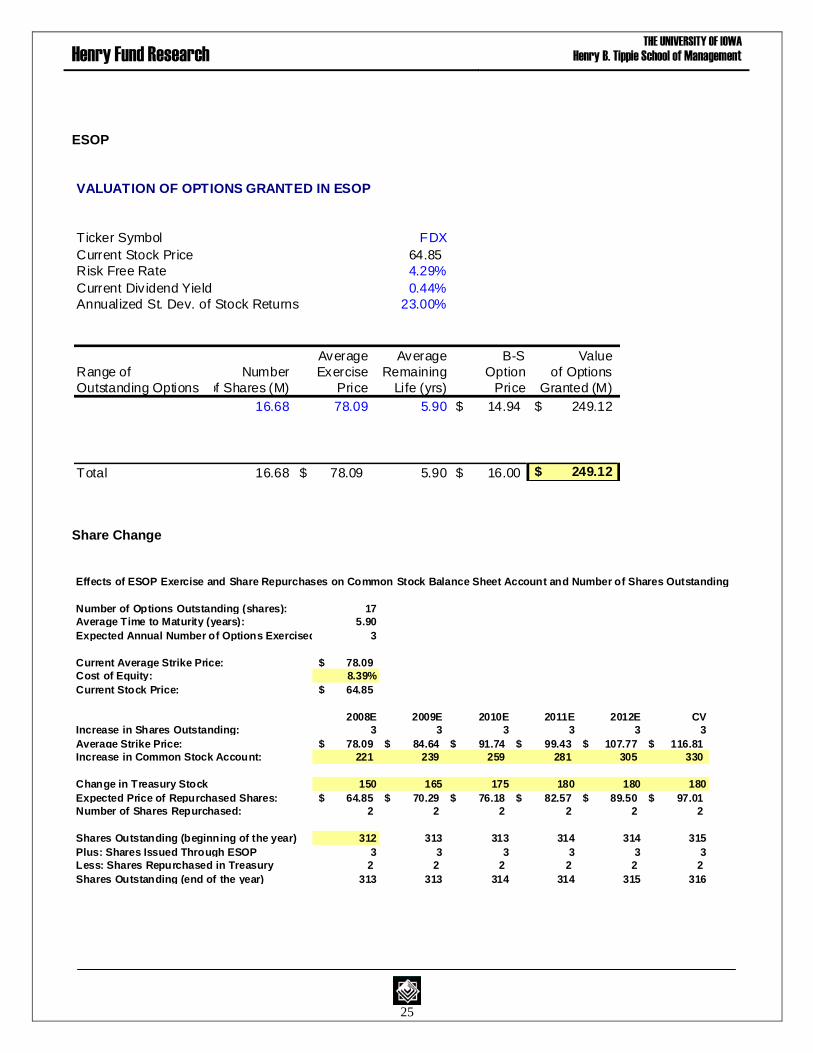
ESOP
Share Change
VALUATION OF OPTIONS GRANTED IN ESOP
Ticker Symbol FDX
Current Stock Price 64.85
Risk Free Rate 4.29%
Current Div idend Yield 0.44%
Annualized St. Dev. of Stock Returns 23.00%
Average Average B-S Value
Range of Number Exercise Remaining Option of Options
Outstanding Options of Shares (M) Price Life (yrs) Price Granted (M)
16.68 78.09 5.90 14.94$ 249.12$
Total 16.68 78.09$ 5.90 16.00$ 249.12$
Effects of ESOP Exercise and Share Repurchases on Common Stock Balance Sheet Account and Number of Shares Outstanding
Number of Options Outstanding (shares): 17
Average Time to Maturity (years): 5.90
Expected Annual Number of Options Exercised: 3
Current Average Strike Price: 78.09$
Cost of Equity: 8.39%
Current Stock Price: 64.85$
2008E 2009E 2010E 2011E 2012E CV
Increase in Shares Outstanding: 3 3 3 3 3 3
Average Strike Price: 78.09$ 84.64$ 91.74$ 99.43$ 107.77$ 116.81$
Increase in Common Stock Account: 221 239 259 281 305 330
Change in Treasury Stock 150 165 175 180 180 180
Expected Price of Repurchased Shares: 64.85$ 70.29$ 76.18$ 82.57$ 89.50$ 97.01$
Number of Shares Repurchased: 2 2 2 2 2 2
Shares Outstanding (beginning of the year) 312 313 313 314 314 315
Plus: Shares Issued Through ESOP 3 3 3 3 3 3
Less: Shares Repurchased in Treasury 2 2 2 2 2 2
Shares Outstanding (end of the year) 313 313 314 314 315 316