Embed Size (px)
Citation preview

Federal Housing Finance Agency
Foreclosure Prevention ReportApril 2014
FHFA Federal Property Manager's Report
This report contains data on foreclosure prevention activity of Fannie Mae and Freddie Mac (the Enterprises) through April 2014.

Foreclosure Prevention ActivitiesMar-14 Apr-14
HAMP Active Trials 10,764 10,250 HAMP Active Permanent - Cumulative 431,677 430,830
Completed Foreclosure Prevention ActionsLoan Modifications * 18,606 17,756 Repayment Plans 5,169 4,863 Forbearance Plans 1,511 605 Charge-offs-in-lieu 141 107 Home Retention Actions 25,427 23,331 Short Sales 3,383 3,635 Deeds-in-lieu 1,455 1,353 Home Forfeiture Actions 4,838 4,988
TOTAL 30,265 28,319
* Includes HAMP permanent modifications
Mortgage Performance (at period end)Mar-14 Apr-14
30-59 Days Delinquent 391,287 395,25360-plus-days Delinquent 724,081 704,061Foreclosure Starts 29,907 26,044Third-party & Foreclosure Sales 15,355 14,823
(Percent of total loans serviced)30-59 Days Delinquent 1.40% 1.41%60-plus-days Delinquent 2.59% 2.52%Serious Delinquent* 2.19% 2.14%* 90 days or more delinquent, or in the process of foreclosure.
28KCompleted Foreclosure
Prevention Actions in April
Third-party and Foreclosure Sales
3%in April
Federal Housing Finance Agency Foreclosure Prevention ReportApril 2014
Source: FHFA (Fannie Mae and Freddie Mac)
Source: FHFA (Fannie Mae and Freddie Mac)
April 2014 HighlightsThe Enterprises' Foreclosure Prevention Actions:
• Approximately 28,300 foreclosure preventionactions were completed in April, bringing the total to more than 3.2 million since the start of the conservatorships in September 2008. Half of these actions have been permanent loan modifications.
• There were nearly 17,800 permanent loanmodifications in April, down 5 percent compared with March.
• Approximately 26 percent of all permanent loanmodifications in April included principal forbearance.
• Nearly 5,000 short sales and deeds-in-lieu werecompleted in April, up 3 percent compared with March.
The Enterprises' Mortgage Performance:
• The serious delinquency rate dropped to 2.14percent at the end of April, from 2.19 percent in March.
The Enterprises' Foreclosures:
• Third-party and foreclosure sales declined 3percent to approximately 14,800, while foreclosure starts dropped 13 percent to 26,000 in April.
Please see glossary on page 14 Page 2

HAMP Statistics 3
Cumulative from April 2009 through Mar-14 Apr-14Trials Ever Started 1,060,036 1,062,089 Less:
Trials Disqualified (79,163) (79,136)Trials Cancelled (349,739) (349,834)Permanent Modifications (620,370) (622,869)
Trials Remaining Active 10,764 10,250
Permanent Modifications Started 620,370 622,869 Less:
Modifications Defaulted (169,020) (171,627)Modifications Paid off (19,673) (20,412)
Active Permanent Modifications 431,677 430,830
14 14 13 1214
12 13 12 14 1311
13 11
6 6 76
8
78 8 7
67
66
0
5
10
15
20
25
Apr-13
May-13
Jun-13
Jul-13
Aug-13
Sep-13
Oct-13
Nov-13
Dec-13
Jan-14
Feb-14
Mar-14
Apr-14
# of
loan
s in
thou
sand
s
Completed loan modifications Loan modifications decreased 5 percent in April.
Freddie Mac
Fannie Mae
Source: FHFA (Fannie Mae and Freddie Mac)
20 20 20 18 21 18 21 20 21 19 17 19 18
11 8 55
55
5 5 5 5 6 5 5
11 2
11
11 1 1 1 1 2 1
1011
910
97
8 6 6 6 5 5 5
0
10
20
30
40
50
Apr13
May13
Jun13
Jul13
Aug13
Sep13
Oct13
Nov13
Dec13
Jan14
Feb14
Mar14
Apr14
# of
loan
s in
thou
sand
s
Foreclosure Prevention Actions CompletedForeclosure prevention actions decreased 6 percent in April driven by
decreases in loan modifications and forbearance plans.
Loan Modifications
Short Sales & Deeds-In-Lieu
RepaymentPlans2
ForbearancePlans2
Source: FHFA (Fannie Mae and Freddie Mac)
Federal Housing Finance Agency Foreclosure Prevention ReportApril 2014
Source: FHFA (Fannie Mae and Freddie Mac)
1 Includes loans with missing original credit score.2 Includes loans that were 30+ days delinquent at initiation of the plan. In addition, the completed forbearance plans data have been revised to exclude HAMP.3 HAMP trial modifications are based on the first trial payment posted date. HAMP permanent modifications are based on the effective date of modification. As of April 30, 2014, Fannie Mae had approximately 256,100 HAMP active permanent modifications and Freddie Mac had nearly 174,800 HAMP active permanent modifications.
1.5%
5.8%
2.5%
0%
2%
4%
6%
Enterprises' 60-plus-days Delinquency RatesSerious delinquency rates continued to decline in April.
Source: FHFA (Fannie Mae and Freddie Mac)
from 2.6% in March
Please see glossary on page 14 Page 3

Full Year2012
Full Year2013
YTDApr-14
Conservatorship to Date1
Home Retention ActionsRepayment Plans 142,615 85,386 20,919 772,101 Forbearance Plans 22,812 12,671 3,499 163,772 Charge-offs-in-lieu 1,335 647 373 10,256 HomeSaver Advance (Fannie) - - - 70,178 Loan Modifications 232,993 243,195 72,428 1,633,170
Total 399,755 341,899 97,219 2,649,477
Nonforeclosure - Home Forfeiture ActionsShort Sales 125,232 87,742 14,348 512,151 Deeds-in-lieu 16,232 18,087 5,572 59,676
Total 141,464 105,829 19,920 571,827
Total Foreclosure Prevention Actions 541,219 447,728 117,139 3,221,304 1 Since the first full quarter in conservatorship (4Q08).
Completed Foreclosure Prevention ActionsSince the first full quarter in conservatorship (4Q08), combined completed foreclosure prevention actions
total more than 3.2 million. Half of these actions are permanent loan modifications.
Federal Housing Finance Agency Foreclosure Prevention ReportApril 2014
Source: FHFA (Fannie Mae and Freddie Mac)
Please see glossary on page 14 Page 4

0
2,000
4,000
6,000
8,000
10,000
Apr-13
May-13
Jun-13
Jul-13
Aug-13
Sep-13
Oct-13
Nov-13
Dec-13
Jan-14
Feb-14
Mar-14
Apr-14
Short SalesCompleted short sales increased 7 percent in April.
Freddie Mac
Fannie Mae
Source: FHFA (Fannie Mae and Freddie Mac)
0
5,000
10,000
15,000
20,000
25,000
Apr-13
May-13
Jun-13
Jul-13
Aug-13
Sep-13
Oct-13
Nov-13
Dec-13
Jan-14
Feb-14
Mar-14
Apr-14
Foreclosure Sales and Third-party SalesForeclosure and third-party sales decreased 3 percent in April.
Freddie Mac
Fannie Mae
Source: FHFA (Fannie Mae and Freddie Mac)
Federal Housing Finance Agency Foreclosure Prevention ReportApril 2014
Please see glossary on page 14 Page 5
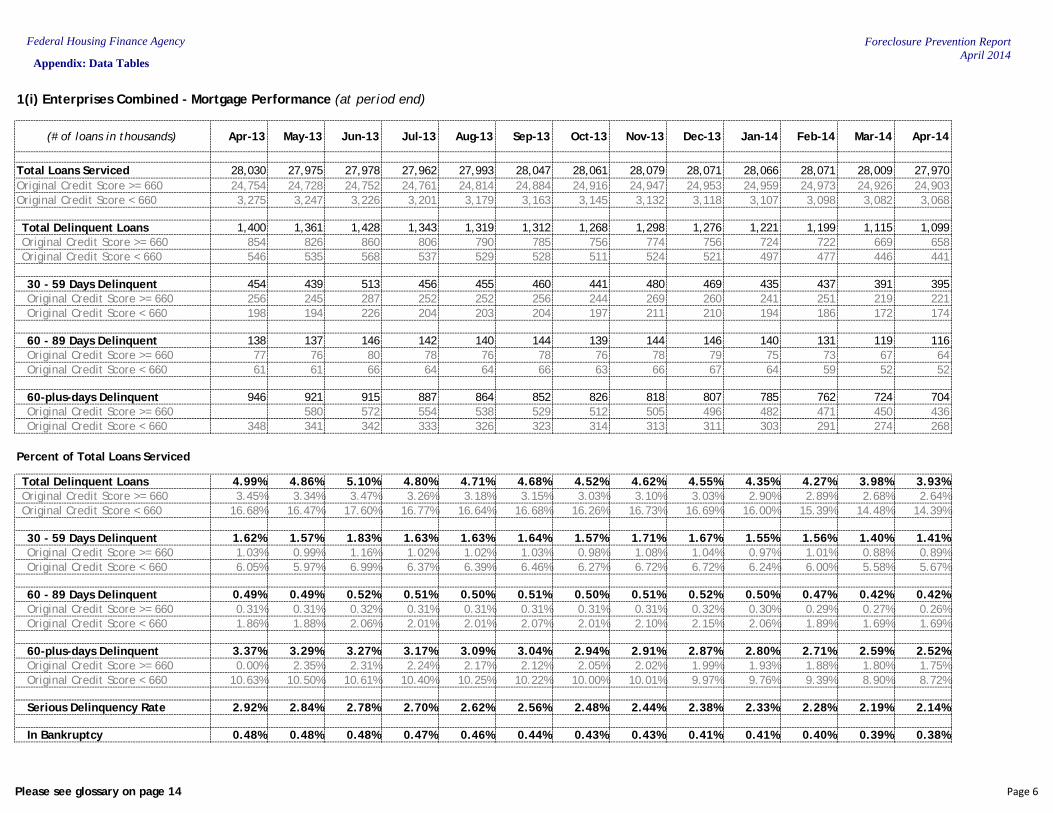
1(i) Enterprises Combined - Mortgage Performance (at period end)
(# of loans in thousands) Apr-13 May-13 Jun-13 Jul-13 Aug-13 Sep-13 Oct-13 Nov-13 Dec-13 Jan-14 Feb-14 Mar-14 Apr-14
Total Loans Serviced 28,030 27,975 27,978 27,962 27,993 28,047 28,061 28,079 28,071 28,066 28,071 28,009 27,970Original Credit Score >= 660 24,754 24,728 24,752 24,761 24,814 24,884 24,916 24,947 24,953 24,959 24,973 24,926 24,903Original Credit Score < 660 3,275 3,247 3,226 3,201 3,179 3,163 3,145 3,132 3,118 3,107 3,098 3,082 3,068
Total Delinquent Loans 1,400 1,361 1,428 1,343 1,319 1,312 1,268 1,298 1,276 1,221 1,199 1,115 1,099Original Credit Score >= 660 854 826 860 806 790 785 756 774 756 724 722 669 658Original Credit Score < 660 546 535 568 537 529 528 511 524 521 497 477 446 441
30 - 59 Days Delinquent 454 439 513 456 455 460 441 480 469 435 437 391 395Original Credit Score >= 660 256 245 287 252 252 256 244 269 260 241 251 219 221Original Credit Score < 660 198 194 226 204 203 204 197 211 210 194 186 172 174
60 - 89 Days Delinquent 138 137 146 142 140 144 139 144 146 140 131 119 116Original Credit Score >= 660 77 76 80 78 76 78 76 78 79 75 73 67 64Original Credit Score < 660 61 61 66 64 64 66 63 66 67 64 59 52 52
60-plus-days Delinquent 946 921 915 887 864 852 826 818 807 785 762 724 704Original Credit Score >= 660 580 572 554 538 529 512 505 496 482 471 450 436Original Credit Score < 660 348 341 342 333 326 323 314 313 311 303 291 274 268
Percent of Total Loans Serviced
Total Delinquent Loans 4.99% 4.86% 5.10% 4.80% 4.71% 4.68% 4.52% 4.62% 4.55% 4.35% 4.27% 3.98% 3.93%Original Credit Score >= 660 3.45% 3.34% 3.47% 3.26% 3.18% 3.15% 3.03% 3.10% 3.03% 2.90% 2.89% 2.68% 2.64%Original Credit Score < 660 16.68% 16.47% 17.60% 16.77% 16.64% 16.68% 16.26% 16.73% 16.69% 16.00% 15.39% 14.48% 14.39%
30 - 59 Days Delinquent 1.62% 1.57% 1.83% 1.63% 1.63% 1.64% 1.57% 1.71% 1.67% 1.55% 1.56% 1.40% 1.41%Original Credit Score >= 660 1.03% 0.99% 1.16% 1.02% 1.02% 1.03% 0.98% 1.08% 1.04% 0.97% 1.01% 0.88% 0.89%Original Credit Score < 660 6.05% 5.97% 6.99% 6.37% 6.39% 6.46% 6.27% 6.72% 6.72% 6.24% 6.00% 5.58% 5.67%
60 - 89 Days Delinquent 0.49% 0.49% 0.52% 0.51% 0.50% 0.51% 0.50% 0.51% 0.52% 0.50% 0.47% 0.42% 0.42%Original Credit Score >= 660 0.31% 0.31% 0.32% 0.31% 0.31% 0.31% 0.31% 0.31% 0.32% 0.30% 0.29% 0.27% 0.26%Original Credit Score < 660 1.86% 1.88% 2.06% 2.01% 2.01% 2.07% 2.01% 2.10% 2.15% 2.06% 1.89% 1.69% 1.69%
60-plus-days Delinquent 3.37% 3.29% 3.27% 3.17% 3.09% 3.04% 2.94% 2.91% 2.87% 2.80% 2.71% 2.59% 2.52%Original Credit Score >= 660 0.00% 2.35% 2.31% 2.24% 2.17% 2.12% 2.05% 2.02% 1.99% 1.93% 1.88% 1.80% 1.75%Original Credit Score < 660 10.63% 10.50% 10.61% 10.40% 10.25% 10.22% 10.00% 10.01% 9.97% 9.76% 9.39% 8.90% 8.72%
Serious Delinquency Rate 2.92% 2.84% 2.78% 2.70% 2.62% 2.56% 2.48% 2.44% 2.38% 2.33% 2.28% 2.19% 2.14%
In Bankruptcy 0.48% 0.48% 0.48% 0.47% 0.46% 0.44% 0.43% 0.43% 0.41% 0.41% 0.40% 0.39% 0.38%
Federal Housing Finance Agency Foreclosure Prevention ReportApril 2014
Appendix: Data Tables
Please see glossary on page 14 Page 6

1(ii) Fannie Mae - Mortgage Performance (at period end)
(# of loans in thousands) Apr-13 May-13 Jun-13 Jul-13 Aug-13 Sep-13 Oct-13 Nov-13 Dec-13 Jan-14 Feb-14 Mar-14 Apr-14
Total Loans Serviced 17,486 17,467 17,459 17,471 17,518 17,573 17,608 17,628 17,625 17,618 17,622 17,588 17,560Original Credit Score >= 660 15,431 15,431 15,436 15,462 15,521 15,586 15,630 15,659 15,663 15,663 15,673 15,648 15,629Original Credit Score < 660 2,054 2,036 2,023 2,008 1,997 1,987 1,977 1,970 1,962 1,954 1,949 1,940 1,931
Total Delinquent Loans 891 862 901 848 829 826 798 816 801 767 755 706 691Original Credit Score >= 660 543 523 542 508 496 493 476 486 474 454 455 424 414Original Credit Score < 660 348 339 359 340 333 333 322 330 327 313 300 283 277
30 - 59 Days Delinquent 292 281 325 289 284 288 275 298 291 270 273 248 246Original Credit Score >= 660 163 156 181 158 156 159 151 166 160 148 156 138 137Original Credit Score < 660 128 125 144 130 128 129 124 132 132 122 117 110 109
60 - 89 Days Delinquent 86 84 89 86 85 87 84 87 88 84 79 71 69Original Credit Score >= 660 47 46 48 47 46 47 46 47 47 45 44 40 38Original Credit Score < 660 38 38 41 39 39 40 38 40 41 39 35 31 31
60-plus-days Delinquent 599 581 576 559 545 538 523 519 510 497 482 458 445Original Credit Score >= 660 380 367 361 350 340 335 325 321 314 306 299 285 277Original Credit Score < 660 220 214 215 209 205 204 198 198 196 191 183 173 168
Percent of Total Loans Serviced
Total Delinquent Loans 5.10% 4.93% 5.16% 4.85% 4.73% 4.70% 4.53% 4.63% 4.55% 4.35% 4.28% 4.02% 3.94%Original Credit Score >= 660 3.52% 3.39% 3.51% 3.29% 3.20% 3.17% 3.04% 3.11% 3.03% 2.90% 2.90% 2.71% 2.65%Original Credit Score < 660 16.94% 16.64% 17.73% 16.91% 16.67% 16.74% 16.30% 16.75% 16.68% 16.01% 15.38% 14.57% 14.36%
30 - 59 Days Delinquent 1.67% 1.61% 1.86% 1.65% 1.62% 1.64% 1.56% 1.69% 1.65% 1.53% 1.55% 1.41% 1.40%Original Credit Score >= 660 1.06% 1.01% 1.17% 1.02% 1.01% 1.02% 0.96% 1.06% 1.02% 0.95% 1.00% 0.88% 0.88%Original Credit Score < 660 6.25% 6.13% 7.12% 6.49% 6.42% 6.50% 6.27% 6.70% 6.71% 6.24% 5.98% 5.67% 5.66%
60 - 89 Days Delinquent 0.49% 0.48% 0.51% 0.49% 0.48% 0.50% 0.48% 0.49% 0.50% 0.48% 0.45% 0.41% 0.39%Original Credit Score >= 660 0.31% 0.30% 0.31% 0.30% 0.30% 0.30% 0.29% 0.30% 0.30% 0.29% 0.28% 0.26% 0.25%Original Credit Score < 660 1.86% 1.85% 2.01% 1.96% 1.95% 2.02% 1.94% 2.04% 2.08% 1.99% 1.81% 1.61% 1.60%
60-plus-days Delinquent 3.43% 3.33% 3.30% 3.20% 3.11% 3.06% 2.97% 2.94% 2.89% 2.82% 2.73% 2.61% 2.53%Original Credit Score >= 660 2.46% 2.38% 2.34% 2.27% 2.19% 2.15% 2.08% 2.05% 2.01% 1.95% 1.91% 1.82% 1.77%Original Credit Score < 660 10.70% 10.51% 10.61% 10.41% 10.25% 10.24% 10.02% 10.06% 9.97% 9.77% 9.40% 8.90% 8.70%
Serious Delinquency Rate 2.93% 2.83% 2.77% 2.70% 2.61% 2.55% 2.48% 2.44% 2.38% 2.33% 2.27% 2.19% 2.13%
In Bankruptcy 0.47% 0.46% 0.47% 0.44% 0.43% 0.41% 0.40% 0.39% 0.38% 0.38% 0.37% 0.36% 0.35%
Federal Housing Finance Agency Foreclosure Prevention ReportApril 2014
Appendix: Data Tables
Please see glossary on page 14 Page 7

1(iii) Freddie Mac - Mortgage Performance (at period end)
(# of loans in thousands) Apr-13 May-13 Jun-13 Jul-13 Aug-13 Sep-13 Oct-13 Nov-13 Dec-13 Jan-14 Feb-14 Mar-14 Apr-14
Total Loans Serviced 10,544 10,508 10,519 10,491 10,476 10,473 10,454 10,451 10,446 10,448 10,449 10,421 10,410Original Credit Score >= 660 9,323 9,297 9,315 9,298 9,293 9,298 9,286 9,288 9,290 9,296 9,300 9,278 9,273Original Credit Score < 660 1,221 1,211 1,203 1,193 1,182 1,175 1,168 1,163 1,156 1,153 1,149 1,142 1,137
Total Delinquent Loans 509 499 527 495 490 486 470 482 475 454 444 409 408Original Credit Score >= 660 311 303 318 298 294 292 281 288 282 269 267 245 244Original Credit Score < 660 198 196 209 197 196 195 189 194 193 184 177 164 164
30 - 59 Days Delinquent 162 159 188 168 171 173 166 182 178 165 165 143 149Original Credit Score >= 660 93 90 107 94 96 98 93 104 100 93 95 81 85Original Credit Score < 660 70 69 82 74 75 75 73 79 78 72 69 62 64
60 - 89 Days Delinquent 52 53 57 56 55 56 55 57 58 55 52 47 47Original Credit Score >= 660 29 30 32 31 30 31 30 31 32 30 29 27 26Original Credit Score < 660 23 24 26 25 25 25 25 26 26 25 23 21 21
60-plus-days Delinquent 346 340 339 327 319 314 303 299 297 289 280 266 259Original Credit Score >= 660 218 213 211 204 198 194 187 184 182 176 172 164 160Original Credit Score < 660 128 127 128 124 121 120 116 115 115 112 108 102 100
Percent of Total Loans Serviced
Total Delinquent Loans 4.82% 4.75% 5.01% 4.72% 4.68% 4.64% 4.49% 4.61% 4.55% 4.34% 4.25% 3.93% 3.92%Original Credit Score >= 660 3.33% 3.26% 3.41% 3.20% 3.16% 3.14% 3.02% 3.10% 3.03% 2.90% 2.87% 2.65% 2.63%Original Credit Score < 660 16.23% 16.20% 17.39% 16.54% 16.58% 16.58% 16.21% 16.70% 16.72% 15.98% 15.40% 14.33% 14.44%
30 - 59 Days Delinquent 1.54% 1.51% 1.79% 1.60% 1.63% 1.65% 1.59% 1.74% 1.71% 1.58% 1.57% 1.38% 1.43%Original Credit Score >= 660 0.99% 0.96% 1.15% 1.01% 1.03% 1.05% 1.01% 1.11% 1.08% 1.00% 1.03% 0.88% 0.91%Original Credit Score < 660 5.71% 5.71% 6.78% 6.17% 6.34% 6.39% 6.25% 6.77% 6.75% 6.24% 6.02% 5.42% 5.67%
60 - 89 Days Delinquent 0.50% 0.51% 0.54% 0.53% 0.53% 0.54% 0.53% 0.54% 0.56% 0.53% 0.50% 0.46% 0.45%Original Credit Score >= 660 0.32% 0.32% 0.34% 0.33% 0.33% 0.33% 0.33% 0.34% 0.34% 0.32% 0.31% 0.29% 0.28%Original Credit Score < 660 1.86% 1.95% 2.13% 2.09% 2.10% 2.17% 2.13% 2.22% 2.29% 2.18% 2.02% 1.82% 1.84%
60-plus-days Delinquent 3.28% 3.24% 3.22% 3.12% 3.05% 2.99% 2.90% 2.86% 2.84% 2.76% 2.68% 2.55% 2.49%Original Credit Score >= 660 2.34% 2.29% 2.27% 2.19% 2.13% 2.08% 2.01% 1.98% 1.95% 1.90% 1.85% 1.77% 1.72%Original Credit Score < 660 10.52% 10.49% 10.61% 10.37% 10.24% 10.19% 9.95% 9.93% 9.96% 9.74% 9.39% 8.91% 8.77%
Serious Delinquency Rate 2.91% 2.85% 2.79% 2.70% 2.64% 2.58% 2.48% 2.43% 2.39% 2.34% 2.29% 2.20% 2.15%
In Bankruptcy 0.51% 0.51% 0.51% 0.50% 0.50% 0.49% 0.48% 0.48% 0.47% 0.46% 0.45% 0.43% 0.43%
Federal Housing Finance Agency Foreclosure Prevention ReportApril 2014Appendix: Data Tables
Please see glossary on page 14 Page 8

2 Enterprises Combined - Foreclosure Prevention Actions (# of loans) 1
Apr-13 May-13 Jun-13 Jul-13 Aug-13 Sep-13 Oct-13 Nov-13 Dec-13 Jan-14 Feb-14 Mar-14 Apr-14YTD
2014Starts2
HAMP Active Trial & Perm. - Cum. 455,697 454,091 451,475 451,058 451,691 447,840 446,510 445,875 445,054 444,087 442,765 442,441 441,080 441,080 Repayment Plans 17,215 15,455 13,612 15,091 15,071 14,592 14,665 11,003 13,390 13,521 10,807 10,615 9,650 44,593 Forbearance Plans 6,492 7,638 8,209 6,217 5,879 6,382 6,596 5,695 5,161 4,807 4,030 3,816 4,346 16,999
CompletedRepayment Plans3 10,628 7,639 5,381 4,600 5,068 4,839 5,316 5,092 4,741 5,200 5,687 5,169 4,863 20,919 Forbearance Plans3 1,344 1,001 1,876 896 744 690 772 748 792 687 696 1,511 605 3,499 Charge-offs-in-lieu 58 57 56 51 59 54 59 52 55 49 76 141 107 373 HomeSaver Advance (Fannie) - - - - - - - - - - - - - - Loan Modifications 19,809 19,815 20,011 18,224 21,293 18,361 20,908 20,462 20,546 18,659 17,407 18,606 17,756 72,428
Home Retention Actions 31,839 28,512 27,324 23,771 27,164 23,944 27,055 26,354 26,134 24,595 23,866 25,427 23,331 97,219
Short Sales 7,954 9,090 7,612 8,449 7,694 5,660 5,945 4,699 4,796 3,980 3,350 3,383 3,635 14,348 Deeds-in-lieu 1,679 1,671 1,407 1,415 1,420 1,359 1,635 1,415 1,671 1,594 1,170 1,455 1,353 5,572 Nonforeclosure - Home Forfeiture Actions
9,633 10,761 9,019 9,864 9,114 7,019 7,580 6,114 6,467 5,574 4,520 4,838 4,988 19,920
Total Foreclosure Prevention Actions
41,472 39,273 36,343 33,635 36,278 30,963 34,635 32,468 32,601 30,169 28,386 30,265 28,319 117,139
Percent of Total Foreclosure Prevention Actions
Repayment Plans 26% 19% 15% 14% 14% 16% 15% 16% 15% 17% 20% 17% 17% 18%Forbearance Plans 3% 3% 5% 3% 2% 2% 2% 2% 2% 2% 2% 5% 2% 3%Charge-offs-in-lieu 0% 0% 0% 0% 0% 0% 0% 0% 0% 0% 0% 0% 0% 0%HomeSaver Advance (Fannie) 0% 0% 0% 0% 0% 0% 0% 0% 0% 0% 0% 0% 0% 0%Loan Modifications 48% 50% 55% 54% 59% 59% 60% 63% 63% 62% 61% 61% 63% 62%
Home Retention Actions 77% 73% 75% 71% 75% 77% 78% 81% 80% 82% 84% 84% 82% 83%
Short Sales 19% 23% 21% 25% 21% 18% 17% 14% 15% 13% 12% 11% 13% 12%Deeds-in-lieu 4% 4% 4% 4% 4% 4% 5% 4% 5% 5% 4% 5% 5% 5% Nonforeclosure - Home Forfeiture Actions
23% 27% 25% 29% 25% 23% 22% 19% 20% 18% 16% 16% 18% 17%
Federal Housing Finance Agency Foreclosure Prevention ReportApril 2014
Appendix: Data Tables
1 The number of foreclosure prevention actions reported in this table may not tie to the Enterprises' financial statements due to timing differences in reporting systems.2 Forbearance plans initiated include HAMP trials initiated by servicers under the MHA program. HAMP trial modifications are based on the first trial payment posted date. HAMP permanent modifications are based on the effective date of modification. As of April 30, 2014, Fannie Mae had approximately 256,100 HAMP active permanent modifications and Freddie Mac had nearly 174,800 HAMP active permanent modifications.3 Includes loans that were 30+ days delinquent at initiation of the plan. In addition, the completed forbearance plans data have been revised to exclude HAMP.
Please see glossary on page 14 Page 9

3(i) Enterprises Combined - Loan Modifications
Apr-13 May-13 Jun-13 Jul-13 Aug-13 Sep-13 Oct-13 Nov-13 Dec-13 Jan-14 Feb-14 Mar-14 Apr-14YTD
2014
Loan Modifications (# of loans) 19,809 19,815 20,011 18,224 21,293 18,361 20,908 20,462 20,546 18,659 17,407 18,606 17,756 72,428
Types of Modification (%)Extend Term Only 19% 19% 18% 17% 21% 22% 20% 18% 23% 26% 29% 32% 30% 30%Reduce Rate Only 9% 9% 9% 9% 9% 7% 7% 5% 5% 6% 5% 6% 5% 5%Reduce Rate and Extend Term 39% 38% 41% 40% 40% 41% 42% 45% 41% 38% 39% 36% 38% 38%Reduce Rate, Extend Term and Forbear Principal
33% 34% 33% 34% 30% 30% 31% 31% 31% 29% 28% 25% 26% 27%
Other 0% 0% 0% 0% 0% 0% 0% 0% 0% 1% 0% 0% 0% 0%
Federal Housing Finance Agency Foreclosure Prevention ReportApril 2014Appendix: Data Tables
Please see glossary on page 14 Page 10

3(ii) Fannie Mae - Loan Modifications
Apr-13 May-13 Jun-13 Jul-13 Aug-13 Sep-13 Oct-13 Nov-13 Dec-13 Jan-14 Feb-14 Mar-14 Apr-14YTD
2014
Loan Modifications (# of loans) 13,741 13,650 12,967 11,870 13,791 11,676 13,006 12,338 13,815 12,565 10,837 12,642 11,321 47,365
Types of Modification (%) Extend Term Only 25% 25% 24% 23% 26% 27% 25% 24% 29% 31% 35% 37% 40% 36%Reduce Rate Only 8% 8% 8% 8% 8% 7% 7% 6% 5% 6% 5% 6% 5% 5%Reduce Rate and Extend Term 36% 35% 37% 37% 37% 38% 39% 40% 36% 34% 34% 32% 30% 33%Reduce Rate, Extend Term and Forbear Principal
31% 32% 31% 31% 29% 28% 29% 30% 30% 28% 26% 25% 24% 26%
Other 0% 0% 0% 0% 0% 0% 0% 0% 0% 1% -1% 0% 0% 0%
Federal Housing Finance Agency Foreclosure Prevention ReportApril 2014
Appendix: Data Tables
Please see glossary on page 14 Page 11

3(iii) Freddie Mac - Loan Modifications
Apr-13 May-13 Jun-13 Jul-13 Aug-13 Sep-13 Oct-13 Nov-13 Dec-13 Jan-14 Feb-14 Mar-14 Apr-14YTD
2014
Loan Modifications (# of loans) 6,068 6,165 7,044 6,354 7,502 6,685 7,902 8,124 6,731 6,094 6,570 5,964 6,435 25,063
Types of Modification (%)Extend Term Only 6% 5% 7% 6% 10% 15% 12% 9% 9% 17% 18% 23% 14% 18%Reduce Rate Only 11% 11% 10% 10% 11% 6% 6% 5% 5% 6% 6% 4% 6% 5%Reduce Rate and Extend Term 45% 45% 48% 45% 47% 44% 47% 53% 52% 47% 46% 46% 52% 47%Reduce Rate, Extend Term and Forbear Principal
38% 38% 35% 39% 32% 34% 35% 33% 33% 30% 30% 26% 29% 29%
Other 0% 0% 0% 0% 0% 0% 0% 0% 1% 0% 0% 1% 1% 0%
Federal Housing Finance Agency Foreclosure Prevention ReportApril 2014
Appendix: Data Tables
Please see glossary on page 14 Page 12

4 Enterprises Combined - Home Forfeiture Actions (# of loans)
Apr-13 May-13 Jun-13 Jul-13 Aug-13 Sep-13 Oct-13 Nov-13 Dec-13 Jan-14 Feb-14 Mar-14 Apr-14YTD
2014
Short Sales 7,954 9,090 7,612 8,449 7,694 5,660 5,945 4,699 4,796 3,980 3,350 3,383 3,635 14,348
Deeds-in-lieu 1,679 1,671 1,407 1,415 1,420 1,359 1,635 1,415 1,671 1,594 1,170 1,455 1,353 5,572
Nonforeclosure - Home Forfeiture Actions 1
9,633 10,761 9,019 9,864 9,114 7,019 7,580 6,114 6,467 5,574 4,520 4,838 4,988 19,920
Third-party Sales 2,221 1,754 1,627 1,674 1,380 1,334 1,354 1,126 1,165 1,749 1,558 1,736 1,858 6,901
Foreclosure Sales 17,514 16,060 15,365 18,222 16,973 16,194 16,728 14,004 13,293 16,184 12,497 13,619 12,965 55,265
Third-party & Foreclosure Sales
19,735 17,814 16,992 19,896 18,353 17,528 18,082 15,130 14,458 17,933 14,055 15,355 14,823 62,166
Foreclosure Starts 44,384 42,697 37,955 40,781 37,218 38,616 40,822 37,390 34,953 32,871 21,901 29,907 26,044 110,723
Top Five Reasons for DelinquencyCurtailment of Income 37% 35% 34% 33% 33% 32% 33% 32% 32% 32% 31% 30% 30%Excessive obligations 17% 16% 17% 16% 17% 17% 17% 17% 17% 17% 17% 19% 19%Unemployment 8% 8% 8% 7% 7% 7% 7% 7% 8% 8% 8% 8% 8%Illness of principal mortgagor or family member
6% 6% 5% 5% 5% 5% 5% 5% 5% 5% 5% 5% 5%
Marital Difficulties 4% 4% 4% 3% 4% 3% 4% 4% 4% 4% 4% 4% 4%
Federal Housing Finance Agency Foreclosure Prevention ReportApril 2014
Appendix: Data Tables
1 Short sales and deeds-in-lieu of foreclosure completed.
Please see glossary on page 14 Page 13

Glossary
Section 1: Mortgage Performance
Total Loans Serviced - Total conventional active book of business, excluding loans that were liquidated during the month.Current and Performing - Loans that are making timely payments and are 0 months delinquent as of the reporting month. Total Delinquent Loans - Loans that are at least one payment past due, i.e., total servicing minus current and performing.30-59 Days Delinquent - Includes loans that are only one payment delinquent.60-89 Days Delinquent - Includes loans that are only two payments delinquent.60-plus-days Delinquent - Loans that are two or more payments delinquent, including loans in relief, in the process of foreclosure, or in the process of bankruptcy, i.e., total servicing minuscurrent and performing, and 30 to 59 days delinquent loans. Our calculation may exclude loans in bankruptcy process that are less than 60 days delinquent.Serious Delinquency - All loans in the process of foreclosure plus loans that are three or more payments delinquent (including loans in the process of bankruptcy). In Bankruptcy - Loans in the process of bankruptcy; includes all delinquency status.
Section 2: Completed Foreclosure Prevention Actions
Home Retention Actions - Repayment plans, forbearance plans, charge-offs in lieu of foreclosure, Home Saver Advances, and loan modifications. Home retention actions allow borrowers to retain ownership/occupancy of their homes while attempting to return loans to current and performing status.Repayment Plans - An agreement between the servicer and a borrower that gives the borrower a defined period of time to reinstate the mortgage by paying normal regular payments plus an additional agreed upon amount in repayment of the delinquency.Forbearance Plans - An agreement between the servicer and the borrower (or estate) to reduce or suspend monthly payments for a defined period of time after which borrower resumes regular monthly payments and pays additional money toward the delinquency to bring the account current or works with the servicer to identify a permanent solution, such as loan modification or short sale, to address the delinquency. Charge-offs-in-lieu of Foreclosure - A delinquent loan for which collection efforts or legal actions against the borrower are agreed to be not in the Enterprises' best interests (because of reduced property value, a low outstanding mortgage balance, or presence of certain environmental hazards). The servicer charges off the mortgage debt rather than completing foreclosure and taking the property title. The borrower retains the property. The unpaid mortgage balance becomes a lien on the borrower’s property, which must be satisfied when the borrower transfers ownership.HomeSaver Advance (Fannie Mae) - An unsecured personal loan to a qualified borrower to cure his or her payment defaults under a mortgage loan the Enterprises own or guarantee. The borrower must be able to resume regular monthly payments on his or her mortgage. The program ended in 2010.
Loan Modifications - Number of modified, renegotiated, or restructured loans, regardless of performance-to-date under the plan during the month. Terms of the contract between the borrower and the lender are altered with the aim of curing the delinquency (30 days or more past due). Nonforeclosure-Home Forfeiture Actions- Short sales and deeds-in-lieu of foreclosure. These actions require borrowers to give up their homes. Although homes are forfeited, foreclosure alternatives generally have less adverse impact on borrowers and their credit reports than foreclosure.Short Sales - A short sale (also called a preforeclosure sale) is the sale of a mortgaged property at a price that nets less than the total amount due on the mortgage (e.g., the sum of the unpaid principal balance, accrued interest, advanced escrows, late fees, and delinquency charges.) The servicer and borrower negotiate payment of the difference between the net sales price and the total amount due on the mortgage. Deed(s)-in-lieu of Foreclosure - A loan for which the borrower voluntarily conveys the property to the lender to avoid a foreclosure proceeding.
Section 3: Loan Modifications
Increase - Principal and interest after modification is higher than before the modification.No Increase - Original principal and interest is unchanged after the modifications.Decrease <=20% - Original principal and interest is decreased by 20 percent or less after modification.Decrease >20% - Original principal and interest is decreased by more than 20 percent after modification.Extend Term Only - Remaining term of the loan is longer after modification.Reduce Rate Only - Loan's rate is lower after modification.Reduce Rate and Extend Term - Loan's rate reduced and term extended.Reduce Rate, Extend Term, and Forbear Principal - Modification includes term extension, rate reduction, and forbearance of principal.Other - A modification that does not fit in any of the above categories. The majority of these loans are capitalized modifications.
Section 4: Third-party Sales and Foreclosures
Third-party Sales - A third party entity purchases the property at the foreclosure sale/auction above the initial bid set forth by Fannie Mae or Freddie Mac.Foreclosure Starts - The total number of loans referred to an attorney to initiate the legal process of foreclosure during the month. These are loans measured as not being in foreclosure in the previous month but referred to foreclosure in the current month.Foreclosure Sales - The number of loans that went to foreclosure (sheriff's) sale during the month.
Data and definitions in this report have been revised relative to prior versions of the report. FHFA continues to work with the Enterprises to improve the comparability of reported data.
Federal Housing Finance Agency Foreclosure Prevention ReportApril 2014
FHFA produces monthly and quarterly versions of the Foreclosure Prevention Report. In addition to the data provided in the monthly reports, the quarterly reports include the following information: MHA program updates; benchmarking of the Enterprises’ delinquency rates; the type and depth of loan modifications; and the performance of modified loans.
Page 14