Embed Size (px)
Citation preview

Financial Calend
Annual Press Conference for the Interim Report January to MarchAnnual General Meeting 2004Interim Report January to June 2Interim Report January to Septe1) scheduled
Ann
ual R
epor
t 20
03T
UI
AG
Annual Report 2003Adding value
Open to change.
Enjoying more.
Going beyond the everyday.
RZ Umschlag GB engl 30.3.2004 9:22 Uhr Seite 1

Financial Calendar 2004
Annual Press Conference for the Financial Year 2003 31 March 2004Interim Report January to March 2004 13 May 20041)
Annual General Meeting 2004 18 May 2004Interim Report January to June 2004 12 August 20041)
Interim Report January to September 2004 11 November 20041)
1) scheduled
veryday.
RZ Umschlag GB engl 30.3.2004 9:23 Uhr Seite 1

TUI Group in Figures
TurnoverTourismLogisticsOthersGroup
Earnings by divisions (EBTA)TourismLogisticsOthersGroup
Earnings before interest, tax, depreciation and amortisation (EBTourismLogisticsOthersGroup
Net profit for the yearEarnings per share
AssetsNon-current assetsCurrent assetsTotal assets
Equity and liabilitiesEquityNon-current liabilitiesCurrent liabilitiesTotal equity and liabilities
Equity ratio
Cash flow
Capital expenditure
Net debt
Employees
TUI Group in FiguresGroup Structure 2003
Tourism
Central EuropeSource markets: Germany | Switzerland | Austria | Poland | Hapag-Lloyd Flug
Northern EuropeSource markets: United Kingdom | Ireland | Nordic countries | Britannia Airways
Western EuropeSource markets: France | Netherlands | Belgium |Corsair
DestinationsIncoming agencies | Hotel companies
Other tourismBusiness travel | IT-Services
Logistics
Hapag-Lloyd AGHapag-Lloyd Container Linie | Hapag-Lloyd Kreuzfahrten | VTG-Lehnkering | Pracht | Algeco
Other sectors
TradingAMC Group | US-Steel Service Companies
DivestmentsEnergy | Building engineering
Central operationsTUI AG | Hapag-Lloyd Express | Real estate | Other companies
RZ Umschlag GB engl 30.3.2004 9:19 Uhr Seite 2

TUI Group in Figures2003 2002 Var. %
TurnoverTourism € mill 12,671 12,416 + 2.1Logistics € mill 3,915 3,777 + 3.6Others € mill 2,629 4,109 - 36.0Group € mill 19,215 20,302 - 5.4
Earnings by divisions (EBTA)Tourism € mill 208 336 - 38.1Logistics € mill 314 200 + 57.3Others € mill 391 39 + 898.2Group € mill 913 575 + 58.9
Earnings before interest, tax, depreciation and amortisation (EBITDA)Tourism € mill 532 614 - 13.5Logistics € mill 548 434 + 26.2Others € mill 633 453 + 39.7Group € mill 1,713 1,501 + 14.1
Net profit for the year € mill 315 41 + 666.2Earnings per share € 1.54 0.18 + 755.6
AssetsNon-current assets € mill 10,271 12,019 - 14.5Current assets € mill 2,718 3,498 - 22.3Total assets € mill 12,989 15,517 - 16.3
Equity and liabilitiesEquity € mill 2,767 3,180 - 13.0Non-current liabilities € mill 4,204 4,516 - 6.9Current liabilities € mill 6,018 7,821 - 23.0Total equity and liabilities € mill 12,989 15,517 - 16.3
Equity ratio % 21.3 20.5 + 0.8
Cash flow € mill 902 1,391 - 35.1
Capital expenditure € mill 724 1,063 - 31.9
Net debt € mill 3,828 5,445 - 29.7
Employees 31 Dec 64,257 70,299 - 8.6
TUI Group in Figures Major TU
Travel agencies
Tour operators
Airlines
Incoming agenc
Hotel companie
RZ Umschlag GB engl 30.3.2004 9:20 Uhr Seite 2

Values inspire trust
1
The World of TUI is inspirational. TUI stands for the
values you can trust. We strive to make the World
of TUI unique and in return we receive something
we value above all else: our customers’ trust.
We aim to exceed our customers’ aspirations, even
more so as their expectations are constantly evolving.
When difficulties arise we still find the right solutions.
Our values are the drivers behind our actions. For our
customers, the World of TUI never ceases to evolve,
turning inspiration into innovation and giving thought
today to the recreational needs of tomorrow.
We take our customers’ well-being and enjoyment of
life to heart. This commitment has been lived and
breathed across the globe in 2003. We will show you
how in this annual report.

2
Table of Contents
5 Chief Executive‘s Statement
17 Management Report18 Economic Situation32 Business Trend
in the Divisions56 Research and
Development59 Risk Management62 Prospects
79 Other Information80 Human Resources84 Environmental Protection

3
89 Corporate Governance90 Report on
Corporate Governance94 Report of the
Supervisory Board99 Supervisory Board
102 Executive Board104 TUI Share
119 Financial Statements120 Financial Statements
of the TUI Group 124 Notes on the
Financial Statements
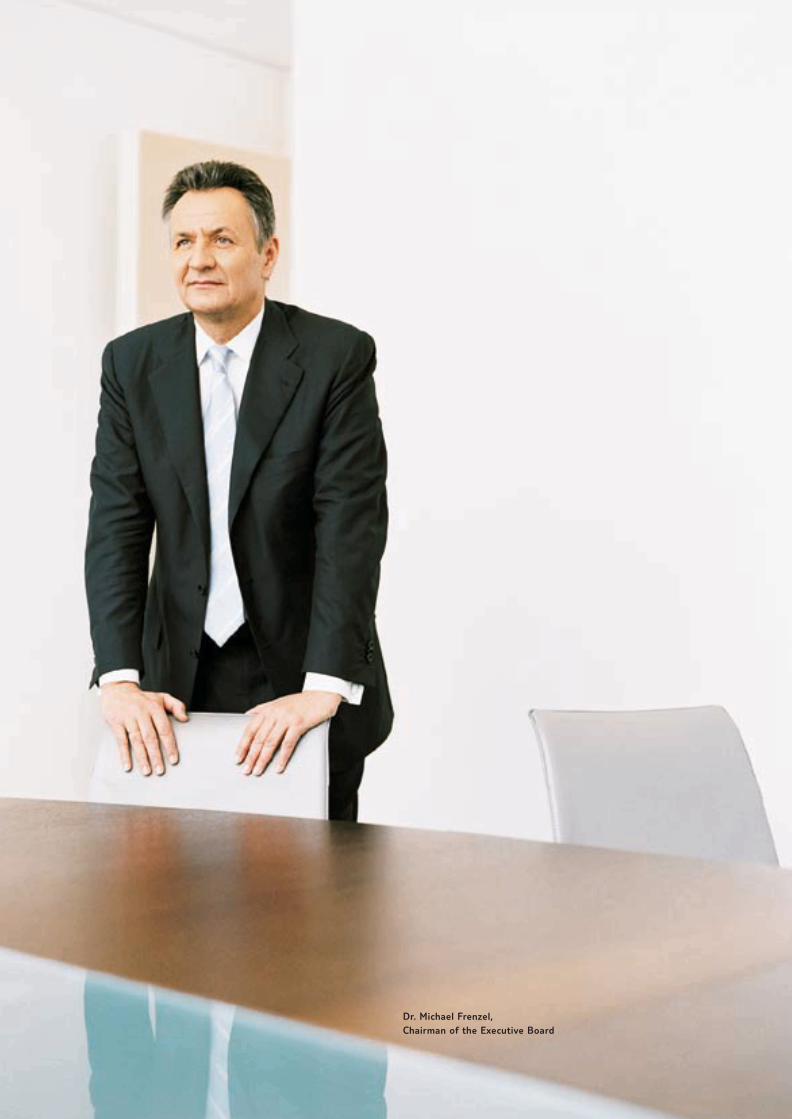
Dr. Michael Frenzel,Chairman of the Executive Board

Chief Executive’s Statement
Dear shareholders,
another difficult year is behind us. For our core business of tourism, inparticular, 2003 was another challenging year. The effects of 11 September2001 and the terror attacks of 2002 were still being felt, and a new con-flict flared up in Iraq. Besides global political events, the disappointingdevelopment of the European economies added further to a sense ofuncertainty. This particularly affected our business in Germany, whereweakness of consumer spending was most distinct.
Our tourism business was particularly affected by these external factors.We limited these effects by our management efforts, but they were notentirely offset. Our comprehensive programme for increasing efficiency,launched in late 2002, contributed substantially to enabling our tourismdivision to overcome the difficulties of 2003.
The economic environment for our second business area, logistics, wasmore favourable. Strong economic growth in Asia, above all in China, andthe growth in world trade provided momentum for the upswing in contai-ner shipping. With its high level of operational efficiency, our containerline benefited above the average from this trend and doubled its ear-nings. We have had our most successful year ever in this sector.
The positive and negative trends in our logistics and tourism divisions largely balanced each other out. Nevertheless, overall earnings in 2003were exceptionally good, primarily due to the capital gains from thedivestment of our energy business.
Overall, at € 913 million, TUI has generated its highest earnings beforetaxes on income and amortisation of goodwill to date. This enables us to again propose to our shareholders a dividend payment of 77 cents pershare, despite this year’s extremely unfavourable economic environment.
In tourism we have experienced two difficult years. We have not beenable to operate untouched by the effects of global political and economicdevelopments. However, today we have a strong position in our industry.One of our advantages is our pan-European business with operations inall major source markets and leading market positions. Our size gives us acompetitive advantage which benefits us when purchasing services. Dueto our activities throughout Europe we have been able to compensate forregional fluctuations in demand. This concept proved its worth for thefirst time in 2003, when relatively stable development in the UK and
5

growth in France and Belgium helped us cope with the effects of a weakGerman market.
Another asset is the vertical integration of our business, covering all stagesof a holiday: from retail, tour operating, flying and accommodation rightup to incoming services at the holiday destination. We operate this busi-ness model in the major source markets, particularly for our core products,i.e. air-inclusive tours. However, this integrated model is run with somevariations in the different markets. For example, the level of integration inthe UK is greater than in Germany, where the travelling behaviour of ourcustomers requires greater flexibility.
Our economic success in a year such as 2003 serves to dispel any doubtsabout the efficiency of this integrated business model. What is more: weare not satisfied with the returns which can be generated by the touroperating business alone. We are thus not only active in retail and touroperating but also involved in downstream activities such as flights andhotels. More than 280 hotels in attractive destinations and a fleet ofmore than 100 aircraft give us a strong platform in these sectors. Highermargins can be achieved as a result. However, we have to operate cost-effectively and flexibly manage our capacities in all sectors. We have already achieved a great deal in this respect, but nevertheless we haveidentified substantial potential for improvement in the future, above all in flight operations.
Last year, I commented that the demands and behaviour of our customerswere changing, as was competition in the travel market. This has continued,and in our view has developed more strongly and more quickly in Germanythan in other countries. New suppliers have entered the market offeringproducts to suit customer’s changing requirements, for instance greaterflexibility and more choice when planning holidays.
As the European market leader in tourism, we see ourselves as a com-pany also serving customers who require a flight or hotel only or wish to package their tour themselves. Growth in this customer segment isabove-average, and we intend to take our share. However, this also meansestablishing new business models alongside our current model of verticalintegration. We have already started this and have offerings availablewhich will be in strong demand in the future: distribution through newmedia such as internet portals, call centres and travel TV as well as attrac-tive hotels and low-cost flying. We are well positioned in the traditionaltravel market, but we are also well prepared for future market develop-ments.
Chief Executive’s Statement
6

2003 has not only brought innovation to our tourism business, but hasalso entailed far-reaching changes in our Group’s structure. We started ourjourney to becoming a services group with the acquisition of Hapag-LloydAG in 1997. This year we took two more major steps with the divestmentof the energy sector and the AMC Group which generated high earnings.We have used these proceeds to reduce net debt substantially which wehad to carry during the restructuring phase. This will considerably reduceour future interest burden.
However, we will not stop here, but will continue to follow the path wehave embarked upon. We have therefore decided to focus our logisticsdivision on shipping, where we foresee considerable growth potential forthe future. As a consequence we will divest the other activities of ourlogistics division. We will convert Hapag-Lloyd into a pure shipping com-pany and float around 30% of its shares on the stock exchange which willcreate a broad basis for financing expected growth.
This closes the circle and completes our realignment from Preussag toTUI. We are now at the beginning of a new phase in the development ofour Group. As a clear market leader in Europe with powerful brands andinnovative products we have a strong basis for future success. We wouldlike to thank you as our shareholders for many years of support and wehope you will stay with us for the future.
Yours sincerely,
7
Chief Executive’s Statement


Market awareness. Recognition of socialchange. That’s important to us. World of TUIis open to change. We’ve got what it takesto accomodate aspiration and desire. Yetbeyond the shifts and trends, one thingremains constant: World of TUI is the mostbeautiful time of the year.
Open to change.

Open to romance. More and more people aged between 45 and 65 are enjoying their financial freedom. They havewholly new expectations, especially when it comes to travelling. Good to know there’s someone there to meet them.


Open to whatever comes. Spontaneous decisions reflect thepace of modern life. In the travel market, too, last-minute bookers and independent travellers are increasingly influencingconsumption patterns. That calls for flexibility.

Open to free spirits. More than ever, people in industrialised nations are putting their individual stamp on life. Especially when it comes to holidays, they see the most beautiful time of the year as a very personal experience. One for which the offer needs to be just right.


16
18 Economic Situation19 Application of new
IAS Standards19 Turnover and Earnings25 Group Profit
for the Year26 Financial Position32 Business Trend
in the Divisions32 Tourism48 Logistics54 Trading
56 Research and Development
59 Risk Management62 Prospects

Management Report bChallenging year for tourism.bFar-reaching changesof the Group.bEarnings by divisions(EBTA) € 913 million.bNet debt significantly reduced.
17

2003 – A year of major challenges for tourism and far-reaching changes of the Group.
Economic situationIn 2003, the pace of economic development in many industrialised coun-tries was more restrained than expected at the beginning of the year. Inthe first half of the year in particular, economic recovery came to a haltdue to the effects of the Iraq conflict. The economy did not gain momen-tum until the second half of the year. However, economic developmentvaried in the individual economies.
Development in the regions The USA was the strongest driving force for the world economy. Here eco-nomic growth picked up in the course of the year, supported above all byan increase in demand in the private and public sectors. The Japaneseeconomy grew more strongly than expected, benefiting from an increasein investments and exports. The emerging Asian economies recorded per-sistently dynamic economic growth, with the strong increase in importsinto China providing particular growth momentum for other economies.
The Eurozone recorded overall weak economic development. The Germaneconomy stagnated in 2003 and only showed signs of a slight recovery atthe end of the year. This was mainly due to poor consumer spendingcombined with low investment activities and low growth levels in exports.The UK recorded better economic development, with its growth rate out-performing average growth in the Eurozone. In contrast, France saw afurther slowdown in economic activity and thus recorded low growth ratescompared with the previous year.
Development of the divisions The impact of the economic environment on the business in the individualdivisions varied. Tourism was particularly adversely affected. In the firsthalf of the year, all European source markets were affected by the Iraqconflict, economic weakness and the muted economic outlook for theentire year. After the end of the war, the consumer climate improved andthe consumers’ willingness to travel increased again. Overall, the demandfor holiday tours declined, although the individual countries were affectedto varying extents by this trend.
18
In 2003, business development of the TUI Group was substantially impacted by globalpolitical events and weak economic activity. Nevertheless, Group companies achievedsizeable profits in the difficult conditions prevailing on many markets. Following thedivestments of 2003, further changes are envisaged in Group structure, which will com-plete the realignment of TUI.
USA and Asia
Eurozone
Tourism

A brighter picture emerged for the logistics division. Economic growth inthe USA and East Asia led to an increase in trade with these regions. This had a positive impact on international container shipping. Transportvolumes again grew faster than world trade, with freight rates raising dueto the strong demand for transport capacity.
Application of new IAS standards The consolidated financial statements of TUI AG were prepared in accor-dance with the international accounting provisions of the InternationalAccounting Standards Board (IASB). All requirements of the standardsapplicable at the balance sheet date were fully met. Over and above that,the rules of IAS 1 (revised 2003) ‘Presentation of financial statements’and IAS 21 (revised 2003) ‘Accounting for the effects of changes inexchange rates’, effective from 1 January 2005, were voluntarily applied.
The first-time application of the revised IAS 1 resulted in particular in anew structure of the profit and loss statement and changes in reportingcompared with the previous year. The balance sheet has also been res-tructured, with classification of the information presented according tomaturities, into current and non-current assets and liabilities. All changesare outlined in detail in the notes.
The development of earnings by the divisions as set out in the manage-ment report continued to be based on earnings by divisions before taxeson income and amortisation of goodwill (EBTA). Due to the new structureof the profit and loss statement, earnings by divisions included otheroperating taxes which, unlike in the past, are now shown under operatingexpenses. The reference values for the 2002 financial year were accord-ingly adjusted.
The divestments made in 2003 and the implementation in 2004 of theconcept for the realignment of the logistics division and hence of Hapag-Lloyd as a purely shipping company will complete the realignment of theGroup started in 1997. As part of the measures planned in this context,goodwill has been allocated to the segments and sectors that will be retai-ned in the future and has accordingly been recognised – with the corres-ponding amortisation of goodwill – in the segment reporting in the notes.
Turnover and earningsThe divisions of the TUI Group were – in some cases substantially – affec-ted by the unfavourable economic framework. Tourism was particularlyadversely affected but nevertheless managed to hold its own well in theadverse climate of 2003. The logistics division benefited primarily from the
Economic Situation Management Report
19
Logistics
Voluntary application
of new IAS standards
Earnings by
divisions (EBTA)
Allocation of
goodwill

20
Management Report Economic Situation
upswing in container shipping. The divestment of the energy sector gener-ated high one-off earnings. Earnings by divisions therefore rose in com-parison with the previous year.
Group turnoverAt € 19.2 billion, Group turnover fell by 5.4% year-on-year. The declinemainly resulted from a reduction in turnover in the trading sector. Thechange in turnover volumes in the individual divisions was attributable todifferent reasons. The increase in tourism was mainly due to the first-time inclusion of the Nouvelles Frontières Group in consolidation for a fullfinancial year. The increase in turnover in the logistics division was exclusi-vely attributable to the positive development of business in containershipping. The trading sector recorded a considerable drop in turnoversince the AMC Group was sold in the fourth quarter and therefore onlyincluded in consolidated financial statements for a period of ten months;moreover, volumes in non-ferrous metals trading at the LME also declined.On a comparable basis, i.e. adjusted for structural change, Group turn-over would have dropped by 6.6%.
Group turnover by divisions€ million 2003 2002 Var. %
Tourism 12,671.3 12,416.2 + 2.1Central Europe 5,097.1 5,199.7 - 2.0Northern Europe 4,301.1 4,762.2 - 9.7Western Europe 2,479.6 1,630.1 + 52.1Destinations 547.5 575.8 - 4.9Other tourism 246.0 248.4 - 1.0Logistics 3,915.1 3,777.3 + 3.6Shipping 2,381.2 2,225.3 + 7.0Logistics 1,533.9 1,552.0 - 1.2Other sectors 2,629.0 4,108.9 - 36.0Trading 2,056.0 3,150.4 - 34.7Divestments 176.9 650.9 - 72.8Central operations 396.1 307.6 + 28.8Total 19,215.4 20,302.4 - 5.4
Earnings by divisionsAt € 913 million, earnings by divisions exceeded the previous year’s levelby 58.9% although earnings of the tourism division were substantiallyaffected by the poor business trend in the first half of the year. Theimprovement was mainly due to the good performance of the logisticsdivision, which generated its best result to date, and the gains on disposalfrom the divestment of the energy sector. Adjusted for unusual expensesand income, included in earnings by divisions with a positive balance of€ 671 million, earnings by divisions totalled € 242 million. They were thusonly € 33 million down on the previous year’s level.
Earnings by divisions
€ 913 million
Group turnover
Tourism 66%
Logistics 20%
Trading 11%
Other 3%

21
Economic Situation Management Report
Earnings by divisions€ million 2003 2002 Var. %
Tourism 208.1 336.0 - 38.1Central Europe - 16.5 105.6 - 115.6Northern Europe 79.0 84.1 - 6.1Western Europe 42.2 15.3 + 175.8Destinations 104.5 120.0 - 12.9Other tourism - 1.1 11.0 - 110.0Logistics 313.9 199.5 + 57.3Shipping 252.5 121.1 + 108.5Logistics 61.4 78.4 - 21.7Other sectors 391.3 39.2 + 898.2Trading 12.2 50.6 - 75.9Divestments – 137.4 –Central operations 379.1 - 148.8 + 354.8Total 913.3 574.7 + 58.9
Turnover and earnings of the tourism divisionTourism increased its turnover to € 12.7 billion, up 2.1%. With the CentralEurope and Northern Europe sectors generating less turnover, this growthwas mainly attributable to the first-time inclusion of the Nouvelles Fronti-ères Group in consolidation for a full financial year. This effect accountedfor approx. € 0.9 billion. On a like-on-like basis, the turnover generatedby the tourism division would have dropped by 5.3% year-on-year.
In the Central Europe sector, turnover fell by 2.0% to € 5.1 billion. Thedecline was predominantly effected by the German market, above all thetour operating business. At € 4.3 billion, the Northern Europe sectorreported a 9.7% decline in turnover year-on-year. Besides a drop in touroperating turnover in the UK but also in the Nordic countries, currencytranslation from British Pounds Sterling into euros was another reasonfor the reduction of recognised turnover. Taking account of this currencyeffect, the turnover in the Northern Europe sector was down by only0.7%. The Western Europe sector reported turnover of € 2.5 billion, a52.1% increase on the previous year. This growth almost exclusively resul-ted from the consolidation effect of the French activities. The destina-tions sector generated a 4.9% decrease in turnover to € 0.5 billion.
Due to the effects of the Iraq conflict, in particular on business in the firsthalf of the year, the tourism division did not achieve the previous year’s levelof earnings. At € 208 million, earnings nevertheless reached a respectablelevel. In the Central Europe and Northern Europe sectors, earnings werebelow the previous year’s levels. The Western Europe sector, in contrast,reported an increase in earnings year-on-year, following the integration of the activities in France. The destinations sector again made an essentialcontribution to the earnings of the tourism division.
Earnings of tourism
€ 208 million
Turnover Tourism
Central Europe 40%
Northern Europe 34%
Western Europe 20%
Destinations 4%
Other Tourism 2%

22
Management Report Economic Situation
The earnings of the Central Europe sector were most severely affected ofall the Group’s tourism activities. At € - 17 million, they fell substantiallybelow the previous year’s level. This was primarily attributable to develop-ment in Germany where losses in the first half of the year could not beoffset by overall good business in the main season. At € 79 million, earn-ings of the Northern Europe sector was lower than in the previous year.The UK finished a difficult year with overall satisfactory earnings. TheNordic countries, however, suffered another loss, amounting to approxi-mately the same level as the previous year. Earnings of the Western Euro-pe sector rose to € 42 million, mainly due to the consolidation of thebusiness in France for a full year. At € 105 million, the destinations sectoragain generated good earnings, with the majority contributed by thehotel companies.
Turnover and earnings of the logistics divisionTurnover generated by the logistics division rose to € 3.9 billion, an increaseof 3.6%. The shipping sector, comprising container shipping and the cruisebusiness of Hapag-Lloyd, achieved growth. At € 2.4 billion, turnover was7.0% up on the previous year’s level. This reflected the increase in trans-port volumes and the improvement in freight rates, with an even strongerrise prevented by the weak US dollar. The logistics sector, which coversthe VTG-Lehnkering Group, Pracht Spedition + Logistik and the AlgecoGroup, generated turnover of € 1.5 billion. Despite the weak economicactivity in Europe, which affected virtually all activities in this sector, itonly dropped by 1.2% year-on-year.
Earnings of the logistics division grew by 57.3% to € 314 million, reflectingconsiderably stronger growth than turnover. These were thus the best earn-ings ever achieved by the division. This was mainly due to container shipping,which benefited from both an increase in transport volumes and an im-provement in freight rates. The earnings contribution of the logistics sectordid not match the previous year’s level, although the VTG-Lehnkering Groupand the Algeco Group held their own well in difficult markets.
Other sectorsThe participation in the AMC Group was sold in the fourth quarter of2003 in the context of a management-buy-out. This was a further steptowards completing the realignment of the Group. The shares in Amalga-mated Metal Corporation PLC., the parent company of the AMC Group,were acquired by AMCO Investment Ltd., established by members of theAMC management for this purpose. Due to the divestment of the AMCGroup, the group was only included in 2003 consolidated financial state-ments for a period of ten months. Turnover and earnings of the trading
Earnings of logistics
€ 314 million
Trading
Turnover Logistics
Shipping 61%
Logistics 39%

Economic Situation Management Report
23
sector therefore are not entirely comparable with the corresponding figuresfor the previous year.
At € 2.1 billion, turnover of the trading sector fell by 34.7% on the previousyear on the basis of an arithmetic comparison. The AMC Group saw thestrongest drop in turnover; apart from the shorter consolidation period,this was mainly due, in operational terms, to a significant reduction involumes in non-ferrous metals trading.
Earnings of the trading sector above all reflected the difficult businessenvironment in which both the AMC Group and the US steel servicecompanies operated: at € 12 million, earnings fell significantly below theprevious year’s level.
A major step in the realignment of the Group was the divestment of theenergy sector, which was initiated in 2002 and completed in the courseof the 2003 financial year.
First of all, in March 2003, E.ON acquired TUI AG’s indirect shareholding inSchubert KG, through which TUI indirectly held a 2.7% shareholding inRuhrgas AG. The core business of the energy sector, Preussag EnergieGmbH, was sold in two tranches, each with effect from 1 January 2003.Firstly, Gaz de France acquired the German business, mainly comprisingthe exploration and production of crude oil and natural gas in northernGermany. The Austrian OMV then acquired the international activities,focusing on South America, the Mediterranean and New Zealand.
The section on ‘Divestments’ in the management report sets out the former energy sector, which had to be consolidated up to the closing ofthe transactions with Gaz de France and OMV in May and June 2003 respectively. No operating profit contribution was shown here for 2003.All earnings in connection with the divestment were included in centraloperations. The previous year’s figures comprised both the energy sectorand the Fels Group, which was included in consolidation until 30 April 2002.
Central operations included TUI AG with its corporate centre functions,the Group’s real estate companies, the remaining industrial activities andthe low-cost airline Hapag-Lloyd Express, still in the start-up phase.
In its first full financial year, Hapag-Lloyd Express (HLX) grew faster thanoriginally expected. After the start of operations from the Cologne hub in December 2002, Hanover was added as a second hub as early as thespring of 2003. Since the autumn of 2003, HLX has also been operating
Earnings of trading
€ 12 million
Divestments
Divestment of
the energy sector
Central operations
Hapag-Lloyd Express

from Stuttgart. The set-up and optimisation of the route network haveprogressed well, therefore a seat load factor of 70% on the seat-kilometresoffered was already achieved in the main season. Due to the start-upphases for new routes, the seat load factor was 62% for the entire year.HLX generated turnover of € 104 million, with its start-up loss amountingas expected to € - 62 million (previous year: € - 18 million).
Excluding HLX, central operations reported a turnover of € 292 million,4.3% less than in the previous year. Earnings of central operations, exclu-ding HLX, totalled € 441 million (previous year: € - 131 million).
A substantial impact to the earnings of central operations this year was thegain on disposal from the divestment of the energy sector. The divestmentsmade in the 2003 financial year generated total unusual income of€ 930 million (previous year: € 487 million), offset by unusual expensesof € 259 million (previous year: € 187 million). These expenses mainlyrelated to provisions for potential risks from planned and completeddivestments that may arise over the next few financial years. The neteffect of unusual expenses and income was € 671 million (previous year:€ 300 million). More detailed information is provided in the notes.
Costs of central operations, including primarily the cost of TUI AG’s corporate centre functions, accounted for € 143 million (previous year: € 155 million).
The net interest result of central operations improved substantially to € - 140 million (previous year: € - 221 million). This was mainly due tothe reduction in debt resulting from the inflow of funds from the divest-ments completed in the first half of the year.
Other expenses and income of central operations totalled € + 53 millionnet (previous year: € - 55 million). They mainly included the earnings ofother companies and the valuation of assets.
24
Management Report Economic Situation
Unusual income and expenses
in central operations

Group profit for the yearAt € 315 million, Group profit for the year was € 274 million up on theprevious year. To a considerable extent, this was due to the proceedsfrom the divestment of the energy sector. Tax credits had an additionalpositive effect. The combined effects more than offset the non-scheduledwrite-downs of goodwill.
Minority interests in Group profit for the year increased to € 40 millionsince shareholdings in tourism, in particular in the hotel sector, increasedtheir earnings on the previous year.
After deduction of minority interests, a share of € 275 million in Groupprofit for the year was attributable to TUI AG shareholders, up € 243 mil-lion on the previous year. As a result, earnings per share rose to € 1.54,following € 0.18 in the previous year. A dilution effect from the issuedconvertible bonds did not have to be taken into account.
Analysis of earnings€ million 2003 2002 var. %
Group profit for the year 314.9 41.1 + 666.2Taxes on income - 68.9 185.8 - 137.1Earnings before tax (EBT) 246.0 226.9 + 8.4Amortisation of goodwill 667.3 347.8 + 91.9Earnings by divisions (EBTA) 913.3 574.7 + 58.9Depreciation 650.6 687.0 - 5.3Earnings before tax, depreciation and amortisation (EBTDA) 1,563.9 1,261.7 + 24.0Net interest - 149.3 - 239.4 + 37.6Earnings before interest, tax,depreciation and amortisation (EBITDA) 1,713.2 1 501.1 + 14.1Operating rental expenses 674.8 554.8 + 21.6Earnings before interest, tax, depreciation, amortisation and rent (EBITDAR) 2,388.0 2,055.9 + 16.2
For taxes on income, comprised of current income taxes and deferred taxliabilities, tax credit of € 69 million was reported for the 2003 financialyear. While the current tax expense amounted to € 102 million, thedeferred tax liability was reduced to € 171 million mainly as a result ofinternal restructuring of the Group.
Economic Situation Management Report
25
Group profit for the year
€ 315 million
Earnings per share
€ 1.54
Taxes on income

Amortisation and write-down of goodwill totalled € 667 million (previousyear: € 348 million), including € 284 million of scheduled amortisation(previous year: € 293 million) and € 383 million of non-scheduled amor-tisation (previous year: € 55 million). The non-scheduled write-down wasrelated to impairment tests conducted after the allocation of goodwill forthe cash-generating units in accordance with the IFRS. The write-downresulting from the difference between the carrying amounts and thevalue in use mainly related to units in the tourism division.
The depreciation and write-down of other tangible assets dropped to € 651 million, down 5.3% year-on-year. They included € 591 million ofscheduled depreciation (previous year: € 620 million) and € 60 million of non-scheduled depreciation (previous year: € 67 million).
Net interest improved to € - 149 million (previous year: € - 239 million).This positive effect was primarily attributable to the reduction in averagedebt due to the divestments.
At € 675 million (previous year: € 555 million), operating rental expenseswas 21.6% higher than in the previous year. They included an amount of€ 468 million directly attributable to operating performance and hencethe cost of materials. Other expenses included rental and lease expensesof € 207 million.
Financial positionThe divestments of the 2003 financial year did not only affect the Group’sprofit and loss statement but also impacted a number of balance sheetitems. The consolidated balance sheet was restructured in accordancewith the rules of IAS 1 (revised 2003).
Balance sheetThe Group’s balance sheet total declined by 16.3% to € 13.0 billion. Thiswas mainly due to changes in the group of consolidated companies follow-ing the divestments of the energy sector and the shareholding in theAMC Group but also to changes in goodwill.
Management Report Economic Situation
26
Amortisation
Depreciation
Net interest
Operating rental expenses
Balance sheet total
€ 13.0 billion

Assets and liabilities€ million 2003 2002
Non-current assets 10,271.4 12,019.6Current assets 2,717.8 3,497.8Assets 12,989.2 15,517.4Group equity 2,766.9 3,180.5Non-current liabilities 4,204.2 4,516.3Current liabilities 6,018.1 7,820.6Liabilities 12,989.2 15,517.4
Non-current assets dropped by € 1.7 billion or 14.5% to € 10.3 billion.The decline primarily affected fixed assets which decreased by 13.5%year-on-year to € 9.7 billion. At € 0.9 billion, goodwill accounted for anessential proportion of the decline in fixed assets. Besides scheduledamortisation of goodwill and non-scheduled write-downs totalling € 0.6billion, the first-time application of IAS 21 (revised 2003) reduced thevaluation of goodwill by another € 0.3 billion. Another essential itemshowing a decline was other tangible assets which dropped by 10.8% to€ 4.7 billion. This was mainly due to the disposals of the energy sectorand the AMC Group.
Current assets dropped by € 0.8 billion or 22.3% to € 2.7 billion. Theremoval of both the energy sector and the AMC Group from consolidationcontributed to the 14.1% decline in trade accounts receivable to € 0.9billion and the 35.4% decline in other receivables and assets to € 0.9 billion.Deferred income tax assets totalled € 22 million and hence did not changemuch. At € 0.3 billion, liquid funds virtually were at previous year’s level.
Group equity dropped by € 0.4 billion or 13.0% to € 2.8 billion. This wasattributable to the decline in reserves of € 0.4 billion, offset against thechange in the valuation of goodwill resulting from the application of IAS21 (revised 2003). The equity ratio stood at 21.3%. Due to the reductionin the balance sheet total, it climbed by 0.8 percentage points year-on-year.
Non-current provisions and liabilities declined by a total of € 0.3 billion or6.9% to € 4.2 billion. This was due to the changes in long-term provisionswhich dropped by € 0.6 billion to € 1.3 billion. This decline primarily resultedfrom a reduction in provisions for deferred income taxes and other provisions.
The increase in non-current liabilities of € 0.3 billion to € 2.9 billion hadan opposite effect and mainly resulted from the increase in long-termfinancial debt from the issuance of a convertible bond in October 2003.
Economic Situation Management Report
27
Non-current assets
€ 10.3 billion
Current assets
€ 2.7 billion
Group equity
€ 2.8 billion
Non-current provisions
and liabilities
€ 4.2 billion

Current provisions and liabilities totalled € 6.0 billion, down by € 1.8 bil-lion or 23.0% year-on-year. Here current provisions rose by 6.1% to € 0.9billion. Trade accounts payable amounted to € 2.0 billion, while other lia-bilities totalled € 1.6 billion. At 3.4% or 0.4%, respectively, the two itemsdid not change essentially.
Current liabilities dropped by € 1.9 billion to € 5.1 billion. Short-termfinancial debt recorded a substantial decline with its reduction of € 1.9billion or 56.8% to € 1.5 billion. This was primarily achieved by means ofthe proceeds from the divestment of the energy sector in the middle ofthe 2003 financial year as well as the scheduled extension of the maturi-ties of the financial liabilities by issuing the convertible bond and takingup note loans.
FinancingThe development of the Group’s financial situation was characterised bythe proceeds from the divestments made in the financial year, in particularthe sale of the energy sector. More detailed disclosures on the cash flowstatement and the financial position, in particular the maturities of theliabilities, are presented in the notes on the consolidated financial state-ments.
Cash and cash equivalents€ million 2003 2002 Var. %
Cash and cash equivalents at 1 January 2003 366.5 643.3 - 43.0Cash inflow from operating activities 902.2 1,390.9 - 35.1Cash inflow from investing activities 1,102.6 107.1 –Cash outflow from financing activities - 2,010.3 - 1,745.3 + 15.2Other changes in cash and cash equivalents - 12.5 - 29.5 + 56.3Cash and cash equivalents at 31 Dec 2003 348.5 366.5 - 4.9
Net financial positionAt the end of the 2003 financial year, the net financial debt totalled € 3.8 billion, including current and non-current financial liabilities of atotal of € 4.1 billion and cash and cash equivalents of € 0.3 billion. It wasreduced by € 1.6 billion in the course of the year. This was primarilyachieved by the reduction in short-term liabilities to banks by means ofthe proceeds from the divestment of the energy sector.
Management Report Economic Situation
28
Current provisions and liabilities
€ 6.0 billion
Net debt € 3.8 billion

Structure and terms of financial liabilitiesAt the balance sheet date, financial liabilities totalled € 4.1 billion. Theycomprised € 1.6 billion of bonds, € 1.9 billion of liabilities to banks, € 0.5billion of finance leases, and € 0.1 billion of other financial liabilities.
Financial liabilities from bonds climbed due to the issuance of a conver-tible bond in October 2003 by € 0.3 billion. Liabilities to bank were reduced by € 1.9 billion, as scheduled. Liabilities from finance leasesdeclined by € 0.1 billion, while other financial liabilities remained virtuallyunchanged.
With regard to a future longer-term structure of financing for the requi-red resources, several initial steps were taken to change the maturitystructure. At the balance sheet date, the remaining terms of the financialliabilities exceeded five years for € 0.5 billion and were one to five yearsfor € 2.2 billion. Current liabilities with a remaining term of up to oneyear totalled € 1.4 billion.
Commitments from lease, rental and charter contractsIn addition to the commitments from finance leases included in financialliabilities, there were commitments from operating leases of € 3.4 billion.They mainly related to lease, rental and leasing contracts for aircraft,hotel complexes and travel agencies in the tourism division. Another sig-nificant proportion related to the logistics division, primarily to leasingcommitments for ships and goods wagons. More detailed information oncommitments in the individual sectors is provided in a separate sectionon ‘Other financial commitments’ in the notes on the consolidated finan-cial statements.
The commitments from lease, rental and leasing contracts included anamount of € 0.9 billion with a remaining term of more than five yearsand an amount of € 1.8 billion with a remaining term of one to five years.€ 0.7 billion were current commitments with a remaining term of up toone year.
Capital expenditureThe Group’s investments in tangible and intangible assets including good-will totalled € 724 million, down 31.9% year-on-year. 71.6% of the totalamount were invested in tourism, 21.9% in the logistics division, and6.5% in other sectors.
Economic Situation Management Report
29
Maturity of financial liabilities
Operating leases
€ 3.4 billion
Maturity of operating leases

Capital expenditure by divisions1)
€ million 2003 2002 Var. %
Tourism 518.0 615.0 - 15.8Central Europe 95.7 58.6 + 63.3Northern Europe 118.3 110.7 + 6.9Western Europe 75.1 218.8 - 65.7Destinations 186.3 156.8 + 18.8Other tourism 42.6 70.1 - 39.2Logistics 158.7 329.5 - 51.8Shipping 37.5 127.7 - 70.6Logistics 121.2 201.8 - 39.9Other sectors 46.9 118.4 - 60.4Trading 7.9 25.7 - 69.3Divestments 24.4 70.6 - 65.4Other companies 14.6 22.1 - 33.9Total 723.6 1,062.9 - 31.9
1) excl. investments
Financial statements of TUI AG (summary)The financial statements of TUI AG for the 2003 financial year were pre-pared in accordance with the rules of the German Commercial Code andgiven an unqualified audit certificate by auditors PwC Deutsche RevisionAktiengesellschaft Wirtschaftsprüfungsgesellschaft, Hanover. They arepublished in full in the Federal Gazette and deposited at the commercialregisters of the district courts of Berlin-Charlottenburg, HRB 321, andHanover, HRB 6580. They are available on the internet and may also berequested in print from TUI AG.
Net profit for the year and profit appropriation of TUI AGFor the 2003 financial year, TUI AG reported a net profit of € 137.4 million.Taking account of the profit brought forward of € 0.4 million, net profitavailable for distribution totalled € 137.8 million, available for the pay-ment of a dividend of € 0.77 per non-par value share. With dividend-bearing capital of € 456.2 million, profit distribution will amount to € 137.4 million while € 0.4 million will remain to be brought forward onnew account.
Management Report Economic Situation
30

Balance sheet of TUI AG€ million 2003 2002
Fixed assets 7,808.7 7,274.7Tangible assets 576.2 76.6Investments 7,232.5 7,198.1Current assets 1,081.5 2,128.0Receivables 1,042.5 2,122.6Cash and cash equivalents 39.0 5.4Prepaid expenses 6.2 3.0Assets 8,896.4 9,405.7
€ million 2003 2002
Equity 2,426.3 2,417.0Special non-taxed item 51.7 64.2Provisions 1,273.9 1,063.2Liabilities 5,143.6 5,861.3Bonds 1,684.5 1,299.9Other financial liabilities 915.1 2,951.4Other liabilities 2,544.0 1,610.0Deferred income 0.9 –Liabilities 8,896.4 9,405.7
Profit and loss statement of TUI AG€ million 2003 2002
Other operating income 658.6 917.3Personnel costs 81.3 69.3Depreciation 4.4 5.1Other operating expenses 635.3 754.9Net income from investments + 962.3 + 556.5Write-down of investments 728.9 334.2Net interest - 134.8 - 157.4Profit on ordinary activities + 36.2 157.9Extraordinary result + 42.9 + 1.2Taxes + 58.3 22.0Net profit for the year 137.4 137.1
Economic Situation Management Report
31

32
Following a very weak first half of the year, which was impacted by theIraq conflict and weak economic activity, the tourism business achieved anoverall satisfactory performance from the third quarter onwards, in a per-sistently difficult economic environment. Good volumes were recordedabove all for the main season in the months of July and August. How-ever, this did not suffice to offset the business lost in the first few monthsof the year. The individual regions reported varying trends. While the de-mand for tours was relatively stable in the UK, it was considerably affect-ed by overall consumer restraint in Germany, Europe’s largest market.
Tourism€ million 2003 2002 Var. %
Turnover 12,671.3 12,416.2 + 2.1Earnings by division (EBTA) 208.1 336.0 - 38.1EBITDA1) 531.6 614.3 - 13.5Investments 518.0 615.0 - 15.8Headcount (31 Dec.) 51,708 55,013 - 6.0
1) Earnings before interest, taxes, depreciation and amortisation of goodwill
At € 12.7 billion, turnover generated by the tourism division climbed by2.1% year-on-year, although several key markets reported a decline inbusiness volume on the previous year’s levels. Given the decline in turnoverin the Central Europe and Northern Europe sectors, the growth mainlyresulted from the first-time inclusion of the Nouvelles Frontières Groupin consolidated financial statements for a full financial year. Without thiseffect, which accounted for approx. € 0.9 billion and opposite currencyeffects from the Northern Europe sector from the conversion of Britishpounds sterling into euros, the turnover generated by the tourism divi-sion would have dropped by 1.7% year-on-year.
At € 208 million, earnings generated by the tourism division did notachieve the previous year’s level. The Central Europe sector, in particular,but also the Northern Europe sector reported declines in earnings. TheWestern Europe sector, in contrast, reported an increase in earningsfollowing the integration of activities in France. The destinations sectoragain made an essential contribution to the earnings of the tourism division.
Tourism Difficult markets for tourism. Businessaffected by Iraq conflict and weakness in consumerspending.
2003 was a very challenging year for the tourism division. Travel markets in Europewere characterised in particular by the effects of the conflict in Iraq and the weaknessof economic activity in many countries. They were also affected by the beginnings ofstructural change resulting from the emergence of new suppliers at individual stages of the tourism value chain.
Turnover of tourism
€ 12.7 billion
Earnings of tourism
€ 208 million

Business Trend in the Divisions Management Report
33
Central Europe The Central Europe sector covers the distribution and tour operatingbusiness in Germany, Switzerland, Austria and Poland as well as the air-line Hapag-Lloyd Flug. Of all Group tourism activities, the Central Europesector was most severely affected by the weakness of economic activityand the restraint in consumer spending. However, the effects of thesetrends varied for individual regions and market segments.
The operating performance of the Central Europe sector was to a largeextent determined by the development of the German market, whichaccounted for approx. 87% of the tour operating business. Although Ger-man tour operators held their own relatively well given the reduction in market volumes, they recorded an overall decline in the number ofcustomers carried. A similar business trend was reported for Austria andSwitzerland where TUI tour operators also outperformed a market thatwas contracting overall. The total number of customers booking a tourwith TUI tour operators in the Central Europe sector in 2003 was 8.09million, a 1.7% drop year-on-year.
Tourism – Central Europe€ million 2003 2002 Var. %
Turnover 5,097.1 5,199.7 - 2.0Earnings by division (EBTA) - 16.5 105.6 - 115.6EBITDA1) 53.9 170.7 - 68.4Investments 95.7 58.6 + 63.3Headcount (31 Dec.) 9,391 9,744 - 3.6
1) Earnings before interest, taxes, depreciation and amortisation of goodwill
At € 5.1 billion, the turnover generated by the Central Europe sector fellby 2.0% year-on-year. This absolute decline predominantly affected theGerman market, although the smaller markets in Austria and Switzerlandreported relatively stronger losses in turnover. In Germany, the restraintin consumer demand and the resulting decline in turnover affected aboveall the tour operators in the quality segment. They accounted for approx.80% of the tour operating business. In contrast, tour operators in the low-cost, direct marketing or last-minute market segments benefited from themarket trend: they managed to increase their turnover. Distribution wasalso affected by difficult business conditions and reported a significantreduction in turnover from travel agencies compared with the previousyear’s level. In Switzerland and Austria the drop in turnover was primarilyattributable to tour operating and only to a lesser extent to distributionwith its lower agency turnover.
Turnover by source markets
Germany 87%
Austria 9%
Switzerland 4%
Customers by source markets
Germany 87%
Austria 10%
Switzerland 3%

34
Management Report Business Trend in the Divisions
Of all the Group’s tourism activities, earnings generated by the CentralEurope sector were most severely affected by the challenging marketconditions. At € - 17 million, they fell substantially short of the previousyear’s level. This was primarily attributable to the decline in the Germanmarket with its negative impact on capacity marketing and price trends.Therefore Germany posted negative earnings. Austria contributed positivebut lower earnings. Switzerland recorded a significant improvement inearnings but nevertheless reported a loss.
GermanyIn 2003, the total travel volume in Germany was down on the previousyear’s level. This trend affected in particular the market for air packagetours. Following the Iraq conflict and weak economic development in par-ticular in the first half of the year, the number of bookings was consider-ably lower than in the previous year. Although the travel business pickedup in the main holiday season, these losses were not offset. Many touroperators were forced to sell a significant volume of holidays relativelylate due to high capacity available and the persistent trend towards latebookings. This resulted in temporary fierce price competition, whichadversely affected overall price levels.
TUI Deutschland maintained its market position despite the tough com-petition in 2003. A total of 7.14 million customers travelled with its touroperators operating in all segments of the travel market. At 2.2%, thedecline was more moderate than the overall reduction in market volumesin Germany.
TUI, the brand recording the highest volume, accounted for the largestproportion of customers in Germany, with 4.01 million. Business in the2002/2003 winter season was in line with the market trend and largelysatisfactory. The summer season saw an extremely poor start but sub-sequently picked up and almost reached the previous year’s level in thethird quarter. Customer booking behaviour was increasingly characterisedby late bookings. More than 40% of TUI customers did not book theirholidays until eight weeks before departure or even later. The resultingcompetition also affected average prices of TUI products, which declinedyear-on-year. 1-2-Fly, the brand offering mainly low-cost holidays forfamilies reported a similar situation. The Discount Travel brand was estab-lished to sell capacity in less attractive periods and destinations by meansof attractive prices. It met its purpose well with slightly over 100,000 pas-sengers carried.
Earnings of Central Europe
€ - 17 million
TUI Deutschland
Tour operators
Customers by destinations
Spain 33%
Greece 13%
Turkey 10%
Germany 9%
Italy 5%
Others 30%
Summer season 2003

35
Airtours International, the tour operator offering premium tours, continuedto specialise its programmes and expanded the five-star segment. Itsbusiness was considerably affected by overall consumer restraint. In thesummer season in particular, the number of customers dropped signifi-cantly year-on-year. Wolters, the tour operator offering holiday homesand adventure tours, recorded an overall satisfactory performance andrelatively stable booking figures. Gebeco und Oft, the tour operatorsoffering educational and long-haul tours, were particularly impacted bythe geopolitical uncertainties and the SARS lung disease; hence theyrecorded a decrease in volume year-on-year. L’tur, market leader in last-minute tours, benefited from the sustained trend towards late bookingsand maintained its business volume despite an increase in competition bymeans of new sales channels. Berge & Meer continued to expand its marketposition in the direct selling segment. The growth in bookings mainlyresulted from retail-based distribution and increases in web bookings.
TUI Leisure Travel groups together travel agency activities in Germany.Due to the overall weakness of demand, 2003 was a difficult year for dis-tribution. As part of a realignment, unprofitable agencies were closeddown, while the focus shifted to an expansion of new distribution channelssuch as web bookings and call centres. Approx. 54% of travel agency turn-over was accounted for by Group tour operators. Travel agencies remainedthe cornerstone of distribution: despite persistently high growth rates, webbookings only accounted for approx. 3% of total tour operator turnover inTUI Deutschland. In contrast, web bookings already account for up to 20%of business in specialist tour operators such as L’tur and Berge & Meer. In2003, the TUI Leisure Travel organisation covered 1,391 travel agencies,one third of which were Group-owned with the remainder being franchisepartners. In addition, the organisation held a 25.1% share in RT-Reisen, Germany’s largest travel agency cooperation with a total of approx. 1,800travel agency partners.
The charter market was highly competitive in 2003. Existing overcapacitiesin the charter segment and new competition from low-cost airlines oncharter routes combined with sluggish demand resulting from weak regionaleconomic activity and the geopolitical events of 2003. This resulted in highcapacity volumes sold late as well as declining prices. Due to directionalselling measures channelling TUI tour operator passengers towards Group-owned flight capacity as well as significant growth in the seat-only business,Hapag-Lloyd Flug nevertheless increased its passenger figures by over6% to 6.7 million. Two thirds of passengers travelled with Group-ownedtour operators, approx. 12% with other tour operators and 20% booked aseat only. Hapag-Lloyd Flug operated a young fleet in 2003, having an
Business Trend in the Divisions Management Report
Specialist tour operators
Distribution
Hapag-Lloyd Flug

36
Management Report Business Trend in the Divisions
average age of just under six years and consisting of 29 Boeing 737-800sand five Airbus A310s. The flight schedule included flights from 18 depar-ture airports in Germany to 37 holiday destinations. The total capacityoffered was 17.8 billion seat-kilometres and a good seat load factor of 86%.
SwitzerlandThe Swiss travel market remained weak in 2003. Besides a number ofexternal factors, price levels also declined due to large capacities offeredby various market players. Nevertheless, TUI Suisse tour operators recordedsmaller declines than the overall market. At 0.19 million, the number ofcustomers fell by 8.9% on the previous year’s level. The individual brandsreported different trends. Imholz, the specialist in beach holidays and citytrips, was considerably affected by the decline in demand in this segmentbut nevertheless managed to regain market shares in package tours. Inorder to meet the increasing demand for more personalised tours both incity trips and beach holidays, the new tour operator brand FlexTravel waslaunched with a modular system to facilitate greater flexibility in bookinglong-haul tours. Vögele Reisen – market leader in Swiss direct selling –responded successfully to market requirements with its flexible offerings.As a result, business volume fell only slightly short of the previous year’slevel.
The in-house distribution system was selectively strengthened in 2003. Itincluded 67 Group-owned travel agencies and three shareholdings. Approx.55% of business was generated by the distribution of products offered byGroup-owned tour operators. New media reported strong growth in distri-bution, although they only accounted for approx. 2% of total distribution.
In the flight segment, TUI Suisse mainly cooperated with three Swisscharter airlines both on medium-haul and long-haul destinations. In addi-tion it also used airlines from the destinations in some instances.
AustriaAustria reported seasonal variations in business trends in 2003. While thenumber of tours sold in the 2002/2003 winter season grew year-on-year,bookings for the summer season dropped. This was mainly due to theadverse economic environment in Austria and overall consumer restraint.This resulted in overcapacities which, when sold, led to price pressure. A total of 0.76 million customers booked their holidays with TUI Austriatour operators in 2003, a 2.4% decline year-on-year. Individual tour ope-rators were affected to varying extents. Gulet, Austria’s strongest volumebrand, managed to grow. TUI’s offerings in the high-end segment and the1-2-Fly product portfolio – which was marketed as a whole for the first
Distribution
Customers by destinations
Greece 17%
Spain 16%
Turkey 6%
Egypt 5%
Cyprus 5%
Others 51%
Summer season 2003
Customers by destinations
Turkey 26%
Greece 25%
Italy 13%
Croatia 10%
Spain 8%
Others 18%
Summer season 2003

37
time – also met with a high level of demand. In contrast, the Magic Lifeclub brand and Terra, tour operator for land-based tours, did not manageto reproduce the previous year’s levels. Hungary recorded a good devel-opment of business: TUI Ungarn offered departures from Budapest andalready assumed a leading position in the Hungarian market for packagetours in just its second financial year.
TUI Austria’s agency distribution significantly strengthened its position.The turnover generated for Group-owned tour operators rose substantially,accounting for around 60% of total business volume. Distribution throughnew media remained relatively insignificant. The Group-owned distribu-tion network included 94 travel agencies, 60% of which were franchiseoperations. In addition, it cooperated with the 75 travel agencies operatingunder the TUI Travelstar brand.
In the flight sector, the tour operators essentially covered their capacityrequirements by means of agreements on capacity concluded with fiveairlines. Charter flights accounted for around 95% of all flight operations,with the remainder being flights booked with scheduled airlines.
PolandTUI Polska managed to maintain its market position in a declining andtherefore intensely competitive market. It sold products of German touroperators under the TUI and Scan Holiday brands as a general salesagent. Poland’s economic problems resulted in a strong drop in the valueof the Polish currency against the euro which meant that travel prices,calculated in euros, rose significantly for Polish customers. This was oneof the main reasons for the year-on-year decline in business volumes.
Northern Europe The Northern Europe sector comprises the distribution and tour operatingbusinesses in the UK, Ireland and the Nordic countries as well as Britan-nia Airways UK and Britannia Airways Nordic airlines. Against the back-ground of the conflict in Iraq and the resulting uncertainties, market con-ditions continued to be very difficult in all markets. Nevertheless, TUINorthern Europe held its own well in the UK and Ireland and stabilisedits position in the Nordic countries due to the successful restructuring.
Business Trend in the Divisions Management Report
Distribution

38
Management Report Business Trend in the Divisions
Business trends varied in the individual markets. In the UK, the largestmarket in the Northern Europe sector, accounting for 74% of the touroperating business, the number of passengers carried was virtually stable.In Ireland, volumes grew due to the expansion of business to NorthernIreland. The Nordic countries recorded another decline in volumes. A totalof 6.12 million customers went on holiday with tour operators of theNorthern Europe sector, a drop of only 2.1% on the previous year. Thedecline in volumes mainly resulted from weak bookings during the con-flict in Iraq.
Tourism – Northern Europe € million 2003 2002 Var. %
Turnover 4,301.1 4,762.2 - 9.7Earnings by division (EBTA) 79.0 84.1 - 6.1EBITDA1) 185.8 197.0 - 5.7Investments 118.3 110.7 + 6.9Headcount (31 Dec.) 18,033 18,732 - 3.7
1) Earnings before interest, taxes, depreciation and amortisation of goodwill
At € 4.3 billion, the turnover generated by the Northern Europe sectorfell 9.7% year-on-year, mainly in the UK but also in the Nordic countries.The loss in the value of British pound sterling against euro had an addi-tional adverse effect on the reported level of turnover. Taking account ofthe effect of currency conversion, the decline in turnover amounted toonly 0.7%. Despite the effect of the Iraq conflict on trading the effect onturnover has been limited.
At € 79 million, earnings generated by the Northern Europe sector droppedbelow the previous year’s level. Following a slow start, the UK companiesachieved an overall satisfactory performance although the profit contri-bution of tour operating was below the previous year’s level. Ireland alsoreported a decline in earnings. Earnings stabilised in the Nordic countries;however, they reported a similar loss to last year.
UKThe UK holiday market was difficult and highly competitive although marketvolume were less affected than in other European countries. The UKbusiness, incorporating Thomson Holidays, distribution under the brandsof Lunn Poly, Travel House, Team Lincoln and Skydeals, the SpecialistHolidays Group and Britannia Airways UK, benefited from the efficient,vertically integrated organisation maximising all stages of the service chain.
Earnings of Northern Europe
€ 79 million
Customers by source markets
UK 74%
Nordic countries 20%
Ireland 6%
Turnover by source markets
UK 79%
Nordic countries 17%
Ireland 4%

39
At 3.81 million, the number of passengers carried by Thomson Holidayswas around 2% ahead of the previous year. This level of volumes wasachieved due to the significant recovery in demand following the end ofthe conflict in Iraq, which had considerably impacted bookings particularlyin the first half of the year. However, average prices suffered, primarily dueto changes in consumer booking behaviour: tour operators reported 3%fewer brochure holidays for the main season, offset by 10% more late dis-counted holidays and 5% more airfare-only passengers. TUI UK didhowever gain market share.
TUI UK distribution continued to become more directionally orientatedtowards TUI UK tour operating products. 67% of the bookings taken werefor TUI UK products. The organisation included 877 travel agencies.Booking volumes continued to migrate from high-street retail to directselling brands. Web bookings thus accounted for 5% of bookings for thesummer season, representing the greatest growth for any of the new saleschannels.
The Specialist Holidays Group is a collection of well-known brands suchas Simply Travel, Magic, Crystal and Something Special. It made use of itsflexibility in committed flights and accommodation and responded tomarket conditions by a reduction in volumes. Nevertheless, it was particu-larly strongly affected by the conflict in Iraq, due to the decline in book-ings to the USA, a destination on which tour operating relied relativelystrongly. In addition, the outbreak of the lung disease SARS impactedlong-haul sales, in particular to destinations in Asia. Against this back-ground, the number of passengers carried declined to 0.69 million, an14% reduction against the level of the previous year.
Britannia Airways UK operated a fleet of 32 aircraft in the summer season,including 20 Boeing 757s and 12 Boeing 767s; one Boeing 767 was tem-porarily leased to Corsair. The average age of the aircraft fleet was nineyears. In the 2003 summer season Britannia flew from 19 UK airports to atotal of 68 destinations in the holiday regions. For its excellent operationalperformance and punctuality it won the Telegraph Travel Award for the thirdyear running. At 8.0 million, the number of passengers carried only fell by1% year-on-year. 96% of these passengers were Group customers. Thetotal number of seat-kilometres offered in 2003 was 20.8 billion; the seatload factor again reached a high level at 91%.
Distribution
Specialist Holidays Group
Britannia UK
Business Trend in the Divisions Management Report
Customers by destinations
Spain 57%
Greece 14%
Cyprus 6%
Italy 5%
Portugal 4%
Others 14%
Summer season 2003

40
Management Report Business Trend in the Divisions
IrelandBudget Travel held its own in the more difficult Irish market. The passengervolume rose to 0.38 million, up 9% year-on-year. However, average pricesfell. The volume growth primarily resulted from the expansion of businessto Northern Ireland where a new Belfast programme was launched forthe 2003 summer season. Profits were adversely impacted by an increasedlevel of discounting, the cancellation of the Egypt programme and poorload factors to capacities in Cyprus, all of which resulted from the Iraqconflict.
Nordic countriesTUI Nordic had another difficult year. Markets in the Nordic countries wereimpacted by weak economies and weak currencies affecting consumerdemand in recent years. Moreover, increased volumes were offered in themarket by low-cost carriers. This resulted in capacity exceeding demandwith a consequential increase in levels of discounting and increasing pres-sure on margins. This year the impact of the Iraq conflict and anothersummer of record weather in the Nordic region represented additionalfactors discouraging the demand for holidays abroad.
Against this backdrop, the TUI Nordic tour operators with their main brandsof Fritidsresor, Star Tour and Finnmatkat reduced their programme offer-ings. As a result, the passenger volume declined to 1.24 million, down 7%on the previous year. The reorganisation of the business, including thecombining of the Swedish and Norwegian business, was continued andcreated the conditions for a further considerable reduction in the costbase. The combining of the Swedish and Norwegian business both usingBritannia for their flying gave the opportunity to strengthen the verticalintegrated model.
In 2003, Britannia Airways Nordic flew passengers from 13 airports inSweden and Norway to a total of 38 destination airports. It operated sixBoeing 737-800s with an average age of three years. In order to reducecapacity, an additional aircraft was leased to a Spanish charter airline fora two-year period. Due to the reduction in the aircraft fleet, the numberof passengers declined by 13% to 1.1 million. 80% of these passengerswere group customers. The airline achieved good operational performanceand a 92% seat load factor for the 4.0 billion seat-kilometres offered.
Tour operators
Britannia Nordic
Customers by destinations
Spain 68%
Greece 13%
Portugal 9%
Cyprus 4%
Turkey 3%
Others 3%
Summer season 2003
Customers by destinations
Greece 32%
Spain 26%
Cyprus 11%
Italy 8%
Turkey 7%
Others 16%
Summer season 2003

41
Western Europe The Western Europe sector covers the tourism business in France, theNetherlands and Belgium as well as Corsair airline operating from sourcemarket France. Markets in these countries showed uneven trends. WhileBelgium recorded relatively stable demand, the tour operating markets inFrance and the Netherlands contracted in the wake of geopolitical uncer-tainties and regional weakness in economic activity.
The tour operating business in the Western Europe sector partly outper-formed market trends. Thus the number of customers in France grew, incontrast to the market trend, and new market shares were again gained inBelgium. At 4.03 million, the total number of customers travelling with TUItour operators in the 2003 financial year was 1.3% down on the previousyear.
Tourism – Western Europe € million 2003 2002 Var. %
Turnover 2,479.6 1,630.1 + 52.1Earnings by division (EBTA) 42.2 15.3 + 175.8EBITDA1) 83.4 23.1 + 261.0Investments 75.1 218.8 - 65.7Headcount (31 Dec.) 6,521 7,822 - 16.6
1) Earnings before interest, taxes, depreciation and amortisation of goodwill
A comparison of turnover and earnings for the Western Europe sector isonly of limited use as the Nouvelles Frontières Group was included in con-solidation for a full financial year for the first time in 2003, whereas it wasonly included in consolidated financial statements for the fourth quarterin the previous year. At € 2.5 billion, turnover generated by the sectorrose by 52.1% year-on-year. As the growth generated in Belgium virtuallymatched the decline in the Netherlands, the increase was almost exclusivelyattributable to the consolidation effect resulting from the inclusion ofactivities in France, which was around € 0.9 billion.
At € 42 million, earnings generated by the Western Europe sector weresignificantly up on the previous year. Here, too, the increase was essen-tially attributable to the full-year consolidation of the Nouvelles FrontièresGroup which contributed positive earnings in the 2003 financial year. TheBelgian companies increased their earnings year-on-year. The Netherlandsclosed the 2003 financial year at a loss, unlike the previous year. This wasmainly due to the weakness of the market and the resulting price pressure.
Business Trend in the Divisions Management Report
Earnings Western Europe
€ 42 million
Customers by source markets
France 40%
Netherlands 30%
Belgium 30%
Turnover by source markets
France 45%
Netherlands 28%
Belgium 27%

Management Report Business Trend in the Divisions
42
FranceThe French market for organised tours was difficult in 2003. The reductionin private consumption in France was also reflected in a decline in demandfor holiday tours. In addition, customers showed a high level of price sen-sitivity. In this difficult environment, the business of Nouvelles Frontièresoutperformed the market. At 1.62 million, the number of customers carriedby the tour operators was 1.2% down on the previous year. Average pricesof tours sold increased and thus resulted in a disproportionate increasein turnover. Tours to the French overseas territories, North Africa and theCaribbean recorded particularly strong demand. The new tour operatorbrand TUI France was launched in September and will tap additional cus-tomer segments with its programmes. In this connection, Nouvelles Fron-tières entered into a strategic partnership with Accor, the French hotelgroup, including the exclusive marketing of eight Coralia Clubs of the AccorGroup.
In terms of distribution, the Group stepped up its presence in southernand western France. The Nouvelles Frontières tour operator brand exclu-sively sold its tours through the Group’s 201 travel agencies, comprising77% of Group-owned agencies with the remainder being franchise opera-tions. In contrast, the new TUI France brand is exclusively distributedthrough third-party travel agencies. At 80%, travel agencies accounted forthe largest proportion of distribution of Group products, while the shareheld by new media rose to 12%; 8% of tours were sold through otherdistribution channels such as group tours.
Corsair, the Nouvelles Frontières Group airline, reported a successful busi-ness year. It benefited from the closure of a competitor which generatedadditional business, in particular on the routes to Réunion and the Antilles.In addition, the seat-only business continued to grow. Corsair carried a totalof 2.1 million passengers, with a proportion of just under 22% in the airfare-only business. It operated a fleet of eleven aircraft in the summer season,two of which were temporarily leased to cope with the increase in businessvolume. The fleet comprised one Boeing 767, five Boeing 747s, two Boeing737s and three Airbus A330s. On its 14.4 billion seat-kilometres it achieveda seat load factor of 84%.
NetherlandsIn 2003, the Dutch travel market was characterised by weak demand,further consolidation of suppliers and an increase in market penetrationthrough direct selling and web distribution. This resulted in across-the-board pressure on prices. The TUI Nederland tour operators were affectedto varying extents by this market trend. Thus, the two traditional tour
Distribution
Corsair
Customers by destinations
Caribbean/Other 23%
Africa 16%
France 10%
Greece 7%
Italy 7%
Others 37%
Summer season 2003

operators Arke and Holland International recorded an approx. 10% declinein bookings in the summer season compared with the previous year’s level,whereas Kras reported an approx. 13% increase in bookings through newmedia in its direct sales segment. A total of 1.20 million customers travel-led with TUI Nederland’s tour operators, 5.0% down on the previous year.
TUI Nederland’s agency-based distribution covered a total of 327 travelagencies, about 50% of which were Group-owned with the remainderbeing associated or franchise companies. Products offered by the Group’sown tour operators accounted for just over half its business. Three quar-ters of tour operator customers booked their tours through travel agen-cies, both Group-owned and third-party. At 2.5%, the proportion of directdistribution through new media channels continued to rise.
In the flight segment, TUI Nederland’s tour operators cooperated withfive charter airlines carrying just over 80% of its passengers. Just under20% of customers were booked on scheduled flights.
BelgiumAlthough the overall economic situation deteriorated in Belgium, the travelmarket remained relatively stable. This trend applied both to volumes andprices. TUI Belgium was very successful in launching new offerings suchas Jetonly in the airfare-only business and again gained market shares. A total of 1.21 million customers booked their tours with TUI Belgium’stour operators, an increase of 2.6%. Jetair, the main brand which accountedfor more than half of the business, consolidated its market position andrecorded moderate growth. Jetair Auto reported solid growth. This brandfirmly consolidated itself in the land-based tour segment and accountedfor roughly one third of customers. The fastest-growing brand was SunjetsDirect, with which more than 10% of customers booked their tours. Interms of destinations, Spain ranked top of the league again, accountingfor around 30% of bookings.
In 2003, TUI Belgium’s agency distribution system included 65 Group-owned travel agencies plus 36 franchise agencies. Roughly 55% of theirbusiness was conducted with Group-owned tour operators: this corres-ponded to a proportion of approx. 12% of TUI Belgium’s tour operatingturnover. Travel agencies increasingly used web applications for their busi-ness; however, direct sales through the web continued to account for onlya small proportion of business.
In 2003, approx. 75% of passengers travelling with TUI Belgium flew withSobelair, with the remainder using different charter airlines based in the
Business Trend in the Divisions Management Report
43
Distribution
Customers by destinations
Spain 32%
France 13%
Greece 11%
Turkey 10%
Tunisia 5%
Others 29%
Summer season 2003
Customers by destinations
Spain 23%
Greece 11%
Benelux 10%
Turkey 10%
Germany 9%
Others 37%
Summer season 2003

destinations. Following the insolvency of Sobelair, TUI Belgium establishedits own airline for 2004.
DestinationsThe destinations sector covers TUI’s incoming agencies and hotel companiesgrouped within TUI Hotels & Resorts. The sector held its own well in thehighly competitive environment of 2003 and performed respectably againstthe backdrop of weak demand in Germany, one of the key source markets.
Consolidated turnover generated by the destinations sector dropped by4.9% to € 548 million. This decrease was primarily attributable to a lowerturnover generated by the incoming agencies but also by the hotel sector’sthird party business. Earnings achieved by the sector dropped by 12.9% to€ 105 million. This was mainly due to the price competition to which thehotel companies were exposed during the conflict in Iraq when bookingswere down.
Tourism - Destinations€ million 2003 2002 Var. %
Turnover 547.5 575.8 - 4.9Earnings by division (EBTA) 104.5 120.0 - 12.9EBITDA1) 168.5 176.0 - 4.3Investments 186.3 156.8 + 18.8Headcount (31 Dec.) 12,896 13,787 - 6.5
1) Earnings before interest, taxes, depreciation and amortisation of goodwill
Incoming agenciesIn the 2003 financial year, TUI’s consolidated and associated incomingagencies provided tourism services such as transfers, excursions as wellas group and incentive programmes to 8.67 million guests in 21 countries.Business trends varied for different regions and throughout the year.Thus agencies in the Islamic countries in the eastern Mediterranean wereadversely affected by the conflict in Iraq, in particular during the first halfof the year, as holidaymakers were much less willing to travel to this region.In contrast, agencies in the western Mediterranean region benefited froman increase in the number of holidaymakers travelling to this region, aboveall due to geopolitical uncertainties. The new agencies in Romania andMexico, in which TUI acquired shareholdings in 2003, reported good busi-ness trends.
TUI España, which operates in Spain and the Dominican Republic, recordeda year-on-year improvement in its business trend in the 2003 financialyear. It catered for 4.79 million guests, an increase of 9% on the previous
Management Report Business Trend in the Divisions
44
Earnings of destinations
€ 105 million
Western Mediterranean
Guests by incoming agencies
TUI España 55%
TUI Hellas 15%
Tantur 7%
TUI Portugal 4%
Travco 4%
TUI Bulgaria 3%
Other agencies 12%

year. This growth was substantially attributable to new customers in thecruise sector and growth in the Caribbean. At just under 95%, the pro-portion of customers booking their tour with TUI tour operators remainedconstant. TUI Portugal continued to expand its business as the leadingagency in the Algarve. At 0.32 million, the number of guests in 2003 was8% up on the previous year, partly due to the takeover of service activi-ties for the TUI UK tour operators. The proportion of customers bookingtours with TUI tour operators continued to rise to 89%.
In the eastern Mediterranean, agencies were affected to varying extentsby the effects of the Iraq conflict. In Greece, TUI Hellas managed to holdits own well and recorded a total of 1.34 million guests, up 3% on the pre-vious year. As before, 98% of this total travelled with a TUI tour operator.The excursion programme was well accepted: air excursions from Crete toCairo, on which TUI Hellas cooperated with the Egyptian agency Travco,were newly included in the programme. Business in Egypt picked up con-siderably following the end of the conflict in Iraq. Demand from thirdparties, e.g. the Russian market, was particularly brisk. Besides the take-over of service activities for other TUI tour operators, this was one of thereasons why Travco increased its number of guests by approx. 40% to0.35 million. The proportion of third parties increased while customersbooking with TUI accounted for 68% of the business. The Turkish agencyTantur was most strongly affected by holidaymakers’ restraint in bookingtours to this region. At 0.59 million, it recorded a 2% drop year-on-yearin the number of guests serviced. It almost exclusively worked for Group-owned tour operators. TUI Bulgaria continued to record a positive trend.With its new offer of service activities for holidaymakers travelling withthird-party tour operators, it continued to expand its already strong marketposition. It reported a more than 45% increase in the number of guestscatered for to 0.23 million, 90% of whom travelled with TUI tour operators.
The remaining agencies recorded successful business trends in 2003. Theycatered for a total of 1.05 million guests, providing them with transfersand excursion programmes. The Aeolos agency in Cyprus benefited fromthe integration of the TUI UK business in the previous year and from newexcursion and leisure programmes, which sold well. Danubius Travel firmlyestablished itself in the emerging Romanian market within a short periodof time. The agencies in long-haul destinations Mexico and Africa benefitedfrom good demand in their destinations and hence performed well.
Hotel companiesThe Group’s hotel portfolio, grouped within TUI Hotels & Resorts, comprisedhotel companies in which the Group held a majority stake, joint ventures
Business Trend in the Divisions Management Report
45
Eastern Mediterranean
Other agencies

with local partners, and associated companies. In the 2003 financial year,the portfolio consisted of a total of 287 hotels with a capacity of over150,000 beds. 44% of these beds were owned by the Group, 14% wereleased and 42% were controlled under management or franchise agree-ments.
In 2003, TUI Hotels & Resorts recorded a total of 2.82 million guests with30.8 million overnight stays for all hotel companies combined. At around80%, the overall occupancy rate rose year-on-year, with individual hotelgroups performing differently.
In the summer of 2003, Robinson operated 25 club complexes in ten coun-tries, down by two on the previous year. The occupancy rate fell just belowthe previous year’s level. Business developed well in the Spanish islands.Both clubs in Fuerteventura reported higher booking figures compared withthe previous year: the Cala Serena club in Majorca, reopened in the summerof 2003 following reconstruction, recorded high occupancy rates right fromthe beginning. The three club complexes in Turkey, on the other hand,reported declines. The remaining clubs recorded steady business trends.
Magic Life offered a total of 21 club complexes, above all in the easternMediterranean region. Its occupancy rates fell short of the previous year’slevel. Bookings for the 9 Turkish clubs, in particular, were impacted by theeffects of the Iraq conflict. Dorfhotel operated three complexes in Austriaand Germany in the summer of 2003; its occupancy rate fell slightly shortof the previous year’s level.
Among the Spanish hotel companies, RIU in particular looks back upon asuccessful 2003 financial year. RIU operated a total of 104 hotels, anincrease of six on the previous year. Demand was particularly strong forthe 19 hotels in the long-haul destinations in the Caribbean, Mexico andthe USA, which were almost fully booked. In Spain, the hotel facilities inthe Canary Islands managed to retain their good occupancy rates, whereashotels in the Balearic Islands recorded a drop in bookings. Overall occu-pancy rates of the available beds rose year-on-year. This was partly attri-butable to an expansion of marketing in other source markets such asSpain for the European hotels or the USA and Canada for hotels in theCaribbean region.
Grupotel had a total of 35 hotels available in the summer of 2003, 23 ofwhich were located in Majorca, eight in Menorca and four in Ibiza. Occu-pancy rates rose, with hotel capacities increased by one additional hotel,and improved in particular in hotels in Majorca and Ibiza.
Management Report Business Trend in the Divisions
46
Magic Life and Dorfhotel
RIU
Grupotel
Controlled hotel beds per region
Western Mediterranean 41%
North Africa/Egypt 17%
Southeast Europe 14%
EasternMediterranean 11%
Caribbean 11%
Others 6%

Grecotel, the leading hotel company in Greece, operated a total of 16 hotels,i.e. the same number as in the previous year. Fourteen hotels were locatedin several Greek islands, while the two remaining hotels were located onmainland Greece. Occupancy rates were good but fell short of the previousyear’s levels. This affected in particular hotels in the islands in the Aegean,close to the Turkish coast.
With its 13 hotels in Egypt and one hotel in Turkey, Iberotel operated thesame number of hotels as in the previous year. Overall, occupancy ratesroughly equalled the previous year’s levels, with good occupancy rates inEgyptian hotels compensating for the significantly decline in Turkey.
The Nordotel, Atlantica and Gran Resort hotel chains included 16 hotels inthe Mediterranean region. Seven hotels were located in the Canary Islands,one each on mainland Spain and the Turkish riviera, four in Cyprus andthree in the Greek island of Rhodes. The facilities were mainly marketedin the UK and Scandinavia and reported very good occupancy rates.
Other tourismThe Other tourism sector comprises the Group’s business travel sectorand IT service providers. It generated turnover of € 246 million, close tothe previous year’s level. In the business travel sector, in particular, themarket was difficult which meant that earnings fell significantly short ofthe previous year’s level, at € - 1 million.
Tourism – Other tourism € million 2003 2002 Var. %
Turnover 246.0 248.4 - 1.0Earnings by division (EBTA) - 1.1 11.0 - 110.0EBITDA1) 40.0 47.5 - 15.8Investments 42.6 70.1 - 39.2Headcount (31 Dec.) 4,867 4,928 - 1.2
1) Earnings before interest, taxes, depreciation and amortisation of goodwill
TUI Business Travel, which operates under the TQ3 Travel Solutions brand,saw its business trend affected all the way into the second half of the yearby global political events, the lung disease SARS and the weakness ofeconomic activity in several markets. Activities in Germany and Scandinaviawere particularly adversely affected, while units in the UK and Canadacontinued to develop positively despite the adverse environment. Mean-while the business network was expanded to more than 70 countries.
Business Trend in the Divisions Management Report
47
Grecotel
Iberotel
Nordotel, Atlantica
and Gran Resort

48
The logistics division, which groups together shipping and special logistics activities underHapag-Lloyd AG, generated a significant year-on-year improvement in earnings. This development was primarily supported by the worldwide recovery of container shipping.
Logistics Upswing in container shipping. Weak economic environment for rail logistics and mobilebuildings business.
Turnover generated by the logistics division rose to € 3.9 billion, up 3.6%.Earnings rose significantly more strongly: at € 314 million, they were57.3% up on the previous year’s level and represented the best resultever generated by the division. The bulk of this increase was contributedby container shipping which took advantage of the growth in global con-tainer transport to expand its business and benefited from an improve-ment in freight rates. In the logistics sector, the VTG-Lehnkering Groupand the Algeco Group operated in difficult markets and therefore reporteda year-on-year drop in their earnings contribution.
Logistics € million 2003 2002 Var. %
Turnover 3,915.1 3,777.3 + 3.6Earnings by division (EBTA) 313.9 199.2 + 57.3EBITDA1) 548.1 434.3 + 26.2Investments 158.7 329.5 - 51.8Headcount (31 Dec.) 9,235 9,307 - 0.8
1) Earnings before interest, taxes, depreciation and amortisation of goodwill
ShippingThe shipping sector comprises the operational units of Hapag-Lloyd Container Linie and Hapag-Lloyd Kreuzfahrten as well as the holdingHapag-Lloyd AG. It generated a turnover of € 2.4 billion, a 7.0% increaseyear-on-year. Earnings rose to € 253 million and thus reached a newrecord level.
Shipping sector€ million 2003 2002 Var. %
Turnover 2,381.2 2,225.3 + 7.0Earnings by division (EBTA) 252.5 121.1 + 108.5EBITDA1) 342.8 212.1 + 61.5Investments 37.5 127.7 - 70.6Headcount (31 Dec.) 3,897 3,761 + 3.6
1) Earnings before interest, taxes, depreciation and amortisation of goodwill
As the geopolitical tension faded, world trade also started to recover, withthe OECD forecasting growth of 4% following 3.4% in the previous year.As before, global container transport grew faster than world trade in 2003.At a growth rate of more than 7%, global container transports achieved a
Earnings of shipping
€ 253 million
Market development

49
volume of 65.7 million standard containers (TEU). Besides the increase inworld trade, growth was spurred by the global division of labour and newtypes of goods which had not previously been shipped in containers.
Hapag-Lloyd Container LinieIn the financial year under review, Hapag-Lloyd Container Linie operated40 container vessels on worldwide east-west shipping routes. It is a mem-ber of Grand Alliance, the world’s largest liner shipping consortium.
In 2003, Hapag-Lloyd Container Linie again grew faster than the market.The number of containers shipped rose by more than 13% to 2.1 millionTEU. This was also due to new and improved services which were wellaccepted by customers. At € 2.2 billion (previous year: € 2.1 billion), turn-over grew by around 9% year-on-year. This was attributable to volumegrowth as well as the increase in freight rates denominated in US dollarsby an average of 15%. Growth in turnover and the development of earn-ings were both slowed by the fall in the value of the US dollar against theeuro which amounted to an annual average of just under 20%. Neverthe-less, Hapag-Lloyd Container Linie managed to increase its earnings signi-ficantly.
A significant proportion of business related to transports between Europeand the Far East. In this shipping region, exports from Europe grew by2%; imports from Asia rose substantially more strongly, with the 16%growth primarily attributable to the strong increase in exports from China.At 10% growth, transports within Asia also recorded strong growth onceagain. Here, too, the driving force behind this growth was the Chinesemarket. Hapag-Lloyd achieved an above-average share in this develop-ment. At 865,000 TEU, transport volumes grew by 16% year-on-year.Freight rates rose by an average of 21% year-on-year. The brisk growth of imports into Europe intensified the imbalance in the flow of freight.Transports from Asia to Europe accounted for just under two thirds oftransports. Efficient control of capacities and turnover of the containerfleet was instrumental in restricting the number of no-load transports.
In the North Atlantic region, exports to America dropped by 1% while Euro-pean imports grew by 5%, spurred by changes in exchange rates. Thevolume shipped by Hapag-Lloyd grew disproportionately. It reached550,000 TEU and was therefore 7% up on the previous year. This wasmainly attributable to new transports between the Mediterranean regionand North America. In addition, freight rates also improved on the NorthAtlantic: on an annual average, they were roughly 9% up on the previousyear.
Business Trend in the Divisions Management Report
Europe/Far East
North Atlantic
Transport volume(in ´000 TEU)
800
700
600
500
400
300
200
100
0
20022003
Far
East
Nor
th A
tlant
ic
Tran
s-Pa
cific
Latin
Am
eric
a

The Trans-Pacific shipping region with routes between Asia and NorthAmerica is the largest shipping region in the world. It grew by almost 13%in 2003. At an increase of more than 16%, transports from Asia to NorthAmerica recorded the highest growth rates, while transports in the oppo-site direction grew by 6%. With a transport volume of 540,000 TEU – justover 14% up on the previous year – Hapag-Lloyd is one of the leadinglines in this shipping region. Freight rates denominated in US dollars grewby an annual average of 14%. Due to selective acquisitions and a sophis-ticated control system for container turnover, transports from the US toAsia grew disproportionately so that the number of no-load transportswas substantially reduced.
In the Latin America shipping region, imports from Europe into this regiondeclined slightly while exports to Europe, on the other hand, rose byaround 9%. Hapag-Lloyd continued to expand its business on these routesand, at 150,000 TEU, grew by 25% over the volume shipped in the previousyear. This was to a large extent due to transports between South andNorth America. Latin America was an economically difficult shipping region:competition was marked by regional overcapacities and therefore freightrates did not increase.
Hapag-Lloyd KreuzfahrtenThe German cruise market was adversely affected to a significant extentby geopolitical uncertainties. Demand did not pick up until the secondhalf of the year. Hapag-Lloyd Kreuzfahrten did not manage to evade thistrend, either. Special offerings – such as adventure, lifestyle or wellnesstours – helped to stimulate demand and stabilise price levels. Besidesfive-star-plus cruise ship Europa, the fleet comprised three other ships of the premium segment: the Hanseatic, the Columbus and the Bremen.
At € 133 million (previous year: € 151 million), turnover fell by 13% year-on-year. This was attributable both to the difficult ocean cruise businessand the scheduled reduction in river cruises. The decline in business volumes and the resulting drop in the utilisation of vessels had a significantadverse effect on earnings, which were negative.
Management Report Business Trend in the Divisions
50
Trans-Pacific
Latin America

LogisticsThe logistics sector, comprising the VTG-Lehnkering Group, Pracht Spedi-tion + Logistik and the Algeco Group, generated turnover of € 1.5 billion.Despite the weakness of economic activity in Europe which affected almostall activities in this sector, it only fell 1.2% short of the previous year’slevels. However, earnings were affected more strongly by the difficult eco-nomic climate: at € 61.4 million, they dropped by 21.7% year-on-year.
Logistics sector € million 2003 2002 Var. %
Turnover 1,533.9 1,552.0 - 1.2Earnings by division (EBTA) 61.4 78.4 - 21.7EBITDA1) 205.3 222.1 - 7.6Investments 121.2 201.8 - 39.9Headcount (31 Dec.) 5,338 5,546 - 3.8
1) Earnings before interest, taxes, depreciation and amortisation of goodwill
VTG-Lehnkering GroupThe development of business for most activities of the VTG-LehnkeringGroup was largely determined by the flagging economy and the slow growthin the chemical industry. This led to a decline in turnover to € 925 million(previous year: € 967 million). This decrease was mainly attributable tothe economic climate but also structural changes in the bulk and speciallogistics sector. Earnings were close to the previous year’s level.
The VTG-Lehnkering Group will focus on rail and tank container logisticsin future. At the end of 2003, it initiated the divestment process to sellthe activities pooled in the bulk and special logistics sector.
Turnover in the rail and tank container logistics sector was slightly lowerthan in the previous year. The major part of the business was tank, bulkand special goods wagon rental. Around 37,000 Group-owned and operatedwagons were available in Europe to meet demand, mainly mineral oil,chemical and compressed gas tank wagons. VTG-Lehnkering’s leadingposition in this sector was due to its large capacities and its presence onall major markets in Europe. Business development varied in the individualcountries, mainly due to the respective economic trends: both capacityutilisation and price levels were good in Austria, Switzerland and Belgiumwhile both areas were adversely affected by weak demand in Germany.Overall, however, the wagon fleet repeated the previous year’s level ofutilisation.
Business Trend in the Divisions Management Report
51
Earnings of logistics
€ 61 million
Rail and tank
container logistics

Transpetrol, the rail forwarder, recorded a considerable expansion of itsbusiness. Growth was primarily generated by new customers in the mineraloil sector.
The Transwaggon Group had approx. 8,400 goods wagons which werehired out or used in the forwarding business. Business trends in thefinancial year under review varied: while utilisation of covered high-capacity wagons was very good again, flat wagons did not yet record asatisfactory level of utilisation again, although demand picked up.
In tank container logistics, 5,800 units were available for rental and for-warding, an increase of 7% on the previous year. Transport volumes roseto 51,200 transports, up 10% year-on-year. Just under 60% of the busi-ness was settled in Europe, with the remainder implemented on routes toand from overseas destinations and on inner-Asian markets which werecharacterised by very good demand.
In the bulk and special logistics sector turnover declined by 7% year-on-year mainly due to the divestment of industrial plant logistics in 2002.Business trends in the individual sectors were relatively steady. Hence,tank vessels used on inland waterway shipping routes recorded goodutilisation rates and improved freight rates. The tank farms also maintainedtheir high utilisation rates; however, rehandling of stored products declined.The same trend also applied to the distribution of hazardous goods. Theroad cargo sector achieved an improvement on the previous year. Thechemical services sector, in contrast, recorded a drop in its performance,in particular due to its crop protection business which declined as a resultof the dry summer weather.
Pracht Spedition + LogistikIn the German haulage sector, freight volumes gradually picked up againtowards the end of the year. Nevertheless, competition remained fiercedue to existing overcapacities in the market and primarily manifested itselfas price competition. In this overall climate, Pracht managed to increaseits turnover to € 210 million (previous year: € 191 million) as well as earn-ings. This was attributable both to improvements in road transports andan increase in productivity in parcel terminals and warehouse management.
As the logistics division initiated a process of concentration on its corebusiness, Pracht Spedition + Logistik GmbH was sold to the Swiss Kühne & Nagel Group with effect from 1 January 2004.
Management Report Business Trend in the Divisions
52
Bulk and special logistics

Algeco GroupThe economic climate for the mobile buildings rental business, the AlgecoGroup’s core business, was not particularly favourable. Sluggish investmentsin the industrial sector also had an adverse effect on the business. Thishad only a limited effect on the development of turnover which was up1% at € 399 million (previous year: € 394 million). Nevertheless, earningsdeclined. One of the main reasons for this trend was the pressure onmargins in the mobile buildings business due to market developments;another factor impacting earnings were non-recurrent expenses for res-tructuring measures in pallet logistics.
Algeco is the leading supplier of mobile buildings in Europe. In 2003, itoffered approx. 105,000 units to European mobile buildings rental customers,an increase of around 1,100 units on the previous year. In France, the largest market, it offered 55,700 units; in the Southern Europe regionwhich includes Spain, Portugal and Italy, Algeco had 26,300 units and inthe Central Europe sector which covers Germany, Belgium and the CzechRepublic it offered more than 23,100 units.
In 2003, the mobile buildings business accounted for more than 80% of theturnover of the Algeco Group; two thirds of this amount were generatedby the rental business. Overall, volumes in the rental business were in-creased in an environment characterised by fierce competition, whilecapacity utilisation increased. However, the general weakness in the mar-ket impacted prices, with Germany, Portugal and Italy more severelyaffected than France and Spain. Sales of mobile buildings, which accountedfor one third of the business, fell short of the previous year’s levels dueto industrial customers’ low willingness to invest.
Pallet logistics achieved a further expansion of its business. With a stockof 16.4 million pallets, an increase of approx. 10% on the previous year,Algeco operated above all on the French market and the Iberian Peninsu-la. Turnover grew again, albeit more moderately than in the previous yeardue to the Group’s concentration on economically attractive businesstransactions.
Business Trend in the Divisions Management Report
53
Mobile buildings park(in ´000 units)
105
104
103
102
101
100
2001
2002
2003

54
Business in the trading sector was adversely affected by the overall economic climate inseveral regions and industries. The development of turnover and earnings was impairedin particular by weak economic activity in the North American steel sector as well as difficult trading conditions for non-ferrous metals.
Trading Unfavourable economic environment forAMC Group and US steel service business.
The shareholding in the AMC Group was sold in the fourth quarter of2003 and therefore had only to be included in the 2003 consolidatedfinancial statements for a period of ten months. Turnover and earningsgenerated in the trading sector are therefore not fully comparable withthe previous year’s figures.
At € 2.1 billion, turnover generated by the trading sector dropped by 34.7%year-on-year on the basis of an arithmetical comparison. The strongestdecline in turnover was reported by the AMC Group: besides the shorterconsolidation period, the key operational reason was a significant reductionin the trading volume for non-ferrous metals. Currency effects also played arole: adjusted for the conversion of British pounds sterling and US dollarsinto euros, the decline in turnover reported by the sector was hence moremoderate and accounted for approx. 26.5%. Earnings generated by thedivision primarily reflected the difficult economic environment: at € 12 million,they dropped significantly year-on-year.
Trading€ million 2003 2002 Var. %
Turnover 2,056.0 3,150.4 - 34.7AMC Group 1,430.9 2,400.5 - 40.4PNA Group 625.1 749.9 - 16.6Earnings by division (EBTA) 12.2 56.0 - 75.9AMC Group 8.7 24.6 - 64.6PNA Group 3.5 26.0 - 86.5EBITDA1) 30.7 74.1 - 58.6Investments 7.9 25.7 - 69.3Headcount (31 Dec.) 1,104 3,038 - 63.7
1) Earnings before taxes, depreciation, interest and amortisation of goodwill
AMC GroupIn most regions, the companies of the AMC Group continued to operate in adifficult economic environment. Besides the reduction in the consolidationperiod to ten months, this was the main reason why both turnover andearnings fell short of the previous year’s levels to € 1.4 billion and € 9 million respectively.
In the commodities trading sector, Amalgamated Metal Trading Ltd., ringdealing member of the London Metal Exchange, again achieved a good
Earnings of AMC Group
€ 9 million
Earnings of trading
€ 12 million

55
Business Trend in the Divisions Management Report
performance despite a considerable reduction in the trading volume. Incontrast, earnings dropped in physical trading in non-ferrous metals andas a result of the divestment of chemicals trading in the previous year. Inthe distribution and merchanting sector, the Canadian steel service cen-tres of Wilkinson and Debro Steel were adversely affected by weak de-mand, above all in the west. This also affected trading in special chemicals.Overall, the British metal trading companies held their own and achieveda satisfactory performance. In the metal processing sector, business trendsshowed regional variations. While the development of companies in Canadaand the UK fell short of the previous year’s levels, companies in Australiaand New Zealand again improved their performance. Production by theThaisarco tin smelter was below previous year’s volume and therefore didnot manage to maintain earnings at the level recorded in the previousyear, despite an increase in the price of tin.
PNA GroupFollowing the recovery recorded in the previous year, the performance ofthe steel service companies of Preussag North America, Inc. (PNA) declinedin the 2003 financial year. At 1.8 million tons of steel, its sales fell 5%short of the previous year’s volume. Turnover totalled € 0.6 billion, 16.6%down on the previous year. Adjusted for currency effects, however, thedecline in turnover only amounted to 0.4%. Earnings fell to € 4 million,with the Feralloy Group recording the strongest decline.
One of the key reasons for this business trend was sagging demand in thesteel processing industries. Another reason for this intensely competitiveenvironment was the sustained oversupply of the American steel market,which meant that prices and hence also margins were under pressure. Asa result, prices for flat steel, which had risen strongly last year, fell through-out 2003, with prices for sectional steel continuing to be weak.
Following the good performance in the previous year, the unsatisfactorymarket situation primarily affected the Feralloy Group which mainly oper-ates in the north and central west. Here, business was adversely affectedin particular by weak demand from the automotive industry. Delta Steel,with its activities in Texas and Arizona, mainly experienced this weak de-mand in the steel service business, while the production of steel mastscontinued to record relatively stable volumes and prices. Infra-Metals dis-continued its trading business in 2003 and realigned its activities to coversteel services only. For this purpose they opened two new branches inIllinois and Virginia. This realignment of the business incurred start-upcosts which were not completely covered by a positive development inthe existing units in Connecticut, Maryland and Florida.
Earnings of PNA Group
€ 4 million
Steel sales (in mill. tons)
2.00
1.75
1.50
1.25
1.00
0.75
0.50
0.25
0
2001
2002
2003

56
Research and Development New products andbrands. Advanced IT systems for distribution andcustomer services.
In the tourism division, innovation in information technology primarilyfocused on distribution: improved booking systems for travel agency distri-bution and new websites for classical travel products, as well as innovativesystems for modular booking of tours. These innovations enhance theattractiveness of the programmes and will boost the efficiency of workprocesses.
IT systems modernise distribution In the Central Europe sector, the renewal of IRIS, TUI’s booking system,was the key project for travel agency distribution in Germany. With itscompletely revised user interface, IRIS.plus offers a large number of inno-vative and user-friendly functionalities that will provide a single systemfor booking all TUI products as well as active support for travel agencystaff in advising customers. The new system has been gradually introducedinto travel agencies since the end of 2003.
Another newly designed system has been introduced in the customerrelationship area. Based on internet technology, the online complaintsmanagement system ORS III supports customer service staff in obtainingthe relevant information by networking their workplaces with bookingsystems, with the customer data base and with financial accounting systems,besides offering processing and filing functions. This enables to provide afaster and more comprehensive service to customers in the event ofcomplaints and more efficient handling of recourse claims made by touroperators against service providers such as hotels.
The expansion of internet-based distribution channels continued: hoteland car rental offerings from the tui.de website were included on thewebsites of airlines Hapag-Lloyd Express and Hapag-Lloyd Flug. As aresult, holidaymakers interested in low-cost air tickets are also offered acomprehensive range of TUI products in the form of hotel accommodationand car rental at destination. On the basis of cooperation schemes withother internet portals such as yahoo.de or bild.de, holidaymakers maybook TUI tours through these channels, too.
In the Northern Europe sector, TUI UK introduced Genie, the new salessystem, in all Lunn Poly travel agencies. Genie represents a single plat-form combining visual information about destinations and virtual tours of
2003 marked another year in which TUI set the trends with its innovative products, itsincreasing use of new media and its progressive brand policy, anticipating changes incustomers’ demands and needs. State-of-the-art information technology played a vitalrole in this respect, and represented one of the principal areas of innovation.
New booking system IRIS.plus
for travel agencies
Customer relationship
with internet technology
New sales system for TUI UK

57
hotels with answers to all relevant questions such as passport, visa andhealth requirements. Genie is also a booking system that takes usersstep-by-step through the booking process, supporting the work of travelagency and call centre staff. Because of its high functionality, Genie isalso used at the lunnpoly.com website.
Following the commissioning in 2002 of the first module of the Group-widehotel and destinations data base – the Group Contracting System – withinthe Apollo programme, the second module, the Destination Data Base,was added in 2003. The new system will replace existing informationmanagement processes for hotels and destinations: it represents a centralplatform providing all relevant data concerning accommodation offered bythe Group, photos of hotel complexes and information about destinationsto all tour operators. This data base thus creates a uniform data platform,avoids multiple data entry and guarantees up-to-date information.
Following a successful launch by TUI UK in the course of the year, the largeunits in Germany and France followed suit and introduced PEPSY, the e-procurement system designed for Group-wide use. PEPSY centralises andautomates the Group’s supplier relationships and substantially helps toleverage synergies by pooling purchasing volumes. The Netherlands andBelgium will be the next countries to join the system, with the remainingmarkets joining step-by-step thereafter.
New brands and productsAs far as brands and products are concerned, customer wishes and markettrends were identified and innovative products were launched on themarket. In TUI Golf, an innovative programme was created for the discrimi-nating holidaymaker in cooperation with golf associations and golf courseoperators: the programme is aimed at both newcomers and experiencedgolfers and comprises the GolferSPass as well as a number of additionaland attractive special rates for golf-lovers. TUI launched several newofferings, including at its website tui.de, to respond to the trend towardsmodular tours. Customers may put together their own travel package fromamong the various elements of a tour such as transport, accommodationand car rental at the destination. Airtours took a further step in launchingits new summer catalogue by offering its exclusive hotel and flight pro-grammes at current prices. In the last minute segment, Discount Travelwas introduced as a new brand which primarily markets capacities in lowseason. This completed the brand portfolio of German tour operators inthis market segment.
Research and Development Management Report
Central data base for hotel
and destination information
Innovative products

A significant innovation in France was the launch of the new brand TUIFrance. With this brand, Nouvelles Frontières aims to target new groupsof customers with a focus on top-quality products and a preference forbeach holidays in Mediterranean regions. Here, TUI concluded a strategicpartnership with the Accor Group in France within which tour operatorTUI France will offer accommodation in Accor hotels and the two partieswill cooperate on distribution.
Logistics invests in IT systems In the logistics division, Hapag-Lloyd dedicated the bulk of its researchand development activities in 2003 to an expansion of information techno-logy, in particular freight information systems. Hapag-Lloyd ContainerLinie focused its IT investment on e-business. The aim of these projectsis to handle the entire exchange of data and information with customersand suppliers electronically. This will lead to a considerable reduction inmanual operations for all those involved in the transport chain and willenhance the quality of information. Data is exchanged via Hapag-Lloyd’swebsite which has been designed as a virtual office for this purpose. Theinternet portal Inttra, in which Hapag-Lloyd helds a participation, can alsobe used. Hapag-Lloyd provides active support to its customers in imple-menting their own projects via both of these applications.
A particular challenge for world-wide container shipping was posed bythe new US regulations under which all relevant transport data – goodsdescription, place of origin, place of destination as well as client andrecipient – must be electronically transmitted to US Customs authorities24 hours prior to loading in the overseas harbour. With its comprehensiveinformation systems already installed and vast corporate expertise, Hapag-Lloyd was one of the first shipping lines in the world to quickly and com-prehensively implement these demanding security requirements of theUS Customs authorities.
Another focus of Hapag-Lloyd’s investment was business intelligence.Compass, its established data warehouse system, was expanded to includea number of additional functionalities. As a result, direct data access hasnow also been made available to operational departments, besides market-ing and distribution, providing them with assistance for decision-making,e.g. in preliminary costing.
Management Report Research and Development
58
e-business in logistics
New information systems
required by US regulations
TUI France

59
Risk Management Proven systems for control andmanagement of risks in place.
TUI’s risk management policy is geared to its aim of steadily and persistentlyenhancing the Group’s corporate value. The companies of the TUI Groupoccupy leading positions in their respective markets both in tourism andlogistics. Their attractive product and services portfolios offer numerousopportunities for generating good returns and enhancing the value of thebusiness. In order to exploit these business opportunities to the maximum,the risks associated with such operations must be borne in an appropriateand limited way. The object of the risk management system is thereforeto identify and assess these risks and limit them to such an extent thatthe economic benefit outweighs the risk.
Risk managementTUI AG’s Executive Board has set out guidelines incorporating the essentialelements of the risk management system applicable to all Group companies,and has installed monitoring and control systems to measure, assess andcontrol the development of business and related risks. Responsibility forthe handling of business risks lies with the management of the operationalsectors, with control functions resting with the relevant higher manage-ment level.
The Executive Board uses a multi-stage integrated planning and controlsystem to manage the Group. On the basis of monthly reports, deviationsfrom projected business developments are identified and analysed by theExecutive Board, so that performance risks are quickly recognised andmeasures can be taken to handle them. The Supervisory Board is involvedin this process by means of regular quarterly reports as well as reports atits regular meetings.
Since entry into force of the German Act on Corporate Supervision andTransparency (KonTraG) in 1998, additional systems have been establishedfor the early identification of risks threatening the existence of companies.By means of regular and specific reports drawn up under these systems,potential risks are identified, assessed on the basis of uniform parametersand summarised in an overall report. These reports have not identifiedany specific risks threatening the continued existence of individual Groupcompanies or of the entire Group, either during the 2003 financial year orat year-end.
The TUI Group operates in various divisions and regions on a worldwide scale. In this,the Group is also exposed to risks of varying severity, depending on the type of business.They may result from the Group’s own entrepreneurial activity or be caused by externalfactors. In order to identify and actively control these risks, the Group has introducedGroup-wide reporting and control systems.
Guidelines
Planning and control systems
Risk reporting

60
Management Report Risik Management
The methods and systems used in risk management and the frequencyof controls vary, depending on the scope and scale of risk. They are con-tinuously checked, modified in line with the results of these reviews andadjusted to changing business environments. In accordance with the pro-visions of the German Act on Corporate Supervision and Transparency(KonTraG), the systems for early identification of risks were audited bythe auditors in the course of the audit of the 2003 annual financial state-ments. This audit was an essential element of the key audit areas com-missioned by the Audit Committee. The auditors found that the auditedsystems were suitable for achieving the stated purposes.
Auditing departments have been set up within TUI AG and Group companiesand their activities support the risk management process. These depart-ments examine transactions and operational processes both on a case-by-case basis and in the framework of audit plans, checking them for adequacy,security and efficiency.
Risk management also encompasses the transfer of risks to third parties.Hence, damages and liability risks from day-to-day business operations arecovered by insurance policies as far as possible. The extent of the insurancecover is regularly reviewed and adjusted where necessary. Although insurancepolicies do not offer complete protection, it is nevertheless fair to saythat the impact of insurable damages on the Group’s financial situation,earnings and liquidity will not threaten its very existence.
The Group’s financial department operates a central financing managementsystem that executes all essential transactions on the financial market,with trading, settlement and controlling organised separately. The individualfinancing categories and rules as well as the limits for transactions andrisk items are defined by guidelines. In order to limit risks arising fromchanges in market prices, exchange or interest rates for underlying trans-actions, such transactions are hedged. Price risks from fuel purchasetransactions are thus centrally hedged. The Group also engages in currencyhedging transactions, with the US dollar and British pound sterling beingthe most important foreign currencies. Risks arising from changes in interestrates are hedged by means of derivative interest rate instruments. This typeof business is only concluded with banks and business partners with first-rate financial standing to avoid any risk of default. Detailed informationabout the scope of financial transactions at the balance sheet date, contin-gent liabilities and other financial liabilities of the TUI Group is providedin the consolidated financial statements.
Development of systems
Insurances
Central financing management

61
Business risksThe individual divisions and regions operated by the TUI Group entail different kinds of risks with a varying impact on the Group’s economicperformance. The intensification of competition leads to an increase particularly in market risks in many sectors. They represent a substantialrisk for the future development of business. Overall, production processesin the companies are well organised and controlled and therefore containless risks.
In the tourism division, the general economic environment and social factors have an impact on consumer behaviour and therefore on holiday-makers’ booking behaviour. Political developments, natural disasters orterrorist attacks may affect holidaymakers’ decisions and impair the devel-opment of business in individual countries of destination.
An essential business risk in tourism relates to the seasonal planning offlight and hotel capacity. In order to plan ahead, tour operators have toforecast demand and anticipate trends in holiday types and destinations.The business model operated by TUI is well suited to counter the ensuingrisks. The Group’s own airline and hotel capacity is considerably lowerthan the number of customers handled by its tour operators. This ena-bles the Group to keep its product portfolio flexible by procuring third-party flight capacity and hotel beds and concluding corresponding con-tractual agreements. Moreover, the Group’s presence in all major Europe-an markets allows it to limit the impact of regional fluctuations indemand on capacity utilisation in the destinations.
The key risks to the development of business in container shipping arisefrom external factors. The development of world trade and investmentcycles in the shipping sector may lead to shipping capacity overhangs andthus adversely affect marine freight rates. In the individual shipping areas,cyclical fluctuations in regional economic activity may result in imbalancesin transport volumes within the individual shipping areas. This risk typical tothe industry is countered by means of an efficient capacity control system.Other essential factors limiting the business risks are the operation ofEast-West routes, i.e. shipping areas with long-term attractiveness, andmembership of the Grand Alliance, the world’s largest liner shipping con-sortium.
Risik Management Management Report
Risks in tourism
Risks in container shipping

62
Prospects Stronger economic growth expected.Varying forecasts by regions and business sectors.
In the second half of 2003, most industrialised countries reported a con-siderable increase in economic momentum. Economic researchers expectthis trend to continue, based on sustained expansionary monetary policyand low interest rates. They expect that the value of both the euro andthe yen will cease to rise against the US dollar. Based on these assump-tions, prices should rise only moderately. There is a realistic prospect offull economic recovery: after the difficulties of the past few years, compa-nies are now well prepared and report increases in profits that willenhance their financial flexibility.
The expected recovery will primarily be based on sustained, strongexpansion in the USA but also on persistently positive development inJapan and South East Asia. For western industrialised countries, economicimpetus is expected to stem primarily from the momentum for growth inthe emerging Asian economies.
Development of GDPVariance % 2003 2004
Eurozone 0.5 2.1Germany - 0.1 1.8United Kingdom 2.0 2.8France 0.2 2.0USA 3.1 4.1Japan 2.7 2.0Emerging Asian economies 4.8 3.0
Source: Institut für Weltwirtschaft, Kiel, in: Die Weltwirtschaft 2003, vol. 4
The development of tourism in 2004 will depend on greater confidenceof consumers in the economic future and their willingness to increasespending. Assuming that no major political events will create uncertainty,the Swiss economic researchers at Prognos AG expect European touriststo return to their past travelling behaviour in terms of both travellingintensity and frequency. Prognos thus expects Europe’s key source mar-kets to see a gross increase in travel spending of 5% annually over the nexttwo years, followed by 3 to 4% annually for the period to 2010.
As far as shipping is concerned, global container transport is expected to continue to grow faster than world trade. Global Insight forecasts an
Since the autumn of last year, perspectives for world economic development in 2004have increasingly been assessed as positive. In the absence of any major geopoliticaldisturbance, TUI will benefit from an upturn in the consumption climate in its tourismdivision and an expansion of worldwide trade in its logistics division.
Prospects for tourism
Prospects for shipping

63
approx. 9% growth in transport volumes for 2004. Until 2006 internatio-nal container transports are expected to increase by approx. 20%. How-ever, shipping capacities are also expected to grow within this period.
TourismFollowing the difficult 2003 financial year, the objective is to increase theprofitability of the tourism business substantially and consistently takeadvantage of the growth potential of existing business areas and of newbusiness models. The results of the cost-containment programmes imple-mented in 2002 and 2003 have paved the way for this.
In 2004, the recovery of the economic climate should generate a 3 to 5%growth in the traditional market for package tours in the various sourcemarkets. Additional volume will be created by the dynamic growth of thenew market segment of so-called modular packaging, enabling customersto book individual components of a tour or to combine them to suit theirindividual needs. Moreover, this market segment is characterised bystrong direct sales which account for a large share of this business.
TUI prepared early on for changes in consumer behaviour and launchednew products and distribution channels such as web-based booking systems. The Group is also developing the flight and hotel sectors furtherto respond to and set the trend towards individualised and flexible tourson the one hand and price-sensitive travelling on the other. Besides con-solidating the European network in the traditional tour operating busi-ness and tapping the market for modular tours in Europe, TUI is enteringgrowth markets such as China, Russia and emerging markets in EasternEuropean countries.
The consolidation of activities in Europe included the divestment of the10% indirect shareholding in the Italian Alpitour Group. TUI exercised itscontractually agreed put option. The transaction also included the divest-ment of the 50% share in the Italian Neos airline with its fleet of threeaircraft. Despite the return of the Alpitour shareholding to its partnerIFIL, TUI and Alpitour continue the successful cooperation in the hotelsector and in incoming services in Italy.
Central Europe Tour operators in the Central Europe source markets expect the marketvolume for package tours in 2004 to grow to a level matching or exceedinglevels prior to the decline of 2003. New forms of travelling and direct selling channels are expected to create additional growth potential.
Prospects Management Report
Package tours and
modular packaging
New products and
distribution channels
Divestment of participation
in Alpitour

64
In Germany, TUI Deutschland’s tour operators have initiated a set ofmeasures to respond to last year’s market and business trends. These include a reduction in the number of hotels on offer, and a reduction inbrochure prices and early booking discounts. These measures are aimedat limiting discounts offered for selling capacity and hence raise the ave-rage price level. On the basis of enhanced purchasing conditions and areduction in personnel and materials costs, margins should be driven upto exceed the previous year’s level.
In the German charter market, the number of available seats will decreasein 2004 since a competitor has withdrawn from the market and severalothers have reduced their capacities. Hapag-Lloyd Flug is planning to usethe same fleet size as last year, i.e. 34 aircraft, for the 2004 summer sea-son. With the launch of the 2004 summer flight schedule, Hapag-LloydExpress will also operate on routes to tourism destinations in close coordi-nation with TUI Deutschland’s tour operators.
Following last year’s rapid start-up phase, Hapag-Lloyd Express will oper-ate a fleet of eleven aircraft departing from Cologne, Hanover and Stutt-gart airports. On the basis of a flight schedule designed to serve com-mercially attractive destinations, the company is expected to break evenin the second half of 2004.
In Switzerland, signs of an onset of economic recovery are increasing onthe travel market. TUI Suisse therefore expects moderate growth in thetraditional tour operating business and in direct selling operations. Themodular tour business, an important business area for Switzerland, showsgood prospects for stronger growth. Accordingly, a new brand called FlexTravel was successfully launched in 2003.
In March 2004, TUI and Kuoni resolved to dissolve their joint venture in Switzerland, established in October 1999. As a result, TUI now againholds 100% of the shares in TUI (Suisse) Holding AG. Even without anyparticipation in equity, TUI Suisse and Kuoni Reisen Schweiz intend tocontinue the cooperation in the hotel, flight and distribution sectors.
The volume of the travel market is also expected to increase again inAustria, although the economic framework is only gradually improving.Competition will continue to be intense as new flight capacities are beingpressed onto the market. Having successfully entered the Hungarian mar-ket, TUI Austria is expanding its business in Slovenia and Slovakia, twomarkets that will gain additional momentum from accession to the EU inthe summer of 2004.
Management Report Prospects
Germany
Hapag-Lloyd Flug
Hapag-Lloyd Express
Switzerland
Austria

65
Northern EuropeThe positive development of the economic environment offers scope foran increase in volumes on the travel markets in the UK and the Nordiccountries. However, all source markets of the Northern Europe sector arealso affected by structural change in demand, above all the trend towardsdirect distribution channels, modular bookings and low-cost flying. TUI Northern Europe is strengthening its own activities in these areas to respond to this development.
In the UK, TUI UK expects volumes to grow on the previous year’s levels,with growth primarily generated in the winter season, and business in thesummer season expected to be stable. As far as destinations are concerned,long-haul tours will benefit from the strong euro and see above-averagegrowth. Distribution of tour operating products through Group-ownedtravel agencies continues to be intensified. Alongside these trends, directdistribution via the web and call centres is gaining in importance and isbeing expanded.
Britannia Airways UK almost exclusively carries passengers of Group-owned tour operators and will start the 2004 summer season with a fleetof 31 aircraft. Additional volume is to be generated by expanding theseat-only business. To this end, the new Thomsonfly brand has beenlaunched which uses the operational platform of Britannia. In the sum-mer of 2004 it will serve routes from the British Midlands predominantlyto tourist destinations with four additional aircraft. In this context, itacquired a majority shareholding in Coventry airport.
Prospects for the Irish travel market are somewhat less positive. Perspec-tives for 2004 are affected by weak economic activity, increasing taxesand considerable expansion of the offerings of low-cost carriers. TUI Ire-land is therefore preparing for a decline in the tour operating businessand has adjusted its capacities accordingly.
The economic climate is improving in the Nordic countries, a trend thatwill also benefit the travel market. With the successful restructuring of itsbusiness and the resulting significant improvement in its programmesand cost base, TUI Nordic is well positioned for the expected recovery ofthe economy.
Britannia Airways Nordic will operate six aircraft in the 2004 summerseason. It expects the tour operating business to pick up again and henceanticipates an increase in passenger volumes and an improvement in loadfactors.
Prospects Management Report
UK
Britannia UK
Ireland
Nordic countries
Britannia Nordic

66
Western EuropeGrowth forecasts for the Western Europe source markets vary. However,all tour operators expect to benefit disproportionately from the recoveryin demand due to their strong market positions.
In France, Nouvelles Frontières is tapping new market segments bylaunching new products such as land-based tours and event tours. TUIFrance, the new brand offering package tours in the four-star categorywith a special focus on beach holidays, is preparing for its first summerseason. The expansion of distribution in southern and western Franceand the increase in direct selling activities will enhance sales volume.
Corsair starts the 2004 summer season with a fleet of ten aircraft. Aspart of its partial fleet replacement programme, two Boeing 747-300sand the Boeing 767 temporarily leased from Britannia are being replacedby three Boeing 747-400s. Growth in passenger volumes is mainly expectedin the seat-only business for flight operations to the French overseas territories.
In the Netherlands, TUI Nederland is pushing ahead the stronger integra-tion of distribution and tour operating and is repositioning its key brandsArke and Holland International to overcome the previous year’s weak per-formance. Direct tour operator Kras and web-based bookings are expectedto generate continued strong growth.
In Belgium, TUI Belgium’s tour operators expect their growth rates tooutperform the market. These expectations are primarily underpinned by the positive development of direct selling activities under the Sunjetsbrand and the successful seat-only business of Jetonly.
Following the insolvency of the Belgian airline Sobelair, which in the pastprovided transport services for the majority of TUI Belgium’s tour opera-tor customers, a new Group-owned airline called TUI Airlines Belgium wasestablished: It will operate a fleet of up to six aircraft in the 2004 sum-mer season.
DestinationsIncoming agencies expect a recovery of business in the source marketsand a corresponding increase in the number of guests catered for, in par-ticular in the Islamic countries impacted by the Iraq conflict in the pre-vious year. The Olympic Games in Greece and the European FootballChampionship in Portugal will provide opportunities for additional busi-ness in the summer.
Management Report Prospects
France
Corsair
Netherlands
Belgium
Incoming agencies

67
The hotel companies managed under TUI Hotels & Resorts expect thenumber of overnight stays to increase year-on-year. This forecast is primarily based on the increase in the bedstock available in the 2004 summer season. Four hotels opened in the course of the previous yearwill be available for the entire season for the first time. In 2004, an addi-tional hotel will be opened in Greece, another in Jamaica and a newRobinson Club in Austria. Occupancy rates are expected to be boosted byan increase in the number of guests from TUI tour operators, with hotelsin Europe benefiting from additional volume from an increase in the num-ber of guests from local markets and hotels in the Caribbean benefitingfrom more guests from the USA. New distribution channels are beingtapped to underpin this expectation.
The expansion of the hotel portfolio will continue. The Group is planningto concentrate on the profitable area of hotel participations with its twelve current hotel brands. In this context, the shareholdings in the AnfiGroup, offering time share schemes in Gran Canaria, will be sold.
LogisticsIn 2004, TUI AG will take further significant strategic measures to com-plete the realignment of the Group which commenced at the end of 1997.Accordingly, the logistics activities which have hitherto been pooled underHapag-Lloyd AG will concentrate on shipping. Hapag-Lloyd, with the con-tainer line and the cruises line, will then go public as a pure shipping com-pany. The IPO, which will entail the placement of probably around onethird of the shares, has been planned for the second half of 2004.
The Group will divest the remaining participations held by the logisticsdivision. These include VTG-Lehnkering AG with its two sectors of rail andtank container logistics and bulk and special logistics as well as the 66.7%share in the French Algeco Group operating in the mobile buildings rentalbusiness. The divestment process for VTG-Lehnkering’s bulk and speciallogistics sector has already reached an advanced stage. Pracht Spedition +Logistik GmbH has already been sold to the Swiss Kühne & Nagel Groupwith effect from 1 January 2004.
International container logistics will remain a growth market in 2004.Hapag-Lloyd Container Linie will grow at least as much as the market inthe current favourable economic environment. In 2004, it will commissiontwo additional container ships with a capacity of 6,750 standard containers(TEU). With this capacity expansion and membership of the Grand Alliance,the world’s largest liner shipping consortium, it is thus well prepared forfurther growth. The expected growth in transport volumes will be handled
Prospects Management Report
Hotel companies
Strategic restructuring
of logistics
Hapag-Lloyd Container Linie

Management Report Prospects
68
with approximately the same manpower, which means that productivitywill again rise. Freight rates denominated in US dollars are expected to goup again on the basis of good levels of demand and balanced shippingcapacities on the key east-west shipping routes. However, this develop-ment might be impaired by a weak US dollar against the euro.
Potential on the German cruise market has not yet been fully exploited.The premium segment in particular offers scope for additional growth.With its four cruise ships, including the five-star-plus ship Europe, Hapag-Lloyd Kreuzfahrten is well prepared for the expected growth in businessvolume in 2004.
The chemical and mineral oil industry is only gradually feeling the econo-mic upswing in Europe. In Germany, the Chemical Industry Federationexpects only moderate growth of 1.5% for 2004. In addition the sector ismarked by structural change. VTG-Lehnkering has launched a fleetmodernisation initiative to counter this trend in the rail and tank contai-ner logistics sector and continues to expand its Eastern European busi-ness.
In the mobile buildings business, industrial customers have initially showna relatively restrained propensity to invest in 2004; demand is not expect-ed to pick up before the second half of the year. The Algeco Group there-fore expects a stable business trend in its key markets France, Spain andGermany. Its well-proven capacity management system enables it to res-pond flexibly to market fluctuations.
TradingFollowing the divestment of the shares in the AMC Group, the tradingsector currently only comprises the US steel service companies of thePNA Group. As part of the divestment programme which has almost beencompleted, these companies will also be divested at some future time.For 2004, business is expected to pick up, although the steel markets inthe USA remain unstable and setbacks cannot be ruled out.
Hapag-Lloyd Kreuzfahrten
VTG-Lehnkering Group
Algeco Group

69
Developments in 2004 The new 2004 financial year has started off well. Although the economyis only gradually gaining momentum in the industrialised countries andconsumer confidence has not yet been fully restored, in particular in Germany, business performance in the tourism and logistics divisions hasimproved year-on-year.
In the tourism business, a growth trend can be observed for the 2003/2004winter season, amounting to around 6% both in terms of volume and bookedturnover at Group level at the end of February. The situation varied inindividual source markets. While the UK and France recorded buoyantbusiness, Germany also recorded positive albeit slower growth. The sametrend applies for bookings for the 2004 summer season so far. After agood start in sales, followed by a weakness in demand in the pre-Christ-mas period, booked turnover for the Group has grown continuously eversince and matched the previous year’s level at the end of February. If thistrend continues and no political problems occur, the tourism division canlook ahead with confidence to the summer season and thus to the 2004financial year.
The logistics division, too, has seen a promising start to the 2004 financialyear. Container shipping in particular has managed to build on last year’spositive business trend. Rail logistics and the mobile buildings businesshave shown steady trends.
Prospects for the 2004 financial year are more favourable than last year.If the economic setting improves as generally expected, this will benefitthe tourism and logistics divisions. As far as costs are concerned, thecompanies have implemented comprehensive measures over the past twoyears, preparing the ground for an above-average share in the recovery.
Prospects Management Report


Tapping opportunities to enjoy life. Developing innovative products to make it happen. World of TUI turns a holidayinto an experience. Individually tailoredholidays give our customers the time to do what they want, a time to remember:World of TUI is a source of inspiration.
Enjoying more.

Enjoying the ebb and flow. From all-in relaxation to an all-outthirst for adventure, we cater for every taste with an attractiverange of products, contemporary and compelling: in 2003, World of TUI won over a host of new guests. Success breeds success.


Enjoying give and take. We aim to stay in touch with our customers to find out how happy they are with our service, or about room for improvement. With customer surveys andinformation circulars. Building holidays around the customer.


Enjoying mix and match. ‘Dream holiday’ means different things todifferent people. World of TUI offers a wealth of ways to put togetherthe perfect package, that goes far beyond windsurfing or walks alongthe beach. There’s nothing more rewarding than diversity.

78
80 Human Resources84 Environmental Protection

79
Other Information bResponsibility foremployees and society.bPartnershipand cooperation.bCertification ofenvironmental management.

80
Human Resources Responsibility for employees and society. Decline in headcount due to structuralchanges.
Customer satisfaction and customer retention in the service business dependto a large extent on personal contact with our employees. Our highlymotivated, skilled employees with their strong sense of commitment, arethe key to our Group’s economic performance. A service-oriented approachas well as sound initial and further training represent an essential part ofour HR activities, which in particular promote innovation and creativity.
Initial, ongoing and further trainingTraining programmes for junior in-house staff and sound initial trainingplay a major role in securing the Group’s competitiveness. In Germanymore than 400 new apprentices were recruited in 2003, while the Groupas a whole offered training and qualification schemes to more than 1,400young people. At more than 7%, the proportion of staff in training thusremained at the previous year’s high level. By means of our extensive internaltraining and further training schemes as well as additional external pro-grammes conveying specific training contents, the Group continued todevelop and secure the level of training as well as the competence of itsemployees.
Economic development in the 2003 financial year meant that the headcounthad to be reduced in several sectors. As a result, some of the companiestraining young apprentices were not able to offer permanent employmentto all apprentices completing their apprenticeship in 2003. Nonetheless,in order to offer these young people an opportunity, a campaign entitled”Prospects for junior staff” was launched throughout the Group: as a result,the young apprentices who had not been offered permanent employmentwere offered a six-month contract. Thanks to this campaign, many youngemployees who had finished their apprenticeship received a temporarycontract in one of the Group companies. In a number of cases these con-tracts were subsequently replaced by permanent employment contracts.
Recruiting and developing skilled and managerial staff is one of the keytasks of HR. To this end, TUI runs special programmes to promote execu-tives and junior managers. For several years now, a multi-stage modularprogramme has been used to identify and develop management potential.In addition, a flexible qualifications programme has been introduced toprepare our employees specifically for the international job requirementsin our Group.
TUI’s entrepreneurial activity aims to reconcile economic objectives with social and ecological concerns. Social responsibility is therefore one of the guiding principles ofthe Group’s corporate management, with societal aspects also taken into account.
Junior staff development
and training
Prospects for junior staff
Job promotion

81
The Group has also introduced new learning formats with the internet-based e-learning programme TUI Genius. The programme enables ouremployees to gain many different skills and decide for themselves when,where and how fast they want to learn. Classical training formats such asseminars and discussion forums continue to promote the gaining and theexchange of knowledge and experience.
Social measuresOn the basis of new legal regulations in Germany, TUI offers several differ-ent types of private pension scheme, which have increasingly been takenup by the employees. The majority of the employees have chosen theoption of using a pension fund to convert part of their pay into a pension.Just under 800 such contracts were concluded by the end of 2003. Theprivate pension scheme supported by special premiums ranked second,with a total of around 200 contracts signed.
The cost-cutting measures required to secure the Group’s future alsoaffected the HR sector. In the German companies, some of the measureswere implemented in a socially compatible way by means of part-timeemployment schemes for older workers and schemes to bring the paymentof old-age pensions forward. Part-time schemes for older workers metwith a good acceptance among the employees, and as a result more than200 part-time work contracts for older workers had been concluded bythe end of 2003.
Current working time schemes offer a wide variety of options to reconcileour employees’ professional and private interests and contribute to jobsecurity. Examples to be mentioned include the use of telework, specialpart-time schemes based on monthly or annual working hours, as well asa reduction in working hours. These measures have helped the Group toachieve several cost containment goals without having to initiate a majorcutback in employment.
Company managements within the TUI Group attach particular importanceto integrating people with disabilities into the work process. To this end,they agreed with the Group Works Council to launch comprehensive mea-sures as set out in the integration agreement concluded at the end of 2002.With a view to increasing the proportion of disabled people in the overallworkforce, cooperation with representatives of our disabled employeesand with job centres has been intensified.
Our health and safety promotion activities continued on the basis of theintegrated health management system. Cornerstones of the system are
Human Resources Other Information
e-learning with TUI Genius
Private pension schemes
New working time schemes
Social responsibility
Health and safety

82
preventative occupational medicine and prevention based on employeeinvolvement. One of the key objectives is to prevent accidents and avoidhealth hazards for our employees as a contribution to improving theirquality of life.
In Germany, employees can join TUI’s company health insurance funds tocover against illnesses: with their attractive service portfolio, these fundsagain attracted many new members. The number of policyholders roseyear-on-year by approx. 3,000 to around 60,000. In 2003, the companyhealth insurance funds again managed to maintain their rate of contributionat 12.9%.
Employee representatives within the GroupBoth national and international workers’ representation schemes exist atvarious levels within the Group. The Executive Board and the managementcooperated constructively and in a spirit of trust with these bodies bothat Group level and in the companies. As a result, they managed to findjoint solutions taking account of the interests of employees and manage-ment in a fair and balanced way, in particular with regard to the reductionin the headcount which became necessary in the completed financial year.
Supplementing the statutory employee representation bodies to be set upunder the relevant national legislation, TUI’s Euopean Forum comprises80 members from 16 European states. The Forum was established asearly as 1995 and makes an important contribution to the transparencyof entrepreneurial decisions and the integration of different nationalitieswithin the Group. The main topics of discussion at its 2003 meeting werethe future orientation of the TUI Group and current issues affectingemployees across national borders.
Change in personnel structureThe Group employed 64,257 employees as at the end of the 2003 financialyear, down around 9% on the previous year. Besides reductions in theworkforce due to restructuring and cost-cutting programmes within thetourism division, this was primarily due to the divestments in the energysector and the trading sector. This has also changed the Group’s personnelstructure. Hence, the proportion of employees working in the tourismdivision rose to 81%, while around 14% of our employees worked in thelogistics division and 5% in other sectors at the balance sheet date.
In the tourism division, the headcount dropped by 6% to 51,708. Thedecline primarily affected the source markets, and was mainly attributableto the restructuring of distribution and tour operation in the Central and
Other Information Human Resources
Health insurance plans
TUI European Forum
Personnel by divisions
Tourism 81%
Logistics 14%
Other 3%
Trading 2%

83
Northern Europe sector and to structural changes within the NouvellesFrontières Group in the Western Europe sector. Also the destinationsrecorded a decrease in the headcount, especially in the hotel companies.Despite the increase in business volume in container shipping, the logis-tics division did not record a major change in headcount. Other sectorsreported a total reduction of around 2,400 employees attributable to thedivestment of the energy sector and the AMC Group.
Personnel by divisions31 Dec 2003 31 Dec 2002 Var. %
Tourism 51,708 55,013 - 6.0Central Europe 9,391 9,744 - 3.6Northern Europe 18,033 18,732 - 3.7Western Europe 6,521 7,822 - 16.6Destinations 12,896 13,787 - 6.5Other tourism 4,867 4,928 - 1.2Logistics 9,235 9,307 - 0.8Shipping 3,897 3,761 + 3.6Logistics 5,338 5,546 - 3.8Other sectors 3,314 5,979 - 44.6Trading 1,104 3,038 - 63.7Divestments – 681 –Central operations 2,210 2,260 - 2.2Total 64,257 70,299 - 8.6
The decline in the headcount affected domestic and foreign companies toroughly the same extent. As a consequence, the proportion of employeesworking abroad did not change much, remaining at 71%. In regional terms,employment focused on Europe: 29% of all Group employees worked in Germany, 25% in the UK, 12% in Spain, 7% in France and 7% in theBenelux countries, with the Nordic countries accounting for 3%.
Personnel by countries31 Dec 2003 31 Dec 2002 Var. %
Germany 18,860 20,117 - 6.2UK/Ireland 15,989 17,188 - 7.0Nordic countries 1,956 2,220 - 11.9France/Benelux countries 8,921 10,199 - 12.5Spain 8,008 7,673 + 4.4Rest of Europe 5,237 6,508 - 19.5Americas 2,591 3,402 - 23.8Rest of World 2,695 2,992 - 9.9Total 64,257 70,299 - 8.6
Human Resources Other Information

84
Environmental Protection Partnership and coopera-tion. Certification for environmental management.
The Group’s environmental activities apply to all providers in the tourismvalue chain, extending from travel agencies to tour operators and transportright up to hotels in the holiday destinations. These activities are supportedby the Group’s central environmental management, which reports directlyto the Executive Board, and supplemented by overarching operative andstrategic measures. The requirements of investors who base their invest-ment decisions also on sustainability criteria are increasingly taken intoaccount. The Group’s environmental activities are comprehensively detailedon the redesigned website at www.tui-environment.com, which providesup-to-date information about new projects and developments.
ISO 14001 certificationOne essential measure for continually improving environmental behaviouramong providers in the tourism and logistics divisions and for maintainingit at a high level long-term, is the certification of their environmentalmanagement systems in accordance with international standards. Thistherefore was a particular focus of the activities of TUI’s central environ-mental management. As a result, a large number of Group companiesstarted as early as 2003 to base their environmental management systemson ISO 14001, the internationally recognised environmental standard ofthe International Organization for Standardization.
In 2003, tour operator TUI Deutschland completed certification of itsenvironmental management system in accordance with ISO 14001, havingmade the standard an integral part of its quality management system.The audits also covered holiday brochure information on environmentalcompatibility, which is of major importance in communication with custom-ers about environmental issues in the holiday regions.
In the hotel sector, Robinson continued the certification of its club facilitiesunder ISO 14001: following completion of certification of all RobinsonClubs in Turkey and Germany in 2002, the three Spanish clubs of CalaSerena, Jandia Playa and Esquinzo Playa followed suit in 2003. Moreover,Robinson Club Ampflwang was awarded the Austrian Environmental Labelfor Tourism Facilities. The internal environmental standards equally apply-ing to all clubs were developed further and expanded to include a numberof additional aspects.
An intact environment and resource conservation are essential prerequisites for sustainabledevelopment in tourism. It is therefore indispensable for TUI to incorporate ecological and social objectives into its economic objectives if its economic success is to continue.
www.tui-environment.com
Tour operators
Hotels

Environmental Protection Other Information
85
The Spanish hotel company Grupotel recorded substantial progress ininstalling environmental management systems. Starting with GrupotelValparaíso Palace in Majorca, the first certification schemes under ISO14001 are scheduled for 2004.
Grecotel, the leading hotel chain in Greece, also introduced environmentalmanagement systems in all its hotels in the 2003 financial year and willfully align these systems with ISO 14001 standards in 2004. Grecotel PellaBeach is the first hotel to have completed the environmental audit andthe pre-audit for certification. The experience gained in this process is nowbeing systematically transferred to all other hotels of the group.
The Nordotel Group hotels continued with the introduction of environ-mental management systems according to the European Union EMASstandard. The certification process is now commencing and the first certifi-cates are expected to be awarded in 2005.
The Spanish RIU hotel group implemented an environmental status analysisof all RIU hotels in Majorca in conjunction with the Universidad de les IllesBalears and cooperated with INESE, the Institute for Ecological Studies, ina research project on waste management systems in Majorca. The resultsof the two projects were used to optimise the internal environmentalmanagement system of the RIU Group.
Besides the hotels, the incoming agencies also stepped up their environ-mental activities in the destinations. Hence Aeolos Travel had its Cyprustransport division certified under ISO 14001 for the first time in 2003. InSpain, TUI España started to establish an integrated environmentalmanagement system. Under this system, an environmental officer willcoordinate environmental activities in the individual holiday regions andcooperation with local authorities.
In the logistics division in 2003, Hapag-Lloyd Container Linie had its envi-ronmental management system certified under the ISO 14001 environmen-tal standard and ISO 9001, the new quality standard. The audit covered allservices along the transport chain, from sender to recipient. An essentialelement of the system are solutions in pre-carriage and on-carriagemovements with seaports in cooperation with the customers to provideenvironmentally friendly carriers such as rail, inland waterway vessels andfeeders in preference to road transport.
Destinations
Logistics

86
Other Information Environmental Protection
Conservation of resources and climate protection At the First International Conference on Climate Change of the WorldTourism Organization (WTO) held on Djerba, TUI presented its climateprotection measures to international tourism and climate experts andcontributed to the wording of the climate policy goals in the WTO DjerbaDeclaration. The focus was on climate change in the destinations and thereduction in CO2 emissions by means of energy saving measures by allproviders in the tourism chain.
For the Group’s airlines, TUI’s central airline management introduced asystematic environmental monitoring system and continued the develop-ment of environmental standards, which are already at a high level. In theoperational area, the focus was on resource conservation, and this hadalso a positive impact on earnings due to the resulting cost reductions. In2003, Hapag-Lloyd Flug and Britannia Airways continued the programmeslaunched in previous years which have already produced lasting resultswith regard to the efficiency of flight operations and technology. Besidesthe cut in aircraft fuel consumption, these positive results also include asubstantial reduction in aircraft noise, achieved with the use of a modernaircraft fleet.
TUI’s environmental protection initiatives in the destinations include climateprotection via the use of renewable energies. In Sarigerme Park, an Iberotelfacility which is also a pioneer in terms of ISO 14001 certification, theInstitute for Solar Research of the German Aerospace Centre (DLR) starteda research project. The Sarigerme Energy Group of Turkey, co-founded by the TUI hotel, was awarded the 2003 European Solar Award by theEUROSOLAR Foundation and KfW-Förderbank in recognition of its com-mitment to date in the field of climate protection and the use of renew-able energies.
Further projects on the use of renewables were implemented by Robinsonand Nordotel in 2003. The Robinson Club Cala Serena in Majorca, newlyopened in June, uses solar panels for energy generation. This means thatmore than half of all Robinson Clubs already use solar energy. The NordotelTres Vidas launched a pilot project for the integrated use of renewableenergies, comprising a state-of-the-art photovoltaic system for electricitygeneration and, in addition, an initial number of solar collectors for hotwater generation with additional surface areas to be added progressivelyin the course of 2004.
Conservation of resources
Renewable energies

87
Partnership and cooperation schemesTUI cooperates with many different national and international organisa-tions and so only some of these cooperation schemes will be presentedhere as examples.
TUI promoted the discussion of specific ecological issues at several foraboth in the European source markets and in the destinations. Thesedebates focused on climate protection by means of renewable energies,improvements in energy efficiency and the preservation of bio-diversitythrough the controlled use of large nature reserves, the latter beingimplemented in cooperation with EUROPARC, the Federation of Natureand National Parks in Europe. In this context, TUI AG also drew togetherthe activities of several Group companies in the Tour Operators´ Initiativefor Sustainable Tourism Development and intensified its involvement ineconsense, the forum for sustainable development of German industry.
In 2003, as a member of the British Sustainable Tourism Initiative, TUI UKco-founded the Travel Foundation and established the World of TUI-MaltaHeritage & Environment Fund for the third time in succession. The purposeof this fund is to promote projects to preserve the cultural and naturalheritage of the island of Malta. TUI Nordic continued in 2003 to supportWorld Wildlife Fund projects in Spanish Natura 2000 reserves and cooper-ated with the UNESCO World Heritage Center.
TUI España participated in several expert panels on future-oriented meas-ures to preserve bio-diversity in the Canary Islands. Examples worthy ofmention include its cooperation with the Loro Parque Fundación for theprotection of endangered parrot species and with Sociedad Española deCetaceos, the whale protection organisation. TUI Hellas has been workingfor a long time with Archelon, the nature conservation organisation, andthe National Marine Park Zakynthos in the fields of bio-diversity andcoastal management. In Africa, TUI agencies participated in a project runby the East African Wildlife Society with the aim of preserving the Tsavonational parks in Kenya.
Hapag-Lloyd Container Linie and Hapag-Lloyd-Kreuzfahrten continuedtheir activities supporting sensitive eco-systems. These included member-ship of the Clean Cargo Group to promote environmentally compatible seatransport and of the International Association of Antarctica Tour Operators(IAATO) as well as close cooperation with the Alfred Wegener Institute forOcean and Polar Research, the Institute for Ecology at the University ofJena and the WWF Arctic Programme.
TUI AG and German tour
operators
Tour operators of
TUI Northern Europe
Incoming agencies
Logistics
Environmental Protection Other Information

88
90 Report on Corporate Governance
94 Report of the Supervisory Board
99 Supervisory Board102 Executive Board104 TUI Share

89
Corporate Governance bRecommenda-tions and suggestions of the GermanCorporate Governance Code furtherdeveloped.bReport of the SupervisoryBoard.bTourism shares suffered fromweak consumer spending.

90
Corporate Governance Recommendations and suggestions of the German Corporate GovernanceCode further developed.
TUI has always largely complied with the recommendations and suggestionsof the German Corporate Governance Code. Following the entry into forceof the Code in August 2002, the implementation measures still requiredwere prepared and drawn up and progressively introduced. Implementationwas continued on the basis of the revised version of the Code of 21 May2003. In accordance with section 161 of the German Stock Corporation Act,the Executive Board and the Supervisory Board have submitted the 2003declaration of compliance on 26 November 2003 and made it permanentlyaccessible to the general public on the company’s website.
In its 2002 declaration of compliance, TUI complied with all but two of therecommendations of the Code. Both these recommendations are now alsobeing complied with or will be in future. Hence, with effect from 2003, anappropriate deductible has been agreed for Executive Board and Super-visory Board within the D&O insurance policy taken out by TUI AG for theentire Group. Moreover, the consolidated financial statements and interimreports shall be published within the timeframes indicated by the Codefollowing the completion of the 2003 financial year.
The new recommendations applicable as of July 2003 and which mainlyrelate to the remuneration of Board members are complied with as follows:in future, the full Supervisory Board shall discuss the structure of theremuneration system for the Executive Board on the basis of a proposalfrom the Presiding Committee and will regularly review it, while the chair-man of the Supervisory Board shall outline to the Annual General Meetingthe salient points of the remuneration system for the members of theExecutive Board and any changes thereto. Information on the remunerationsystem shall include an indication of the value of the Board’s stock optionsor phantom stocks.
The recommendation to provide information on the remuneration of theindividual members of the Executive Board and Supervisory Board is notcomplied with. As before, this information is presented as a total amount foreach of the Boards in the consolidated financial statements of the presentannual report, which for the Executive Board is broken down into fixedand variable components as well as the long-term incentive programme.The incentive system does not include an option to restrict incentives inthe event of extraordinary unforeseen developments. This is not required as
The principles of corporate governance have traditionally determined the actions of TUI AG’s management bodies. In accordance with sub-section 3.10 of the German Corporate Governance Code and also on behalf of the Supervisory Board, the Executive Board provides the following report.
Up-to-date declaration of
compliance on the internet
under www.tui.com

91
the system operated by TUI AG for the Executive Board members entailsa business performance-related bonus which is converted into phantomstocks in TUI AG on the basis of an average stock price, with the value ofthese shares corresponding to the share price on the stock exchange.
Cooperation of Executive and Supervisory Board TUI AG’s Executive Board and Supervisory Board cooperate closely and ina spirit of trust to manage and control the company. The Boards informand consult each other regularly about strategy and planning as well asdiscussing recent business trends and the current situation of the Group,including risk management.
The Executive Board of TUI AG currently comprises four members. Theyform the management body that manages the company’s operations andthey bear joint responsibility. The allocation of areas of responsibility amongthe individual Board members is presented separately.
TUI AG’s Supervisory Board comprises twenty members, with ten repre-sentatives elected by the shareholders and ten by the employees for anidentical period of office. TUI AG’s Supervisory Board does not currentlycontain any former Executive Board members. The term of the SupervisoryBoard covers a period of five years and will expire at the 2006 AnnualGeneral Meeting.
The Supervisory Board advises and supervises the Executive Board in themanagement of the company. It is involved in all decisions of fundamentalimportance to the company. In accordance with the terms of referencefor the Executive Board, decisions taken by the Executive Board on majortransactions such as major acquisitions or divestments require the approvalof the Supervisory Board.
The Executive Board provides the Supervisory Board with comprehensiveup-to-date information at regular meetings and in writing. An extraordinarySupervisory Board meeting may be convened, if required, if events of parti-cular relevance occur. The Supervisory Board has adopted terms of referencegoverning its work. In the run-up to the Supervisory Board meetings, therepresentatives of shareholders and employees meet separately, wherenecessary.
The Supervisory Board has established two committees from among itsmembers: the Presiding Committee and the Audit Committee, which pre-pare its work. Each Committee has six members, with an equal number ofshareholder and employee representatives.
Report Corporate Governance
92
The Executive and Supervisory Board members are obliged to act in TUIAG’s best interests. In the completed financial year there were no conflictsof interest requiring immediate disclosure to the Supervisory Board.None of the Executive Board members of TUI AG sat on more than fiveSupervisory Boards of non-Group listed companies.
The remuneration of the Executive Board members is made up of a fixedcomponent and two variable components. The variable components consistof a component dependent on the level of the dividend and a bonus with along-term incentive effect linked to business performance in the completedfinancial year. The final amount of this bonus is determined by TUI shareprice development. The remuneration of Supervisory Board members com-prised a fixed and a variable component, determined in accordance withsection 18 of TUI AG’s Articles of Association, which are permanently acces-sible to the general public on the internet. Details concerning the remuner-ation of the Executive Board, the bonus systems and the remuneration ofthe Supervisory Board are provided in the consolidated financial statements.
Shareholders’ rights Shareholders in TUI AG exercise their co-determination and control rightsat the ordinary Annual General Meeting. The AGM takes decisions on allstatutory matters and these are binding on all shareholders and the com-pany. For voting on resolutions, each share confers one vote.
All shareholders registering in due time are entitled to participate in theAGM. Shareholders who are not able to attend the AGM in person areentitled to have their voting rights exercised by a proxy of their ownchoosing or by a representative provided by TUI AG and acting on theirbehalf in accordance with their instructions.
Prior to the AGM, the letter of invitation and the reports and documentsrequired for voting are provided on TUI AG’s website. During the AGM,the presentations given by the Executive Board are transmitted live overthe internet.
Risk management Good corporate governance entails the responsible handling of commer-cial risks. The TUI Group Boards use comprehensive company-specificand Group-wide reporting and monitoring systems to identify, assess andcontrol these risks. These systems are continually developed and adjustedto match changes in overall conditions. More detailed information aboutrisk management in the TUI Group is presented in the relevant chapter ofthe management report.
Corporate Governance Report

93
Financial reporting and transparencyTUI publishes its financial calendar in both the annual report and interimreports and makes it permanently accessible on its website. TUI providesregular information about the economic situation of the company in itsannual report and interim reports. The company publishes press releaseson topical corporate events and any new developments. All information ispublished simultaneously in German and English and is available in printas well as via e-mail and on the internet. Moreover, the company websiteat www.tui.com provides comprehensive information about the Group andthe TUI share.
Directors’ dealingsIn the 2003 financial year, TUI AG did not receive any notifications of theacquisition or sale of TUI shares by members of TUI AG’s Executive Boardor Supervisory Board or by first-degree relatives of Board members.Ownership of TUI shares by Executive or Supervisory Board members isdisclosed in the consolidated financial statements.
Accounting and auditing Since 1999, TUI AG has prepared its consolidated financial statements inaccordance with the International Accounting Standards Board (IASB). Thefinancial statements of TUI AG were prepared in accordance with theGerman Commercial Code (HGB).
The consolidated financial statements and the financial statements of TUIAG were audited by PwC Deutsche Revision Aktiengesellschaft Wirtschafts-prüfungsgesellschaft, the auditor elected by the 2003 AGM. The auditwas based on German auditing rules, taking account of the generallyaccepted auditing standards issued by the German Auditors’ Institute (IDW),as well as the International Standards on Auditing. It also covered riskmanagement and conformance with the declaration of compliance oncorporate governance in accordance with section 161 of the GermanStock Corporation Act. In addition, a contractual agreement was concludedwith the auditors to the effect that the auditors will immediately informthe Supervisory Board of any grounds for disqualification or partialityoccurring during the audit as well as of all facts or events of importancearising during the performance of the audit.
Report Corporate Governance

94
Report of the Supervisory Board
In the 2003 financial year, the Supervisory Board performed its duties inaccordance with the law and the Articles of Association. They includedmonitoring the Executive Board’s work and providing regular advice to theBoard on the management of the Company. The Supervisory Board wasdirectly involved in all key decisions affecting the Company.
On the basis of written and verbal reports, the Executive Board providedregular, timely and comprehensive information to the Supervisory Board,encompassing all relevant information on the development of businessand the position of the Group, including the risk situation and risk manage-ment. The Executive Board discussed the strategic orientation of theGroup and all key transactions of relevance to the company – in particularthe further development of the Group – with the Supervisory Board.Deviations from the approved plans for the development of businesswere presented, explained and discussed.
The Supervisory Board held six meetings in the 2003 financial year. ThePresiding Committee met four times and the Audit Committee threetimes to prepare the issues to be dealt with by the Supervisory Board.Because of the brevity of their term of office, two Supervisory Boardmembers participated in less than half of the Supervisory Board meetings.
The reports provided by the Executive Board were discussed at length bythe committees and the Supervisory Board plenary meetings. Transactionsrequiring the approval of the Supervisory Board and decisions of funda-mental importance were discussed in depth with the Executive Board priorto a decision being taken. Concerning a number of specific or particularlyurgent issues arising between the regular meetings, the Supervisory Boardwas fully informed and, where necessary, submitted its approval in writing.In addition, the Chairman of the Supervisory Board was regularly informedabout current business developments and major transactions.
Work of the committeesAt its meeting on 22 January 2003, the Presiding Committee dealt mainlywith an issue relating to the Executive Board. On 6 May 2003, discussionsfocused primarily on the new Group management structure, preparationof the agenda for the 2003 Annual General Meeting including amendmentsto the Articles of Association, as well as issues related to the remuneration
In the following, the Supervisory Board reports about its activities in the completedfinancial year, in particular the plenary discussions, the work done by the committees,corporate governance, the audit of the financial statements of TUI AG and the Groupas well as changes in the membership of the Boards of the Company.

95
of the Executive Board, Supervisory Board and Audit Committee members.At its meeting on 31 August 2003, mainly issues relating to the ExecutiveBoard were discussed. On 26 November 2003, the key issue on the agendawas the updating of the declaration of compliance with the German Corporate Governance Code.
At its first meeting held on 5 May 2003, the Audit Committee adoptedterms of reference. Discussions focused on the 2002 annual and consoli-dated financial statements. They also covered the organisation of GroupAccounting as well as corporate governance. On 26 August 2003, theAudit Committee dealt with the interim financial statements for the firsthalf of 2003 and discussed the appointment of the auditors for the 2003annual and consolidated financial statements, in particular the key auditareas and the audit fee. The agenda also included the structure and activities of Group Auditing. On 26 November 2003, discussions focusedmainly on the interim financial statements for the third quarter of 2003.Auditor representatives were present at two meetings of the Audit Com-mittee in which they presented comprehensive reports on their audits.
At the full Supervisory Board meetings, comprehensive reports weregiven about the activities of the committees.
Focus of deliberations in the Supervisory Board Discussions at Supervisory Board meetings regularly focused on thedevelopment of turnover, results and employment of the Group and theindividual divisions as well as the financial situation and structural devel-opment of the Company.
At its meeting of 22 January 2003, the Supervisory Board comprehensivelydiscussed future trends and subsequently approved the planning for 2003for the Group and took note of the 2004/2005 forecast accounts. One ofthe key issues discussed in this context was the divestment of the domesticand foreign activities of the energy sector. Moreover, the Supervisory Boardappointed Mr. Sebastian Ebel as an ordinary member of the ExecutiveBoard of TUI AG, with effect from 1 February 2003.
At its meeting of 21 March 2003, the Supervisory Board discussed thestrategic alignment of the Group, in particular the development of tourism,the core business. In respect of this, the Executive Board presented theTOP programme (TUI Optimizing Performance), representing the strategicinitiatives of the Company. Furthermore the chairman of the SupervisoryBoard submitted a report about the results of the efficiency examination,done by an external consultant.
Report of the Supervisory Board Corporate Governance

96
At its meeting of 6 May 2003, the Supervisory Board mainly discussedthe financial statements of TUI AG and the Group as per 31 December2002, the 2002 budget report, and the personnel and social reports for2002; this meeting was also attended by representatives of the auditorwho were available to answer questions. The meeting also focused on thenew Group management structure and amendments to the Articles ofAssociation of TUI AG in connection with the preparation of draft resolu-tions for the 2003 Annual General Meeting.
At its meeting of 18 June 2003, the Supervisory Board mainly discussedissues related to the forthcoming ordinary Annual General Meeting.
The strategy meeting of 15 and 16 September 2003 focused on a com-prehensive presentation of the tourism division and its future developmentas well as a status report on the TOP programme. Questions related tofuture financing were also discussed and the Supervisory Board approvedthe issue of a convertible bond and employee shares. It also discussedthe planned divestment of the AMC Group.
At its meeting of 26 November 2003, the Supervisory Board comprehen-sively discussed corporate governance within the Company and the updat-ing of the declaration of compliance with the German Corporate GovernanceCode. During discussion of the approval of participation issues, the focuswas on the exercise of the put option to return the indirect participationin the Alpitour Group.
Corporate governanceOn 26 November 2003, the Executive Board and the Supervisory Boardissued an updated declaration of compliance with the German CorporateGovernance Code in accordance with section 161 of the German StockCorporation Act, and made it permanently accessible to the public onTUI’s website. In accordance with sub-section 3.10 of the Code and alsoon behalf of the Supervisory Board, the Executive Board reports aboutcorporate governance in a separate chapter of the annual report.
Both the Audit Committee and the Supervisory Board have on severaloccasions dealt with corporate governance within the company and ex-amined the efficiency of their own actions. They primarily focused on theimplementation of the recommendations of the efficiency review and theprovision of information to the Supervisory Board.
Corporate Governance Report of the Supervisory Board

97
Audit of the annual financial statements of TUI AG and the Group PwC Deutsche Revision Aktiengesellschaft Wirtschaftsprüfungsgesellschaft,Hanover, were appointed as the auditors by the Annual General Meetingheld on 18 June 2003 and commissioned by the chairman of the Super-visory Board following consideration of the Audit Committee. The auditcovered the annual financial statements of TUI AG as at 31 December2003, submitted by the Executive Board and prepared in accordance withthe provisions of the German Commercial Code (HGB), the joint manage-ment report for TUI AG and the Group, and the consolidated financialstatements for the 2003 financial year prepared in accordance with theprovisions of the International Accounting Standards Board (IASB). Thepreparation of consolidated financial statements in accordance with theGerman Commercial Code (HGB) was dispensed with under the exemptionprovision of section 292a HGB. Specific explanatory information requiredwas added to the consolidated financial statements. The auditors issuedtheir unqualified audit certificate for the annual financial statements ofTUI AG and the consolidated financial statements.
The financial statements, the management report and the auditors’ reportswere submitted to all members of the Supervisory Board. They were discussed at the Audit Committee meeting of 23 March 2004 and theSupervisory Board meeting of 30 March 2004 at which representatives ofthe auditors were present in order to provide supplementary information.On the basis of its own audit of the annual financial statements of TUI AGand the Group, as well as the joint management report as at 31 December2003 and the results of the audit, the Supervisory Board approved theannual financial statements of TUI AG, which were thereby adopted, theconsolidated financial statements and the Group management report.The Supervisory Board also examined and approved the proposal for theappropriation of the profits for the 2003 financial year submitted by theExecutive Board.
Supervisory Board membershipBy virtue of a ruling of the District Court of Hanover of 2 January 2003,Mr. Christian Kuhn was appointed to the Supervisory Board.
Mr. Gerhard Schneider resigned from the Supervisory Board and the Presiding Committee as at 31 December 2002; at its meeting on 22 January2003, the Supervisory Board elected Mr. Hartmut Schulz as his successoron the Presiding Committee.
Due to the divestment of Preussag Energie GmbH, Mr. Friedel Kemper’sterm of office on the Supervisory Board terminated at the close of 26 May
Report of the Supervisory Board Corporate Governance

2003. The Supervisory Board thanks Mr. Kemper for his many years ofconstructive cooperation.
By way of a ruling of the District Court of Hanover of 3 June 2003, Ms. Petra Oechtering was appointed on the Supervisory Board.
At the close of the Annual General Meeting held on 18 June 2003, Mr. HansHenning Offen retired from the Supervisory Board. The Supervisory Boardthanks Mr. Offen for his many years of constructive cooperation. TheAnnual General Meeting of 18 June 2003 elected Mr. Jürgen Sengera asMr. Offen’s successor on the Supervisory Board; at the close of 21 August2003, Mr. Sengera then resigned from the Supervisory Board. By virtue ofa ruling of the District Court of Hanover of 8 September 2003, Dr. JohannesRingel was appointed as his successor on the Supervisory Board; at theclose of 12 January 2004, Dr. Ringel retired from the Supervisory Board,whereupon the District Court of Hanover appointed Dr. Thomas Fischerto the Supervisory Board by virtue of a ruling of 16 January 2004.
Executive Board membershipWith effect from 1 February 2003, the Supervisory Board appointed Mr.Sebastian Ebel as an ordinary member of the Executive Board of TUI AG.
A new management structure for the TUI Group entered into force on 1 June 2003. The new Group management body, the Executive Committee,comprises the four members of the Executive Board of TUI AG and fourdivisional directors responsible for business operations in the source markets of the tourism division and in the logistics division. Following theintroduction of the new management structure, Messrs. Dr. Ralf Corsten,Charles Gurassa and Dr. Helmut Stodieck stepped down from the TUIAG’s Executive Board as per the close of 31 May 2003. The SupervisoryBoard thanks them all for their excellent work.
Dr. Helmut Stodieck continued as a divisional director responsible for thelogistics/participations sector. The other divisional directors appointed bythe Supervisory Board with effect from 1 June 2003 were Messrs. Dr.Volker Böttcher, in charge of the Central Europe sector, Peter Rothwell, incharge of the Northern Europe sector, and Eric Debry, in charge of theWestern Europe sector.
The Supervisory BoardHanover, 30 March 2004
Dr. Friedel Neuber, Chairman
Corporate Governance Report of the Supervisory Board
98

99
Dr. Friedel NeuberChairmanDuisburg-Rheinhausen
Jan KahmannDeputy ChairmanMember of the Federal Executive Board of ver.di – Vereinte Dienstleistungs-gewerkschaft e.V. Berlin
Jella Susanne Benner-HeinacherSolicitorManaging Director of DeutscheSchutzvereinigung für Wertpapierbesitz e.V.Düsseldorf
Dr. Thomas FischerChairman of the Executive Board of WestLB AGDüsseldorf(since 16 January 2004)
Friedel KemperForeman Lingen(until 26 May 2003)
Uwe KleinClerkHamburg
Fritz KollorzMember of the Executive Board of theMining, Chemical and Energy Industrial UnionHanover
Dr. Jürgen KrumnowMember of the Board of Advisors of Deutsche Bank AGFrankfurt/Main
Christian KuhnTravel agentHanover(since 2 January 2003)
Dr. Dietmar Kuhntex. Chairman of the Executive Board of RWE AG Essen
Dr. Klaus LiesenHonorary Chairman of the Supervisory Board of Ruhrgas AG Essen
Petra OechteringTravel agentCologne(since 3 June 2003)
Dipl.-Kfm. Hans Henning Offenex. Deputy Chairman of the Executive Boardof Westdeutsche Landesbank Girozentrale Großhansdorf(until 18 June 2003)
Dr. Johannes Ringelex. Chairman of the Executive Board of WestLB AGMeerbusch(since 8 September 2003 until 12 January 2004)
Hans-Dieter RüsterAircraft engineerLangenhagen
Marina SchmidtTravel agentHamburg
Dr. Manfred SchneiderChairman of the Supervisory Board of Bayer AGLeverkusen
Prof. Dr. Ekkehard SchulzChairman of the Executive Board of ThyssenKrupp AGDüsseldorf
Hartmut SchulzMovement ControllerLangenhagen
Ilona Schulz-MüllerRepresentative for equalityin the Federal Executive Board of ver.di – Vereinte Dienstleistungs-gewerkschaft e.V.Berlin
Dipl.-Math. Olaf SeifertHead of the Group Controlling Departmentof TUI AGHanover
Jürgen Sengeraex. Chairman of the Executive Board of WestLB AGKaarst(since 18 June 2003 until 21 August 2003)
Dr. Bernd W. VossMember of the Supervisory Board of Dresdner Bank AG Frankfurt/Main
Dr. Franz VranitzkyChancellor (retrd.) of the Republic of Austria Vienna
as of 29 February 2004
Supervisory Board
Members of the Supervisory Board

Corporate Governance Supervisory Board
100
Presiding Committee
Dr. Friedel NeuberChairmanDuisburg-Rheinhausen
Jan KahmannMember of the Federal Executive Board of ver.di – Vereinte Dienstleistungs-gewerkschaft e.V. Berlin
Uwe KleinClerkHamburg
Dr. Dietmar Kuhntex. Chairman of the Executive Board of RWE AG Essen
Dr. Klaus LiesenHonorary Chairman of the Supervisory Board of Ruhrgas AG Essen
Hartmut SchulzMovement ControllerLangenhagen(since 22 January 2003)
as of 29 February 2004
Audit Committee
Dr. Jürgen KrumnowChairmanMember of the Board of Advisors of Deutsche Bank AGFrankfurt/Main
Uwe KleinClerkHamburg
Dr. Friedel NeuberDuisburg-Rheinhausen
Prof. Dr. Ekkehard SchulzChairman of the Executive Board of ThyssenKrupp AG Düsseldorf
Ilona Schulz-MüllerRepresentative for equalityin the Federal Executive Board of ver.di – Vereinte Dienstleistungs-gewerkschaft e.V.Berlin
Dipl.-Math. Olaf SeifertHead of the Group Controlling Departmentof TUI AGHanover
Committees of the Supervisory Board
*) Information refers to 31 December 2003or date of resignation from the Supervisory Board of TUI AG
1) Chairman2) Deputy Chairmana) Membership in Supervisory Boards
required by lawb) Membership in comparable Boards
of domestic and foreign companies

101
Supervisory Board Corporate Governance
Dr. Friedel Neuber(Chairman)a) Deutsche Bahn AG
Hapag-Lloyd AGRAG AGRWE AG1)
ThyssenKrupp AGb) Landwirtschaftliche Rentenbank
Jan Kahmann(Deputy chairman)a) Eurogate Beteiligungs-GmbH2)
Jella Susanne Benner-Heinachera) A. S. Creation AG
K+S AG
Dr. Thomas Fischera) Audi AG
Berlin & Co. KGaA1)
Hawesko Holding AGInSynCo AG1)
KanAm International GmbHKanAm Kapitalanlagegesellschaft mbHX-Com AG1)
b) LTG Technologies Plc.SLEC Holding Ltd.
Friedel Kempera) Gaz de France
Produktion Exploration Deutschland GmbH
Uwe Kleina) Hapag-Lloyd AG
Fritz Kollorza) DSK Anthrazit Ibbenbüren GmbH2)
RAG AG2)
STEAG AG2)
Vattenfall Europe AG2)
Vattenfall Europe Generation Verwaltungs-AG2)
Dr. Jürgen Krumnowa) Lenze Holding AG2)
mg technologies ag Vivascience AG2)
b) Peek & Cloppenburg KG
Christian Kuhna) TUI Deutschland GmbH2)
Dr. Dietmar Kuhnta) Allianz Versicherungs-AG
Dresdner Bank AGHapag-Lloyd AGHochtief AG1)
mg technologies agRWE AG
b) Société Electrique de I’Our SA2)
Dr. Klaus Liesena) E.ON AG
Volkswagen AG
Petra Oechteringa) –
Dipl.-Kfm. Hans Henning Offena) Gildemeister AG
RWE Plus AG ThyssenKrupp Materials AGWestIntell AG1)
b) Familienstiftung SchwarzKaufland Stiftung & Co. KGLidl Stiftung & Co. KG
Dr. Johannes Ringela) HSH Nordbank AG
Hüttenwerke Krupp Mannesmann GmbHRütgers AGRWE Energy AGSTEAG AGThyssenKrupp Stahl AG
b) DekaBank – Deutsche GirozentraleLandesbank Rheinland-PfalzGirozentrale2)
MTBC Bank Deutschland GmbH2)
Hans-Dieter Rüstera) –
Marina Schmidta) –
Dr. Manfred Schneidera) Allianz AG
Bayer AG1)
DaimlerChrysler AGLinde AG1)
Metro AGRWE AG
Prof. Dr. Ekkehard Schulza) AXA Konzern AG
Commerzbank AGDeutsche Bahn AGMAN AGRAG AG2)
ThyssenKrupp Automotive AG1)
ThyssenKrupp Services AG1)
ThyssenKrupp Steel AG1)
b) ThyssenKrupp Budd Company
Hartmut Schulza) –
Ilona Schulz-Müllera) WinCom Versicherungsholding AG
Dipl.-Math. Olaf Seiferta) TUI Espan~a S.A.
TUI Hellas Travel and Tourism A.E.
Jürgen Sengeraa) AXA Konzern AG
Deutsche Post AGFord Deutschland Holding GmbHFord-Werke AG
b) Deutsche Anlagen-Leasing GmbH1)
Liquiditäts- und Konsortialbank GmbH2)
Rockwool Beteiligungs GmbHRockwool International A/S
Dr. Bernd W. Vossa) Allianz Lebensversicherungs-AG
Continental AG Dresdner Bank AGOsram GmbHQuelle AGWacker Chemie GmbH
b) ABB Ltd.Bankhaus Reuschel & Co.1)
Dr. Franz Vranitzkyb) Magic Life der Club International
Hotelbetriebs GmbH1)
Magna International Inc.
Other board memberships of the Supervisory Board*)

Dr. Michael FrenzelChairman
Sebastian EbelPlatforms(since 1 February 2003)
Dr. Peter EngelenHuman Resources and Legal Affairs
Rainer FeuerhakeFinance
Dr. Ralf CorstenTourism I(until 31 May 2003)
Charles GurassaTourism II(until 31 May 2003)
Dr. Helmut StodieckHoldings(until 31 May 2003)
102
Executive Board
Executive Committee*)
Executive Board of TUI AG
Dr. Michael FrenzelChairman
Sebastian EbelPlatforms
Dr. Peter EngelenHuman Resources and Legal Affairs
Rainer FeuerhakeFinance
*) since 1 June 2003
Dr. Volker BöttcherCentral Europe sector
Peter RothwellNorthern Europe sector
Eric DebryWestern Europe sector
Dr. Helmut StodieckLogistics/Holdings

Dr. Michael Frenzel(Chairman)a) AXA Konzern AG
Continental AGDeutsche Bahn AG1)
E.ON Energie AGHapag-Lloyd AG1)
Hapag-Lloyd Fluggesellschaft mbH1)
ING BHF-Bank AGING BHF Holding AGTUI Deutschland GmbH1)
Volkswagen AGb) Norddeutsche Landesbank
Preussag North America, Inc.1)
Dr. Ralf Corstena) ERGO Versicherungsgruppe AG
Hapag-Lloyd Fluggesellschaft mbHMesse Berlin GmbH1)
TUI Business Travel Deutschland GmbHTUI Deutschland GmbHTUI Leisure Travel GmbH
b) Alpitour S.p.A.Egyptotel Company S.A.E.Grupotel DOS S.A.NHT New Holding for Tourism B.V.RIUSA II S.A.TUI Belgium N.V.1)
TUI España Turismo S.A.1)
TUI Nederland N.V.1)
Sebastian Ebela) Hapag-Lloyd Fluggesellschaft mbH
TUI Business Travel Deutschland GmbH1)
TUI Deutschland GmbHTUI Leisure Travel GmbH
b) TQ3 Travel Solutions A/STQ3 Travel Solutions Nederland B.V.TUI Belgium N.V.TUI Business Travel Belgium B.V.TUI España Turismo S.A.TUI Nederland N.V.TUI Suisse Ltd.
Dr. Peter Engelena) Hapag-Lloyd Fluggesellschaft mbH
TUI Business Travel Deutschland GmbHTUI Deutschland GmbHTUI Leisure Travel GmbH
Rainer Feuerhakea) Hapag-Lloyd AG
Hapag-Lloyd Fluggesellschaft mbHTUI Deutschland GmbHWolf GmbH
b) Amalgamated Metal Corporation PLCPreussag North America, Inc.
Charles Gurassaa) Hapag-Lloyd Fluggesellschaft mbH
TUI Business Travel Deutschland GmbHTUI Deutschland GmbH
b) Neos SpATUI Northern Europe Ltd.Thomson Travel Group(Holdings) LimitedWhitbread Group Plc.
Dr. Helmut Stodiecka) Wolf GmbH1)
b) Amalgamated Metal Corporation PLC1)
Preussag North America, Inc.
Executive Board Corporate Governance
103
Other board memberships of the Executive Board*)
*) Information refers to 31 December 2003or date of resignation from the Executive Board of TUI AG
1) Chairman2) Deputy Chairmana) Membership in Supervisory Boards
required by lawb) Membership in comparable Boards
of domestic and foreign companies

104
For long periods, stock markets in 2003 were characterised by weak worldwide economicactivity and the aftermath of the conflict in Iraq. It was not until the second half of theyear that the downward trend reversed and stock markets recovered.
The year 2003 started off poorly for international investors. Uncertaintyabout geopolitical developments and concerns about economic activitycast a cloud over stock market activities. European and German sharessuffered above-average losses. During that phase, the German share index,the DAX, fell to around 2,200 index points, its lowest level since 1995.The US stock market showed a similar trend. As a result, the US FederalReserve System and the European Central Bank cut their key lendingrates. With diminishing fears of deflation and the emergence of the firstpositive economic signals, the mood brightened again in the stock marketsas of mid-year and share prices increased across-the-board.
Development of TUI’s share price in 2003 The year 2003 did not start off well for the TUI share, either. Opening ata price of € 17.20, it fell to a value of below € 8 by mid-March. This trendwas substantially determined by uncertainty about the repercussions ofthe Iraq conflict on the tourism business. Even after the end of the war,the market remained sceptical, causing sustained volatility of the shareprice. Positive reports from the industry and confidence regarding pro-spects for the key holiday months of July through September, as well asthe brightening of the overall mood on the stock market caused the TUIshare price to again top € 14 by mid-year. At year-end, the TUI share
TUI Share Challenging year for the stock markets.Tourism shares suffered from weak consumer spending.
Volatile share price
TUI’s share price compared with the DAX in 2003
22.90
21.30
19.70
18.10
16.50
14.90
13.30
11.70
10.10
8.50
6.90
TUI share in €DAX
3,940
3,640
3,340
3,040
2,740
2,440
2,140
1,840
1,540
1,240
Jan
Feb
Mar
Apr
May
Jun
Jul
Aug
Sep
Oct
Nov
Dec

105
stood at € 16.53, around 2% up on the closing price of the previous year.DAX30 stood at 3,965.16 index points, gaining just over 28% in the courseof the year.
Long-term development of TUI share prices € 1999/2000 AFY 2000 2001 2002 2003
Highest share price 55.60 42.00 44.70 35.57 17.20Lowest share price 30.50 32.80 19.20 13.98 7.75Share price at financial year-end 34.70 38.60 27.60 16.16 16.53Book value 18.86 18.60 19.00 17.86 15.50
Quotations, indices and trading The TUI share is the only German tourism share. It is officially quoted onall eight German trading floor systems and traded in the Xetra electronictrading system. Several European competitors such as MyTravel, FirstChoice, Club Méditerranée and Kuoni are also listed and traded on stockmarkets in the UK, France and Switzerland.
The TUI share has been one of the DAX30 stocks, the German stockindex of the top quoted companies, since 1990. The two decisive criteriafor admission of a share to the index are its market capitalisation andexchange volume. When the composition of the index was last determinedin December 2003, the TUI share ranked 25th in terms of exchange volumeand 33rd in terms of market capitalisation and carried a weighting of0.48% in the DAX. Since the resegmentation of the German stock marketas of 1 January 2003, TUI has been a member of the prime standard andtherefore meets the high international transparency standards of thissegment over and above legal requirements.
In addition, the TUI share is also included in several industry indices inthe German stock market and at European level; these include Europeanmarket indices DJ Stoxx Cyclical Goods and Services and DJ Euro StoxxCyclical Goods and Services. Its year-end weightings were 1.23% and 2.27%respectively. Moreover, the share has been incluced in the FTSE indexEurotops 300 for some time.
In 2003, TUI shares recorded extremely brisk trading activity. On average,1,466,473 shares were traded per day in 2003, this figure being morethan double the figure reported in the previous year. The total tradingvolume amounted to 371.0 million no-par value shares, following 174.2million in 2002. Given a free float of around 70%, the shares in circulationwere turned over some three times.
TUI Share Corporate Governance
Member of the DAX30
and the prime standard
Buoyant trading

106
Corporate Governance TUI Share
The number of options on TUI shares traded on the European futuresexchange EUREX totalled approx. 530,000 contracts in 2003. Average trad-ing therefore amounted to 44,000 contracts per month, above 132% on thevolume traded in the previous year. In addition, a relatively large numberof covered warrants – warrants issued by banks and covered by shareportfolios – was in circulation again in 2003, primarily traded off the floor.
Subscribed capital and number of shares In October 2003, eligible employees were offered employee shares. 6.1%of eligible subscribers took up this capital formation offering. As a result,the number of shares rose by 430,380 to 178,468,679, with subscribedcapital recording an increase of € 1,100,249 to € 456,247,933.
In the 2003 financial year, no bonds were converted from the 1999/2004convertible bond. As a result, investors continued to hold conversion rightsfor a total of 8,750,719 shares as per balance sheet date. The conversionprice for this bond is € 61.90. It will mature on 17 June 2004.
The 2003/2008 convertible bond was issued in October 2003 with amaturity of five years and a volume of approx. € 384.6 million. The bondshave a 4% coupon and may be converted into 17,803,240 TUI shares.Given a conversion premium of 47.5% at a reference price of € 14.6433,the conversion price amounts to € 21.60.
Resolutions of the 2003 Annual General MeetingThe 2003 Annual General Meeting was held on 18 June 2003 in Hanover.Approx. 2,000 shareholders and shareholder representatives representing54.8% of the capital stock participated in the AGM.
Besides the formal approval of the acts of the Executive and SupervisoryBoards and the adoption of a resolution on the appropriation of profitsfrom the 2002 financial year, the agenda also included authorisation of theBoards to engage in capital measures and the renewal of the authorisationto purchase own shares under section 71 sub-section 1 no. 8 of the German Stock Corporation Act (AktG). In the 2003 financial year, no usewas made of the authorisation to purchase own shares.
Shareholder structureThe shareholder structure was again relatively stable in the 2003 financialyear. German shareholders continued to hold the vast majority of sharesin the subscribed capital, although the number of shares held by foreigninvestors rose again in line with an increasing focus on tourism, the corebusiness. According to internal and external analyses, approx. one quarter
Employee shares
New convertible bond

107
of the subscribed capital is held by foreign investors, mainly from the UK,Switzerland, France and the US.
Private shareholders hold around 15% of TUI shares, with approx. 85% heldby institutional investors. GEV Gesellschaft für Energie- und Versorgungs-werte mbH continues to be the largest individual institutional shareholderin TUI. Landesbank Nordrhein-Westfalen, controlling company of WestLB AGand therefore of GEV, notified TUI under the provisions of the GermanSecurities Trading Act (WpHG) that it held approx. 31.4% of voting rightsin TUI AG. In the course of the year 2003, several investment funds heldmore than 5% of the subscribed capital in TUI shares; however, at financialyear-end their shares had once again fallen below the level of 5% requir-ing notification under the German Securities Trading Act.
Dividend and yield ratios TUI AG reported a profit for the year of € 137.4 million. Taking intoaccount retained profits brought forward of € 0.4 million, a total profit of€ 137.8 million is available for distribution to the shareholders for the2003 financial year.
It is therefore possible to retain the dividend and once again propose adividend of € 0.77 per no-par value share to the Annual General Meeting.With a total of 178,468,679 dividend-bearing shares at the end of the 2003financial year, the resulting dividend payouts amount to € 137.4 million,with the remaining € 0.4 million to be carried forward on new account.
Accordingly, the TUI share continued to be attractive to income-orientedshareholders. TUI shareholders who purchased their shares at the beginn-ing of the 2003 financial year gained a dividend yield of 4.8% in the courseof the year. Longer-term investors who for instance invested € 500 inthen Preussag shares ten years ago, exercised their subscription rightsand reinvested their dividend income, had a portfolio worth € 820 at thebalance sheet date. Their average annual return totalled 3.9%. This figurereflected in particular the weakness of stock markets and the unfavourableclimate for the tourism sector since the events of 11 September 2001.
Development of earnings and dividend of the TUI share € 1999/2000 AFY 2000 2001 2002 2003
Earnings per share 1.91 0.08 1.96 0.18 1.54Dividend 0.77 0.20 0.77 0.77 0.77Tax credit 0.33 – – – –
TUI Share Corporate Governance
Shareholder structure
Dividend
Yield of shares

108
For the 2003 financial year, the TUI Group generated earnings per shareof € 1.54 (previous year: € 0.18) on the basis of group profit for the yearafter minority interests. This figure was based on an average number ofshares of 178,070,135 (previous year: 178,038,299). Adjusted for goodwillamortisation, earnings per share totalled € 5.26, following € 2.05 in theprevious year.
According to current information, the convertible bond maturing in June2004 will not result in an increase in the subscribed capital, so that earn-ings per share will not be subject to a dilution effect. The convertible bondissued in 2003 and maturing in October 2008 is also not expected to gene-rate a dilution effect in determining earnings per share due to the deve-lopment of the TUI share price since issuance.
Return on sales ratios 2003Results by Return
Turnover divisions*) on sales€ million € million %
Tourism 12,671.3 208.1 1.6Logistics 3,915.1 313.9 8.0Trading 2,056.0 12.2 0.6Central operations 573.0 379.1 –Group 19,215.4 913.2 4.8
*) Result before tax and goodwill amortisation
The difficult economic climate in the 2003 financial year was also reflectedin the Group’s return ratios. Although return on sales rose to 4.8% atGroup level (previous year: 2.8%), this was primarily attributable to extra-ordinary income from divestments. At a return on sales of 1.6%, downfrom 2.7% in the previous year, the tourism division recorded its weakestyear to date. The logistics division rose to 8.0% (previous year: 5.3%). Thetrading sector generated a return on sales of 0.6% (previous year: 1.6%).
Corporate Governance TUI Share
Earnings per share
Return on sales

109
TUI Share Corporate Governance
Investor RelationsThe difficult political and economic environment in the 2003 financial yearalso posed a particular challenge to Investor Relations activities. Up-to-dateinformation and open communication with shareholders, analysts, prospec-tive investors and lenders helped market participants to make a realisticassessment of TUI’s future development. The focus of interest was on thedevelopment of tourism, the core business, and the status of the divest-ment programme.
The activities of the Investor Relations team also focused on regular con-tacts with key financial analysts and institutional investors, by phone or inone-on-one meetings. The Executive Board met analysts and investors atseveral investors’ meetings and road shows in Germany, the UK and theUS. In addition, the Boards met their information requirements by meansof one-on-one meetings and conference calls. The annual financial state-ments for 2002 were presented at an analysts’ meeting, while the Execu-tive Board was available for questions in conference calls whenever aninterim report was presented. A special event was the analysts’ day inMajorca, attended by approx. 40 participants who discussed current andfuture issues related to the sector and the Group with members of TUI’sExecutive Committee, following a comprehensive presentation by theCompany.
Dialogue with private investors was a focus at several investor forumsorganised by regional stock exchanges, banking institutions and shareholderassociations. Another forum at which the Investor Relations team presentedinformation on the TUI share was the 2003 Annual General Meeting, whichoffered ample opportunity for discussion with shareholders. Constantcontact with shareholders was maintained by the Shareholder Newsletter,launched at the beginning of April 2003. It primarily targets private investorsand provides up-to-date information about developments in the Company.


Going one step further. Thinking ahead.That’s our passion. World of TUI opens upnew horizons. Wherever there’s holiday inthe air, we’re there. Open and proactive. In everything we do, we’re driven by ouraspiration: World of TUI always spells quality.
Going beyond the everyday.


Going beyond the horizon. As an integrated tourism group,World of TUI provides first-hand service and support at everystage of the holiday, a pledge we furthered in 2003 with ourquality drive. Added value from first to last.

Going beyond the usual game. World of TUI taps international synergies within the Group for the benefit of our customers presentand future. We’re there for our customers around the clock, via ourInternet portal. That next holiday is always close at hand.


Going beyond limits. We inspire the tourism industry not only withour innovative ideas and go-getting spirit, but also our staying powerand drive. For World of TUI, market leadership means giving customersnothing but the very best. We will not rest on our laurels.

118
120 Consolidated Profit and Loss Statement
121 Consolidated Balance Sheet
122 Statement of Changes in Equity
123 Consolidated Cash Flow Statement
124 Notes on theAccounting Principles
140 Segment Reporting148 Notes on the
Consolidated Profit and Loss Statement
166 Notes on the Consolidated Balance Sheet
199 Notes on the Consolidated Cash Flow Statement
200 Other Notes205 Major Shareholdings206 Auditors‘ Statement

119
Financial Statements bNew IAS stand-ards voluntarily applied. bBalancesheet total decreased to € 13.0 billion.bEquity ratio 21.3% bNet debt reduced to € 3.8 billion.

120
Financial Statements Consolidated Profit and Loss Statement
Profit and Loss Statement of the TUI Group for the period from 1 January 2003 to 31 December 2003 € million Notes 2003 2002
Turnover (1) 19,215.4 20,302.4Other income (2) 868.6 1,162.6Change in inventories andother own work capitalised (3) + 30.6 + 57.5Cost of materials and purchased services (4) 13,441.5 14,433.5Personnel costs (5) 2,568.8 2,550.6Depreciation and amortisation (6) 877.9 904.9(of which amortisation of goodwill) (278.9) (278.3)Impairment of fixed assets (7) 387.8 55.4(of which impairment of goodwill) (368.6) (55.0)Other expenses (8) 3,045.5 3,193.1(of which other taxes) (55.4) (53.1)Result from the discontinuance of operations (9) + 557.7 + 89.1Financial result (10) - 147.3 - 293.3Earnings from companies measured at equity (11) + 42.5 + 46.1Earnings before taxes on income + 246.0 + 226.9Income taxes (12) - 68.9 + 185.8Group profit for the year 314.9 41.1Minority interests (13) 39.9 9.1Group profit for the year attributable to shareholders in TUI AG 275.0 32.0
€ Notes 2003 2002
Basic earnings per share (14) 1.54 0.18Diluted earnings per share 1.54 0.18Earnings per share before amortisation of goodwill 5.26 2.05

121
Consolidated Balance Sheet Financial Statements
Balance Sheet of the TUI Group as at 31 December 2003€ million Notes 31 Dec 2003 31 Dec 2002
Assets Goodwill (15) 3,807.9 4,753.7Other intangible assets (16) 198.6 260.2Investment property (17) 149.3 171.0Other property, plant and equipment (17) 4,734.7 5,310.5Companies measured at equity (18) 332.4 349.6Other investments (18) 465.2 357.1Fixed assets 9,688.1 11,202.1Other receivables and assets (21) 395.0 532.1Deferred income tax claims (22) 188.3 285.4Non-current receivables 583.3 817.5Non-current assets 10,271.4 12,019.6
Inventories (19) 532.4 638.3Trade accounts receivable (20) 898.2 1,045.4Other receivables and assets (21) 916.9 1,418.8Current income tax claims (22) 21.8 28.8Current receivables 1,836.9 2,493.0
Cash and cash equivalents (23) 348.5 366.5Current assets 2,717.8 3,497.8
12,989.2 15,517.4
€ million Notes 31 Dec 2003 31 Dec 2002
Equity and liabilitiesSubscribed capital (24) 456.2 455.1Reserves (25) 1,887.8 2,317.5Net profit available for distribution (26) 137.8 137.5Interest in equity of shareholders in TUI AG 2,481.8 2,910.1Minority interests (27) 285.1 270.4Group equity 2,766.9 3,180.5
Provisions for pensions and similar obligations (28) 598.3 631.8Current income tax provisions (29) 119.9 207.1Deferred income tax provisions (29) 209.2 475.5Other provisions (29) 360.2 612.4Non-current provisions 1,287.6 1,926.8
Financial liabilities 2,710.2 2,416.9Other liabilities 206.4 172.6Non-current liabilities (30) 2,916.6 2,589.5Non-current provisions and liabilities 4,204.2 4,516.3
Provisions for pensions and similar obligations (28) 46.8 51.0Current income tax provisions (29) 159.2 170.3Other provisions (29) 684.5 617.8Current provisions 890.5 839.1
Financial liabilities 1,467.1 3,394.4Trade accounts payable 2,036.6 1,969.7Other liabilities 1,623.9 1,617.4Current liabilities (30) 5,127.6 6,981.5Current provisions and liabilities 6,018.1 7,820.6
12,989.2 15,517.4

122
Financial Statements Statement of Changes in Equity
Statement of Changes in Equity as at 31 December 2003Differences Revaluation Profit Equity attri-
Sub- from reserve for available butable toscribed Capital Revenue currency financial Total for distri- shareholders Minority Totalcapital reserves reserves translation assets reserves bution in TUI AG interests equity
€ million (24) (25) (26) (27)
Balance as at 1 Jan 2003 455.1 1,554.4 675.0 - 88.3 176.4 2,317.5 137.5 2,910.1 270.4 3,180.5First-time application of IAS 21(revised 2003) 0.0 0.0 0.0 - 179.9 0.0 - 179.9 0.0 - 179.9 0.0 - 179.9Dividend payments 0.0 0.0 0.0 0.0 0.0 0.0 - 137.1 - 137.1 - 16.8 - 153.9Issue of employee shares 1.1 3.2 0.0 0.0 0.0 3.2 0.0 4.3 0.0 4.3Issue of convertible bond 0.0 42.1 0.0 0.0 0.0 42.1 0.0 42.1 0.0 42.1Differences from changes in consolidation 0.0 0.0 54.5 15.6 - 0.7 69.4 0.0 69.4 2.9 72.3Differences from currency translation 0.0 0.0 0.0 - 255.3 - 1.0 - 256.3 0.0 - 256.3 - 10.0 - 266.3Changes in fair value ofavailable-for-sale financial assets 0.0 0.0 0.0 0.0 0.4 0.4 0.0 0.4 0.0 0.4Changes in fair value ofcash flow hedges 0.0 0.0 0.0 0.0 - 69.4 - 69.4 0.0 - 69.4 - 3.6 - 73.0Available-for-sale financialassets taken to income 0.0 0.0 0.0 0.0 - 202.7 - 202.7 0.0 - 202.7 0.0 - 202.7Cash flow hedges taken to income 0.0 0.0 0.0 0.0 16.9 16.9 0.0 16.9 1.6 18.5Tax items directly offsetagainst equity 0.0 - 15.0 0.0 0.0 24.0 9.0 0.0 9.0 0.7 9.7Transfers to reserves 0.0 4.4 133.2 0.0 0.0 137.6 - 137.6 0.0 0.0 0.0Group profit for the year 0.0 0.0 0.0 0.0 0.0 0.0 275.0 275.0 39.9 314.9Balance as at 31 Dec 2003 456.2 1,589.1 862.7 - 507.9 - 56.1 1,887.8 137.8 2,481.8 285.1 2,766.9
Statement of Changes in Equity as at 31 December 2002Differences Revaluation Profit Equity attri-
Sub- from reserve for available butable toscribed Capital Revenue currency financial Total for distri- shareholders Minority Totalcapital reserves reserves translation assets reserves bution in TUI AG interests equity
€ million (24) (25) (26) (27)
Balance as at 1 Jan 2002 455.1 1,550.1 938.9 - 13.2 - 36.1 2,439.7 137.5 3,032.3 350.6 3,382.9Dividend payments 0.0 0.0 0.0 0.0 0.0 0.0 - 137.1 - 137.1 - 18.8 - 155.9Differences from changes in consolidation 0.0 0.0 - 154.5 - 3.1 0.0 - 157.6 0.0 - 157.6 - 54.9 - 212.5Differences from currency translation 0.0 0.0 0.0 - 72.0 1.6 - 70.4 0.0 - 70.4 - 12.7 - 83.1Changes in fair value ofavailable-for-sale financial assets 0.0 0.0 0.0 0.0 202.5 202.5 0.0 202.5 0.0 202.5Changes in fair value ofcash flow hedges 0.0 0.0 0.0 0.0 - 76.6 - 76.6 0.0 - 76.6 - 4.2 - 80.8Available-for-sale financialassets taken to income 0.0 0.0 0.0 0.0 21.9 21.9 0.0 21.9 0.0 21.9Cash flow hedges taken to income 0.0 0.0 0.0 0.0 51.2 51.2 0.0 51.2 - 0.2 51.0Reclassification of cash flow hedgesnot affecting operating result 0.0 0.0 0.0 0.0 - 2.7 - 2.7 0.0 - 2.7 0.0 - 2.7Tax items directly offsetagainst equity 0.0 0.0 0.0 0.0 14.6 14.6 0.0 14.6 1.5 16.1Withdrawals from ortransfers to reserves 0.0 4.3 - 109.4 0.0 0.0 - 105.1 105.1 0.0 0.0 0.0Group profit for the year 0.0 0.0 0.0 0.0 0.0 0.0 32.0 32.0 9.1 41.1Balance as at 31 Dec 2002 455.1 1,554.4 675.0 - 88.3 176.4 2,317.5 137.5 2,910.1 270.4 3,180.5

123
Cash Flow Statement Financial Statements
Cash Flow Statement€ million Notes 2003 2002
Group profit for the year 314.9 41.1Depreciation, armortisation and impairments (+)/write-back (-) of fixed assets 1,325.9 983.9Other non-cash expenses (+)/income (-) - 33.3 52.8Interest expenses 241.9 325.4Profit (-)/loss (+) from disposals of fixed assets - 935.1 - 423.7Increase (-)/decrease (+) in inventories - 5.5 13.5Increase (-)/decrease (+) in receivables and other assets - 20.7 159.0Increase (+)/decrease (-) in provisions - 116.6 290.1Increase (+)/decrease (-) in liabilities (excl. liabilities to banks) 130.7 - 51.2Cash inflow/outflow from operating activities (31) 902.2 1,390.9Payments received from disposals of tangible and intangible assets 352.7 472.2Payments received from disposals of consolidated companies and financial assets(excl. disposals of cash and cash equivalents due to divestments) 1,547.9 909.3Payments made for investments in tangible and intangible assets - 589.9 - 747.8Payments made for investments in consolidated companies and financial assets and for credits and loans to third parties (excl. cash and cash equivalents received due to acquisitions) - 208.1 - 526.6Cash inflow/outflow from investing activities (32) 1,102.6 107.1Payments received from capital increases and allowances by shareholders 4.4 0.0Dividend payment by TUI AG - 137.1 - 137.1Dividend payment by subsidiaries to other shareholders - 17.1 - 18.7Payments received from the issue of loans and the raising of financial liabilities 2,033.6 2,827.4Payments made for redemption of loans and financial liabilities - 3,683.3 - 4,112.7Interest paid - 210.8 - 304.2Cash inflow/outflow from financing activities (33) - 2,010.3 - 1,745.3Net change in cash and cash equivalents - 5.5 - 247.3
Development of cash and cash equivalents (34)Cash and cash equivalents at beginning of period 366.5 643.3Change in cash and cash equivalents due to changes in consolidation 9.2 3.5Change in cash and cash equivalents due to exchange rate fluctuationsand other changes in value - 21.7 - 33.0Change in cash and cash equivalents with cash effects - 5.5 - 247.3Cash and cash equivalents at end of period 348.5 366.5

124
Notes Principles and Methods underlying the Consolidated Financial Statements
GeneralThe TUI Group’s parent company, TUI AG, is a listed stock corporationunder German law. The Company which was named Preussag Aktienge-sellschaft until 1 July 2002 has been registered in the commercial registersof the district courts of Berlin-Charlottenburg (HRB 321) and Hanover(HRB 6580). The Executive Board of TUI AG is based in Hanover, Karl-Wiechert-Allee 4.
On 26 November 2003, the Executive Board and the Supervisory Boardsubmitted the 2003 declaration of compliance with the German CorporateGovernance Code in accordance with section 161 of the German StockCorporation Act and made it permanently accessible to the general publicon the Company’s website.
The members of the Supervisory Board and the Executive Board as wellas other board memberships held by them are listed separately in thesection on corporate governance.
The TUI Group’s core business is the performance of tourism services.The services portfolio includes all activities of the tourism value chain: the organisation and coordination of package tours by tour operators, thedistribution of tours in travel agencies, the performance of flight operationsby means of Group-owned airlines, services for and accomodation ofguests in the destinations by incoming agencies or Group hotels. Anotherimportant business area is logistics. It includes an international containershipping line and cruise activities. This business area also covers companieswhich primarily render rail-based logistics services and produce, rent outand sell mobile buildings and pallets. The Group also performs industrialactivities to a small extent, which have not yet been divested in the frame-work of its strategic realignment.
The financial year of TUI AG and its subsidiaries corresponds to thecalendar year. Group reporting is based on euros. Unless stated otherwise,all amounts are indicated in million euros.

125
Principles and methods underlying the consolidatedfinancial statements
Accounting principles The consolidated financial statements of TUI AG were prepared in accor-dance with international accounting standards, the International FinancialReporting Standards (IFRS), previously International Accounting Standards(IAS), on the basis of the historical cost principle. The only deviation fromthe historical cost principle was the accounting method applied in measur-ing financial instruments. All requirements of each of the standards applied were completely fulfilled. Moreover, the provisions of IAS 1 (revised2003) ‘Presentation of Financial Statements’ and IAS 21 (revised 2003)‘The Effects of Changes in Foreign Exchange Rates’ were voluntarily appliedprior to their effective date, i.e. 1 January 2005.
The requirements of section 292a of the German Commercial Code(HGB) for an exemption from the duty to prepare consolidated financialstatements in accordance with German accounting standards were met.According to standard no. 1 of the German Accounting Standards Com-mittee (DRSC), the consolidated financial statements were in particularconsistent with the European Union Directive on Consolidated FinancialAccounting (Directive 83/349/EEC).
Changes in presentation and recognition The first-time application of the revised IAS 1 resulted in particular in anew structure of the profit and loss statement and the following changesin recognition:
Amortisation of goodwill was combined with amortisation of other intangibleassets and depreciation of property, plant and equipment under the item‘depreciation and amortisation’.
Impairment of goodwill, other intangible assets and property, plant andequipment was shown in a separate item.
Other taxes were reported under other expenses.
Earnings of associated companies and joint ventures measured at equitywere not reported under financial result as before but as a separate item.
Unlike in the previous year, the result from the discontinuance of operationswas not shown as ’of which’ disclosures any longer but was carried as aseparate item in the profit and loss statement. For this reason, the previous
Notes on the Principles and Methods Financial Statements

126
Financial Statements Notes on the Principles and Methods
year’s figures from other lines of the profit and loss statement, in particularother income and expenses, were reclassified.
Unlike previous years, subtotals for ‘Operating result’, ‘Results by divisions’and ‘Profit on ordinary activities’ were not shown in the profit and lossstatement any longer.
The previous year’s profit and loss statement was presented in line withthe new provisions relating to structure and recognition. In order toenhance comparability with the previous year, scheduled amortisationand impairment of goodwill as well as other taxes were disclosed as an‘of which’ disclosure in the profit and loss statement for the last time.Disclosures on the reclassifications made were provided under the res-pective items of the profit and loss statement.
In the framework of the first-time application of the revised IAS 1, thebalance sheet was also restructured. The presentation followed the maturityof current and non-current assets and liabilities. Deferred tax items wereclassified as non-current, irrespective of their actual maturity, while tradeaccounts receivable and payable were recognised as current, irrespectiveof their actual maturity.
Allocation of goodwill to individual segments and business areas In accordance with the IFRS rules, acquired goodwill should always beallocated to individual segments as assets unless reasonable allocation ofgoodwill is impossible.
In the framework of its strategic realignment, the TUI Group acquiredgoodwill incorporating considerable synergy potential and cross-segmentalstrategic competitive benefits in addition to the earnings potentials ofthe companies acquired. It was therefore impossible to unambiguouslyallocate this goodwill to the segment or business area in which the acquiredsubsidiary operated immediately after the acquisition of the shares. Hence,e.g. the goodwill from the 1998 acquisition of Hapag Lloyd AG was notclearly allocatable as this acquisition prepared the ground for the creationof an integrated tourism group apart from ensuring entrance into thecontainer shipping market.
The divestments of companies made in the completed financial year andthe approval of the concept for the realignment of the logistics divisionby the Supervisory Board at its meeting on 21 January 2004 completedthe realignment of the Group towards a pure services group focusing onthe tourism and shipping sectors. In the framework of the measures

127
planned in this context, it has been possible to allocate goodwill to thesegments and business areas retained for the future.
Accordingly, goodwill as at 31 December 2003 was presented as assets ofthe individual segments and business areas. The amortisation of thisgoodwill was also reported as an expense of the respective segment orbusiness area.
Due to the allocation of goodwill as assets to the individual segments orbusiness areas, the accounting method for the currency translation ofgoodwill was changed and IAS 21 (revised 2003) was applied for the firsttime prior to its effective date.
Due to the recognition of goodwill as assets of the segments and businessareas, goodwill was recognised in the functional currency of the subsidiaryand translated in the framework of the preparation of the consolidatedfinancial statements. Differences resulting from changes in exchange ratesbetween the exchange rate at the date of acquisition of the subsidiaryand the exchange rate at the balance sheet date were treated with noeffect on results, in analogy to other differences from the translation offinancial statements of foreign subsidiaries, and shown separately underequity.
In the past, goodwill was translated at historical exchange rates andreported in the Group’s functional currency (euro). The accounting andmeasurement method was changed for all goodwill from the acquisitionof subsidiaries purchased since 1 October 1995 in accordance with therules of the revised IAS 21 without adjusting the previous year’s figures.
If goodwill had already been reported in the subsidiaries’ functional cur-rencies in the previous year, the carrying amount of goodwill would havebeen € 166.1 million below the carrying amount shown in the consolidatedfinancial statements as at 31 December 2002 due to the accumulatedcurrency differences since the date of acquisition. The Group’s equitywould have been reported correspondingly lower due to the currencydifference. The translation of the amortisation of goodwill at averagerates would have increased earnings by € 4.9 million in the previous year.
The change in accounting provisions also applied to the accounting ofgoodwill of companies measured at equity. If the principles had alreadybeen applied in the previous year, the carrying amounts of the companiesmeasured at equity and equity as at 31 December 2002 would have beenstated € 13.8 million below the actually reported amounts. In the previous
Notes on the Principles and Methods Financial Statements

128
year, earnings from equity measurement would have been € 0.5 millionhigher due to the translation of foreign currencies.
The currency difference from the translation of goodwill, taken directly toequity, totalled € 403.7 million as at 31 December 2003.
Principles and methods of consolidationThe consolidated financial statements included all major companies inwhich TUI AG was able, directly or indirectly, to determine the financialand operating policies so as to obtain benefits from the activity of thesecompanies (subsidiaries). As a rule, the control was exercised by meansof a majority of voting rights in the management bodies, in individualcases by means of contractual regulations. These companies were includedin the consolidated financial statements as from the date at which theTUI Group gained control. When the TUI Group ceased to control thesecompanies, they were taken out of consolidation.
The consolidated financial statements were prepared on the basis of theindividual or consolidated financial statements of TUI AG and its subsidiaries,prepared on the basis of uniform acccounting, measurement and consoli-dation methods and provided with an audit certificate.
Shareholdings in companies in which the Group was able to exert signifi-cant influence over the financial and operating decisions within thesecompanies were carried at equity (associated companies). Companiesmanaged jointly with one or several partners ( joint ventures) were notincluded on the basis of proportionate consolidation but also measuredat equity.
Equity measurement in each case was based on the last audited annualor consolidated financial statements. The determination of the dates forinclusion in and removal from the group of associated companies andjoint ventures measured at equity was analogous to the principles apply-ing to consolidated subsidiaries.
Group of consolidated companiesIn the financial year under review, the consolidated financial statements in-cluded a total of 62 domestic and 369 foreign subsidiaries, besides TUI AG.
76 domestic and 173 foreign subsidiaries were not included in the consoli-dated financial statements. Even when taken together, these companieswere not significant for the presentation of a true and fair view of thefinancial position and performance of the Group.
Financial Statements Notes on the Principles and Methods

129
Development of the group of consolidated companies1)
and the group of companies carried at equityBalance Balance
31 Dec 2002 Additions Disposals 31 Dec 2003
Consolidated subsidiaries 481 33 83 431of which in Germany 82 6 26 62of which abroad 399 27 57 369Associated companies 20 2 3 19of which in Germany 4 1 1 4of which abroad 16 1 2 15Joint ventures 28 – 1 27of which in Germany 7 – – 7of which abroad 21 – 1 20
1) excl. TUI AG
As in the previous year, the additions to the group of consolidated com-panies almost exclusively related to the tourism division with 26 companies.18 of these companies were consolidated for the first time in the NorthernEurope sector, four in the destinations sector and three in the CentralEurope sector as well as one in the Western Europe sector. These addi-tions included seven companies included in consolidation for the firsttime due to acquisitions of shares. On 1 January 2003, the participationin a specialist tour operator for educational tours in the Central Europe sector was increased to a shareholding of more than 50%. The remainingacquisitions of shareholdings related to one specialist tour operator forsports tours (three companies), one TV-based distribution organisation(two companies) in the Northern Europe sector, and one Mexican incomingagency. Acquisition costs for these companies totalled approx. € 22.8 million. Furthermore, 14 newly created companies and five companiesexpanding their business activities were included in consolidation for thefirst time.
Alongside the additions to consolidation in the tourism division, sevencompanies were included in the group of consolidated companies in the‘Other/consolidation’ sector, mainly due to the expansion of their businessoperations.
The additions to the group of consolidated companies were offset by theremoval of a total of 83 companies from consolidation in the 2003 financialyear. 27 of these removals related to discontinuing operations due todivestments of companies. First of all, the activities of the energy sectorwere completely divested in two transactions as at 31 May and 30 June2003. Another 25 companies were removed from consolidation due to thedivestment of the Amalgamated Metal Corporation Group (AMC Group)
Notes on the Principles and Methods Financial Statements

130
operating in the trading sector. Disclosures on discontinuing operationsare outlined under note 9.
Another 31 companies were removed from consolidation with their indivi-dual financial statements as a result of mergers; the remaining 25 removalsprimarily related to companies that restricted their business activities orwere liquidated in the year under review. 45 of these companies werepreviously operating in the tourism division, three each in the logisticsdivision and the former industrial sector, and five companies in the‘Other/consolidation’ sector.
Effects of additions to and removals from consolidation Balance sheet Additions Disposals€ million 31 Dec 2003 31 Dec 2002
Non-current assets 47.4 715.3Current assets 23.9 561.1Provisions 4.3 409.7Financial liabilities 15.5 192.0Other liabilities 19.1 151.9
Effects of additions to and removals from consolidationProfit and loss statement Additions Disposals Disposals€ million 2003 2003 2002
Total turnover1) 146.4 1,607.9 2,886.8Operating income 2.5 16.5 102.4Operating expenses 147.3 1,597.3 2,821.4Financial result 0.8 1.9 6.3At equity result – – 1.1Earnings before taxes on income 2.4 29.0 175.2Income taxes 0.7 15.5 55.5
1) Total turnover also includes turnover generated with consolidated Group companies
As at 31 December 2003, 19 associated companies and 27 joint ventureswere measured at equity. The group of companies measured at equitydeclined by two companies compared with the previous year.
Two companies were added to equity measurement while four wereremoved. The additions exclusively resulted from acquisitions of share-holdings. The removals from the group of companies measured at equityresulted from the full consolidation of one company which gained controlover these companies in the financial year under review, and for the mostpart from sales of shares.
Financial Statements Notes on the Principles and Methods

131
Details concerning the major indirect and direct subsidiaries, associatedcompanies and joint ventures of TUI AG are listed in a separate annex tothe notes. A complete list of shareholdings has been deposited with thecommercial registers of the district courts of Berlin-Charlottenburg andHanover.
Currency translationThe financial statements of the foreign subsidiaries were translatedaccording to the functional currency concept. As from TUI AG’s perspective,all companies were financially, economically and organisationally autono-mous, the respective functional currency corresponds to the currency ofthe country of incorporation of the company. Assets and liabilities, balancesheet notes as well as goodwill allocated to foreign subsidiaries were trans-lated at the mid exchange rate applicable at the balance sheet date (closingrate); the items of the profit and loss statement and hence the profit forthe year shown in the profit and loss statement were translated at theannual average rate.
In subsidiaries operating in hyperinflationary economies, the translationof the income and expense items governed by the changed purchasingpower conditions, including the profit for the year, was effected at therespective closing rate. Prior to translation at the closing rate, the carry-ing amounts of the non-monetary balance sheet items of these companieswere adjusted to the changes in prices recorded during the financial yearon the basis of appropriate indices for measuring purchasing power. Thepurchasing power gains or losses resulting from the indexing were carriedas interest income or expenses with an effect on results.
The translation of the financial statements of foreign companies measuredat equity followed the same principles for adjusting equity and translatinggoodwill as those used for consolidated companies.
All differences resulting from the translation of the financial statements offoreign subsidiaries were carried with no effect on results and separatelyshown under revenue reserves. These currency differences were recognisedas income or expenses in the year in which these subsidiaries were removedfrom consolidation.
Notes on the Principles and Methods Financial Statements

132
Exchange rates of relevant currenciesClosing rate Average rate
€ 31 Dec 2003 31 Dec 2002 2003 2002
1 Pound Sterling 1.41 1.54 1.45 1.591 US Dollar 0.79 0.96 0.88 1.06100 Swiss Francs 64.14 68.85 65.76 68.17100 Swedish Kronas 11.02 10.93 10.96 10.91
Consolidation methodsCapital consolidation was based on the purchase method of accountingby eliminating acquisition costs against the acquiree’s equity attributableto the parent company at the acquisition date. Any excess of acquisitioncosts over net assets acquired was recognised as goodwill and amortisedagainst income over the expected useful life for all companies purchasedsince 1 October 1995; any goodwill from subsidiaries purchased beforethat date continued to be eliminated against revenue reserves. As a matterof principle, any negative goodwill from capital consolidation was carriedas a deduction from capitalised goodwill and systematically amortisedover the useful lives of the non-monetary assets of the companies. Inaccordance with the provisions of IAS 21 (revised 2003), goodwill andnegative goodwill were recognised as an asset of the acquired subsidiarysince 1 January 2003.
In the wake of the removal from consolidation, the differences betweenthe results generated by the subsidiaries during the period of inclusion inGroup consolidation and the results of the subsidiary carried in the annualfinancial statements of the parent company were recognised with an effecton results. In the case of a disposal of goodwill of subsidiaries acquiredbefore 1 October 1995 in companies leaving the group of consolidatedcompanies, the elimination against revenue reserves with no effect onresults effected in the past was reversed. Minority interests in the netassets of the subsidiary were removed from consolidation with no effecton profits.
The main associated companies and joint ventures of the Group weremeasured at the acquiree’s equity attributable to the parent company as ofthe acquisition date (equity method) and shown in the balance sheet andin the statement of changes in fixed assets under ‘Associated companiesor joint ventures measured at equity’. Concerning the treatment of remain-ing differences, the principle applied in capital consolidation was alsoapplied to the companies measured at equity, with goodwill contained inequity measurement. The ‘Result from companies measured at equity’contained both the share of these companies in the profit for the year
Financial Statements Notes on the Principles and Methods

133
after taxes and the amortisation of goodwill of these companies. Where theaccounting and measurement methods applied by associated companiesand joint ventures differed from the uniform accounting rules applied inthe Group, amendments were made unless the relevant facts were notsufficiently known or accessible.
Intra-group receivables and liabilities or provisions were eliminated. Wherethe conditions for a consolidation of third-party liabilities were met, thisconsolidation method was applied.
Intercompany turnover and other income from intercompany transactionsas well as the corresponding expenses were eliminated. Intercompanyprofits and losses from intra-group deliveries or services were eliminatedwith an effect on results, with deferred taxes taken into account. Intra-group deliveries and services were usually provided in conformity with thearm’s length principle. Intercompany profits from deliveries to and fromcompanies measured at equity were eliminated on the basis of the sameprinciples when the corresponding facts were known.
Accounting and measurementThe financial statements of the subsidiaries included in the TUI Groupwere prepared in accordance with uniform accounting and measurementprinciples. The amounts stated in the consolidated financial statementswere not determined by tax regulations but solely by the commercial presentation of the financial position as set out in the rules of the IASB.
As a matter of principle, turnover and other income was reported uponrendering of the service or delivery of the assets and hence upon transferof the risk. For tourism services, the turnover was recognised according tothe proportion of contract performance within the tourism value chain.The commisson income from package tours of non-Group tour operatorssold by the travel agencies was recognised upon payment by the customers;however, upon departure at the latest. Commission income from Groupproducts sold was not recognised until upon departure of the customers.The services of tour operators mainly consisted in the organisation andcoordination of package tours. Turnover from the organisation of tourswas therefore recognised upon start of the tour. Turnover generated indownstream stages of the tourism value chain such as hotel and flightservices was recognised when the customers had used the respective service. Revenue from services in the logistics division was recognised onan accrual basis.
Notes on the Principles and Methods Financial Statements

134
Financial Statements Notes on the Principles and Methods
Interest expenses and income were reported on an accrual basis. As arule, dividends were reported when the legal claim had arisen.
Transaction costs on the issue of shares, conversion options or warrantswere eliminated against the capital reserves formed for the issue with noeffect on results.
Assets were capitalised when all material risks and rewards incident toownership were attributable to the Group. Assets were measured atamortised cost, with the exception of certain financial assets.
The cost of purchase comprised all costs incurred to purchase an assetand bring it to working condition. The cost of conversion was determinedon the basis of direct costs and appropriate allocations of overheads anddepreciation. The cost of finance for the acquisition or the period ofconversion was not capitalised.
Intangible assets were amortised and property, plant and equipment witha limited service life depreciated over the expected useful life unless adifferent amortisation or depreciation method was more appropriate inunusual cases due to the actual development of the useful life. Impairmenttests of assets were implemented where an impairment was indicated bycertain events or indications. Impairment was charged where the futurerecoverable amount flowing to the Group from the asset was below itscarrying amount. The recoverable amount of an asset was the net sellingprice or present value of future cash flows expected to arise from theasset, if higher (value in use). Where the original causes for impairmentcharged in previous years no longer applied, the impairment was writtenback to other income.
Goodwill acquired since 1 October 1995 was capitalised and amortisedsystematically with an effect on results. The amortisation of goodwill tookaccount of the strategic importance of the acquisition of the companyand a number of other factors impacting on the useful life and was chargedon a straight–line basis over a period of five to a maximum of twentyyears. In the case of additions during the financial year, the amortisationof goodwill was effected on a pro rata temporis basis. As in previousyears, goodwill from subsidiaries purchased before 1 October 1995 wasoffset against revenue reserves. The release of negative goodwill with aneffect on results was carried in the profit and loss statement togetherwith the amortisation of goodwill.

135
Other purchased intangible assets were carried at cost. Self-generatedintangible assets, primarily software used by the Group itself, were capi-talised at cost where an inflow of future economic benefits for the Groupwas probable and could be reliably measured.
Useful lives of other intangible assetsUseful lives
Concessions, industrial property rights and similarrights and values (excl. software) Up to 20 yearsSoftware Up to 10 years
Property, plant and equipment were measured at cost, less scheduledwear-and-tear depreciation and in individual cases impairments. Investmentgrants received were shown as reductions in cost where these grants weredirectly attributable to individual tangible asset items. Where a directallocation of grants was not possible, the grants received were carried asdeferred income under ‘Other liabilities’ and released in accordance withthe useful life of the investment project.
For aircraft, residual values of up to 20% of the acquisition costs werededucted in determining depreciation; for vessels and in justified casesfor machinery and fixtures, scrap values were deducted as residual values.
Low-cost capital assets were written off in full in the year of acquisitionand shown as disposals.
Useful lives of property, plant and equipmentUseful lives
Hotel buildings 25 yearsOther buildings Up to 50 yearsTank farms Up to 25 yearsOther technical plants and machinery Up to 40 yearsContainer ships 23 yearsOther ships and wagon fleet Up to 30 yearsAircraft and spare parts for aircraft Up to 18 yearsOperating and business equipment Up to 10 years
The repair and maintenance costs of property, plant and equipment wererecognised as expenses. Replacement and renewal costs were recognisedas subsequent costs of conversion when they led to a considerableextension of the useful life or a substantial improvement or major changein the use of the tangible asset.
Notes on the Principles and Methods Financial Statements

136
Financial Statements Notes on the Principles and Methods
In accordance with the criteria of IAS 17, leased property, plant andequipment in which the TUI Group carried all the risks and rewards incidentto ownership of the assets (finance leases) were measured at the costthat would have been incurred if the assets had been purchased or thenet present value of the minimum lease payments, if lower. Depreciationwas charged over the economic life or the lease term, if shorter, on thebasis of the depreciation method applicable to comparable purchased ormanufactured assets. The payment obligations arising from future leasepayments were carried as liabilities, with no consideration of future interestexpenses.
Real estate which was exclusively held to generate rental income and profits from capital appreciation (investment property) was recognised atamortised cost.
Inventories were measured at the lower of cost or net realisable value.Net realisable value was the estimated selling price less the estimatedcost incurred until the sale. All inventories were written down individuallywhere the net realisable value of inventories was lower than their carryingamounts. Where the original causes of inventory write-downs no longerapplied, the write-downs were reversed. The measurement method appliedto like inventory items was the weighted average cost formula.
Financial assets were recognised at cost upon acquisition. Marketablefinancial assets were recognised for the first time at the settlement date,i.e. the day on which the asset was delivered. Primary financial instrumentswere measured depending on the Company’s intention to hold them. Inthe TUI Group, the instruments were either classified as available-for-saleor as loans and receivables originated by the Company. As a matter ofprinciple, derivative financial instruments were concluded and classifiedas hedges.
Besides all purchased securities, available-for-sale financial assets com-prised all shares in non-consolidated Group companies and shareholdings.They were initially measured at cost and subsequently at the fair value ofthe financial assets. The changes in the fair values between the date ofacquisition and the balance sheet date were recognised in the revaluationreserve with no effect on results. Upon selling these financial assets, theaccumulated gain or loss was recognised in the profit and loss statementwith an effect on results. Where a substantial impairment existed in additionto the fluctuations in value customary in the market, the accumulated losspreviously shown in equity gave rise to impairments in the result for theperiod. Where no fair value listed on an active market existed for shares

137
in non-consolidated Group companies and other methods for the deter-mination of an objective fair value were not applicable due to the affilia-tion to the Group, the shares were measured at amortised cost.
Loans and receivables originated by the Company – including loans aswell as all receivables and other assets – were measured at amortisedcost. Where companies of the TUI Group were lessors of finance leases,an interest-bearing receivable was recognised at the present value of theminimum lease payments. Concerning these items, all identifiable indivi-dual risks and the general credit risk supported by empirical informationwere accounted for by means of appropriate value discounts.
As a rule, liabilities were carried as they arose at the value of the consi-deration received after deduction of the costs of borrowing. In the sub-sequent period, liabilities were measured at amortised cost using theEffective Interest Method. For the issue of financial instruments comprisingboth a liability and an equity element in the form of conversion options orwarrants, the financial resources received for the respective componentwere reported in accordance with their character. In this regard, bonds werereported at the value that would have been achieved by the issue of thisdebt instrument without the equity element and on the basis of currentmarket conditions. Consequently, the amount transferred to capital reserves– taking into account deferred taxes – was the difference arising on theissuing proceeds.
In the individual financial statements, foreign currency receivables and lia-bilities were measured at the rate of exchange at the balance sheet date.The currency differences resulting from the translation of foreign currencyreceivables and liabilities were reported under cost of purchased servicesand materials when they had arisen in the wake of normal operating pro-cesses, or under other operating expenses and income when they wereattributable to other facts.
In accordance with IAS 39, derivative financial instruments were carried atfair value. When the derivative financial instruments had been enteredinto to hedge exposure to changes in the fair value of recognised assetsand liabilities (fair value hedges), changes in fair values and changes inthe fair value of the underlying hedged item were immediately recognisedin the result for the period. When the derivative financial instruments hadbeen entered into to hedge future cash flows (cash flow hedges) such asplanned purchases of aircraft fuel, all changes in the fair value of thesefinancial instruments were recognised in the revaluation reserve for financialinstruments with no effect on results until the underlying hedged trans-
Notes on the Principles and Methods Financial Statements

138
Financial Statements Notes on the Principles and Methods
action occurred. When a hedged future transaction gave rise to the re-cognition of an asset, the accumulated gains and losses from the derivativefinancial instrument directly recognised in equity were shown as a reduc-tion or increase in cost. When the hedged item was a hedged expense orincome item, the accumulated gains or losses from the hedge were realisedas income or expense of the period when the hedged item affected netprofit or loss. When in unusual cases the necessary criteria for hedgeaccounting under IAS 39 were not met by individual derivative financialinstruments, the changes in fair values were immediately recognised inthe result for the period.
Provisions were formed for uncertain third-party obligations where theseobligations were expected to lead to a future outflow of resources. Theywere carried at the anticipated settlement amount, taking into account allrelated identifiable risks, and were not offset against indemnification claims.Long-term provisions, insofar as there was a material effect, were reportedat their net present value, with future cost increases taken into account inthe computation of the settlement amount. Pension provisions wererecognised using the projected unit credit method in accordance with IAS19 (revised 2002). Current income tax provisions – provided they existedin the same fiscal territory and were congruent in terms of nature andmaturity – were offset against the corresponding tax refund claims.
In accordance with IAS 12 (revised 2000), the accounting and measurementof deferred taxes followed the balance sheet liability method on the basisof the tax rate applicable at the date of realisation. The fiscal consequencesof profit distribution were only taken into account once a resolution wasadopted on appropriation of profits. For the expected tax benefits relatingto losses carried forward which were assessed as realisable in future,deferred tax assets were reported.
The preparation of the consolidated financial statements was based on anumber of assumptions and estimates which had an effect on the valueand presentation of the reported assets, liabilities, income and expensesas well as contingent liabilities. The assumptions and estimates mainlyrelated to the fixing of uniform economic lives, the accounting and mea-surement of provisions and the realisability of future tax savings. Theassumptions underlying the respective estimates were outlined under thenotes to the individual items of the profit and loss statement and thebalance sheet. Actual values may vary from the assumptions and estimatesmade in individual cases. Changes were accounted for with an effect onresults by the time new information was available.

139
Notes on the accounting and measurement methods deviating from German law Under the rules of IAS 21 (revised 2003) and IAS 39, all foreign currencyreceivables and liabilities had to be translated at the rate of exchange atthe balance sheet date. All derivative financial instruments and available-for-sale securities had to be recognised at their fair values. As a result,the profit and loss statement or equity also included unrealised gains.These rules deviated from the historical cost, realisation and imparityprinciples to be applied under German commercial law.
In accordance with IAS 12 (revised 2000), the accounting and measure-ment of deferred taxes followed the balance sheet liability method ratherthan the German Commercial Code. Tax savings from future loss carryfor-wards assessed as realisable were carried in the balance sheet as deferredtax assets.
Under IFRS, income by tour operators was recognised at the date ofdeparture of the customers. Under commercial law, income and profitswere recognised at the end of a tour.
Whereas liabilities were carried at the repayable amounts under commerciallaw, liabilities were reported in accordance with IFRS rules after deductionof the cost of borrowing at the value of the consideration received. Deviat-ing from commercial law, the costs arising in conjunction with the issue ofshares and subscription rights were treated with no effect on profits anddirectly deducted from the capital reserve.
Furthermore, in contrast to German law, self-generated intangible assetssuch as computer software were recognised, and no provisions were formedfor omitted maintenance activities carried out within three months. More-over, the provisions for supplier invoices not yet received were carried astrade accounts payable due to the high probability of the outflow ofresources under the IFRS rules.
Notes on the Principles and Methods Financial Statements

140
Financial Statements Notes on the Principles and Methods
Segment reporting
Notes on the segmentsIn segment reporting, the business activities of the TUI Group were attributed to the tourism, logistics and the former industry divisions. Thesegmentation of the Group reflected the Group’s internal control andreporting structure. The sole criterion for the classification of the individualgroups of companies was their economic affiliation to the divisions andsectors, rather than their participation structure under company law.
The tourism division covered all tourism companies of the Group with theexception of the cruise activities of Hapag-Lloyd AG which were reported inthe logistics division. As the Group’s business activities focused on tourism,the tourism division was additionally subdivided into the five sectors Central Europe, Northern Europe, Western Europe, Destinations andOther tourism activities. This classification mainly followed geographicalaspects and the respective functions within the value chain. While touroperating, distribution and the Group’s airlines were classified into thethree sectors Central Europe, Northern Europe and Western Europeaccording to the customers’ countries of origin, the Group’s tourism activities in the destinations were reported under the ‘destinations’ sector.‘Other tourism’ covered the Group’s tourism companies not directlyassociated with the organisation and implementation of holiday tours.
The Central Europe sector was formed by the distribution and touroperating activities in Germany, Switzerland, Austria and Poland. Hapag-Lloyd Fluggesellschaft mbH was also included in this sector.
The Northern Europe sector covered the travel agencies and tour operatorsin the UK and Ireland operating under TUI Northern Europe as well asthe Nordic countries Sweden, Denmark, Norway and Finland. BritanniaAirways UK and Britannia Airways Nordic airlines, operating from the UKor Sweden and Norway, respectively, were also covered by this sector.
The distribution and tour operating activities in France, the Netherlandsand Belgium were combined in the Western Europe sector. The airlineCorsair S.A., operating on the French market, was also included in thissector.
The activities implemented by the destinations sector included cateringfor the needs of guests, transfers between airports and hotels as well asthe organisation and implementation of day trips, circular trips and otherevents by the Group’s own agencies. This sector also covered the Group’s

141
hotel companies and the companies of the Anfi Group, engaging in theconstruction and sale of time-sharing complexes.
Other tourism/consolidation mainly covered the companies managed byTUI Business Travel Deutschland GmbH and performing business travelorganisation and agency functions. This segment also covered central services companies offering cross-sectoral functions such as the provisionof EDP services and central hotel purchasing. In addition, this sector in-cluded the consolidation of relationships between the tourism sectors.
The logistics division provided services in the shipping and specialistlogistics sectors. The shipping sector covered both transport services forcontainer shipping and cruise activities. Specialist logistics provided trans-port and service activities for the chemical industry and the mineral oilindustry. This sector also included the manufacture and rental of mobilebuildings and pallets.
The former industry division comprised the energy and trading sectorsand included the building engineering sector in the previous year. Due tothe divestments already completed or planned for the individual sectors,the industry division represented a discontinuing operation. Detailedinformation on discontinuing operations is provided under note 9.
The energy sector comprised Preussag Energie GmbH. The activities ofPreussag Energie GmbH covered the exploration and production of crudeoil and natural gas. The activities of the energy sector were completelydivested in two transactions with effect from 31 May and 30 June 2003.
With the termination of the control of the Fels Group as at 1 May 2002,the discontinuation of the building engineering sector was already com-pleted in the previous year.
The trading sector covered the US steel service companies. The companiestraded in products for the steel-processing industry on the North Americanmarket. The companies of the AMC Group, which were divested in theframework of an MBO model, were also covered by the trading sector until31 October 2003. The trading sector represented another discontinuingoperation.
Notes on the Principles and Methods Financial Statements

142
TUI AG, the Group’s holding company, was responsible both for cross-divisional functions such as finance, taxes and legal affairs but also oper-ative management functions for the tourism division, including in particularthe central management of the uniform tourism master brand World ofTUI. Along with other activities which could not be allocated to individualsectors and with consolidations of relationships between the segments,TUI AG’s cross-divisional functions were therefore shown as a separatereporting unit under ’Others/consolidation’. Besides TUI AG, this sectoralso covered low-cost carriers Hapag-Lloyd Express GmbH, founded in2002, and Budget Air Ltd., founded in 2003. The Group’s real estate com-panies were also included in this segment. The ‘Others/consolidation’ sectoralso included Wolf GmbH as the original intention to divest this companyhas initially been postponed.
Notes on the segment dataAs a rule, inter-segment turnover was generated in line with the arm’slength principle, applied in transactions with third parties.
The non-interest-bearing segment assets and liabilities comprised theassets or liabilities required for the operation, excluding interest-bearingassets and liabilities as well as income taxes. Goodwill was also shown assegment assets. In order to enhance comparability, the previous year’svalues were adjusted in segment reporting. Accordingly, goodwill was alsorecognised as non-interest-bearing segment assets for the previous year.However, goodwill was not carried in foreign currency in the previous year.
Capital expenditure covered additions of property, plant and equipmentand intangible assets.
Depreciation was related to segment assets and also included the amortisation and impairment of goodwill.
Depreciation was not taken into account in the determination of non-cash expenses.
Interest-bearing assets and cash equivalents were used to generate thefinancial result, while interest-bearing liabilities were used to fund theoperating and investing activities.
The reconciliation of segment assets and liabilities to the Group’s assetsor liabilities resulted from the consideration of the income tax claims orincome tax provisions and liabilities not taken into account in accordancewith IAS 14.
Financial Statements Notes on the Principles and Methods

143
Segment reporting also disclosed additional earnings ratios such as EBT,EBTA, EBITDA and EBITDAR as these ratios were also used as the controlbasis for value-oriented corporate management. For the determination ofthe earnings ratios, the ‘result from discontinuance of operations’ wasagain allocated to the individual types of income and expenses, in linewith its nature. This applied in particular to the impairment of goodwill (€ 14.3 million) and fixed assets (€ 30.0 million) in the specialist logisticssector.
Notes on the Principles and Methods Financial Statements
Reconciliation of Group profit for the year to earnings ratios € million Reference 2003 2002
Group profit for the year Profit and loss statement 314.9 41.1Income taxes Profit and loss statement - 68.9 + 185.8Earnings before taxes (EBT) 246.0 226.9Amortisation of goodwill Note 6 278.9 278.3Impairment of goodwill Note 7 382.9 55.0Amortisation of goodwill of ‘associated companies and joint ventures measured at equity’ Note 11 5.5 14.5Write-backs of goodwill 0.0 0.0Earnings before taxes and amortisation of goodwill (EBTA) 913.3 574.7Amortisation of other intangible assets and depreciation of property, plant and equipment Note 6 599.0 626.6Impairment of other intangible assets and property, plant and equipment Note 7 49.2 0.4Impairment of available-for-sale financial assets Note 10 11.1 66.2Write-backs and post-capitalisation of other intangible assets and property, plant and equipment, available-for-sale financial assets and inventories 8.7 6.2Earnings before taxes, depreciation and amortisation (EBTDA) 1,563.9 1,261.7Interest income Note 10 88.9 95.2Interest expenses Note 10 241.9 325.0Earnings from value adjustments of financial assets not incorporated in hedges Note 10 + 3.7 - 9.6Earnings before interest, taxes, depreciation and amortisation (EBITDA) 1,713.2 1,501.1Operating rental expenses Note 4/note 8 674.8 554.8Earnings before interest, taxes, depreciation and amortisation and rental expenses (EBITDAR) 2,388.0 2,055.9

144
Financial Statements Segment Reporting
Key Figures by Divisions and SectorsTourism Logistics Energy*)
€ million 2003 2002 2003 2002 2003 2002
Statement of resultsThird-party turnover 12,671.3 12,416.2 3,915.1 3,777.3 176.9 448.2Inter-segment turnover 29.7 15.4 0.4 0.4 0.0 0.0Segment turnover 12,701.0 12,431.6 3,915.5 3,777.7 176.9 448.2Earnings before taxes on income (EBT) - 439.2 51.9 296.3 195.9 20.2 139.4Amortisation of goodwill 642.5 275.1 17.0 3.0 0.0 - 2.0Amortisation of goodwillof companies measured at equity 4.8 9.0 0.6 0.6 0.0 0.0Earnings by divisions (EBTA) 208.1 336.0 313.9 199.5 20.2 137.4Amortisation of other intangible assets and depreciation of property, plant and equipment 330.6 310.9 213.2 211.2 19.2 47.2Other depreciation/amortisation and write-backs - 1.4 5.7 - 4.6 0.9 0.0 0.0Interest result 8.5 26.9 - 16.4 - 24.5 - 1.1 0.0Earnings before interest, taxes, depreciationand amortisation (EBITDA) 531.6 614.3 548.1 434.3 40.5 184.6Rental expenses 471.5 424.0 151.2 111.2 0.4 2.1Earnings before interest, taxes, depreciation,amortisation and rental expenses (EBITDAR) 1,003.1 1,038.3 699.3 545.5 40.9 186.7
Segment assets and liabilitiesNon-interest-bearing segment assets 7,683.1 8,807.6 2,704.2 2,844.9 0.0 779.3of which goodwill (3,777.2) (4,712.1) (30.7) (48.1) (0.0) (- 6.5)Carrying amounts of companies measured at equity 317.3 332.1 9.8 11.5 0.0 0.0Interest-bearing assets and cash and cash equivalents 1,233.2 1,367.1 164.2 167.7 0.0 105.4Segment assets 9,233.6 10,506.8 2,878.2 3,024.1 0.0 884.7Non-interest-bearing segment liabilities 3,335.0 3,258.7 986.9 1,005.8 0.0 419.2Interest-bearing segment liabilities 1,459.5 1,338.3 630.9 510.4 0.0 177.1Segment liabilities 4,794.5 4,597.0 1,617.8 1,516.2 0.0 596.3
Additional disclosuresAt equity result 35.2 13.3 2.7 - 3.0 0.0 0.0of which operating result (40.0) (22.3) (3.3) (- 2.4) (0.0) (0.0)of which amortisation of goodwill (4.8) (9.0) (0.6) (0.6) (0.0) (0.0)Non-cash expenses 1.6 22.9 2.5 0.0 0.0 0.0Return on sales (% on EBTA) 1.6 2.7 8.0 5.3 11.4 30.7Investments 518.0 615.0 158.7 329.5 24.4 60.5Investments in goodwill 85.9 263.8 1.2 54.4 0.0 0.0Investments in other intangible assetsand property, plant and equipment 432.1 351.2 157.5 275.1 24.4 60.5Financing ratio (%) 187.9 95.3 145.1 65.0 78.7 74.7Personnel at year-end 51,708 55,013 9,235 9,307 0 681
*) Discontinuing operation
Key figures by regionsGermany EU (excl. Germany) Rest of Europe
€ million 2003 2002 2003 2002 2003 2002
Consolidated turnover by customers 2,368.7 2,751.7 10,278.2 11,220.3 921.0 925.6Consolidated turnover by domicile of companies 8,480.0 8,742.0 9,547.1 10,081.6 246.5 310.9Non-interest-bearing segment assets 4,579.9 5,632.3 5,970.1 7,091.0 100.0 112.9of which goodwill (701.0) (735.1) (3,044.5) (3,949.2) (18.2) (19.7)Non-interest-bearing segment liabilities 2,754.7 2,804.9 2,472.6 2,473.3 69.8 78.9
Additional disclosuresDepreciation/amortisation 413.8 446.4 862.8 473.6 9.9 12.7Investments 248.9 400.4 418.3 552.6 4.7 11.4Investments in goodwill 10.4 54.2 75.5 261.6 0.0 0.5Investments in other intangible assetsand property, plant and equipment 238.5 346.2 342.8 291.0 4.7 10.9Personnel at year-end 18,860 20,117 36,539 39,135 2,274 2,421

145
Segment Reporting Financial Statements
Building engineering*) Trading*) Other/consolidation Group2003 2002 2003 2002 2003 2002 2003 2002
0.0 202.7 2,056.0 3,150.4 396.1 307.6 19,215.4 20,302.40.0 0.0 0.0 0.0 - 30.1 - 15.8 0.0 0.00.0 202.7 2,056.0 3,150.4 366.0 291.8 19,215.4 20,302.40.0 - 57.9 12.2 49.7 356.5 - 152.1 246.0 226.90.0 52.6 0.0 0.9 2.3 3.7 661.8 333.3
0.0 0.0 0.0 0.0 0.1 4.9 5.5 14.50.0 - 5.3 12.2 50.6 358.9 - 143.5 913.3 574.7
0.0 15.2 14.4 18.8 70.9 23.7 648.3 627.00.0 0.0 - 0.3 - 0.6 7.7 - 75.6 1.4 - 69.60.0 - 6.9 - 3.8 - 4.1 - 140.2 - 221.2 - 153.0 - 229.8
0.0 16.8 30.7 74.1 562.3 177.0 1,713.2 1,501.10.0 2.8 7.2 8.4 44.5 6.3 674.8 554.8
0.0 19.6 37.9 82.5 606.8 183.3 2,388.0 2,055.9
0.0 0.0 292.0 594.1 558.1 566.4 11,237.4 13,592.3(0.0) (0.0) (0.0) (0.0) (0.0) (0.0) (3,807.9) (4,753.7)0.0 0.0 5.3 6.0 0.0 0.0 332.4 349.60.0 0.0 0.9 98.8 - 189.0 - 477.7 1,209.3 1,261.30.0 0.0 298.2 698.9 369.1 88.7 12,779.1 15,203.20.0 0.0 61.0 151.5 1,106.3 781.4 5,489.2 5,616.60.0 0.0 155.3 207.9 1,997.0 3,630.1 4,242.7 5,863.80.0 0.0 216.3 359.4 3,103.3 4,411.5 9,731.9 11,480.4
0.0 0.0 1.2 2.1 3.4 33.7 42.5 46.1(0.0) (0.0) (1.2) (2.1) (3.5) (38.6) (48.0) (60.6)(0.0) (0.0) (0.0) (0.0) (0.1) (4.9) (5.5) (14.5)0.0 0.0 13.9 0.0 2.5 124.3 20.5 147.20.0 - 2.6 0.6 1.6 4.8 2.80.0 10.1 7.9 25.7 14.6 22.1 723.6 1,062.90.0 0.0 0.0 0.0 0.0 0.0 87.1 318.2
0.0 10.1 7.9 25.7 14.6 22.1 636.5 744.7182.3 76.7 181.1 90.3
0 0 1,104 3,038 2,210 2,260 64,257 70,299
North and South America Other Regions Consolidation Group2003 2002 2003 2002 2003 2002 2003 2002
2,675.5 2,695.1 2,972.0 2,709.7 19,215.4 20,302.4849.3 1,046.3 92.5 121.6 19,215.4 20,302.4483.1 632.3 111.3 133.9 - 7.0 - 10.1 11,237.4 13,592.3
(6.5) (8.7) (37.7) (41.0) (3,807.9) (4,753.7)125.8 187.9 72.3 73.2 - 6.0 - 1.6 5,489.2 5,616.6
18.9 22.9 6.8 10.7 - 2.1 - 6.0 1,310.1 960.340.3 92.5 11.4 6.0 723.6 1,062.90.5 1.4 0.7 0.5 87.1 318.2
39.8 91.1 10.7 5.5 636.5 744.72,591 3,402 3,993 5,224 64,257 70,299

146
Financial Statements Segment Reporting
Key Figures Tourism Division
Central Europe Northern Europe€ million 2003 2002 2003 2002
Statement of resultsThird-party turnover 5,097.1 5,199.7 4,301.1 4,762.2Inter-segment turnover 36.6 16.5 5.5 0.0Segment turnover 5,133.7 5,216.2 4,306.6 4,762.2Earnings before taxes on income (EBT) - 70.1 57.1 - 385.6 - 71.0Amortisation of goodwill 51.2 46.5 464.6 155.1Amortisation of goodwill of companies measured at equity 2.4 2.0 0.0 0.0Earnings by divisions (EBTA) - 16.5 105.6 79.0 84.1Amortisation of other intangible assetsand depreciation of property, plant and equipment 76.2 76.1 121.2 130.5Other depreciation/amortisation and write-backs - 1.1 - 0.2 0.0 1.8Interest result 6.9 11.2 14.4 15.8Earnings before interest, taxes, depreciation and amortisation (EBITDA) 53.9 170.7 185.8 197.0Rental expenses 97.1 70.5 227.9 202.1Earnings before interest, taxes, depreciation,amortisation and rental expenses (EBITDAR) 151.0 241.2 413.7 399.1
Segment assets and liabilitiesNon-interest bearing segment assets 1,757.2 1,899.2 3,164.6 4,102.4of which goodwill (647.8) (684.7) (1,906.3) (2,717.5)Carrying amounts of companies measured at equity 6.8 12.5 0.0 0.0Interest-bearing assets and cash and cash equivalents 475.6 545.1 523.3 569.8Segment assets 2,239.6 2,456.8 3,687.9 4,672.2Non-interest-bearing segment liabilities 887.5 860.5 1,487.1 1,500.0Interest-bearing segment liabilities 508.6 382.2 288.4 251.3Segment liabilities 1,396.1 1,242.7 1,775.5 1,751.3
Additional disclosuresAt equity result - 1.5 3.4 0.0 0.0of which operating result (0.9) (5.4) (0.0) (0.0)of which amortisation of goodwill (2.4) (2.0) (0.0) (0.0)Non-cash expenses 0.0 1.5 0.0 0.0Return on sales (% on EBTA) - 0.3 2.0 1.8 1.8Investments 95.7 58.6 118.3 110.7Investments in goodwill 10.0 23.1 19.8 3.7Investments in other intangible assets and property, plant and equipment 85.7 35.5 98.5 107.0Financing ratio (%) 133.1 209.2 495.2 258.0Personnel at year-end 9,391 9,744 18,033 18,732

147
Segment Reporting Financial Statements
Other Tourism/Western Europe Destinations Consolidation Total
2002 2001 2003 2002 2003 2002 2003 2002
2,479.6 1,630.1 547.5 575.8 246.0 248.4 12,671.3 12,416.28.9 5.6 552.0 529.1 - 573.3 - 535.8 29.7 15.4
2,488.5 1,635.7 1,099.5 1,104.9 - 327.3 - 287.4 12,701.0 12,431.69.1 - 4.3 17.4 65.3 - 10.0 4.8 - 439.2 51.9
33.1 15.1 85.0 52.2 8.6 6.2 642.5 275.10.0 4.5 2.1 2.5 0.3 0.0 4.8 9.0
42.2 15.3 104.5 120.0 - 1.1 11.0 208.1 336.0
36.0 15.4 56.6 53.7 40.6 35.2 330.6 310.91.6 5.0 - 3.3 - 1.4 1.4 0.5 - 1.4 5.7
- 6.8 2.6 - 4.1 - 0.9 - 1.9 - 1.8 8.5 26.983.4 23.1 168.5 176.0 40.0 47.5 531.6 614.342.1 16.1 87.7 122.4 16.7 12.9 471.5 424.0
125.5 39.2 256.2 298.4 56.7 60.4 1,003.1 1,038.3
884.0 870.8 1,540.2 1,590.3 337.1 344.9 7,683.1 8,807.6(471.8) (457.3) (642.0) (738.0) (109.3) (114.6) (3,777.2) (4,712.1)
1.2 1.1 305.4 317.3 3.9 1.2 317.3 332.1240.5 247.1 173.3 177.6 - 179.5 - 172.5 1,233.2 1,367.1
1,125.7 1,119.0 2,018.9 2,085.2 161.5 173.6 9,233.6 10,506.8605.1 520.8 199.2 214.9 156.1 162.5 3,335.0 3,258.7189.2 228.2 616.4 596.7 - 143.1 - 120.1 1,459.5 1,338.3794.3 749.0 815.6 811.6 13.0 42.4 4,794.5 4,597.0
0.1 - 11.3 41.8 29.4 - 5.2 - 8.2 35.2 13.3(0.1) (- 6.8) (43.9) (31.9) (- 4.9) (- 8.2) (40.0) (22.3)(0.0) (4.5) (2.1) (2.5) (0.3) (0.0) (4.8) (9.0)0.0 11.5 1.5 1.4 0.1 8.5 1.6 22.91.7 0.9 9.5 10.9 1.6 2.7
75.1 218.8 186.3 156.8 42.6 70.1 518.0 615.050.5 203.9 0.8 14.9 4.8 18.2 85.9 263.824.6 14.9 185.5 141.9 37.8 51.9 432.1 351.292.0 13.9 76.0 67.5 187.9 95.3
6,521 7,822 12,896 13,787 4,867 4,928 51,708 55,013

(2) Other income
Notes on the Consolidated Profit and Loss Statement
148
Group turnover by business activity€ million 2003 2002
Tourism services 12,681.5 12,402.1Transport services 3,238.4 3,193.3Production of goods and other services 359.8 382.8Trading in merchandise 2,441.8 3,871.5Letting and leasing 481.2 441.5Other turnover 12.7 11.2Total 19,215.4 20,302.4
The decline in turnover on the previous year mainly resulted from discon-tinuing operations. Turnover declined by € 0.3 billion in the energy sectorsince the turnover generated by the companies in the 2003 financial yearwas only included for the period up to May and June 2003, respectively,when the companies were sold. The decline in turnover of the AMC Groupof around € 1.0 billion was attributable both to the fact that the groupwas only included until 31 October 2003 and to the considerable drop intransaction volumes of its stock exchange transactions in non-ferrousmetal trading. Another factor contributing to the decline in turnover wasthe disposal of the Fels Group which had been included with its turnoverof around € 0.2 billion up to its disposal date in the previous year. On theother hand, turnover rose by approx. € 0.9 billion due to the first-timeconsolidation of the Nouvelles Frontières Group for a full financial year.
Besides changes in the group of consolidated companies, the decline inturnover was also due to the reduction in business volumes in some sectorsas well as currency effects from the translation of the financial statementsof subsidiaries.
Other income€ million 2003 2002
Book profits from the sale of fixed assets and current assets 279.2 525.9Income from supplementary transactions 132.4 121.5Income from the reversal of provisions and deferred liabilities – 125.4Foreign exchange gains 119.4 83.2Income from rebilling 67.3 81.7Income from letting and leasing contracts 12.5 21.9Income from the reversal of value adjustments to trade accounts receivables 15.9 12.0Other income 241.9 191.0Total 868.6 1,162.6
(1) Turnover

149
In the financial year under review, the book profits from the sale of fixedassets and current assets were primarily characterised by the divestmentof the indirect shareholding in Ruhrgas AG. In the previous financial year,the book profits mainly resulted from the divestment of approx. 13,700rental flats in Salzgitter and the divestment of shares in former Deminexprojects. The book profits from the discontinuance of operations – fromthe sale of the Preussag Energie Group in 2003 and the disposal of theFels Group in 2002 – were recognised under ‘Operating result from dis-continuing operations’ in the profit and loss statement. Due to the re-classification, other income recognised dropped by € 145.1 million in theprevious year.
Unlike in the previous year, income from the reversal of provisions of€ 116.5 million was carried under the profit and loss statement itemwhich had shown the expenses for the formation of the correspondingprovisions in previous years.
Change in inventories and other own work capitalised € million 2003 2002
Reduction in stocks of finished goods and work in progress - 5.1 - 6.6Other own work capitalised 35.7 64.1Total + 30.6 + 57.5
Cost of materials and purchased services€ million 2003 2002
Cost of raw materials, supplies and purchased merchandise 2,799.4 3,858.0Cost of purchased services 10,174.0 10,217.5Rental and lease expenses 468.1 358.0Total 13,441.5 14,433.5
The cost of purchased services mainly related to third-party tourism services such as hotel expenses and cost of aviation and other transpor-tation services.
The item ‘Cost of materials and purchased services’ included rental andlease expenses for operating leases where these expenses were directlyrelated to the turnover generated.
The decline in the cost of raw materials and purchased merchandisealmost exclusively resulted from the significant reduction in the 2003financial year in the trading volume of the AMC Group, which was divestedas at 1 November 2003.
Notes on the Consolidated Profit and Loss Statement Financial Statements
(3) Change in inventories and
other own work capitalised
(4) Cost of materials and
purchased services

Financial Statements Notes on the Consolidated Profit and Loss Statement
150
Personnel costs€ million 2003 2002
Wages and salaries 2,018.5 2,054.4Social security contributions, pension costs and benefits 550.3 496.2Total 2,568.8 2,550.6
Pension costs included expenses for defined benefit pension obligations.This item also included the interest portion of the measurement of thepension obligations. A detailed presentation of the pension obligations isgiven under note 28.
In comparison with the previous year, the cost of wages and salariesdeclined by 1.7%. This was due to a reduction in the average headcountby 1,352 to now 67,585 employees (excluding apprentices and trainees).The drop in staffing levels primarily resulted from the divestment in 2003of the companies of the energy sector and the AMC Group whoseemployees were included in the Group headcount for the financial yearon a pro rata temporis basis until the companies were sold. The averageheadcount in tourism rose from 53,014 to 53,929 employees, primarilydue to the first-time consolidation of the Nouvelles Frontières Group fora full financial year.
Average annual headcount (excluding apprentices)2003 2002
Wage earners 5,034 6,240Salaried employees 62,551 62,697Total 67,585 68,937
Depreciation and amortisation € million 2003 2002
Amortisation of goodwill 278.9 278.3Amortisation of intangible assets and depreciation of property, plant and equipment 599.0 626.6Total 877.9 904.9
Depreciation and amortisation was based on the uniform useful lives out-lined unter the explanatory information on accounting and measurement.Due to the first-time application of IAS 1 (revised 2003), amortisation ofgoodwill was recognised in combination with the amortisation of intangibleassets and depreciation of property, plant and equipment under one item.Amortisation of goodwill included both amortisation of goodwill from the
(5) Personnel costs
(6) Depreciation
and amortisation

Notes on the Consolidated Profit and Loss Statement Financial Statements
151
acquisition of subsidiaries and from the acquisition of business operations.In the previous year, the amortisation of goodwill from the acquisition ofbusiness operations of € 4.9 million was recognised under amortisation ofintangible assets and depreciation of property, plant and equipment.
Impairment of fixed assets€ million 2003 2002
Impairment of goodwill 368.6 55.0Impairment of intangible assetsand property, plant and equipment 19.2 0.4Total 387.8 55.4
Due to the first-time application of IAS 1 (revised 2003), impairment ofgoodwill was recognised in combination with impairment of intangibleassets and property, plant and equipment under one item.
In the first half of 2003, the tourism business was impacted by the Iraqconflict and weak economic development in several source markets. Alt-hough business picked up in the second half of 2003, earnings did notmatch the previous year’s level. Against this background, impairment testswere conducted in conjunction with the allocation of goodwill at the levelof cash-generating units. In accordance with the rules of the IASB, cash-generating units are the smallest identifiable groups of assets that generatecash inflows from continuing use that are largely independent of the cashinflows from other assets or groups of assets. In the tourism segment,cash-generating units were fixed both for individual source markets on acountry-specific basis and for individual subsidiaries in the tourism desti-nations. In the logistics segment, cash-generating units were defined as afunction of business activities.
In the framework of the impairment tests, the carrying amounts plus allo-cated goodwill of the tested units were compared with their value in use.Where the carrying amounts exceeded the value in use, impairment wasrecognised. The value in use is the present value of estimated sustainablefuture cash flows expected to arise from the continuing use of an asset.The present value was calculated on the basis of the medium-term planprepared as at the 2003 financial year-end with a pre-tax interest rate ofapprox. 8.5% p.a. In some individual cases, expected sales prices were used.
On the basis of the implemented impairment tests, impairment of good-will had to be effected for individual operations, mostly in the tourism seg-ment. Goodwill had to be impaired in particular in the Northern Europesector. This impairment was triggered by the development of earnings in
(7) Impairment of fixed assets

(8) Other expenses
Financial Statements Notes on the Consolidated Profit and Loss Statement
152
the Nordic countries and in a specialist tour operator in the UK, which fellshort of expectations. Goodwill also had to be impaired for a hotel com-pany available for sale, and for a hotel company focusing its activities onthe eastern Mediterranean region.
Impairment of property, plant and equipment was primarily effected forcommercial property.
Other expenses€ million 2003 2002
Commissions for tourism services and other selling expenses 1,044.3 1,013.7Rental and lease expenses 206.7 196.8Expenses for insurance premiums 66.5 68.9Advertising expenses 244.2 261.0Contributions, charges, fees and consultancy expenses 128.1 155.3Expenses for write-downs of receivables and value adjustments 52.6 139.6Other expenses for financial and monetary transactions 169.9 131.6Other expenses from creation of provisions 88.8 157.4Administrative expenses 369.0 389.7External services and non-operating material expenses 313.4 303.5Losses from the disposal of fixed assets and current assets 38.4 69.1Other taxes 55.4 53.1Other operating expenses 268.2 253.4Total 3,045.5 3,193.1
In the 2003 financial year, the commissions for tourism services wererecognised in combination with other selling expenses. This item primarilycovered travel agency commissions and commissions passed on frominsurance policies covering travel contract cancellation costs.
As in previous years, the utilisation of provisions created and charged toother operating expenses in previous years, the cost of which was nowshown under the corresponding type of expense, was offset against thecost of provisions newly created.
Expenses for financial and monetary transactions also included exchangerate losses from changes in exchange rates between the date of trans-action and the date of payment of receivables and payables denominatedin foreign currencies.
In the 2003 financial year, other taxes were recognised as other expensesfor the first time. The previous year’s recognition was accordingly adjusted.
Other expenses from the discontinuance of operations – from the divest-ment of the AMC Group in 2003 and the planned divestment of parts ofthe Preussag Energie Group in 2002 – were shown under ’Result from the

Notes on the Consolidated Profit and Loss Statement Financial Statements
153
discontinuance of operations’ in the profit and loss statement. Due to thereclassification, other operating expenses recognised in the previous yearfell by € 56.0 million.
In the framework of its strategic realignment, the Group divested itsindustrial sectors building engineering, trading and energy in several steps.
Initially, the Supervisory Board of TUI AG approved a divestment pro-gramme for the building engineering and trading sectors in October 2000.With the sale of the Fels Group, the discontinuance of the building engi-neering sector was completed in the 2002 financial year.
The discontinuance of the trading sector was partly effected in the 2003financial year with the divestment of the AMC Group. The AMC Group wassold in the course of an MBO with effect of 1 November 2003. Following thepayment of a special dividend of around € 115 million by AmalgamatedMetal Corporation PLC (AMC), a company owned by the managementsubmitted a takeover bid at a purchase price of around € 90 million. Plansto sell the US steel service activities were retained. The trading sector thuscontinued to meet the definition of a discontinuing operation.
The activities of the energy sector, mainly operating in the explorationand production of crude oil and natural gas, were completely discontinuedin the 2003 financial year. The domestic and international activities ofPreussag Energie GmbH were sold in two stages. First, the German busi-ness of Preussag Energie GmbH was sold to the Gaz de France Group asat 31 May 2003. OMV AG then acquired the international operations as at30 June 2003. The divestment of the energy activities was completed at atotal purchase price of around € 1.4 billion.
At its meetings of 21 March 2003 and 21 January 2004, the SupervisoryBoard approved the concept for the realignment of the logistics segment.The Group will focus on the tourism and shipping sectors, as scheduled,and will thus divest its other shareholdings in the logistics segment. Theseinclude the VTG-Lehnkering Group, the Algeco Group and Pracht Spedition+ Logistik GmbH. This intention was publicly announced shortly after theapproval of the concept. The specialist logistics sector therefore representsa discontinuing operation. It is to be assumed that the individual activitiesof this sector will be discontinued at different points in time and by meansof different transactions. Where the cash inflows expected to be generatedby the transactions were below the carrying amounts of the operations tobe discontinued, non-scheduled write-downs were effected or correspond-ing provisions were created.
(9) Result from the discontin-
uance of operations

Financial Statements Notes on the Consolidated Profit and Loss Statement
154
The operating result from discontinuing operations recognised in the profitand loss statement comprised both the proceeds from the divestment ofthe Preussag Energie Group with a profit of € 729.6 million and of the AMCGroup with a loss of € 36.7 milllion as well as the provisions formed for thediscontinuing operations in the specialist sector. As far as the discontinuanceof the trading sector were concerned, provisions were set up for currencydifferences hitherto taken directly to equity and expected to be realisedin the wake of the discontinuance of the sector. Total provisions for oper-ations to be discontinued amounted to € 135.2 million.
Material assets and liabilities of the discontinuance of Energy
€ million 31 Dec 2003 31 Dec 2002
Non-current assets – 634.1Current assets – 251.3Provisions – 380.2Financial liabilities – 177.0Other liabilities – 69.4
With the discontinuance of the Preussag Energie Group, the assets orliabilities were no longer recognised in the consolidated balance sheet asat 31 December 2003.
Trading€ million 31 Dec 2003 31 Dec 2002
Non-current assets 92.2 173.5Current assets 209.3 530.3Provisions 16.9 39.8Financial liabilities 155,3 207.9Other liabilities 51.7 127.9
Specialist logistics€ million 31 Dec 2003 31 Dec 2002
Non-current assets 934.5 967.4Current assets 362.9 403.5Provisions 205.7 206.6Financial liabilities 478.8 562.5Other liabilities 238.1 230.0

Notes on the Consolidated Profit and Loss Statement Financial Statements
155
Material items of the profit and loss statements of the discontinuance of
Building engineering€ million 2003 2002
Turnover – 202.7Operating income – 13.9Operating expenses – 268.0Financial result – - 6.5Earnings before taxes on income – - 57.9Income taxes – 14.9
Energy€ million 2003 2002
Turnover 177.0 448.3Operating income 7.6 86.1Operating expenses 163.4 398.5Financial result - 1.0 3.5Earnings before taxes on income 20.2 139.4Income taxes 13.4 40.7
Trading€ million 2003 2002
Turnover 2,056.0 3,150.4Operating income 10.3 16.0Operating expenses 2,052.4 3,114.3Financial result - 2.9 - 4.5Earnings before taxes on income 12.2 49.7Income taxes 4.8 19.0
Specialist logistics€ million 2003 2002
Turnover 1,534.8 1,552.9Operating income 67.7 84.5Operating expenses 1,543.0 1,541.8Financial result - 20.5 - 22.3Earnings before taxes on income 44.0 74.9Income taxes 23.8 27.5

Financial Statements Notes on the Consolidated Profit and Loss Statement
156
Cash flow from operating, investing and financing activities Energy
€ million 2003 2002
Change in cash and cash equivalents due to exchange rate fluctuations and other changes in value – –Cash inflow/outflow from operating activities - 22.4 + 161.5Cash inflow/outflow from investing activities - 23.1 + 28.1Cash inflow/outflow from financing activities + 3.8 - 140.9Change in cash and cash equivalents - 41.7 + 48.7
Trading€ million 2003 2002
Change in cash and cash equivalents due to exchange rate fluctuations and other changes in value - 5.7 - 8.4Cash inflow from operating activities + 19.9 + 51.2Cash outflow from investing activities - 7.2 - 11.9Cash outflow from financing activities - 31.7 - 18.6Change in cash and cash equivalents - 24.7 + 12.3
Specialist logistics€ million 2003 2002
Change in cash and cash equivalents due to exchange rate fluctuations and other changes in value - 0.2 + 2.3Cash inflow from operating activities + 144.6 + 146.2Cash outflow from investing activities - 89.3 - 104.5Cash outflow from financing activities - 46.0 - 47.9Change in cash and cash equivalents + 9.1 - 3.9

Notes on the Consolidated Profit and Loss Statement Financial Statements
157
Financial result€ million 2003 2002
Result from non-consolidated Group companies 4.9 4.9Income from other investments 4.3 4.5Income from profit transfer agreements from non-consolidated Group companies 4.8 1.7Income from profit transfer agreements from other investments 0.2 3.2Expenses relating to losses taken overfrom non-consolidated Group companies 1.1 2.0Net income from investments + 13.1 + 12.3Write-downs of available-for-sale financial assets and loans 11.1 66.2Income from securities and long-term loans from non-consolidated Group companies 0.6 0.5Other income from securities and long-term loans 5.0 4.3Other interest and similar income from non-consolidated Group companies 0.7 0.8Other interest and similar income 82.6 89.6Interest and similar expenses to non-consolidated Group companies 2.9 3.2Other interest and similar expenses 239.0 321.8Net interest result - 153.0 - 229.8Result from change in value of derivative financial assetsthat are not classified as hedging instrument + 3.7 - 9.6Total - 147.3 - 293.3
The write-downs of available-for-sale financial assets and loans includedan amount of € 9.6 million (previous year: € 65.1 million) of non-scheduledwrite-downs. The decline in non-scheduled write-downs resulted fromthe previous year’s high level of non-scheduled write-downs of shares inBabcock Borsig AG, which had become insolvent, as well as shares inMetaleurop S.A. This item also included in particular write-downs ofinvestments and securities held as fixed assets.
The improvement in the net interest result was primarily attributable tothe further reduction in borrowings as a result of the divestments made.
The indexing of the financial statements of foreign subsidiaries based inhyper-inflationary economies led to the realisation of purchasing powergains totalling € 0.7 million (previous year: € 2.1 million) from the changein purchasing power parities in these countries, carried under interestincome and expenses. The purchasing power gains were primarily attribu-table to the financial requirements of Turkish hotel companies.
(10) Financial result

(11) Result from companies
measured at equity
(12) Income taxes
Financial Statements Notes on the Consolidated Profit and Loss Statement
158
Result from companies measured at equity € million 2003 2002
Result from associated companies measured at equity + 0.8 + 35.1Result from joint ventures measured at equity + 41.7 + 11.0Total + 42.5 + 46.1
The result from companies measured at equity comprised the proratednet profit for the year of the associated companies and joint ventures aswell as the amortisation of goodwill of these companies totalling € 5.5million (previous year: € 14.5 million).
Group share in individual items of profit and loss statements of joint ventures € million 2003 2002
Operating income 189.9 228.0Operating expenses 147.7 197.2Operating result 42.2 30.8Financial result 7.0 - 13.3Profit on ordinary activities 49.2 17.5Taxes 3.9 3.4Profit for the year 45.3 14.1Amortisation of goodwill 3.6 3.1Result from joint ventures measured at equity 41.7 11.0
Breakdown of income tax expenses€ million 2003 2002
Current income taxesin Germany 1.0 31.4abroad 100.7 109.2Deferred tax income/expenses - 170.6 + 45.2Total - 68.9 + 185.8
Current income tax expenses dropped in Germany as existing loss carry-forwards were utilised, whereas current income taxes remained virtuallyunchanged abroad. The reduction in deferred tax liabilities resulted indeferred tax income in the 2003 financial year: the reduction in the provisionfor deferred taxes was caused by changes in the tax valuation of individualasset items resulting predominantly from intra-Group restructurings.

The German companies of the TUI Group had to pay an average tradetax of approx. 17%, which was deductible in the computation of the cor-poration tax. The corporation tax rate was 26.5% (previous year: 25%),plus a 5.5% solidarity surcharge on corporation tax. The increase in thecorporation tax rate was attributable to the Flood Victims Solidarity Actenacted by the Federal German government. Under this act, the corporatetax rate was increased by 1.5% to 26.5% for the year 2003 to use theseresources to establish a ‘reconstruction aid’ fund. The temporary increasein the corporation tax rate expired at the end of the financial year. Onthe basis of this tax legislation, all deferred tax items of German companiesrealised in 2003 were measured at an average tax rate of 40%. The tem-porary increase in the corporation tax rate ended at the end of the financialyear under review. All deferred tax items realising as of 2004 will be mea-sured at a tax rate of 39%.
The calculation of foreign income tax was based on the laws and regula-tions applicable in the respective countries. The income tax rates appliedto foreign companies varied from 12.5% to 42.0%.
In accordance with the rules of IAS 12 (revised 2000), deferred taxes werecalculated in accordance with the balance sheet liability method. Accord-ingly, tax decreases and increases considered as realisable in future werereported for temporary differences between the carrying amounts ofassets and liabilities in the consolidated financial statements and their taxbase. Where the temporary differences between the consolidated balancesheet or tax balance sheet related to items directly taken to equity, thedeferred taxes relating to these differences were also directly offset againstequity. Due to the elimination of deferred taxes with no effect on results,equity rose by € 14.1 million in the 2003 financial year (previous year: € 20.4 million). Deferred taxes included an amount of € + 24.7 millionfrom differences in the measurement of financial assets to hedge futurecash flows which led to an increase in equity, whereas equity declined byan amount of € - 10.6 million from differences in the measurement of theequity component of the convertible bonds issued.
Expected tax savings from the use of loss carryforwards assessed asrealisable in the future were capitalised. In measuring capitalised assetsfor future tax savings, the probability of recovering the expected taxbenefit was taken into account.
Notes on the Consolidated Profit and Loss Statement Financial Statements
159

Financial Statements Notes on the Consolidated Profit and Loss Statement
160
Individual items of deferred tax assets and liabilities recognised in the balance sheet
31 Dec 2003 31 Dec 2002€ million Assets Liabilities Assets Liabilities
Differences in depreciation and amortisation methods and useful lives 91.1 402.5 91.3 684.6Finance lease transactions – 8.1 – 1.6Differences in carrying amounts of fixed assets and investments 12.7 24.7 7.5 26.5Differences in turnoverrecognition dates 110.2 18.9 110.4 53.7Fair values of financial assets 79.8 36.5 61.0 47.2of which deferred taxes taken directly to equity (76.0) (31.3) (59.8) (39.8)Measurement of pension provisions 57.9 12.3 55.2 14.5Differences in carrying amounts of other provisions 111.7 32.8 118.3 36.9Other transactions 55.3 121.5 108.3 118.3Capitalised tax savings from realisable loss carryforwards 117.7 – 241.2 –Set-off of deferred tax assets and liabilities - 448.1 - 448.1 - 507.8 - 507.8Balance sheet amount 188.3 209.2 285.4 475.5(of which long-term) (49.0) (193.8) (208.0) (426.8)
In the 2003 financial year, deferred tax assets and liabilites were structuredaccording to different accounting and measurement items for the firsttime, whereas they were structured according to balance sheet items inthe previous year.
Differences in the financial and tax balance sheets with regard to ‘Otherprovisions’ were primarily attributable to the creation of provisions foranticipated losses. Where changes in the fair values of financial assetswere directly taken to equity, the related deferred taxes also led to anincrease or decrease in equity with no effect on results. Deferred tax assetsand tax liabilities were offset if they related to income taxes levied by thesame taxation authority and related to the same tax period.
Deferred tax assets carried in the balance sheet declined by € 126.9 millionsolely due to the utilisation and value adjustment of capitalised tax losscarryforwards. Deferred tax liabilities also declined predominantly fromintra-Group restructurings.

Breakdown of tax loss carryforwards € million 31 Dec 2003 31 Dec 2002
German loss carryforwardsCorporation tax 346.0 585.7Trade tax 312.4 636.2Foreign loss carryforwards 609.2 621.9Total potential tax savings from loss carryforwards 306.9 430.6
While German loss carryforwards could be used over an unlimited periodof time, as before, annual use of such carryforwards will be restricted asof the 2004 financial year due to the introduction of minimum taxation.Foreign loss carryforwards frequently had to be used within a specifiedperiod of time and were subject to restrictions concerning the use of theseloss carryforwards for profits on ordinary activities, which were taken intoaccount accordingly in the measurement.
Time limits for existing loss carryforwards € million 31 Dec 2003
Loss carryforwards forfeitable within one year 0.2Loss carryforwards forfeitable within 2 to 5 years 105.9Loss carryforwards forfeitable within more than 5 years (excluding non-forfeitable loss carryforwards) 47.6Non-forfeitable loss carryforwards 1,113.9Total unused loss carryforwards 1,267.6
Potential tax savings of € 189.2 million (previous year: € 189.4 million)were not capitalised since the benefit of the underlying loss carryforwardswas unlikely to be realised within the planning period.
In the 2003 financial year, the use of loss carryforwards for which no assetwas recognised in previous years for the resulting potential tax savingsled to a reduction in the tax burden of € 37.5 million (previous year: € 1.0 million). As in 2002, it was not possible to reduce the tax burdenfor the year under review by means of tax loss carrybacks.
Notes on the Consolidated Profit and Loss Statement Financial Statements
161

Development of capitalised tax savings from realisable loss carryforwards € million 2003 2002
Capitalised tax savings at the beginning of the financial year 241.2 131.6Changes in the group of consolidated companies and currency adjustment - 8.6 + 14.3Use of loss carryforwards - 87.1 - 19.6Value adjustment of previously capitalised tax savings from loss carryforwards - 39.8 - 25.2Capitalisation of tax savings from loss carryforwards + 12.0 + 140.1Capitalised tax savings at financial year-end 117.7 241.2
The reduction in capitalised tax loss carryforwards resulted from the utili-sation of loss carryforwards, in particular in German companies. At thesame time, value adjustments were effected for previously capitalised losscarryforwards since they were not realisable within the planning period.
The actual income tax expense of € -68.9 million (previous year: € 185.8million) was € 167.3 million less (previous year: € 97.3 million more) thanthe expected income tax expense of € 98.4 million (previous year: € 88.5million) which would have resulted from the application of the Germanincome tax rate to the Group’s annual pre-tax profit.
Reconciliation of expected to actual income tax expense € million 2003 2002
Group profit for the year before income taxes 246.0 226.9Expected income tax expense (tax rate: 40% for 2003, 39% for 2002) 98.4 88.5Difference between actual and expected tax rates - 103.4 - 65.8Proportion of expected taxation relating to: tax-exempt income - 393.6 - 183.3non-tax-deductible expenses 433.4 328.9temporary differences and losses for which no deferred taxes were recognised 3.9 10.6tax expenses and income unrelated to accounting period - 119.0 3.3other variances 11.4 3.6Actual income tax expense - 68.9 185.8
Due to the 1.5% increase in the corporation tax rate in the 2003 financialyear under the German Flood Victims Solidarity Act, the reconciliation for2003 was calculated on the basis of a Group tax rate of 40%. The differencebetween actual tax rates and the German tax rates (40%) was partlyattributable to the fact that lower tax rates were applied to the earnings
Financial Statements Notes on the Consolidated Profit and Loss Statement
162

of foreign subsidiaries. The Group’s non-tax-deductible expenses primari-ly related to the amortisation of goodwill from capital consolidation.
Minority interests in Group profit for the year€ million 2003 2002
Profit attributable to minority interests 51.4 46.0Loss attributable to minority interests - 11.5 - 36.9Total 39.9 9.1
Profit for the year attributable to minority interests mainly related to consolidated subsidiaries in the tourism division, in particular the companiesof the RIU Group (minority interest: 50%), the Magic Life Group, the AnfiGroup (minority interests: 49% each) and TUI Suisse Group (minorityinterest: 49%). Minority interests were also held in several incomingagencies. In the logistics division, minority interests exclusively related toshareholders of Algeco S.A. (minority interest: approx. 33.0%).
In accordance with IAS 33, basic earnings per share were calculated bydividing the Group’s net profit for the year due to the shareholders ofTUI AG by the weighted average number of no-par value bearer sharesoutstanding during the financial year under review. The average numberof shares increased in the financial year under review due to the inclusionof 430,380 employee shares for a period of 27 days.
A dilution of earnings per share occurs when the average number of sharesis increased by adding the issue of potential shares from the warrantsand conversion options. As in 2002, the conversion options from the con-vertible bond issued by TUI AG did not have a diluting effect. Basic earn-ings per share thus equalled diluted earnings per share. The impairmentof goodwill of a discontinuing operation of € 14.3 million was taken intoaccount in the determination of earnings per share before amortisationof goodwill.
2003 2002
Group profit for the year attributable to TUI shareholders (€ million) 275.0 32.0Weighted average number of shares 178,070,135 178,038,299Basic earnings per share (€) 1.54 0.18Diluted earnings per share (€) 1.54 0.18Earnings per share before amortisation of goodwill (€) 5.26 2.05
Notes on the Consolidated Profit and Loss Statement Financial Statements
163
(13) Minority interests in
Group profit for the year
(14) Earnings per share

Further information on the consolidated profit andloss statementAny income or expense items of the profit and loss statement whose disclosure was relevant to explain the Group’s earning power due to theirlevel, type or frequency were classified as unusual. Unusual income orexpenses comprised those items of earnings before taxes which did notoccur regularly or were relevant for an understanding of the sustainableearning power due to their amounts. Expenses and income classified asunusual were offset and presented in line with the underlying transactionsand were comprised in several items of the profit and loss statement.
As in 2002, unusual income mainly resulted from the strategic realignmentof the Group in the 2003 financial year. The effects of the discontinuanceof operations were separately shown in the profit and loss statement andset out in detail under note 9. Moreover, additional income was generatedfrom the divestment of shareholdings in the 2003 financial year and shownas book profits under ‘Other income’. The divestment of the indirect share-holding in Ruhrgas AG generated income of around € 200.0 million.
Apart from unusual income totalling € 757.7 million, the Group also incurredunusual expenses of € 466.2 million. These expenses mainly resultedfrom the impairments of goodwill effected in the financial year underreview. This impairment is presented in detail under note 7.
In addition, the impairments of commercial property item were classifiedas unusual.
Moreover, provisions for divestments already made in the previous yearwere classified as unusual since these provisions did not relate to the discontinuance of any longer.
Income taxes comprised the tax effects on the transactions classified asunusual as well as deferred tax income from the reversal of a deferredtax liability due to internal Group restructurings.
Financial Statements Notes on the Consolidated Profit and Loss Statement
164

Unusual income and expenses€ million 2003
Income from the discontinuance of operations 557.7Income from the divestment of the shares in Ruhrgas AG 200.0Unusual income 757.7Impairment of commercial property 17.8Provisions for divestments made in previous years 83.2Impairments of goodwill 365.4Unusual expenses 466.4Unusual earnings before taxes on income 291.3Tax result from unusual income and expenses - 172.1Unusual earnings after taxes on income 463.4
Due to the new Group structure with activities mainly focused on theservices sector, no material research and development expenses wereincurred by the Group in 2003, as in the previous year.
Notes on the Consolidated Profit and Loss Statement Financial Statements
165

166
Notes on the Consolidated Balance Sheet
GoodwillNegative
€ million Goodwill goodwill Total
Historical costBalance as at 1 Jan 2003 5,666.7 18.3 5,648.4Exchange differences - 435.5 – - 435.5Additions due to changes in consolidation 0.5 – 0.5Additions 87.8 0.7 87.1Disposals 9.4 17.2 - 7.81)
Reclassifications - 2.9 – - 2.9Balance as at 31 Dec 2003 5,307.2 1.8 5,305.4
AmortisationBalance as at 1 Jan 2003 906.5 11.8 894.7Exchange differences - 64.7 – - 64.7Additions due to changes in consolidation 0.2 – 0.2Amortisation for the current year 662.5 0.7 661.8Disposals 8.1 10.7 - 2.61)
Reclassifications 2.9 – 2.9Balance as at 31 Dec 2003 1,499.3 1.8 1,497.5
Carrying amounts as at 31 Dec 2003 3,807.9 0.0 3,807.9Carrying amounts as at 31 Dec 2002 4,760.2 6.5 4,753.7
1) of which disposals from changes in consolidation of € - 15.3 million and € - 8.8 million
As of the 2003 financial year, goodwill from capital consolidation of sub-sidiaries was recognised under one item in combination with goodwill fromthe acquisition of operations. The presentation of the previous year’sfigures was adjusted accordingly. At 31 December 2003, the net carryingamount of goodwill from the acquisition of operations totalled € 21.2millon (previous year: € 27.3 million). The carrying amount of goodwilldeclined by € 945.8 million in the financial year under review. Besidesamortisation and impairment in the financial year (cf. notes 6 and 7), thiswas attributable to the first-time application of IAS 21 (revised 2003). Inaccordance with the rules of this standard, goodwill was recognised in thefunctional currency of the subsidiaries following the allocation of goodwillto individual segments and sectors in the financial year and subsequentlytranslated in the framework of the preparation of the consolidated financialstatements. In analogy to the treatment of other differences from thetranslation of annual financial statements of foreign subsidiaries, differencesdue to exchange rate fluctuations between the exchange rate at the dateof acquisition of the subsidiary and the exchange rate at the balance sheetdate were taken directly to and recognised separately under equity. Due tothis exchange difference, the carrying amount of goodwill declined by€ 370,8 million. The exchange difference mainly resulted from the trans-lation of goodwill from the acquisition of the TUI Northern Europe Group
(15) Goodwill

167
Notes on the Consolidated Balance Sheet Financial Statements
(formerly Thomson Travel Group). The exchange difference was mainlycaused by the currency losses of British Pounds Sterling against euroswhich arose in the 2003 financial year. As in the previous year, no write-backs were effected in the year under review.
Self-generated software related to computer programmes for tourismapplications which were exclusively used internally by the Group.
As in the previous year, no write-backs to other intangible assets wereeffected in the year under review. As in 2002, there were no material restraints on ownership or disposal.
(16) Other intangible assets
Other intangible assetsConcessions,
industrialExploration property rights and drilling and similar Self-generated Payments on
€ million licences rights and values software account Total
Historical costBalance as at 1 Jan 2003 13.9 549.9 86.7 6.7 657.2Exchange differences – - 13.8 – – - 13.8Additions due to changes in consolidation – 1.1 – – 1.1Additions – 67.0 20.9 2.2 90.1Disposals 13.9 230.6 – – 244.51)
Reclassifications – 13.4 – - 6.5 6.9Balance as at 31 Dec 2003 0.0 387.0 107.6 2.4 497.0
AmortisationBalance as at 1 Jan 2003 13.9 359.4 23.7 0.0 397.0Exchange differences – - 8.4 – – - 8.4Additions due to changes in consolidation – 0.7 – – 0.7Amortisation for the current year – 65.7 18.6 – 84.3Disposals 13.9 164.1 – – 178.01)
Reclassifications – 2.8 – – 2.8Balance as at 31 Dec 2003 0.0 256.1 42.3 0.0 298.4
Carrying amount as at 31 Dec 2003 0.0 130.9 65.3 2.4 198.6Carrying amount as at 31 Dec 2002 0.0 190.5 63.0 6.7 260.2
1) of which disposals from changes in consolidation of € 216.8 million or € 170.5 million

Investment property and other property, plant and equipmentReal estate,
land rights andbuildings
incl. buildingson third-party Investment Pits, mines Machinery
€ million properties property and boreholes and fixtures
Historical costBalance as at 1 Jan 2003 1,500.2 253.6 732.2 762.9Exchange differences - 53.3 – – - 23.6Additions due to changes in consolidation 0.7 – – –Additions 70.9 4.5 4.1 18.5Disposals 110.2 6.6 724.6 315.9Reclassifications 25.6 1.3 - 11.7 29.3Balance as at 31 Dec 2003 1,433.9 252.8 0.0 471.2
DepreciationBalance as at 1 Jan 2003 402.9 82.6 577.9 520.6Exchange differences - 10.3 – – - 11.9Additions due to changes in consolidation 0.2 – – –Depreciation for the current year 57.3 22.3 11.4 55.5Disposals 48.9 2.2 577.6 262.7Reclassifications - 2.7 0.8 - 11.7 11.5Balance as at 31 Dec 2003 398.5 103.5 0.0 313.0
Carrying amounts as at 31 Dec 2003 1,035.4 149.3 0.0 158.2Carrying amounts as at 31 Dec 2002 1,097.3 171.0 154.3 242.3
1) of which disposals from changes in consolidation of € 1,175.1 million and € 904.5 million
At the balance sheet date, the carrying amount of the property, plant andequipment items subject to restraints on ownership amounted to € 89.4million (previous year: € 74.9 million), including an amount of € 85.5 million(previous year: € 54.5 million) pledged as security.
For the Group, write-backs totalling € 0.7 million (previous year: € 3.1million) were effected for property, plant and equipment.
Changes in individual items of property, plant and equipment primarilyresulted from disposals from the group of consolidated companies. Dueto the divestment of the capital-intensive companies of the PreussagEnergie Group and of the AMC Group, fixed assets declined by a total of€ 271.8 million, including an amount of € 145.1 million for pits, mines andboreholes and € 52.0 million for machinery and fixtures.
168
Financial Statements Notes on the Consolidated Balance Sheet
(17) Investment property and other property, plant and equipment

Property, plant and equipment comprised all leased assets in which consolidated companies carried all the risks and rewards incident toownership of the assets. Property, plant and equipment leased underfinance leases developed as follows in the year under review:
169
Notes on the Consolidated Balance Sheet Financial Statements
Other plants,Mobile buildings, operating
Ships and containers and and office Assets under Payments wagons container trailers Aircraft equipment construction on account Total
2,386.1 1,147.2 2,372.0 1,152.5 87.9 25.2 10,419.8- 9.9 - 0.5 - 77.4 - 30.4 - 3.3 - 0.9 - 199.3
– – 24.4 10.9 – – 36.024.5 77.5 81.7 180.7 76.8 7.2 546.413.0 68.2 106.9 206.3 45.4 12.2 1,609.31)
0.1 5.1 1.0 10.9 - 47.4 - 10.8 3.42,387.8 1,161.1 2,294.8 1,118.3 68.6 8.5 9,197.0
1,181.7 575.2 861.8 735.6 0.0 0.0 4,938.3- 6.0 - 0.2 - 32.4 - 13.4 – – - 74.2
– – 2.5 5.9 – – 8.684.2 82.4 117.9 132.9 – – 563.911.8 57.4 42.0 118.3 – – 1,120.91)
- 2.1 2.0 – - 0.5 – – - 2.71,246.0 602.0 907.8 742.2 0.0 0.0 4,313.0
1,141.8 559.1 1,387.0 376.1 68.6 8.5 4,884.01,204.4 572.0 1,510.2 416.9 87.9 25.2 5,481.5

Financial Statements Notes on the Consolidated Balance Sheet
170
The payment obligations arising on future lease payments were carried asliabilities at amortised cost, producing a constant rate of periodic interest.Payments due in the future under finance leases totalled € 688.9 million(previous year: € 848.8 million). The decline in leased assets and futurelease payments mainly resulted from the acquisition of aircraft previouslyleased. Group companies accepted guarantees for the residual values ofleased assets totalling € 186.1 million (previous year: € 187.0 million).
Reconciliation of future lease payments to liabilities from finance leases
31 Dec 2003 31 Dec 2002
Remaining termup to more than
€ million 1 year 1-5 years 5 years Total Total
Total future lease payments 101.3 255.4 332.2 688.9 848.8Interest portion 21.3 78.7 38.1 138.1 193.1Liabilities from finance leases 80.0 176.7 294.1 550.8 655.7
Development of leased assetsMobile
Ships buildingsand and
€ million Aircraft wagons containers Buildings Other Total
Historical costBalance as at 1 Jan 2003 839.3 170.4 108.4 162.7 30.2 1,311.0Exchange differences - 48.1 – – – – - 48.1Additions due to changes in consolidation – – – – – –Additions – – 0.8 4.5 6.7 12.0Disposals – 0.2 – 0.2 6.4 6.8Reclassifications - 51.2 - 10.8 - 1.3 – - 0.9 - 64.2Balance as at 31 Dec 2003 740.0 159.4 107.9 167.0 29.6 1,203.9
DepreciationBalance as at 1 Jan 2003 210.7 61.9 38.8 53.6 11.2 376.2Exchange differences - 18.8 – – – – - 18.8Additions due to changes in consolidation – – – – – –Depreciation for the current year 31.6 6.5 9.4 4.4 6.0 57.9Disposals – 0.1 – – 1.4 1.5Reclassifications - 2.5 - 7.2 - 2.0 – – - 11.7Balance as at 31 Dec 2003 221.0 61.1 46.2 58.0 15.8 402.1
Carrying amounts as at 31 Dec 2003 519.0 98.3 61.7 109.0 13.8 801.8Carrying amounts as at 31 Dec 2002 628.6 108.5 69.6 109.1 19.0 934.8

Notes on the Consolidated Balance Sheet Financial Statements
171
However, Group companies were not only lessees under finance leasesbut generated turnover of € 481.2 million (previous year: € 441.5 million)from current leasing and renting out property, plant and equipment.Movable property, plant and equipment were predominantly leased out,under operating leases, by the logistics division, particularly by the com-panies of the VTG-Lehnkering Group and the Algeco Group. In addition,the Group had residential property, leased out to third parties in order togenerate rental income. Overall, property, plant and equipment with acarrying amount of € 759.4 million (previous year: € 673.1 million) wasleased out to third parties, of which the largest proportion, € 583.2 million(previous year: € 474.4 million), was accounted for by transport vehiclesand mobile buildings.
In addition, the Group leased out Group-owned aircraft to third partieson the basis of finance leases.
Reconciliation of receivables from future lease paymentsto receivables from finance leases
31 Dec 2003 31 Dec 2002
Remaining termup to more than
€ million 1 year 1-5 years 5 years Total Total
Total receivables from future lease payments 14.9 60.2 111.7 186.8 38.3Interest portion 6.4 19.2 20.2 45.8 9.4Receivables from finance leases 8.5 41.0 91.5 141.0 28.9
As a matter of principle, real estate owned by the Group was occupiedfor use in the framework of the Group’s ordinary business activities. TheGroup also owned commercial property and apartments which met thedefinition of investment property under IAS 40. The fair value of thisinvestment property, with a carrying amount of € 149.3 million (previousyear: € 199.3 million) shown in fixed assets – and partly also in currentassets in the previous year – totalled around € 162.7 million (previousyear: around € 209.7 million). The fair values were calculated by theGroup’s own real estate company, without consulting an external expert,on the basis of comparable market rents. Property for which purchasecontracts had already been concluded was carried at the selling price asthe fair value. Investment property generated total income of € 138.4million (previous year: € 337.3 million). The generation of this income wasassociated with expenses of € 132.8 million (previous year: € 148.1 million)in the 2003 financial year.

Companies measured at equity and other investments Associated Shares in
Joint ventures companies non-consolidatedmeasured measured Group
€ million at equity at equity companies
Historical costBalance as at 1 Jan 2003 288.9 84.9 198.5Exchange differences - 29.4 - 0.9 - 6.0Additions due to changes in consolidation – – 34.2Additions 62.7 12.3 21.1Disposals 45.0 15.9 41.0Reclassifications – - 7.8 1.1Balance as at 31 Dec 2003 277.2 72.6 207.9
Amortisation Balance as at 1 Jan 2003 11.5 12.7 125.4Exchange differences - 3.2 – - 4.7Additions due to changes in consolidation – – 14.0Amortisation for the current year 3.6 1.9 3.6Disposals 0.1 6.0 9.1Reclassifications – - 3.0 –Balance as at 31 Dec 2003 11.8 5.6 129.2
Carrying amounts as at 31 Dec 2003 265.4 67.0 78.7Carrying amounts as at 31 Dec 2002 277.4 72.2 73.1
*) of which disposals from changes in consolidation of € 47.0 million and € 6.7 million
For associated companies and joint ventures measured at equity, propor-tionate changes in equity with an effect on results were shown underadditions and disposals, and amortisation of goodwill was carried underdepreciation/amortisation.
For companies jointly managed by the Group and one or several partners( joint ventures), the Group share corresponded to the share of individualassets and liabilities of the joint ventures.
172
Financial Statements Notes on the Consolidated Balance Sheet
(18) Companies measured at equity and other investments

Group share of individual assets and liabilities in joint ventures € million 31 Dec 2003 31 Dec 2002
Goodwill from equity measurement 12.7 42.9Fixed assets 414.7 417.3Current assets excl. liquid funds 57.1 53.6Liquid funds 24.4 33.7Provisions 19.3 19.6Financial liabilities 161.3 164.2Other liabilities 62.9 86.3Joint ventures measured at equity 265.4 277.4
173
Notes on the Consolidated Balance Sheet Financial Statements
Loans to Loans to companies Securitiesnon-consolidated in which held as
Group shareholdings fixed Other Paymentscompanies Investments are held assets loans on account Total
19.2 100.6 9.5 27.0 160.7 0.4 889.7– – – - 2.2 - 0.6 – - 39.1
0.1 – – 1.3 0.6 – 36.24.3 7.5 4.8 13.2 182.7 0.1 308.79.6 52.8 5.6 20.4 21.9 – 212.2*)
– - 2.0 0.6 – 0.7 – - 7.414.0 53.3 9.3 18.9 322.2 0.5 975.9
5.0 7.1 5.0 6.7 9.6 0.0 183.0– – – - 0.5 – – - 8.4– – – 0.1 – – 14.1
1.6 3.6 0.8 – 1.5 – 16.60.9 1.5 – 6.2 0.2 – 24.0*)
– – – – – – - 3.05.7 9.2 5.8 0.1 10.9 0.0 178.3
8.3 44.1 3.5 18.8 311.3 0.5 797.614.2 93.5 4.5 20.3 151.1 0.4 706.7

Financial Statements Notes on the Consolidated Balance Sheet
174
The TUI Group’s investments exclusively comprised loans and receivablesoriginated by the company in the form of loans or available-for-salefinancial assets. The loans and receivables were recognised at amortisedcost. Non-interest or low-interest loans were carried at their presentvalues and amortised according to the effective interest method. Theinterest rates for loans varied from 0% p.a. to 7.0% p.a. (previous year:0% p.a. to 9.8% p.a.).
Overall, shares in non-consolidated subsidiaries and investments with acarrying amount of € 122.8 million (previous year: € 166.6 million) weremeasured at cost.
Write-backs of € 0.1 million (previous year: € 1.0 million) were effected inother investments.
As in the previous year, none of the financial assets were subject toownership restraints at the balance sheet date.
Inventories€ million 31 Dec 2003 31 Dec 2002
Raw materials and supplies 75.9 113.3Work in progress 43.3 65.1Finished goods and merchandise 194.7 301.4Payments on account 221.6 161.7
535.5 641.5./. Advance payments received 3.1 3.2Total 532.4 638.3
Of the total of inventories, € 11.8 million (previous year: € 16.8 million)were carried at net realisable value. Write-backs of inventories of€ 2.3 million (previous year: none) were effected in the Group.
Inventories primarily related to the US steel service companies and com-panies operating as tour operators in the tourism division. The decline of€ 105.9 million was mainly due to the disposal of the companies of theAMC Group, sold in October 2003, which held corresponding inventoriessince they were trading companies.
The payments on account made mainly comprised advance payments forfuture tourism services, in particular hotel services, customary in the sector.Where these payments on account were made for a period of more thanone season, they were carried under non-current assets in the balancesheet.
(19) Inventories

Notes on the Consolidated Balance Sheet Financial Statements
175
Inventories totalling € 72.9 million (previous year: none) were pledged ascollateral by the US steel service companies in taking up a loan.
Trade accounts receivable€ million 31 Dec 2003 31 Dec 2002
from third parties 869.7 975.8from non-consolidated Group companies 15.7 21.0from affiliates 12.8 48.6Total 898.2 1,045.4
Trade accounts receivable included an amount of € 35.6 million (previousyear: € 42.6 million) of receivables with a remaining term of more thanone year.
Other receivables and assets31 Dec 2003 31 Dec 2002
Remaining term Remaining more than term more
€ million 1 year Total Total than 1 year
Derivatives 47.4 174.0 146.0 10.1Receivables from loans to non-consolidated Group companies 37.8 42.9 62.8 2.3Other receivables from non-consolidated Group companies – 7.9 14.0 –Receivables from loans to affiliates 4.5 25.9 53.6 13.1Other receivables from affiliates 2.2 22.8 18.2 1.8Other receivables 44.5 99.5 148.6 17.2Other tax refund claims 0.6 91.9 52.7 –Interest deferral – 16.2 10.4 –Receivables from loans to third parties 40.3 140.4 385.6 45.2Receivables from members of the boards 0.1 0.2 0.2 0.1Receivables from finance leases 132.5 141.0 28.9 3.9Other current assets 127.0 396.1 928.7 453.4Other assets 300.5 785.8 1,406.5 502.6Prepaid expenses 2.6 252.6 249.8 2.2Total 395.0 1,311.9 1,950.9 532.1
Restraints on ownership or disposal existed for an amount of € 50.8 million(previous year: none) of other receivables and assets reported in thefinancial statements.
Securities available for sale at short notice and recognised at fair valuewere shown under other assets. These securities mainly comprised listedsecurities and fixed-interest securities with interest rates of 1.63% p.a. to4.23% p.a. (previous year: 2.25% p.a. to 4.75% p.a.).
(20) Trade accounts
receivable
(21) Other receivables and
assets

Financial Statements Notes on the Consolidated Balance Sheet
176
Other prepaid expenses primarily comprised prepaid expenses for returnflights taking place after the balance sheet date and expenses for rental,maintenance and accrued brochure costs.
Assets from future income tax benefits comprised tax assets from tem-porary differences between the carrying amounts shown in the consolida-ted balance sheet and those carried in the tax balance sheet as well asthe tax savings from loss carryforwards assessed as recoverable in thefuture. Deferred tax assets are outlined in detail under note 12. This itemalso included current income tax claims.
Income tax claims€ million 31 Dec 2003 31 Dec 2002
Deferred income tax claims 188.3 285.4Current income tax claims 21.8 28.8Total 210.1 314.2
Cash and cash equivalents€ million 31 Dec 2003 31 Dec 2002
Bank deposits 327.7 262.8Cheques, cash in hand 20.8 103.7Total 348.5 366.5
As in the previous year, cash and cash equivalents were not subject toany constraints on disposal.
Group equityChanges in equity of the TUI Group are presented in the statement ofchanges in equity.
The subscribed capital of TUI AG consisted of no-par value shares, eachrepresenting an identical share in the capital stock. The proportionateshare in the capital stock per no-par value share was around € 2.56.
The subscribed capital of TUI AG, registered in the commercial registersof the district courts of Berlin-Charlottenburg and Hanover, rose by€ 1,100,249.00 to a total of € 456,247,933.11 due to the issuance of430,380 employee shares. Subscribed capital thus comprised 178,468,679shares (previous year: 178,038,299 shares) at the end of the financial year.
(22) Current and deferred
income tax claims
(23) Cash and cash
equivalents
(24) Subscribed capital

Notes on the Consolidated Balance Sheet Financial Statements
177
The Annual General Meeting of 18 June 2003 authorised the ExecutiveBoard of TUI AG to purchase own shares of up to 10% of the subscribedcapital. The authorisation will expire on 17 December 2004 and replacesthe authorisation granted by the Annual General Meeting of 26 June2002. So far, the possibility of acquiring own shares has not been used.
GEV Gesellschaft für Energie- und Versorgungswerte mbH, Dortmund, asubsidiary of WestLB AG, Düsseldorf/Münster, held more than 25% ofthe subcribed capital of TUI AG at the balance sheet date.
Conditional capitalThe Annual General Meeting of 31 March 1999 adopted a resolution creating a conditional capital of € 39.0 million for the issue of conversionrights in connection with the issue of convertible bonds. On the basis ofthis resolution, TUI AG issued a convertible bond of € 550.0 million inJune 1999. This convertible bond has been admitted to trading on thestock exchange since 17 June 1999. In the year under review, no conversionrights were exercised, as in the previous year. Conversion rights for a con-ditional capital of just under € 39.0 million were not yet exercised by thebalance sheet date.
On 18 June 2003, the Annual General Meeting adopted a resolution creating an additional conditional capital of € 90.0 million. The conditionalcapital was intended to service conversion rights and warrants from theissue of one or several bonds with a total par value of up to € 1.0 billionby 17 June 2008. In October 2003, convertible bonds totalling around € 384.6 million were issued. The conversion rights entitled the holders toconvert each convertible bond of a par value of € 50,000.00 into 2,314.81shares in TUI AG. The convertible bond has been admitted to official stockexchange trading since 1 December 2003. Exercise of the conversionrights has been possible since 2 January 2004.
The resolutions adopted at the Annual General Meetings of 12 April 2000and 26 June 2002 to create a total conditional capital of € 95.0 millionfor the issuance of convertible bonds or bonds were reversed.
Changes in conditional capitalAvailment in the current financial year
Conditional Number of exercised Increase in Changes due Conditionalcapital warrants and subscribed to AGM capital
€ ‘000 31 Dec 2002 conversion options capital resolutions 31 Dec 2003
Conversion rights 133,997 - - - 5,000 128,997Total 133,997 - - - 5,000 128,997

(25) Reserves
Financial Statements Notes on the Consolidated Balance Sheet
178
Authorised capitalThe authorised capital created at the Annual General Meeting of 12 April2000 of up to a total of € 10.0 million for the issue of employee shareswas partly used in the financial year under review to issue 430,380employee shares. At the end of the financial year, authorised capitalstood at € 8,047,977.07 (previous year: € 9,148,226.07).
The authorised capital of up to € 165.0 million created by the AnnualGeneral Meeting of 12 April 2000 was not used during the financial yearto issue new no-par value shares against cash or non-cash contribution.
In addition, the Annual General Meeting of 12 April 2000 created anotherauthorised capital of up to € 44.0 million. As in the previous year, thisauthorised capital was not used to issue new no-par value shares againstcash contribution.
The Group’s reserves comprised the capital reserve, revenue reserves, differences arising on the currency translation of goodwill and financialstatements of foreign subsidiaries as well as the revaluation reserve forfinancial instruments. Changes in individual reserves are outlined in detailin the statement of changes in equity.
Capital reservesCapital reserves only included transfers of share premiums from the issueof shares and amounts that were generated by the issue of bonds forconversion options and warrants to purchase shares in TUI AG. Premiumsfrom the exercise of conversion options and warrants were also transferredto the capital reserves. The funding costs for the issue of conversionoptions and warrants and the capital increase by the issue of new sharesagainst cash contribution were offset against the transfers to capitalreserves resulting from these transactions.
In the financial year under review, capital reserves increased by € 3.2 milliondue to the issue of employee shares (previous year: no change from theissue of new shares). Capital reserves rose by an additional amount of€ 27.1 million due to the transfer of the equity component of the conver-tible bond issued in October 2003, taking account of deferred taxes. Inaddition, capital reserves increased by € 4.4 million (previous year: € 4.3million) as a result of the reversal of the provision for deferred taxes, setup in the wake of the issuance of conversion options and taken directlyto capital reserves.

Notes on the Consolidated Balance Sheet Financial Statements
179
Revenue reservesRevenue reserves consisted of other revenue reserves pursuant to com-mercial-law reporting requirements. They comprised appropriations fromthe results of the current or previous financial years as well as eliminationsof goodwill and negative goodwill from capital consolidation and equitymeasurement of subsidiaries purchased before 30 September 1995. Inaddition, adjustments from the first-time application of new IFRS standardswere transferred to or offset against revenue reserves. The change inrevenue reserves with no effect on results related to goodwill of subsidiariespurchased before 1 October 1995. Where these companies disposed ofgoodwill purchased before 1 October 1995, amounts directly taken torevenue reserves in the past were reversed with no effect on results.
The articles of association of TUI AG did not contain any provisions pertaining to the formation of reserves.
Differences arising on currency translationDifferences arising on currency translation comprised differences fromthe currency translation of the financial statements of foreign subsidiariesas well as differences from the translation of goodwill denominated inforeign currency due to the first-time application of IAS 21 (revised 2003).
Differences arising on currency translation totalled around € -179.9 millionand mainly resulted from the voluntary application of IAS 21 (revised 2003)prior to its effective date.
Revaluation reserve for financial instrumentsThe reserve for changes in the value of financial instruments contained allaccumulated gains and losses from changes in the fair values of financialinstruments entered into as cash flow hedges. When the hedged transactionoccurred, the results of the hedge were reclassified either as an incomeor expense item in the profit and loss statement or as an increase ordecrease in the cost of assets.
In accordance with section 58 sub-section 2 of the German Stock Corpo-ration Act, dividend payments to TUI AG’s shareholders were based onnet profit available for distribution of the commercial-law financial state-ments of TUI AG.
(26) Net profit available
for distribution

Financial Statements Notes on the Consolidated Balance Sheet
180
Reconciliation of Group profit for the year to net profit available for distribution of TUI AG € million 2003 2002
Group profit for the year (excl. minority shares) 275.0 32.0Retained profits brought forward of TUI AG 0.4 0.4Withdrawals from reserves – 105.1Transfers to reserves 137.6 –Net profit available for distribution of TUI AG 137.8 137.5
A proposal will be submitted to the Annual General Meeting to use theprofit available for distribution for the payment of a dividend of € 0.77per no-par value share and to carry the amount of € 379,117.17 remainingafter the deduction of the dividend total of € 137,420,882.83 forward onnew account.
Minority interests mainly related to companies of the tourism division,above all companies of the RIU Group (minority interest: 50%), the MagicLife Group (minority interest: 49%), TUI Suisse Group (minority interest:49%) and the Anfi Group (minority interest: 49%). Other noteworthyminority interests existed in the logistics sector in the Algeco Group(minority interest: approx. 33%).
A number of pension schemes based on defined contribution plans ordefined benefit plans were provided for the employees. Pension obligationsvaried according to the legal, fiscal and economic circumstances of thecountry concerned and usually depended on employees‘ length of serviceand pay levels. Whereas defined contribution plans were funded externallyas a matter of principle, systems existed for defined benefit plans entailingthe formation of provisions or investments in funds outside the company.
German employees enjoyed benefits from a statutory defined contributionplan paying pensions as a function of employees‘ income and the contri-butions paid in. Several other industry pension organisations existed forcompanies of the TUI Group. Once the contributions to the state and private pension insurance institutions had been paid, no further obligationsexisted for the Company. Current contribution payments were recognisedas an expense for the respective period. In the 2003 financial year, thepension costs for all defined contribution plans for the TUI Group totalled€ 98.5 million (previous year: € 90.8 million). The pension costs for definedbenefit pension commitments totalled € 138.9 million (previous year: € 122.9 million).
(27) Minority interests
(28) Pension provisions
and similar obligations

Notes on the Consolidated Balance Sheet Financial Statements
181
Pension costs for defined benefit pension obligations € million 2003 2002
Current service cost resulting from employee service in the current period 50.5 51.6Interest cost 103.7 106.7Expected return on external plan assets 55.6 54.8Past service cost due to plan changes 1.1 0.1Losses/gains on curtailment orsettlement of pension obligations - 0.2 –Amortisation of actuarial gains/losses 39.4 19.3Total 138.9 122.9
The increase in pension costs for defined benefit pension obligations in2003 mainly resulted from an increase in amortisation of actuarial losses.Amortisation primarily related to actuarial losses incurred in 2002 forpension obligations of TUI Northern Europe.
Provisions for pension obligations were established for benefits payable in the form of retirement, invalidity and surviving dependants‘ benefits. Provisions were exclusively formed for defined benefit schemes underwhich the Company guarantees employees a certain level of pension.Provisions for similar obligations covered in particular early retirementand temporary assistance benefits.
Pension provisions were almost exclusively related to benefit obligationsfor German companies
Due to the divestment of the companies of the Preussag Energie Group,the provision for pensions and similar obligations decreased by € 69.3million.
Where the defined benefit pension obligations were not financed byprovisions, they were funded externally. This type of funding of pensionobligations prevailed to a considerable extent in the Northern Europe
Development of provisions for pensions and similar obligationsChanges in
Opening group of Closingbalance consolidated balance
€ million 1 Jan 2003 companies1) Utilisation Reversal Addition 31 Dec 2003
Provisions for pensions 662.5 - 78.9 39.6 3.8 83.6 623.8Similar obligations 20.3 - 0.4 2.2 0.1 3.7 21.3Total 682.8 - 79.3 41.8 3.9 87.3 645.1
1) as well as transfers and exchange differences

Financial Statements Notes on the Consolidated Balance Sheet
182
sector in TUI UK and Britannia Airways Ltd. Furthermore, funded pensionobligation systems were operated predominantly by foreign companies ofHapag-Lloyd Container Linie, the TUI Suisse Group, in the Netherlandsand in the US steel service companies.
While the fund assets were determined on the basis of the fair values ofinvested funds as at 31 December 2003, the pension obligations weremeasured by actuarial calculations and assumptions. The obligations underdefined benefit plans were calculated in keeping with the internationallyaccepted Projected Unit Credit Method, taking account of expected futureincreases in salaries and pensions.
Actuarial parameters applied to German companies Percentage p.a. 2003 2002
Discount rate 5.25 5.6Projected future salary increases 1.67 – 3.0 1.83 – 2.5Projected future pension increases 1.0 – 1.67 1.0 – 2.0Projected employee turnover rate 2.0 2.0
Actuarial calculations for companies abroad were based on specific para-meters for each country concerned.
Actuarial assumptions for foreign companies 2003 2002
Projected ProjectedProjected future Projected future
Discount return on salary Discount return on salaryPercentage p.a. rate plan assets increases rate plan assets increases
Eurozone 5.25 5.25 – 6.0 2.0 – 3.8 5.0 – 5.6 5.0 – 6.4 2.0 – 3.5UK 5.4 7.7 3.8 – 4.3 5.6 8.0 3.4 – 3.9Other Europe 3.75 – 5.25 3.25 – 7.0 0.0 – 3.5 5.5 7.0 3.5America 6.25 8.0 4.0 6.75 8.0 4.0Asia 2.0 – 3.5 1.5 – 2.75 1.5 – 3.0 2.0 – 4.0 3.25 1.5 – 3.0

Notes on the Consolidated Balance Sheet Financial Statements
183
Reconciliation of the present value of pension obligations to liabilityrecognised in the balance sheet € million 31 Dec 2003 31 Dec 2002
Actual present value of all pension obligations 1,846.2 1,961.5Fair value of external plan assets 831.1 852.4Net present value of pension obligations 1,015.1 1,109.1Adjustment for unrecognised actuarial gains/losses - 398.8 - 446.6Adjustment for past service benefits 0.5 –Net recognised liability 616.8 662.5of which provisions for pensions (+) 623.8 662.5of which assets (-) - 7.0 –
The difference of € 398.3 million not yet affecting results at the balancesheet date will be recognised ratably as an expense over the remainingworking lives of active employees. The reduction in the difference mainlyresulted from exchange rate changes, amortisation of the current financialyear and disposals from consolidation. The reduction in the discount ratehad an opposite effect.
Relationship of plan assets to benefit obligations Plans with obligation Plans with assets
in excess of assets in excess of obligation€ million 31 Dec 2003 31 Dec 2002 31 Dec 2003 31 Dec 2002
Fair value of plan assets 727.4 725.9 103.7 126.5Present value of benefit obligations 1,201.4 1,231.2 101.2 122.6Excess - 474.0 - 505.3 + 2.5 + 3.9
Due to the divestment of the AMC Group with its externally funded pension obligations, both plan assets and pension obligations declined byapprox. € 130.0 million. In addition, plans with obligations in excess ofassets declined due to changes in exchange rates, in particular exchangelosses of British Pounds Sterling against euros.
In the completed financial year, plan assets generated higher than expectedreturns due to the recovery of international capital markets. However, anopposite effect was produced by the reduction in the discount rate, whichled to an increase in the present value of pension obligations. In net terms,these changes resulted in a reduction in actuarial losses.
Where plan assets exceeded obligations, taking account of actuarial gainsor losses, in funded pension obgliations, the excess was capitalised inconformity with the upper limit defined by IAS 19 (revised 2002).

Financial Statements Notes on the Consolidated Balance Sheet
184
Income tax provisionsIncome tax provisions comprised provisions for current and deferred income taxes. Provisions for deferred taxes are outlined in note 12.
Other provisionsOther provisions comprised provisions for personnel costs, typical operating risks, other taxes and miscellaneous provisions.
Provisions for personnel costs comprised vacation provisions and unpaidbonus payments, severance compensation and jubilee benefits.
Provisions for personnel costs also contained provisions for the ‘phantomstocks‘ granted as a bonus to the members of the Executive Board andsenior executives in the framework of a long-term incentive programme.A provision is formed for the personnel costs under this incentive pro-gramme upon the granting of the ‘phantom stocks‘ and adjusted to thechanges in the price of the TUI shares until the exercise date.
Provisions for typical operating risks declined considerably in the financialyear under review. This was attributable to the divestment of the PreussagEnergie Group which had substantial provisions for recultivation and wastedisposal obligations, in particular for field clearing and borehole sealing.The remaining provisions for typical operating risks of € 114.1 millioncomprised provisions for maintenance operations for leased aircraft of€ 53.4 million and provisions for stabilising and restoration measures forthe former mining activities (approx. € 36.0 million). These provisions
(29) Tax provisions and other
provisions
Development of provisions in the 2003 financial year Changes in
Opening group of Closingbalance consolidated balance
€ million 1 Jan 2003 companies1) Utilisation Reversal Addition 31 Dec 2003
Provisions for current income tax 377.4 - 31.0 132.8 81.2 146.7 279.1Provisions for deferred taxes 475.5 - 95.6 – 170.7 – 209.2Income tax provisions 852.9 - 126.6 132.8 251.9 146.7 488.3Personnel costs 262.4 - 18.7 133.1 23.2 239.3 326.7Typical operating risks 338.6 - 262.4 16.2 1.4 55.5 114.1Other taxes 46.0 - 2.2 8.7 0.4 32.5 67.2Miscellaneous provisions 583.2 1.4 157.3 49.6 159.0 536.7Other provisions 1,230.2 - 281.9 315.3 74.6 486.3 1,044.7Total 2,083.1 - 408.5 448.1 326.5 633.0 1,533.0
1) as well as transfers and exchange differences

included an amount of € 17.0 million (previous year: € 2.1 million) fornecessary environmental protection measures.
Miscellaneous provisions mainly included provisions for risks from onerouscontracts (€ 103.7 million; previous year: € 105.7 million) and guarantee,warranty and liability risks (€ 99.6 million; previous year: € 103.4 million).With regard to the insolvency of Babcock Borsig AG, provisions were formed in previous years for guarantee and liability risks to fully cover therisks from the anticipated implementation of guarantees and warrantiesgranted in previous years for the former plant engineering activities; inthe financial year under review, these provisions were partly utilised anddeclined accordingly. The provisions for risks from onerous contracts wereformed for committed hotel and flight capacity already contracted butprobably not to be fully utilised. In addition, provisions had to be recognisedfor rented property not utilised.
Maturities of income tax provisions and other provisions31 Dec 2003 31 Dec 2002
Remaining Remainingterm of more term of more
€ million than 1 year Total Total than 1 year
Provisions for current taxes on income 119.9 279.1 377.4 207.1Provisions for deferred taxes 193.8 209.2 475.5 426.8Income tax provisions 313.7 488.3 852.9 633.9Personnel costs 70.4 326.7 262.4 67.2Typical operating risks 84.4 114.1 338.6 291.6Other taxes 24.5 67.2 46.0 16.6Miscellaneous provisions 180.9 536.7 583.2 237.0Other provisions 360.2 1,044.7 1,230.2 612.4Total 673.9 1,533.0 2,083.1 1,246.3
Notes on the Consolidated Balance Sheet Financial Statements
185

Financial Statements Notes on the Consolidated Balance Sheet
186
Convertible bonds included the convertible bonds issued by TUI AG inJune 1999 and October 2003 of € 550.0 million and € 384.6 million, respectively. The bearer bond of € 750.0 million issued in October 1999was carried under other bonds.
The convertible bond of € 550.0 million maturing on 17 June 2004 entailedan interest coupon of 2.125% p.a. and entitled holders to convert eachconvertible bond of a par value of € 1,000.00 into 15.9128 shares at anarithmetic conversion price of around € 62.84 per share. As a matter ofprinciple, the conversion option may be exercised any time between 1 July 1999 and 28 May 2004.
The convertible bond of € 384.6 million issued in October 2003 willmature on 1 December 2008 and carries an interest coupon of 4.0% p.a.Each convertible bond of a par value of € 50,000.00 entitles the holderto convert it into approx. 2,314.81 shares at a conversion price of € 21.60per share any time between 2 January 2004 and 17 November 2008.
The debt component of the convertible bonds was carried at the issuedate at its present value based on an interest rate in line with marketconditions and was increased by the interest portion of the period as atthe balance sheet date in accordance with the internationally acceptedEffective Interest Method.
(30) Liabilities
Financial liabilities31 Dec 2003 31 Dec 2002
Remaining term Remaining termup to more than more than more than
€ million 1 year 1-5 years 5 years Total Total 1 year
Convertible bonds 544.4 332.8 – 877.2 532.4 532.4Other bonds – 748.4 – 748.4 747.9 747.9Liabilities to banks 681.6 867.2 150.1 1,698.9 3,499.5 472.5Liabilities from bills drawn – – – – 0.2 –Liabilities from finance leases 80.0 176.7 294.1 550.8 655.7 550.7Financial liabilities due to non-consolidated Group companies 50.2 – 12.3 62.5 49.8 4.0Financial liabilities due to affiliates1) 65.6 108.2 – 173.8 256.9 74.0(of which to banks) (53.7) (108.2) (–) (161.9) (241.0) (74.0)Other financial liabilities 45.3 3.5 16.9 65.7 68.9 35.4Total 1,467.1 2,236.8 473.4 4,177.3 5,811.3 2,416.9
1) Consists of financial liabilities owned by the group of companies in which the Group has a shareholding interest or which have a shareholding interest in any Group company.

Notes on the Consolidated Balance Sheet Financial Statements
187
The bearer bond of € 750.0 million was divided into 750,000 bonds witha par value of € 1,000.00. The bond with a notional interest rate of5.875% matures on 23 October 2006.
Most medium- and long-term liabilities to banks, including banks in whichshareholdings were held, were based on floating interest rates and werebroken down as follows:
At € 171.7 million, the fair values of the main fixed-interest loan liabilitiesonly slightly exceeded the carrying amounts of € 165.8 million. For floating-interest liabilities, the carrying amounts corresponded to the fair values.
Material liabilities to banks31 Dec 2003 31 Dec 2002
Weighted Remaining termMaturing average up to more than more thanin interest rate p.a. € million 1 year 1 to 5 years 5 years € million
2003 – – – – 2,82004 6.04% 0.3 0.3 – – 3.42005 7.79% 9.4 0.4 7.8 1.2 –2006 4.72% 124.6 44.3 80.3 – 171.22007 5.63% 27.5 2.5 25.0 – 11.12008 3.63% 4.0 – 4.0 – –
Total fixed–interest 165.8 47.5 117.1 1.2 188.52003 Euribor – – – – 524.82005 Libor – – – – 35.72006 Euribor 555.3 254.5 300.8 – 25.22006 Libor 1.5 – 1.5 – –2007 Euribor 46.5 0.5 46.0 – 48.22008 Euribor 294.3 2.1 267.2 25.0 19.02008 Libor 101.6 – 101.6 – –2009 Libor 31.5 6.0 24.0 1.5 46.92012 Libor 106.6 3.9 40.1 62.6 118.6After 2012 Euribor 39.5 1.0 5.9 32.6 –
Total floating-interest 1,176.8 268.0 787.1 121.7 818.4Other 141.8 43.4 71.2 27.2 158.2Total medium- and long-term liabilities 1,484.4 358.9 975.4 150.1 1,165.1Euribor 349.3 349.3 – – 2,429.4Libor – – – – 127.1Other 27.1 27.1 – – 19.0Total short-term liabilities 376.4 376.4 – – 2,575.5Total 1,860.8 735.3 975.4 150.1 3,740.6Of which due to related parties (161.9) (53.7) (108.2) – (241.0)

Financial Statements Notes on the Consolidated Balance Sheet
188
In the 2003 financial year, the Group renewed a syndicated bank loan of€ 800 million. The Group also had other bilateral short-term credit lines.These credit lines were almost exclusively floating-interest loans based onEURIBOR. In addition, long-term notes of € 42 million were issued in the2003 financial year.
In addition, a conventional bank guaranty (bonding facility) of GBP 397million was renewed in the Northern Europe sector in the 2003 financialyear in order to meet the legal requirements applicable to package touroperating in source markets England, Ireland and Scandinavia.
In September 2003, a long-term credit line of USD 195 million, indepen-dent of other Group financing, was taken up from an American bankingconsortium to finance the operations of the US steel service companies.The assets of the US steel service companies were pledged as collateralfor the loan. The credit line was a floating-interest loan based on LIBOR.
Current floating-interest liabilities with a volume of approx. € 1.6 billionwere hedged against increases in interest rates by means of interest rateswaps.
The liabilities from finance leases were recognised at amortised cost, producing a constant rate of periodic interest.
Liabilities secured by mortgages, assignment as security or similar rights€ million 31 Dec 2003 31 Dec 2002
to banks 321.5 199.0to non-banks 37.8 7.7Total 359.3 206.7
Trade accounts payable 31 Dec 2003 31 Dec 2002
Remaining term Remaining termup to more than more than more than
€ million 1 year 1-5 years 5 years Total Total 1 year
to third parties 2,000.1 15.5 6.4 2,022.0 1,943.4 0.5to non-consolidated Group companies 6.3 – – 6.3 9.9 –to affiliates 8.3 – – 8.3 16.4 –Total 2,014.7 15.5 6.4 2,036.6 1,969.7 0.5

Notes on the Consolidated Balance Sheet Financial Statements
189
The negative fair values of derivative financial instruments recognised inliabilities and predominantly serving to hedge the future operating businessare outlined in detail in the explanatory information on financial instruments.
Deferred income included government grants to promote investmentsand not directly attributable to individual asset items (investment grants)of € 2.1 million (previous year: € 1.4 million).
Of the total of all liabilities in the previous year, € 519.6 million had aremaining term of more than five years.
Other liabilities31 Dec 2003 31 Dec 2002
Remaining term Remaining termup to more than more than more than
€ million 1 year 1-5 years 5 years Total Total 1 year
Derivatives 138.5 111.5 – 250.0 176.1 54.1Other liabilities due to non-consolidated Group companies 18.7 – – 18.7 6.2 1.0Other liabilities due to affiliates 2.6 – – 2.6 4.3 –Other liabilities relating to income taxes 2.1 – – 2.1 3.6 –Other liabilities relating to other taxes 53.6 – – 53.6 61.7 –Other liabilities relating to social security 62.7 0.2 0.5 63.4 52.7 0.8Other liabilities relating to employees 18.9 0.1 – 19.0 19.1 0.1Other liabilities relating to members of the boards 2.8 – – 2.8 6.0 –Other miscellaneous liabilities 256.1 11.2 1.6 268.9 453.9 15.2Liabilities for bills accepted 21.2 – – 21.2 18.9 –Advance payments received 1,019.0 43.6 – 1,062.6 895.3 43.4Other liabilities 1,457.7 55.1 2.1 1,514.9 1,521.7 60.5Deferred income 27.7 31.3 6.4 65.4 92.2 58.0Total 1,623.9 197.9 8.5 1,830.3 1,790.0 172.6

Financial Statements Notes on the Consolidated Balance Sheet
190
Contingent liabilities
Contingent liabilities€ million 31 Dec 2003 31 Dec 2002
Liabilities on bills – 0.3Liabilities under guarantees, bill and cheque guarantees due to non-consolidated Group companies 16.4 12.3Other liabilities under guarantees, bill and cheque guarantees 653.2 772.1Liabilities under warranties due to non-consolidated Group companies – –Other liabilities under warranties 2.8 1.9Contingent liabilities related to the provision of collateral for third-party liabilities 3.1 0.9Total 675.5 787.5
Contingent liabilities were carried at the level of potential availment as atthe balance sheet date.
Liabilities under warranties were all contractual liabilities to third partiesnot to be classified as guarantees and going beyond the typical scope ofthe business and the industry.
In connection with the insolvency of Babcock Borsig AG, provisions wereformed to fully cover the guarantees and warranties granted in previousyears for activities in the former plant engineering sector which were probable to be called up. All remaining guarantees and warranties fromformer activities in plant engineering and shipbuilding served the settle-ment of ongoing business transactions and were shown at their amountsat the balance sheet date. The reduction in guarantees and warranties ledto a corresponding reduction in the amount for the financial year underreview.
Contingent liabilities relating to the provision of collateral for third-partyliabilities covered assets used to collateralise third-party liabilities.
The TUI Group companies were jointly and severally liable for participationsin civil-law partnerships for which profit and loss transfer agreementswith subsidiaries existed, for participations in joint ventures and participa-tions in partnerships as general partner.
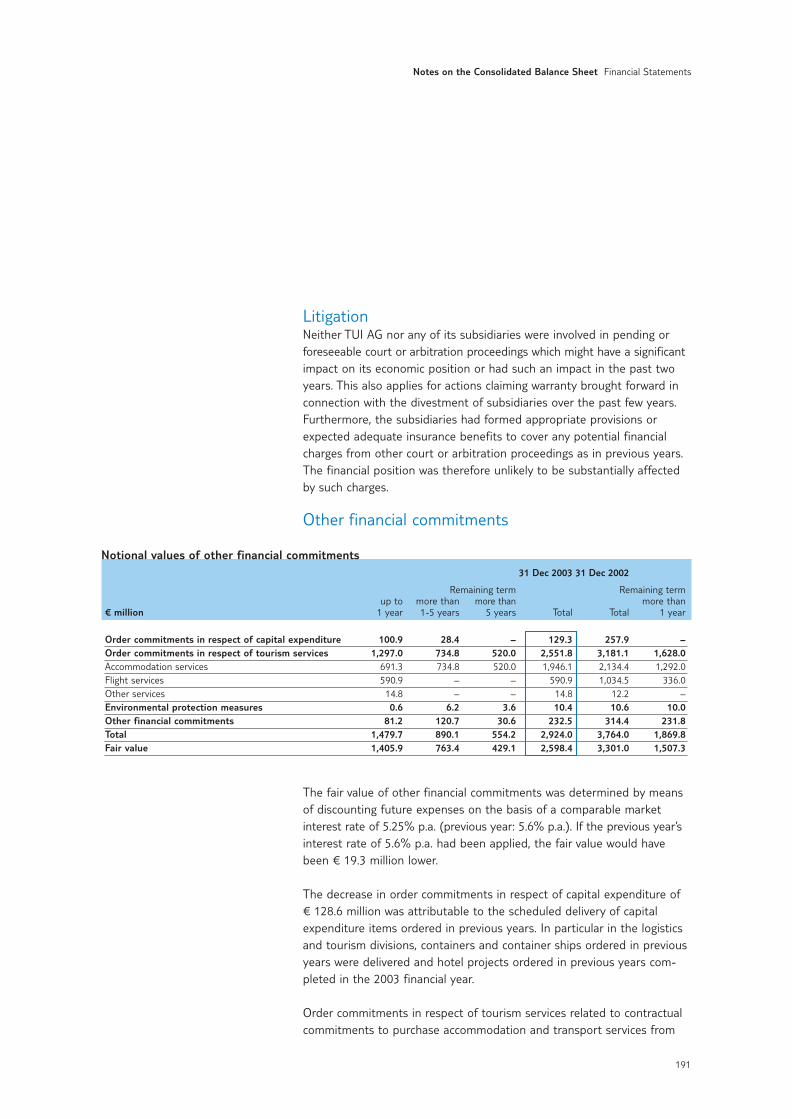
Notes on the Consolidated Balance Sheet Financial Statements
191
Litigation Neither TUI AG nor any of its subsidiaries were involved in pending orforeseeable court or arbitration proceedings which might have a significantimpact on its economic position or had such an impact in the past twoyears. This also applies for actions claiming warranty brought forward inconnection with the divestment of subsidiaries over the past few years.Furthermore, the subsidiaries had formed appropriate provisions orexpected adequate insurance benefits to cover any potential financialcharges from other court or arbitration proceedings as in previous years.The financial position was therefore unlikely to be substantially affectedby such charges.
Other financial commitments
The fair value of other financial commitments was determined by meansof discounting future expenses on the basis of a comparable market interest rate of 5.25% p.a. (previous year: 5.6% p.a.). If the previous year’sinterest rate of 5.6% p.a. had been applied, the fair value would havebeen € 19.3 million lower.
The decrease in order commitments in respect of capital expenditure of€ 128.6 million was attributable to the scheduled delivery of capitalexpenditure items ordered in previous years. In particular in the logisticsand tourism divisions, containers and container ships ordered in previousyears were delivered and hotel projects ordered in previous years com-pleted in the 2003 financial year.
Order commitments in respect of tourism services related to contractualcommitments to purchase accommodation and transport services from
Notional values of other financial commitments31 Dec 2003 31 Dec 2002
Remaining term Remaining termup to more than more than more than
€ million 1 year 1-5 years 5 years Total Total 1 year
Order commitments in respect of capital expenditure 100.9 28.4 – 129.3 257.9 –Order commitments in respect of tourism services 1,297.0 734.8 520.0 2,551.8 3,181.1 1,628.0Accommodation services 691.3 734.8 520.0 1,946.1 2,134.4 1,292.0Flight services 590.9 – – 590.9 1,034.5 336.0Other services 14.8 – – 14.8 12.2 –Environmental protection measures 0.6 6.2 3.6 10.4 10.6 10.0Other financial commitments 81.2 120.7 30.6 232.5 314.4 231.8Total 1,479.7 890.1 554.2 2,924.0 3,764.0 1,869.8Fair value 1,405.9 763.4 429.1 2,598.4 3,301.0 1,507.3

Financial Statements Notes on the Consolidated Balance Sheet
192
non-Group suppliers and associated companies as well as joint ventures.The significant decrease in order commitments in respect of flight servicesresulted in particular from the insolvency of Belgian charter airline Sobelair.
The fair value of financial commitments from lease, rental and chartercontracts was determined by means of discounting future expenses onthe basis of a comparable market interest rate of 5.25% p.a. (previousyear: 5.6% p.a.). If the previous year’s interest rate of 5.6% p.a. had beenapplied, the fair value would have been € 29.2 million lower.
The commitments from lease, rental and leasing contracts exclusivelyrelated to leases that did not transfer all the risks and rewards incident toownership of the asset to the companies of the TUI Group in accordancewith the IASB rules (so-called operating leases). The slight decline incommitments from hotel lease agreements resulted from the timing ofthe corresponding agreements. The increase in commitments for shipsresulted from an expansion of the fleet by means of operating leases.
Other financial commitments mainly included amounts for obligationsfrom orders already placed, commitments in connection with leased landclean-up and renovation, payment obligations and liabilities in connectionwith shareholdings. They also included other financial commitments fromcontractual agreements to purchase subsidiaries.
Financial commitments from operating lease, rental and charter contracts 31 Dec 2003 31 Dec 2002
Remaining term Remaining termup to more than more than more than
€ million 1 year 1-5 years 5 years Total Total 1 year
Hotel complexes 154.2 175.6 163.5 493.3 587.7 454.5Travel agencies 57.4 172.3 163.8 393.5 463.3 399.5Administrative buildings 41.7 114.3 73.8 229.8 271.7 220.2Aircraft 207.7 733.8 168.7 1,110.2 1,185.8 966.2Ships 82.7 285.6 201.3 569.6 401.8 347.1Rolling stock 29.0 73.4 61.8 164.2 152.9 127.3Other 128.3 295.5 63.6 487.4 579.4 442.5Total 701.0 1,850.5 896.5 3,448.0 3,642.6 2,957.3Fair value 665.9 1,587.2 694.1 2,947.2 3,063.2 2,414.2

Notes on the Consolidated Balance Sheet Financial Statements
193
Financial instrumentsFinancial instruments entail contractual rights or obligations that will leadto an outflow or inflow of financial assets or to the issue of equity rights.They also comprise derivative claims or obligations derived from otherfinancial instruments. The fair value of a financial instrument is the amountfor which an asset could be exchanged, sold or purchased, or a liabilitysettled, between knowledgeable and willing parties in an arm’s lengthtransaction.
Hedging strategy and risk management Due to their financial nature, financial instruments were exposed to cer-tain financial risks which the Group eliminated or limited by means ofappropriate risk strategies and hedging methods.
TUI’s financial risk strategy has changed as the Group has realigned froma diversified multi-sector group to a services group focusing on tourismand logistics. All essential financial transactions have been centralised.Following this restructuring, TUI AG will assume the central role as theGroup’s bank, responsible for all financial transactions for the Group com-panies and the Group-wide financial risk management as a matter ofprinciple. Following the introduction of the required organisational measuresin the Group and the implementation of some of these measures, thecentralisation shall be completed in 2004.
Risk management was based on guidelines and rules fixing binding deci-sional bases, competencies and responsibilites for all financial transactions.
In accordance with these Group guidelines, the Group companies submittedmonthly reports to TUI AG detailing their current and planned foreigncurrency and fuel volumes. On this basis, TUI AG entered into appropriatehedges; currency risks were hedged by initially netting currency incomeand expenses in the same currency and with equivalent terms. As a matterof principle, all hedging transactions of the Group were thus based oncorresponding recognised or future underlying transactions. Hedgesexclusively consisted of unlisted derivatives. These were predominantlyfixed-price transactions (e.g. forward transactions and swaps) as well asoptions. The transactions were concluded at arm’s length with first-ratecontracting partners with top-class creditworthiness operating in thefinancial services sector.
Use of derivative financial instruments was confined to internally fixedand regularly checked limits. There was a strict organisational separationbetween the functional areas of trading, settlement and control. A regular

internal control and monitoring system was operated to check compliancewith the set limits and guidelines on the one hand and performance incomparison with overall industry standards on the other. Generally recog-nised standard software was used for regular reporting, assessment andmonitoring of the hedges entered into and the underlying transactions.
The scope of hedges of currency transactions in the tourism division totalled80% to 100% of the planned foreign currency requirements in the res-pective tourism season, depending on calculated brochure prices. Thehedged volumes were adjusted to changes in planning requirements basedon monthly reports by subsidiaries to rule out quantitative overhedging.
Risk factorsThe value of a financial instrument may change due to changes inexchange rates (currency risk), level of interest rates (interest rate risk)and changes in market and stock exchange prices (market risk).
The operative business of companies of the TUI Group generated pay-ments denominated in foreign currencies, which were not always matchedby congruent payments having an equivalent term in the same currency.To this extent the Group companies were exposed to currency risks. Withinthe TUI Group, risks from exchange rate fluctuations of more than 20currencies were hedged, with the largest hedging volumes relating to USdollars, euros and British pounds sterling.
The largest hedging volume in the operative business related to US dollars.In the tourism division, payments in US dollars primarily related to theprocurement of services in non-European destinations and purchases ofaircraft fuel and aircraft. In the logistics division, in particular in the frame-work of international liner shipping, major procurement and sales trans-actions were denominated in US dollars. Due to the structure of the respective business, the tourism division had a substantial short US dollarposition while the logistics division had a long US dollar position.
The introduction of the euro limited the currency risk in the key touristdestinations to Group companies whose functional currency was not theeuro. In the tourism division and primarily in the Northern Europe sector,this mainly affected changes in the value of the British pound sterlingand the Swedish krona.
An interest rate risk, i.e. potential fluctuations in the value of a financialinstrument resulting from changes in market interest rates, was posedprimarily in respect of medium- and long-term fixed-interest receivables
Financial Statements Notes on the Consolidated Balance Sheet
194
Currency risk
Interest rate risk

and payables. The TUI Group partly replaced its hitherto predominantlyshort-term financing structure by long-term components by means of theconclusion of a syndicated bank facility and the issue of a convertible bond.Due to the reduction in financial debt and the issuance of the convertiblebond in October 2003, borrowing was predominantly effected at fixed-interest terms and conditions. Concerning long-term, fixed-interest financialliabilities, in particular the convertible bonds issued and the corporatebond, the fair value deviates from recognised carrying amounts.
Fair values of long-term fixed-interest financial liabilities (31 Dec 2003)Fair value Fair value
of debt of equity Total Carrying€ million Volume component component fair value amount
Convertible bond 1999/04 550.0 544.8 0.3 545.1 544.4Corporate bond 1999/06 750.0 772.5 – 772.5 748.4Convertible bond 2003/08 384.6 353.8 40.4 394.2 332.8
Market risk arises from the fact that the value of a financial instrumentmay change due to fluctuating prices on the financial markets. In accor-dance with the rules of IAS 39, noncurrent financial instruments andmarketable securities were recognised at their fair values. Marketableavailable-for-sale securities of € 10.3 million (previous year: € 20.6 million)were mostly listed shares and funds which were subject to normal pricefluctuations on the capital markets. The market risk of these investmentswas not hedged. As a matter of principle, changes in the market value ofavailable-for-sale securities were directly taken to the revaluation reservefor financial instruments. Where any substantial impairments of available-for-sale securities occurred, the cumulative net loss previously shown inequity was recognised as a non-scheduled write-down in the result forthe period. In the year under review, no non-scheduled write-down wasrealised with an effect on results (previous year: € 20.1 million).
The credit risk in non-derivative financial instruments results from the riskof non-performance of contractual payment obligations by contract partners.
Maximum credit risk exposure was mainly reported by means of the totalof the fair values of the non-derivative financial assets, irrespective ofexisting collateral, but taking into account any legally enforceable possibi-lities of offsetting financial assets and liabilities. A concentration of creditrisks may arise from exposures to single debtors or groups of debtorshaving similar characteristics. Since the TUI Group operated in manydifferent business areas and regions in a diversified manner, the structureof the Group meant that significant credit risk concentrations of receivables
Notes on the Consolidated Balance Sheet Financial Statements
195
Market risk
Credit risk

from and loans to certain debtors or groups of debtors were not to beexpected. There was as well no significant specific concentration of creditrisks related to specific individual countries. The Group covered the identi-fiable credit risk of individual receivables and the general credit risk bymeans of corresponding specific bad debt allowances as well as lump-sumbad debt allowances based on empirical values.
For derivative financial instruments entered into, the maximum credit riskwas the total of all positive fair values of these instruments, since in theevent of non-performance by the contracting partners asset losses wouldbe incurred only up to this amount. Since derivative financial instrumentswere concluded with a variety of top-class debtors, no significant concen-tration of credit risk exposure was to be expected.
The overall Group’s liquidity requirements were determined by means ofits liquidity planning and covered by credit line commitments so that theGroup’s liquidity was guaranteed at any time.
The cash flow risk results from the fact that future cash flows expectedfrom a monetary financial instrument or future transactions can showquantitative variations. The Group’s mainly floating-rate financial liabilitiesin particular entailed the risk of fluctuations in future cash flows due tochanges in effective interest rates. In order to minimise this risk, interestrate hedges were concluded to reduce the resulting cost of borrowing funds.The changes in the fair values of these financial instruments, classified ascash flow hedges in accordance with the rules of IAS 39, were takendirectly to equity. Due to the continued decline in interest rates in thecourse of the financial year under review, the fair value of the interestrate swaps totalled € -43.3 million (previous year: € -46.0 million) as at31 December 2003.
The cash flow risks resulting from future cash flows in foreign currencieswere hedged through derivative financial instruments. In this respect, theforeign currency requirements of the tourism division attributable toexpected bookings for future tourism seasons were hedged by means ofcorresponding forward exchange or option contracts.
Financial Statements Notes on the Consolidated Balance Sheet
196
Liquidity risk
Cash flow risk

The companies of the TUI Group used price hedging instruments in orderto hedge against external risks impacting their operating activities. Thesehedges were used in particular for the Group’s airlines to hedge futureaircraft fuel requirements. The price hedges were based on correspondingplans and met the conditions of cash flow hedges under IAS 39. Accumu-lated changes in fair values were taken directly to equity until the date ofoccurrence of the hedged transaction. Upon settlement of the hedgeditem, the accumulated results were carried in the income or expense itemcovering the associated hedged transaction with an effect on results.
Notional amounts of derivative financial instruments 31 Dec 2003 31 Dec 2002
Remaining term Remaining termup to more than more than
€ million 1 year 1 year Total Total 1 year
Interest rate hedging instrumentsSwaps 90.1 2,300.0 2,390.1 138.7 89.3Caps and floors 9.3 1,349.5 1,358.8 1,711.2 1,565.5Collars 0.8 1.2 2.0 12.5 7.6Forward rate agreements 328.8 – 328.8 340.9 205.2Currency hedging instrumentsForward buying 2,178.0 264.7 2,442.7 2,908.9 205.9Forward selling 421.9 21.5 443.4 372.0 32.2Cross currency forward exchange transactions 230.8 4.8 235.6 410.0 1.2Buying of options 282.7 15.8 298.5 385.7 –Collars 80.1 35.7 115.8 179.7 –Swaps and other currencyhedging instruments 227.2 71.8 299.0 392.8 129.9Commodity hedging instrumentsSwaps 228.0 24.6 252.6 343.6 56.6Options 14.0 1.1 15.1 5.1 –Collars 99.1 9.9 109.0 129.6 54.3Other – – – 8.6 –
The notional amounts corresponded to the total of all purchase or saleamounts or the contract values of the transactions. The decline in notionalamounts of forward exchange and commodity transactions followed thedevelopment of the operating business.
The interest spread of interest rate hedging instruments used rangedfrom 1.875% p.a. to 9.0% p.a. (previous year: 1.75% p.a. to 6.5% p.a.).
Notes on the Consolidated Balance Sheet Financial Statements
197
Price risk

As a matter of principle, the fair values of derivative financial instrumentscorresponded to the market values. The fair value of unlisted financialderivatives was determined by means of appropriate discounting methods,e.g. by discounting the expected future cash flows. The calculation of thefair values of option transactions was based on recognised option pricemodels. The fair values determined on the basis of the Group’s ownmethods were periodically compared with fair value confirmations ofexternal counterparties. The fair values of the financial instruments enteredinto to hedge raw material prices were checked by means of confirmationsof the external contracting partners involved in these transactions.
Positive and negative fair values of the derivative financial instruments shown as receivables or payables
31 Dec 2003 31 Dec 2002€ million Receivables Payables Receivables Payables
Fair value hedges to hedge exposure toCurrency risks 1.6 0.4 3.7 1.8Cash flow hedges to hedge exposure to Currency risks 47.2 155.2 92.0 108.7Interest rate risks 16.3 58.9 2.8 51.3Market risks 66.4 1.9 40.3 6.9Hedges 131.5 216.4 138.8 168.7Other derivative financial instruments 42.5 33.6 7.2 7.4Total 174.0 250.0 146.0 176.1
Financial instruments which represented an interest rate or currency hedgeaccording to operational criteria but did not meet the strict criteria of IAS39 for the creation of hedges were shown as other derivative financialinstruments. This item also included financial instruments entered into inthe framework of company acquisitions or divestments.
Financial Statements Notes on the Consolidated Balance Sheet
198

Notes on the consolidated cash flow statementThe cash flow statement showed the flow of cash and cash equivalentson the basis of a separate presentation of cash inflows and outflowsfrom operating, investing and financing activities. The effects of changesin the group of consolidated companies were eliminated.
The cash inflow from operating activites included interest received. In thefinancial year under review, interest totalling € 63.7 million was received(previous year: € 68.9 million). In the 2003 financial year, income tax pay-ments resulted in a cash outflow of € 121.9 million (previous year: € 119.7 million).
The cash payments for investments in property, plant and equipment andintangible assets or the cash receipts from corresponding sales did notmatch the additions or disposals shown under the development of fixedassets, which included the goodwill acquired from capital consolidation aswell as non-cash investments and disposals. The cash outflow from invest-ing activities included cash payments – offset against cash and cash equi-valents from additions to consolidation – for the acquisition of shares insubsidiaries, most of which were included in the consolidated balancesheet as goodwill and as assets and liabilities.
Total acquisitions of shares in subsidiaries and investments in the 2003financial year resulted in cash payments of around € 38 million (previousyear: around € 527 million). The cash inflow from the purchase transactionstotalled approx. € 1 million. At the same time, cash payments of approx.€ 170 million were made for purchased aircraft, leased out in the frame-work of a finance lease, and to a lesser extent for loans issued. In thesame period, cash payments of around € 1,531 million (previous year:around € 909 million) were received by the Group from the divestmentof the Preussag Energie Group, the indirect shareholding in Ruhrgas AGand other divestments. The total of cash and cash equivalents sold in theframework of the sales transactions amounted to around € 98 million inthe 2003 financial year.
Non-cash investments were primarily effected in the logistics and tourismdivisions by means of finance leases. Lease agreements resulted in totalinvestments of € 12.0 million (previous year: € 14.4 million).
199
Notes on the Consolidated Cash Flow Statement
(31) Cash inflow/outflow
from operating activities
(32) Cash inflow/outflow
from investing activities

200
Apart from the cash outflow from the redemption of existing financial lia-bilities, the cash flow from financing activities also included the interestpaid in the financial year under review. The cash inflow from operatingactivities and the cash inflow from the divestment programme was pri-marily used to repay financial debt, reducing it by around € 1.7 billion.
Cash and cash equivalents comprised all liquid funds, i.e. cash in hand,bank balances and cheques. The impact of changes in cash and cashequivalents due to exchange rate flucutations was shown separately. Alsooutlined separately were the changes in cash and cash equivalents attri-butable to changes in consolidation which did not result from the acquisi-tion or divestment of companies. As at 31 December 2003, total cash andcash equivalents were not subject to any restraints on disposal.
Events after the balance sheet date On 21 January 2003, the Supervisory Board of TUI AG approved a conceptfor the realignment of the logistics division. This concept will probablycomplete the realignment of the Group as a purely services group focusingon the tourism and shipping sectors in the 2004 financial year. The measures planned in this context include the divestment of the VTG-Lehnkering Group, the Algeco Group and Pracht Spedition + Logistik GmbH.This intention has been publicly announced. The closing of the divestmentof Pracht Spedition + Logistik GmbH, effected in October 2003, is expectedfor early 2004.
In February 2004, the decision was taken to sell the 51% share in theAnfi Group, a time-share provider.
Related partiesApart from the subsidiaries included in the consolidated financial state-ments, TUI AG, in carrying out its ordinary business activities, maintainedindirect or direct relationships with related parties. Related parties con-trolled by the TUI Group or over which the TUI Group was able to exercisea significant influence are listed in the list of shareholdings, with informa-tion on the interest held, equity and annual earnings by sector. The list ofshareholdings was deposited in the commercial registers of the districtcourts of Berlin-Charlottenburg and Hanover.
Apart from pure equity participations, related parties also included Groupparticipations that supplied goods or provided services for TUI Groupcompanies as part of their business purpose.
(33) Cash inflow/outflow
from financing activities
(34) Development of cash
and cash equivalents
Other Notes

Other Notes Financial Statements
201
Transactions with related parties€ million 2003 2002
Services provided by the GroupManagement and consultancy services 21.4 18.2Sales of tourism services 19.0 27.0Distribution services 6.6 6.7Other services 4.9 9.3Total 51.9 61.2Services received by the GroupIn the framework of lease, rental and leasing agreements 42.6 44.9Purchase of hotel commitments 112.5 109.8Incoming services 43.4 50.4Distribution services 18.7 16.5Other services 4.5 6.2Total 221.7 227.8
Transactions with associated companies in which shareholdings were heldand joint ventures were primarily effected in the tourism segment. Trans-actions with related parties comprised in particular the tourism servicesof the incoming agencies and the hotel companies. Group-owned touroperators made use of local support services provided by related incomingagencies for customers travelling with these tour operators. In the hotelcompanies sector, subsidiaries provided management and consultancyservices for related parties, rented hotel buildings and complexes andacquired hotel commitments from these companies in the framework oftheir own ordinary business activities. In addition, tour operators repre-senting related parties made use of services provided by the TUI Groupalong the entire tourism value chain, such as distribution, transportation,accommodation and catering services.
The logistics division in particular held participations in companies leasingout property, plant and equipment to consolidated subsidiaries. As thecompanies of the TUI Group held all the risks and rewards incident toownership of these leased tangible assets, the leased tangible assets andthe corresponding liabilities from these finance leases were recognised inthe consolidated balance sheet, in accordance with IASB rules.
All transactions with related parties were executed on an arm’s lengthbasis, based on international comparable uncontrolled price methods inaccordance with IAS 24.

Financial Statements Other Notes
202
Financial liabilities to related parties included liabilities from finance leasestotalling € 116.7 million (previous year: 142.9 million). Receivables andpayables concerning related parties as at the balance sheet date arepresented under notes 20, 21 and 30.
The income and expenses resulting from equity participations and finan-cing were carried under the overall financial result for all companies includedand presented under segment reporting for the individual divisions, to-gether with a separate presentation of the earnings of associated companiesby divisions.
Given its indirect equity participation, WestLB AG Düsseldorf/Münstermet the formal requirements for a related party of TUI AG in accordancewith IAS 24. In holding its participation, WestLB AG did not pursue anyentrepreneurial objectives and therefore did not have any part in thefinancial or operating policy decisions of TUI AG. Relations with WestLB AGconsisted entirely of transactions customarily carried out with commercialbanks. In the 2003 financial year, WestLB AG operated as lead manager,in conjunction with other commercial banks, for the Group in raising creditlines and issuing the convertible bond. At 31 December 2003, the Group’sfinancial liabilities to WestLB totalled € 161.9 million.
Corporate Governance
Remuneration of the Executive BoardThe remuneration of the members of the Executive Board comprised bothfixed and variable components. The variable compensation componentconsisted of a performance-related compensation linked to a considerableextent to the dividend and a personal assessment factor, and a long-termincentive programme. In the framework of the long-term incentive pro-gramme, the Executive Board members received a performance-relatedbonus which was translated into ‘phantom stocks’ of TUI AG on the basisof an average share price. The calculation was based on earnings by sectors.The translation into phantom stocks was based on the average stock marketprice of the 20 trading days following the Supervisory Board meetingadopting the annual financial statements. The number of phantom stocksgranted for a financial year is thus not determined until the subsequentyear. After a lock-up period of two years, the entitlement to cash paymentfrom this bonus can be exercised individually by the Executive Boardmembers within pre-defined exercise windows. The level of the cash pay-ment depends on the average share price of TUI AG over a period of 20trading days following the exercise date. There are no further restrictionssuch as absolute or relative return or price targets.
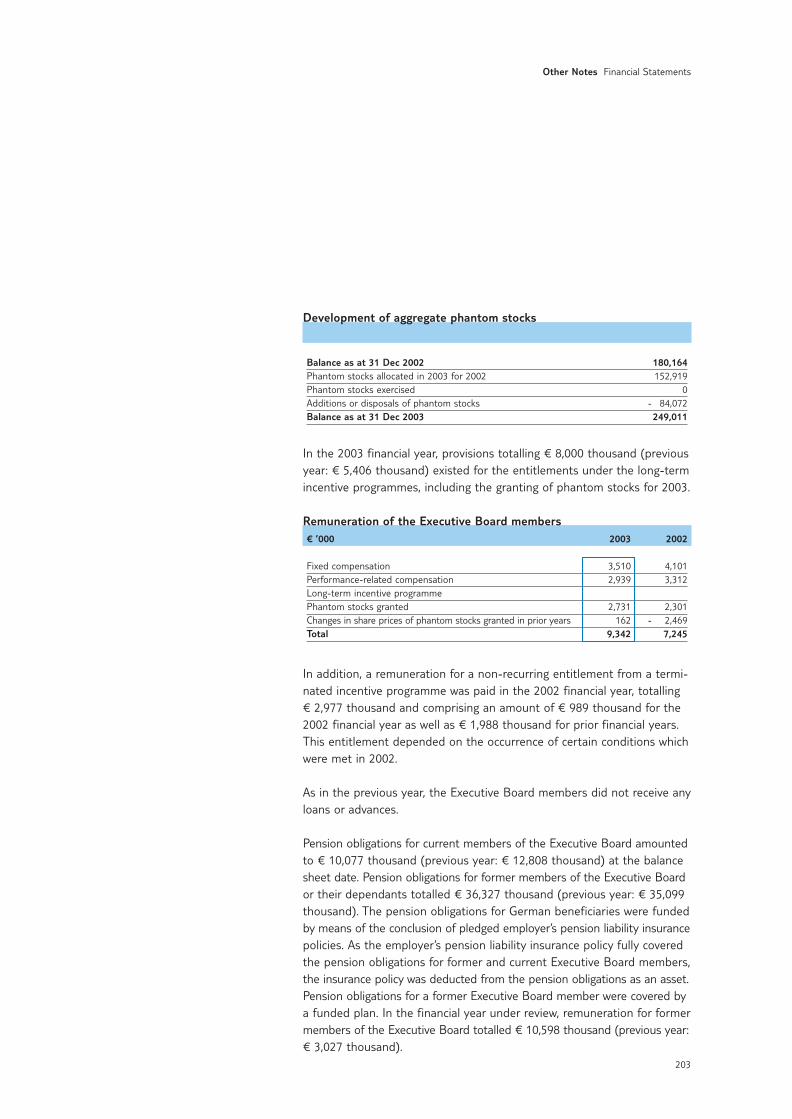
203
Other Notes Financial Statements
Development of aggregate phantom stocks
Balance as at 31 Dec 2002 180,164Phantom stocks allocated in 2003 for 2002 152,919Phantom stocks exercised 0Additions or disposals of phantom stocks - 84,072Balance as at 31 Dec 2003 249,011
In the 2003 financial year, provisions totalling € 8,000 thousand (previousyear: € 5,406 thousand) existed for the entitlements under the long-termincentive programmes, including the granting of phantom stocks for 2003.
Remuneration of the Executive Board members€ ’000 2003 2002
Fixed compensation 3,510 4,101Performance-related compensation 2,939 3,312Long-term incentive programmePhantom stocks granted 2,731 2,301Changes in share prices of phantom stocks granted in prior years 162 - 2,469Total 9,342 7,245
In addition, a remuneration for a non-recurring entitlement from a termi-nated incentive programme was paid in the 2002 financial year, totalling€ 2,977 thousand and comprising an amount of € 989 thousand for the2002 financial year as well as € 1,988 thousand for prior financial years.This entitlement depended on the occurrence of certain conditions whichwere met in 2002.
As in the previous year, the Executive Board members did not receive anyloans or advances.
Pension obligations for current members of the Executive Board amountedto € 10,077 thousand (previous year: € 12,808 thousand) at the balancesheet date. Pension obligations for former members of the Executive Boardor their dependants totalled € 36,327 thousand (previous year: € 35,099thousand). The pension obligations for German beneficiaries were fundedby means of the conclusion of pledged employer’s pension liability insurancepolicies. As the employer’s pension liability insurance policy fully coveredthe pension obligations for former and current Executive Board members,the insurance policy was deducted from the pension obligations as an asset.Pension obligations for a former Executive Board member were covered bya funded plan. In the financial year under review, remuneration for formermembers of the Executive Board totalled € 10,598 thousand (previous year:€ 3,027 thousand).

204
Financial Statements Other Notes
Remuneration of the Supervisory BoardTotal remuneration of the members of the Supervisory Board amountedto € 1,432 thousand (previous year: € 1,319 thousand). The remunerationcomprised a fixed component totalling € 124 thousand (previous year: € 107 thousand) and a variable component linked to the dividend andtotalling € 1,308 thousand (previous year: € 1,212 thousand).
In the 2003 financial year, the members of the Supervisory Board did notperform any personal serivces such as consultancy or agency services forthe Group.
Directors’ dealingsAt the end of the 2003 financial year, the number of shares in TUI AGheld by the Executive Board and Supervisory Board members did notexceed the limit of 1% of the shares issued by the Company, stipulated insection 6.6 of the German Corporate Governance Code as the limit abovewhich these holdings have to be reported separately. Overall, the ExecutiveBoard members held 784 TUI shares and the Supervisory Board members2,948 TUI shares. For the period from the effective date of the correspon-ding provisions to the balance sheet date, the Company was not notifiedof any purchases or sales of shares by the members of the boards.
Hanover, 17 March 2004
The Executive Board
Ebel Engelen Feuerhake
Frenzel

205
Major Shareholdings Financial Statements
Annex to the notes
Major subsidiaries, associated companies and joint venturesNominal Result for Shareholding (%)
share capital the year1)
in ‘000 in ‘000 total indirect
TourismTUI Deutschland GmbH, Hanover € 15,000 * 100.0 –1-2-FLY GmbH, Hanover € 8,000 * 100.0 –TUI Leisure Travel GmbH, Hanover € 14,501 * 100.0 –Hapag-Lloyd Fluggesellschaft mbH, Langenhagen € 45,000 * 100.0 –GULET TOUROPA Touristik GmbH & Co. KG, Vienna € 75 2,401 75.0 75.0TUI (Suisse) AG, Zürich CHF 4,854 - 5,292 51.0 51.0TUI Nederland N.V., Rijswijk2) € 10,000 - 11,375 100.0 –JetAir N.V., Oostende2) € 750 19,196 100.0 72.0Groupe Nouvelles Frontières S.A.S., Paris € 3,274 2,043 100.0 –Touraventure S.A., Paris € 10,469 - 27,419 100.0 91.7TUI Northern Europe Ltd., London3) GBP 250,459 - 11,200 100.0 –VEXTEL World S.L., Barcelona € 1,003 - 27 100.0 –Robinson Club GmbH, Hanover € 5,138 * 100.0 –„MAGIC LIFE der Club“ International Hotelbetriebs GmbH, Vienna € 146 - 10,359 51.0 –RIUSA II S.A., Palma de Mallorca2) 5) € 1,202 25,968 50.0 –Atlantica Hellas S.A., Athen3) 4) € 11,026 - 614 50.0 –„MAGIC LIFE“ Assets AG, Vienna3) 4) € 198 - 1,657 50.0 –GRUPOTEL DOS S.A., Cán Picafort3) 4) € 84,546 818 50.0 –RIU Hotels S.A., Palma de Mallorca4) 6) € 841 27,097 49.0 –Hotel Sumba S.A., Palma de Mallorca3) € 1,172 380 40.0 –TUI Business Travel Deutschland GmbH, Bremen € 11,000 * 100.0 –TUI InfoTec GmbH & Co. KG, Hanover € 10,226 4,119 100.0 –LogisticsHapag-Lloyd AG, Bremen and Hamburg € 72,800 349,411 100.0 –Hapag-Lloyd Container Linie GmbH, Hamburg € 25,600 * 100.0 100.0VTG-Lehnkering AG, Duisburg and Hamburg € 54,340 * 100.0 100.0ALGECO S.A., Paris/Mâcon € 7,300 35,379 67.0 67.0TradingFeralloy Corp., Chicago2) USD 2,000 - 3,625 100.0 100.0Delta Steel, Inc., Houston USD 2,000 1,877 100.0 100.0Other CompaniesSalzgitter Grundstücks- und Beteiligungsgesellschaft mbH, Salzgitter € 71,427 * 100.0 –Preussag Immobilien GmbH, Salzgitter € 25,000 * 100.0 100.0Wolf GmbH, Mainburg € 20,000 * 80.0 –
*) Profit transfer agreement1) according to local laws2) according to financial statement of the group3) according to financial statements as per 31 Dec 20024) Joint venture5) Control despite shareholding of 50% or less6) according to financial statements of the group as per 31 Dec 2002

206
Auditors’ Statement
‘We have audited the consolidated financial statements prepared by TUIAktiengesellschaft, Berlin and Hanover, comprised of balance sheet, profitand loss statement, statement of changes in shareholders’ equity, cashflow statement and notes, for the financial year from 1 January 2003 to31 December 2003. The Executive Board is responsible for the preparationand the contents of the consolidated financial statements in accordancewith the International Accounting Standards (IAS). It is our responsibilityto assess, on the basis of our audit, whether the consolidated financialstatements conform with IAS.
We conducted our audit of the consolidated financial statements inaccordance with German auditing rules and the generally accepted audit-ing standards promulgated by the German Auditors‘ Institute (IDW) andin supplementary compliance with the International Standards on Audit-ing (ISA). Those standards require that we plan and perform the auditsuch that it can be assessed with reasonable assurance whether the con-solidated financial statements are free from material misstatements. Indetermining the audit procedures, knowledge of the business activitiesand the economic and legal position of the Group as well as expectationswith regard to possible misstatements was taken into account. Within theframework of the audit, the evidence supporting the amounts and dis-closures in the consolidated financial statements were assessed on a testbasis. The audit included an assessment of the accounting principles applied and the significant estimates and judgements made by the legalrepresentatives, as well as an evaluation of the overall adequacy of thepresentation of information in the consolidated financial statements. Webelieve that our audit gives us reasonable grounds for our opinion.
In our opinion, the consolidated financial statements, in conformity withthe IAS, present a true and fair view of the financial position and resultsof operation of the Group and of the cash flows in the financial year.
Our audit, which was conducted in accordance with German auditingrules and also extends to the combined management report of the Groupand of TUI AG prepared by the Executive Board for the financial yearfrom 1 January 2003 to 31 December 2003, has not led to any reserva-tions. In our opinion, the Group management report provides a suitableunderstanding of the Group’s position and suitably presents the risks offuture development.

Auditors’ Statement Financial Statements
207
We also confirm that the consolidated financial statements and theGroup management report for the financial year from 1 January 2003 to31 December 2003 meet the conditions required for the Company’sexemption from its duty to prepare consolidated financial statements andthe Group management report in accordance with German law.’
Hanover, 17 March 2004
PwC Deutsche RevisionAktiengesellschaft
Wirtschaftsprüfungsgesellschaft
Nienborg RolfesWirtschaftsprüfer Wirtschaftsprüfer

208
Contact
Head office
TUI AGKarl-Wiechert-Allee 4D-30625 Hanover
P. O. Box 61 02 0930602 HanoverGermany
E-Mail [email protected] +49.511.566-00Fax +49.511.566-1901
Investor RelationsE-Mail [email protected] +49.511.566-1425 or -1442Fax +49.511.566-1096
Group CommunicationsE-Mail [email protected] +49.511.566-1408Fax +49.511.566-1166
The German version of this report is legally binding. The Companycannot be held responsible for any misunderstandings or misinterpreta-tion arising from this translation. Both versions are available on the web:www.tui.com

Major TUI Brands
Travel agencies
Tour operators
Airlines
Incoming agencies
Hotel companies
RZ Umschlag GB engl 30.3.2004 9:22 Uhr Seite 2

RZ Umschlag GB engl 30.3.2004 9:23 Uhr Seite 2

TUI AGKarl-Wiechert-Allee 4D-30625 HanoverGermany
Imprint
TUI AGKarl-Wiechert-Allee 4D-30625 HanoverGermany
Phone +49.511.566-00Fax +49.511.566-1901Internet http://www.tui.com
Concept, design and production:Interbrand Zintzmeyer & Lux, CologneIrlenkäuser Communication GmbH, DüsseldorfPhotography: Getty Images (cover, pg. 10/11, 72/73,
74/75, 110/111, 112/113, 114/115)Photonica (pg. 12/13, 70/71)Plainpicture (pg. 14/15)Armin Brosch (pg. 4)
Lithography: O/R/T/ Medienverbund GmbH, KrefeldPrinting: Heining & Müller GmbH, Mülheim/Ruhr
RZ Umschlag GB engl 30.3.2004 9:19 Uhr Seite 1

Ann
ual R
epor
t 20
03T
UI
AG
TUI AGKarl-Wiechert-Allee 4D-30625 HanoverGermany
Annual RAdding v
Open to change.
RZ Umschlag GB engl 30.3.2004 9:20 Uhr Seite 1


![OneCNC Solid Design AA Mill Express Mill …OneCNC Solid Design AA Mill Express Mill Advantage Design 280,000B (ü%l]) 280,000B 480,000B 28 Milling & Multi Axis Mill 800,000B Mill](https://img.dokumen.tips/doc/110x75/5f867f1cac5a475cf73aa2f7/onecnc-solid-design-aa-mill-express-mill-onecnc-solid-design-aa-mill-express-mill.jpg)