Embed Size (px)
Citation preview
Federal Employee Viewpoint Survey ResultsEmployees Influencing Change
Governmentwide Management Report
United States Office of Personnel Management OPM.GOV/FEVS #FEVS
A Message from the Director
In 2015, more than 400,000 employees participated in the Federal Employee Viewpoint Survey (FEVS). I am grateful for your willingness to devote your time to an undertaking so important to our goals of supporting excellence in government. Employee feedback on key performance metrics captured in the FEVS is singularly important to realizing OPM’s mission to maintain and enhance our talented, engaged, and diverse Federal workforce. The feedback you provide enables each agency to develop effective strategies and tools for driving continuous improvement.
Agency leadership has actively responded to feedback from prior years and these enhanced efforts are clearly reflected in FEVS results. Compared with 2014, more employees in 2015 perceive their agency conditions as conducive to engagement, describe their workplaces as inclusive, and report satisfaction with their jobs. On a government-wide basis, the Employee Engagement Index increased by 1 percentage point; however, that seemingly modest increase is supported by broad-based improvements — 27 of the 37 large, independent agencies increased by 1 percent or more and 10 agencies increased by 3 percent or more.
Agency leaders and managers have responded to the President’s Management Agenda on People and Culture by taking active steps to improve how employees engage with their jobs, organizations, and missions. Some examples I have seen as co-chair of the People and Culture plank include: better internal communication from leaders to employees, greater input from employees in how their agencies operate, increased training opportunities, and more explicit recognition for a job well done.
Results continue to indicate a highly motivated workforce — over 90 percent of survey participants are willing to commit extra effort when necessary and consistently seek out ways to improve. Overall, scores on almost three-quarters of the survey items showed an increase government-wide from 2014 (53 of the 71 core items), and no items decreased.
Results also point to important topics to consider for improvement in the upcoming year. A number of occupations have been identified as critical to the achievement of agency missions, including IT specialists. When compared with other mission-critical occupations, items related to employee recruitment, development and retention are rated lower among IT specialists, suggesting an important focus for future strategic initiatives.
While there is work to do, together we are making a difference. The gains realized this year will continue to grow so long as all of us — leaders, managers, supervisors, and employees — focus on improving the way we work together at every level to improve performance. The FEVS continues to be essential to assessing our progress and pointing the way forward.
I personally want to thank you for your feedback, as well as your service and commitment to the American people and to your country. I am honored to work in the company of such talented, motivated, and hardworking people.
Beth CobertActing DirectorU.S. Office of Personnel Management

Table of Contents
About This Report ..................................................................................................................................................................................2
Participant Overview ..............................................................................................................................................................................3
Results at a Glance ................................................................................................................................................................................4
Federal Employee Viewpoint Survey Indices ...........................................................................................................................................5
Engagement Index ............................................................................................................................................................................6
Global Satisfaction Index ..................................................................................................................................................................9
The New IQ Index........................................................................................................................................................................... 12
Engagement by Key Employee Characteristics .................................................................................................................................... 15
A Look at Occupations in the Federal Government ............................................................................................................................. 17
Conclusion .......................................................................................................................................................................................... 24
Appendix A: 2015 FEVS Methods ....................................................................................................................................................... 25
Appendix B: Trend Analysis ................................................................................................................................................................ 28
Appendix C: Response Rates .............................................................................................................................................................. 32
Appendix D: Governmentwide Respondent Characteristics ............................................................................................................... 36
Appendix E: Governmentwide Demographic Response Rates ............................................................................................................ 40
Appendix F: Engagement Index Trends............................................................................................................................................... 43
F1: Engagement Index Trends ........................................................................................................................................................ 43
F2: Leaders Lead ............................................................................................................................................................................ 47
F3: Supervisors ............................................................................................................................................................................... 51
F4: Intrinsic Work Experience ......................................................................................................................................................... 55
Appendix G: Global Satisfaction Index Trends .................................................................................................................................... 59
Appendix H: New IQ Index Trends ...................................................................................................................................................... 63
H1: New IQ Index Trends ................................................................................................................................................................ 63
H2: Fair ........................................................................................................................................................................................... 67
H3: Open ........................................................................................................................................................................................ 71
H4: Cooperative ............................................................................................................................................................................. 75
H5: Supportive ............................................................................................................................................................................... 79
H6: Empowered .............................................................................................................................................................................. 83
2
About This Report
The Federal Employee Viewpoint Survey (FEVS) provides government employees with the opportunity to candidly share their perceptions of their work experiences, their agencies, and their leaders. For 2015, 421,748 employees responded to the survey. These individuals constitute full- and part-time and headquarters and field employees; veterans and non-veterans; individuals living with disabilities; individuals with varying educational backgrounds; and members of LGBT communities and multiple racial and ethnic groups—all who work in a vast array of occupations that make up our Federal workforce. Survey participants represent 82 agencies—37 Departments/Large Agencies and 45 Small/Independent Agencies.
The 2015 survey instrument remained unchanged from the 2014 survey. The data collected from 2015 survey respondents were weighted to ensure survey estimates accurately represent the survey population.1 The final data set reflects the agency composition and demographic makeup of the Federal workforce within plus or minus 1 percentage point. Demographic results are not weighted.
This report presents an overview of the governmentwide results, highlighting notable agency findings. Particular attention has been devoted to the Engagement, Global Satisfaction, and New IQ indices, highlighting top performing and most improved agencies since 2014. The report also examines scores on the Engagement Index across five demographic categories: agency tenure, generation, disability status, supervisory status, and telework status. The section called “A Look at Occupations in the Federal Government” explores the experiences of employees working in mission-critical occupations (MCOs), and Science, Technology, Engineering and Mathematics (STEM) occupations.
Detailed information on the 2015 FEVS Methods and item-by-item results may be found in the appendices. This and other reports are available on OPM’s Federal Employee Viewpoint Survey website at: www.opm.gov/FEVS.
Resources
The figure below provides links and additional information about available resources. Some resources are publicly available and others are restricted access.
FEVS website Agencies and the general public can access governmentwide data reports, as well as special topic reports produced from the FEVS. This website includes results from the 2004 administration of the survey to the present. Access the FEVS website at www.opm.gov/FEVS.
Public Release Data File (PRDF) Three types of public use data sets are available for the FEVS: (1) a full data extract excluding the LGBT variable, (2) a separate data extract containing the LGBT variable, and (3) a data extract for trend analysis combining the public use files from 2004 up to the current year. To request a public use data file, complete the form available at: http://www.fedview.opm.gov/2014/EVSDATA/. NOTE: The 2015 PRDF will be available in the winter.
FedScope OPM’s FedScope is an online publicly available tool which allows users to access and analyze HR data from OPM’s Enterprise Human Resources Integration-Statistical Data Mart (EHRI-SDM). Access this site using the following link: http://www.fedscope.opm.gov/.
Unlock Talent A tool for both the general public and agencies to view comprehensive data visualizations with broad displays of FEVS data. These displays allow agencies to identify subcomponents for action to improve engagement, as well as resources agencies can apply to their action planning. This site can be accessed at https://www.unlocktalent.gov/. Questions and feedback for the dashboard can be sent to [email protected].
FEVS Online Data Analysis Tool A password protected tool for agency points of contact to access agency specific and governmentwide reports. In addition, agency users can develop customized reports that may be useful for data analysis and action planning. Questions and feedback for this online tool can be sent to [email protected].
1 Because unweighted data may produce biased estimates of population statistics, as done in previous years, data collected from this year’s survey respondents were weighted to generate survey estimates that accurately represent the survey population. The weights developed for the 2015 FEVS take into account the variable probabilities of selection across the sample domains, nonresponse, and known demographic characteristics of the survey population.
About This Report
3
Participant Overview
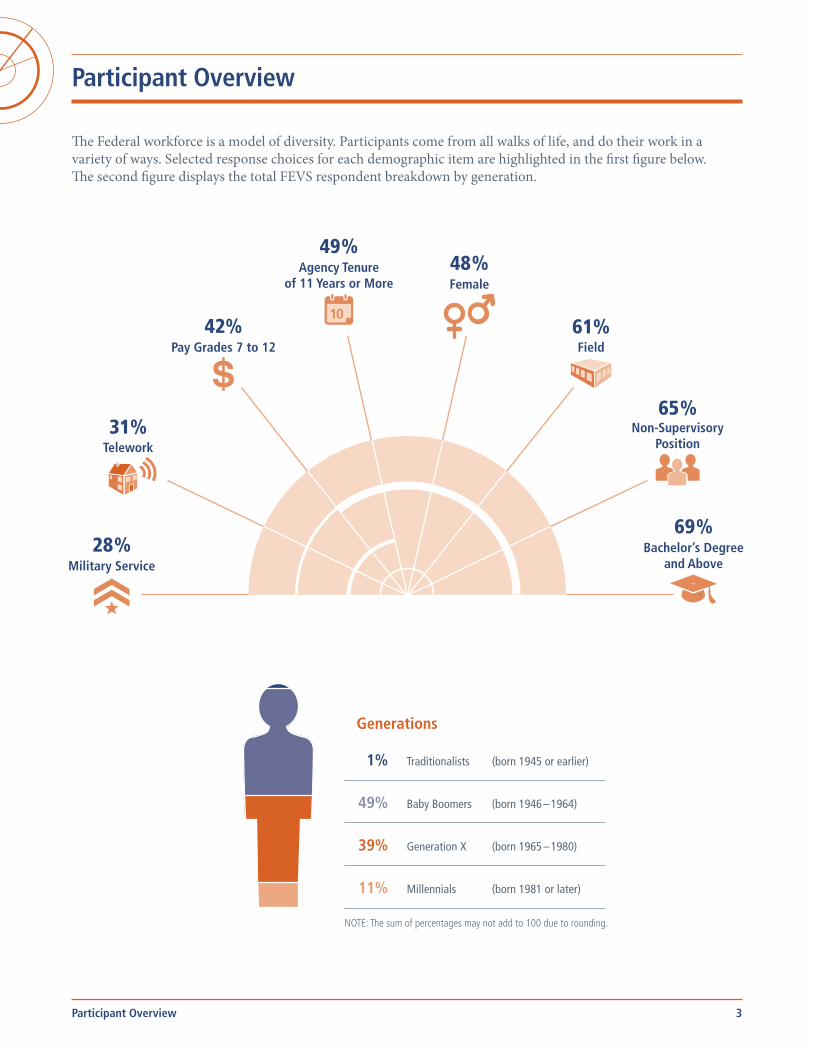
The Federal workforce is a model of diversity. Participants come from all walks of life, and do their work in a variety of ways. Selected response choices for each demographic item are highlighted in the first figure below. The second figure displays the total FEVS respondent breakdown by generation.
Military Service28 %
Telework31%
Pay Grades 7 to 12 42%
Agency Tenure of 11 Years or More
49 %
10
Female48 %
Field61%
Non-Supervisory Position
65 %
Bachelor’s Degree and Above
69 %
Generations
1% Traditionalists (born 1945 or earlier)
49% Baby Boomers (born 1946 – 1964)
39% Generation X (born 1965 – 1980)
11% Millennials (born 1981 or later)
NOTE: The sum of percentages may not add to 100 due to rounding.
Participant Overview
4
Results at a Glance
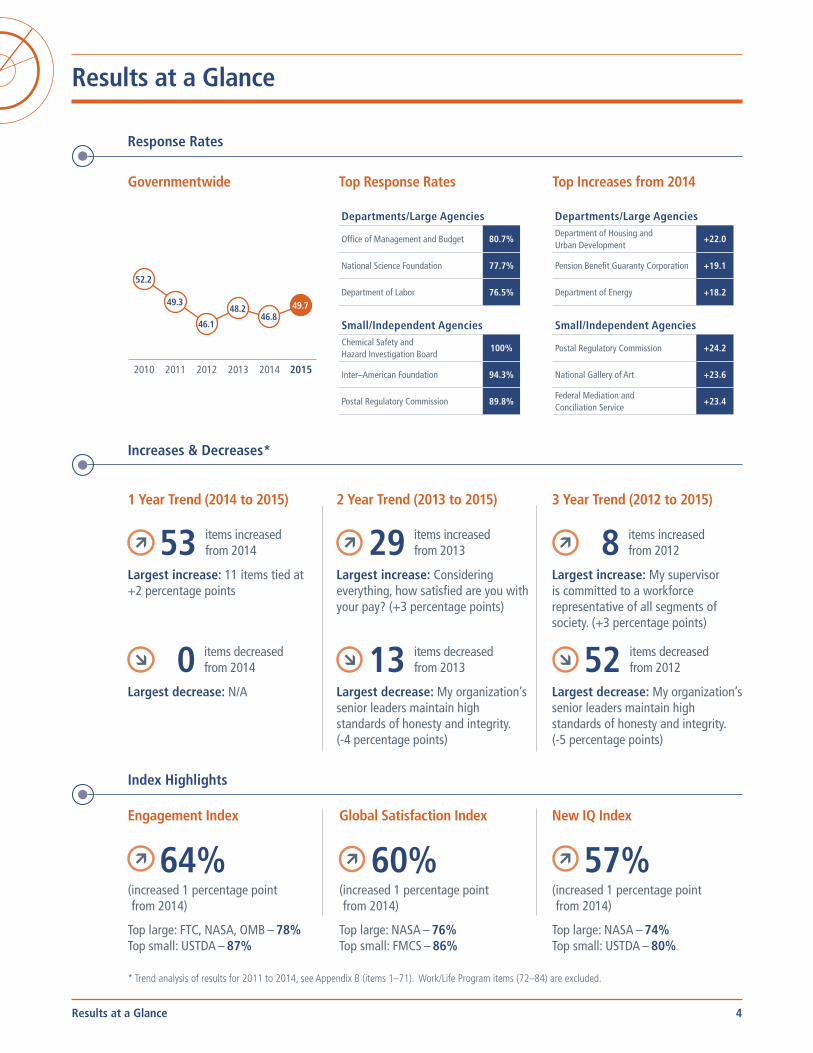
Response Rates
Governmentwide
52.2 in 2010
49.3 in 2011
46.1 in 2012
48.2 in 2013
46.8 in 2014
49.7 in 2015
52.2
49.3
46.1
48.246.8
49.7
2010 2011 2012 2013 2014 2015
Top Response Rates
Departments/Large Agencies
Office of Management and Budget 80.7%
National Science Foundation 77.7%
Department of Labor 76.5%
Small/Independent AgenciesChemical Safety and Hazard Investigation Board
100%
Inter–American Foundation 94.3%
Postal Regulatory Commission 89.8%
Top Increases from 2014
Departments/Large AgenciesDepartment of Housing and Urban Development
+22.0
Pension Benefit Guaranty Corporation +19.1
Department of Energy +18.2
Small/Independent Agencies
Postal Regulatory Commission +24.2
National Gallery of Art +23.6
Federal Mediation and Conciliation Service
+23.4
Results at a Glance
Increases & Decreases*
1 Year Trend (2014 to 2015)
53 items increased from 2014
Largest increase: 11 items tied at +2 percentage points
0 items decreased from 2014
Largest decrease: N/A
2 Year Trend (2013 to 2015)
29 items increased from 2013
Largest increase: Considering everything, how satisfied are you with your pay? (+3 percentage points)
13 items decreased from 2013
Largest decrease: My organization’s senior leaders maintain high standards of honesty and integrity. (-4 percentage points)
3 Year Trend (2012 to 2015)
8 items increased from 2012
Largest increase: My supervisor is committed to a workforce representative of all segments of society. (+3 percentage points)
52 items decreased from 2012
Largest decrease: My organization’s senior leaders maintain high standards of honesty and integrity. (-5 percentage points)
Index Highlights
Engagement Index
64%( increased 1 percentage point from 2014)
Top large: FTC, NASA, OMB – 78% Top small: USTDA – 87%
Global Satisfaction Index
60%( increased 1 percentage point from 2014)
Top large: NASA – 76% Top small: FMCS – 86%
New IQ Index
57%( increased 1 percentage point from 2014)
Top large: NASA – 74% Top small: USTDA – 80%
* Trend analysis of results for 2011 to 2014, see Appendix B (items 1–71). Work/Life Program items (72–84) are excluded.
5
Federal Employee Viewpoint Survey Indices
An index combines several items that refer to different facets of a broader area of consideration, providing a more consistent and robust metric for measuring progress toward objectives. The Federal Employee Viewpoint Survey encompasses three important index measures. These are:
• Engagement Index
• Global Satisfaction Index
• New Inclusion Quotient (New IQ)
Using IndicesReviewing both individual item results and index data provides a more complete perspective on an agency’s results. Agencies can use an index to measure and track progress toward improving a specific area, and to pinpoint areas where change is needed. Improvement takes time and is an ongoing process.
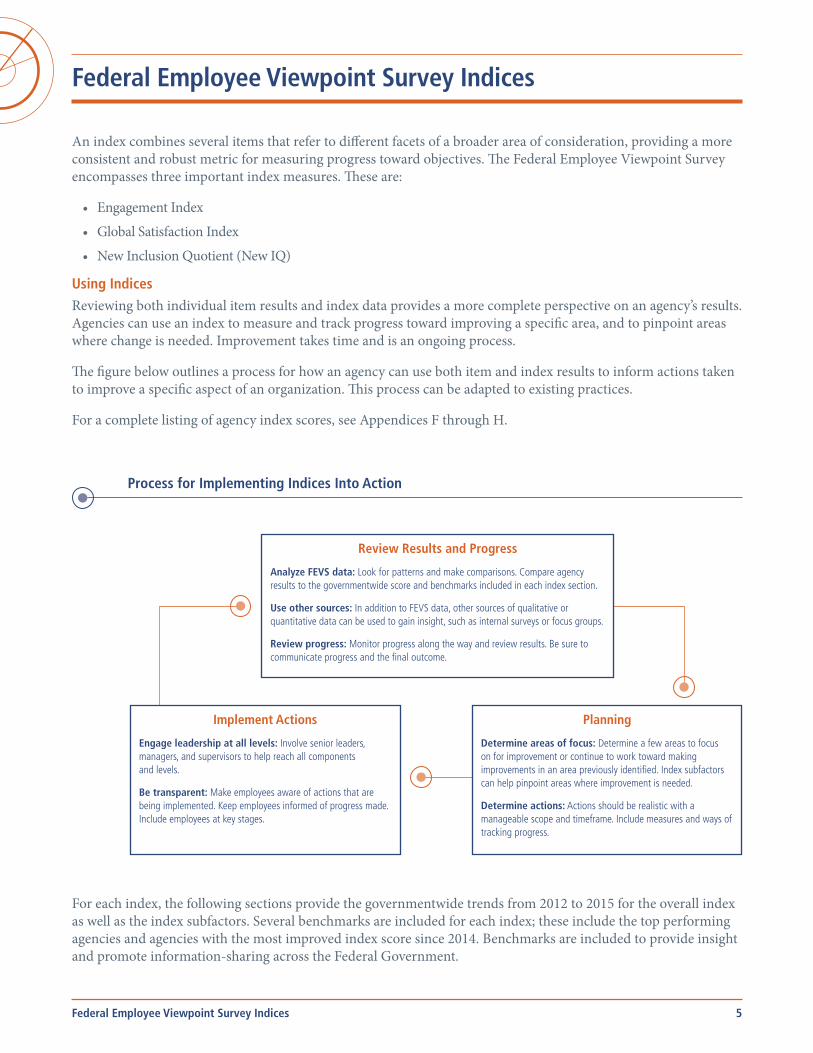
The figure below outlines a process for how an agency can use both item and index results to inform actions taken to improve a specific aspect of an organization. This process can be adapted to existing practices.
For a complete listing of agency index scores, see Appendices F through H.
Process for Implementing Indices Into Action
Review Results and Progress
Analyze FEVS data: Look for patterns and make comparisons. Compare agency results to the governmentwide score and benchmarks included in each index section.
Use other sources: In addition to FEVS data, other sources of qualitative or quantitative data can be used to gain insight, such as internal surveys or focus groups.
Review progress: Monitor progress along the way and review results. Be sure to communicate progress and the final outcome.
Planning
Determine areas of focus: Determine a few areas to focus on for improvement or continue to work toward making improvements in an area previously identified. Index subfactors can help pinpoint areas where improvement is needed.
Determine actions: Actions should be realistic with a manageable scope and timeframe. Include measures and ways of tracking progress.
Implement Actions
Engage leadership at all levels: Involve senior leaders, managers, and supervisors to help reach all components and levels.
Be transparent: Make employees aware of actions that are being implemented. Keep employees informed of progress made. Include employees at key stages.
For each index, the following sections provide the governmentwide trends from 2012 to 2015 for the overall index as well as the index subfactors. Several benchmarks are included for each index; these include the top performing agencies and agencies with the most improved index score since 2014. Benchmarks are included to provide insight and promote information-sharing across the Federal Government.
Federal Employee Viewpoint Survey Indices
6
Engagement Index
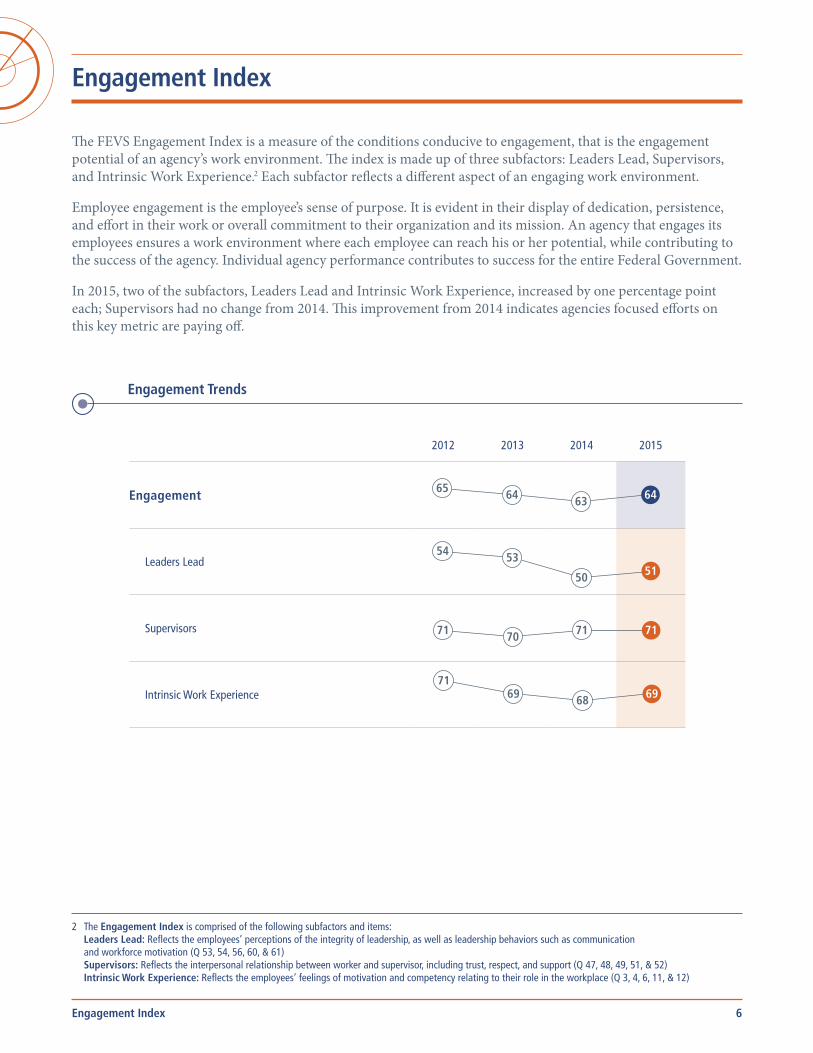
The FEVS Engagement Index is a measure of the conditions conducive to engagement, that is the engagement potential of an agency’s work environment. The index is made up of three subfactors: Leaders Lead, Supervisors, and Intrinsic Work Experience.2 Each subfactor reflects a different aspect of an engaging work environment.
Employee engagement is the employee’s sense of purpose. It is evident in their display of dedication, persistence, and effort in their work or overall commitment to their organization and its mission. An agency that engages its employees ensures a work environment where each employee can reach his or her potential, while contributing to the success of the agency. Individual agency performance contributes to success for the entire Federal Government.
In 2015, two of the subfactors, Leaders Lead and Intrinsic Work Experience, increased by one percentage point each; Supervisors had no change from 2014. This improvement from 2014 indicates agencies focused efforts on this key metric are paying off.
Engagement Trends
2012 2013 2014 2015
Engagement
65. 64. Decreased from 2012. 63. Decreased from 2013. 64. Increased from 2014.
Leaders Lead
54. 53. Decreased from 2012. 50. Decreased from 2013. 51. Increased from 2014.
Supervisors
71. 70. Decreased from 2012. 71. Increased from 2013. 71. Stayed the same from 2014.
Intrinsic Work Experience
71. 69. Decreased from 2012. 68. Decreased from 2013. 69. Increased from 2014.
2 The Engagement Index is comprised of the following subfactors and items: Leaders Lead: Reflects the employees’ perceptions of the integrity of leadership, as well as leadership behaviors such as communication and workforce motivation (Q 53, 54, 56, 60, & 61) Supervisors: Reflects the interpersonal relationship between worker and supervisor, including trust, respect, and support (Q 47, 48, 49, 51, & 52) Intrinsic Work Experience: Reflects the employees’ feelings of motivation and competency relating to their role in the workplace (Q 3, 4, 6, 11, & 12)
65 63 64 64
71
68 69 69
71 71 70 71
54
50
53 51
Engagement Index
7Engagement Index
Engagement Index (continued)
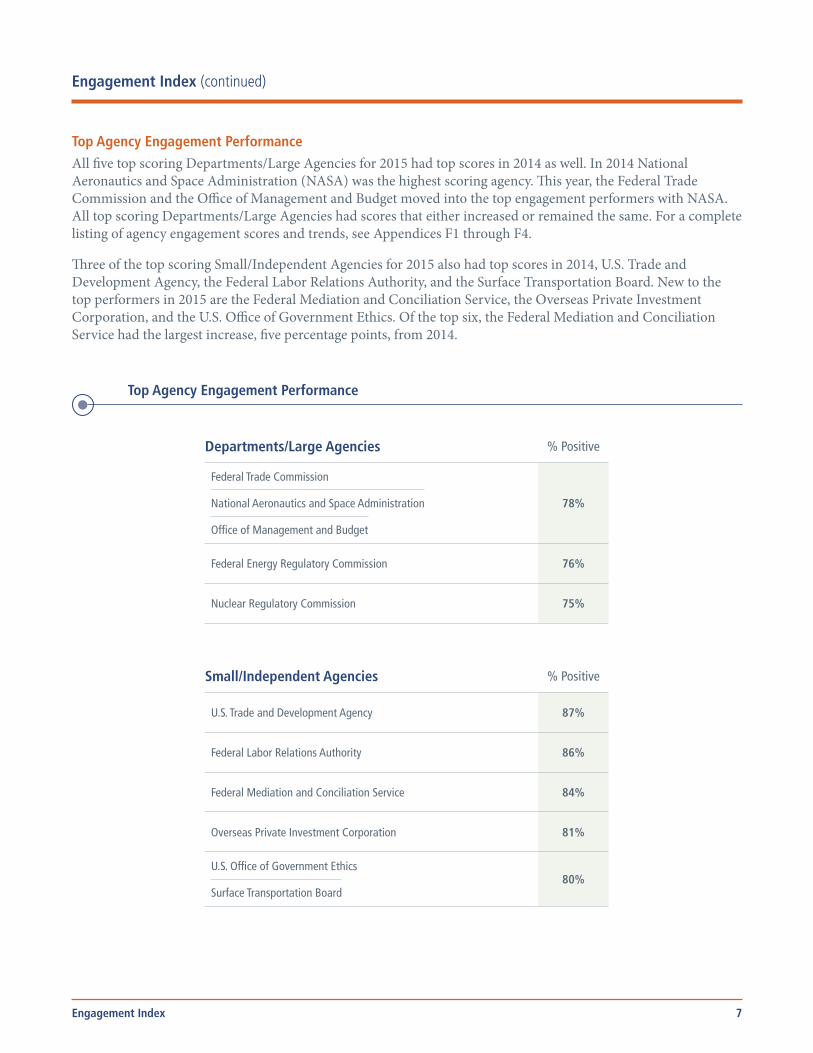
Top Agency Engagement PerformanceAll five top scoring Departments/Large Agencies for 2015 had top scores in 2014 as well. In 2014 National Aeronautics and Space Administration (NASA) was the highest scoring agency. This year, the Federal Trade Commission and the Office of Management and Budget moved into the top engagement performers with NASA. All top scoring Departments/Large Agencies had scores that either increased or remained the same. For a complete listing of agency engagement scores and trends, see Appendices F1 through F4.
Three of the top scoring Small/Independent Agencies for 2015 also had top scores in 2014, U.S. Trade and Development Agency, the Federal Labor Relations Authority, and the Surface Transportation Board. New to the top performers in 2015 are the Federal Mediation and Conciliation Service, the Overseas Private Investment Corporation, and the U.S. Office of Government Ethics. Of the top six, the Federal Mediation and Conciliation Service had the largest increase, five percentage points, from 2014.
Top Agency Engagement Performance
Departments/Large Agencies % Positive
Federal Trade Commission
National Aeronautics and Space Administration
Office of Management and Budget
78%
Federal Energy Regulatory Commission 76%
Nuclear Regulatory Commission 75%
Small/Independent Agencies % Positive
U.S. Trade and Development Agency 87%
Federal Labor Relations Authority 86%
Federal Mediation and Conciliation Service 84%
Overseas Private Investment Corporation 81%
U.S. Office of Government Ethics
Surface Transportation Board80%
8Engagement Index
Engagement Index (continued)
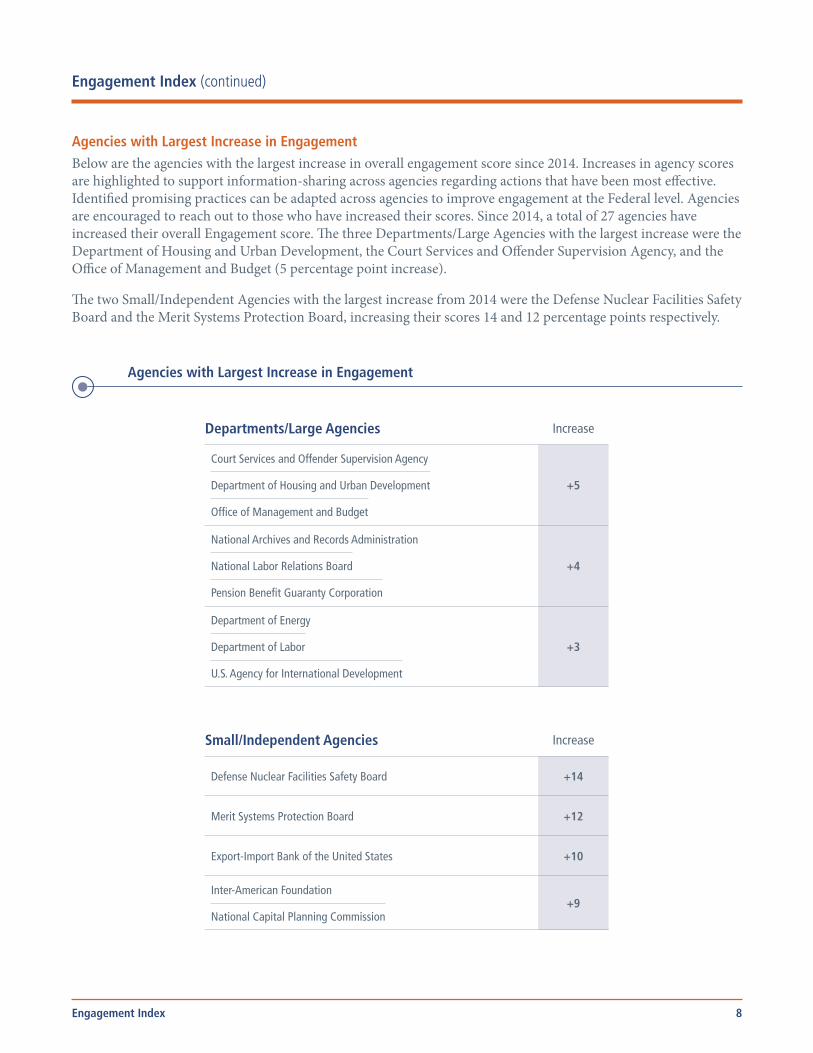
Agencies with Largest Increase in EngagementBelow are the agencies with the largest increase in overall engagement score since 2014. Increases in agency scores are highlighted to support information-sharing across agencies regarding actions that have been most effective. Identified promising practices can be adapted across agencies to improve engagement at the Federal level. Agencies are encouraged to reach out to those who have increased their scores. Since 2014, a total of 27 agencies have increased their overall Engagement score. The three Departments/Large Agencies with the largest increase were the Department of Housing and Urban Development, the Court Services and Offender Supervision Agency, and the Office of Management and Budget (5 percentage point increase).
The two Small/Independent Agencies with the largest increase from 2014 were the Defense Nuclear Facilities Safety Board and the Merit Systems Protection Board, increasing their scores 14 and 12 percentage points respectively.
Agencies with Largest Increase in Engagement
Departments/Large Agencies Increase
Court Services and Offender Supervision Agency
Department of Housing and Urban Development
Office of Management and Budget
+5
National Archives and Records Administration
National Labor Relations Board
Pension Benefit Guaranty Corporation
+4
Department of Energy
Department of Labor
U.S. Agency for International Development
+3
Small/Independent Agencies Increase
Defense Nuclear Facilities Safety Board +14
Merit Systems Protection Board +12
Export-Import Bank of the United States +10
Inter-American Foundation
National Capital Planning Commission+9

9
Global Satisfaction Index
The Global Satisfaction Index3 measures employee satisfaction about four aspects related to their work: their job, their pay, their organization, and whether they would recommend their organization as a good place to work. Understanding employee satisfaction along these four dimensions can help reduce costs in the long run. Satisfied employees are more likely to stay in their jobs, reducing turnover. The effects of turnover are costly, not only in recruitment and on-boarding processes, but also in terms of lost productivity and lower customer satisfaction. Estimates suggest that the cost of bringing a new employee up to speed can range anywhere from 90 to 200 percent of an employee’s annual salary, depending on whether they are entry-level or a top executive.4
The overall Global Satisfaction Index, and its subfactors, all increased by one percentage point from 2014. These scores also show either an increase or no change from 2013 but are still two to four percentage points below 2012 scores.
Global Satisfaction Trends
2012 2013 2014 2015
Global Satisfaction
63. 59. Decreased from 2012. 59. Stayed the same from 2013. 60. Increased from 2014.
Job Satisfaction
68. 65. Decreased from 2012. 64. Decreased from 2013. 65. Increased from 2014.
Pay Satisfaction
59. 54. Decreased from 2012. 56. Increased from 2013. 57. Increased from 2014.
Organization Satisfaction
59. 56. Decreased from 2012. 55. Decreased from 2013. 56. Increased from 2014.
Recommend Organization
67. 63. Decreased from 2012. 62. Decreased from 2013. 63. Increased from 2014.
3 The Global Satisfaction Index is comprised of the following survey items: Considering everything, how satisfied are you with your job? (Q. 69) Considering everything, how satisfied are you with your pay? (Q. 70) Considering everything, how satisfied are you with your organization? (Q. 71) I recommend my organization as a good place to work. (Q. 40)
4 Retaining Talent: A Guide to Analyzing and Managing Employee Turnover, Society for Human Resource Management (2008)
67
62 63 63
59
55 56 56
59
56 54
57
68
64 65 65
63
59 59 60
Global Satisfaction Index
10Global Satisfaction Index
Global Satisfaction Index (continued)
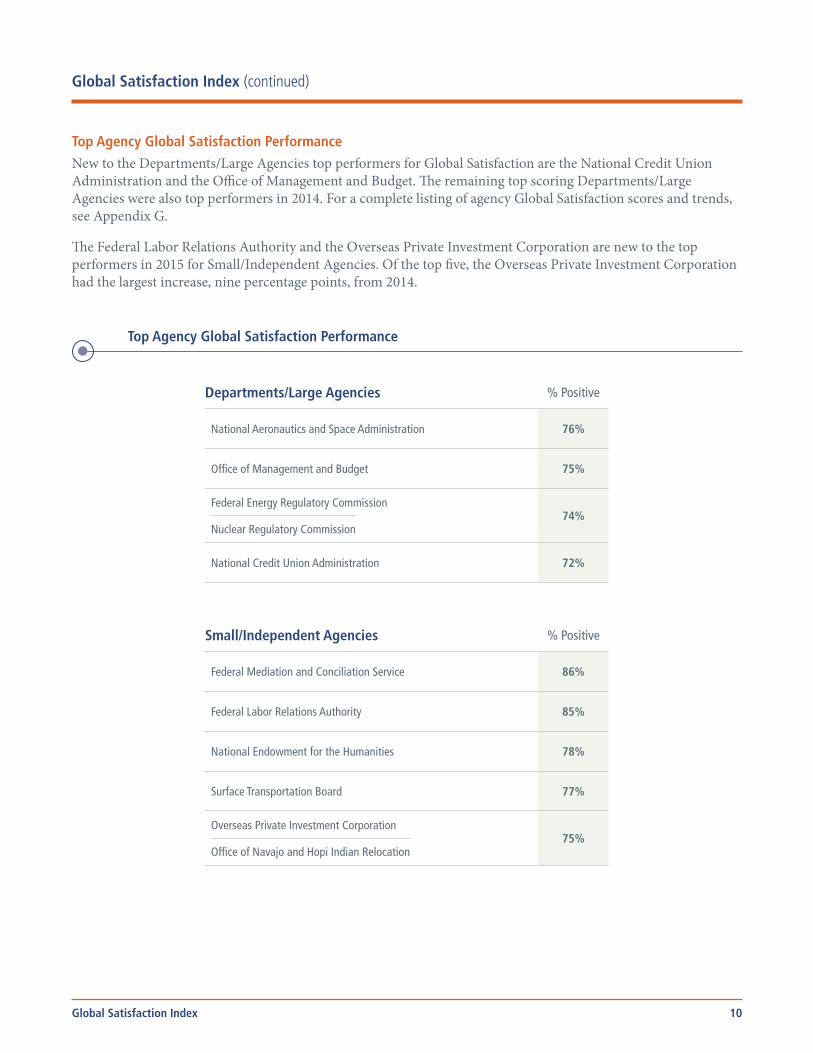
Top Agency Global Satisfaction PerformanceNew to the Departments/Large Agencies top performers for Global Satisfaction are the National Credit Union Administration and the Office of Management and Budget. The remaining top scoring Departments/Large Agencies were also top performers in 2014. For a complete listing of agency Global Satisfaction scores and trends, see Appendix G.
The Federal Labor Relations Authority and the Overseas Private Investment Corporation are new to the top performers in 2015 for Small/Independent Agencies. Of the top five, the Overseas Private Investment Corporation had the largest increase, nine percentage points, from 2014.
Top Agency Global Satisfaction Performance
Departments/Large Agencies % Positive
National Aeronautics and Space Administration 76%
Office of Management and Budget 75%
Federal Energy Regulatory Commission
Nuclear Regulatory Commission74%
National Credit Union Administration 72%
Small/Independent Agencies % Positive
Federal Mediation and Conciliation Service 86%
Federal Labor Relations Authority 85%
National Endowment for the Humanities 78%
Surface Transportation Board 77%
Overseas Private Investment Corporation
Office of Navajo and Hopi Indian Relocation75%
11Global Satisfaction Index
Global Satisfaction Index (continued)
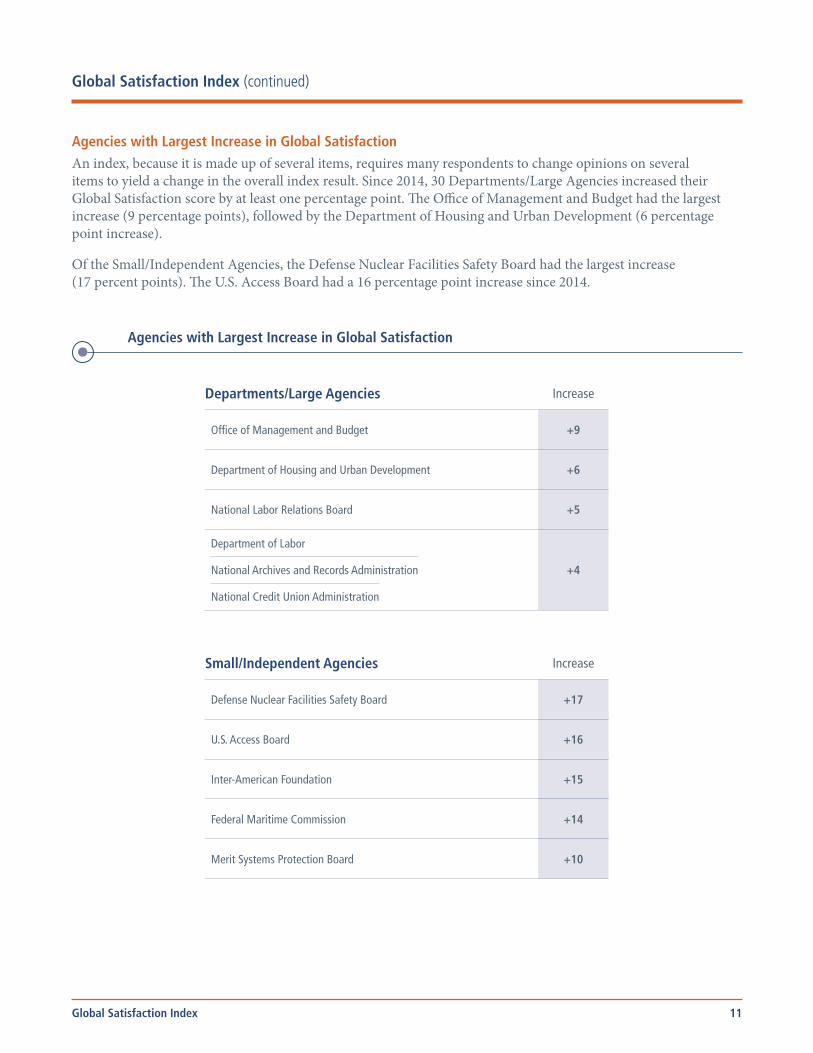
Agencies with Largest Increase in Global SatisfactionAn index, because it is made up of several items, requires many respondents to change opinions on several items to yield a change in the overall index result. Since 2014, 30 Departments/Large Agencies increased their Global Satisfaction score by at least one percentage point. The Office of Management and Budget had the largest increase (9 percentage points), followed by the Department of Housing and Urban Development (6 percentage point increase).
Of the Small/Independent Agencies, the Defense Nuclear Facilities Safety Board had the largest increase (17 percent points). The U.S. Access Board had a 16 percentage point increase since 2014.
Agencies with Largest Increase in Global Satisfaction
Departments/Large Agencies Increase
Office of Management and Budget +9
Department of Housing and Urban Development +6
National Labor Relations Board +5
Department of Labor
National Archives and Records Administration
National Credit Union Administration
+4
Small/Independent Agencies Increase
Defense Nuclear Facilities Safety Board +17
U.S. Access Board +16
Inter-American Foundation +15
Federal Maritime Commission +14
Merit Systems Protection Board +10
12
The New IQ Index
The New IQ identifies behaviors that help create an inclusive environment and is built on the concept that repetition of inclusive behaviors will create positive habits among team members and managers. Behaviors included in the New IQ can be learned, practiced, and developed. Consequently, all members of an organization can improve their inclusive intelligence. Workplace inclusion is a contributing factor to both employee engagement and organizational performance.
The New IQ is made up of 20 questions that relate to inclusive workplace environments. The 20 questions are grouped into “Five Habits of Inclusion” – Fair, Open, Cooperative, Supportive, and Empowering.5
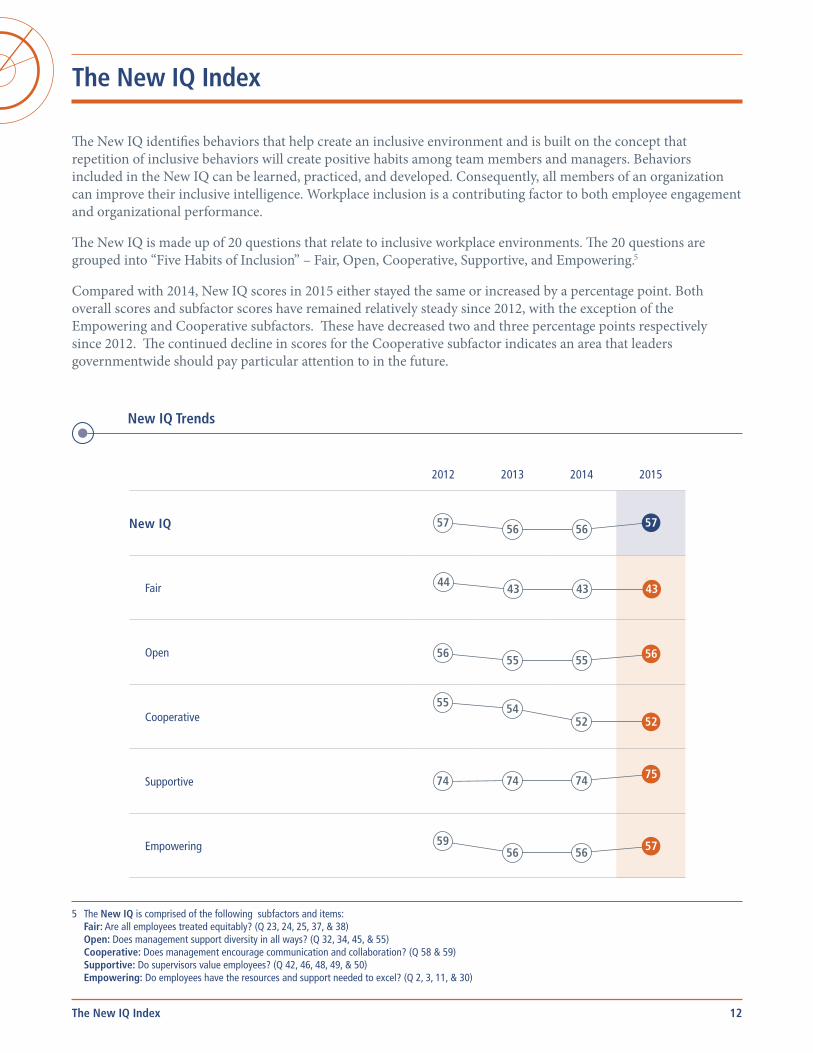
Compared with 2014, New IQ scores in 2015 either stayed the same or increased by a percentage point. Both overall scores and subfactor scores have remained relatively steady since 2012, with the exception of the Empowering and Cooperative subfactors. These have decreased two and three percentage points respectively since 2012. The continued decline in scores for the Cooperative subfactor indicates an area that leaders governmentwide should pay particular attention to in the future.
New IQ Trends
2012 2013 2014 2015
New IQ
57. 56. Decreased from 2012. 56. Stayed the same from 2013. 57. Increased from 2014.
Fair
44. 43. Decreased from 2012. 43. Stayed the same from 2013. 43. Stayed the same from 2014.
Open
56. 55. Decreased from 2012. 55. Stayed the same from 2013. 56. Increased from 2014.
Cooperative
55. 54. Decreased from 2012. 52. Decreased from 2013. 52. Stayed the same from 2014.
Supportive
74. 74. Stayed the same from 2012. 74. Stayed the same from 2012. 75. Increased from 2014.
Empowering
59. 56. Decreased from 2012. 56. Stayed the same from 2013. 57. Increased from 2014.
5 The New IQ is comprised of the following subfactors and items: Fair: Are all employees treated equitably? (Q 23, 24, 25, 37, & 38) Open: Does management support diversity in all ways? (Q 32, 34, 45, & 55) Cooperative: Does management encourage communication and collaboration? (Q 58 & 59) Supportive: Do supervisors value employees? (Q 42, 46, 48, 49, & 50) Empowering: Do employees have the resources and support needed to excel? (Q 2, 3, 11, & 30)
56 55 55 56
44 43 43 43
57 56 56 57
59 56 56 57
74 74 74 75
55
52 54
52
The New IQ Index

13The New IQ Index
The New IQ Index (continued)
Top Agency New IQ PerformanceNew IQ agency level scores ranged from 25 to 93 governmentwide for 2015. The top performers for Departments/Large Agencies in 2015 were also top performers in 2014. Since 2014, four of the top scoring agencies increased their scores; the Nuclear Regulatory Commission’s score remained steady. For a complete listing of agency New IQ scores and trends, see Appendices H1 to H6.
New to the top performers for Small/Independent Agencies in 2015 is the Overseas Private Investment Corporation. This agency also has the largest increase among top performers for Small/Independent agencies with six percentage points.
Top Agency New IQ Performance
Departments/Large Agencies % Positive
National Aeronautics and Space Administration 74%
Federal Trade Commission 70%
Federal Energy Regulatory Commission
Nuclear Regulatory Commission
Office of Management and Budget
69%
Small/Independent Agencies % Positive
U.S. Trade and Development Agency 80%
Federal Labor Relations Authority 79%
Federal Mediation and Conciliation Service 78%
Overseas Private Investment Corporation 76%
Surface Transportation Board 73%
14The New IQ Index
The New IQ Index (continued)
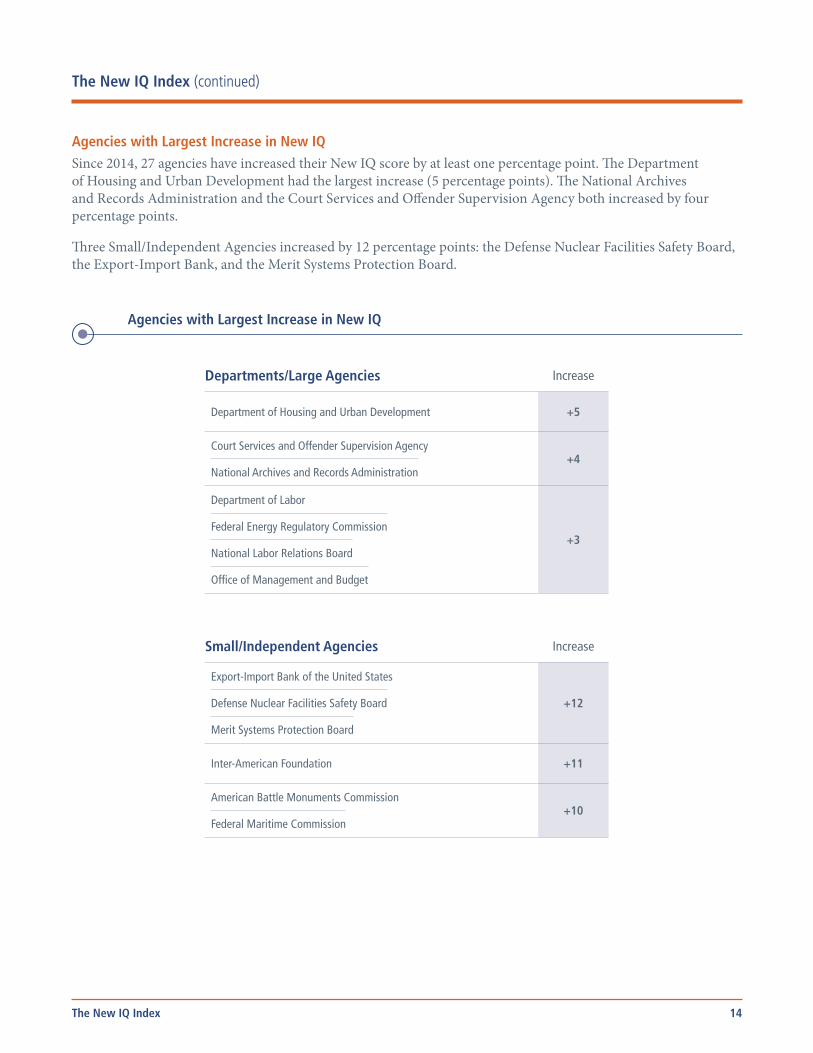
Agencies with Largest Increase in New IQSince 2014, 27 agencies have increased their New IQ score by at least one percentage point. The Department of Housing and Urban Development had the largest increase (5 percentage points). The National Archives and Records Administration and the Court Services and Offender Supervision Agency both increased by four percentage points.
Three Small/Independent Agencies increased by 12 percentage points: the Defense Nuclear Facilities Safety Board, the Export-Import Bank, and the Merit Systems Protection Board.
Agencies with Largest Increase in New IQ
Departments/Large Agencies Increase
Department of Housing and Urban Development +5
Court Services and Offender Supervision Agency
National Archives and Records Administration+4
Department of Labor
Federal Energy Regulatory Commission
National Labor Relations Board
Office of Management and Budget
+3
Small/Independent Agencies Increase
Export-Import Bank of the United States
Defense Nuclear Facilities Safety Board
Merit Systems Protection Board
+12
Inter-American Foundation +11
American Battle Monuments Commission
Federal Maritime Commission+10

15Engagement by Key Employee Characteristics
Engagement by Key Employee Characteristics
While examining governmentwide trends is useful, it is also important to understand engagement within different groups that make up the workforce. The table below contains the Engagement Index scores for selected employee characteristics: agency tenure, generation, disability status, supervisory status, and telework participation.
Engagement trends show an increase from 2014 for nearly all employee characteristics. In particular:
• Individuals with agency tenure of less than four years consistently have higher engagement scores than those with longer agency tenure.
• Traditionalists have higher engagement scores compared to the other three generations.
• Despite an increase from 2014, engagement scores for individuals with a disability remained substantially lower than those in other demographic categories.
• Individuals who telework consistently have higher engagement scores than those who do not.
Engagement by Key Characteristics
2012 2013 2014 2015
Change from 2014
Agency Tenure
< 4 years 69% 68% 67% 69% +2
4–10 years 63% 62% 62% 63% +1
> 10 years 65% 64% 63% 64% +1
Generations
Millennials 66% 65% 63% 65% +2
Generation X 65% 64% 62% 63% +1
Baby Boomers 65% 64% 63% 64% +1
Traditionalists 69% 70% 68% 68% 0
Disability Status
With Disabilities 61% 60% 59% 60% +1
Without Disabilities 66% 65% 64% 65% +1
16
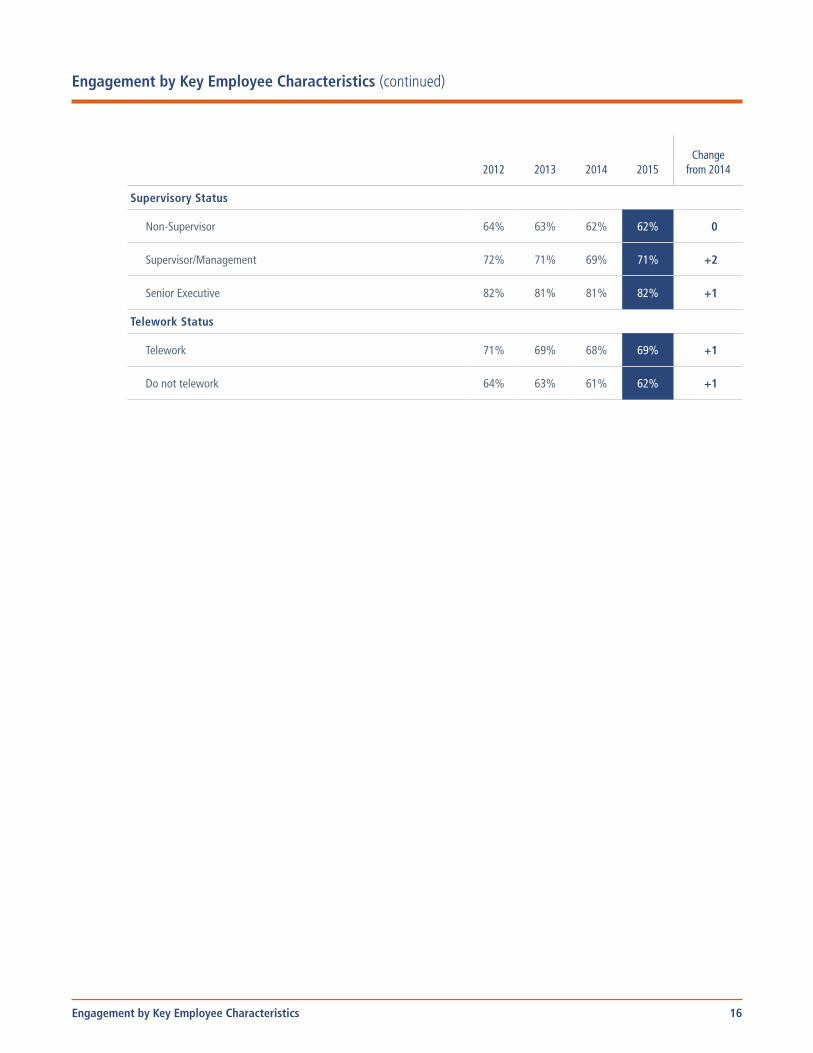
Engagement by Key Employee Characteristics (continued)
Engagement by Key Employee Characteristics
Supervisory Status
Non-Supervisor 64% 63% 62% 62% 0
Supervisor/Management 72% 71% 69% 71% +2
Senior Executive 82% 81% 81% 82% +1
Telework Status
Telework 71% 69% 68% 69% +1
Do not telework 64% 63% 61% 62% +1
2012 2013 2014 2015
Change from 2014
17A Look at Occupations in the Federal Government
A Look at Occupations in the Federal Government
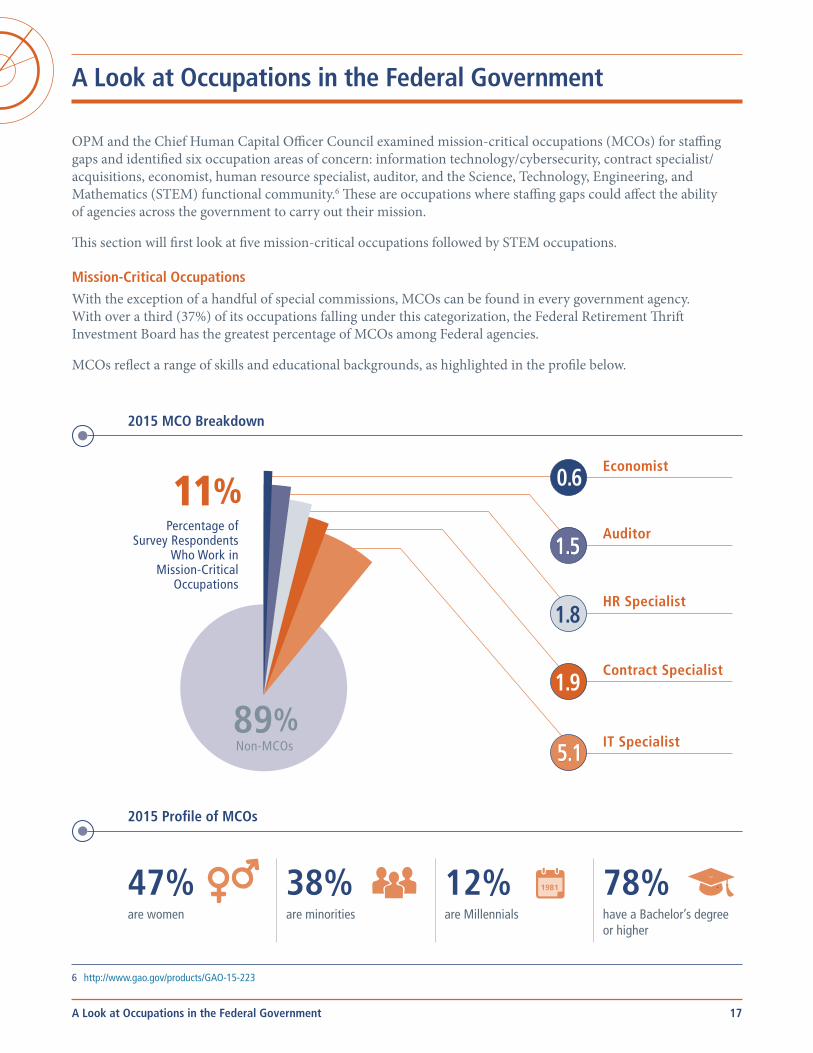
OPM and the Chief Human Capital Officer Council examined mission-critical occupations (MCOs) for staffing gaps and identified six occupation areas of concern: information technology/cybersecurity, contract specialist/ acquisitions, economist, human resource specialist, auditor, and the Science, Technology, Engineering, and Mathematics (STEM) functional community.6 These are occupations where staffing gaps could affect the ability of agencies across the government to carry out their mission.
This section will first look at five mission-critical occupations followed by STEM occupations.
Mission-Critical OccupationsWith the exception of a handful of special commissions, MCOs can be found in every government agency. With over a third (37%) of its occupations falling under this categorization, the Federal Retirement Thrift Investment Board has the greatest percentage of MCOs among Federal agencies.
MCOs reflect a range of skills and educational backgrounds, as highlighted in the profile below.
2015 MCO Breakdown
Percentage of Survey Respondents
Who Work in Mission-Critical
Occupations
11%
Non-MCOs89%
Economist 0.6
Auditor1.5
HR Specialist1.8
Contract Specialist1.9
IT Specialist 5.1
2015 Profile of MCOs
47%are women
38%are minorities
12%are Millennials
78%have a Bachelor’s degree or higher
6 http://www.gao.gov/products/GAO-15-223
1981

18
A Look at Occupations in the Federal Government (continued)
A Look at Occupations in the Federal Government
The table below contains the Engagement Index scores for MCOs. Index trends show an increase from 2014 for all occupation categories, Economist showed the greatest increase with a jump of four percentage points.
Engagement Scores by Mission-Critical Occupations
2012 2013 2014 2015
Change from 2014
Economists 70% 69% 69% 73% +4
Auditor 71% 69% 69% 70% +1
HR Specialist 67% 67% 66% 67% +1
Contract Specialist 68% 67% 65% 66% +1
IT Specialist 65% 63% 63% 64% +1
19
A Look at Occupations in the Federal Government (continued)
A Look at Occupations in the Federal Government
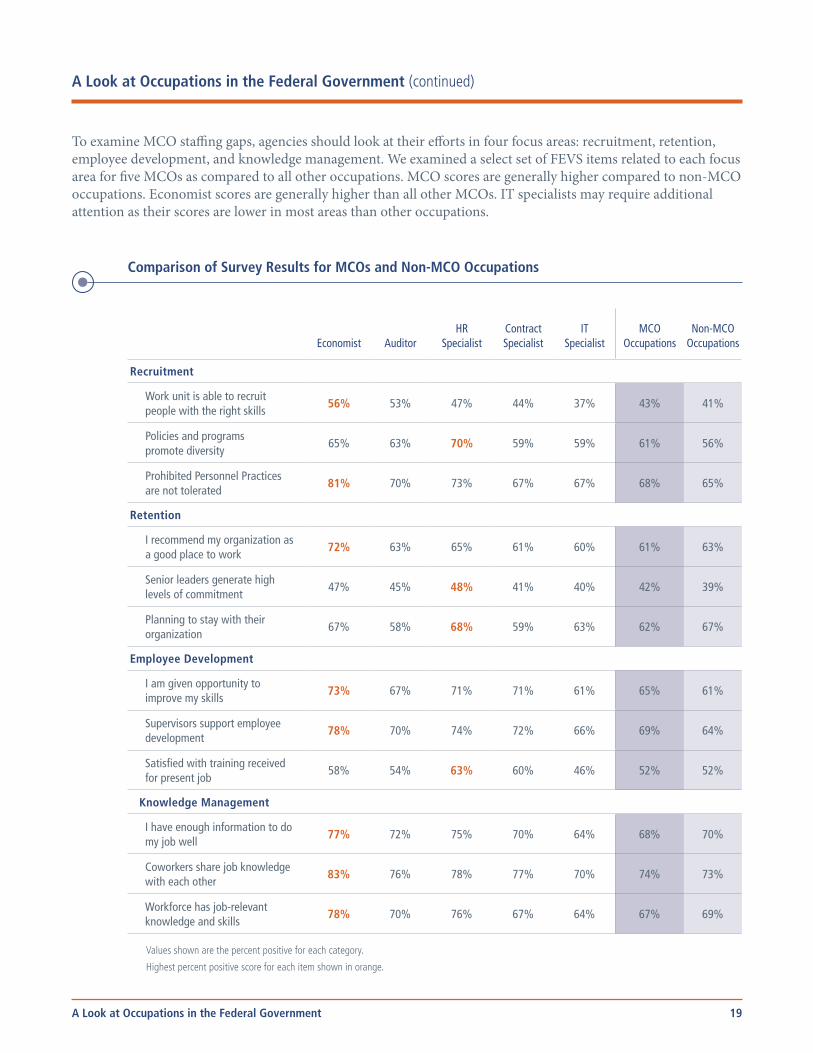
To examine MCO staffing gaps, agencies should look at their efforts in four focus areas: recruitment, retention, employee development, and knowledge management. We examined a select set of FEVS items related to each focus area for five MCOs as compared to all other occupations. MCO scores are generally higher compared to non-MCO occupations. Economist scores are generally higher than all other MCOs. IT specialists may require additional attention as their scores are lower in most areas than other occupations.
Comparison of Survey Results for MCOs and Non-MCO Occupations
Economist Auditor
HR Specialist
Contract Specialist
IT Specialist
MCO Occupations
Non-MCO Occupations
Recruitment
Work unit is able to recruit people with the right skills
56% 53% 47% 44% 37% 43% 41%
Policies and programs promote diversity
65% 63% 70% 59% 59% 61% 56%
Prohibited Personnel Practices are not tolerated
81% 70% 73% 67% 67% 68% 65%
Retention
I recommend my organization as a good place to work
72% 63% 65% 61% 60% 61% 63%
Senior leaders generate high levels of commitment
47% 45% 48% 41% 40% 42% 39%
Planning to stay with their organization
67% 58% 68% 59% 63% 62% 67%
Employee Development
I am given opportunity to improve my skills
73% 67% 71% 71% 61% 65% 61%
Supervisors support employee development
78% 70% 74% 72% 66% 69% 64%
Satisfied with training received for present job
58% 54% 63% 60% 46% 52% 52%
Knowledge Management
I have enough information to do my job well
77% 72% 75% 70% 64% 68% 70%
Coworkers share job knowledge with each other
83% 76% 78% 77% 70% 74% 73%
Workforce has job-relevant knowledge and skills
78% 70% 76% 67% 64% 67% 69%
Values shown are the percent positive for each category.
Highest percent positive score for each item shown in orange.

20A Look at Occupations in the Federal Government
A Look at Occupations in the Federal Government (continued)
STEMOver the past decade, the number of employees in STEM occupations has increased by 30,000 and at a rate faster than Non-STEM occupations. Shown in the profile below, the majority of employees in STEM occupations are male (69%) and ten percent are Millennials.
2015 STEM Breakdown
Percentage of Survey Respondents
Who Work in STEM Occupations
16%
Non-STEM84%
Mathematics1.1
Science4.9
Engineering 5.1
Technology 5.1
2015 Profile of STEM Occupations
69%are male
28%are minorities
10%are Millennials
89%hold a Bachelor’s degree or higher
1981
21
A Look at Occupations in the Federal Government (continued)
A Look at Occupations in the Federal Government
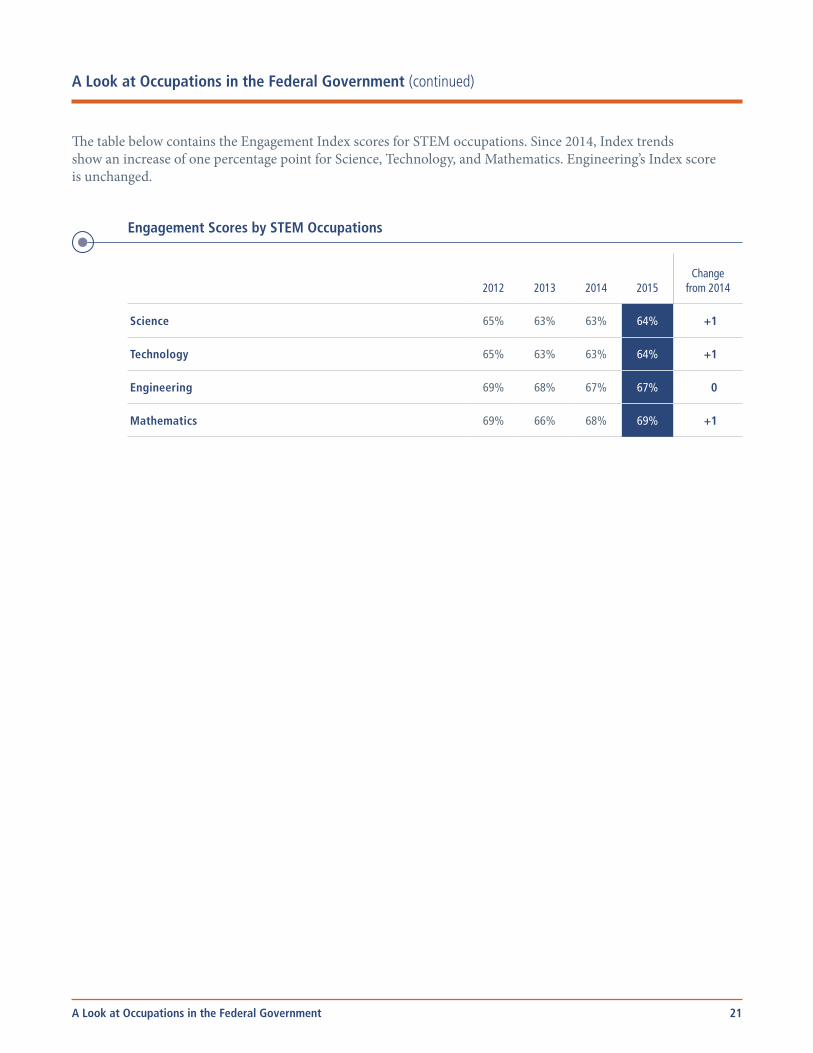
The table below contains the Engagement Index scores for STEM occupations. Since 2014, Index trends show an increase of one percentage point for Science, Technology, and Mathematics. Engineering’s Index score is unchanged.
Engagement Scores by STEM Occupations
2012 2013 2014 2015
Change from 2014
Science 65% 63% 63% 64% +1
Technology 65% 63% 63% 64% +1
Engineering 69% 68% 67% 67% 0
Mathematics 69% 66% 68% 69% +1
22A Look at Occupations in the Federal Government
A Look at Occupations in the Federal Government (continued)
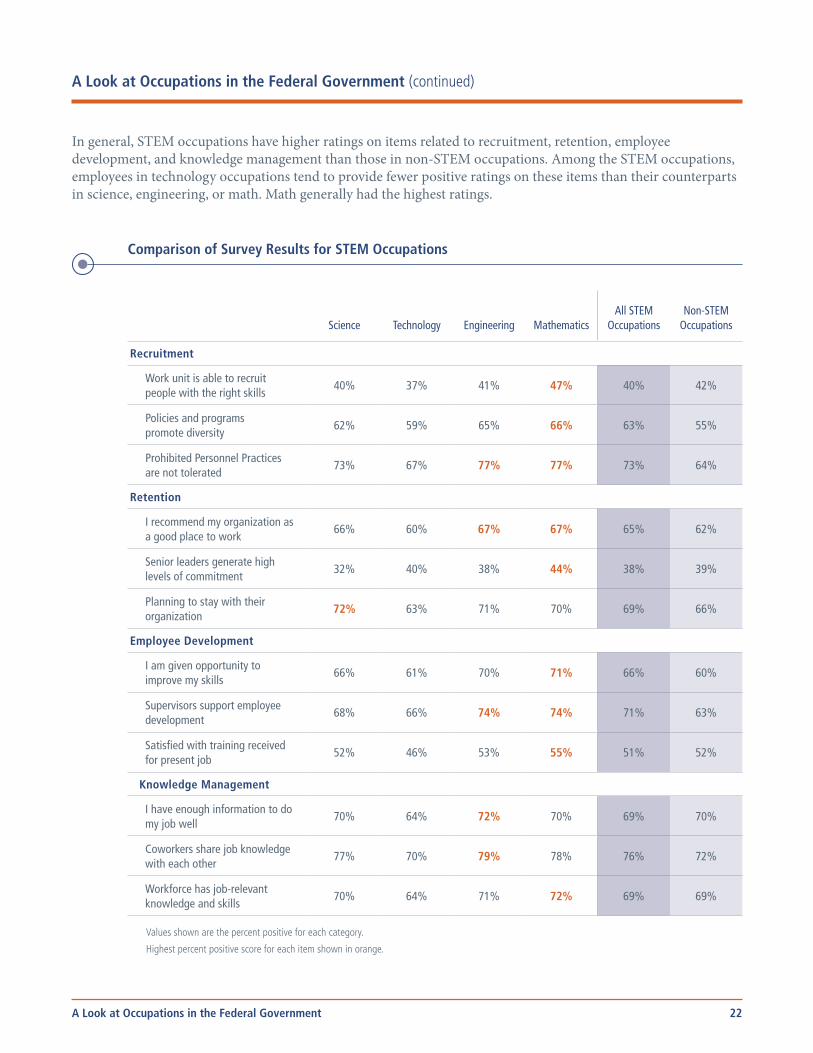
In general, STEM occupations have higher ratings on items related to recruitment, retention, employee development, and knowledge management than those in non-STEM occupations. Among the STEM occupations, employees in technology occupations tend to provide fewer positive ratings on these items than their counterparts in science, engineering, or math. Math generally had the highest ratings.
Comparison of Survey Results for STEM Occupations
Science Technology Engineering Mathematics
All STEM Occupations
Non-STEM Occupations
Recruitment
Work unit is able to recruit people with the right skills
40% 37% 41% 47% 40% 42%
Policies and programs promote diversity
62% 59% 65% 66% 63% 55%
Prohibited Personnel Practices are not tolerated
73% 67% 77% 77% 73% 64%
Retention
I recommend my organization as a good place to work
66% 60% 67% 67% 65% 62%
Senior leaders generate high levels of commitment
32% 40% 38% 44% 38% 39%
Planning to stay with their organization
72% 63% 71% 70% 69% 66%
Employee Development
I am given opportunity to improve my skills
66% 61% 70% 71% 66% 60%
Supervisors support employee development
68% 66% 74% 74% 71% 63%
Satisfied with training received for present job
52% 46% 53% 55% 51% 52%
Knowledge Management
I have enough information to do my job well
70% 64% 72% 70% 69% 70%
Coworkers share job knowledge with each other
77% 70% 79% 78% 76% 72%
Workforce has job-relevant knowledge and skills
70% 64% 71% 72% 69% 69%
Values shown are the percent positive for each category.
Highest percent positive score for each item shown in orange.

23
Mission-Critical Occupations and STEMIn addition to examining the areas of recruitment, retention, employee development, and knowledge management we also considered workload and resource availability as assessed in the FEVS. When compared to other occupations, those in MCOs or STEM occupations are slightly less likely to feel they have a reasonable workload or that they have sufficient resources to get their job done. These are factors that may have an impact on retention efforts, affecting efforts to close identified skills gaps identified for MCOs and STEM occupations.
Comparison of Survey Results for Workload and Resources
My Workload Is ReasonableMission Critical and STEM Occupation
54%
All Other Occupations
58%
I Have Sufficient Resources to Get My Job DoneMission Critical and STEM Occupation
43%
All Other Occupations
47%
A Look at Occupations in the Federal Government
A Look at Occupations in the Federal Government (continued)
All Other Occupations
Mission Critical and STEM Occupations
24Conclusion
Conclusion
Through participation in the annual Federal Employee Viewpoint Survey (FEVS), Federal Government employees are given the opportunity to share their experiences and provide feedback about all aspects of their work life. For 2015, more than 421,000 employees, representing various demographic groups at all organizational levels, voiced their opinions about working in the Federal Government. By revealing what is working and what is not, FEVS results provide a guide to evaluation and action planning efforts to support and strengthen a culture of employee engagement and organizational performance.
Similar to previous years, results from the 2015 FEVS continue to document the unwavering dedication and devotion of the Federal workforce.
Ninety percent or more of Federal employees:
• view their work as important
• are willing to commit extra effort when necessary to get their jobs done
• consistently seek out ways to do better
Progress is shown since 2014:
• approximately 75 percent of the survey items increased
• more Federal employees report being satisfied with their jobs
• scores on three key indices — Engagement, Global Satisfaction, and New IQ — have increased
What continues to remain strong in 2015:
• employees’ relationships with their supervisors
• satisfaction with telework and alternative work schedules
Areas where improvement should still be made:
• dealing with poor performers
• recognizing differences in performance within the work unit
Federal Government employees are strong, resolute, and committed. The 2015 FEVS results show employee experiences are improving. While this improvement is a cause for celebration, additional work remains especially in the areas of performance management.
The survey is only the measuring stick; the real work lies ahead as agencies embrace survey results and move forward towards identifying and implementing improvement initiatives or sustaining success. Through the President’s Management Agenda plank on People and Culture, agencies have galvanized their resources behind strategies to improve employee engagement, which is a precursor to improved performance and productivity. With 27 of 37 large agencies increasing by one percentage point or more on the Engagement Index, the 2015 FEVS results provide an inkling of the return on investment that is possible when organizations focus on engagement.
Throughout the report, resources and processes are highlighted to assist agencies in next steps. Agencies are encouraged to start conversations with one another to address challenging issues and share best practices to accomplish complex change tasks. Working together we can provide positive experiences for employees and the public they serve.
25
Appendix A: 2015 FEVS Methods
2015 Federal Employee Viewpoint Survey Methods
What Types of Questions are Included in the Survey?The 98–item survey includes 84 items that measure Federal employees’ perceptions about how effectively agencies manage their workforce, as well as 14 demographic items.
The survey is grouped into eight topic areas:
• Personal Work Experiences
• Work Unit
• Agency
• Supervisor
• Leadership
• Satisfaction
• Work/Life Programs
• Demographics
Who Participated?Full–time and part–time permanent, non–seasonal employees were eligible to participate in the survey.
How Many Employees Participated?Employees from 82 agencies, 37 departments/large agencies and 45 small/independent agencies, participated in this year’s survey. Of the 848,237 employees who received the FEVS, 421,748 completed the survey for a governmentwide response rate of 49.7 percent.
How Was the Survey Administered?The survey was a self–administered Web survey.
When Were Employees Surveyed?Agency launch dates were organized in two waves this year, with approximately 6–week administration periods beginning April 27th and May 4th.
Data WeightingData collected from the 2015 survey respondents were weighted to produce survey estimates that accurately represent the survey population. Unweighted data could produce biased estimates of population statistics. The weights developed for the 2015 FEVS take into account the variable probabilities of selection across the sample domains, nonresponse, and known demographic characteristics of the survey population. Thus, the final data set reflects the agency composition and demographic makeup of the Federal workforce within plus or minus 1 percentage point.
Appendix A: 2015 FEVS Methods
26
Data AnalysisIn performing statistical analyses for this report, OPM employed a number of grouping procedures to simplify presentations. Most of the items had six response categories: Strongly Agree, Agree, Neither Agree nor Disagree, Disagree, Strongly Disagree, and No Basis to Judge/Do Not Know. In some instances, these responses are collapsed into one positive category (Strongly Agree and Agree), one negative category (Strongly Disagree and Disagree), and a neutral category (Neither Agree nor Disagree). We conducted analyses on all survey items for the various demographic categories. More detailed survey statistics are available in the published Federal Employee Viewpoint Survey Data volumes for this survey and can be downloaded from OPM’s Federal Employee Viewpoint Survey website: www.opm.gov/FEVS.
Index DevelopmentThe 2015 FEVS includes seven indices: the Engagement Index, the Global Satisfaction Index, the New Inclusion Quotient (The New IQ), and the four HCAAF (Human Capital Assessment and Accountability Framework) Indices. These indices provide a dependable and consistent method for Federal agencies to assess different facets of the workforce.
Engagement IndexThe Engagement Index was developed using a combination of social science theory and statistical analysis. Several items from the FEVS were selected based on a rationalization they would be representative of dimensions similar to other engagement “driver” measures. Items which used a satisfaction scale were excluded so as to differentiate between satisfaction and engagement.
An initial exploratory factor analysis revealed three factors consisting of 16 items (Leaders Lead, Supervision, and Intrinsic Work Experience) with a single, underlying factor (Conditions Conducive to Employee Engagement). A confirmatory factor analysis was repeated with an independent dataset, which further supported the three–factor model. One item was removed for theoretical and statistical reasons, resulting in the 15–item, three–factor model.
Global Satisfaction IndexOPM created the Global Satisfaction Index to provide a more comprehensive indicator of employees’ overall work satisfaction. The index is a combination of employees’ satisfaction with their job, their pay, and their organization, plus their willingness to recommend their organization as a good place to work.
New Inclusion Quotient (The New IQ)The New IQ is built on the concept that individual behaviors, repeated over time, form the habits that create the essential building blocks of an inclusive environment. These behaviors can be learned, practiced, and developed into habits of inclusiveness and subsequently improve the inclusive intelligence of organizational members. The New IQ consists of 20 questions that are related to inclusive environments. These 20 questions are grouped into “5 Habits of inclusion” – Fair, Open, Cooperative, Supportive, and Empowering.
Appendix A: 2015 FEVS Methods (continued)
Appendix A: 2015 FEVS Methods
27
HCAAF IndicesThe HCAAF Indices were developed to help agencies meet the requirements of OPM’s mandate under the Chief Human Capital Officers Act of 2002 to design systems, set standards, and develop metrics for assessing the management of Federal employees. The FEVS provides supplementary information to evaluate Leadership & Knowledge Management, Results–Oriented Performance Culture, and Talent Management, and provides an additional index on Job Satisfaction. Agencies can access their 2015 HCAAF scores on the Online Reporting and Analysis Tool.
The Index scores were calculated by averaging the percent positive responses on the items within the Index. For example, if the item–level percent positive responses for a four–item Index were 20 percent, 40 percent, 60 percent, and 80 percent, the HCAAF rating would be the average of these four percentages (20 + 40 + 60 + 80) divided by 4 = 50 percent.
Appendix A: 2015 FEVS Methods (continued)
Appendix A: 2015 FEVS Methods
28
Appendix B: Trend Analysis
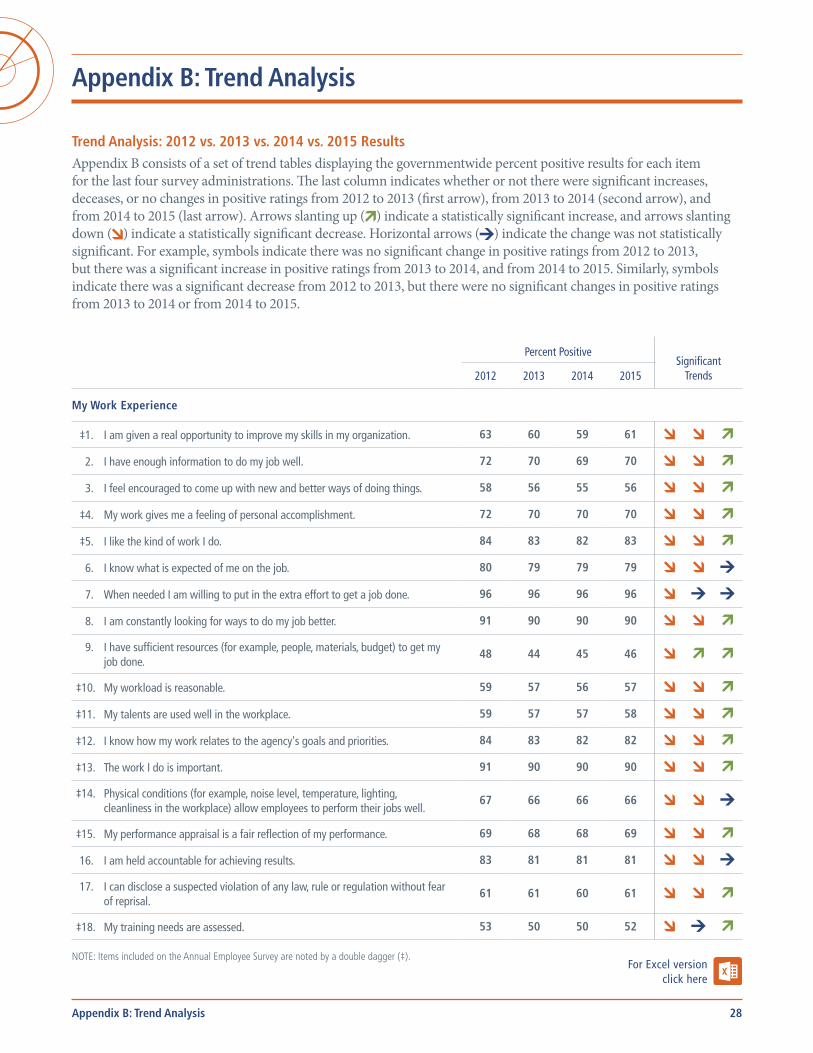
Trend Analysis: 2012 vs. 2013 vs. 2014 vs. 2015 ResultsAppendix B consists of a set of trend tables displaying the governmentwide percent positive results for each item for the last four survey administrations. The last column indicates whether or not there were significant increases, deceases, or no changes in positive ratings from 2012 to 2013 (first arrow), from 2013 to 2014 (second arrow), and from 2014 to 2015 (last arrow). Arrows slanting up ( ) indicate a statistically significant increase, and arrows slanting down ( ) indicate a statistically significant decrease. Horizontal arrows ( ) indicate the change was not statistically significant. For example, symbols indicate there was no significant change in positive ratings from 2012 to 2013, but there was a significant increase in positive ratings from 2013 to 2014, and from 2014 to 2015. Similarly, symbols indicate there was a significant decrease from 2012 to 2013, but there were no significant changes in positive ratings from 2013 to 2014 or from 2014 to 2015.
Percent Positive
Significant Trends2012 2013 2014 2015
My Work Experience
‡1. I am given a real opportunity to improve my skills in my organization. 63 60 59 61Significant decrease in positive ratings from 2012 to 2013. Significant decrease in positive ratings from 2013 to 2014. Significant increase in positive ratings from 2014 to 2015.
2. I have enough information to do my job well. 72 70 69 70nt decrease in positive ratings from 2012 to 2013. Significant decrease in positive ratings from 2013 to 2014. Significant increase in positive ratings from 2014 to 2015.
3. I feel encouraged to come up with new and better ways of doing things. 58 56 55 56nt decrease in positive ratings from 2012 to 2013. Significant decrease in positive ratings from 2013 to 2014. Significant increase in positive ratings from 2014 to 2015.
‡4. My work gives me a feeling of personal accomplishment. 72 70 70 70nt decrease in positive ratings from 2012 to 2013. Significant decrease in positive ratings from 2013 to 2014. Significant increase in positive ratings from 2014 to 2015.
‡5. I like the kind of work I do. 84 83 82 83nt decrease in positive ratings from 2012 to 2013. Significant decrease in positive ratings from 2013 to 2014. Significant increase in positive ratings from 2014 to 2015.
6. I know what is expected of me on the job. 80 79 79 79nt decrease in positive ratings from 2012 to 2013. Significant decrease in positive ratings from 2013 to 2014. No significant change in positive ratings from 2014 to 2015.
7. When needed I am willing to put in the extra effort to get a job done. 96 96 96 96nt decrease in positive ratings from 2012 to 2013. No significant change in positive ratings from 2013 to 2014.No significant change in positive ratings from 2014 to 2015.
8. I am constantly looking for ways to do my job better. 91 90 90 90nt decrease in positive ratings from 2012 to 2013. Significant decrease in positive ratings from 2013 to 2014. Significant increase in positive ratings from 2014 to 2015.
9. I have sufficient resources (for example, people, materials, budget) to get my job done.
48 44 45 46nt decrease in positive ratings from 2012 to 2013. Significant increase in positive ratings from 2013 to 2014. Significant increase in positive ratings from 2014 to 2015.
‡10. My workload is reasonable. 59 57 56 57nt decrease in positive ratings from 2012 to 2013. Significant decrease in positive ratings from 2013 to 2014. Significant increase in positive ratings from 2014 to 2015.
‡11. My talents are used well in the workplace. 59 57 57 58nt decrease in positive ratings from 2012 to 2013. Significant decrease in positive ratings from 2013 to 2014. Significant increase in positive ratings from 2014 to 2015.
‡12. I know how my work relates to the agency's goals and priorities. 84 83 82 82nt decrease in positive ratings from 2012 to 2013. Significant decrease in positive ratings from 2013 to 2014. Significant increase in positive ratings from 2014 to 2015.
‡13. The work I do is important. 91 90 90 90nt decrease in positive ratings from 2012 to 2013. Significant decrease in positive ratings from 2013 to 2014. Significant increase in positive ratings from 2014 to 2015.
‡14. Physical conditions (for example, noise level, temperature, lighting, cleanliness in the workplace) allow employees to perform their jobs well.
67 66 66 66nt decrease in positive ratings from 2012 to 2013. Significant decrease in positive ratings from 2013 to 2014. No significant change in positive ratings from 2014 to 2015.
‡15. My performance appraisal is a fair reflection of my performance. 69 68 68 69nt decrease in positive ratings from 2012 to 2013. Significant decrease in positive ratings from 2013 to 2014. Significant increase in positive ratings from 2014 to 2015.
16. I am held accountable for achieving results. 83 81 81 81nt decrease in positive ratings from 2012 to 2013. Significant decrease in positive ratings from 2013 to 2014. No significant change in positive ratings from 2014 to 2015.
17. I can disclose a suspected violation of any law, rule or regulation without fear of reprisal.
61 61 60 61nt decrease in positive ratings from 2012 to 2013. Significant decrease in positive ratings from 2013 to 2014. Significant increase in positive ratings from 2014 to 2015.
‡18. My training needs are assessed. 53 50 50 52nt decrease in positive ratings from 2012 to 2013. No significant change in positive ratings from 2013 to 2014. Significant increase in positive ratings from 20
NOTE: Items included on the Annual Employee Survey are noted by a double dagger (‡).For Excel version
click here
Appendix B: Trend Analysis

29
‡19. In my most recent performance appraisal, I understood what I had to do to be rated at different performance levels (for example, Fully Successful, Outstanding).
68 68 67 68No significant change in positive ratings
from 2012 to 2013.Significant decrease in positive ratings from 2013 to 2014. Significant increase in positive ratings from 2014 to 2015.
‡20. The people I work with cooperate to get the job done. 73 73 72 73nt decrease in positive ratings from 2012 to 2013. Significant decrease in positive ratings from 2013 to 2014. Significant increase in positive ratings from 2014 to 2015.
‡21. My work unit is able to recruit people with the right skills. 43 40 41 42nt decrease in positive ratings from 2012 to 2013. Significant increase in positive ratings from 2013 to 2014. Significant increase in positive ratings from 2014 to 2015.
‡22. Promotions in my work unit are based on merit. 34 32 32 33nt decrease in positive ratings from 2012 to 2013. Significant increase in positive ratings from 2013 to 2014. Significant increase in positive ratings from 2014 to 2015.
‡23. In my work unit, steps are taken to deal with a poor performer who cannot or will not improve.
29 28 28 28nt decrease in positive ratings from 2012 to 2013. Significant increase in positive ratings from 2013 to 2014. No significant change in positive ratings from 2014 to 2015
‡24. In my work unit, differences in performance are recognized in a meaningful way. 34 31 32 33nt decrease in positive ratings from 2012 to 2013. No significant change in positive ratings from 2013 to 2014 Significant increase in positive ratings from 2014 to 2015.
25. Awards in my work unit depend on how well employees perform their jobs. 41 38 38 40nt decrease in positive ratings from 2012 to 2013. Significant increase in positive ratings from 2013 to 2014. Significant increase in positive ratings from 2014 to 2015.
26. Employees in my work unit share job knowledge with each other. 72 72 72 73nt decrease in positive ratings from 2012 to 2013. No significant change in positive ratings from 2013 to 2014. Significant increase in positive ratings from 2014 to 2015.
27. The skill level in my work unit has improved in the past year. 55 52 51 53nt decrease in positive ratings from 2012 to 2013. Significant decrease in positive ratings from 2013 to 2014. Significant increase in positive ratings from 2014 to 2015.
28. How would you rate the overall quality of work done by your work unit? 83 83 82 82nt decrease in positive ratings from 2012 to 2013. Significant decrease in positive ratings from 2013 to 2014. No significant change in positive ratings from 2014 to 2015.
My Agency
‡29. The workforce has the job-relevant knowledge and skills necessary to accomplish organizational goals.
72 70 69 69nt decrease in positive ratings from 2012 to 2013. Significant decrease in positive ratings from 2013 to 2014. Significant increase in positive ratings from 2014 to 2015.
‡30. Employees have a feeling of personal empowerment with respect to work processes.
45 43 42 43nt decrease in positive ratings from 2012 to 2013. Significant decrease in positive ratings from 2013 to 2014. Significant increase in positive ratings from 2014 to 2015.
31. Employees are recognized for providing high quality products and services. 48 46 45 47nt decrease in positive ratings from 2012 to 2013. Significant decrease in positive ratings from 2013 to 2014. Significant increase in positive ratings from 2014 to 2015.
‡32. Creativity and innovation are rewarded. 38 35 35 37nt decrease in positive ratings from 2012 to 2013. Significant decrease in positive ratings from 2013 to 2014. Significant increase in positive ratings from 2014 to 2015.
‡33. Pay raises depend on how well employees perform their jobs. 22 19 20 21nt decrease in positive ratings from 2012 to 2013. Significant increase in positive ratings from 2013 to 2014. Significant increase in positive ratings from 2014 to 2015.
34. Policies and programs promote diversity in the workplace (for example, recruiting minorities and women, training in awareness of diversity issues, mentoring).
57 55 55 56nt decrease in positive ratings from 2012 to 2013. No significant change in positive ratings from 2013 to 2014. Significant increase in positive ratings from 2014 to 2015.
‡35. Employees are protected from health and safety hazards on the job. 77 76 76 76nt decrease in positive ratings from 2012 to 2013. No significant change in positive ratings from 2013 to 2014.No significant change in positive ratings from 2014 to 2015.
‡36. My organization has prepared employees for potential security threats. 78 76 76 76nt decrease in positive ratings from 2012 to 2013. No significant change in positive ratings from 2013 to 2014.No significant change in positive ratings from 2014 to 2015.
37. Arbitrary action, personal favoritism and coercion for partisan political purposes are not tolerated.
51 51 50 51nt decrease in positive ratings from 2012 to 2013. Significant decrease in positive ratings from 2013 to 2014. Significant increase in positive ratings from 2014 to 2015.
38. Prohibited Personnel Practices are not tolerated. 66 65 65 66nt decrease in positive ratings from 2012 to 2013. No significant change in positive ratings from 2013 to 2014. Significant increase in positive ratings from 2014 to 2015.
39. My agency is successful at accomplishing its mission. 76 74 73 73nt decrease in positive ratings from 2012 to 2013. Significant decrease in positive ratings from 2013 to 2014. No significant change in positive ratings from 2014 to 2015.
40. I recommend my organization as a good place to work. 67 63 62 63nt decrease in positive ratings from 2012 to 2013. Significant decrease in positive ratings from 2013 to 2014. Significant increase in positive ratings from 2014 to 2015.
41. I believe the results of this survey will be used to make my agency a better place to work.
42 38 38 39nt decrease in positive ratings from 2012 to 2013. No significant change in positive ratings from 2013 to 2014. Significant increase in positive ratings from 2014 to 2015.
NOTE: Items included on the Annual Employee Survey are noted by a double dagger (‡).
Percent Positive
Significant Trends2012 2013 2014 2015
Appendix B: Trend Analysis (continued)
Appendix B: Trend Analysis
30
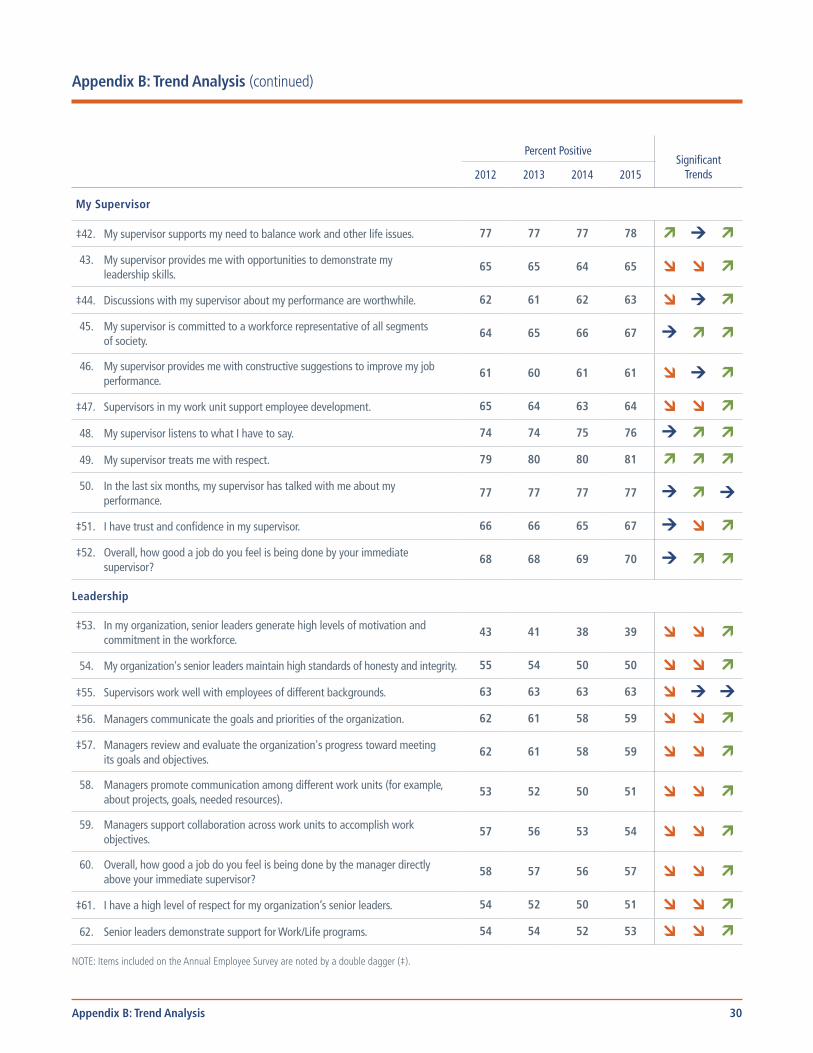
My Supervisor
‡42. My supervisor supports my need to balance work and other life issues. 77 77 77 78Significant increase in positive ratings from 2012 to 2013. No significant change in positive ratings from 2013 to 2014. Significant increase in positive ratings from 2014 to 2015.
43. My supervisor provides me with opportunities to demonstrate my leadership skills.
65 65 64 65Significant decrease in positive ratings from 2012 to 2013. Significant decrease in positive ratings from 2013 to 2014. Significant increase in positive ratings from 2014 to 2015.
‡44. Discussions with my supervisor about my performance are worthwhile. 62 61 62 63Significant decrease in positive ratings from 2012 to 2013. No significant change in positive ratings from 2013 to 2014. Significant increase in positive ratings from 2014 to 2015.
45. My supervisor is committed to a workforce representative of all segments of society.
64 65 66 67No significant change in positive ratings
from 2012 to 2013.Significant increase in positive ratings from 2013 to 2014. Significant increase in positive ratings from 2014 to 2015.
46. My supervisor provides me with constructive suggestions to improve my job performance.
61 60 61 61Significant decrease in positive ratings from 2012 to 2013. No significant change in positive ratings from 2013 to 2014. Significant increase in positive ratings from 2014 to 2015.
‡47. Supervisors in my work unit support employee development. 65 64 63 64Significant decrease in positive ratings from 2012 to 2013. Significant decrease in positive ratings from 2013 to 2014. Significant increase in positive ratings from 2014 to 2015.
48. My supervisor listens to what I have to say. 74 74 75 76No significant change in positive ratings
from 2012 to 2013.Significant increase in positive ratings from 2013 to 2014. Significant increase in positive ratings from 2014 to 2015.
49. My supervisor treats me with respect. 79 80 80 81Significant increase in positive ratings from 2012 to 2013. Significant increase in positive ratings from 2013 to 2014. Significant increase in positive ratings from 2014 to 2015.
50. In the last six months, my supervisor has talked with me about my performance.
77 77 77 77No significant change in positive ratings
from 2012 to 2013.Significant increase in positive ratings from 2013 to 2014. No significant change in positive ratings from 2014 to 2015.
‡51. I have trust and confidence in my supervisor. 66 66 65 67No significant change in positive ratings
from 2012 to 2013.Significant decrease in positive ratings from 2013 to 2014. Significant increase in positive ratings from 2014 to 2015.
‡52. Overall, how good a job do you feel is being done by your immediate supervisor?
68 68 69 70No significant change in positive ratings
from 2012 to 2013.Significant increase in positive ratings from 2013 to 2014. Significant increase in positive ratings from 2014 to 2015.
Leadership
‡53. In my organization, senior leaders generate high levels of motivation and commitment in the workforce.
43 41 38 39Significant decrease in positive ratings from 2012 to 2013. Significant decrease in positive ratings from 2013 to 2014. Significant increase in positive ratings from 2014 to 2015.
54. My organization's senior leaders maintain high standards of honesty and integrity. 55 54 50 50Significant decrease in positive ratings from 2012 to 2013. Significant decrease in positive ratings from 2013 to 2014. Significant increase in positive ratings from 2014 to 2015.
‡55. Supervisors work well with employees of different backgrounds. 63 63 63 63Significant decrease in positive ratings from 2012 to 2013. No significant change in positive ratings from 2013 to 2014.No significant change in positive ratings from 2014 to 2015
‡56. Managers communicate the goals and priorities of the organization. 62 61 58 59Significant decrease in positive ratings from 2012 to 2013. Significant decrease in positive ratings from 2013 to 2014. Significant increase in positive ratings from 2014 to 2015.
‡57. Managers review and evaluate the organization's progress toward meeting its goals and objectives.
62 61 58 59Significant decrease in positive ratings from 2012 to 2013. Significant decrease in positive ratings from 2013 to 2014. Significant increase in positive ratings from 2014 to 2015.
58. Managers promote communication among different work units (for example, about projects, goals, needed resources).
53 52 50 51Significant decrease in positive ratings from 2012 to 2013. Significant decrease in positive ratings from 2013 to 2014. Significant increase in positive ratings from 2014 to 2015.
59. Managers support collaboration across work units to accomplish work objectives.
57 56 53 54Significant decrease in positive ratings from 2012 to 2013. Significant decrease in positive ratings from 2013 to 2014. Significant increase in positive ratings from 2014 to 2015.
60. Overall, how good a job do you feel is being done by the manager directly above your immediate supervisor?
58 57 56 57Significant decrease in positive ratings from 2012 to 2013. Significant decrease in positive ratings from 2013 to 2014. Significant increase in positive ratings from 2014 to 2015.
‡61. I have a high level of respect for my organization’s senior leaders. 54 52 50 51Significant decrease in positive ratings from 2012 to 2013. Significant decrease in positive ratings from 2013 to 2014. Significant increase in positive ratings from 2014 to 2015.
62. Senior leaders demonstrate support for Work/Life programs. 54 54 52 53Significant decrease in positive ratings from 2012 to 2013. Significant decrease in positive ratings from 2013 to 2014. Significant increase in positive ratings from 2014 to 2015.
NOTE: Items included on the Annual Employee Survey are noted by a double dagger (‡).
Appendix B: Trend Analysis (continued)
Percent Positive
Significant Trends2012 2013 2014 2015
Appendix B: Trend Analysis
31
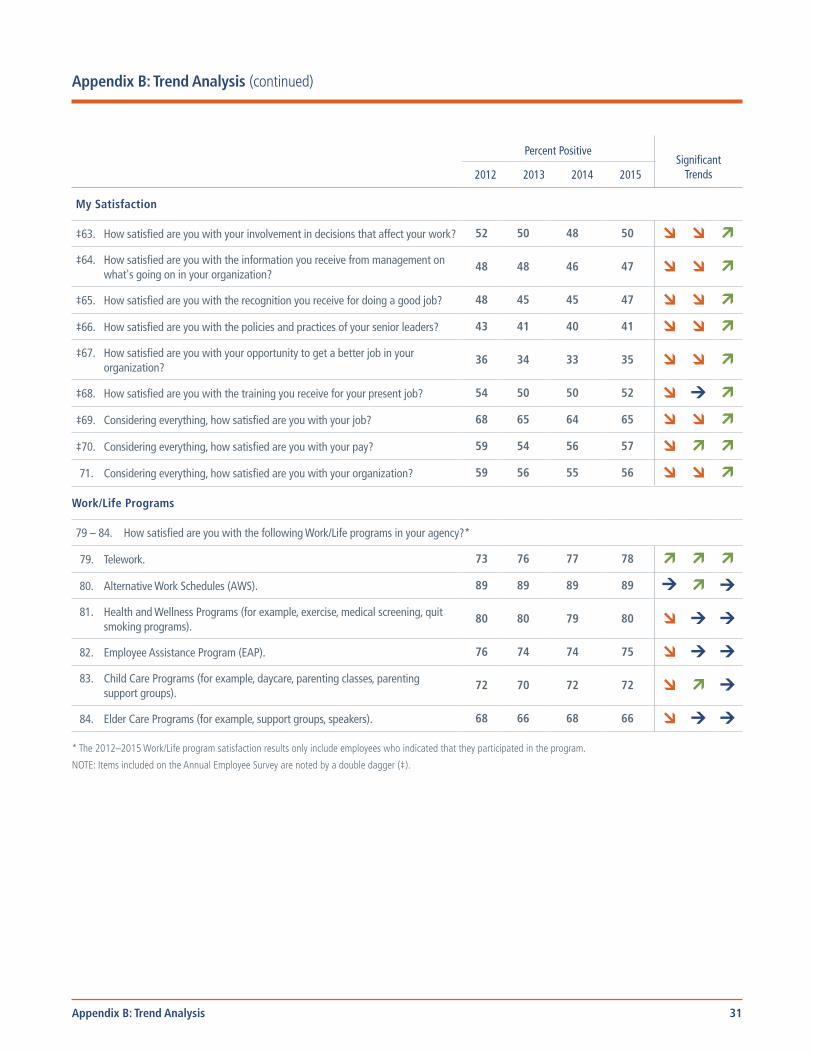
My Satisfaction
‡63. How satisfied are you with your involvement in decisions that affect your work? 52 50 48 50Significant decrease in positive ratings from 2012 to 2013. Significant decrease in positive ratings from 2013 to 2014. Significant increase in positive ratings from 2014 to 2015.
‡64. How satisfied are you with the information you receive from management on what's going on in your organization?
48 48 46 47Significant decrease in positive ratings from 2012 to 2013. Significant decrease in positive ratings from 2013 to 2014. Significant increase in positive ratings from 2014 to 2015.
‡65. How satisfied are you with the recognition you receive for doing a good job? 48 45 45 47Significant decrease in positive ratings from 2012 to 2013. Significant decrease in positive ratings from 2013 to 2014. Significant increase in positive ratings from 2014 to 2015.
‡66. How satisfied are you with the policies and practices of your senior leaders? 43 41 40 41Significant decrease in positive ratings from 2012 to 2013. Significant decrease in positive ratings from 2013 to 2014. Significant increase in positive ratings from 2014 to 2015.
‡67. How satisfied are you with your opportunity to get a better job in your organization?
36 34 33 35Significant decrease in positive ratings from 2012 to 2013. Significant decrease in positive ratings from 2013 to 2014. Significant increase in positive ratings from 2014 to 2015.
‡68. How satisfied are you with the training you receive for your present job? 54 50 50 52Significant decrease in positive ratings from 2012 to 2013. No significant change in positive ratings from 2013 to 2014 Significant increase in positive ratings from 2014 to 2015.
‡69. Considering everything, how satisfied are you with your job? 68 65 64 65Significant decrease in positive ratings from 2012 to 2013. Significant decrease in positive ratings from 2013 to 2014 Significant increase in positive ratings from 2014 to 2015.
‡70. Considering everything, how satisfied are you with your pay? 59 54 56 57Significant decrease in positive ratings from 2012 to 2013. Significant increase in positive ratings from 2013 to 2014. Significant increase in positive ratings from 2014 to 2015.
71. Considering everything, how satisfied are you with your organization? 59 56 55 56Significant decrease in positive ratings from 2012 to 2013. Significant decrease in positive ratings from 2013 to 2014 Significant increase in positive ratings from 2014 to 2015.
Work/Life Programs
79 – 84. How satisfied are you with the following Work/Life programs in your agency?*
79. Telework. 73 76 77 78Significant increase in positive ratings from 2012 to 2013. Significant increase in positive ratings from 2013 to 2014. Significant increase in positive ratings from 2014 to 2015.
80. Alternative Work Schedules (AWS). 89 89 89 89No significant change in positive ratings
from 2012 to 2013.Significant increase in positive ratings from 2013 to 2014. No significant change in positive ratings from 2014 to 2015
81. Health and Wellness Programs (for example, exercise, medical screening, quit smoking programs).
80 80 79 80Significant decrease in positive ratings from 2012 to 2013. No significant change in positive ratings from 2013 to 2014No significant change in positive ratings from 2014 to 2015
82. Employee Assistance Program (EAP). 76 74 74 75Significant decrease in positive ratings from 2012 to 2013. No significant change in positive ratings from 2013 to 2014No significant change in positive ratings from 2014 to 2015
83. Child Care Programs (for example, daycare, parenting classes, parenting support groups).
72 70 72 72Significant decrease in positive ratings from 2012 to 2013. Significant increase in positive ratings from 2013 to 2014. No significant change in positive ratings from 2014 to 2015
84. Elder Care Programs (for example, support groups, speakers). 68 66 68 66Significant decrease in positive ratings from 2012 to 2013. No significant change in positive ratings from 2013 to 2014No significant change in positive ratings from 2014 to 2015
* The 2012–2015 Work/Life program satisfaction results only include employees who indicated that they participated in the program.
NOTE: Items included on the Annual Employee Survey are noted by a double dagger (‡).
Appendix B: Trend Analysis (continued)
Percent Positive
Significant Trends2012 2013 2014 2015
Appendix B: Trend Analysis

32
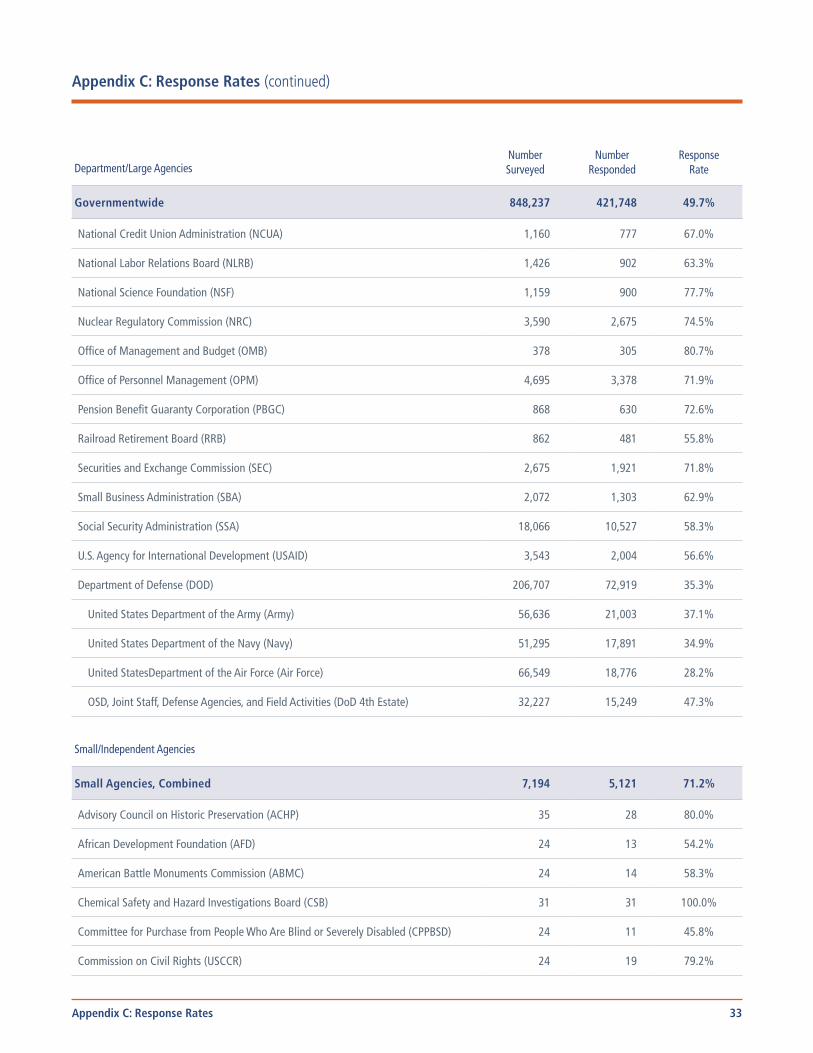
Appendix C: Response Rates
NumberSurveyed
NumberResponded
ResponseRateDepartment/Large Agencies
Governmentwide 848,237 421,748 49.7%
Broadcasting Board of Governors (BBG) 1,484 1,102 74.3%
Court Services and Offender Supervision Agency (CSOSA) 1,107 648 58.5%
Department of Agriculture (USDA) 31,135 20,624 66.2%
Department of Commerce (DOC) 17,515 10,129 57.8%
Department of Education (Educ) 3,717 2,701 72.7%
Department of Energy (DOE) 12,388 8,469 68.4%
Department of Health and Human Services (HHS) 69,008 36,772 53.3%
Department of Homeland Security (DHS) 91,425 43,090 47.1%
Department of Housing and Urban Development (HUD) 7,348 5,404 73.5%
Department of Justice (DOJ) 44,712 20,218 45.2%
Department of Labor (DOL) 14,848 11,359 76.5%
Department of State (State) 7,670 4,060 52.9%
Department of the Interior (DOI) 45,898 26,366 57.4%
Department of the Treasury (Treas) 84,043 51,700 61.5%
Department of Transportation (DOT) 29,298 15,598 53.2%
Department of Veterans Affairs (VA) 89,428 32,236 36.0%
Environmental Protection Agency (EPA) 7,193 4,456 61.9%
Equal Employment Opportunity Commission (EEOC) 2,047 1,247 60.9%
Federal Communications Commission (FCC) 1,573 573 36.4%
Federal Energy Regulatory Commission (FERC) 1,357 996 73.4%
Federal Trade Commission (FTC) 1,034 626 60.5%
General Services Administration (GSA) 10,477 7,874 75.2%
National Aeronautics and Space Administration (NASA) 16,771 9,936 59.2%
National Archives and Records Administration (NARA) 2,366 1,721 72.7%
For Excel version click here
Appendix C: Response Rates
33
National Credit Union Administration (NCUA) 1,160 777 67.0%
National Labor Relations Board (NLRB) 1,426 902 63.3%
National Science Foundation (NSF) 1,159 900 77.7%
Nuclear Regulatory Commission (NRC) 3,590 2,675 74.5%
Office of Management and Budget (OMB) 378 305 80.7%
Office of Personnel Management (OPM) 4,695 3,378 71.9%
Pension Benefit Guaranty Corporation (PBGC) 868 630 72.6%
Railroad Retirement Board (RRB) 862 481 55.8%
Securities and Exchange Commission (SEC) 2,675 1,921 71.8%
Small Business Administration (SBA) 2,072 1,303 62.9%
Social Security Administration (SSA) 18,066 10,527 58.3%
U.S. Agency for International Development (USAID) 3,543 2,004 56.6%
Department of Defense (DOD) 206,707 72,919 35.3%
United States Department of the Army (Army) 56,636 21,003 37.1%
United States Department of the Navy (Navy) 51,295 17,891 34.9%
United StatesDepartment of the Air Force (Air Force) 66,549 18,776 28.2%
OSD, Joint Staff, Defense Agencies, and Field Activities (DoD 4th Estate) 32,227 15,249 47.3%
Small/Independent Agencies
Small Agencies, Combined 7,194 5,121 71.2%
Advisory Council on Historic Preservation (ACHP) 35 28 80.0%
African Development Foundation (AFD) 24 13 54.2%
American Battle Monuments Commission (ABMC) 24 14 58.3%
Chemical Safety and Hazard Investigations Board (CSB) 31 31 100.0%
Committee for Purchase from People Who Are Blind or Severely Disabled (CPPBSD) 24 11 45.8%
Commission on Civil Rights (USCCR) 24 19 79.2%
Department/Large AgenciesNumberSurveyed
NumberResponded
ResponseRate
Governmentwide 848,237 421,748 49.7%
Appendix C: Response Rates (continued)
Appendix C: Response Rates

34
Commodity Futures Trading Commission (CFTC) 617 488 79.1%
Consumer Product Safety Commission (CPSC) 467 299 64.0%
Corporation For National And Community Service (CNCS) 591 492 83.2%
Defense Nuclear Facilities Safety Board (DNFS) 97 81 83.5%
Export-Import Bank of the United States (EXIM) 360 217 60.3%
Farm Credit Administration (FCA) 258 225 87.2%
Farm Credit System Insurance Corporation (FCSIC) 11 9 81.8%
Federal Retirement Thrift Investment Board (FRTIB) 170 142 83.5%
Federal Election Commission (FEC) 294 163 55.4%
Federal Housing Finance Agency (FHFA) 482 350 72.6%
Federal Labor Relations Authority (FLRA) 117 98 83.8%
Federal Maritime Commission (FMC) 98 77 78.6%
Federal Mediation And Conciliation Service (FMCS) 203 164 80.8%
Institute Of Museum And Library Services (IMLS) 59 46 78.0%
Inter-American Foundation (IAF) 35 33 94.3%
Internat Boundary and Water Commission (IBWC) 205 104 50.7%
Marine Mammal Commission (MMC) 10 8 80.0%
Merit Systems Protection Board (MSPB) 192 138 71.9%
National Capital Planning Commission (NCPC) 28 24 85.7%
National Endowment For The Arts (NEA) 95 58 61.1%
National Endowment For The Humanities (NEH) 115 74 64.3%
National Gallery of Art (NGA) 696 456 65.5%
National Indian Gaming Commission (NIGC) 88 67 76.1%
National Mediation Board (NMB) 35 16 45.7%
National Transportation Safety Board (NTSB) 384 228 59.4%
Nuclear Waste Technical Review Board (NWTRB) 10 4 40.0%
Small/Independent AgenciesNumberSurveyed
NumberResponded
ResponseRate
Small Agencies, Combined 7,194 5,121 71.2%
Appendix C: Response Rates (continued)
Appendix C: Response Rates
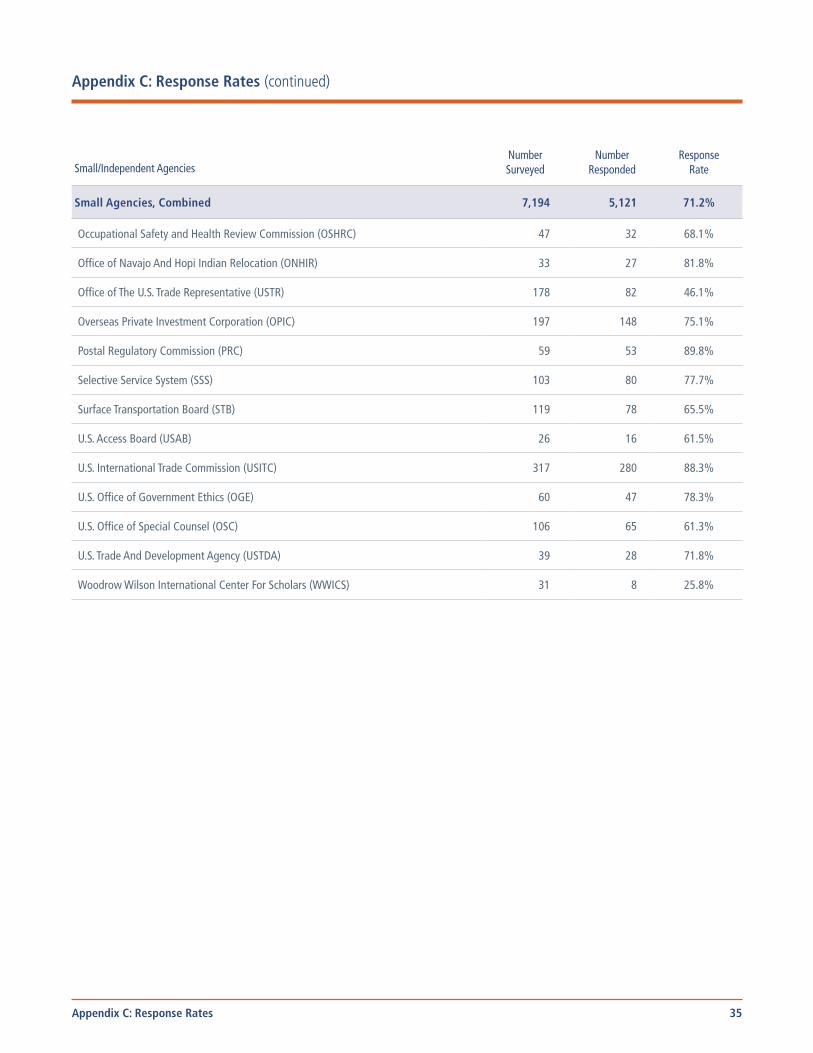
35
Occupational Safety and Health Review Commission (OSHRC) 47 32 68.1%
Office of Navajo And Hopi Indian Relocation (ONHIR) 33 27 81.8%
Office of The U.S. Trade Representative (USTR) 178 82 46.1%
Overseas Private Investment Corporation (OPIC) 197 148 75.1%
Postal Regulatory Commission (PRC) 59 53 89.8%
Selective Service System (SSS) 103 80 77.7%
Surface Transportation Board (STB) 119 78 65.5%
U.S. Access Board (USAB) 26 16 61.5%
U.S. International Trade Commission (USITC) 317 280 88.3%
U.S. Office of Government Ethics (OGE) 60 47 78.3%
U.S. Office of Special Counsel (OSC) 106 65 61.3%
U.S. Trade And Development Agency (USTDA) 39 28 71.8%
Woodrow Wilson International Center For Scholars (WWICS) 31 8 25.8%
Small/Independent AgenciesNumberSurveyed
NumberResponded
ResponseRate
Small Agencies, Combined 7,194 5,121 71.2%
Appendix C: Response Rates (continued)
Appendix C: Response Rates

36
Appendix D: Governmentwide Respondent Characteristics
NumberResponded Percentage
Work Location
Headquarters 156,969 39%
Field 241,047 61%
Supervisory Status
Non-Supervisor 262,018 65%
Team Leader 53,511 13%
Supervisor 52,669 13%
Manager 24,425 6%
Senior Leader 8,076 2%
Gender
Male 205,866 52%
Female 189,512 48%
Ethnicity
Hispanic/Latino 34,074 9%
Not Hispanic/Latino 357,460 91%
Race/National Origin
American Indian or Alaska Native 8,403 2%
Asian 18,755 5%
Black or African American 60,497 16%
Native Hawaiian or Other Pacific Islander 2,486 1%
White 274,753 72%
Two or more races 14,519 4%
For Excel version click here
Appendix D: Governmentwide Respondent Characteristics

37
Highest Level of Education Completed
Less than High School 415 0%
High School Diploma/GED or equivalent 19,471 5%
Trade or Technical Certificate 9,624 2%
Some College (no degree) 60,499 15%
Associate's Degree (e.g., AA, AS) 31,501 8%
Bachelor's Degree (e.g., BA, BS) 136,286 34%
Master's Degree (e.g., MA, MS, MBA) 98,552 25%
Doctoral/Professional Degree (e.g., Ph.D., MD, JD) 41,166 10%
Pay Category
Federal Wage System 12,724 3%
GS 1 – 6 22,098 6%
GS 7 – 12 167,199 42%
GS 13 – 15 162,989 41%
Senior Executive Service 5,728 1%
Senior Level (SL) or Scientific or Professional (ST) 1,546 0%
Other 25,733 6%
Time in Federal Government
Less than 1 year 6,061 2%
1 to 3 years 28,371 7%
4 to 5 years 41,255 10%
6 to 10 years 88,183 22%
11 to 14 years 57,014 14%
15 to 20 years 49,014 12%
More than 20 years 128,964 32%
Appendix D: Governmentwide Respondent Characteristics (continued)
NumberResponded Percentage
Appendix D: Governmentwide Respondent Characteristics
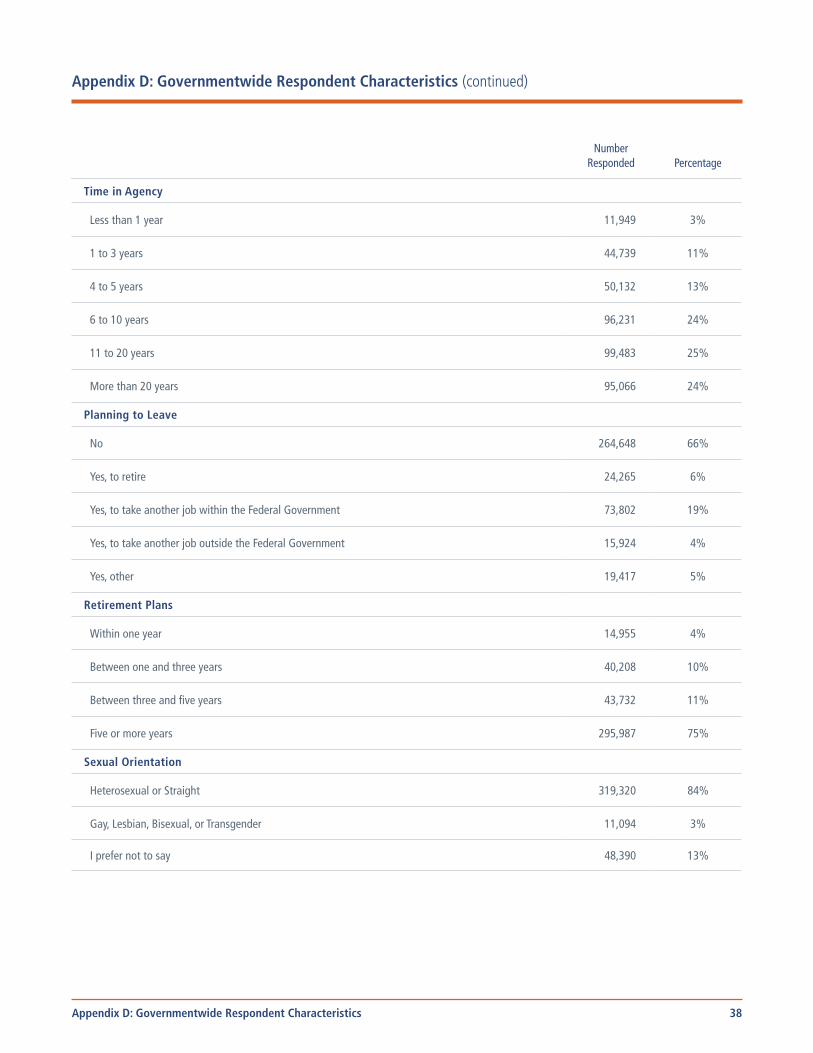
38
Time in Agency
Less than 1 year 11,949 3%
1 to 3 years 44,739 11%
4 to 5 years 50,132 13%
6 to 10 years 96,231 24%
11 to 20 years 99,483 25%
More than 20 years 95,066 24%
Planning to Leave
No 264,648 66%
Yes, to retire 24,265 6%
Yes, to take another job within the Federal Government 73,802 19%
Yes, to take another job outside the Federal Government 15,924 4%
Yes, other 19,417 5%
Retirement Plans
Within one year 14,955 4%
Between one and three years 40,208 10%
Between three and five years 43,732 11%
Five or more years 295,987 75%
Sexual Orientation
Heterosexual or Straight 319,320 84%
Gay, Lesbian, Bisexual, or Transgender 11,094 3%
I prefer not to say 48,390 13%
Appendix D: Governmentwide Respondent Characteristics (continued)
NumberResponded Percentage
Appendix D: Governmentwide Respondent Characteristics
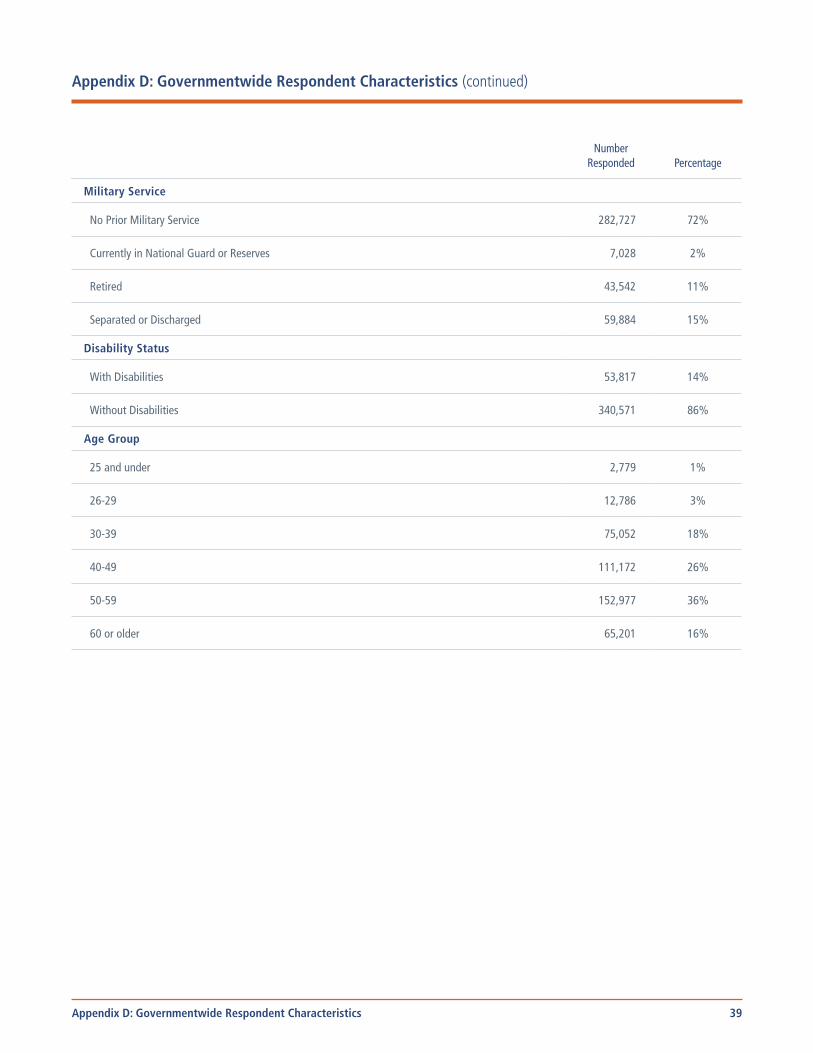
39
Military Service
No Prior Military Service 282,727 72%
Currently in National Guard or Reserves 7,028 2%
Retired 43,542 11%
Separated or Discharged 59,884 15%
Disability Status
With Disabilities 53,817 14%
Without Disabilities 340,571 86%
Age Group
25 and under 2,779 1%
26-29 12,786 3%
30-39 75,052 18%
40-49 111,172 26%
50-59 152,977 36%
60 or older 65,201 16%
Appendix D: Governmentwide Respondent Characteristics (continued)
NumberResponded Percentage
Appendix D: Governmentwide Respondent Characteristics
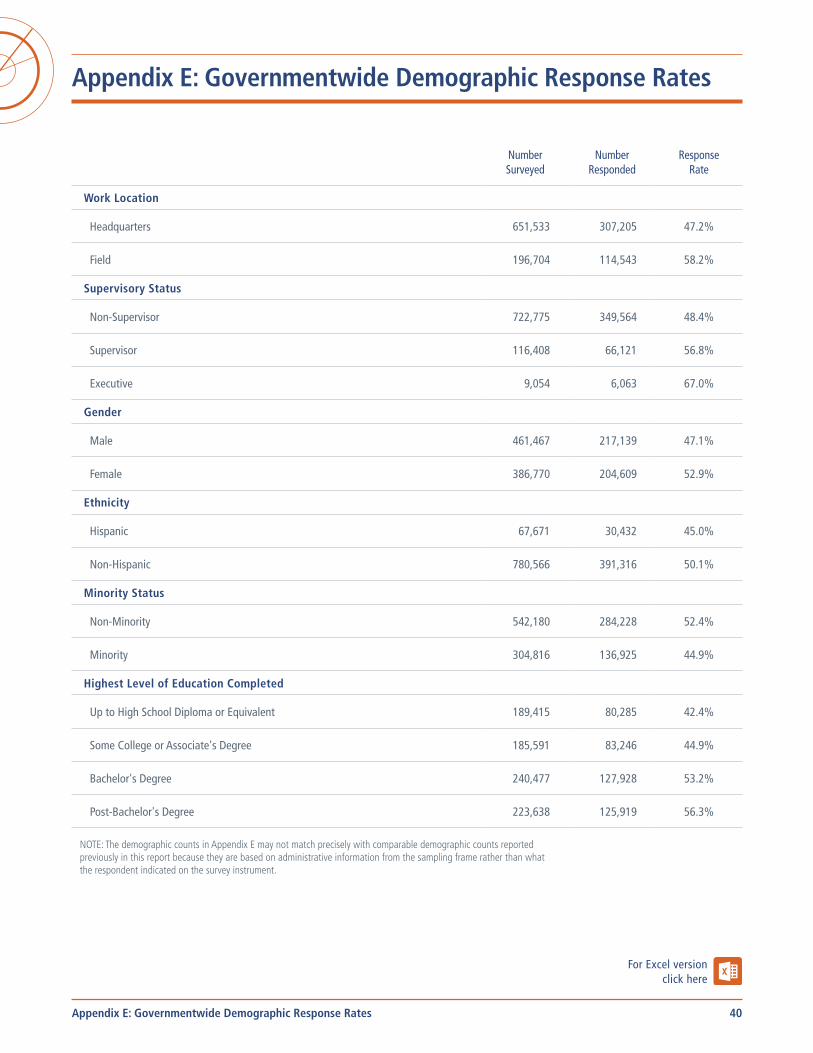
40
Appendix E: Governmentwide Demographic Response Rates
NumberSurveyed
NumberResponded
ResponseRate
Work Location
Headquarters 651,533 307,205 47.2%
Field 196,704 114,543 58.2%
Supervisory Status
Non-Supervisor 722,775 349,564 48.4%
Supervisor 116,408 66,121 56.8%
Executive 9,054 6,063 67.0%
Gender
Male 461,467 217,139 47.1%
Female 386,770 204,609 52.9%
Ethnicity
Hispanic 67,671 30,432 45.0%
Non-Hispanic 780,566 391,316 50.1%
Minority Status
Non-Minority 542,180 284,228 52.4%
Minority 304,816 136,925 44.9%
Highest Level of Education Completed
Up to High School Diploma or Equivalent 189,415 80,285 42.4%
Some College or Associate's Degree 185,591 83,246 44.9%
Bachelor's Degree 240,477 127,928 53.2%
Post-Bachelor's Degree 223,638 125,919 56.3%
NOTE: The demographic counts in Appendix E may not match precisely with comparable demographic counts reported previously in this report because they are based on administrative information from the sampling frame rather than what the respondent indicated on the survey instrument.
For Excel version click here
Appendix E: Governmentwide Demographic Response Rates
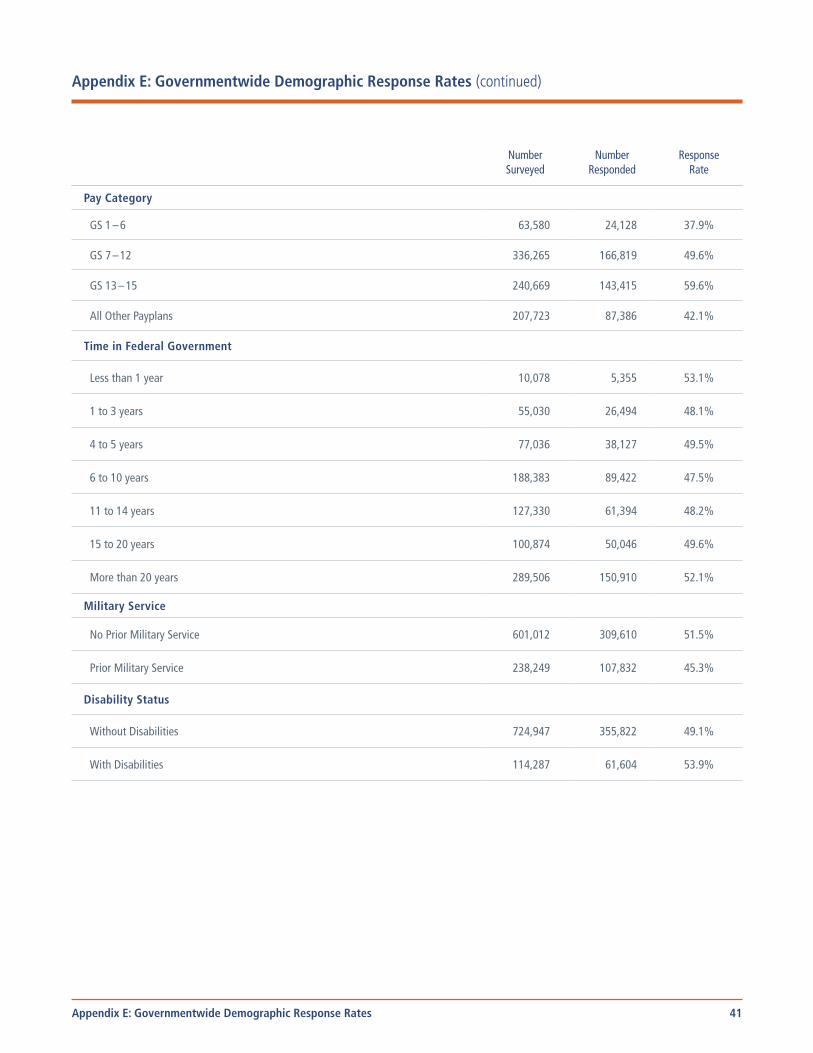
41
Pay Category
GS 1 – 6 63,580 24,128 37.9%
GS 7 – 12 336,265 166,819 49.6%
GS 13 – 15 240,669 143,415 59.6%
All Other Payplans 207,723 87,386 42.1%
Time in Federal Government
Less than 1 year 10,078 5,355 53.1%
1 to 3 years 55,030 26,494 48.1%
4 to 5 years 77,036 38,127 49.5%
6 to 10 years 188,383 89,422 47.5%
11 to 14 years 127,330 61,394 48.2%
15 to 20 years 100,874 50,046 49.6%
More than 20 years 289,506 150,910 52.1%
Military Service
No Prior Military Service 601,012 309,610 51.5%
Prior Military Service 238,249 107,832 45.3%
Disability Status
Without Disabilities 724,947 355,822 49.1%
With Disabilities 114,287 61,604 53.9%
Appendix E: Governmentwide Demographic Response Rates (continued)
NumberSurveyed
NumberResponded
ResponseRate
Appendix E: Governmentwide Demographic Response Rates
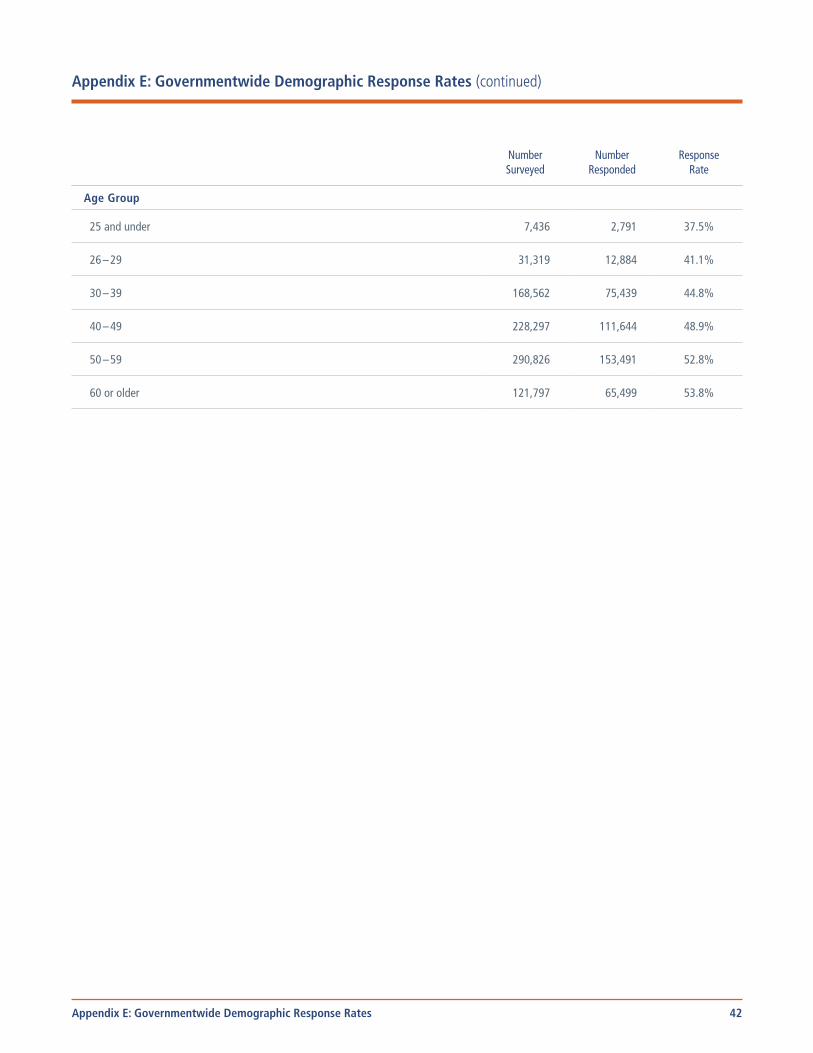
42
Age Group
25 and under 7,436 2,791 37.5%
26 – 29 31,319 12,884 41.1%
30 – 39 168,562 75,439 44.8%
40 – 49 228,297 111,644 48.9%
50 – 59 290,826 153,491 52.8%
60 or older 121,797 65,499 53.8%
Appendix E: Governmentwide Demographic Response Rates (continued)
NumberSurveyed
NumberResponded
ResponseRate
Appendix E: Governmentwide Demographic Response Rates

43
Appendix F: Engagement Index Trends
F1: Engagement Index Trends
2011 2012 2013 2014 2015Department/Large Agencies
Governmentwide 67 65 64 63 64
Broadcasting Board of Governors 57 56 58 56 58
Court Services and Offender Supervision Agency 70 67 65 63 68
Department of Agriculture 65 63 63 63 64
Department of Commerce 70 70 70 70 68
Department of Defense, Combined 68 67 65 64 65
Department of the Army 68 66 63 63 64
Department of the Navy 68 68 66 65 66
Department of the Air Force 67 67 66 65 67
OSD, Joint Staff, Defense Agencies, and Field Activities (DoD 4th Estate) 66 66 65 64 65
Department of Education 64 65 66 67 68
Department of Energy 63 65 64 61 64
Department of Health and Human Services 65 66 66 66 68
Department of Homeland Security 60 58 56 54 53
Department of Housing and Urban Development 61 62 57 57 62
Department of Justice 69 67 66 66 68
Department of Labor 64 64 62 64 67
Department of State 72 71 69 70 70
Department of the Interior 64 64 62 61 62
Department of the Treasury 70 69 67 66 66
Department of Transportation 63 64 65 64 66
Department of Veterans Affairs 65 62 63 61 61
Environmental Protection Agency 67 68 64 63 63
Equal Employment Opportunity Commission 65 67 65 65 67
The Engagement Index assesses the critical conditions conducive for employee engagement (e.g., effective leadership, work which provides meaning to employees, etc.). It is made up of three subfactors: Leaders Lead, Supervisors, and Intrinsic Work Experience.
For Excel version click here
Appendix F1: Engagement Index Trends
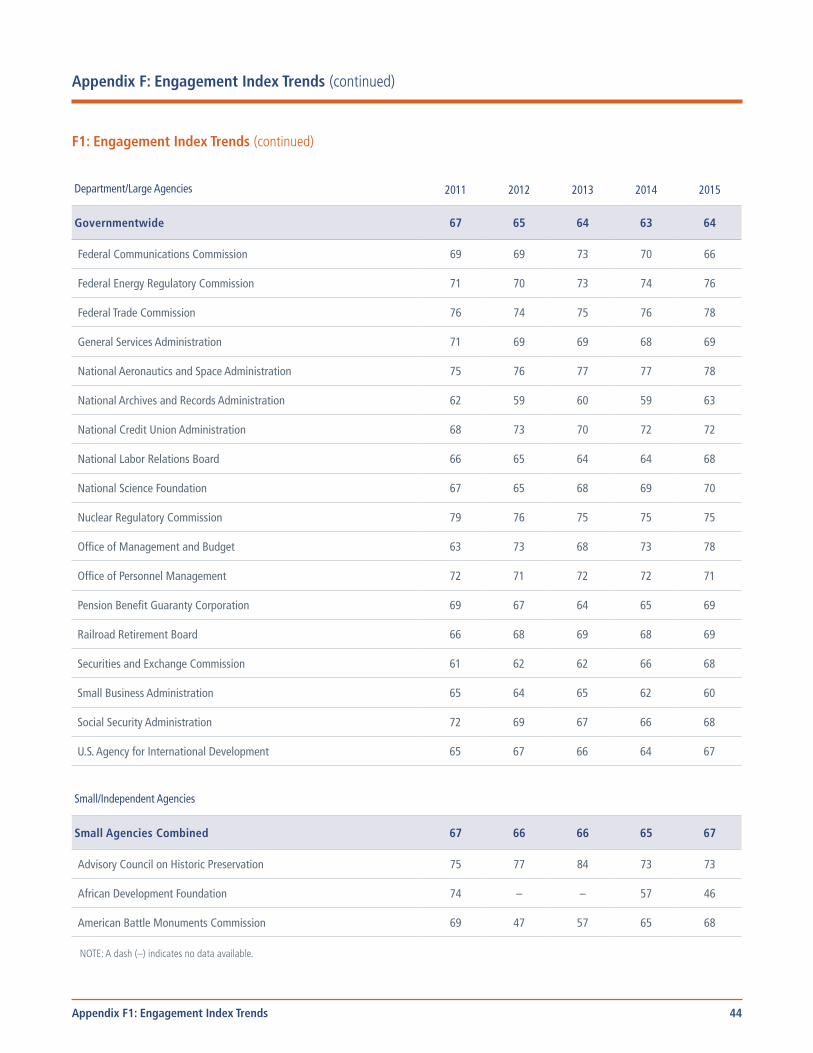
44
Federal Communications Commission 69 69 73 70 66
Federal Energy Regulatory Commission 71 70 73 74 76
Federal Trade Commission 76 74 75 76 78
General Services Administration 71 69 69 68 69
National Aeronautics and Space Administration 75 76 77 77 78
National Archives and Records Administration 62 59 60 59 63
National Credit Union Administration 68 73 70 72 72
National Labor Relations Board 66 65 64 64 68
National Science Foundation 67 65 68 69 70
Nuclear Regulatory Commission 79 76 75 75 75
Office of Management and Budget 63 73 68 73 78
Office of Personnel Management 72 71 72 72 71
Pension Benefit Guaranty Corporation 69 67 64 65 69
Railroad Retirement Board 66 68 69 68 69
Securities and Exchange Commission 61 62 62 66 68
Small Business Administration 65 64 65 62 60
Social Security Administration 72 69 67 66 68
U.S. Agency for International Development 65 67 66 64 67
Small/Independent Agencies
Small Agencies Combined 67 66 66 65 67
Advisory Council on Historic Preservation 75 77 84 73 73
African Development Foundation 74 – – 57 46
American Battle Monuments Commission 69 47 57 65 68
NOTE: A dash (–) indicates no data available.
Appendix F: Engagement Index Trends (continued)
F1: Engagement Index Trends (continued)
Department/Large Agencies 2011 2012 2013 2014 2015
Governmentwide 67 65 64 63 64
Appendix F1: Engagement Index Trends
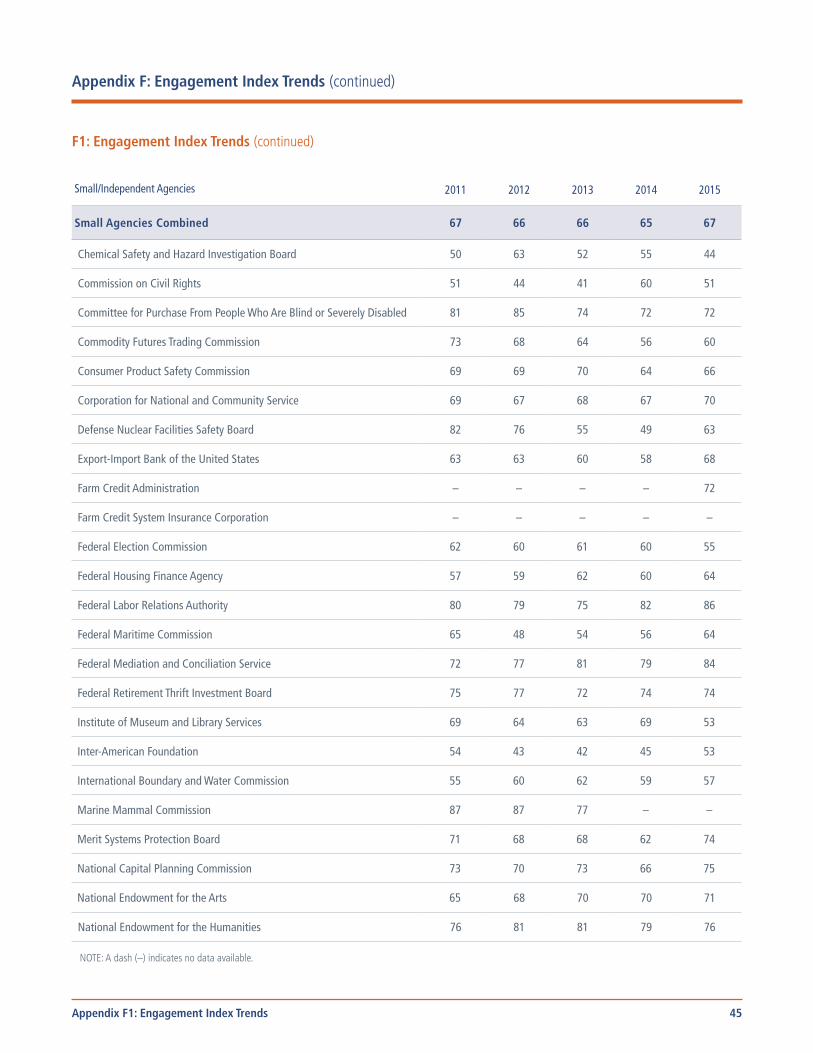
45
Chemical Safety and Hazard Investigation Board 50 63 52 55 44
Commission on Civil Rights 51 44 41 60 51
Committee for Purchase From People Who Are Blind or Severely Disabled 81 85 74 72 72
Commodity Futures Trading Commission 73 68 64 56 60
Consumer Product Safety Commission 69 69 70 64 66
Corporation for National and Community Service 69 67 68 67 70
Defense Nuclear Facilities Safety Board 82 76 55 49 63
Export-Import Bank of the United States 63 63 60 58 68
Farm Credit Administration – – – – 72
Farm Credit System Insurance Corporation – – – – –
Federal Election Commission 62 60 61 60 55
Federal Housing Finance Agency 57 59 62 60 64
Federal Labor Relations Authority 80 79 75 82 86
Federal Maritime Commission 65 48 54 56 64
Federal Mediation and Conciliation Service 72 77 81 79 84
Federal Retirement Thrift Investment Board 75 77 72 74 74
Institute of Museum and Library Services 69 64 63 69 53
Inter-American Foundation 54 43 42 45 53
International Boundary and Water Commission 55 60 62 59 57
Marine Mammal Commission 87 87 77 – –
Merit Systems Protection Board 71 68 68 62 74
National Capital Planning Commission 73 70 73 66 75
National Endowment for the Arts 65 68 70 70 71
National Endowment for the Humanities 76 81 81 79 76
NOTE: A dash (–) indicates no data available.
Appendix F: Engagement Index Trends (continued)
F1: Engagement Index Trends (continued)
Small/Independent Agencies 2011 2012 2013 2014 2015
Small Agencies Combined 67 66 66 65 67
Appendix F1: Engagement Index Trends
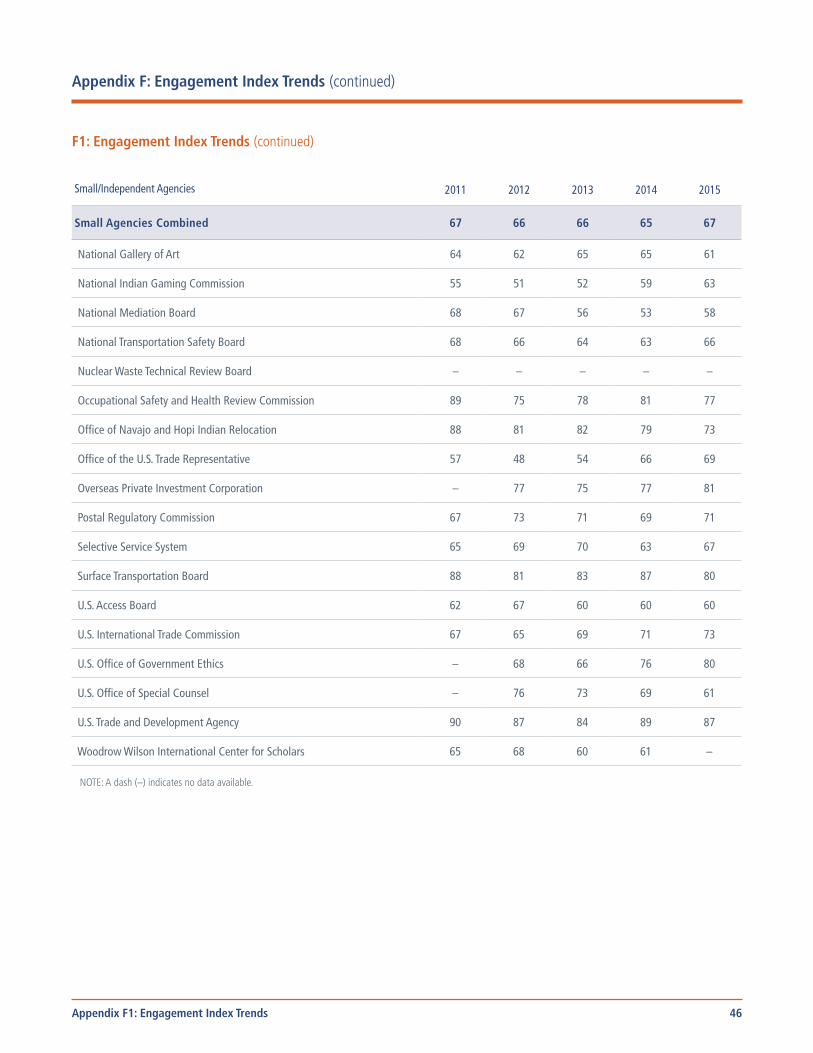
46
National Gallery of Art 64 62 65 65 61
National Indian Gaming Commission 55 51 52 59 63
National Mediation Board 68 67 56 53 58
National Transportation Safety Board 68 66 64 63 66
Nuclear Waste Technical Review Board – – – – –
Occupational Safety and Health Review Commission 89 75 78 81 77
Office of Navajo and Hopi Indian Relocation 88 81 82 79 73
Office of the U.S. Trade Representative 57 48 54 66 69
Overseas Private Investment Corporation – 77 75 77 81
Postal Regulatory Commission 67 73 71 69 71
Selective Service System 65 69 70 63 67
Surface Transportation Board 88 81 83 87 80
U.S. Access Board 62 67 60 60 60
U.S. International Trade Commission 67 65 69 71 73
U.S. Office of Government Ethics – 68 66 76 80
U.S. Office of Special Counsel – 76 73 69 61
U.S. Trade and Development Agency 90 87 84 89 87
Woodrow Wilson International Center for Scholars 65 68 60 61 –
NOTE: A dash (–) indicates no data available.
Appendix F: Engagement Index Trends (continued)
F1: Engagement Index Trends (continued)
Small/Independent Agencies 2011 2012 2013 2014 2015
Small Agencies Combined 67 66 66 65 67
Appendix F1: Engagement Index Trends
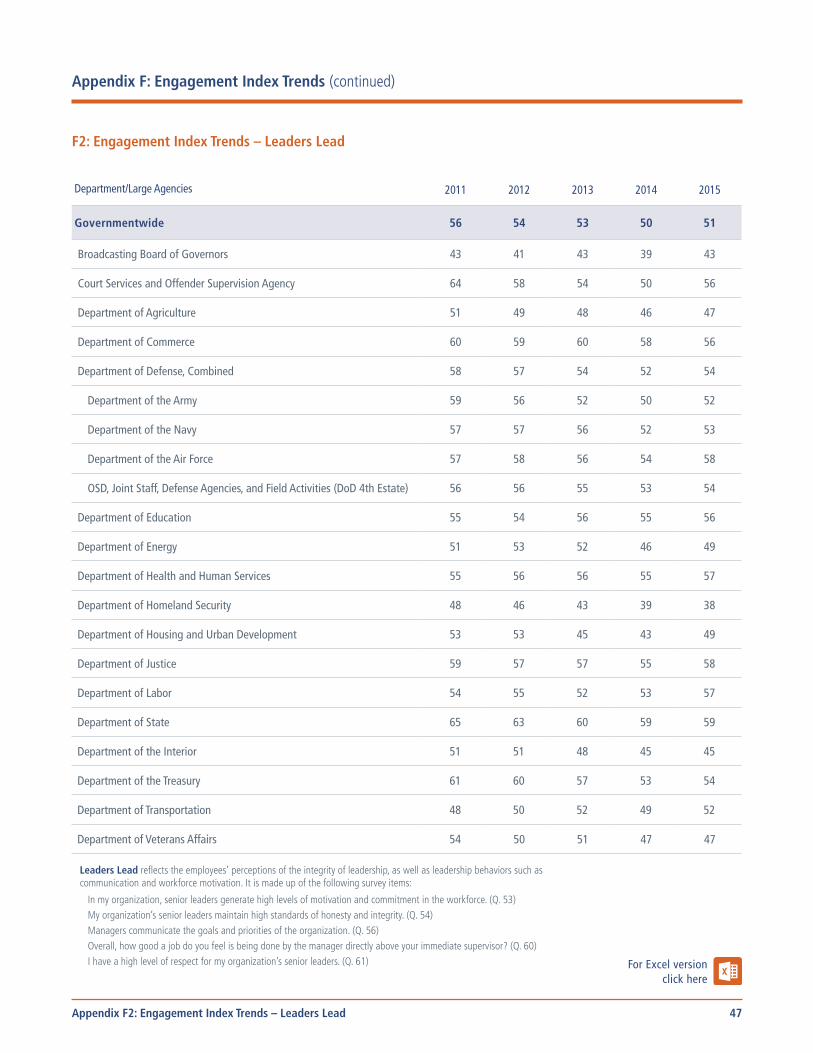
47
F2: Engagement Index Trends – Leaders Lead
2011 2012 2013 2014 2015Department/Large Agencies
Governmentwide 56 54 53 50 51
Broadcasting Board of Governors 43 41 43 39 43
Court Services and Offender Supervision Agency 64 58 54 50 56
Department of Agriculture 51 49 48 46 47
Department of Commerce 60 59 60 58 56
Department of Defense, Combined 58 57 54 52 54
Department of the Army 59 56 52 50 52
Department of the Navy 57 57 56 52 53
Department of the Air Force 57 58 56 54 58
OSD, Joint Staff, Defense Agencies, and Field Activities (DoD 4th Estate) 56 56 55 53 54
Department of Education 55 54 56 55 56
Department of Energy 51 53 52 46 49
Department of Health and Human Services 55 56 56 55 57
Department of Homeland Security 48 46 43 39 38
Department of Housing and Urban Development 53 53 45 43 49
Department of Justice 59 57 57 55 58
Department of Labor 54 55 52 53 57
Department of State 65 63 60 59 59
Department of the Interior 51 51 48 45 45
Department of the Treasury 61 60 57 53 54
Department of Transportation 48 50 52 49 52
Department of Veterans Affairs 54 50 51 47 47
Leaders Lead reflects the employees’ perceptions of the integrity of leadership, as well as leadership behaviors such as communication and workforce motivation. It is made up of the following survey items:
In my organization, senior leaders generate high levels of motivation and commitment in the workforce. (Q. 53) My organization’s senior leaders maintain high standards of honesty and integrity. (Q. 54) Managers communicate the goals and priorities of the organization. (Q. 56) Overall, how good a job do you feel is being done by the manager directly above your immediate supervisor? (Q. 60) I have a high level of respect for my organization’s senior leaders. (Q. 61)
Appendix F: Engagement Index Trends (continued)
Appendix F2: Engagement Index Trends – Leaders Lead
For Excel version click here
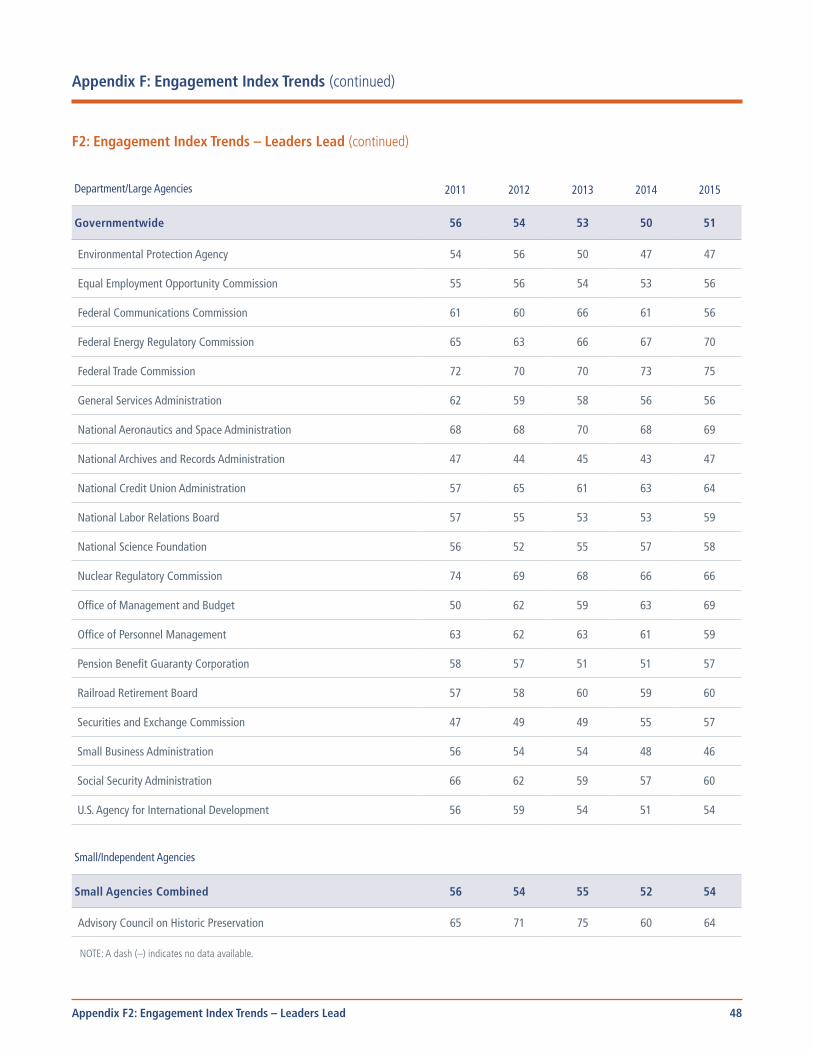
48
Environmental Protection Agency 54 56 50 47 47
Equal Employment Opportunity Commission 55 56 54 53 56
Federal Communications Commission 61 60 66 61 56
Federal Energy Regulatory Commission 65 63 66 67 70
Federal Trade Commission 72 70 70 73 75
General Services Administration 62 59 58 56 56
National Aeronautics and Space Administration 68 68 70 68 69
National Archives and Records Administration 47 44 45 43 47
National Credit Union Administration 57 65 61 63 64
National Labor Relations Board 57 55 53 53 59
National Science Foundation 56 52 55 57 58
Nuclear Regulatory Commission 74 69 68 66 66
Office of Management and Budget 50 62 59 63 69
Office of Personnel Management 63 62 63 61 59
Pension Benefit Guaranty Corporation 58 57 51 51 57
Railroad Retirement Board 57 58 60 59 60
Securities and Exchange Commission 47 49 49 55 57
Small Business Administration 56 54 54 48 46
Social Security Administration 66 62 59 57 60
U.S. Agency for International Development 56 59 54 51 54
Small/Independent Agencies
Small Agencies Combined 56 54 55 52 54
Advisory Council on Historic Preservation 65 71 75 60 64
NOTE: A dash (–) indicates no data available.
Appendix F: Engagement Index Trends (continued)
F2: Engagement Index Trends – Leaders Lead (continued)
Department/Large Agencies 2011 2012 2013 2014 2015
Governmentwide 56 54 53 50 51
Appendix F2: Engagement Index Trends – Leaders Lead
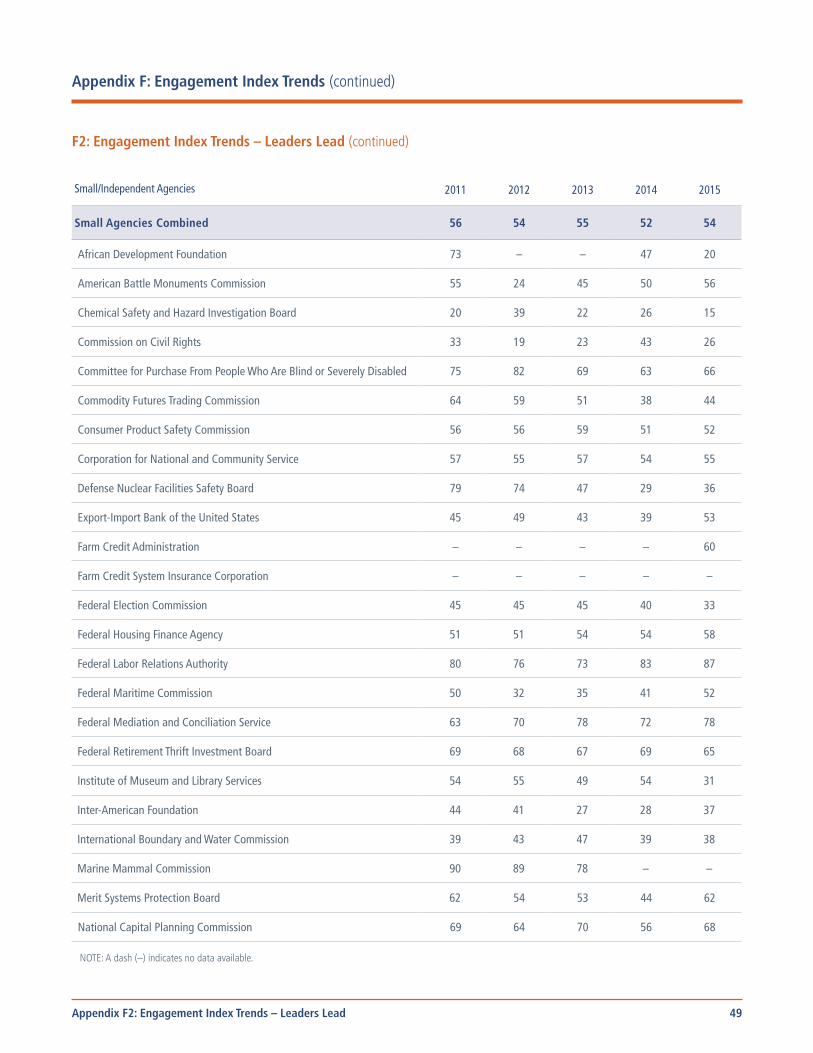
49
African Development Foundation 73 – – 47 20
American Battle Monuments Commission 55 24 45 50 56
Chemical Safety and Hazard Investigation Board 20 39 22 26 15
Commission on Civil Rights 33 19 23 43 26
Committee for Purchase From People Who Are Blind or Severely Disabled 75 82 69 63 66
Commodity Futures Trading Commission 64 59 51 38 44
Consumer Product Safety Commission 56 56 59 51 52
Corporation for National and Community Service 57 55 57 54 55
Defense Nuclear Facilities Safety Board 79 74 47 29 36
Export-Import Bank of the United States 45 49 43 39 53
Farm Credit Administration – – – – 60
Farm Credit System Insurance Corporation – – – – –
Federal Election Commission 45 45 45 40 33
Federal Housing Finance Agency 51 51 54 54 58
Federal Labor Relations Authority 80 76 73 83 87
Federal Maritime Commission 50 32 35 41 52
Federal Mediation and Conciliation Service 63 70 78 72 78
Federal Retirement Thrift Investment Board 69 68 67 69 65
Institute of Museum and Library Services 54 55 49 54 31
Inter-American Foundation 44 41 27 28 37
International Boundary and Water Commission 39 43 47 39 38
Marine Mammal Commission 90 89 78 – –
Merit Systems Protection Board 62 54 53 44 62
National Capital Planning Commission 69 64 70 56 68
NOTE: A dash (–) indicates no data available.
Appendix F: Engagement Index Trends (continued)
F2: Engagement Index Trends – Leaders Lead (continued)
Small/Independent Agencies 2011 2012 2013 2014 2015
Small Agencies Combined 56 54 55 52 54
Appendix F2: Engagement Index Trends – Leaders Lead

50
National Endowment for the Arts 44 50 58 53 59
National Endowment for the Humanities 67 73 76 74 68
National Gallery of Art 52 49 53 55 48
National Indian Gaming Commission 38 36 38 56 60
National Mediation Board 54 59 42 38 45
National Transportation Safety Board 60 53 49 45 50
Nuclear Waste Technical Review Board – – – – –
Occupational Safety and Health Review Commission 85 78 76 75 76
Office of Navajo and Hopi Indian Relocation 83 73 74 68 61
Office of the U.S. Trade Representative 41 24 28 59 65
Overseas Private Investment Corporation – 70 67 71 76
Postal Regulatory Commission 58 61 60 67 66
Selective Service System 62 63 63 53 49
Surface Transportation Board 88 79 78 82 76
U.S. Access Board 51 53 51 43 48
U.S. International Trade Commission 54 48 59 59 61
U.S. Office of Government Ethics – 58 63 67 74
U.S. Office of Special Counsel – 64 59 56 46
U.S. Trade and Development Agency 90 86 83 87 85
Woodrow Wilson International Center for Scholars 59 58 49 48 –
NOTE: A dash (–) indicates no data available.
Appendix F: Engagement Index Trends (continued)
F2: Engagement Index Trends – Leaders Lead (continued)
Small/Independent Agencies 2011 2012 2013 2014 2015
Small Agencies Combined 56 54 55 52 54
Appendix F2: Engagement Index Trends – Leaders Lead
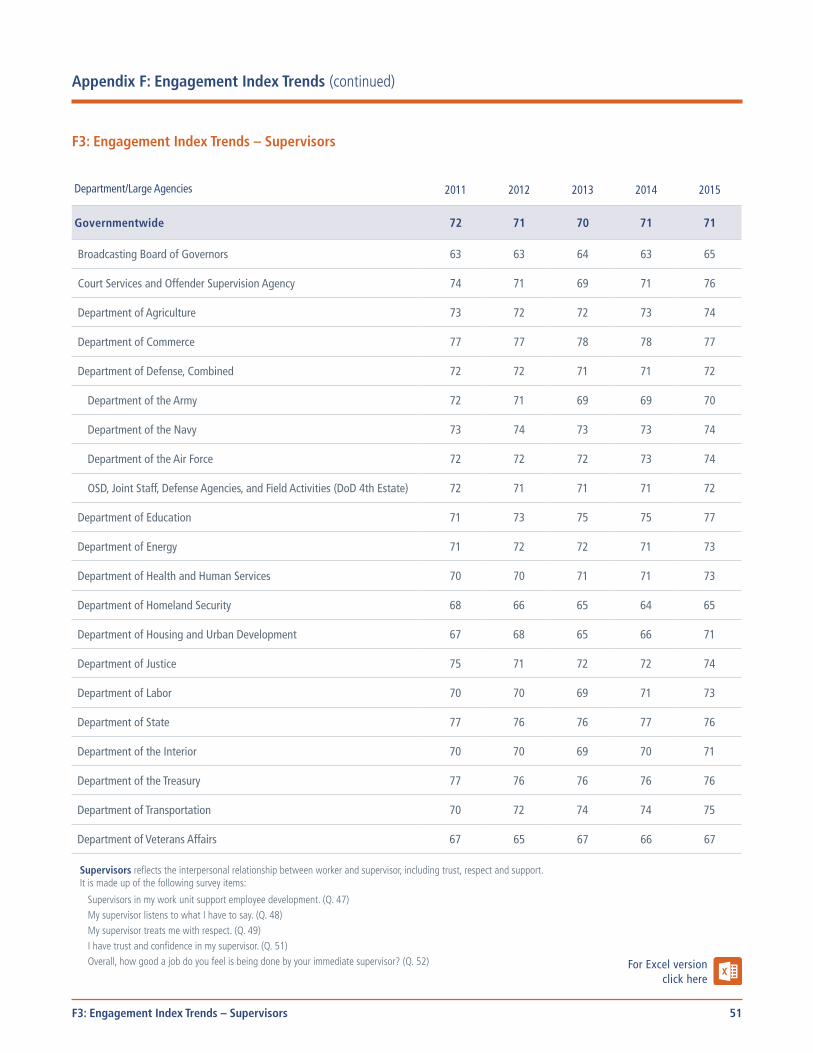
51
F3: Engagement Index Trends – Supervisors
2011 2012 2013 2014 2015Department/Large Agencies
Governmentwide 72 71 70 71 71
Broadcasting Board of Governors 63 63 64 63 65
Court Services and Offender Supervision Agency 74 71 69 71 76
Department of Agriculture 73 72 72 73 74
Department of Commerce 77 77 78 78 77
Department of Defense, Combined 72 72 71 71 72
Department of the Army 72 71 69 69 70
Department of the Navy 73 74 73 73 74
Department of the Air Force 72 72 72 73 74
OSD, Joint Staff, Defense Agencies, and Field Activities (DoD 4th Estate) 72 71 71 71 72
Department of Education 71 73 75 75 77
Department of Energy 71 72 72 71 73
Department of Health and Human Services 70 70 71 71 73
Department of Homeland Security 68 66 65 64 65
Department of Housing and Urban Development 67 68 65 66 71
Department of Justice 75 71 72 72 74
Department of Labor 70 70 69 71 73
Department of State 77 76 76 77 76
Department of the Interior 70 70 69 70 71
Department of the Treasury 77 76 76 76 76
Department of Transportation 70 72 74 74 75
Department of Veterans Affairs 67 65 67 66 67
Supervisors reflects the interpersonal relationship between worker and supervisor, including trust, respect and support. It is made up of the following survey items:
Supervisors in my work unit support employee development. (Q. 47) My supervisor listens to what I have to say. (Q. 48) My supervisor treats me with respect. (Q. 49) I have trust and confidence in my supervisor. (Q. 51) Overall, how good a job do you feel is being done by your immediate supervisor? (Q. 52)
Appendix F: Engagement Index Trends (continued)
F3: Engagement Index Trends – Supervisors
For Excel version click here
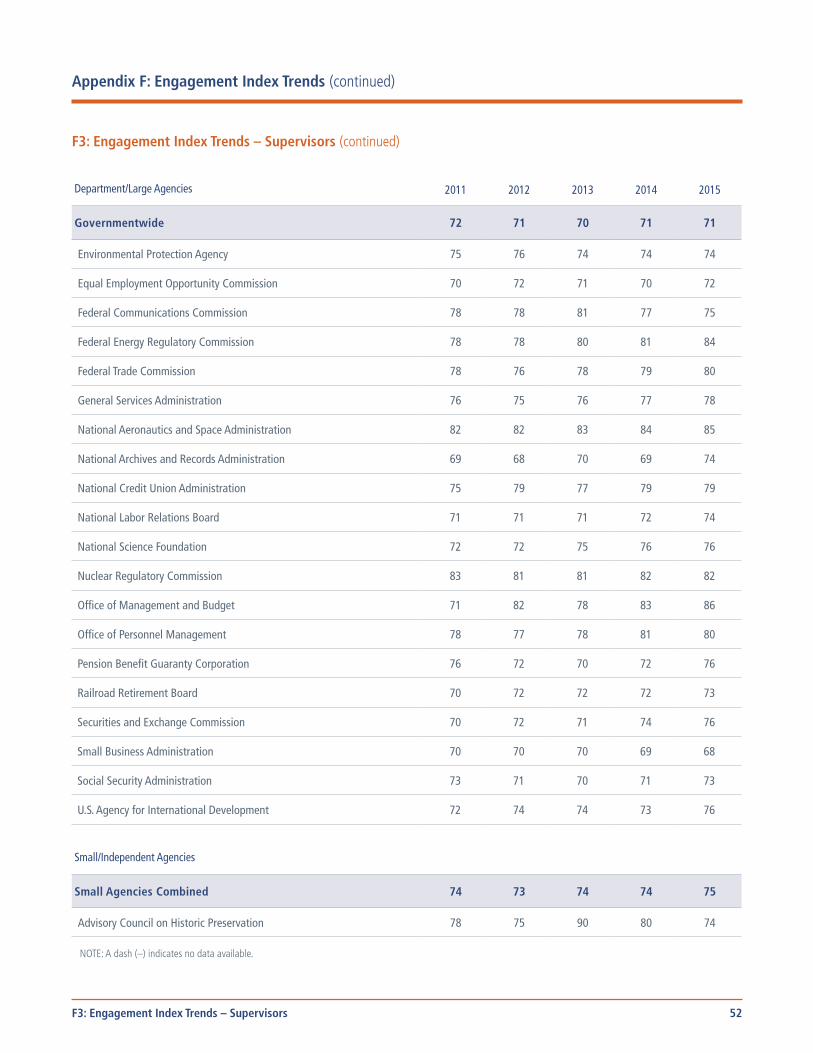
52
Environmental Protection Agency 75 76 74 74 74
Equal Employment Opportunity Commission 70 72 71 70 72
Federal Communications Commission 78 78 81 77 75
Federal Energy Regulatory Commission 78 78 80 81 84
Federal Trade Commission 78 76 78 79 80
General Services Administration 76 75 76 77 78
National Aeronautics and Space Administration 82 82 83 84 85
National Archives and Records Administration 69 68 70 69 74
National Credit Union Administration 75 79 77 79 79
National Labor Relations Board 71 71 71 72 74
National Science Foundation 72 72 75 76 76
Nuclear Regulatory Commission 83 81 81 82 82
Office of Management and Budget 71 82 78 83 86
Office of Personnel Management 78 77 78 81 80
Pension Benefit Guaranty Corporation 76 72 70 72 76
Railroad Retirement Board 70 72 72 72 73
Securities and Exchange Commission 70 72 71 74 76
Small Business Administration 70 70 70 69 68
Social Security Administration 73 71 70 71 73
U.S. Agency for International Development 72 74 74 73 76
Small/Independent Agencies
Small Agencies Combined 74 73 74 74 75
Advisory Council on Historic Preservation 78 75 90 80 74
NOTE: A dash (–) indicates no data available.
Appendix F: Engagement Index Trends (continued)
F3: Engagement Index Trends – Supervisors (continued)
Department/Large Agencies 2011 2012 2013 2014 2015
Governmentwide 72 71 70 71 71
F3: Engagement Index Trends – Supervisors
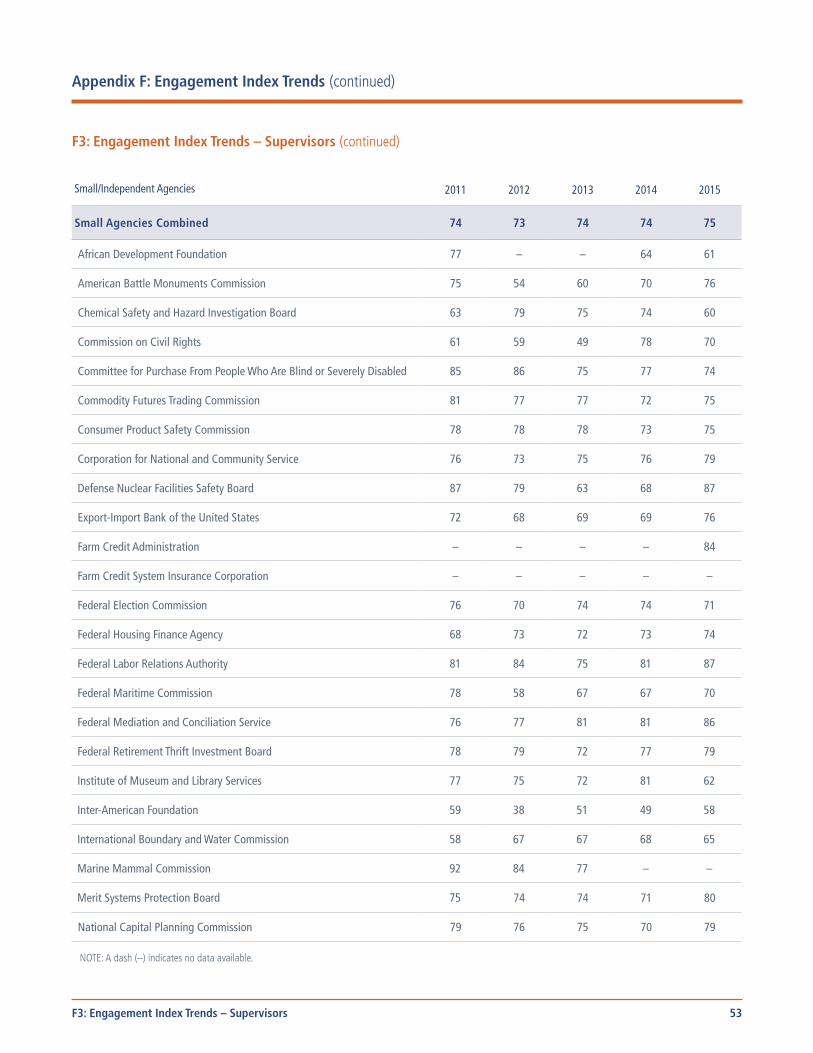
53
African Development Foundation 77 – – 64 61
American Battle Monuments Commission 75 54 60 70 76
Chemical Safety and Hazard Investigation Board 63 79 75 74 60
Commission on Civil Rights 61 59 49 78 70
Committee for Purchase From People Who Are Blind or Severely Disabled 85 86 75 77 74
Commodity Futures Trading Commission 81 77 77 72 75
Consumer Product Safety Commission 78 78 78 73 75
Corporation for National and Community Service 76 73 75 76 79
Defense Nuclear Facilities Safety Board 87 79 63 68 87
Export-Import Bank of the United States 72 68 69 69 76
Farm Credit Administration – – – – 84
Farm Credit System Insurance Corporation – – – – –
Federal Election Commission 76 70 74 74 71
Federal Housing Finance Agency 68 73 72 73 74
Federal Labor Relations Authority 81 84 75 81 87
Federal Maritime Commission 78 58 67 67 70
Federal Mediation and Conciliation Service 76 77 81 81 86
Federal Retirement Thrift Investment Board 78 79 72 77 79
Institute of Museum and Library Services 77 75 72 81 62
Inter-American Foundation 59 38 51 49 58
International Boundary and Water Commission 58 67 67 68 65
Marine Mammal Commission 92 84 77 – –
Merit Systems Protection Board 75 74 74 71 80
National Capital Planning Commission 79 76 75 70 79
NOTE: A dash (–) indicates no data available.
Appendix F: Engagement Index Trends (continued)
F3: Engagement Index Trends – Supervisors (continued)
Small/Independent Agencies 2011 2012 2013 2014 2015
Small Agencies Combined 74 73 74 74 75
F3: Engagement Index Trends – Supervisors
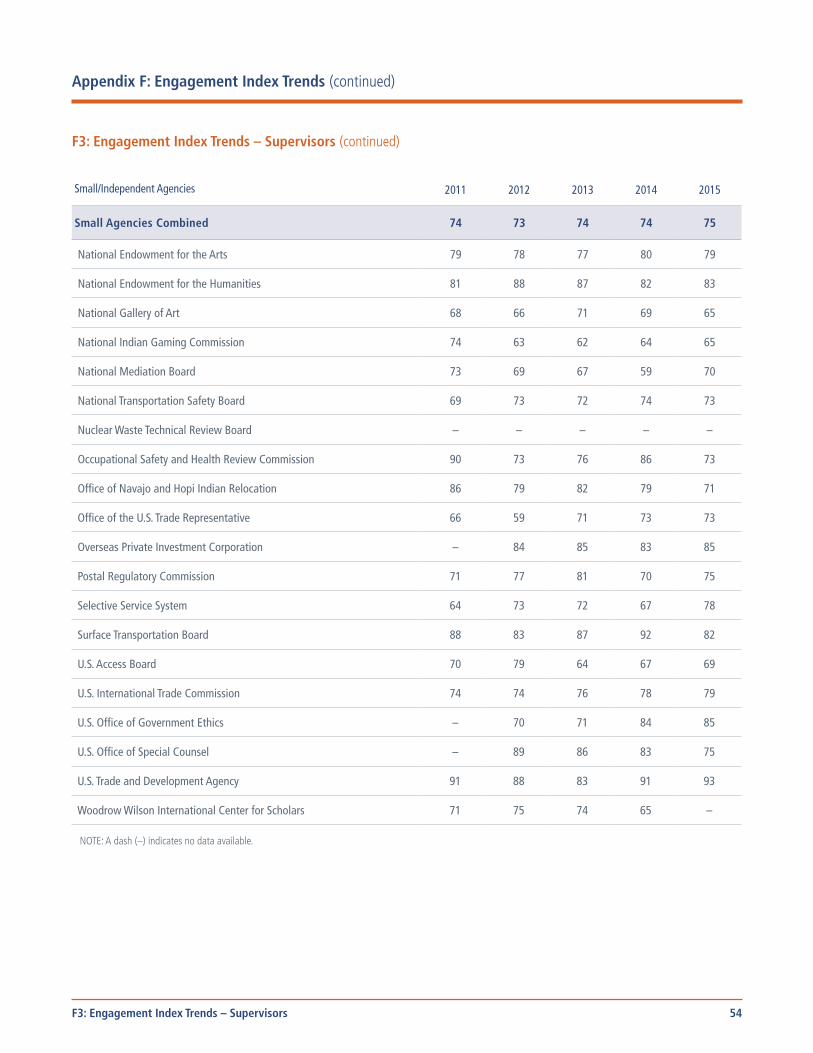
54
National Endowment for the Arts 79 78 77 80 79
National Endowment for the Humanities 81 88 87 82 83
National Gallery of Art 68 66 71 69 65
National Indian Gaming Commission 74 63 62 64 65
National Mediation Board 73 69 67 59 70
National Transportation Safety Board 69 73 72 74 73
Nuclear Waste Technical Review Board – – – – –
Occupational Safety and Health Review Commission 90 73 76 86 73
Office of Navajo and Hopi Indian Relocation 86 79 82 79 71
Office of the U.S. Trade Representative 66 59 71 73 73
Overseas Private Investment Corporation – 84 85 83 85
Postal Regulatory Commission 71 77 81 70 75
Selective Service System 64 73 72 67 78
Surface Transportation Board 88 83 87 92 82
U.S. Access Board 70 79 64 67 69
U.S. International Trade Commission 74 74 76 78 79
U.S. Office of Government Ethics – 70 71 84 85
U.S. Office of Special Counsel – 89 86 83 75
U.S. Trade and Development Agency 91 88 83 91 93
Woodrow Wilson International Center for Scholars 71 75 74 65 –
NOTE: A dash (–) indicates no data available.
Appendix F: Engagement Index Trends (continued)
F3: Engagement Index Trends – Supervisors (continued)
Small/Independent Agencies 2011 2012 2013 2014 2015
Small Agencies Combined 74 73 74 74 75
F3: Engagement Index Trends – Supervisors
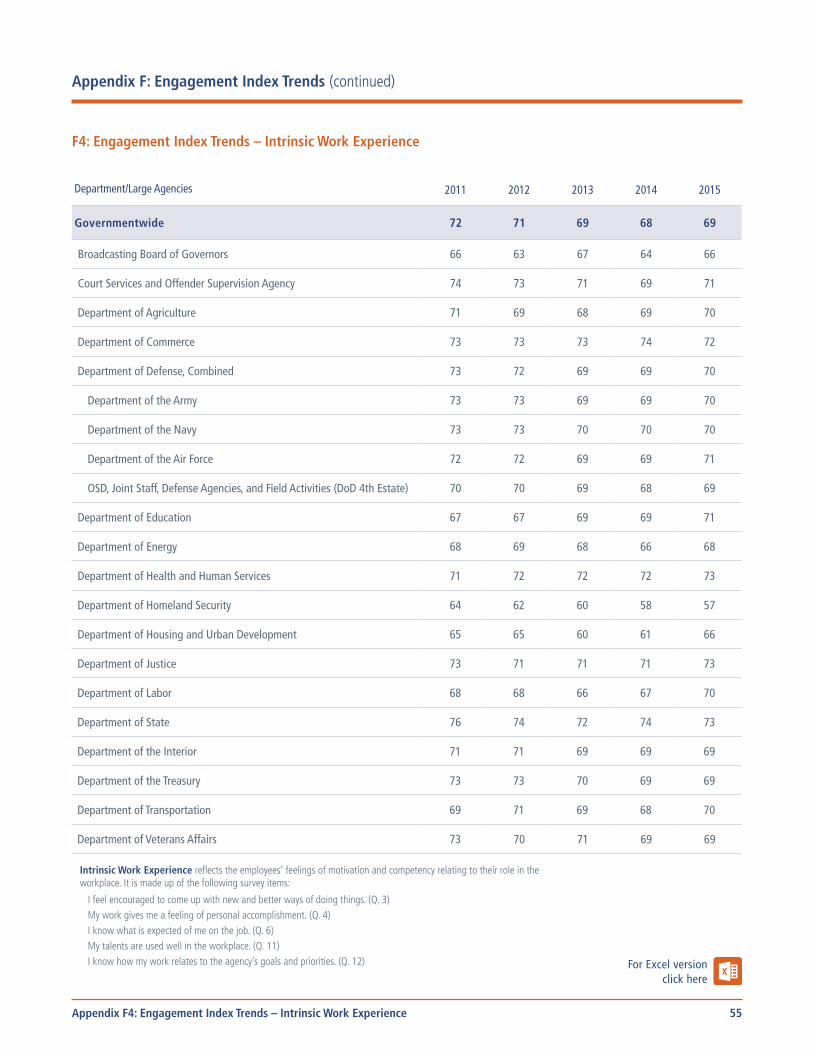
55
F4: Engagement Index Trends – Intrinsic Work Experience
2011 2012 2013 2014 2015Department/Large Agencies
Governmentwide 72 71 69 68 69
Broadcasting Board of Governors 66 63 67 64 66
Court Services and Offender Supervision Agency 74 73 71 69 71
Department of Agriculture 71 69 68 69 70
Department of Commerce 73 73 73 74 72
Department of Defense, Combined 73 72 69 69 70
Department of the Army 73 73 69 69 70
Department of the Navy 73 73 70 70 70
Department of the Air Force 72 72 69 69 71
OSD, Joint Staff, Defense Agencies, and Field Activities (DoD 4th Estate) 70 70 69 68 69
Department of Education 67 67 69 69 71
Department of Energy 68 69 68 66 68
Department of Health and Human Services 71 72 72 72 73
Department of Homeland Security 64 62 60 58 57
Department of Housing and Urban Development 65 65 60 61 66
Department of Justice 73 71 71 71 73
Department of Labor 68 68 66 67 70
Department of State 76 74 72 74 73
Department of the Interior 71 71 69 69 69
Department of the Treasury 73 73 70 69 69
Department of Transportation 69 71 69 68 70
Department of Veterans Affairs 73 70 71 69 69
Intrinsic Work Experience reflects the employees’ feelings of motivation and competency relating to their role in the workplace. It is made up of the following survey items:
I feel encouraged to come up with new and better ways of doing things. (Q. 3) My work gives me a feeling of personal accomplishment. (Q. 4) I know what is expected of me on the job. (Q. 6) My talents are used well in the workplace. (Q. 11) I know how my work relates to the agency’s goals and priorities. (Q. 12)
Appendix F: Engagement Index Trends (continued)
Appendix F4: Engagement Index Trends – Intrinsic Work Experience
For Excel version click here
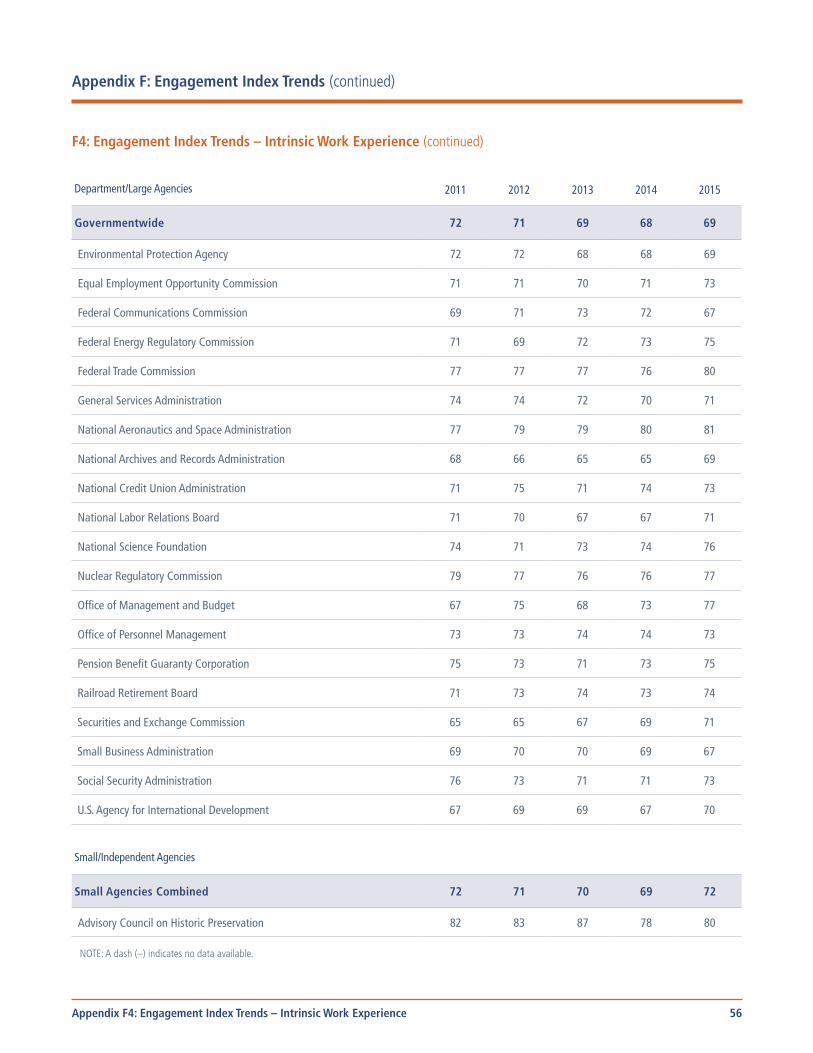
56
Environmental Protection Agency 72 72 68 68 69
Equal Employment Opportunity Commission 71 71 70 71 73
Federal Communications Commission 69 71 73 72 67
Federal Energy Regulatory Commission 71 69 72 73 75
Federal Trade Commission 77 77 77 76 80
General Services Administration 74 74 72 70 71
National Aeronautics and Space Administration 77 79 79 80 81
National Archives and Records Administration 68 66 65 65 69
National Credit Union Administration 71 75 71 74 73
National Labor Relations Board 71 70 67 67 71
National Science Foundation 74 71 73 74 76
Nuclear Regulatory Commission 79 77 76 76 77
Office of Management and Budget 67 75 68 73 77
Office of Personnel Management 73 73 74 74 73
Pension Benefit Guaranty Corporation 75 73 71 73 75
Railroad Retirement Board 71 73 74 73 74
Securities and Exchange Commission 65 65 67 69 71
Small Business Administration 69 70 70 69 67
Social Security Administration 76 73 71 71 73
U.S. Agency for International Development 67 69 69 67 70
Small/Independent Agencies
Small Agencies Combined 72 71 70 69 72
Advisory Council on Historic Preservation 82 83 87 78 80
NOTE: A dash (–) indicates no data available.
Appendix F: Engagement Index Trends (continued)
F4: Engagement Index Trends – Intrinsic Work Experience (continued)
Department/Large Agencies 2011 2012 2013 2014 2015
Governmentwide 72 71 69 68 69
Appendix F4: Engagement Index Trends – Intrinsic Work Experience

57
African Development Foundation 71 – – 59 57
American Battle Monuments Commission 75 63 65 73 70
Chemical Safety and Hazard Investigation Board 66 72 58 65 57
Commission on Civil Rights 58 55 53 60 58
Committee for Purchase From People Who Are Blind or Severely Disabled 84 87 77 75 77
Commodity Futures Trading Commission 73 68 65 57 60
Consumer Product Safety Commission 72 72 73 68 70
Corporation for National and Community Service 73 72 71 71 75
Defense Nuclear Facilities Safety Board 80 74 55 49 65
Export-Import Bank of the United States 71 70 68 67 76
Farm Credit Administration – – – – 73
Farm Credit System Insurance Corporation – – – – –
Federal Election Commission 66 64 63 66 61
Federal Housing Finance Agency 59 60 63 64 68
Federal Labor Relations Authority 80 77 77 82 83
Federal Maritime Commission 68 53 60 59 68
Federal Mediation and Conciliation Service 78 84 85 84 88
Federal Retirement Thrift Investment Board 79 84 76 77 78
Institute of Museum and Library Services 76 64 67 73 65
Inter-American Foundation 60 51 48 57 64
International Boundary and Water Commission 70 70 71 69 68
Marine Mammal Commission 78 88 75 – –
Merit Systems Protection Board 77 76 76 71 79
National Capital Planning Commission 71 69 74 72 78
NOTE: A dash (–) indicates no data available.
Appendix F: Engagement Index Trends (continued)
F4: Engagement Index Trends – Intrinsic Work Experience (continued)
Small/Independent Agencies 2011 2012 2013 2014 2015
Small Agencies Combined 72 71 70 69 72
Appendix F4: Engagement Index Trends – Intrinsic Work Experience

58
National Endowment for the Arts 73 75 76 77 75
National Endowment for the Humanities 79 83 81 81 78
National Gallery of Art 70 72 71 69 69
National Indian Gaming Commission 53 54 55 59 64
National Mediation Board 77 72 59 64 58
National Transportation Safety Board 74 72 71 70 73
Nuclear Waste Technical Review Board – – – – –
Occupational Safety and Health Review Commission 91 75 83 84 82
Office of Navajo and Hopi Indian Relocation 93 91 91 90 85
Office of the U.S. Trade Representative 64 62 64 66 68
Overseas Private Investment Corporation – 76 74 76 82
Postal Regulatory Commission 73 81 73 69 73
Selective Service System 69 73 76 69 73
Surface Transportation Board 89 82 85 88 83
U.S. Access Board 65 69 64 69 63
U.S. International Trade Commission 74 71 74 76 79
U.S. Office of Government Ethics – 77 64 78 81
U.S. Office of Special Counsel – 75 75 68 63
U.S. Trade and Development Agency 90 87 85 89 82
Woodrow Wilson International Center for Scholars 64 69 57 69 –
NOTE: A dash (–) indicates no data available.
Appendix F: Engagement Index Trends (continued)
F4: Engagement Index Trends – Intrinsic Work Experience (continued)
Small/Independent Agencies 2011 2012 2013 2014 2015
Small Agencies Combined 72 71 70 69 72
Appendix F4: Engagement Index Trends – Intrinsic Work Experience
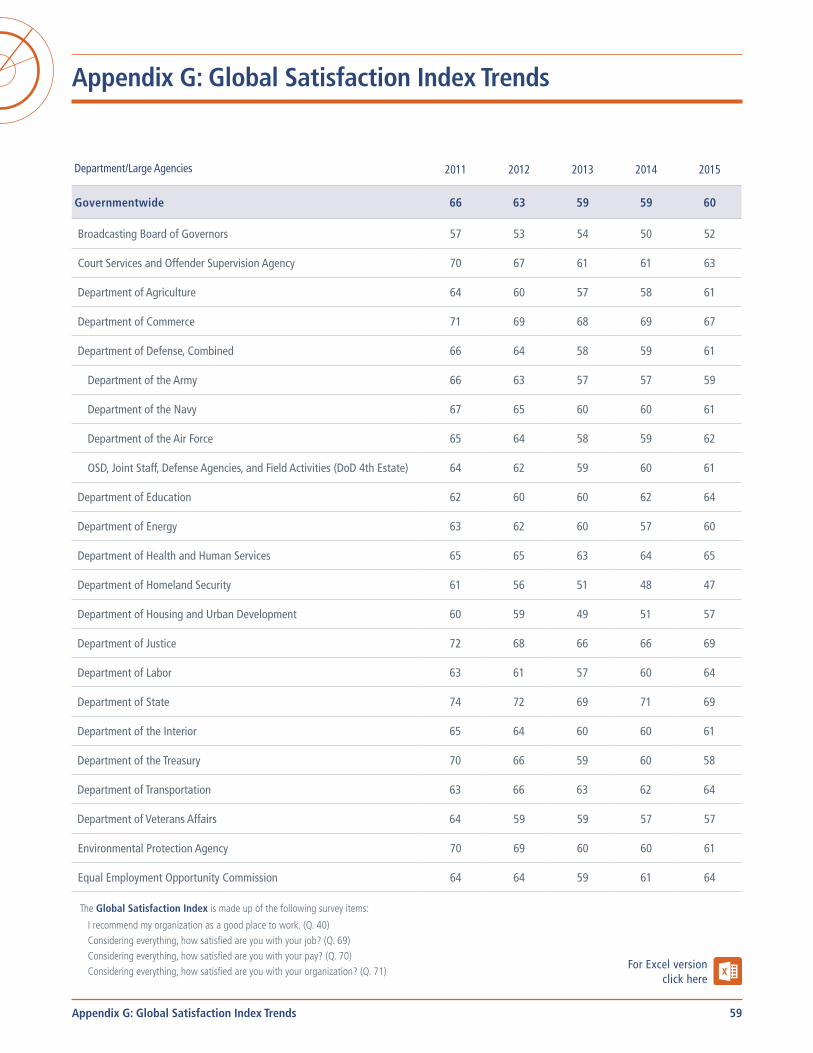
59
Appendix G: Global Satisfaction Index Trends
2011 2012 2013 2014 2015Department/Large Agencies
Governmentwide 66 63 59 59 60
Broadcasting Board of Governors 57 53 54 50 52
Court Services and Offender Supervision Agency 70 67 61 61 63
Department of Agriculture 64 60 57 58 61
Department of Commerce 71 69 68 69 67
Department of Defense, Combined 66 64 58 59 61
Department of the Army 66 63 57 57 59
Department of the Navy 67 65 60 60 61
Department of the Air Force 65 64 58 59 62
OSD, Joint Staff, Defense Agencies, and Field Activities (DoD 4th Estate) 64 62 59 60 61
Department of Education 62 60 60 62 64
Department of Energy 63 62 60 57 60
Department of Health and Human Services 65 65 63 64 65
Department of Homeland Security 61 56 51 48 47
Department of Housing and Urban Development 60 59 49 51 57
Department of Justice 72 68 66 66 69
Department of Labor 63 61 57 60 64
Department of State 74 72 69 71 69
Department of the Interior 65 64 60 60 61
Department of the Treasury 70 66 59 60 58
Department of Transportation 63 66 63 62 64
Department of Veterans Affairs 64 59 59 57 57
Environmental Protection Agency 70 69 60 60 61
Equal Employment Opportunity Commission 64 64 59 61 64
The Global Satisfaction Index is made up of the following survey items:
I recommend my organization as a good place to work. (Q. 40) Considering everything, how satisfied are you with your job? (Q. 69) Considering everything, how satisfied are you with your pay? (Q. 70) Considering everything, how satisfied are you with your organization? (Q. 71)
Appendix G: Global Satisfaction Index Trends
For Excel version click here
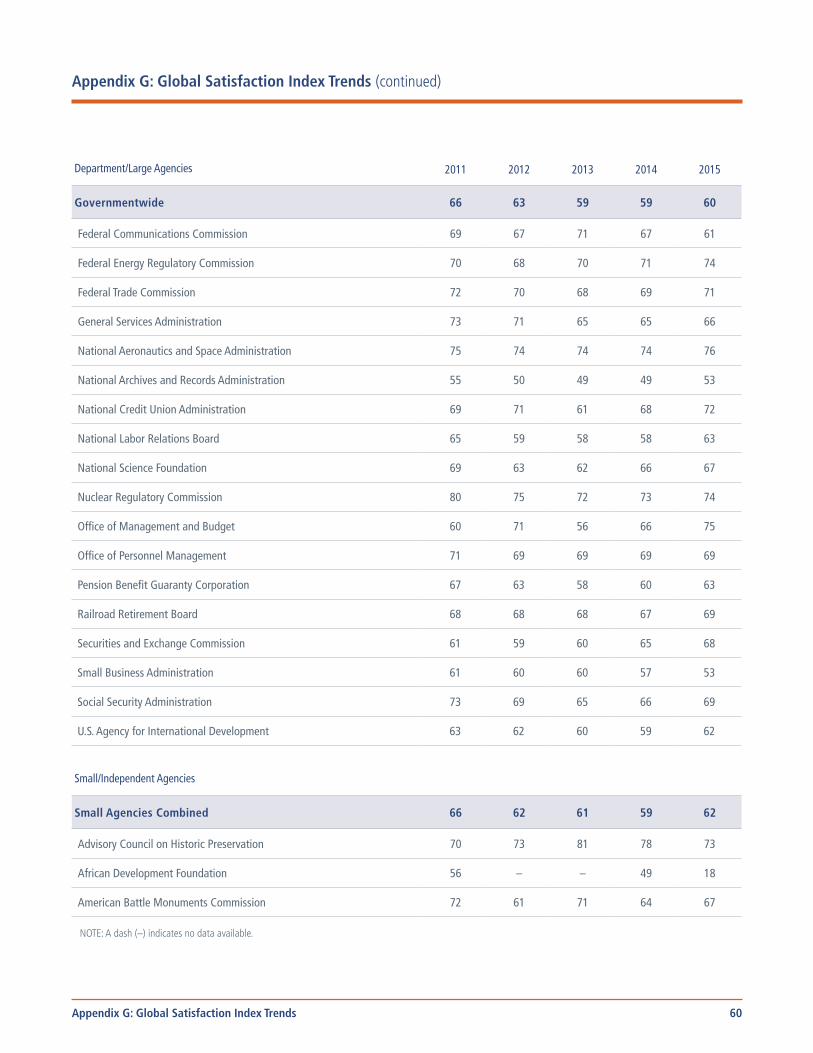
60
Federal Communications Commission 69 67 71 67 61
Federal Energy Regulatory Commission 70 68 70 71 74
Federal Trade Commission 72 70 68 69 71
General Services Administration 73 71 65 65 66
National Aeronautics and Space Administration 75 74 74 74 76
National Archives and Records Administration 55 50 49 49 53
National Credit Union Administration 69 71 61 68 72
National Labor Relations Board 65 59 58 58 63
National Science Foundation 69 63 62 66 67
Nuclear Regulatory Commission 80 75 72 73 74
Office of Management and Budget 60 71 56 66 75
Office of Personnel Management 71 69 69 69 69
Pension Benefit Guaranty Corporation 67 63 58 60 63
Railroad Retirement Board 68 68 68 67 69
Securities and Exchange Commission 61 59 60 65 68
Small Business Administration 61 60 60 57 53
Social Security Administration 73 69 65 66 69
U.S. Agency for International Development 63 62 60 59 62
Small/Independent Agencies
Small Agencies Combined 66 62 61 59 62
Advisory Council on Historic Preservation 70 73 81 78 73
African Development Foundation 56 – – 49 18
American Battle Monuments Commission 72 61 71 64 67
NOTE: A dash (–) indicates no data available.
Appendix G: Global Satisfaction Index Trends (continued)
Department/Large Agencies 2011 2012 2013 2014 2015
Governmentwide 66 63 59 59 60
Appendix G: Global Satisfaction Index Trends
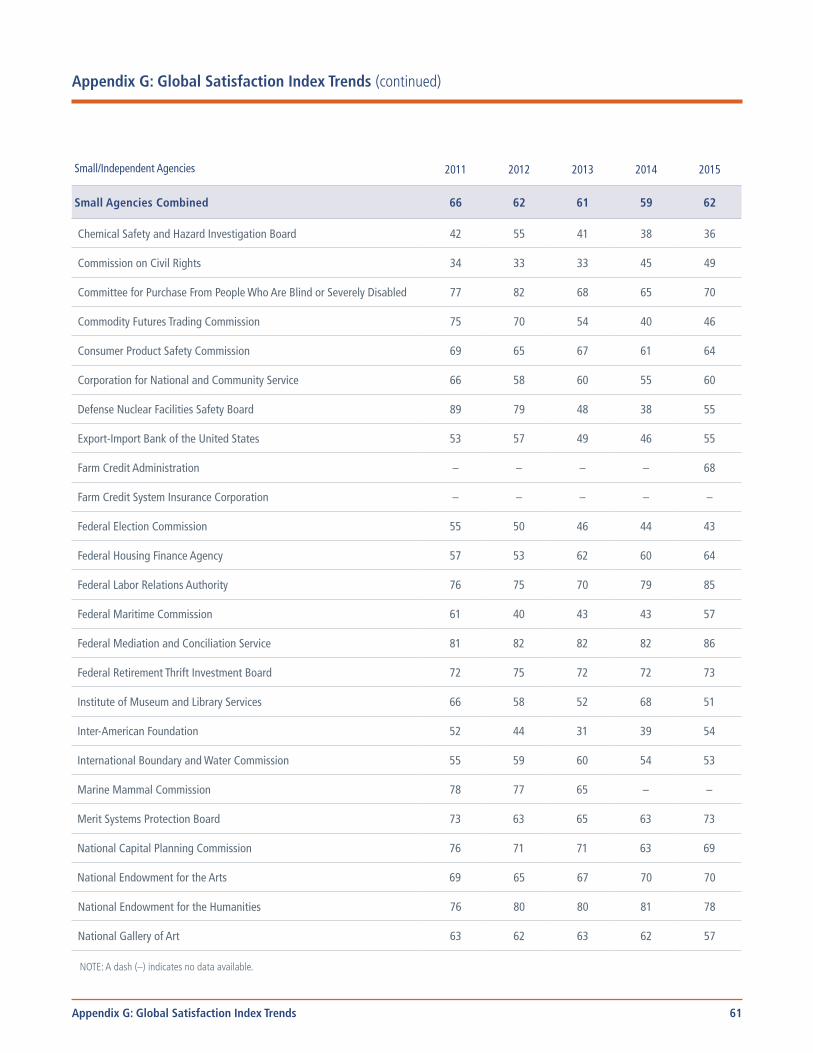
61
Chemical Safety and Hazard Investigation Board 42 55 41 38 36
Commission on Civil Rights 34 33 33 45 49
Committee for Purchase From People Who Are Blind or Severely Disabled 77 82 68 65 70
Commodity Futures Trading Commission 75 70 54 40 46
Consumer Product Safety Commission 69 65 67 61 64
Corporation for National and Community Service 66 58 60 55 60
Defense Nuclear Facilities Safety Board 89 79 48 38 55
Export-Import Bank of the United States 53 57 49 46 55
Farm Credit Administration – – – – 68
Farm Credit System Insurance Corporation – – – – –
Federal Election Commission 55 50 46 44 43
Federal Housing Finance Agency 57 53 62 60 64
Federal Labor Relations Authority 76 75 70 79 85
Federal Maritime Commission 61 40 43 43 57
Federal Mediation and Conciliation Service 81 82 82 82 86
Federal Retirement Thrift Investment Board 72 75 72 72 73
Institute of Museum and Library Services 66 58 52 68 51
Inter-American Foundation 52 44 31 39 54
International Boundary and Water Commission 55 59 60 54 53
Marine Mammal Commission 78 77 65 – –
Merit Systems Protection Board 73 63 65 63 73
National Capital Planning Commission 76 71 71 63 69
National Endowment for the Arts 69 65 67 70 70
National Endowment for the Humanities 76 80 80 81 78
National Gallery of Art 63 62 63 62 57
NOTE: A dash (–) indicates no data available.
Appendix G: Global Satisfaction Index Trends (continued)
Small/Independent Agencies 2011 2012 2013 2014 2015
Small Agencies Combined 66 62 61 59 62
Appendix G: Global Satisfaction Index Trends
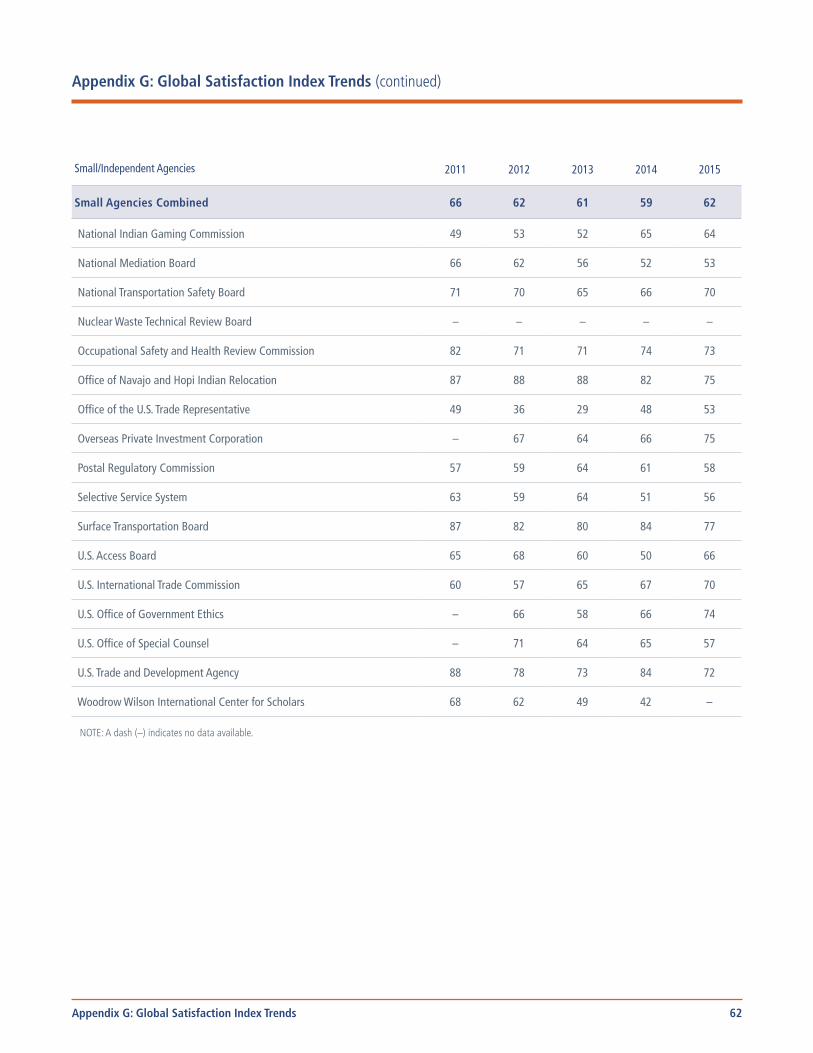
62
National Indian Gaming Commission 49 53 52 65 64
National Mediation Board 66 62 56 52 53
National Transportation Safety Board 71 70 65 66 70
Nuclear Waste Technical Review Board – – – – –
Occupational Safety and Health Review Commission 82 71 71 74 73
Office of Navajo and Hopi Indian Relocation 87 88 88 82 75
Office of the U.S. Trade Representative 49 36 29 48 53
Overseas Private Investment Corporation – 67 64 66 75
Postal Regulatory Commission 57 59 64 61 58
Selective Service System 63 59 64 51 56
Surface Transportation Board 87 82 80 84 77
U.S. Access Board 65 68 60 50 66
U.S. International Trade Commission 60 57 65 67 70
U.S. Office of Government Ethics – 66 58 66 74
U.S. Office of Special Counsel – 71 64 65 57
U.S. Trade and Development Agency 88 78 73 84 72
Woodrow Wilson International Center for Scholars 68 62 49 42 –
NOTE: A dash (–) indicates no data available.
Appendix G: Global Satisfaction Index Trends (continued)
Small/Independent Agencies 2011 2012 2013 2014 2015
Small Agencies Combined 66 62 61 59 62
Appendix G: Global Satisfaction Index Trends

63
Appendix H: New IQ Index Trends
H1: New IQ Index Trends
2011 2012 2013 2014 2015Department/Large Agencies
Governmentwide 59 57 56 56 57
Broadcasting Board of Governors 50 48 49 47 49
Court Services and Offender Supervision Agency 64 60 56 55 59
Department of Agriculture 58 57 56 57 58
Department of Commerce 64 64 64 64 63
Department of Defense, Combined 60 59 57 57 58
Department of the Army 60 59 55 55 56
Department of the Navy 60 60 58 57 58
Department of the Air Force 60 60 57 58 60
OSD, Joint Staff, Defense Agencies, and Field Activities (DoD 4th Estate) 58 58 57 57 58
Department of Education 56 57 59 60 61
Department of Energy 58 59 57 55 57
Department of Health and Human Services 58 58 58 59 60
Department of Homeland Security 52 49 48 46 45
Department of Housing and Urban Development 52 54 49 49 54
Department of Justice 61 58 58 58 60
Department of Labor 56 56 55 56 59
Department of State 65 63 62 62 62
Department of the Interior 57 57 55 55 56
Department of the Treasury 63 62 60 60 59
Department of Transportation 56 57 58 58 59
Department of Veterans Affairs 57 54 55 53 53
Environmental Protection Agency 61 61 58 57 57
Equal Employment Opportunity Commission 57 57 55 56 58
Federal Communications Commission 63 62 65 60 59
The New IQ Index indicates the degree to which an environment is inclusive. Although this is a new index, the items that comprise the New IQ have been on the FEVS in previous years, making trend calculation possible.
Appendix H1: New IQ Index Trends
For Excel version click here
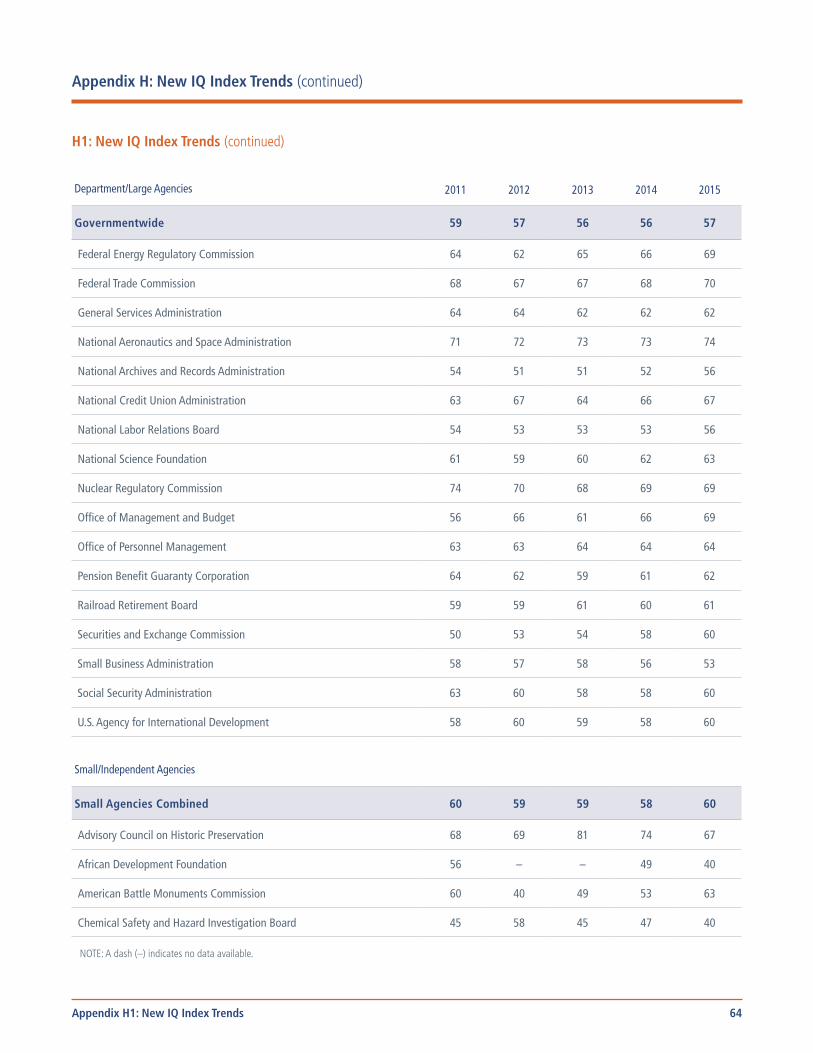
64
Federal Energy Regulatory Commission 64 62 65 66 69
Federal Trade Commission 68 67 67 68 70
General Services Administration 64 64 62 62 62
National Aeronautics and Space Administration 71 72 73 73 74
National Archives and Records Administration 54 51 51 52 56
National Credit Union Administration 63 67 64 66 67
National Labor Relations Board 54 53 53 53 56
National Science Foundation 61 59 60 62 63
Nuclear Regulatory Commission 74 70 68 69 69
Office of Management and Budget 56 66 61 66 69
Office of Personnel Management 63 63 64 64 64
Pension Benefit Guaranty Corporation 64 62 59 61 62
Railroad Retirement Board 59 59 61 60 61
Securities and Exchange Commission 50 53 54 58 60
Small Business Administration 58 57 58 56 53
Social Security Administration 63 60 58 58 60
U.S. Agency for International Development 58 60 59 58 60
Small/Independent Agencies
Small Agencies Combined 60 59 59 58 60
Advisory Council on Historic Preservation 68 69 81 74 67
African Development Foundation 56 – – 49 40
American Battle Monuments Commission 60 40 49 53 63
Chemical Safety and Hazard Investigation Board 45 58 45 47 40
NOTE: A dash (–) indicates no data available.
Appendix H: New IQ Index Trends (continued)
H1: New IQ Index Trends (continued)
Department/Large Agencies 2011 2012 2013 2014 2015
Governmentwide 59 57 56 56 57
Appendix H1: New IQ Index Trends
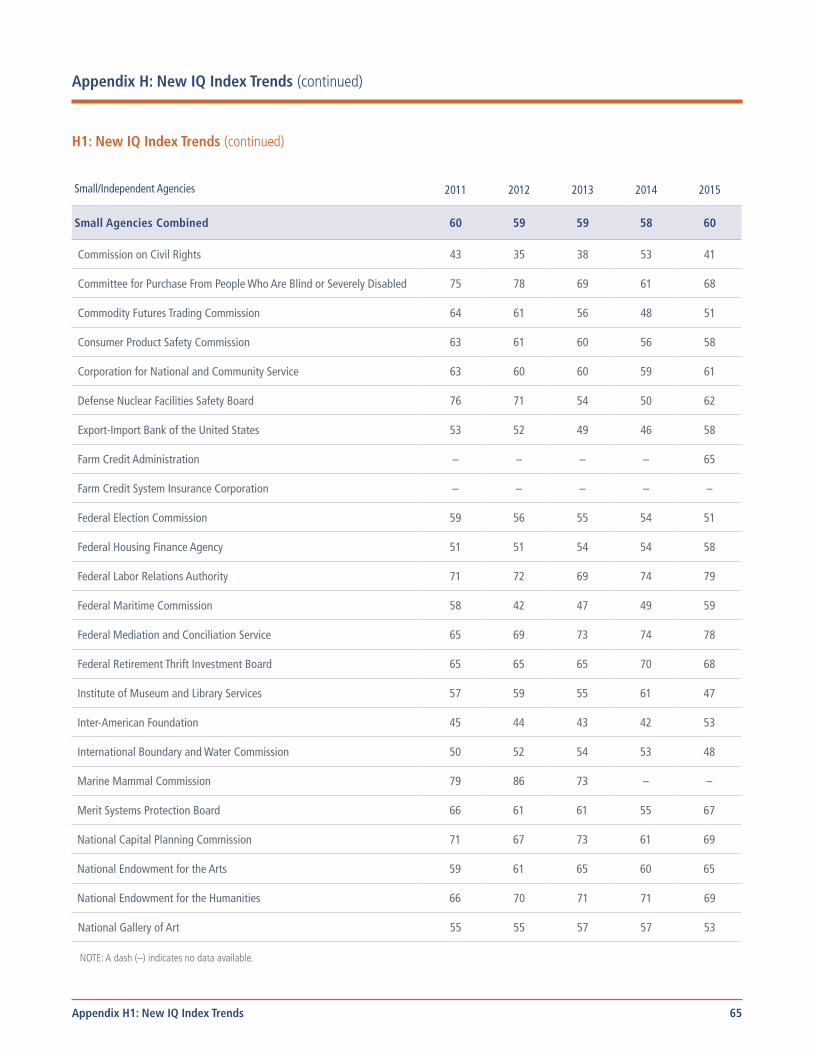
65
Commission on Civil Rights 43 35 38 53 41
Committee for Purchase From People Who Are Blind or Severely Disabled 75 78 69 61 68
Commodity Futures Trading Commission 64 61 56 48 51
Consumer Product Safety Commission 63 61 60 56 58
Corporation for National and Community Service 63 60 60 59 61
Defense Nuclear Facilities Safety Board 76 71 54 50 62
Export-Import Bank of the United States 53 52 49 46 58
Farm Credit Administration – – – – 65
Farm Credit System Insurance Corporation – – – – –
Federal Election Commission 59 56 55 54 51
Federal Housing Finance Agency 51 51 54 54 58
Federal Labor Relations Authority 71 72 69 74 79
Federal Maritime Commission 58 42 47 49 59
Federal Mediation and Conciliation Service 65 69 73 74 78
Federal Retirement Thrift Investment Board 65 65 65 70 68
Institute of Museum and Library Services 57 59 55 61 47
Inter-American Foundation 45 44 43 42 53
International Boundary and Water Commission 50 52 54 53 48
Marine Mammal Commission 79 86 73 – –
Merit Systems Protection Board 66 61 61 55 67
National Capital Planning Commission 71 67 73 61 69
National Endowment for the Arts 59 61 65 60 65
National Endowment for the Humanities 66 70 71 71 69
National Gallery of Art 55 55 57 57 53
NOTE: A dash (–) indicates no data available.
Appendix H: New IQ Index Trends (continued)
H1: New IQ Index Trends (continued)
Small/Independent Agencies 2011 2012 2013 2014 2015
Small Agencies Combined 60 59 59 58 60
Appendix H1: New IQ Index Trends
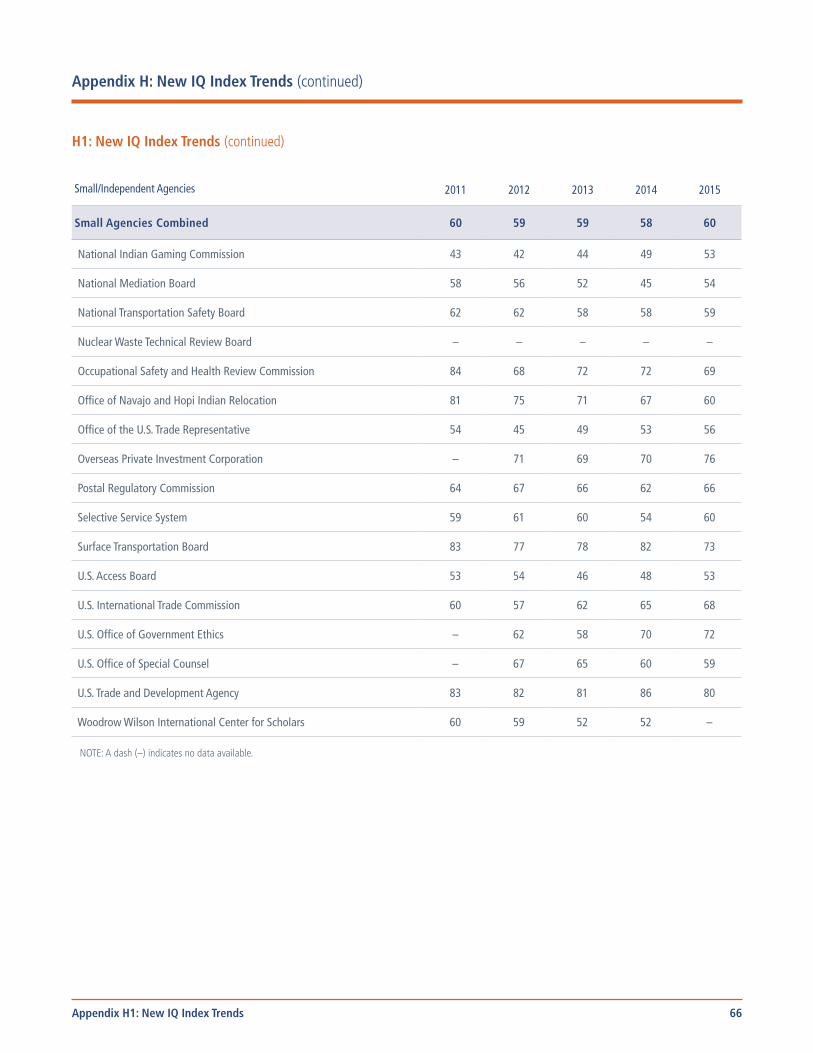
66
National Indian Gaming Commission 43 42 44 49 53
National Mediation Board 58 56 52 45 54
National Transportation Safety Board 62 62 58 58 59
Nuclear Waste Technical Review Board – – – – –
Occupational Safety and Health Review Commission 84 68 72 72 69
Office of Navajo and Hopi Indian Relocation 81 75 71 67 60
Office of the U.S. Trade Representative 54 45 49 53 56
Overseas Private Investment Corporation – 71 69 70 76
Postal Regulatory Commission 64 67 66 62 66
Selective Service System 59 61 60 54 60
Surface Transportation Board 83 77 78 82 73
U.S. Access Board 53 54 46 48 53
U.S. International Trade Commission 60 57 62 65 68
U.S. Office of Government Ethics – 62 58 70 72
U.S. Office of Special Counsel – 67 65 60 59
U.S. Trade and Development Agency 83 82 81 86 80
Woodrow Wilson International Center for Scholars 60 59 52 52 –
NOTE: A dash (–) indicates no data available.
Appendix H: New IQ Index Trends (continued)
H1: New IQ Index Trends (continued)
Small/Independent Agencies 2011 2012 2013 2014 2015
Small Agencies Combined 60 59 59 58 60
Appendix H1: New IQ Index Trends

67
H2: New IQ Index Trends – Fair
2011 2012 2013 2014 2015Department/Large Agencies
Governmentwide 46 44 43 43 43
Broadcasting Board of Governors 37 37 36 33 36
Court Services and Offender Supervision Agency 52 46 40 40 43
Department of Agriculture 45 43 42 43 44
Department of Commerce 54 54 55 56 54
Department of Defense, Combined 46 45 43 43 44
Department of the Army 47 44 41 40 42
Department of the Navy 47 46 44 44 45
Department of the Air Force 46 46 43 45 47
OSD, Joint Staff, Defense Agencies, and Field Activities (DoD 4th Estate) 45 44 43 44 45
Department of Education 43 44 45 47 47
Department of Energy 44 45 44 41 44
Department of Health and Human Services 46 45 44 46 48
Department of Homeland Security 39 37 35 34 32
Department of Housing and Urban Development 40 41 36 35 41
Department of Justice 47 44 43 43 45
Department of Labor 45 45 42 45 46
Department of State 50 50 48 50 49
Department of the Interior 46 45 43 44 44
Department of the Treasury 52 51 48 49 48
Department of Transportation 42 43 42 44 45
Department of Veterans Affairs 44 41 42 41 41
The New IQ – Fair indicates if all employees are treated equitably. It is made up of the following survey items:
In my work unit, steps are taken to deal with a poor performer who cannot or will not improve. (Q. 23) In my work unit, differences in performance are recognized in a meaningful way. (Q. 24) Awards in my work unit depend on how well employees perform their jobs. (Q. 25) Arbitrary action, personal favoritism and coercion for partisan political purposes are not tolerated. (Q. 37) Prohibited Personnel Practices (for example, illegally discriminating for or against any employee/applicant,
obstructing a person’s right to compete for employment, knowingly violating veterans’ preference requirements) are not tolerated. (Q. 38)
Appendix H: New IQ Index Trends (continued)
Appendix H2: New IQ Index Trends – Fair
For Excel version click here
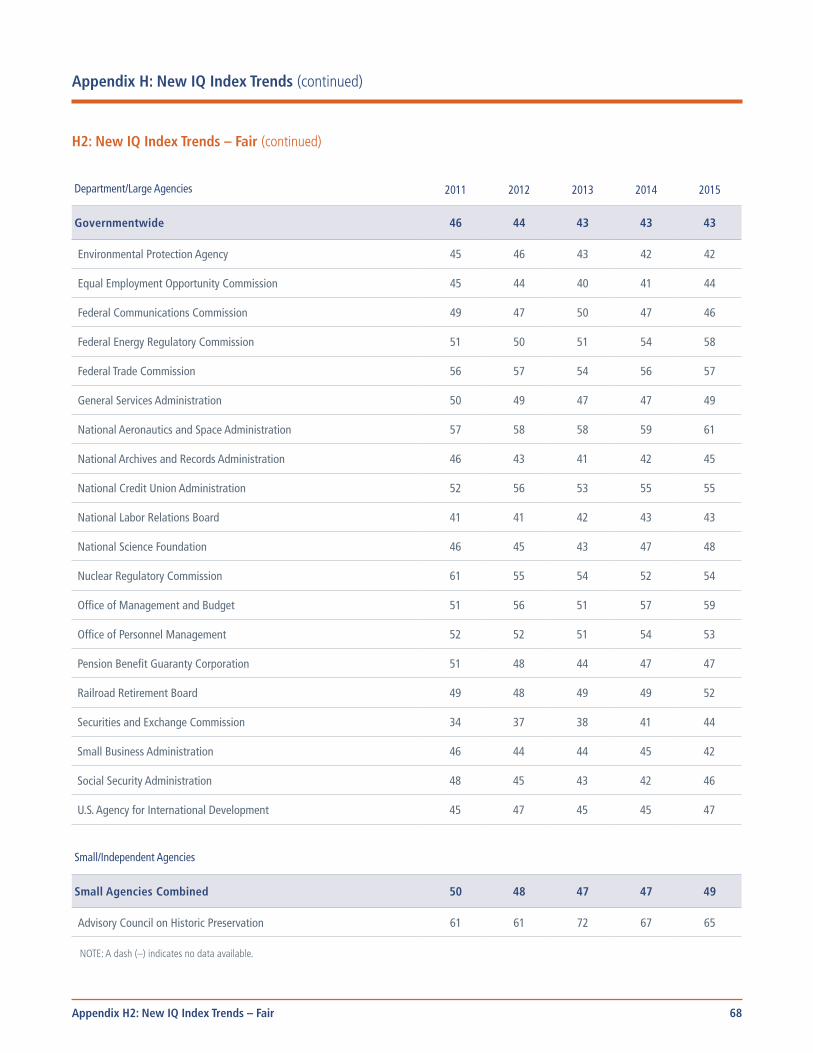
68
Environmental Protection Agency 45 46 43 42 42
Equal Employment Opportunity Commission 45 44 40 41 44
Federal Communications Commission 49 47 50 47 46
Federal Energy Regulatory Commission 51 50 51 54 58
Federal Trade Commission 56 57 54 56 57
General Services Administration 50 49 47 47 49
National Aeronautics and Space Administration 57 58 58 59 61
National Archives and Records Administration 46 43 41 42 45
National Credit Union Administration 52 56 53 55 55
National Labor Relations Board 41 41 42 43 43
National Science Foundation 46 45 43 47 48
Nuclear Regulatory Commission 61 55 54 52 54
Office of Management and Budget 51 56 51 57 59
Office of Personnel Management 52 52 51 54 53
Pension Benefit Guaranty Corporation 51 48 44 47 47
Railroad Retirement Board 49 48 49 49 52
Securities and Exchange Commission 34 37 38 41 44
Small Business Administration 46 44 44 45 42
Social Security Administration 48 45 43 42 46
U.S. Agency for International Development 45 47 45 45 47
Small/Independent Agencies
Small Agencies Combined 50 48 47 47 49
Advisory Council on Historic Preservation 61 61 72 67 65
NOTE: A dash (–) indicates no data available.
Appendix H: New IQ Index Trends (continued)
H2: New IQ Index Trends – Fair (continued)
Department/Large Agencies 2011 2012 2013 2014 2015
Governmentwide 46 44 43 43 43
Appendix H2: New IQ Index Trends – Fair
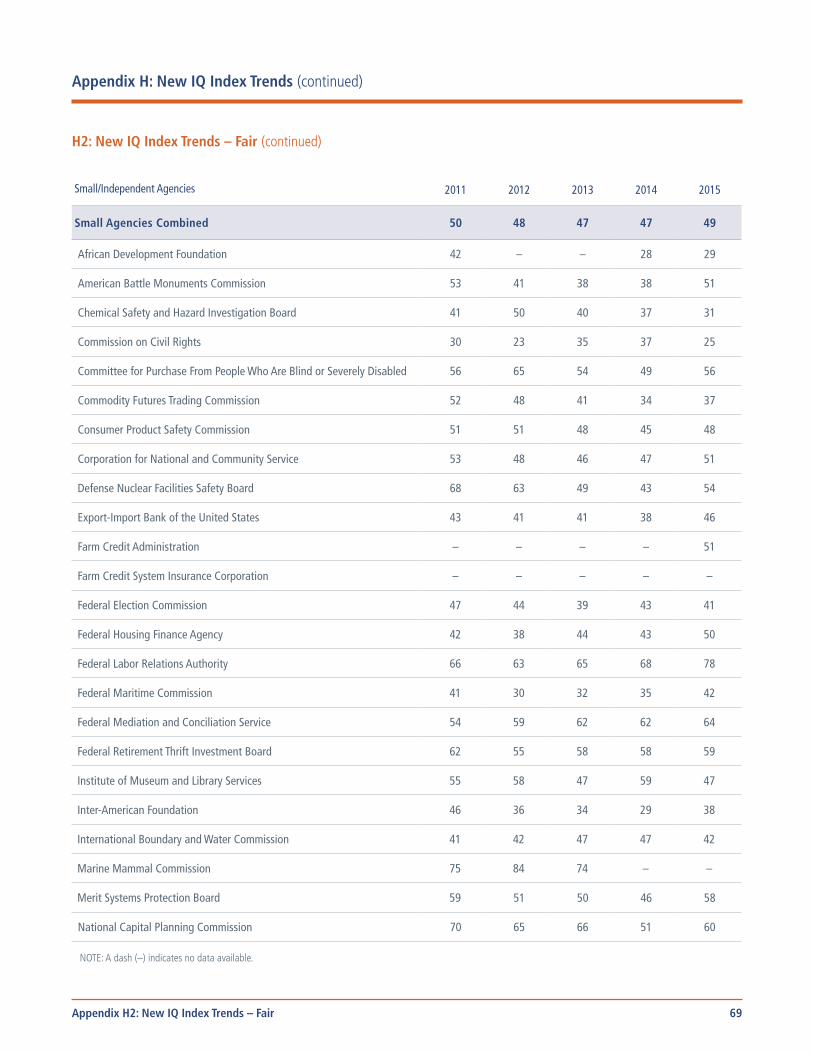
69
African Development Foundation 42 – – 28 29
American Battle Monuments Commission 53 41 38 38 51
Chemical Safety and Hazard Investigation Board 41 50 40 37 31
Commission on Civil Rights 30 23 35 37 25
Committee for Purchase From People Who Are Blind or Severely Disabled 56 65 54 49 56
Commodity Futures Trading Commission 52 48 41 34 37
Consumer Product Safety Commission 51 51 48 45 48
Corporation for National and Community Service 53 48 46 47 51
Defense Nuclear Facilities Safety Board 68 63 49 43 54
Export-Import Bank of the United States 43 41 41 38 46
Farm Credit Administration – – – – 51
Farm Credit System Insurance Corporation – – – – –
Federal Election Commission 47 44 39 43 41
Federal Housing Finance Agency 42 38 44 43 50
Federal Labor Relations Authority 66 63 65 68 78
Federal Maritime Commission 41 30 32 35 42
Federal Mediation and Conciliation Service 54 59 62 62 64
Federal Retirement Thrift Investment Board 62 55 58 58 59
Institute of Museum and Library Services 55 58 47 59 47
Inter-American Foundation 46 36 34 29 38
International Boundary and Water Commission 41 42 47 47 42
Marine Mammal Commission 75 84 74 – –
Merit Systems Protection Board 59 51 50 46 58
National Capital Planning Commission 70 65 66 51 60
NOTE: A dash (–) indicates no data available.
Appendix H: New IQ Index Trends (continued)
H2: New IQ Index Trends – Fair (continued)
Small/Independent Agencies 2011 2012 2013 2014 2015
Small Agencies Combined 50 48 47 47 49
Appendix H2: New IQ Index Trends – Fair

70
National Endowment for the Arts 46 49 52 53 58
National Endowment for the Humanities 62 67 65 66 65
National Gallery of Art 45 45 48 47 43
National Indian Gaming Commission 28 31 30 39 43
National Mediation Board 44 46 37 34 42
National Transportation Safety Board 55 52 47 49 46
Nuclear Waste Technical Review Board – – – – –
Occupational Safety and Health Review Commission 80 63 66 63 67
Office of Navajo and Hopi Indian Relocation 75 77 60 53 46
Office of the U.S. Trade Representative 38 33 36 43 47
Overseas Private Investment Corporation – 57 56 55 62
Postal Regulatory Commission 51 54 53 55 58
Selective Service System 46 47 46 38 48
Surface Transportation Board 71 64 64 72 62
U.S. Access Board 41 43 37 34 45
U.S. International Trade Commission 45 45 49 50 52
U.S. Office of Government Ethics – 52 45 53 59
U.S. Office of Special Counsel – 63 57 50 48
U.S. Trade and Development Agency 68 68 67 83 70
Woodrow Wilson International Center for Scholars 55 50 42 35 –
NOTE: A dash (–) indicates no data available.
Appendix H: New IQ Index Trends (continued)
H2: New IQ Index Trends – Fair (continued)
Small/Independent Agencies 2011 2012 2013 2014 2015
Small Agencies Combined 50 48 47 47 49
Appendix H2: New IQ Index Trends – Fair
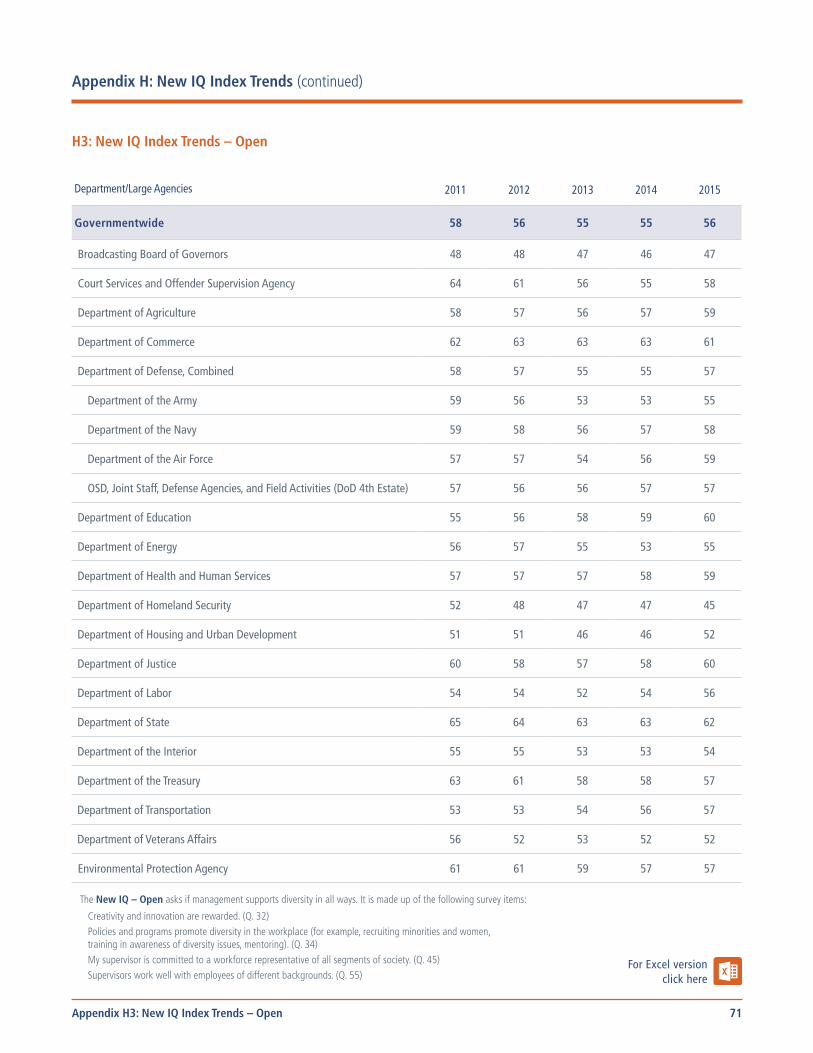
71
H3: New IQ Index Trends – Open
2011 2012 2013 2014 2015Department/Large Agencies
Governmentwide 58 56 55 55 56
Broadcasting Board of Governors 48 48 47 46 47
Court Services and Offender Supervision Agency 64 61 56 55 58
Department of Agriculture 58 57 56 57 59
Department of Commerce 62 63 63 63 61
Department of Defense, Combined 58 57 55 55 57
Department of the Army 59 56 53 53 55
Department of the Navy 59 58 56 57 58
Department of the Air Force 57 57 54 56 59
OSD, Joint Staff, Defense Agencies, and Field Activities (DoD 4th Estate) 57 56 56 57 57
Department of Education 55 56 58 59 60
Department of Energy 56 57 55 53 55
Department of Health and Human Services 57 57 57 58 59
Department of Homeland Security 52 48 47 47 45
Department of Housing and Urban Development 51 51 46 46 52
Department of Justice 60 58 57 58 60
Department of Labor 54 54 52 54 56
Department of State 65 64 63 63 62
Department of the Interior 55 55 53 53 54
Department of the Treasury 63 61 58 58 57
Department of Transportation 53 53 54 56 57
Department of Veterans Affairs 56 52 53 52 52
Environmental Protection Agency 61 61 59 57 57
The New IQ – Open asks if management supports diversity in all ways. It is made up of the following survey items:
Creativity and innovation are rewarded. (Q. 32) Policies and programs promote diversity in the workplace (for example, recruiting minorities and women,
training in awareness of diversity issues, mentoring). (Q. 34) My supervisor is committed to a workforce representative of all segments of society. (Q. 45) Supervisors work well with employees of different backgrounds. (Q. 55)
Appendix H: New IQ Index Trends (continued)
Appendix H3: New IQ Index Trends – Open
For Excel version click here
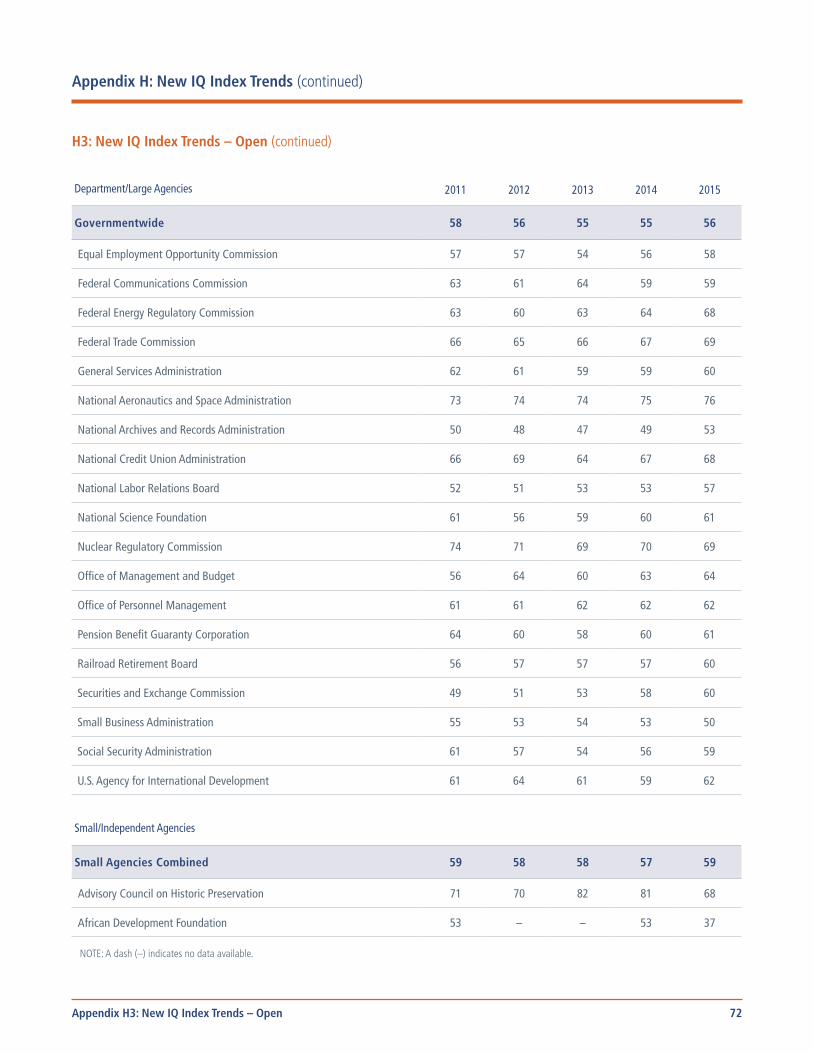
72
Equal Employment Opportunity Commission 57 57 54 56 58
Federal Communications Commission 63 61 64 59 59
Federal Energy Regulatory Commission 63 60 63 64 68
Federal Trade Commission 66 65 66 67 69
General Services Administration 62 61 59 59 60
National Aeronautics and Space Administration 73 74 74 75 76
National Archives and Records Administration 50 48 47 49 53
National Credit Union Administration 66 69 64 67 68
National Labor Relations Board 52 51 53 53 57
National Science Foundation 61 56 59 60 61
Nuclear Regulatory Commission 74 71 69 70 69
Office of Management and Budget 56 64 60 63 64
Office of Personnel Management 61 61 62 62 62
Pension Benefit Guaranty Corporation 64 60 58 60 61
Railroad Retirement Board 56 57 57 57 60
Securities and Exchange Commission 49 51 53 58 60
Small Business Administration 55 53 54 53 50
Social Security Administration 61 57 54 56 59
U.S. Agency for International Development 61 64 61 59 62
Small/Independent Agencies
Small Agencies Combined 59 58 58 57 59
Advisory Council on Historic Preservation 71 70 82 81 68
African Development Foundation 53 – – 53 37
NOTE: A dash (–) indicates no data available.
Appendix H: New IQ Index Trends (continued)
H3: New IQ Index Trends – Open (continued)
Department/Large Agencies 2011 2012 2013 2014 2015
Governmentwide 58 56 55 55 56
Appendix H3: New IQ Index Trends – Open
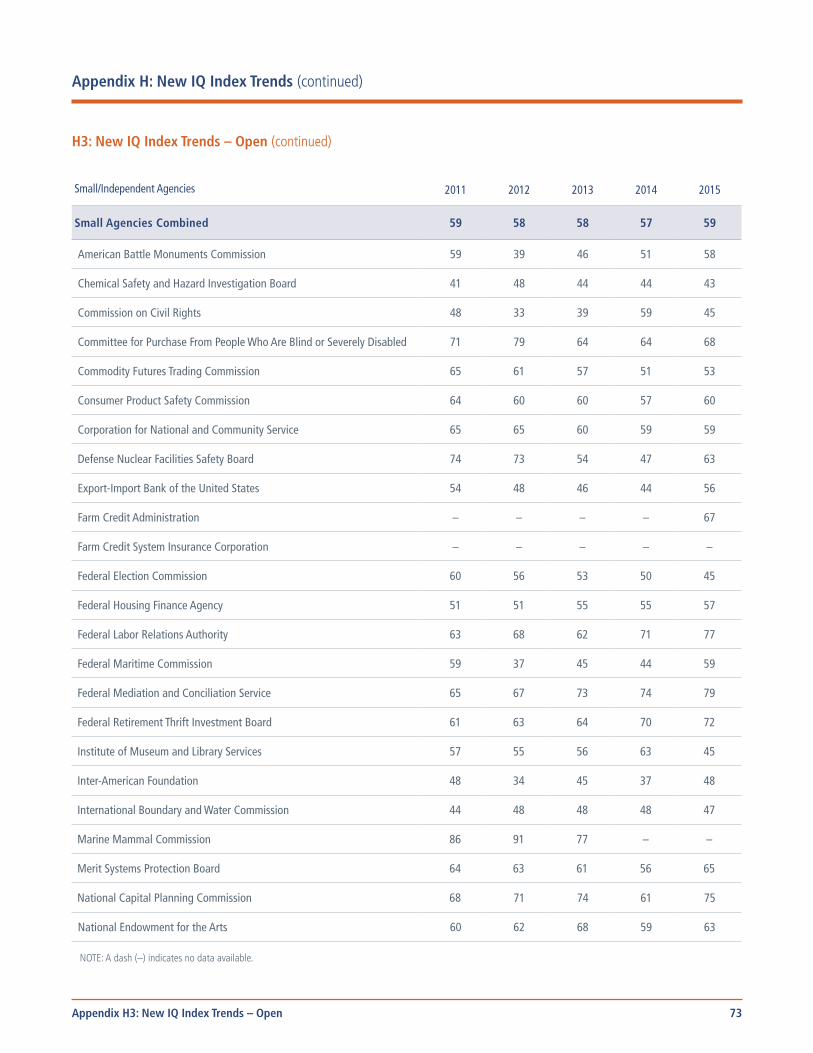
73
American Battle Monuments Commission 59 39 46 51 58
Chemical Safety and Hazard Investigation Board 41 48 44 44 43
Commission on Civil Rights 48 33 39 59 45
Committee for Purchase From People Who Are Blind or Severely Disabled 71 79 64 64 68
Commodity Futures Trading Commission 65 61 57 51 53
Consumer Product Safety Commission 64 60 60 57 60
Corporation for National and Community Service 65 65 60 59 59
Defense Nuclear Facilities Safety Board 74 73 54 47 63
Export-Import Bank of the United States 54 48 46 44 56
Farm Credit Administration – – – – 67
Farm Credit System Insurance Corporation – – – – –
Federal Election Commission 60 56 53 50 45
Federal Housing Finance Agency 51 51 55 55 57
Federal Labor Relations Authority 63 68 62 71 77
Federal Maritime Commission 59 37 45 44 59
Federal Mediation and Conciliation Service 65 67 73 74 79
Federal Retirement Thrift Investment Board 61 63 64 70 72
Institute of Museum and Library Services 57 55 56 63 45
Inter-American Foundation 48 34 45 37 48
International Boundary and Water Commission 44 48 48 48 47
Marine Mammal Commission 86 91 77 – –
Merit Systems Protection Board 64 63 61 56 65
National Capital Planning Commission 68 71 74 61 75
National Endowment for the Arts 60 62 68 59 63
NOTE: A dash (–) indicates no data available.
Appendix H: New IQ Index Trends (continued)
H3: New IQ Index Trends – Open (continued)
Small/Independent Agencies 2011 2012 2013 2014 2015
Small Agencies Combined 59 58 58 57 59
Appendix H3: New IQ Index Trends – Open
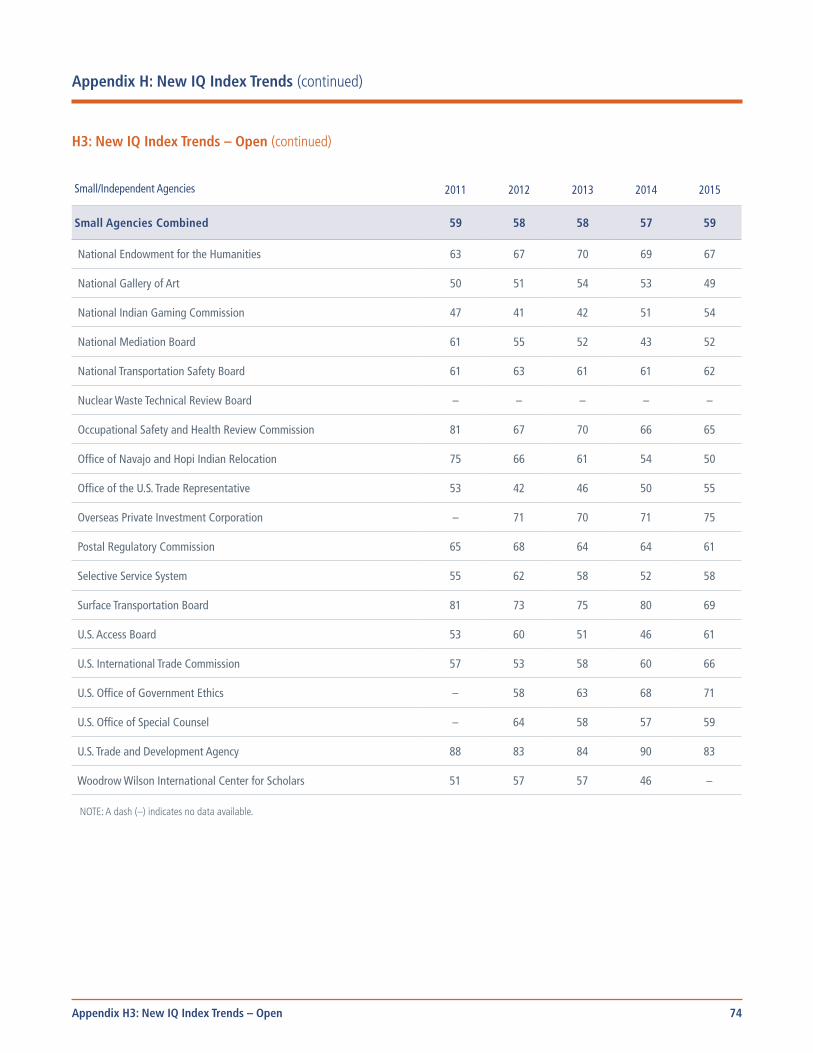
74
National Endowment for the Humanities 63 67 70 69 67
National Gallery of Art 50 51 54 53 49
National Indian Gaming Commission 47 41 42 51 54
National Mediation Board 61 55 52 43 52
National Transportation Safety Board 61 63 61 61 62
Nuclear Waste Technical Review Board – – – – –
Occupational Safety and Health Review Commission 81 67 70 66 65
Office of Navajo and Hopi Indian Relocation 75 66 61 54 50
Office of the U.S. Trade Representative 53 42 46 50 55
Overseas Private Investment Corporation – 71 70 71 75
Postal Regulatory Commission 65 68 64 64 61
Selective Service System 55 62 58 52 58
Surface Transportation Board 81 73 75 80 69
U.S. Access Board 53 60 51 46 61
U.S. International Trade Commission 57 53 58 60 66
U.S. Office of Government Ethics – 58 63 68 71
U.S. Office of Special Counsel – 64 58 57 59
U.S. Trade and Development Agency 88 83 84 90 83
Woodrow Wilson International Center for Scholars 51 57 57 46 –
NOTE: A dash (–) indicates no data available.
Appendix H: New IQ Index Trends (continued)
H3: New IQ Index Trends – Open (continued)
Small/Independent Agencies 2011 2012 2013 2014 2015
Small Agencies Combined 59 58 58 57 59
Appendix H3: New IQ Index Trends – Open
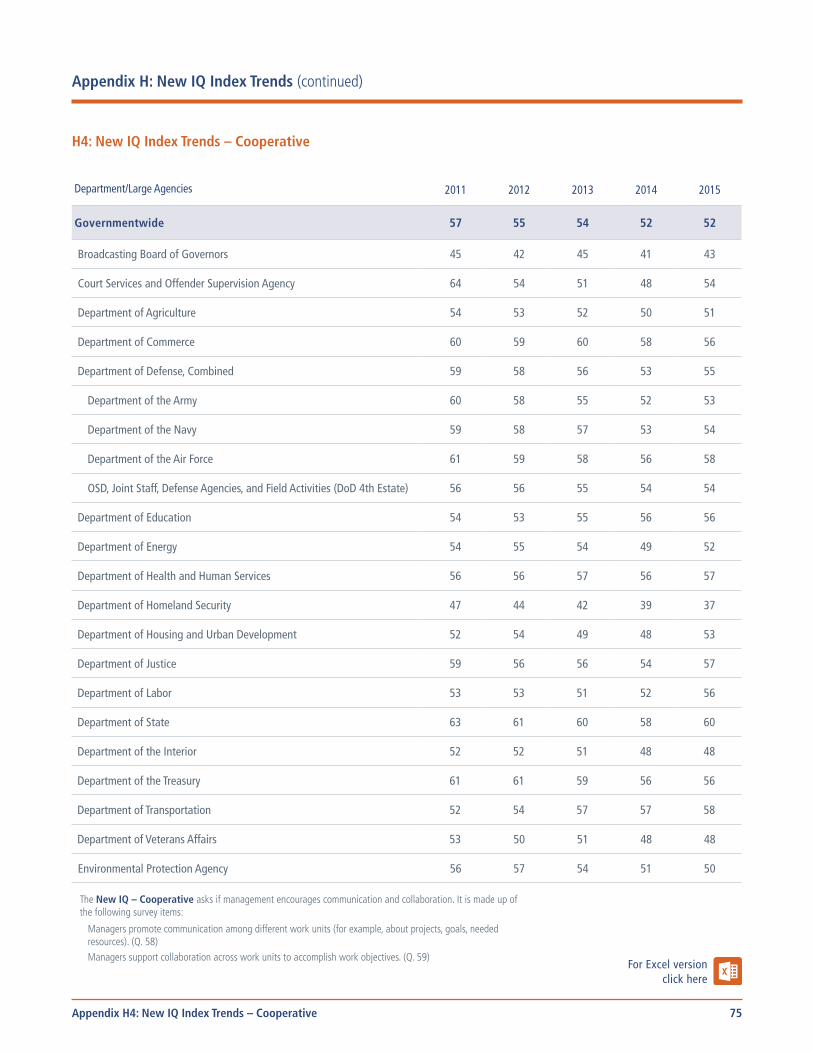
75
H4: New IQ Index Trends – Cooperative
2011 2012 2013 2014 2015Department/Large Agencies
Governmentwide 57 55 54 52 52
Broadcasting Board of Governors 45 42 45 41 43
Court Services and Offender Supervision Agency 64 54 51 48 54
Department of Agriculture 54 53 52 50 51
Department of Commerce 60 59 60 58 56
Department of Defense, Combined 59 58 56 53 55
Department of the Army 60 58 55 52 53
Department of the Navy 59 58 57 53 54
Department of the Air Force 61 59 58 56 58
OSD, Joint Staff, Defense Agencies, and Field Activities (DoD 4th Estate) 56 56 55 54 54
Department of Education 54 53 55 56 56
Department of Energy 54 55 54 49 52
Department of Health and Human Services 56 56 57 56 57
Department of Homeland Security 47 44 42 39 37
Department of Housing and Urban Development 52 54 49 48 53
Department of Justice 59 56 56 54 57
Department of Labor 53 53 51 52 56
Department of State 63 61 60 58 60
Department of the Interior 52 52 51 48 48
Department of the Treasury 61 61 59 56 56
Department of Transportation 52 54 57 57 58
Department of Veterans Affairs 53 50 51 48 48
Environmental Protection Agency 56 57 54 51 50
The New IQ – Cooperative asks if management encourages communication and collaboration. It is made up of the following survey items:
Managers promote communication among different work units (for example, about projects, goals, needed resources). (Q. 58)
Managers support collaboration across work units to accomplish work objectives. (Q. 59)
Appendix H: New IQ Index Trends (continued)
Appendix H4: New IQ Index Trends – Cooperative
For Excel version click here
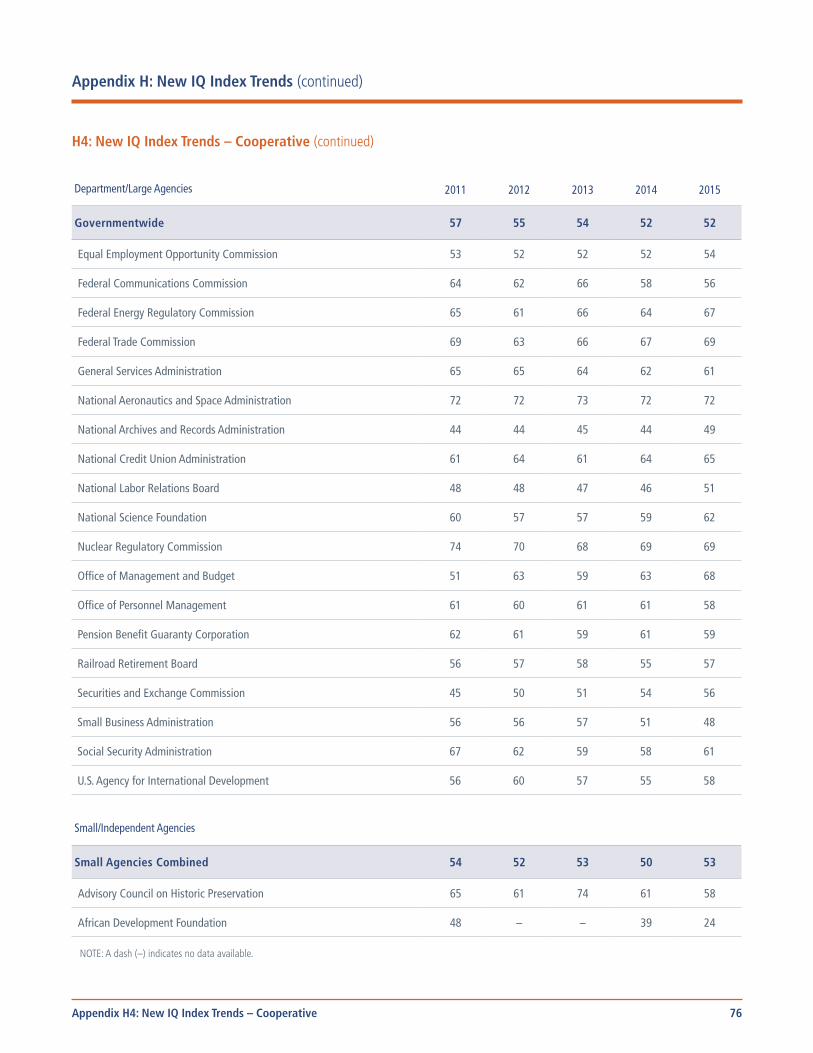
76
Equal Employment Opportunity Commission 53 52 52 52 54
Federal Communications Commission 64 62 66 58 56
Federal Energy Regulatory Commission 65 61 66 64 67
Federal Trade Commission 69 63 66 67 69
General Services Administration 65 65 64 62 61
National Aeronautics and Space Administration 72 72 73 72 72
National Archives and Records Administration 44 44 45 44 49
National Credit Union Administration 61 64 61 64 65
National Labor Relations Board 48 48 47 46 51
National Science Foundation 60 57 57 59 62
Nuclear Regulatory Commission 74 70 68 69 69
Office of Management and Budget 51 63 59 63 68
Office of Personnel Management 61 60 61 61 58
Pension Benefit Guaranty Corporation 62 61 59 61 59
Railroad Retirement Board 56 57 58 55 57
Securities and Exchange Commission 45 50 51 54 56
Small Business Administration 56 56 57 51 48
Social Security Administration 67 62 59 58 61
U.S. Agency for International Development 56 60 57 55 58
Small/Independent Agencies
Small Agencies Combined 54 52 53 50 53
Advisory Council on Historic Preservation 65 61 74 61 58
African Development Foundation 48 – – 39 24
NOTE: A dash (–) indicates no data available.
Appendix H: New IQ Index Trends (continued)
H4: New IQ Index Trends – Cooperative (continued)
Department/Large Agencies 2011 2012 2013 2014 2015
Governmentwide 57 55 54 52 52
Appendix H4: New IQ Index Trends – Cooperative
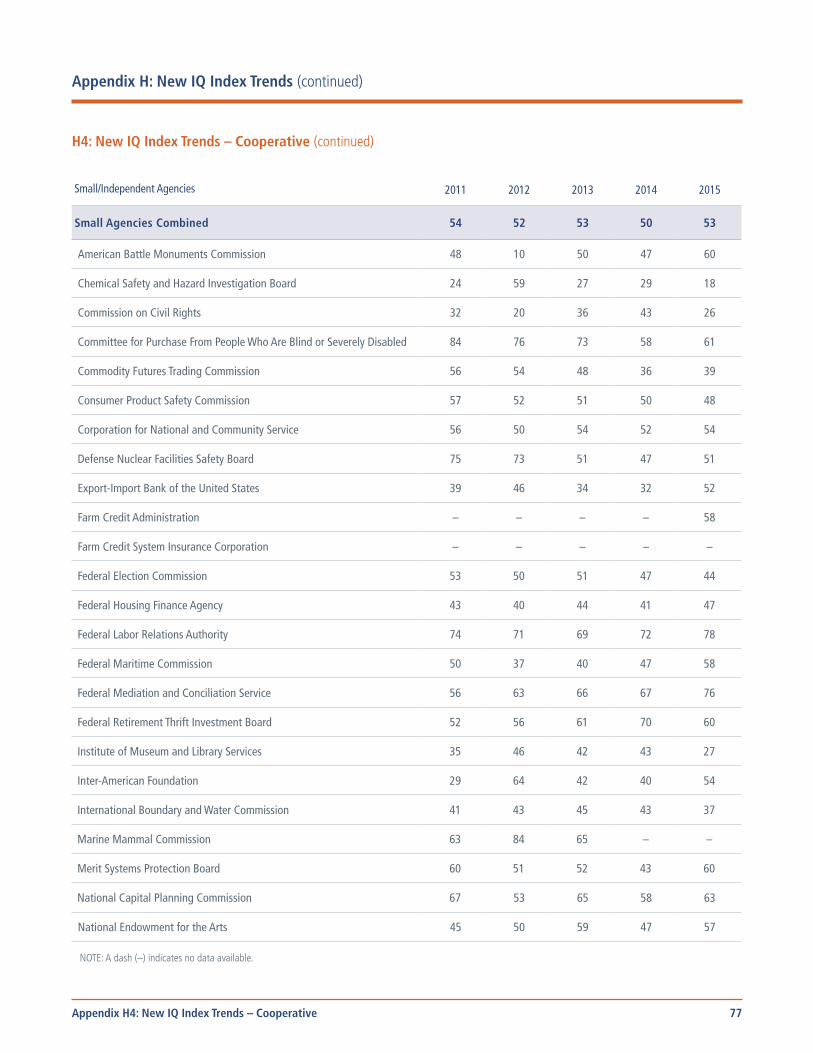
77
American Battle Monuments Commission 48 10 50 47 60
Chemical Safety and Hazard Investigation Board 24 59 27 29 18
Commission on Civil Rights 32 20 36 43 26
Committee for Purchase From People Who Are Blind or Severely Disabled 84 76 73 58 61
Commodity Futures Trading Commission 56 54 48 36 39
Consumer Product Safety Commission 57 52 51 50 48
Corporation for National and Community Service 56 50 54 52 54
Defense Nuclear Facilities Safety Board 75 73 51 47 51
Export-Import Bank of the United States 39 46 34 32 52
Farm Credit Administration – – – – 58
Farm Credit System Insurance Corporation – – – – –
Federal Election Commission 53 50 51 47 44
Federal Housing Finance Agency 43 40 44 41 47
Federal Labor Relations Authority 74 71 69 72 78
Federal Maritime Commission 50 37 40 47 58
Federal Mediation and Conciliation Service 56 63 66 67 76
Federal Retirement Thrift Investment Board 52 56 61 70 60
Institute of Museum and Library Services 35 46 42 43 27
Inter-American Foundation 29 64 42 40 54
International Boundary and Water Commission 41 43 45 43 37
Marine Mammal Commission 63 84 65 – –
Merit Systems Protection Board 60 51 52 43 60
National Capital Planning Commission 67 53 65 58 63
National Endowment for the Arts 45 50 59 47 57
NOTE: A dash (–) indicates no data available.
Appendix H: New IQ Index Trends (continued)
H4: New IQ Index Trends – Cooperative (continued)
Small/Independent Agencies 2011 2012 2013 2014 2015
Small Agencies Combined 54 52 53 50 53
Appendix H4: New IQ Index Trends – Cooperative

78
National Endowment for the Humanities 53 59 62 63 62
National Gallery of Art 53 50 54 56 50
National Indian Gaming Commission 29 30 38 47 47
National Mediation Board 46 48 49 28 52
National Transportation Safety Board 59 52 49 44 49
Nuclear Waste Technical Review Board – – – – –
Occupational Safety and Health Review Commission 86 66 74 69 69
Office of Navajo and Hopi Indian Relocation 83 70 70 67 63
Office of the U.S. Trade Representative 56 37 43 44 54
Overseas Private Investment Corporation – 72 70 70 79
Postal Regulatory Commission 65 65 65 59 63
Selective Service System 62 57 60 49 49
Surface Transportation Board 85 81 83 81 72
U.S. Access Board 47 43 34 31 45
U.S. International Trade Commission 53 52 62 67 69
U.S. Office of Government Ethics – 53 55 73 75
U.S. Office of Special Counsel – 50 55 50 54
U.S. Trade and Development Agency 90 88 90 87 83
Woodrow Wilson International Center for Scholars 55 61 42 49 –
NOTE: A dash (–) indicates no data available.
Appendix H: New IQ Index Trends (continued)
H4: New IQ Index Trends – Cooperative (continued)
Small/Independent Agencies 2011 2012 2013 2014 2015
Small Agencies Combined 54 52 53 50 53
Appendix H4: New IQ Index Trends – Cooperative
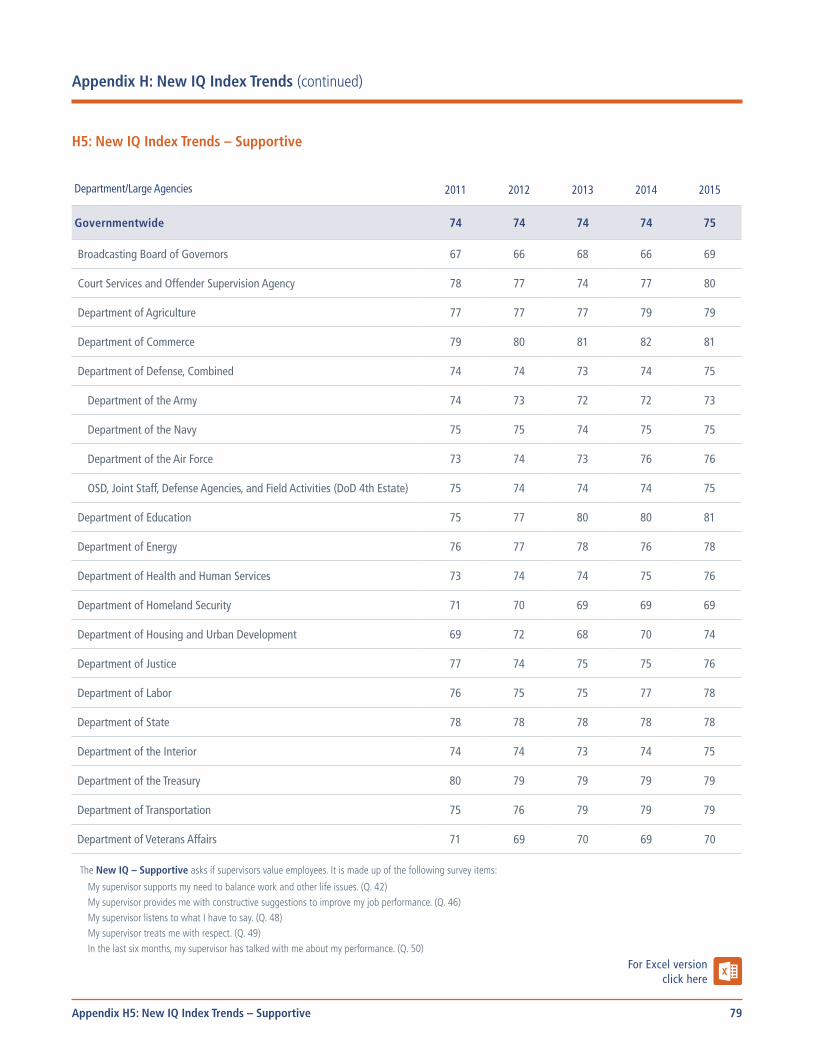
79
H5: New IQ Index Trends – Supportive
2011 2012 2013 2014 2015Department/Large Agencies
Governmentwide 74 74 74 74 75
Broadcasting Board of Governors 67 66 68 66 69
Court Services and Offender Supervision Agency 78 77 74 77 80
Department of Agriculture 77 77 77 79 79
Department of Commerce 79 80 81 82 81
Department of Defense, Combined 74 74 73 74 75
Department of the Army 74 73 72 72 73
Department of the Navy 75 75 74 75 75
Department of the Air Force 73 74 73 76 76
OSD, Joint Staff, Defense Agencies, and Field Activities (DoD 4th Estate) 75 74 74 74 75
Department of Education 75 77 80 80 81
Department of Energy 76 77 78 76 78
Department of Health and Human Services 73 74 74 75 76
Department of Homeland Security 71 70 69 69 69
Department of Housing and Urban Development 69 72 68 70 74
Department of Justice 77 74 75 75 76
Department of Labor 76 75 75 77 78
Department of State 78 78 78 78 78
Department of the Interior 74 74 73 74 75
Department of the Treasury 80 79 79 79 79
Department of Transportation 75 76 79 79 79
Department of Veterans Affairs 71 69 70 69 70
The New IQ – Supportive asks if supervisors value employees. It is made up of the following survey items:
My supervisor supports my need to balance work and other life issues. (Q. 42) My supervisor provides me with constructive suggestions to improve my job performance. (Q. 46) My supervisor listens to what I have to say. (Q. 48) My supervisor treats me with respect. (Q. 49) In the last six months, my supervisor has talked with me about my performance. (Q. 50)
Appendix H: New IQ Index Trends (continued)
Appendix H5: New IQ Index Trends – Supportive
For Excel version click here

80
Environmental Protection Agency 78 79 79 79 80
Equal Employment Opportunity Commission 75 77 75 75 76
Federal Communications Commission 79 81 83 79 78
Federal Energy Regulatory Commission 82 81 82 84 86
Federal Trade Commission 82 80 81 81 83
General Services Administration 79 78 80 81 81
National Aeronautics and Space Administration 83 84 85 85 86
National Archives and Records Administration 73 73 74 75 79
National Credit Union Administration 77 81 80 82 83
National Labor Relations Board 71 72 72 72 75
National Science Foundation 73 75 79 79 80
Nuclear Regulatory Commission 86 84 84 85 86
Office of Management and Budget 67 82 78 81 82
Office of Personnel Management 82 81 83 85 84
Pension Benefit Guaranty Corporation 80 78 75 78 80
Railroad Retirement Board 74 76 77 77 78
Securities and Exchange Commission 74 76 77 79 80
Small Business Administration 75 75 76 76 74
Social Security Administration 78 75 75 77 78
U.S. Agency for International Development 71 74 74 73 76
Small/Independent Agencies
Small Agencies Combined 78 76 77 77 78
Advisory Council on Historic Preservation 74 79 92 86 74
NOTE: A dash (–) indicates no data available.
Appendix H: New IQ Index Trends (continued)
H5: New IQ Index Trends – Supportive (continued)
Department/Large Agencies 2011 2012 2013 2014 2015
Governmentwide 74 74 74 74 75
Appendix H5: New IQ Index Trends – Supportive
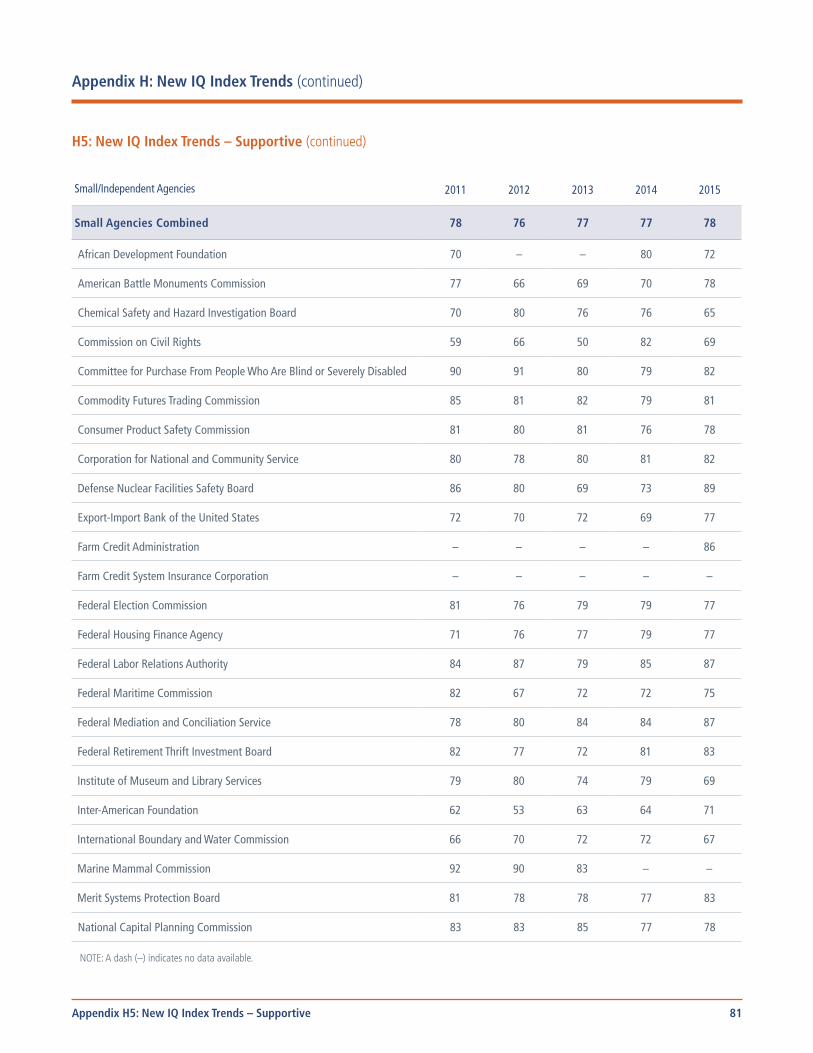
81
African Development Foundation 70 – – 80 72
American Battle Monuments Commission 77 66 69 70 78
Chemical Safety and Hazard Investigation Board 70 80 76 76 65
Commission on Civil Rights 59 66 50 82 69
Committee for Purchase From People Who Are Blind or Severely Disabled 90 91 80 79 82
Commodity Futures Trading Commission 85 81 82 79 81
Consumer Product Safety Commission 81 80 81 76 78
Corporation for National and Community Service 80 78 80 81 82
Defense Nuclear Facilities Safety Board 86 80 69 73 89
Export-Import Bank of the United States 72 70 72 69 77
Farm Credit Administration – – – – 86
Farm Credit System Insurance Corporation – – – – –
Federal Election Commission 81 76 79 79 77
Federal Housing Finance Agency 71 76 77 79 77
Federal Labor Relations Authority 84 87 79 85 87
Federal Maritime Commission 82 67 72 72 75
Federal Mediation and Conciliation Service 78 80 84 84 87
Federal Retirement Thrift Investment Board 82 77 72 81 83
Institute of Museum and Library Services 79 80 74 79 69
Inter-American Foundation 62 53 63 64 71
International Boundary and Water Commission 66 70 72 72 67
Marine Mammal Commission 92 90 83 – –
Merit Systems Protection Board 81 78 78 77 83
National Capital Planning Commission 83 83 85 77 78
NOTE: A dash (–) indicates no data available.
Appendix H: New IQ Index Trends (continued)
H5: New IQ Index Trends – Supportive (continued)
Small/Independent Agencies 2011 2012 2013 2014 2015
Small Agencies Combined 78 76 77 77 78
Appendix H5: New IQ Index Trends – Supportive

82
National Endowment for the Arts 84 82 83 80 81
National Endowment for the Humanities 79 83 84 80 82
National Gallery of Art 71 69 73 72 68
National Indian Gaming Commission 74 64 70 65 67
National Mediation Board 79 73 74 68 74
National Transportation Safety Board 75 78 76 78 77
Nuclear Waste Technical Review Board – – – – –
Occupational Safety and Health Review Commission 88 77 79 85 74
Office of Navajo and Hopi Indian Relocation 86 79 78 77 67
Office of the U.S. Trade Representative 70 63 71 75 66
Overseas Private Investment Corporation – 85 85 85 88
Postal Regulatory Commission 76 79 83 71 80
Selective Service System 72 78 75 75 85
Surface Transportation Board 90 86 87 92 84
U.S. Access Board 70 75 64 73 66
U.S. International Trade Commission 78 76 79 80 81
U.S. Office of Government Ethics – 76 71 84 86
U.S. Office of Special Counsel – 90 89 86 78
U.S. Trade and Development Agency 87 90 81 90 90
Woodrow Wilson International Center for Scholars 78 71 75 69 –
NOTE: A dash (–) indicates no data available.
Appendix H: New IQ Index Trends (continued)
H5: New IQ Index Trends – Supportive (continued)
Small/Independent Agencies 2011 2012 2013 2014 2015
Small Agencies Combined 78 76 77 77 78
Appendix H5: New IQ Index Trends – Supportive
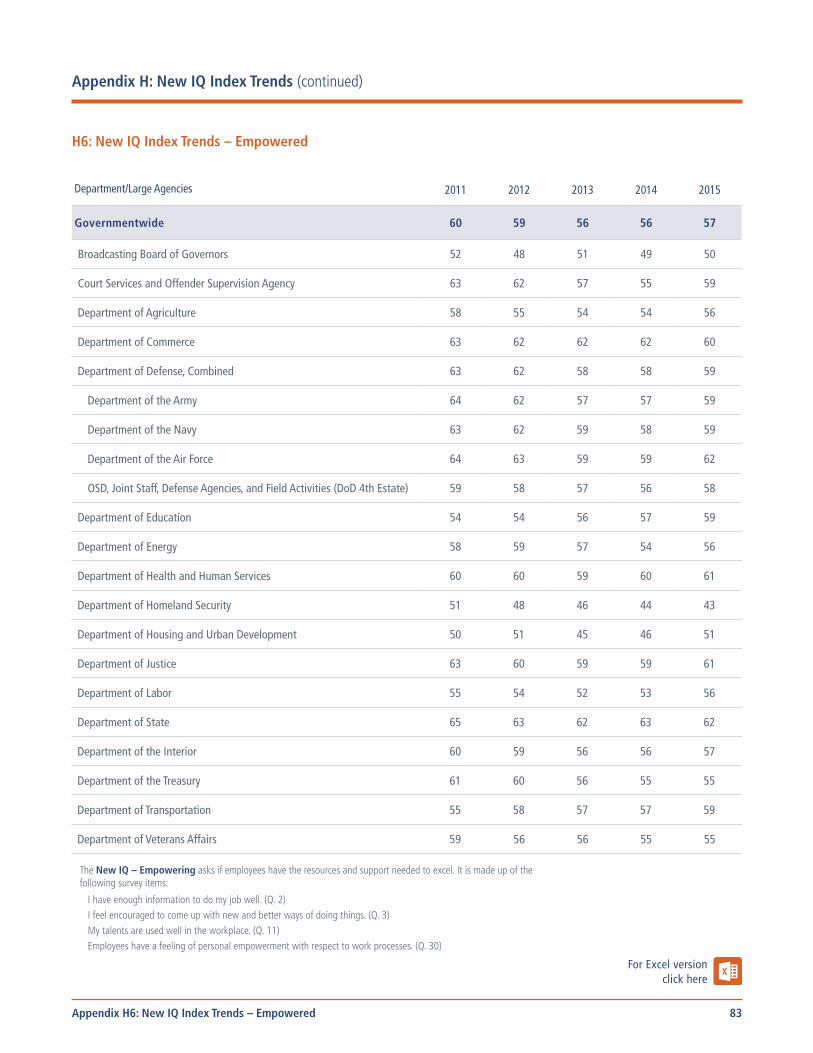
83
H6: New IQ Index Trends – Empowered
2011 2012 2013 2014 2015Department/Large Agencies
Governmentwide 60 59 56 56 57
Broadcasting Board of Governors 52 48 51 49 50
Court Services and Offender Supervision Agency 63 62 57 55 59
Department of Agriculture 58 55 54 54 56
Department of Commerce 63 62 62 62 60
Department of Defense, Combined 63 62 58 58 59
Department of the Army 64 62 57 57 59
Department of the Navy 63 62 59 58 59
Department of the Air Force 64 63 59 59 62
OSD, Joint Staff, Defense Agencies, and Field Activities (DoD 4th Estate) 59 58 57 56 58
Department of Education 54 54 56 57 59
Department of Energy 58 59 57 54 56
Department of Health and Human Services 60 60 59 60 61
Department of Homeland Security 51 48 46 44 43
Department of Housing and Urban Development 50 51 45 46 51
Department of Justice 63 60 59 59 61
Department of Labor 55 54 52 53 56
Department of State 65 63 62 63 62
Department of the Interior 60 59 56 56 57
Department of the Treasury 61 60 56 55 55
Department of Transportation 55 58 57 57 59
Department of Veterans Affairs 59 56 56 55 55
The New IQ – Empowering asks if employees have the resources and support needed to excel. It is made up of the following survey items:
I have enough information to do my job well. (Q. 2) I feel encouraged to come up with new and better ways of doing things. (Q. 3) My talents are used well in the workplace. (Q. 11) Employees have a feeling of personal empowerment with respect to work processes. (Q. 30)
Appendix H: New IQ Index Trends (continued)
Appendix H6: New IQ Index Trends – Empowered
For Excel version click here
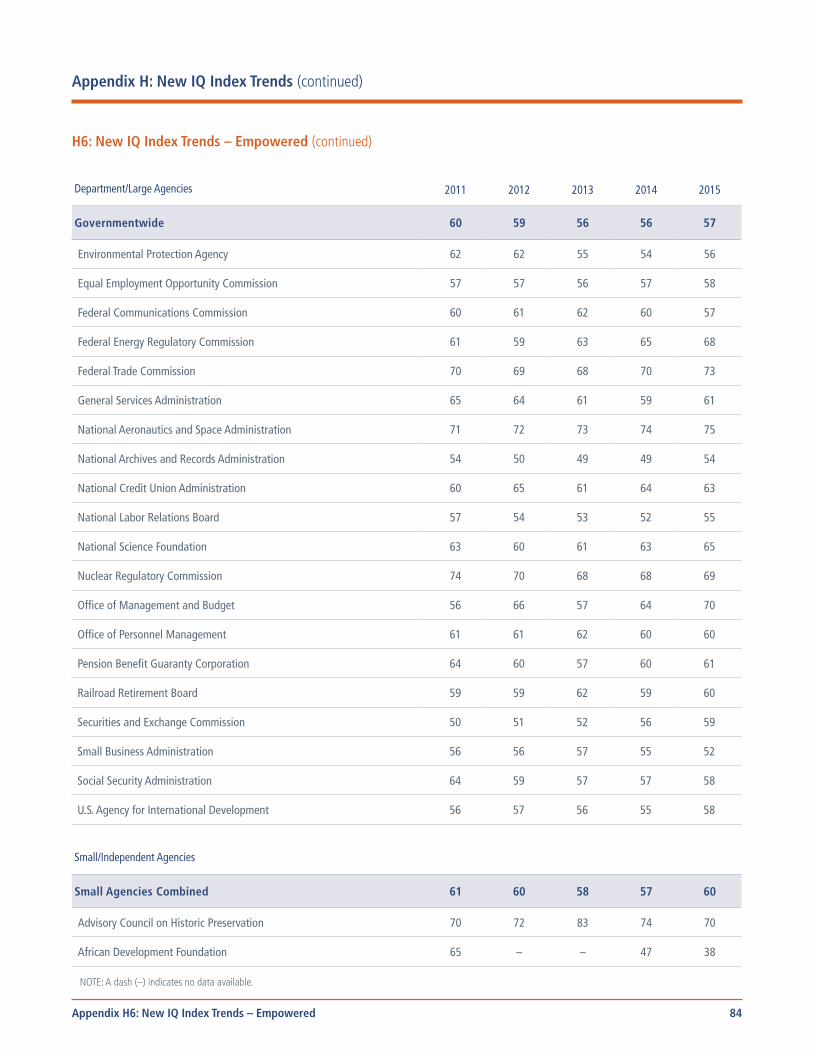
84
Environmental Protection Agency 62 62 55 54 56
Equal Employment Opportunity Commission 57 57 56 57 58
Federal Communications Commission 60 61 62 60 57
Federal Energy Regulatory Commission 61 59 63 65 68
Federal Trade Commission 70 69 68 70 73
General Services Administration 65 64 61 59 61
National Aeronautics and Space Administration 71 72 73 74 75
National Archives and Records Administration 54 50 49 49 54
National Credit Union Administration 60 65 61 64 63
National Labor Relations Board 57 54 53 52 55
National Science Foundation 63 60 61 63 65
Nuclear Regulatory Commission 74 70 68 68 69
Office of Management and Budget 56 66 57 64 70
Office of Personnel Management 61 61 62 60 60
Pension Benefit Guaranty Corporation 64 60 57 60 61
Railroad Retirement Board 59 59 62 59 60
Securities and Exchange Commission 50 51 52 56 59
Small Business Administration 56 56 57 55 52
Social Security Administration 64 59 57 57 58
U.S. Agency for International Development 56 57 56 55 58
Small/Independent Agencies
Small Agencies Combined 61 60 58 57 60
Advisory Council on Historic Preservation 70 72 83 74 70
African Development Foundation 65 – – 47 38
NOTE: A dash (–) indicates no data available.
Appendix H: New IQ Index Trends (continued)
H6: New IQ Index Trends – Empowered (continued)
Department/Large Agencies 2011 2012 2013 2014 2015
Governmentwide 60 59 56 56 57
Appendix H6: New IQ Index Trends – Empowered
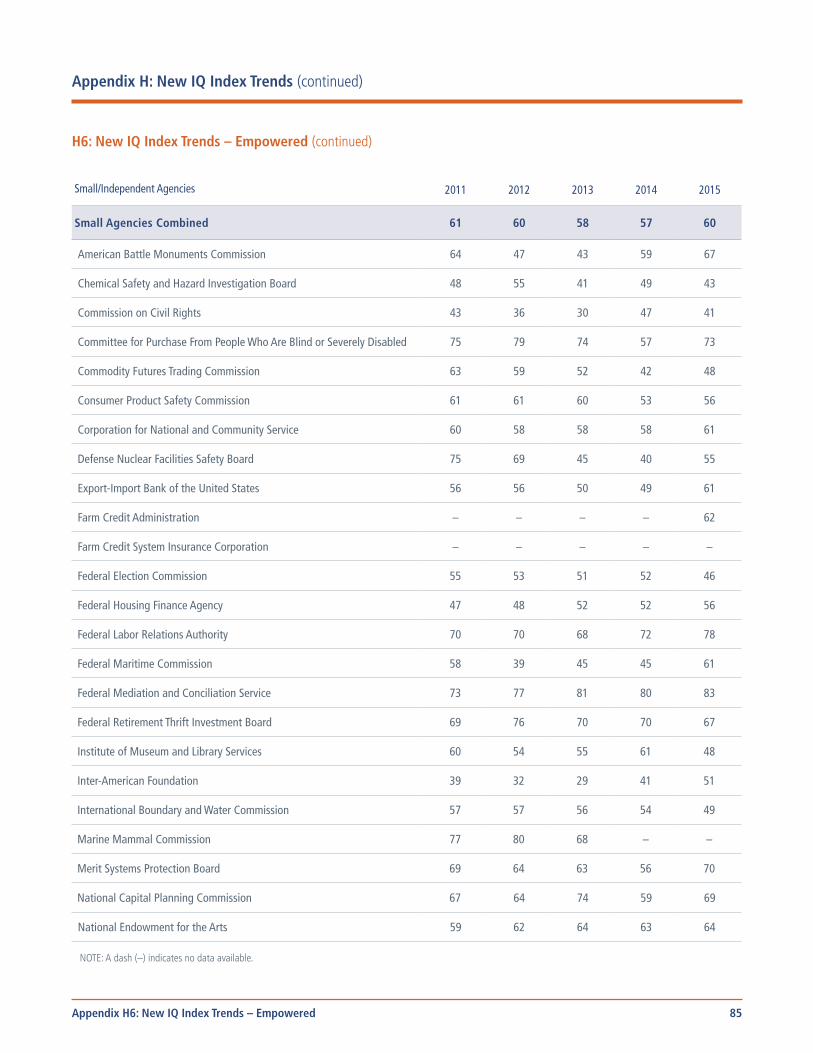
85
American Battle Monuments Commission 64 47 43 59 67
Chemical Safety and Hazard Investigation Board 48 55 41 49 43
Commission on Civil Rights 43 36 30 47 41
Committee for Purchase From People Who Are Blind or Severely Disabled 75 79 74 57 73
Commodity Futures Trading Commission 63 59 52 42 48
Consumer Product Safety Commission 61 61 60 53 56
Corporation for National and Community Service 60 58 58 58 61
Defense Nuclear Facilities Safety Board 75 69 45 40 55
Export-Import Bank of the United States 56 56 50 49 61
Farm Credit Administration – – – – 62
Farm Credit System Insurance Corporation – – – – –
Federal Election Commission 55 53 51 52 46
Federal Housing Finance Agency 47 48 52 52 56
Federal Labor Relations Authority 70 70 68 72 78
Federal Maritime Commission 58 39 45 45 61
Federal Mediation and Conciliation Service 73 77 81 80 83
Federal Retirement Thrift Investment Board 69 76 70 70 67
Institute of Museum and Library Services 60 54 55 61 48
Inter-American Foundation 39 32 29 41 51
International Boundary and Water Commission 57 57 56 54 49
Marine Mammal Commission 77 80 68 – –
Merit Systems Protection Board 69 64 63 56 70
National Capital Planning Commission 67 64 74 59 69
National Endowment for the Arts 59 62 64 63 64
NOTE: A dash (–) indicates no data available.
Appendix H: New IQ Index Trends (continued)
H6: New IQ Index Trends – Empowered (continued)
Small/Independent Agencies 2011 2012 2013 2014 2015
Small Agencies Combined 61 60 58 57 60
Appendix H6: New IQ Index Trends – Empowered
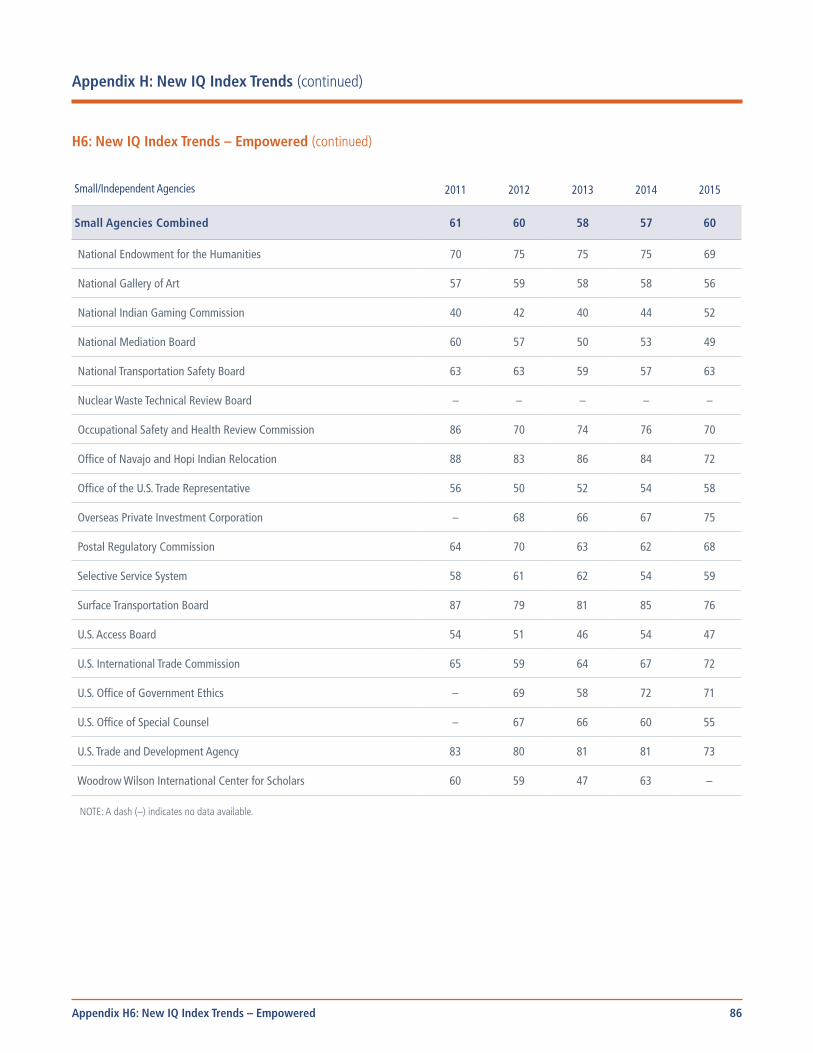
86
National Endowment for the Humanities 70 75 75 75 69
National Gallery of Art 57 59 58 58 56
National Indian Gaming Commission 40 42 40 44 52
National Mediation Board 60 57 50 53 49
National Transportation Safety Board 63 63 59 57 63
Nuclear Waste Technical Review Board – – – – –
Occupational Safety and Health Review Commission 86 70 74 76 70
Office of Navajo and Hopi Indian Relocation 88 83 86 84 72
Office of the U.S. Trade Representative 56 50 52 54 58
Overseas Private Investment Corporation – 68 66 67 75
Postal Regulatory Commission 64 70 63 62 68
Selective Service System 58 61 62 54 59
Surface Transportation Board 87 79 81 85 76
U.S. Access Board 54 51 46 54 47
U.S. International Trade Commission 65 59 64 67 72
U.S. Office of Government Ethics – 69 58 72 71
U.S. Office of Special Counsel – 67 66 60 55
U.S. Trade and Development Agency 83 80 81 81 73
Woodrow Wilson International Center for Scholars 60 59 47 63 –
NOTE: A dash (–) indicates no data available.
Appendix H: New IQ Index Trends (continued)
H6: New IQ Index Trends – Empowered (continued)
Small/Independent Agencies 2011 2012 2013 2014 2015
Small Agencies Combined 61 60 58 57 60
Appendix H6: New IQ Index Trends – Empowered
United States Office of Personnel Management Planning and Policy Analysis
1900 E Street, NW Washington, DC 20415
www.opm.gov/FEVS