Embed Size (px)
Citation preview
FEDERAL EMERGENCY MANAGEMENT AGENCY
Inventory of Lifelines in the Cajon-Pass, California
Issued in Furtherance of the Decadefor Natural Disaster Reduction
Earthquake Hazard Reduction Series 60
FEMA 225 1 February 1932:
Rv. \. . /I I Y

Inventory of Lifelines in the CajonPass, California
Submitted to the Federal Emergency Management AgencyWashington, D.C.
Submitted by:
INTECH Inc.11316 Rouen Dr.
Potomac, MD 20854-3126
Submitted August 1991
Co-Principal Investigators:Dr. Phillip A. Lowe, INTEC, Inc.
Dr. Charles F. Scheffey, INTEC, Inc.Mr. Po Lam, Earth Mechanics, Inc.
INVENTORY OF LIFELINES IN THE CAJON PASS, CALIFORNIA
TABLE OF CONTENTSITEM
List of Figures ......................List of Tables .... . ......
INTRODUCTION ANDBACKGROUND. ...................BACKGROUND .............. ......PURPOSE, GOALS, AND STUDY APPROACH . .......................BIBLIOGRAPHY FOR SECTION 1.0 ..............................
EXECUTIVE SUMMARY ................................................SULbARY ................... ..BIBLIOGRAPHY FOR SECTION 2.0 ....................
PAGE
448
3.0 SITE CONDITIONS AND LIFELINES .................................
3.1 SITE CONDITIONS .............................................3.1.1 Fault Information and Ground Rupture (Displacement) Potential3.1.2 Soil and Bedrock Conditions ..................................3.1.3 Seismic Events .............................................3.1.4 Ground Shaking Hazards .........................................3.1.5 Topographic and Ground Relief Features and Landslide Hazards .3.1.6 Hydraulic, Groundwater Conditions, and Liquefaction Potential .3.1.7 Bibliography For Section 3.1 .................................
3.2 COMMUNICATION LIFELINES ..................................3.2.1 Fiber Optic Cables ...............................3.2.2 Microwave and Radio Towers ............................3.2.3 Bibliography For Section 3.2 .......................
3.3 ELECTRICAL POWER LIFELINES ..........................3.3.1 Los Angeles Department of Water & Power Facilities3.3.2 Southern California Edison Company Facilities .....3.3.3 Bibliography For Section 3.3 ......................
3.43.4.13.4.23.4.3
3.53.5.13.5.23.5.3
FUEL TRANSPORTATION LIFELINES ......................Natural Gas Pipelines .............................Liquid Fuel Pipelines .............................Bibliography For Section 3.4 ......................
TRANSPORTATION LIFELINES .............Highways ..........................................Railways ........................ .............Bibliography For Section 3 .5 .....................
440 CONTACTS MADE DURING THE STUDY .....................................
Appendix A Details for Figure 3.1-7, Earthquake Faults
89141617182127
30323739
39394346
46485356
56566469
69
71
i
2.02.12.1
............
.............A........
.......... . .
............
................. +
*. . . I.....
.. S.. +.......
............
............
............
LIST OF FIGURES
FIGURE PAGE
1-1 Map of the Cajon Pass Area ...................................... 3
2-1 Composite Map of Lifelines in the Cajon Pass Study Area ... ...... 6
3.1-1 Regional Fault Map ............................................ 103.1-2 Active Fault Locations in the Study Area ...................... 113.1-3 Cajon Pass Region Geologic Units With High Water Table
Identified ................................................... 153.1-4 Observed Landslides Within the Study Area .................... 193.1-5 Rebuilt Power Transmission Towers on a Landslide Scar ... ...... 203.1-6 Landslide Scar in Lone Pine Canyon Along the San Andreas
Fault Zone .................................................................... 203.1-7 Location of Shallow Water Table Conditions ..................... 23
3.2-1 Map of the Communication Lifelines ............................ 313.2-2 Looking North on Old Highway 66 (Cajon Canyon Road)............. 323.2-3 Fiber Optic Conduits Crossing a Cajon Canyon Road Bridge ......343.2-4 Details of the Fiber Optic Conduits and Hangers on a Cajon
Canyon Road Bridge ............................................ 343.2-5 Crib Wall Retaining the Southbound Lanes of I-15 With Fiber
Optic Conduits Buried at the Wall Toe ......................... 353.2-6 Details of Fiber Optic Conduit Supports on the Concrete
Culvert Wall .................................................. 353.2-7 Fiber Optic Conduits Heading Under I-15 Attached to a
Concrete Culvert Wall ......................................... 363.2-8 A Fiber Optic Conduit Hung From A Bridge With A Water
Distribution Pipe Directly Above It ........................... 38
3.3-1 Map of the Electric Power Lifelines .......... w................ 403.3-2 A View of Power Lines & Buried Fuel Pipelines Crossing the
San Andreas Fault Zone ......... ............................... 413.3-3 Power Towers at the Edge of a Steep Ravine Near the San
Andreas Fault Zone ............................................ 423.3-4 Lugo Substation Control Facilities & Equipment .... ............ 443.3-5 Lugo Substation Circuit Breakers .............................. 443.3-6 Typical Electric Transmission Tower Footings .................. 45
3.4-1 Map of the Fuel Pipeline Lifelines ............................ 473.4-2 Natural Gas Pipeline Crossing Under Two Railroads ... .......... 493.4-3 An Exposed Section of The Natural Gas Pipeline ................503.4-4 Details of the Ground Support For Exposed Sections of
Natural Gas Pipelines ......................................... 513.4-5 Natural Gas Pipeline Valve Station on Baldy Mesa Rd. ... ....... 523.4-6 The Natural Gas Pipeline Crossing the California Aqueduct ..... 523.4-7 The Petroleum Products Pipeline Valve Station on the Shoulder
of Baldy Mesa Rd. ............................................. 54
ii
LIST OF FIGURES (Continued)
FIGURE PAGE
3.4-8 Petroleum Products Pipelines Hung Under the Baldy Mesa Rd.Bridge Over the California Aqueduct ........................... 55
3.5-1 Map of the Transportation Lifelines ............................ 573.5-2 I-15 Bridge Over Lytle Creek Wash ............................. 593.5-3 I-15 Bridge Over Cajon Creek Wash ........................... 59,3.5-4 I-15 Bridge Over Kenwood Avenue ............................ 603.5-5 I-15 Arch Bridge Over Matthews Road . 613.5-6 1-15 Box Bridge Over the Railroad ............................... 623.5-7 I-15 & Access Road Bridges Over the Railroad .. 623.5-8 Highway 138 Cut & Fill at Cajon Junction . 633.5-9 Railroad Bridges in Cajon Wash, I-15 Bridge in Background .653.5-10 Concrete Beam Railroad Bridge in Cajon Creek Near Cajon
Junction ............ .... . 663.5-11 Rubble Pier Railroad Bridge in Cajon Creek Near Cajon Junction. 673.5-12 Ballasted Deck Railroad Bridge Over Highway 138 . 673.5-13 Highway 138 Bridge Over Railroad at Cajon Junction ............ 673.5-14 Railroad Tunnel North of Cajon Junction ....................... 633.5-15 Typical Short Span Railroad Bridges North of Cajon Junction ... 68
LIST OF TABLES
TABLE PAGE
3.1-1 Depth to Ground Water Measured From Wells ..................... 24
iii
INVENTORY OF LIFELINES IN THE CAJON PASS, CALIFORNIA
1.0 INTRODUCTION AND BACKGROUND
1.1 BACKGROUND
Lifelines (e.g., communication, electric power, liquid fuels, natural gas,transportation, water and sewer systems, etc.) are presently being sitedin "utility or transportation corridors" to reduce their right-of-wayenvironmental, aesthetic, and cost impacts on the community and on landuse. The individual lifelines are usually constructed or modified atdifferent time periods, resulting in their being built to differentstandards and in different siting criteria being applied to differentsegments of an individual lifeline or to different lifelines that providesimilar functions. Presently, the siting review usually does not considerthe impact of the proximity or collocation of one lifeline upon the riskto or vulnerability of other lifelines from natural or manmade hazards ordisasters, either because the other lifelines have not yet been installedor because such a consideration has not been identified as a factor in thesiting evaluation.
In August 1988, a train derailment in northern California also damaged apetroleum pipeline which was buried along the railroad right-of-way. Theresult was a spill of the pipeline fluids in addition to the derailment(but no significant loss of property and no injuries to orcasualties), 1 . The State of California Office of the Fire Marshallbecame involved as it is the California agent responsible for theinspection and enforcement of safety criteria for pipelines that transportliquids. When another derailment in San Bernardino occurred in May l989cl2), which resulted in severe property damage and the loss of life, theOffice of the Fire Marshall also responded to see if the derailment hadimpacted a petroleum products pipeline that was buried along the railroadright-of-way. It was decided that the pipeline was not damaged, and thefire and safety personnel turned over the site to the railroad to allowthem to clean up the site. About a week later the pipeline ruptured andthe resulting fire caused considerable property damage and loss of life.The subsequent investigations12) concluded that the pipeline may have beendamaged during the derailment, but that the most probable cause of itsdamage was the derailment clean up operations.
In a similar sense, communication lines along a highway bridge would bevulnerable to failure if the bridge were to displace or fail during adisaster event. In fact, frequently highway bridges and overpasses areused to route other lifelines, such as communications and pipelines, overcauseways and water bodies. Such lifelines can be damaged by failure ofthe superstructure, bridge foundation movement, or ground deformation
1Numbers in parentheses refer to the bibliography found at the end of
each major report section.
1
along the approaches to the bridge. Settlement and lateral displacementadjacent to abutments have been especially troublesome because suchmovements tend to impose deformations on the lifelines where they arelocally constrained at the attachment or penetration of the abutment.
There are many such examples of lifeline interdependency that occurredduring the 1989 Loma Prieta earthquake. For example'(1-3' 4), the lack offire fighting water in the Marina district resulted from pipelinefailures. Failed water pipelines have caused ground erosion that hasfailed the foundations of other lifelines. Loss of electric powerprevented the fire department from closing remote, electrically-controlledvalves that were intended to isolate damaged portions of the waterlifeline system. This resulted in the loss of the use of storagereservoirs and the ability to provide critically needed, fire fightingwater. Electrical failures and shorts have ignited leaks from fuelpipelines, increasing the level of damage associated with the failed fluedelivery lifeline.
In response to these types of situations, the Federal Emergency ManagementAgency (FEMA) is focusing attention on the use of such corridors, and theyinitiated this study to examine the impacts of siting multiple lifelinesystems in confined and at-risk areas.
1.2 PURPOSE, GOALS, AND STUDY APPROACH
The overall FEMA project goals are to develop, for multiple lifelinesystems in confined and at-risk areas, a managerial tool that can be usedto increase the understanding of the lifeline systems' vulnerabilities andto help identify potential mitigation approaches that could be used toreduce those vulnerabilities. The goals also are to identify methods toenhance the transfer of the resulting information to lifeline systemproviders, designers, builders, managers, operators, users, andregulators.
To provide a specific example of how the managerial tool can be used, itwas decided that the methods should be applied to the lifelines in theCajon Pass, California, for an assumed earthquake event at the Pass.
The purpose of this report is to provide an inventory of the majorlifeline systems in the Cajon Pass and the earthquake and geologicanalysis tools available to identify and define the level of seismic riskto those lifelines. The information in this report can then become avalidated data base for use in the development of the required analysismethodology for evaluating the impact of proximity or collocation oflifelines on the vulnerability of nearby lifelines.
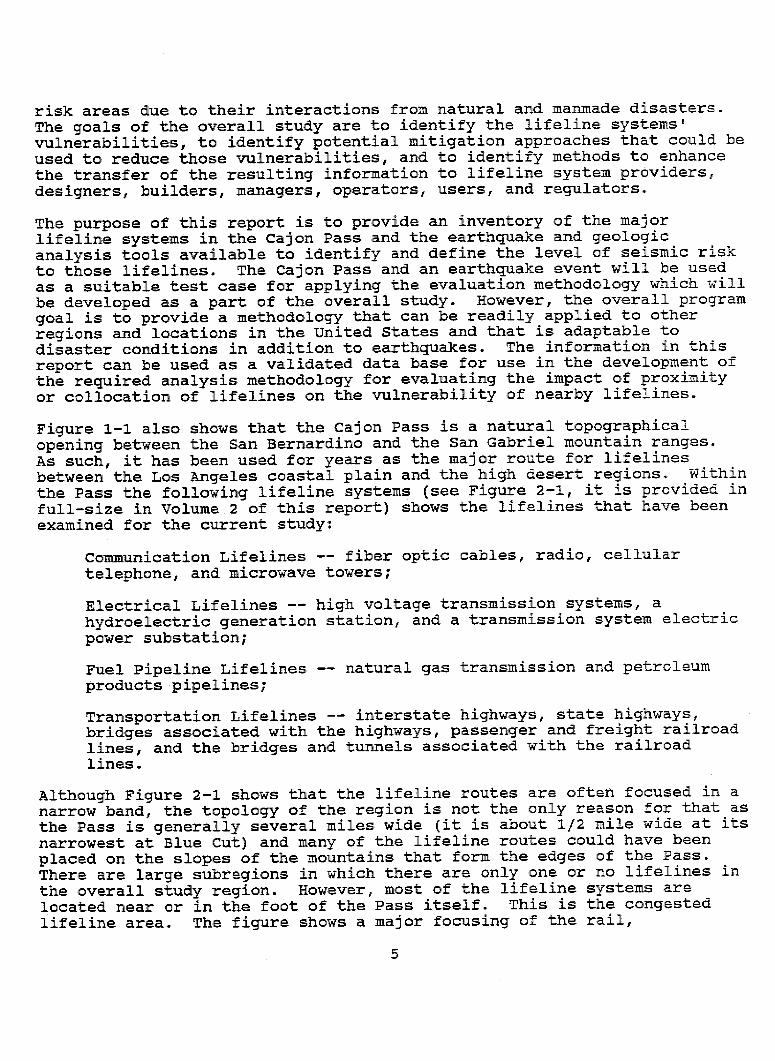
Figure 1-1 is a reproduction of a highway map (courtesy of the AutomobileClub of Southern California) of the San Bernardino, California, area(1:250,000-scale). The locations of the Cajon Pass study area and the May12, 1989, train derailment and the subsequent May 25, 1989, petroleumproducts pipeline rupture are identified on the map.
2

Figure 1-1, Map of the Cajoni Pass Area
L ~ ~~ ~
MUS~~ ~ ~ ~ ~ ~ ~ ~ M
wi iML','11 -
~~~~~~~~-~ ~ ~ ~ ~ -
-- ~~~~~ ~~~ -AU MBI 4- OFSOUTHERN CALIFORNIA _
a DY~~~~~~~~~~~~~~~~~~t
CUCAMONGA __-fBERNA I O0 ' - -~~----1-f4UTANPEEIAL - . -'-
MON__ -~~~~~~~~~~~~~~~~~~~~~~~- - ~~~~~~~~~~~~~~~~ -=0P
PC-RVERSDE ~i-I¶R~
~INORCI 7-1 HILLS~~~~~~~~LUE~A1UA
~~J' - A~~~uh~~Th~ ~ a~~aaa'~~~ SUNTh~~~~E-X
OE GARDR U.
3
The methodology used in developing the information for this report is asfollows. Site reconnaissance surveys of the Cajon Pass were made tofamiliarize the researchers with the specific site conditions and toidentify areas of special interest. Contacts were then made with eachlifeline system owner and the study information needs were explained. Theowners responded with engineering data on their specific system(s).Contact also was made with the regulatory agencies as well as withappropriate emergency planners. Those direct contacts provided basic dataon each lifeline system, and they provided validation of the data (or insome cases raised questions as to our understanding of the data).Additional site visits were then made to confirm and further validate theavailable data. This report was then prepared, with heavy reliance on thevalidated data or on the data provided by each lifeline owner. As a finalvalidation of the work, the draft report was submitted to eachorganization that provided information for the report with the requestthat it review the material to assure that the information provided wasnot misunderstood or to provide additional clarification data whenappropriate.
Section 2.0 of this report presents an executive summary of the study. Italso adds a discussion in which all of the separate data are combined ontoa single map to identify the regions of greatest congestion. Section 3.0presents the specific data for the lifeline systems and the seismic dataand codes available to determine the earthquake impact on those lifelines.Section 4.0 presents a list of the organizations contacted during thisstudy.
1.3 BIBLIOGRAPHY FOR SECTION 1.0
1-1 Source of information: conversations with the State of CaliforniaOffice of the Fire Marshall, Office of Pipeline Safety.
1-2 National Transportation Safety Board Railroad Accident ReportNTBS/RAR-90/02 (PB90-916302), June 19, 1990.
1-3 T.D. O'Rourke, et. al., "Geotechnical and Lifeline Aspects of theOctober 17, 1989, Loma Prieta Earthquake in San Francisco", TechnicalReport NCEER-90-0001, National Center for Earthquake EngineeringResearch, January 1990.
1-4 T.D. O'Rourke, et al., "Response of the San Francisco Water SupplySystem During the 1989 Loma Prieta Earthquake", presented at theconference Putting the Pieces Together, San Francisco, CA, October1990.
2.0 EXECUTIVE SUMMARY
2.1 SUMMARY
This report is the first phase of a study commissioned by the FederalEmergency Management Agency (FEMA) to evaluate the vulnerabilitiesoccurring from the siting of multiple lifeline systems in confined and at-
4
risk areas due to their interactions from natural and manmade disasters.The goals of the overall study are to identify the lifeline systems'vulnerabilities, to identify potential mitigation approaches that could beused to reduce those vulnerabilities, and to identify methods to enhancethe transfer of the resulting information to lifeline system providers,designers, builders! managers, operators, users, and regulators.
The purpose of this report is to provide an inventory of the majorlifeline systems in the Cajon Pass and the earthquake and geologicanalysis tools available to identify and define the level of seismic riskto those lifelines. The Cajon Pass and an earthquake event will be usedas a suitable test case for applying the evaluation methodology which willbe developed as a part of the overall study. However, the overall programgoal is to provide a methodology that can be readily applied to otherregions and locations in the United States and that is adaptable todisaster conditions in addition to earthquakes. The information in thisreport can be used as a validated data base for use in the development ofthe required analysis methodology for evaluating the impact of proximityor collocation of lifelines on the vulnerability of nearby lifelines.
Figure 1-1 also shows that the Cajon Pass is a natural topographicalopening between the San Bernardino and the San Gabriel mountain ranges.As such, it has been used for years as the major route for lifelinesbetween the Los Angeles coastal plain and the high desert regions. Withinthe Pass the following lifeline systems (see Figure 2-11 it is provided infull-size in Volume 2 of this report) shows the lifelines that have beenexamined for the current study:
Communication Lifelines -- fiber optic cables, radio, cellulartelephone, and microwave towers;
Electrical Lifelines -- high voltage transmission systems, ahydroelectric generation station, and a transmission system electricpower substation;
Fuel Pipeline Lifelines -- natural gas transmission and petroleumproducts pipelines;
Transportation Lifelines -- interstate highways, state highways,bridges associated with the highways, passenger and freight railroadlines, and the bridges and tunnels associated with the railroadlines.
Although Figure 2-1 shows that the lifeline routes are often focused in anarrow band, the topology of the region is not the only reason for that asthe Pass is generally several miles wide (it is about 1/2 mile wide at itsnarrowest at Blue Cut) and many of the lifeline routes could have beenplaced on the slopes of the mountains that form the edges of the Pass.There are large subregions in which there are only one or no lifelines inthe overall study region. However, most of the lifeline systems arelocated near or in the foot of the Pass itself. This is the congestedlifeline area. The figure shows a major focusing of the rail,
5

117 21
'a*I.a
-. -. a ;~'.---'0
;- I . 'I . .i . j ' `-a I.I , ',_3 , I, .a'
IIT 1 so0' 11b'S ar
Figure 2-1 Composite Map of Lifelines In the Cajon Pass Study Areas
SCALE
2 , ,0 XW
EXPLANATION
- I-LB MUa
- £-P ---
------- ----p - -p -
_______ .? I_____,
… I …__I -4…__…__-
l' COMNe. ZMATMW Di VW?
COanTUs VMVAL MmeaFOT
SNTOWTZ
PFAD XAWWLT
,mwsrLUME-PEN5TOCX
rmin ADNATRL uam ruam
no aYr CAMn
LargerScale FigureLocated at
Endof Document
6
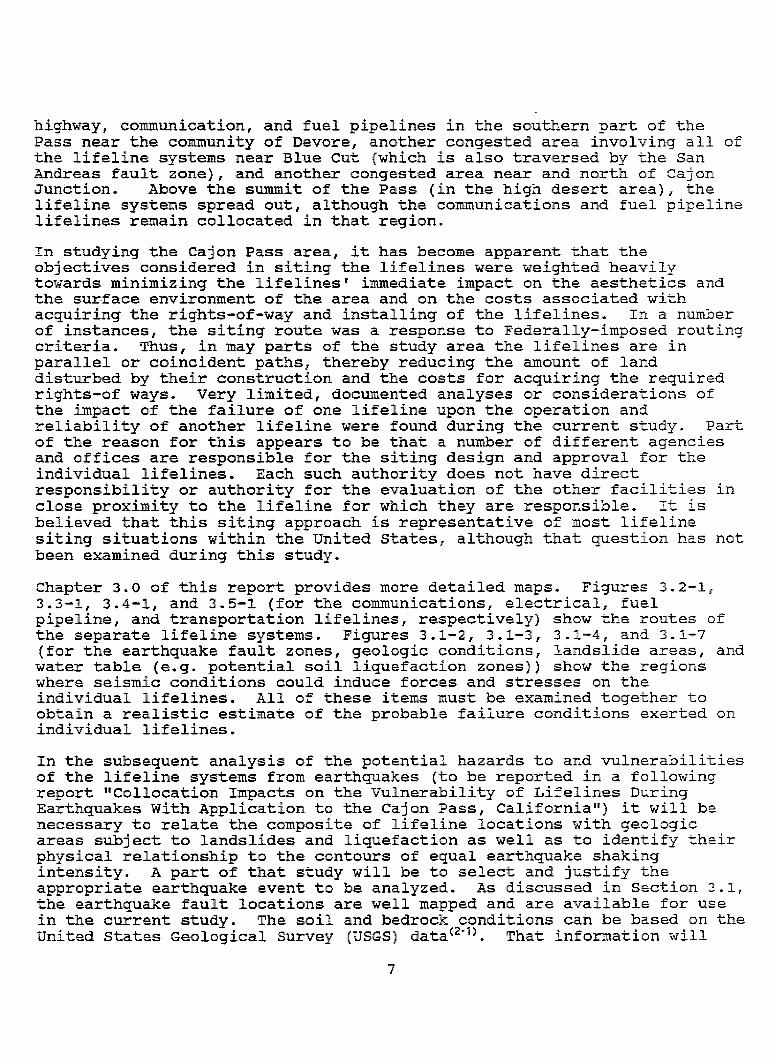
highway, communication, and fuel pipelines in the southern part of thePass near the community of Devore, another congested area involving all ofthe lifeline systems near Blue Cut (which is also traversed by the SanAndreas fault zone), and another congested area near and north of CajonJunction. Above the summit of the Pass (in the high desert area), thelifeline systems spread out, although the communications and fuel pipelinelifelines remain collocated in that region.
In studying the Cajon Pass area, it has become apparent that theobjectives considered in siting the lifelines were weighted heavilytowards minimizing the lifelines' immediate impact on the aesthetics andthe surface environment of the area and on the costs associated withacquiring the rights-of-way and installing of the lifelines. In a numberof instances, the siting route was a response to Federally-imposed routingcriteria. Thus, in may parts of the study area the lifelines are inparallel or coincident paths, thereby reducing the amount of landdisturbed by their construction and the costs for acquiring the requiredrights-of ways. Very limited, documented analyses or considerations ofthe impact of the failure of one lifeline upon the operation andreliability of another lifeline were found during the current study. Partof the reason for this appears to be that a number of different agenciesand offices are responsible for the siting design and approval for theindividual lifelines. Each such authority does not have directresponsibility or authority for the evaluation of the other facilities inclose proximity to the lifeline for which they are responsible. It isbelieved that this siting approach is representative of most lifelinesiting situations within the United States, although that question has notbeen examined during this study.
Chapter 3.0, of this report provides more detailed maps. Figures 3.2-1,3.3-1, 3.4-1, and 3.5-1 (for the communications, electrical, fuelpipeline, and transportation lifelines, respectively) show the routes ofthe separate lifeline systems. Figures 3.1-2, 3.1-3, 3.1-4, and 3.1-7(for the earthquake fault zones, geologic conditions, landslide areas, andwater table (e.g. potential soil liquefaction zones)) show the regionswhere seismic conditions could induce forces and stresses on theindividual lifelines. All of these items must be examined together toobtain a realistic estimate of the probable failure conditions exerted onindividual lifelines.
In the subsequent analysis of the potential hazards to and vulnerabilitiesof the lifeline systems from earthquakes (to be reported in a followingreport "Collocation Impacts on the Vulnerability of Lifelines DuringEarthquakes With Application to the Cajon Pass, California") it will benecessary to relate the composite of lifeline locations with geologicareas subject to landslides. and liquefaction as well as to identify theirphysical relationship to the contours of equal earthquake shakingintensity. A part of that study will be to select and justify theappropriate earthquake event to be analyzed. As discussed in Section 3.1,the earthquake fault locations.are well mapped and are available for usein the current study. The soil and bedrock conditions can be based on theUnited States Geological Survey (USGS) data(2-1). That information will
7
provide input to the QUAK2NW3 earthquake shaking intensity model developedat the USGS 22). Landslide potential can be determined by applying theUSGS models(23 ,24 ) with the results supplemented by the data of Figure 3.1-5. Liquefaction potential can be determined by applying the USGSmethodology(25 ) with the results supplemented by the data of Figure 3.1-8.Thus, there are sufficient data and models available to allow thecalculation of the earthquake and geologic impacts on the lifelinesystems.
The study presented in this report was prepared by obtaining data from thelifeline system owners and regulators and by conducting numerous on-siteexaminations. The data were further validated by having the draft reportreviewed by those who supplied the input data to assure that they were notmisunderstood and that they were complete. As such, the information canbe considered as a reliable data base upon which the rest of the FEMA-sponsored study can be built. Chapter 3.0 presents the results obtained,Chapter 4.0 identifies the organizations and offices contacted during thestudy.
2.2 BIBLIOGRAPHY FOR SECTION 2.0
2-1 J. Davis, et. al., "Earthquake Planning Scenario for a Magnitude 8.3Earthquake in the San Andreas Fault in Southern California",California Division of Mines and Geology, Special Publication 60,1982.
2-2 J. Evernden, et. al., "Seismic Intensities of Earthquakes ofConterminous United States - Their Prediction and Interpretations",USGS Professional Paper 1272, 1981, and "Predictive Model forImportant Ground Motion Parameters Associated with Large and GreatEarthquakes", USGS Bulletin 1838, 1988.
2-3 M. Legg, et. al., "Seismic Hazard for Lifeline VulnerabilityAnalysis", Proceedings of the Third International Conference onMicrozonation, Seattle WA, 1982.
2-4 R.C. Wilson and D.K Keefer, "Predicting Earthquake-Induced Landslideswith Emphasis on Arid and Semi-Arid Environments", Landslides in aSemi-Arid Environment with Emphasis on the Inland Valley of SouthernCalifornia, Editors: P. Sadler & D. Morten, 1989.
2-5 T.L. Youd and D.M. Perkins, "Mapping of Liquefaction Severity Index",Journal of Geotechnical Engineering, V 113, No. GT 11, 1987, and"Mapping Liquefaction-Induced Ground Failure Potential", Journal ofGeotechnical Engineering, V 104, No. GT 4, 1978.
3.0 SITE CONDITIONS AND LIFELINES
3.1 SITE CONDITIONS
This report section presents geologic and geotechnical information for theCajon Pass Study Area including:
8
a Fault information and ground rupture (displacement) potentials
o Seismic events
o Soil and bedrock conditions
o Ground shaking hazards
o Topographic and ground relief features and landslide hazards
o Hydrologic and ground water conditions and liquefactionpotentials
Discussions will also be presented on the earthquake hazards andpredictive models that can be used to evaluate the damage potentialsassociated with the various earthquake hazards including: ground shaking,landslide, and liquefaction hazards. In addition1 data (geologic,geotechnical, hydrological, and groundwater) gathered in the course of theproject is presented. Actual applications of the predictive models toanalyze the damage potentials on the lifeline systems at the study areawill be provided in a separate, vulnerability analysis report to beissued.
As shown in Figure 2.1, the study area covers approximately a 9.2 miles by17.4 miles area (Longitude ranging from about 1170 21.91W to 1170 31.4 1W;Latitude ranging from about 340 10.71N to 3a,4 261N). The study areacovers portions of nine 7.5 minute quadrangles (as designated byU.S.G.S.): Phelan, Telegraph Peak, Cucamonga Peak, Baldy Mesa, Cajon,Devore, Hesperia, Silverwood Lake, and San Bernardino North. As shown inthe figure, most of the lifelines at Cajon Pass generally follow the CajonCanyon corridor in the southern part of the study area. The San Andreasrift zone intersects that lifeline corridor at the middle to southern partof the Cajon Pass study area. In the high desert region in the northernpart of the study area the lifelines are spread apart to a greater degreethan is found in the southern regions.
3.1.1 Fault Information and Ground Rupture (Displacement) Potential
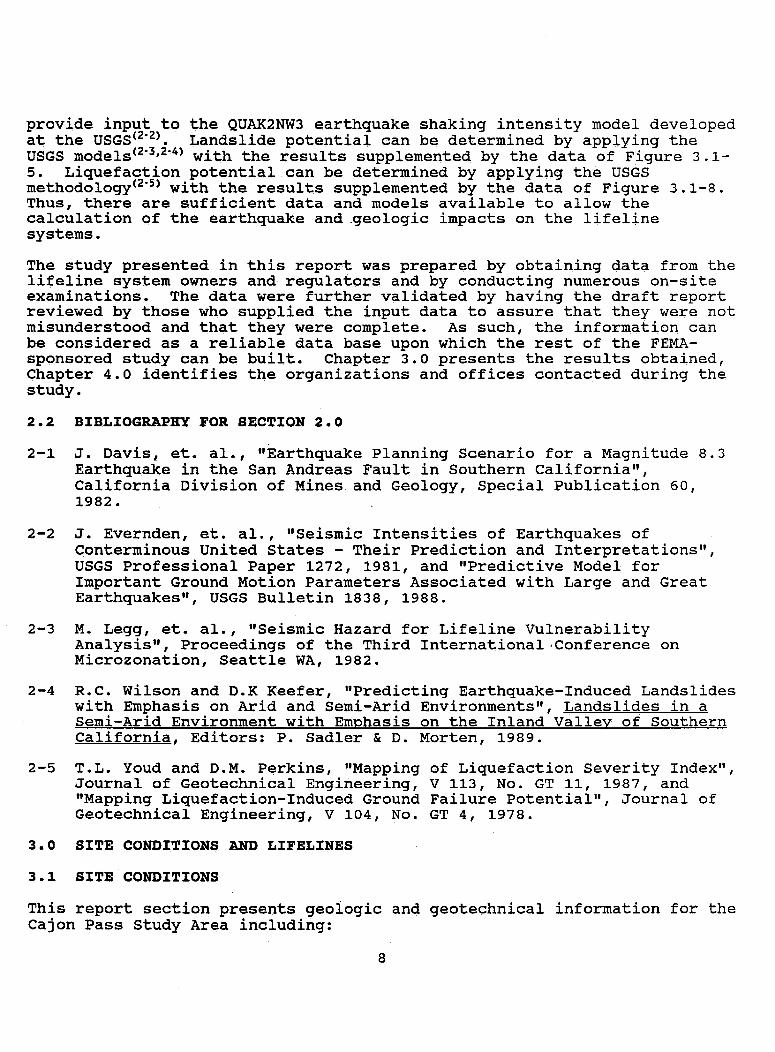
An excellent compilation of information on potential active faults thatcould generate damaging earthruakes in Southern California has,beenpresented by Ziony and Yerkes "1 U. Figure 3.1-1 and Appendix A (whichdefines the terms used in Figure 3.1-1) are extracted from their work.They show that a number of different geologic faults can affect the CajonPass. Also, many of the faults shown in Figure 3.1-1 but which are notlocated directly within the Cajon Pass area still could present earthquakehazards in terms of ground shaking to the lifelines in Cajon Pass. Figure3.1-2 is presented to provide a more detailed map of the active faultslocated within the study area that could present hazards related tosurface fault rupture or relative ground displacements.
9

Figure 3.1-1, Regional Fault Map
a
Ij I11111
10

I, I aUImm
- - - - -,-- -- - -
iqura 3.1-2 actisv Fault LocationsIn The Study Araa
LargerScale FigureLocated at
End ofDocument

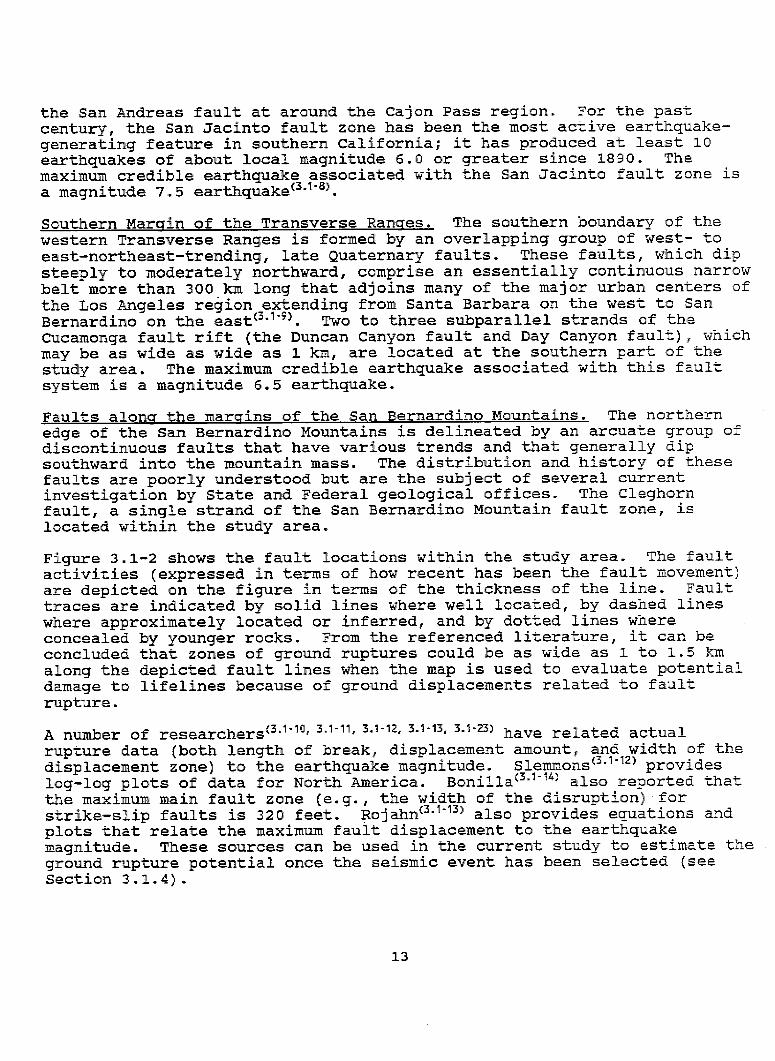
It can be seen from Figure 3.1-2 that the faults which are located withinthe study area are:
(1) San Andreas fault zone (which is in Lone Pine Canyon).
(2) The San Jacinto fault zone (which generally follows Lytle CreekCanyon and is south and parallel to the San Andreas fault),including the following strands within the fault zone: (a) GlenHelen fault, (b) several strands of San Jacinto fault, (c) LytleCreek fault, and (d) Punch Bowl fault.
(3) Faults along the southern margin of Transverse Ranges,especially the Cucamonga fault which is further south of the SanJacinto fault zone and which has two to three subparallelstrands located within the study area including the (a) DuncanCanyon fault and the (b) Day Canyon fault.
(4) Faults along the margins of San Bernardino Mountains, theCleghorn fault (which is north and approximately parallel to theSan Andreas fault zone).
A discussion of each of the above four fault zones is presented below.Aspects related to potential surface fault ruptures that are directlyrelevant to lifeline damage evaluations are emphasized.
San Andreas Fault Zone. A very complete discussion on the San Andreasfault can be found in California Department of Conservation Division ofMines and Geology (CDMG) reports(31 3.1-3) and USGS reportsOA-4, 31-5). TheSan Andreas fault zone is the most dominant active fault in California.It is the main element of the boundary between the Pacific and the NorthAmerican tectonic plates. Two great historical earthquakes have occurredalong this fault: the renowned 1906 San Francisco earthquake and thelesser known but possibly more severe 1857 Fort Tejon earthquake. Thesetwo earthquakes were selected to serve as a basis for emergency planningin Northern California(3 .16)and Southern California(3 17). Approximately400 km of the San Andreas fault between Parkfield-Cholame (e.g., CentralCalifornia) and Cajon Junction (Southern California) ruptured during the1857 Fort Tejon earthquake, which had an estimated magnitude of 8.3. Thesouthern end of the fault rupture during the Fort Tejon earthquake islocated within the study area (between Cajon Junction and Blue Cut). AtCajon Pass, the San Andreas fault zone generally has been reported torange from 0.3 to 1.5 km wide (0.2 to 0.9 miles). Bennett andRodgers(3 12) reported that although very pronounced surface crustalmovements can be observed north of Cajon Pass along the San Andreas fault,very little movement has been recorded along the segment of the SanAndreas fault south of Cajon Pass.
San Jacinto Fault Zone. Echelon segments (including: the Glen Helen, thevarious strands of San Jacinto faults, Punch Bowl fault, and the LytleCreek fault) of the San Jacinto fault zone system extend southeastward formore than 300 km through the Imperial Valley and into northern BajaCalifornia, Mexico. The zone at its northern end appears to merge with
12
the San Andreas fault at around the Cajon Pass region. For the pastcentury, the San Jacinto fault zone has been the most active earthquake-generating feature in southern California; it has produced at least 10earthquakes of about local magnitude 6.0 or greater since 1890. Themaximum credible earthquake associated with the San Jacinto fault zone isa magnitude 7..5 earthquakes31 8).
Southern Marain of the Transverse Ranges. The southern boundary of thewestern Transverse Ranges is formed by an overlapping group of west- toeast-northeast-trending, late Quaternary faults. 'Thesefaults, which dipsteeply to moderately northward, comprise an essentially continuous narrowbelt more than 300 km long that adjoins many of the major urban centers ofthe Los Angeles region extending from Santa Barbara on the west to SanBernardino on the east(3 1-9. Two to three subparallel strands of theCucamonga fault rift (ithe Duncan Canyon fault and Day Canyon fault)! whichmay be as wide as wide as 1 km, are located at the southern part of thestudy area. The maximum credible earthquake associated with this faultsystem is a magnitude 6.5 earthquake.
Faults along the margins of the San Bernardino Mountains. The northernedge of the San Bernardino Mountains is delineated by an arcuate group ofdiscontinuous faults that have various trends and that generally dipsouthward into the mountain mass. The distribution and history of thesefaults are poorly understood but are the subject of several currentinvestigation by State and Federal geological offices. The Cleghornfault, a single strand of the San Bernardino Mountain fault zone, islocated within the study area.
Figure 3.1-2 shows the fault locations within the study area. The faultactivities (expressed in terms of how recent has been the fault movement)are depicted on the figure in terms of the thickness of the line. Faulttraces are indicated by solid lines where well located, by dashed lineswhere approximately located or inferred, and by dotted lines whereconcealed by younger rocks. From the referenced literature, it can beconcluded that zones of ground ruptures could be as wide as 1 to 1.5 kmalong the depicted fault lines when the map is used to evaluate potentialdamage to lifelines because of ground displacements related to faultrupture.
A number of researchers( 3 .1-10, 31-11, 3.1-12, 3.1-13, 3.1-23) have related actualrupture data (both length of break, displacement amount! and width of thedisplacement zone) to the earthquake magnitude. Slemmons(3.112) provideslcg-log plots of data for North America. Bonilla(3.1-14) also reported thatthe maximum main fault zone (e.g., the width of the disruption) forstrike-slip faults is 320 feet. Rojahn(3 ,113 ) also provides equations andplots that relate the maximum fault displacement to the earthquakemagnitude. These sources can be used in the current study to estimate theground rupture potential once the seismic event has been selected !(seeSection 3.1.4).
13
3.1.2 Soil and Bedrock Conditions
Areal differences in damage caused by shaking from earthquakes can berelated to variations in soil conditions, especially to those near thesurface (also see articles by Tinsley and Fumal and by Evernden inreference 3.1-1). A comparison(3.113,31-15, 31-16, 31-17) of the earthquakeshaking intensity maps of the 1906 San Francisco earthquake and that ofthe 1989 Loma Prieta earthquake reveals that severe damage occurred to thesame locations where poor soil conditions exist, even though theepicenters of the two earthquakes were physically removed for each other.
A number of recently completed studies on geologic mapping at the CajonPass(311 8 , 3.119, 3.1-20, 1-21) along with some traditional sources ofinformation 3 12 , 3.1-22 3.1-9) offers detailed information on the geologicconditions at various locations in the study area. A number of scientificresearch programs, including the first deep scientific drill hole in CajonPass and the deep crustal seismic reflection profile at the western SanBernardino Mountains, have recently been completed. Unfortunately, mostof the above studies cover a relatively small portion of the study area.
Traditional geologic mapping emphasizes the distribution and character ofbedrock units, including lithology, age, and rock structure (beddingfoliation, lineation, fractures, folds, faults, etc.). Areas underlain byflood plain and other water-laid sediments commonly are depicted as asingle map unit, termed alluvium. Variation in the physical properties ofalluvial deposits that pertain to hazards of interest to earthquakeevaluations, such as ground shaking and ground failure, are not usuallydistinguished on the standard geologic maps. Therefore, conventionalgeologic maps have limitations with respect to evaluation earthquakehazards.
In the past two decades, specialized mapping techniques directedspecifically at identifying and evaluating earthquake hazards in alluvialdeposits have evolved(3,-23, 3-124, 3.1-25, 3.1-26, .1-27), all of which are summarizedin reference 3.1-1. However, such maps have only been presented for urbandevelopment areas and are not available for Cajon Pass.
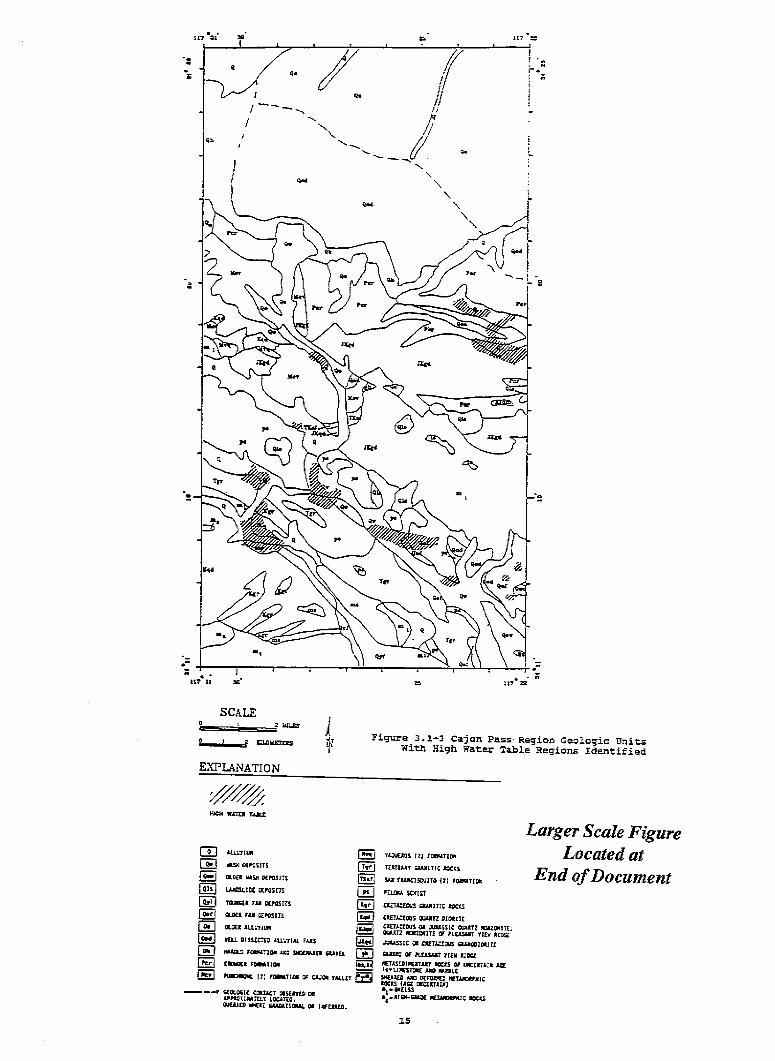
For the above reasons, the geologic maps of the San Bernardino Quadranglecompiled by Bortugno and Spittler(3-136 ) were selected for the presentstudy. An enlarged geologic map (scale: 1 inch = 1 mile) for the studyarea is presented in Figure 3.1-3. The age of the bedrock and soildeposit units denoted in the figure refers to various geologic times.Some common terminology used to denote geologic time scales are summarizedin Appendix A, which is copied from reference 3.1-l1 In general,alluvium, especially the Holocene alluvium, denoted as UnconsolidatedAlluvium, Q; Wash Deposits, Qw; Older Wash Deposits, Qow; YoungerAlluvium, Qya; Younger Fan Deposits, Qyf, Fan Deposits, Qf; Wind-BlownSand, Qs; Large Landslide Deposits, Qls and lake Deposits, Ql wouldpresent the most seismic hazard potentials (in terms of ground shaking,liquefaction and landslide and ground failure). For convenience, thelocations of high ground water table have been identified in the figure.
14
as tl7 R n
SCALEO0 , 2MIUtt
5_,2 fLwcwn 4' Figure 3.1-3 Cajon Pass Region Geologic UnitsWith High Water Table Regions Identified
EXPLANATION
//M/.... YT TA&Z
5 " GESfSITS Ei[El OLDERVkS DEPOSITS Uhf
Ei1 LAEDSLUDCDE2s2T5 SOji TCUll i.U DSITS01
ft EIIra OEMITSI
WLLDISSECTTEALLUTIALFiAS Ei3AISM FO T30Mf JAXsU EER GRAtV Q
CtCI FCUJIIE
FRPI nW Ill FONUTISNOF WONEFA1iL1T
_- ISEZOCIEESISST OSSEOUSCtOPISSLMeTaXTLOCAlE;-UIllt sInII~ GAAMTLSELtK ItflEEO1.
YAQUEllS[0?] IDltTID
TLITIlETMA30LTIClEC
SAXtUlCMISOIITOill FoeaTIDt
PELDM MUST5UiTACtEOS GWIuTIC 1=tS
CEhTACEgOwSi~SU1 01TECUTACECUSDRSALSSIC GiRtZ PWZOUTE.OLUT1 AMO*3EOOF PLULSM TsEERIDGEJAA5DECORtTAEOUS GAMJWNTZ
AM' OF ILEASAEtYIEY RlIDEITAsUDIMITAT M0.5 OF UNCERTALIAM
SWInEDAX2DE; W ETAERIxICtexs im Et=Mx]fl.GEISS
*4 laGat METAWWICM25S
LargerScale FigureLocated at
EndofDocument
15
n-
z~Il I

West of the San Andreas fault, a basement rock unit referred to as the"Pelona Schist", or "ps", is the most landslide prone basement rock unitin the Inland Valley region of Southern California(3119 ). A number ofmajor deep-seated landslides 3 117' 3.1-28) in the region are underlain by thePelona Schist. The Pelona Schist is comprised of several rock types butis mainly a fissile, white mica-albite-quartz schist that is relativelyweak and distortable. A variety of landslides, regardless of thephysically setting, have been recorded at the Pelona Schists. Thelandslides that have impacted the Cajon Pass electrical lifelines (seeSection 3.3) and the natural gas pipeline lifeline (see Section 3.4) haveoccurred in schist deposit areas.
3.1.3 Seismic Events
Four seismic source zones have been identified within the study area andhave been discussed in the preceding section ( Section 3.1.1). Althoughother nearby faults or seismic source zones need to be considered whenhazards associated with ground shaking are studied, the main hazards wouldbe associated with the four fault zones within the study area.Furthermore, the San Andreas fault, which is highly active and couldgenerate significantly larger magnitude earthquakes, would dominate theseismic loading considerations. Although the San Andreas fault has a-total fault length exceeding 1000 km, seismologists and geologistsanticipate that only a portion of the San Andreas fault would rupture in asingle event. The fault is divided in three major segments which couldgenerate very large magnitude earthquakes:. (1) the northern segment fromPoint Delgada to San Juan Bautista (roughly coincident with the 1906 SanFrancisco earthquake fault rupture), (2) the central segment from aroundParkfield to Cajon Pass (coincident with the 1857 Fort Tejon earthquake),and (3) the southern (Mojave) segment from Cajon Pass to Salton Sea. Themaximum credible earthquakes associated with the central and the southernsegment of the fault is a magnitude 8.25 and'a 7.5 event 3 ,18),respectively. Both the central and the southern segments have been judgedto be highly active 3129 ), with a probability of sizable earthquakesexceeding a 40 percent chance over a 30-year exposure time. However,since Cajon Pass marked the end points of fault rupture associated withthe two events, the damage scenario for the Southern California region asa whole due to disruption of major lifelines may be remarkably differentdepending on which event is chosen for damage evaluation. A potentiallymore damaging third event scenario associated with a fault rupturecentered roughly at Cajon Pass and extending both northward beyondPalmdale (where another major natural gas pipeline crosses the San Andreasfault) and southward to beyond Thermal, California (where still anothermajor power transmission line and also a natural gas pipeline cross theSan Andreas fault) could be a plausible event.
Lifelines in general and especially electric power towers and buriedlifelines, with the exception of highway and railroad bridges, havesurvived ground shaking effects remarkably well. Surface fault ruptureand ground failure (including landslides and liquefaction) potentiallywould be more damaging to lifelines. Therefore, although the San Andreasfault would present the most intense ground shaking damage, other smaller
16

faults which could generate surface ruptures at locations within the studyarea will need to be evaluated in terms of ground displacement effects.
3.1.4 Ground Shaking Hazards
Various models can be adopted to predict ground shaking for a givenseismic event depending on the desired ground shaking parameters,including:
o seismic intensity;
o peak ground acceleration, velocity and displacement;
o ground shaking durations; and
o frequency content.
Models to predict fairly detailed ground shaking parameters, includingpeak ground acceleration, velocity, duration, and frequency content interms of overall the overall shape of spectral intensity magnitude atvarious period ranges have been developed(3 "23 ). However, while such amodel would be ideal for a local site-specific evaluation, they are notsuitable for use in regional analysis such as being performed in thisstudy.
A models3 '3 3-131) which has been developed ,can be used to predict seismicintensities in terms of both Rossi-Forell (RF) and Modified MercalliIntensity (DMI) scales for regional risk evaluations. Other ground motionparameters (e.g., peak ground acceleration, velocity and displacement) andthe damage potential to a variety of structures can then be postulatedfrom correlation-of the intensity at the structures location by usinghistorical data on intensity-failure effects, 3 113 1. This approach has beenused by Davis et. al.(3.1-6, 3.T-7) to estimate the general effects ofhypothetical great earthquakes along the San Andreas fault on the lifelinesystems in the Los Angeles and San Francisco metropolitan areas. Thisapproach is expected to be used to predict the seismic intensity andresulting Cajon Pass lifeline damage from the various postulatedearthquake events associated with the San Andreas fault and the otherfault zones identified in Section 3.1.1.
The USGS seismic shaking intensity model 3 1-30 3.131) has been coded in acomputer program QUAK2NW3. Input to the program consists of:
(1) A fault data file, which represents the fault to be analyses, asa series of uniform point sources spaced as closely asdesirable.
(2) A ground condition data file which performs two functions. Itestablishes each calculation point with respect to the fault,and it provides the soil condition at each calculation point.Ground conditions are typically discretized into 0.5 minutelatitude by 0.5 minute longitude grids by the code developers.
17

(3) A pseudodepth term "C" which is chosen to give proper near-fielddie-off of the shaking intensities as a function of distancefrom the fault.
(4) An attenuation parameter "k" which controls the rate of die-offof peak acceleration as a function of distance from the fault.
With the above input data, the computer program QUAK2NW3 computes theacceleration associated with the energy release at each point source alongthe fault(3 132 ). Then, the shaking intensity value is computed from theacceleration value. The shaking intensity is first calculated for astandard reference ground unit condition (e.g. saturated alluvium). Then,the intensity value at each grid point is adjusted for the actual groundcondition specified in the ground condition input data file. Using thismodel, the model developer has predicted the patterns of intensity formany of the large earthquakes occurred throughout the United States. Manyof these predictions compared favorably with the intensity iso-seismalmaps estimated from historical recordst3131).
The USGS model will be used to predict the shaking intensity at the CajonPass region for all the referenced faults identified in Section 3.1.1.Several analyses will be conducted to evaluate the sensitivities of thevarious event scenarios postulated for the San Andreas fault, so that anappropriate scenario can be selected for the subsequent vulnerabilityanalysis.
3.1.5 Topographic and Ground Relief Features and Landslide Hazards
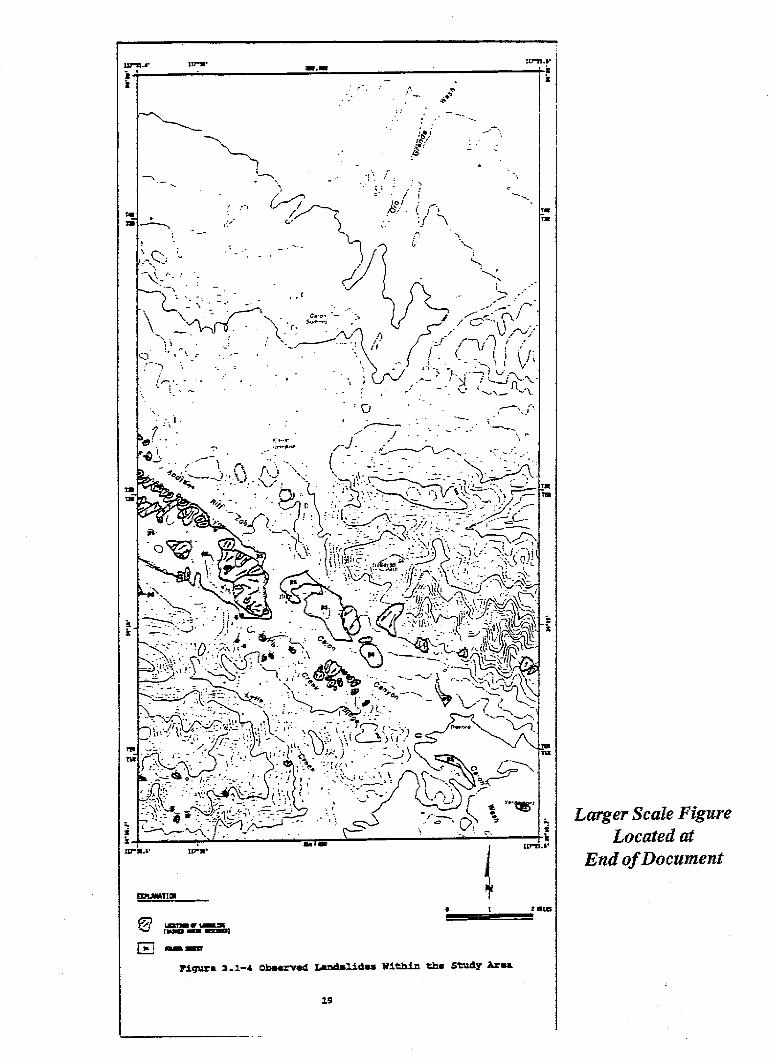
A number of publications(3119 ,3.1-30, 3.1-38, 3.1-39) were reviewed and observedrelics of landslides were used to develop a landslide map at Cajon Pass;this is shown in Figure 3.1-4. It was concluded that earthquake shakingwill be one of the main triggering agents for landslides in the Cajon Passarea. A photograph showing very significant recent landslide scars wherethe Southern California Power Edison Co.'s power line transmission towersare located is presented as Figure 3.1-5. Figure 3.1-6 shows a typicallandslide scar in the Lone Pine Canyon, the canyon which contains the SanAndreas fault rift zone. It can be seen on Figure 3.1-4 that there arenumerous landslide features at the Cajon Pass especially at areas wherethe Pelona Schist, ps, is the basement bedrock geologic unit. Asdiscussed earlier, the Pelona Schist is the most landslide prone bedrockunit known in the study area 3-1-33 ). This landslide map is presented toserve as an inventory of observed or recorded landslide features at thestudy area. It also can be used to validate landslide prediction modelsand analyses to be conducted in the subsequent damage evaluation report.
Although there are numerous analysis methods to analyze landslides for avariety of loading conditions (gravity, ground water seepage forces, andearthquake) in the literature, they are almost exclusively intended to beused for site specific studies. A frequently used analysis model forevaluating earthquake induced landslides that can be used in regionalevaluations is a model presented by Wilson and Keefers3- 38' 3-140). Theirmodel has been used to analyze and correlate with slope failures from the
18
LargerScale FigureLocated at
End ofDocument
?iqurs 3.1-4 Obsaeved Landslides Within the Study Area
19

August 6, 1979,Coyote Lake,California,earthquake and the1989 Loma Prietaearthquake.Preliminaryinformationindicates that thereis good agreementfor the predictionwith the Loma Prietaearthquake landslidedata. Wieczorek(3137) applied the analysis method todevelop a map ofrelative landslidepotential duringearthquakes in SanMateo County,California. Nilsen,et. al. 3 -1-39) also applied the methodin a project jointlysupported by USGSand the Departmentof Housing and UrbanDevelopment todevelop maps ofrelative slopestability for land-use planning in theSan Francisco Bayregion, California.
-
-� I --- -- - - . - - I
figure 3.1-5 Rebu1lt Power Transmission Towers on a Landslide Scar
Figure 3.1-6 Landslide Scar in Lone Pine Canyon AlongThe San Andreas Fault Zone
20

Wilson's method consists of the following basic steps:
Step-1 Solve for the factor of safety of the slope for a givencombination of slope angle and soil strength.
Step-2 Using the Newmark method 3--43) and the factor of safety fromStep-1, calculate the critical acceleration value which isthe level of ground acceleration required to initiatedownward slope movement.
Step-3 The above critical acceleration value can then be used inconjunction with a given design earthquake to solve for themagnitude of accumulated downslope movement associated withthe design earthquake. This magnitude of accumulated slopemovement is then used as an indicator of the potential forslope failure.
Wilson has presented several simplifying charts to facilitate applicationof the above procedures and they are summarized by Rojahn 3 3'.
Existing information indicates that earthquake-induced landslides couldpose significant damage to the lifelines at Cajon Pass. An evaluation oflandslide potential will be very important in the current project.Wilson's method will be used to develop a map of the landslide potentialat Cajon Pass. The digital elevation model data acquired in the course ofthe project will be used to develop a topographic map and subsequently amap of the ground relief data. Shear strength values will be assigned toeach of the geologic units on the Cajon Pass geologic map. The groundrelief and the shear strength maps will be used to calculate the criticalacceleration value at each grid point in the study area. The criticalacceleration and the MMI index value can be used to enter the tablesprovided by Rojahn to identify the slope failure state. The slope failurestate can then be related to the lifeline damage state. This is similarto the analysis method of Wieczorek"3 -37 , where the landslidesusceptibility was estimated in terms of a critical ground accelerationand a calculated slope displacement value. -One advantage of this proposedmethod is that it relates the landslide susceptibility to the ModifiedMercalli Indices as well as the geology and the slope of the surfaceformations.
3.1.6 Hydraulic, Groundwater Conditions, and Liquefaction Potential
The study area is situated far from oceans. There are also no majorhydrologic features (lakes, rivers) within the study area. There are anumber of minor creeks and streams (e.g. Lytle Creek Wash, Cajon Washwithin the study area) which could be carrying large volume surface waterduring the rainy season (winter) or during flash floods. Therefore, areaswhere liquefaction could occur in the study area would be locations wherethe water table is close to the surface. The ground water table at CajonPass could fluctuate in relation to precipitation and ground-watermanagement (3.1 34 K. As an example from outside of the study area in the Cityof San Bernardino, the regional long-term trend is a lowering of the
21
ground-water table due to withdrawal from water wells, although the Cityof San Bernardino is currently experiencing a rise in the depth-to-ground-water due to the reduction in agriculture and its impact on reducing thewithdrawal rate of ground water in that specific local region. Availabledepth-to-ground-water maps"3--35 indicate that, in general, the water tablewill be relatively deep (over 100 feet) over most of the study region.However, perched water tables (5-20 feet deep) exist at isolated pocketswithin the study area.
In an effort to locate these pockets of higher perched water table zones,water-well data from the Department of Water Resource was examined.Locations of the water wells are identified in a map presented in Figure3.1-7. Detailed information for the water well, including depth of thewater table and date of the observation, are tabulated in Table 3.1-1.The water-well data were then divided into two categories:
o Shallow water table (depth less than 30 feet).
o Deep water table (depth more than 30 Feet).
Locations of shallow water table conditions are identified in Figure 3.1-4. and Figure 3.1-7. These are the locations where liquefaction couldoccur during an earthquake. It should be noted that due to the ruggedterrain and sparse population in the study area, there is simply no wellwater data available over much of the Cajon Pass area. Therefore, it isfair to say that the map is incomplete andother locations with highperched ground water table could be present within the study area. Also,the dominance of fault features in the region adds complexities to theevaluation of the ground-water table conditions. Major faults appear toact as barriers to downslope movement of ground water, especially the SanAndreas fault, as indicated by seeps and springs along many parts of thefault, particularly where it transects alluviated flood plains of canyonsor alluvial slopes. In many instances along major faults, the groundwater on the upslope side apparently backs up against the fault, whichacts as an "underground dam", and the overflow reaches the ground surfaceas springs. The water table on the upslope side of the fault could beseveral tens of feet higher than on the downslope side of the fault. Anexample of this in the study area is the gravel pit located just south ofCajon Junction. On the upstream side of an apparent schist "dam" thewater table is within 5-7 feet of the surface. Downstream of the schistthe gravel pit operator had removed gravel at 50-70 feet below the surfaceand the pit was dry (when observed in the fall of 1990).
Although, widespread liquefaction is not expected at the study area, atlocal sites where the lifelines are collocated it can be anticipated thatliquefaction could be the major factor for imposing collocation loads onthe individual lifelines.
There are several liquefaction analysis approaches that can be used forregional evaluations. The most recognized model is the one by Youd andPerkins 3 .4 1 ' 3.142). The procedure used to determine areal variations inliquefaction potential requires the development of a liquefaction
22

aru~~~~a enu 1-- 1°7f-- l.
- e~l_ JZ </- jt
AN'sw~ ~ ~ A
i ~~~~-
K_ - ^- C _ _ .-e a - ' - \'i ax,)s,. _._
k1w
1s~~~- , . - u !
. .. '~~ -. - Cn-'
.~~~~~~~~ ~ ~~~~~~~~ _-- _.rn~_
X ~~ ~ ~ ~ ~ 1 ---i~ |!~-
sn ~ ~ ~ C J '
( 4~~~~~~~~~~~~~~~~~~~~~~~4MX)UW~flWIT
S. -tJ _ -lre eFgr
- N -w as
C.enFlg 3-1-7 ticrL oS Sballor Yrz~r T* 4u .
- I~~~~~~~~~~~~~~~~~~~~~~~~~~~~~~~~~~~~~7
*~~'\ '~ ~ WWe O-
b ~ ~S0. ~~~ C4~~, wW 76S ti
% 'a~~~~sa
* - I' ~~~~~~ -w-----4="AMt Tu~~~~~SW-
* sumsas ins~~~~~~~sem
o nuns unearM
us a ja: M mua-aemu i LargerScale FigureVA4I f~0 ma ww -w un- Locatedat
Piqura 3..1-7 Locatiwi of Msalicv Water Tablm Cmnditis En f oumn
23
IiI
i
ii
I
i
L
1
Table 3.1-1, Depth to Ground Water Measured From Wells
Reference No.
1234567891011121314151617171718
19202121222324252627282930313233343536
Township &Section No.
3N5W/l 114141920212222262627272727272728282835
2N5W/l 1131313131313131313151515152419191919
Range StateWell No.
R2DINiMlQiRiE2MlElMlAlBlB3B4GlP1A6A7A8Al
BiElKlKlMlM2NiN201
03F3JiLiL2AlDl
K1K201
24
Year
19841963198419861964196319741978198019881963196419631988197919871972197419771988
1955196719511960196719671967196719641967196419801986198519851979197019871983
Depth (ft)
41025520049144
870
11021406048154230
FLOWING84607012
287
7070171
144
24134
2535305050
DRY375
Table 3.1-1, Depth to Ground Water Measured(Continued)
From Wells
Reference No.
3738394041424344454546
4747484950515252525354555657
58596061616161616161616161
Township & RangeSection No.
2N5W/1 20222727272833333333
I N5W/33366677777888
2N6W/22222222222222222222222222
StateWell No.
RIP1ElKILiL2ClF1KIKIml
AlAlA2GIKIK2HiHiHIH2Ji81NiQ1
FlF2GiLI
L2
L4L5L6UL8L9LI 0
Year
19671967197519781974197419561950195019831979
19271982195219871953198719311977198719181918193819181918
1988198719881988198719861985198519851985198519851987
Depth (ftT
131014310018014032
130838425
125.142
145-20075DRY911261171006317260
132107
7770115235386064602510/6050
25
Table 3.1-1, Depth to Ground Water Measured(Continued)
From Wells
Reference No.
6161616263646566676869
70
717273747576777778798081828282838383838485
Township & RangeSection No.
2N6W/2222222224252626262727
1N5W/ 2
2N5W/262626262635353535353535353535353535353535
StateWell No.
LI 1Li 2L13P1ClLIBiLiL2ClGi
Kl
G2KlMlP1Q2BIClC2C3DIElGiKlK2K3L2L3L4L6L5Q1
Year
19861987198619861967198519781982197319851985
1988
197919781977197919781978197719781979198019791977198819781978198019781978198519791977
Depth (ft)
4065329
3154
117154586
121
18010080402290
20010020
1501652001219065608595
1133260
26
susceptibility map and a liquefaction opportunity map. A liquefactionsusceptibility map delineates areas where liquefiable materials are mostlikely to be present and is based chiefly on generalizations pertaining tothe geology and hydrology of late Quaternary deposits in a sedimentarybasin. The liquefaction opportunity map shows regions of earthquakeshaking strong enough to generate liquefaction in susceptible materialsand is based on an appraisal of regional earthquake potential. These twomaps are then considered together to determine liquefaction potential, therelative likelihood that an earthquake will cause liquefaction in water-saturated cohesionless silts and sands that may be present. The use ofthis approach can also be validated with the analysis *ofRojahn:3 3s wherethe liquefaction potential has been presented in a table and alternativelyby the standard penetration resistance (e.g., blow count data) of thesoils.
3.1.7 Bibliography For Section 3.1
3.1-1 J.I. Ziony & R.F. Yerkes, "Evaluating Earthquake and Surface-Faulting Potentials', Evaluating Earthquake Hazards in the LosAngeles Region-An Earth-Science Perspective, USGS ProfessionalPaper 1360, 1985.
3.1-2 "San Andreas Fault in Southern California : A Guide To SanAndreas Fault from Mexico to Carrijo Plain", California Divisionof Mines and Geology (CDMG) Special Report 118, 1975.
3.1-3 "Earthquake Hazards and Tectonic History of the San AndreasFault Zones, Los Angeles County, California", CDMG Open-fileReport 85-10, 1985.
3.1-4 D.C. Ross., "Map Showing recently Active Breaks,Along the SanAndreas Fault Between Tejon Pass and Cajon Pass, SouthernCalifornia", U.S. Geological Survey, Miscellaneous InvestigationSeries, Map I-553, 1969.
3.1-5 "IThe San Andreas Fault System", USGS Professional Paper 1515,Editor R.E. Wallace, 1990.
3.1-6 J.F. Davis, et. al., "Earthquake Planning Scenario for aMagnitude 8.3 Earthquake on the San Andreas Fault in SouthernCalifornia", CDMG Special Publication 60, 1982.
3.1-7 J.F. Davis, et. al., "Earthquake Planning Scenario for aMagnitude 8.3 Earthquake on the San Andreas Fault in the SanFrancisco Bay Area", CDMG Special Publication 61, 1982.
3.1-8 R.W. Greensfelder, "Maximum Credible Rock Acceleration FromEarthquakes in California", CDMG Map Sheet 23, 1974.
3.1-9 "Recent Reverse Faulting in the Transverse Ranges, California",U. S. Geological Professional Paper 1339, 1987.
27

3.1-10 M. Bonilla and J. Buchanan, "Interim Report on WorldwideHistoric Faulting", USGS Open-File Report, 1970.
3.1-11 M. Bonilla, et. al. "Statistical Relations Among EarthquakeMagnitude, Surface Rupture Length, and Surface FaultDisplacement", USGS Open-File Report 84-256, 1984.
3.1-12 D. Slemmons, "Determination of Design Earthquake Magnitude forMicrozonation", Proceedings of the 3rd International Conferenceon Microzonation, Seattle, Washington, 1982.
3.1-13 C. Rojahn and R. Sharpe, "Earthquake Damage Evaluation Data forCalifornia", ATC-13, 1985.
3.1-14 M. Bonilla, "Historic Surface Faulting in Continental UnitedStates And Adjacent Parts of Mexico," USGS Report (NTIS No. TID-24124), 1967.
3.1-15 "The Loma Prieta Earthquake of October 17, 1989, WhatHappened..... What is Expected..... What can be Done", USGS Memo,January 1990.
3.1-16 "Lessons Learned from the Loma Prieta, California, Earthquake ofOctober 17, 1989", USGS Circular 1045, G. Plafker and J.P.Galloway, Editors, 1989.
3.1-17 "Loma Prieta Earthquake Reconnaissance Report", EarthquakeSpectra, The Professional Journal of the Earthquake EngineeringResearch Institute, Supplement to Volume.6, EarthquakeEngineering Research Institute (EERI), May 1990.
3.1-18 K.E. Meisling and R.J. Weldon, "Late Cenozoic Tectonics of theNorthwest San Bernardino Mountains, Southern California",Geological Society of America Bulletin, V. 101, pp. 106-128,January 1989
3.1-19 P.M. Sadler and D.M. Morton, Editors, "Landslides in a Semi-AridEnvironment with Emphasis on the Inland Valleys of SouthernCalifornia", Landslides in a Semi-Arid Environment, Publicationsof the Inland Geological Society, Volume 2, 1989
3.1-20 R.J. Weldon, "The Late Cenozoic Geology of Cajon Pass;Implications for Tectonics and Sedimentation along the SanAndreas Fault", Ph D. Thesis, California Institute ofTechnology, Pasadena, California, 1986.
3.1-21 R.J. Weldon et. al., "Implications of the Age and Distributionof the Late Cenozoic Stratigraphy in Cajon Pass, SouthernCalifornia," San Andreas Fault, Cajon Pass to Wrightwood,American Association of Petroleum Geologist, Pacific Section,Volume and Guidebook Number 55, R. Hester and D. Hallinger,editors, 1984.
28

3.1-22 T.W. Dibbles, Jr., "Areal Geology of the Western Mojave Desert,California", USGS Professional Paper 522, 1067.
3.1-23 W.B. Joyner and T.E. Fumal, "Predictive Mapping of EarthquakeGround Motions", Evaluating Earthauake Hazards in the LosAngeles Region, USGS Professional Paper 1360, J.I. Ziony,Editor, 1985.
3.1-24 K.R. Lajoie and E.J. Helley, "Classification and Mapping ofQuaternary Sediment for Purposes of Seismic Zonation', Studiesfor Seismic Zonation of San Francisco Bay Region, R.D. Borcherdteditor, USGS Professional Paper 941-A, 1975.
3.1-25 R.D. Borcherdt, "Effect of Local Geology on Ground Motion nearSan Francisco Bay", Bulletin of Seismological Society ofAmerica, v. 60, p. 29-61, 1970.
3.1-26 R.D. Borcherdt, et. al., "'Response of Local Geologic Units toGround Shaking", Studies for Seismic Zonation of San FranciscoBay Region, editor R.D. Gorchert, USGS Professional Paper 941-A,1975.
3.1-27 "Landsliding and Mudflows at Wrightwood, San Bernardino County,California"3 , USGS Special Report 136, 1979.
3.1-28 "Geologic Hazards in Southwestern San Bernardino County,California", USGS Special Report 113, 1976.
3.1-29 T.C. Hanks, "The National Earthquake Hazards Reduction Program-Scientific Status", USGS Bulletin 1659, 1985.
3.1-30 J.F. Evernden, et. al., "Seismic Intensities of Earthquakes ofConterminous United States - Their Predictions andInterpretations', USGS Professional Paper 1223. 1981.
3.1-31 J.F. Evernden and J.M. Thompson, "Predictive Model for ImportantGround Motion Parameters Associated With Large and GreatEarthquakes", USGS Bulletin 1838, 1988.
3.1-32 J.F. Evernden, et. al., "Interpretation of Seismic IntensityData1", Bulletin of the Seismological Society of America, v. 63,1973.
3.1-33 D.M. Morton and R. Streitz, "Preliminary Reconnaissance Map ofMajor Landslides, San Gabriel Mountains, California", CDMG MapSheet 15, 1969.
3.1-34 "San Bernardino County General Plan Update Background AppendixDraft: Water Distribution Systems, Groundwater Supply andQuality", Environmental Public Works Agency-Land ManagementDepartment, Office of Planning, Pages 113-165, April 1989.
29
3.1-35 "Meeting Water Demands in the Bunker Hill-San Timoteo Area",State of California, The Resources Agency, Department of WaterResources, Bulletin No. 104-5, December 1970.
3.1-36 E.J. Bertugno and T.E. Spittler, "Geologic Map of the SanBernardino Quadrangle", CDMG Geologic Map Series, Map No. 3A(Geology), 1986.
3.1-37 G.F. Wieczorek, et. al., "Map Showing Slope Stability DuringEarthquakes in San Mateo County, California", USGS Map I-1257-E,1985.
3.1-38 R.C. Wilson and D.K. Keefer, "Predicting Aerial Limits ofEarthquake Induced Landsliding", Evaluating Earthquake Hazardsin the Los Angeles Region, USGS Professional Paper 1360, J.I.Ziony, Editor, 1985.
3.1-39 T.H. Nilsen, et. al., "Relative Slope Stability and Land-UsePlanning in the San Francisco Bay Region, California", USGSProfessional Paper 944, 1979.
3.1-40 R.C. Wilson and D.K. Keefer, "Dynamic Analysis of a SlopeFailure From the 6 August 1979 Coyote Lake, California,Earthquake", Bulletin of the Seismological Society of America,Vol. 73, No. 3, pp. 863-877, 1983.
3.1-41 T.L. Youd and D.M. Perkins, "Mapping Liquefaction-Induced GroundFailure Potential", Proceedings of the American Society of CivilEngineers, Journal of the Geotechnical Engineering Division, V104, No. GT4, 1978.
3.1-42 T.L. Youd and D.M. Perkins, "Mapping of Liquefaction SeverityIndex", Journal of Geotechnical Engineering, V 113, No. GT 11,1987.
3.1-43 N.M. Newmark "Effects of Earthquakes on Dams and Embankments",Geotechnique, V 15, No. 2, p. 139-160, 1965.
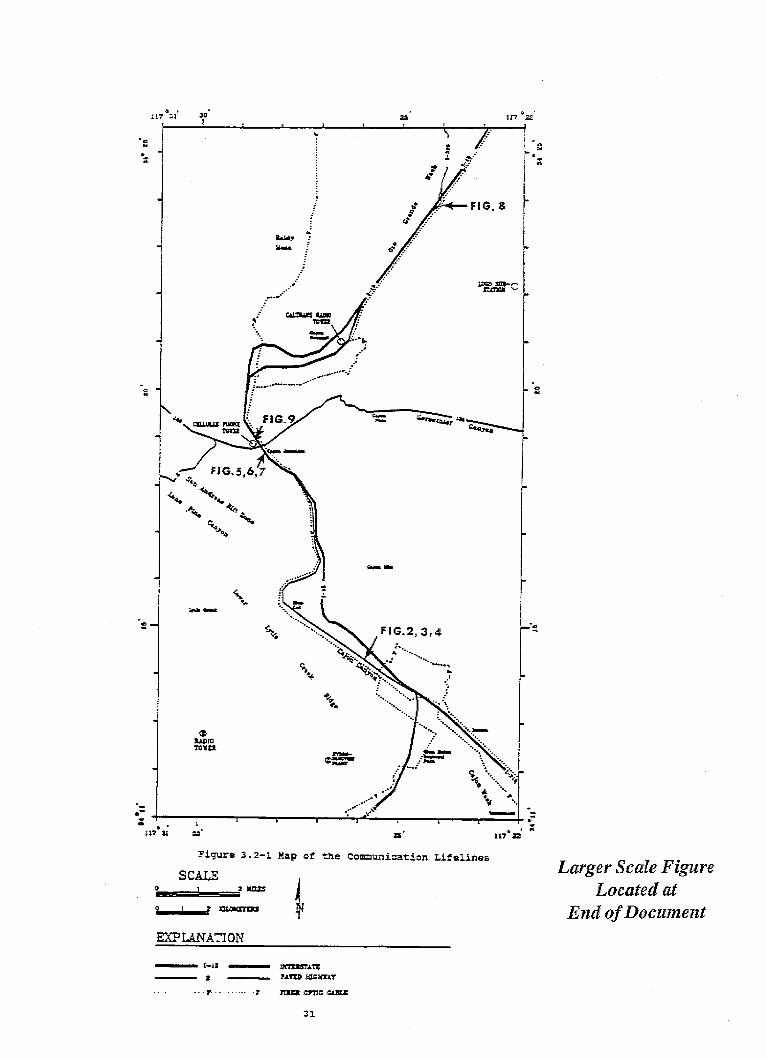
3.2 COMMUNICATION LIFELINES
The Cajon Pass region includes hardwired and fiber optic telephone systemsand microwave and radio towers. The hardwired telephone primarilyservices the local distribution system. The fiberoptic lines primarilyare transmission and major trunk lines. The microwave and radio towersserve both local communications within the Pass and transcontinentalcommunication, but separate towers are used to support local or longdistance transmission. The tower systems are identified in this study forcompleteness, but they are mostly isolated and thus have no directcollocation impacts. Figure 3.2-1 is a map of the communicationlifelines. For reference purposes, the location of photographs providedin this Section are also shown on the Figure. Consistent with the conceptused for evaluating other lifeline systems (that is, this study focuses onthe
30
" 117'
Figure 3.2-1 Map of the Comunication Lifelines
SCALE1 2 urW
0 7 onm ILargerScale Figure
LocatedatEnd ofDocument
EXPLANATION
-~ i-azI -I
7--. 7-- 3nc1nc cn
31
C,
;: 4It? 21 30
I B;|-
o

transmission or primary systems andnot the local or distributionsystems), the hardwired and woodenpole telephone systems were notincluded in this study. However,the fiber optic systems are similarto a transmission system in thatthey are used to transfer manycalls between the Los Angeles Basinand other regions in the nation.Thus, they were included in detailin this study. There are no stateor Federal documented seismiccriteria or standards for theinstallation of fiber optic cables,hence each company is free toinclude seismic considerations asit determines necessary.
3.2.1 Fiber optic Cables
On-site surveys identified thatfive fiber optic systems arelocated in the study area. Theyare American Telephone andTelegraph (AT&T), ContinentalTelephone (CONTEL), MCICommunications (MCI), WilTel (nowWTGWest) and US Sprint. Contact(3,) was made with these
-C_- -- %MCM 01PYLTMl8'y -A rTeT.L .LIm, CUILLAl Et l, L.LAj, a.In U>C.vv-int r4cnndaA i h i fnrgvma+ n . Figure-Max-.. - -- Looking on Old .c-w.. -54.,_ -- -- i 3.2-2, NorthReview of the U.S. Forest Service Highway 66 (Now Cajon Canyon Rd.)maps, on-site evaluations, andcontact with the California UtilityUnderground Service were used to supplement the information and to obtainadditional details on the routing of the various systems.
A fiber optic cable is a multi-layered cable with an inner structure thatallows the cable to be pulled and maintained in a state of tension withoutputting tension on the individual glass fibers. Various materials areused for insulating the glass fibers, including a metal sheath. In thefall of 1986, both MCI and WTG West contacted the U.S. Forest Service to obtain right-of-ways for their cables (See Figure 3.2-1). To reduce thenumber of locations where trenching would be required, the Forest Servicerequired each of those firms to trench conduits that could support fourdifferent fiber optic systems (for a total of eight systems in the tworoutes). They also required that the routes coincide whenever possible,so from just north of the Cajon Junction to the southern end of the oldCajon Canyon Road the cables are collocated (see Figure 3.2-2 which is aphotograph of the old Highway 66, now called Cajon Canyon Rd.. Note thatthe divided highway has been converted to a two lane highway by blocking
32

the eastern side of the road). Each of the firms installed two metalconduits. They are four inches in diameter and can accommodate up tothree separate fiber optic cables in each conduit, although it isanticipated that at most eight separate firms will actually install cablein the conduits. AT&T was the last firm to install their cable,completing the work in late 1989.
The separate telephone connections for AT&T, MCI, US Sprint, and WTG Westare parts of a much larger network owned by each of those companies. Ifthere were problems with the cables in the Cajon Pass, the companiesindicated that by rerouting the calls they could continue their service.A similar situation exists for CONTEL, except that they do not maintain asmany separate lines from their Victorville, California, center to theirLos Angeles Basin center. Thus, they may have to reroute their callsusing the existing lines of one of the other firms identified above. Theexact excess rerouting capacity of each firm is confidential.
Referring to Figure 3.2-1 and starting from the southern edge of the studyarea, the AT&T cable enters from San Bernardino on the eastern side of thestudy area. Much of its route is along city streets in San Bernardino andDevore, where AT&T already had existing right-of-ways. Part of the cablepath is along the street parallel and next to I-215 (Outer Highway andLittle League Drive). It crosses under highway I-15 at the Kenwoodexchange. From there it enters the cable conduits installed by WTG West.The US Sprint cable also enters the study area from the Rialto area. Ittravels north on Sycamore street, then east on Highland Ave., then northon Macy St. until it insects Cajon Boulevard. It travels northwest alongCajon Blvd. parallel to the Atcheson Topeka and Santa Fe (AT&SF) and theUnion Pacific railroads. At Devore it turns northeast along Devore Road.It crosses under I-215 along Devore Road and then turns parallel to I-15along Nedlee Ave.. Just north of the I-15 and I-215 intersection itcrosses under 1-15 and connects to the existing fiber optics conduit(which was installed by MCI) located along the old Highway 66 (which isparallel and west of I-15). The WTG West cable enters the study area fromthe western side of the southern boundary. It heads northeast alongDevore Road (which is north of and roughly parallel to I-15). It crossesthe Lytle Creek Wash, turns south, and then crosses under I-15 where itcontinues to follow Devore Road. Next it enters Cajon Wash and crossesunder the AT&SF and the Union Pacific railroads, then it turns northwestand crosses under I-15 near to the US Sprint cable. It enters theexisting conduit at the same location that the US Sprint cable enters it,but it enters a different conduit. Also located in one of those twoconduits is the CONTEL cable. The CONTEL fiber optic cable enters thestudy area from San Bernardino from the southeast study boundary. Itmoves northwest along Cajon Blvd., turns east on DeVore Road and crossesunder I-215. It follows Devore Rd., turns west along Kenwood Ave.,crosses under I-15 along Kenwood Ave., and enters the conduit installed byMCI.
The fiber optic conduits (four in number) are located together and runmostly along the median region of the old Highway 66 (see Figure 3.2-2which shows the general nature of the old highway and the wide nature of
33

-
the Cajon Pass inthat region).Again, in order tolimit the amount ofpotentialenvironmental damagedue to trenching,the U.S. ForestService had thefiber optic cableslocated parallel andnear to the existingtwo petroleumproduct pipelines(an eight and a 14inch line). The arerouted in the medianzone of the oldHighway 66. Thecables are locatedfrom one to fourfeet from thepipelines and areburied three to fourfeet deep (duringthe cable trenching,the pipelineoperator indicatedthat the trencherstruck the pipelineon at least twooccasions, requiringrepair efforts bythe pipeline owner).
However, at bridgeor culvert locationsthey are routedabove ground alongthe bridge or abovethe culvert butstill underground.Figure 3.2-3 is atypical example ofthe supports used tohang the cableconduits from thebridge. Earthquakecriteria were notused in designingthese supports. Itis noted that this
Figure 3.2-3 Fiber Optic Conduits Crossing a CajonCanyon Road Bridge
L
Figure 3.2-4 Details of the Fiber Optic Conduits andHangers on a Cajon Canyon Road Bridge
34

side of the CajonCanyon Road and thebridge are"abandoned" and someconcrete spalling ofthe piers was notedduring the siteinspections. Figure2.3-4 gives furtherdetails of theconditions of theconduits and theirwall supports.
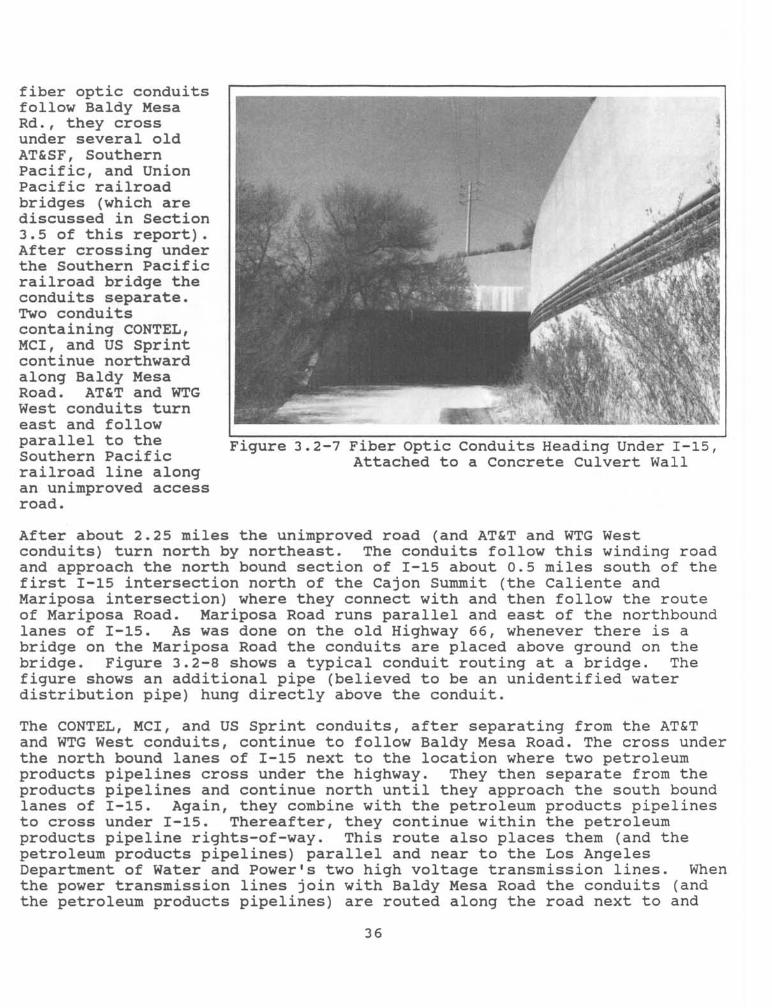
Continuing north,the cables pass atthe toe of a cribwall used to retainthe southbound lanesof I-15 (see Figure3.2-5). That siteis a potentialliquefaction sitedue to the highwater table andalluvium deposits.Immediately north ofthe crib wall theconduits are broughtto the surface andhung from a concretewall that forms aculvert under I-15.Figure 3.2-6 showsdetails of how theconduits are hungfrom the concrete,and Figure 3.2-7shows then enteringthe culvert as theyhead north and underI-15. On theeastern side of I-15they are againburied and routednorth along BaldyMesa Rd. (anunimproved dirt roadat this location).
North of CajonJunction, as the
X Z f/ ,.::-7, si
z
Figure 3.2-5 Crib Wall Retaining the Southbound Lanesof I-15 With Fiber Optic Conduits Buried at the WallToe
Figure 3.2-6 Details of Fiber Optic Conduits Supportson a Concrete Culvert Wall
35
c: I l : A - - - - - -
z±ber OplC1
COnlUlts I
follow Baldy MesaRd., they crossunder several oldAT&SF, SouthernPacific, and UnionPacific railroadbridges (which arediscussed in Section3.5 of this report).After crossing underthe Southern Pacificrailroad bridge theconduits separate.Two conduitscontaining CONTEL,MCI, and US Sprintcontinue northwardalong Baldy MesaRoad. AT&T and WTGWest conduits turneast and followparallel to the Figure 3.2-7 Fiber Optic Conduits Heading Under I-15,Southern Pacific Attached to a Concrete Culvert Wallrailroad line alongan unimproved accessroad.
After about 2.25 miles the unimproved road (and AT&T and WTG Westconduits) turn north by northeast. The conduits follow this winding roadand approach the north bound section of I-15 about 0.5 miles south of thefirst I-15 intersection north of the Cajon Summit (the Caliente andMariposa intersection) where they connect with and then follow the routeof Mariposa Road. Mariposa Road runs parallel and east of the northboundlanes of I-15. As was done on the old Highway 66, whenever there is abridge on the Mariposa Road the conduits are placed above ground on thebridge. Figure 3.2-8 shows a typical conduit routing at a bridge. Thefigure shows an additional pipe (believed to be an unidentified waterdistribution pipe) hung directly above the conduit.
The CONTEL, MCI, and US Sprint conduits, after separating from the AT&T and WTG West conduits, continue to follow Baldy Mesa Road. The cross underthe north bound lanes of I-15 next to the location where two petroleumproducts pipelines cross under the highway. They then separate from theproducts pipelines and continue north until they approach the south boundlanes of I-15. Again, they combine with the petroleum products pipelinesto cross under I-15. Thereafter, they continue within the petroleumproducts pipeline rights-of-way. This route also places them (and thepetroleum products pipelines) parallel and near to the Los AngelesDepartment of Water and Power's two high voltage transmission lines. Whenthe power transmission lines join with Baldy Mesa Road the conduits (andthe petroleum products pipelines) are routed along the road next to and
36

. .I .between tne twopower transmissionlines. After about2 miles, Baldy MesaRoad turns due northand leaves the powertransmission lines.The fiber opticcables and thepipelines continuealong Baldy MesaRoad. About 1.5miles further norththey are joined by a36-inch natural gastransmission line,and all of theselifelines continuealong Baldy MesaRoad until theyleave the studyarea. It isinstructive, Figure 3.2-8 A Fiber Optic Conduit Hung From a Bridgehowever, to examine With a Water Distribution Pipe Directly Above Ithow the cables andpipelines cross overthe California Aqueduct (about another 2 miles north of the study northernboundary. All of the lifelines are brought to the surface to cross theaqueduct. One fiber optic cable conduit is hung from the side of thebridge with light fasteners as was done on other bridges. The otherconduit is hung under the bridge. The petroleum products pipelines alsoare hung from the bottom of the bridge while the natural gas pipelineseparately spans the aqueduct (see Section 3.4 for photographs of howthese fuel pipeline lifelines cross the aqueduct).
3.2.2 Microwave and Radio Towers
Because of their remote locations and the need to use trucks with winchesin order to assure travel to their sites, the radio and microwave towersthat support regional communications were not examined during the sitevisits. The cellular phone and radio towers which are used by CALTRANSand PAC TEL for local communications within the Cajon Canyon Pass itselfwere examined during the site visits. Refer to the map of Figure 3.2-1for the following discussions.
Starting from the southern boundary of the Cajon Pass study region, aradio tower is located at the western edge of the study boundary about twomiles west of the Los Angeles Department of Water & Power's high voltagetransmission lines and about 2.5 miles north of the southern edge of thestudy boundary. It is serviced by an unpaved road and distributionelectric power lines. Plans call for the expansion of this site into amuch larger communications center. At that time the collocation of the
37
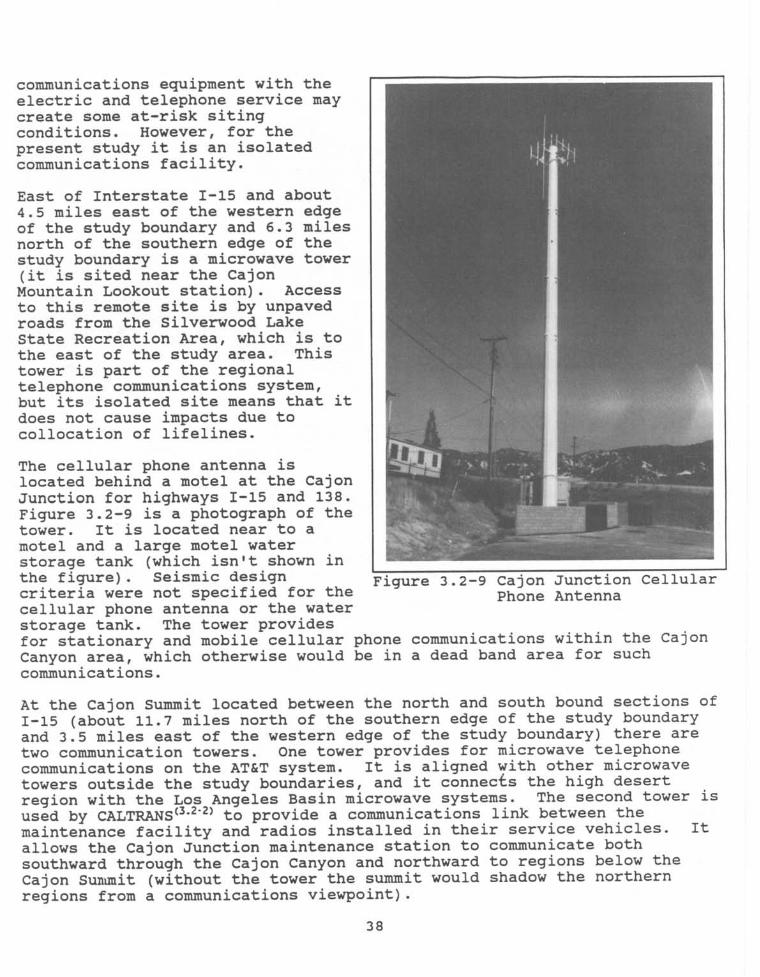
communications equipment with theelectric and telephone service maycreate some at-risk sitingconditions. However, for thepresent study it is an isolatedcommunications facility.
East of Interstate I-15 and about4.5 miles east of the western edgeof the study boundary and 6.3 milesnorth of the southern edge of thestudy boundary is a microwave tower(it is sited near the CajonMountain Lookout station). Accessto this remote site is by unpavedroads from the Silverwood LakeState Recreation Area, which is tothe east of the study area. Thistower is part of the regionaltelephone communications system,but its isolated site means that itdoes not cause impacts due tocollocation of lifelines.
The cellular phone antenna islocated behind a motel at the CajonJunction for highways I-15 and 138.Figure 3.2-9 is a photograph of thetower. It is located near to amotel and a large motel waterstoraae tank (which isn't shown inthe figure). Seismic design Figure 3.2-9 Cajon Junction Cellularcriteria were not specified for the Phone Antennacellular phone antenna or the waterstorage tank. The tower providesfor stationary and mobile cellular phone communications within the CajonCanyon area, which otherwise would be in a dead band area for suchcommunications.
At the Cajon Summit located between the north and south bound sections ofI-15 (about 11.7 miles north of the southern edge of the study boundaryand 3.5 miles east of the western edge of the study boundary) there aretwo communication towers. One tower provides for microwave telephonecommunications on the AT&T system. It is aligned with other microwavetowers outside the study boundaries, and it connects the high desertregion with the Los Angeles Basin microwave systems. The second tower isused by CALTRANS 3,22) to provide a communications link between themaintenance facility and radios installed in their service vehicles. Itallows the Cajon Junction maintenance station to communicate bothsouthward through the Cajon Canyon and northward to regions below theCajon Summit (without the tower the summit would shadow the northernregions from a communications viewpoint).
38

Bibliography for Section 3.2
3.2-1 Source of information: discussions with US Sprint, discussionsand construction drawings and routing maps from AT&T, CONTEL,and discussions with and routing maps from the US ForestService.
3.2-2 Source of information: discussions with the CALTRANS staff atthe maintenance station at Cajon Junction.
3.3 ELECTRICAL POWER LIFELINES
The electric power lifelines. (See Figure 3.3-1) located in the Cajon Passstudy area include a hydroelectric power generation station, high voltagetransmission lines, a transmission system substation, and wood poledistribution lines and transformers. For reference purposes, thelocations of the photographs provided in this, Section are shown on theFigure. In accordance with the basis for this study, only the facilitiesthat relate to regional or bulk transfer of electrical energy are beingexamined. Thus, the distribution systems are not described.
Some of the electric power towers have two circuits of three wires eachand some have one circuit of three wires. In conversation, the circuitsare often referred to as "lines". Multiple circuits on a single towersave right-of-way acquisition and construction costs, but the towers arelarger and cost more. Wind loading criteria generally control the towerdesigns. Specific earthquake design criteria usually are not applied.However, operating experience throughout the industry has confirmed thattowers so designed will perform well under earthquake conditions.
The maps of the U.S. Geological Survey were used as a starting point tolocate the appropriate electrical power lifelines. An initial site surveyconfirmed that not all of the transmission lines were identified on themaps. Subsequent meetings with the lifeline owners were held to gatherdetailed information, and that information was validated by additionalsite visits, meetings with regulators, and examination of the right-of-wayfiles of the U.S. Forest Service.
The City of Los Angeles Department of Water and Power is self-regulatingwith respect to applying, implementing, and inspecting the application ofseismic hazard standards., The California Public Utilities Commissionregulates.the activities for the Southern California Edison Companyfacilities in the Cajon Pass. However, their criteria are general andnon-specific in nature, mostly requiring that the consequences ofearthquake events be accounted for in the design, siting, and operation ofthe electric lifelines. Consequently, the transmission systems are notdesigned to specific seismic standards, but are designed to standards,including wind loading, which have been accepted as "'being morerestrictive than would be seismic standards alone"'.
3.3.1 Los Angeles Department of Water & Power Facilities
The Los Angeles Department of Water and Power owns two 287.5 kV
39
3.2.3
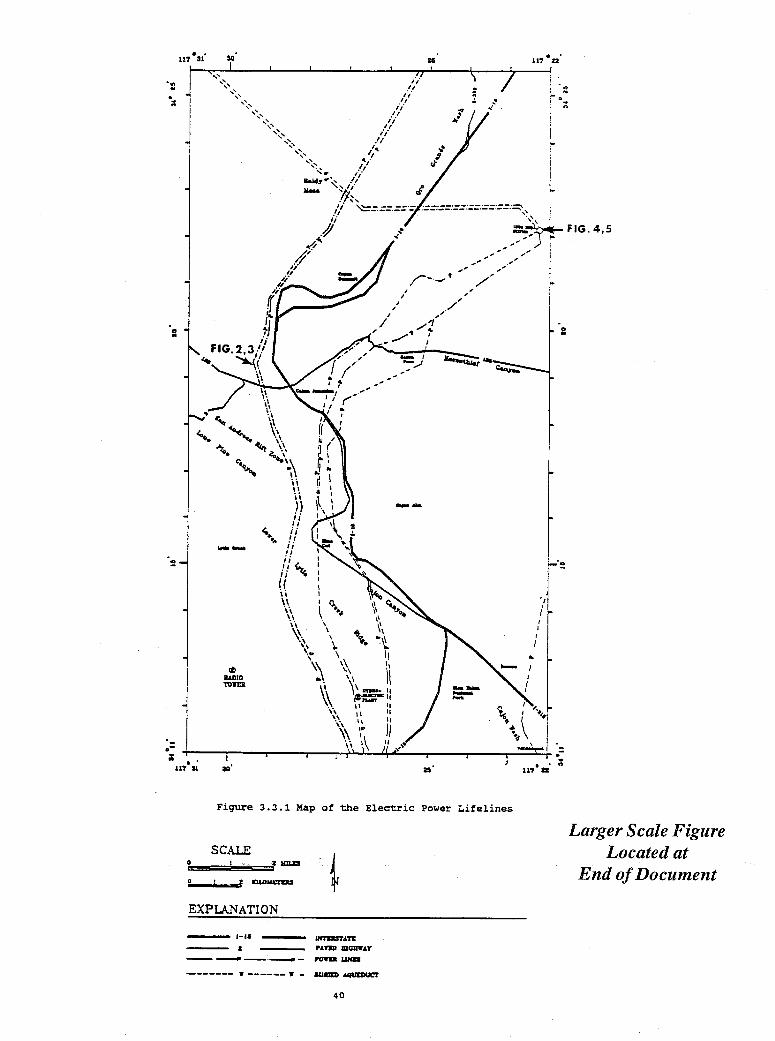
20 35
Figure 3.3.1 Map of the Electric Power Lifelines
SCALE0 I E 2
EXPLANATI ON
LargerScale FigureLocated at
End of Document
a -
- __ __-_ -
-- - - W-----…-… -
117 21
a
FIG. 4,5
I17?117 a
INTZX7TSPAV25 MGMIAY
rot A4
40
xl
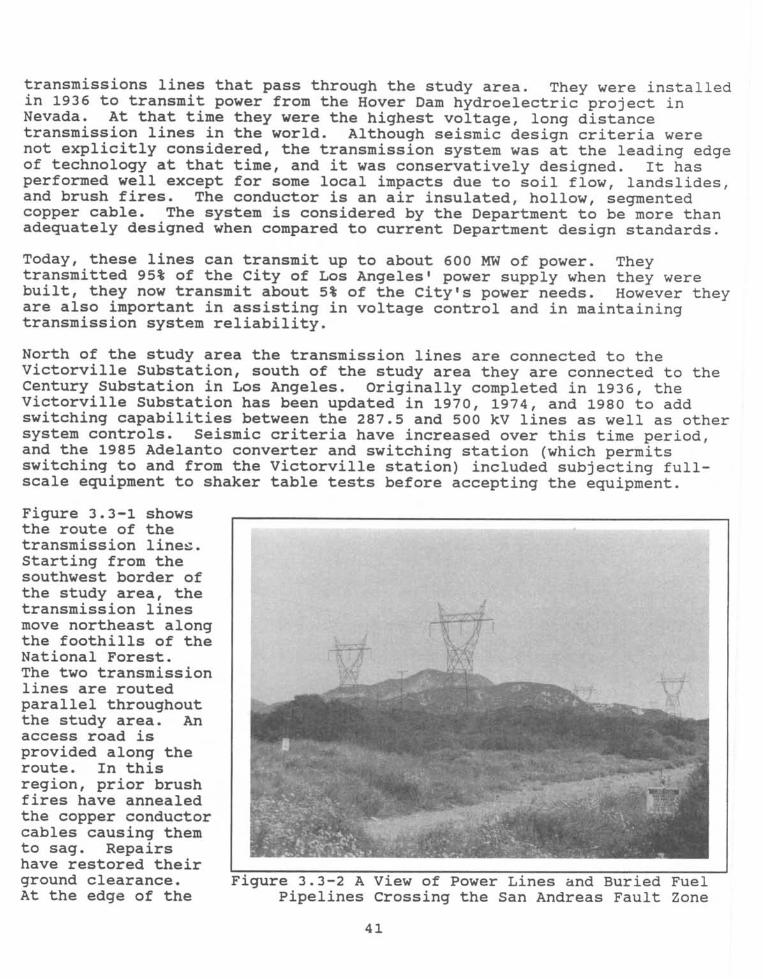
transmissions lines that pass through the study area. They were installedin 1936 to transmit power from the Hover Dam hydroelectric project inNevada. At that time they were the highest voltage, long distancetransmission lines in the world. Although seismic design criteria werenot explicitly considered, the transmission system was at the leading edgeof technology at that time, and it was conservatively designed. It hasperformed well except for some local impacts due to soil flow, landslides,and brush fires. The conductor is an air insulated, hollow, segmentedcopper cable. The system is considered by the Department to be more thanadequately designed when compared to current Department design standards.
Today, these lines can transmit up to about 600 MW of power. Theytransmitted 95% of the City of Los Angeles' power supply when they werebuilt, they now transmit about 5% of the City's power needs. However theyare also important in assisting in voltage control and in maintainingtransmission system reliability.
North of the study area the transmission lines are connected to theVictorville Substation, south of the study area they are connected to theCentury Substation in Los Angeles. Originally completed in 1936, theVictorville Substation has been updated in 1970, 1974, and 1980 to addswitching capabilities between the 287.5 and 500 kV lines as well as othersystem controls. Seismic criteria have increased over this time period,and the 1985 Adelanto converter and switching station (which permitsswitching to and from the Victorville station) included subjecting full-scale equipment to shaker table tests before accepting the equipment.
Figure 3.3-1 shows,;_... - r
tne route or tnetransmission lines.Starting from thesouthwest border ofthe study area, thetransmission linesmove northeast alongthe foothills of theNational Forest.The two transmissionlines are routedparallel throughoutthe study area. Anaccess road isprovided along theroute. In thisregion, prior brushfires have annealedthe copper conductorcables causing themto sag. Repairsnave restored tneir _, _ _ _ _ . _ . . _ground clearance. Figure 3.3-2 A View of Power Lines and Buried FuelAt the edge of the Pipelines Crossing the San Andreas Fault Zone
41
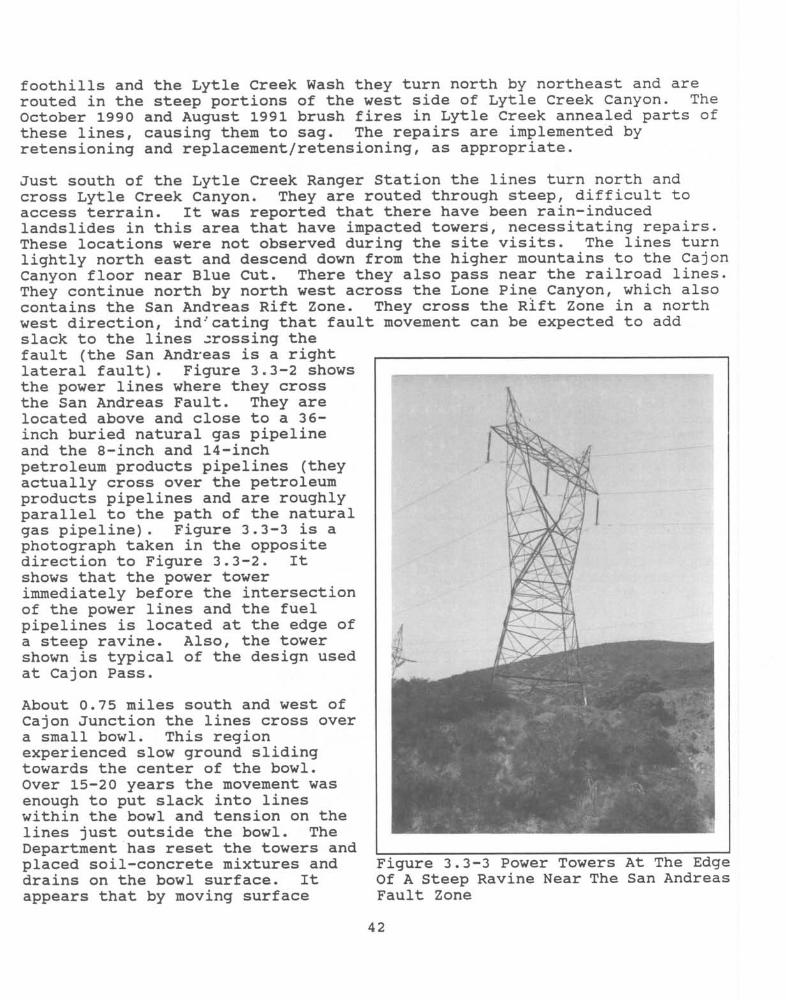
foothills and the Lytle Creek Wash they turn north by northeast and arerouted in the steep portions of the west side of Lytle Creek Canyon. TheOctober 1990 and August 1991 brush fires in Lytle Creek annealed parts ofthese lines, causing them to sag. The repairs are implemented byretensioning and replacement/retensioning, as appropriate.
Just south of the Lytle Creek Ranger Station the lines turn north andcross Lytle Creek Canyon. They are routed through steep, difficult toaccess terrain. It was reported that there have been rain-inducedlandslides in this area that have impacted towers, necessitating repairs.These locations were not observed during the site visits. The lines turnlightly north east and descend down from the higher mountains to the CajonCanyon floor near Blue Cut. There they also pass near the railroad lines.They continue north by north west across the Lone Pine Canyon, which alsocontains the San Andreas Rift Zone. They cross the Rift Zone in a northwest direction, ind cating that fault movement can be expected to addslack to the lines rossing theI - . . I .- . . I .- __ . . . - - . . - . .
- ___ % _- ---- --- -- - - - -2 --
lateral fault). figure .3-2 snowsthe power lines where they crossthe San Andreas Fault. They arelocated above and close to a 36inch buried natural gas pipelineand the 8-inch and 14-inchpetroleum products pipelines (theyactually cross over the petroleumproducts pipelines and are roughlyparallel to the path of the naturalgas pipeline). Figure 3.3-3 is aphotograph taken in the oppositedirection to Figure 3.3-2. Itshows that the power towerimmediately before the intersectionof the power lines and the fuelpipelines is located at the edge ofa steep ravine. Also, the towershown is typical of the design usedat Cajon Pass.
About 0.75 miles south and west ofCajon Junction the lines cross overa small bowl. This regionexperienced slow ground slidingtowards the center of the bowl.Over 15-20 years the movement wasenough to put slack into lineswithin the bowl and tension on thelines lust outside the bowl. TheDepartment has reset the towers andplaced soil-concrete mixtures and Figure 3.3-3 Power Towers At The Edgedrains on the bowl surface. It Of A Steep Ravine Near The San Andreasappears that by moving surface Fault Zone
42
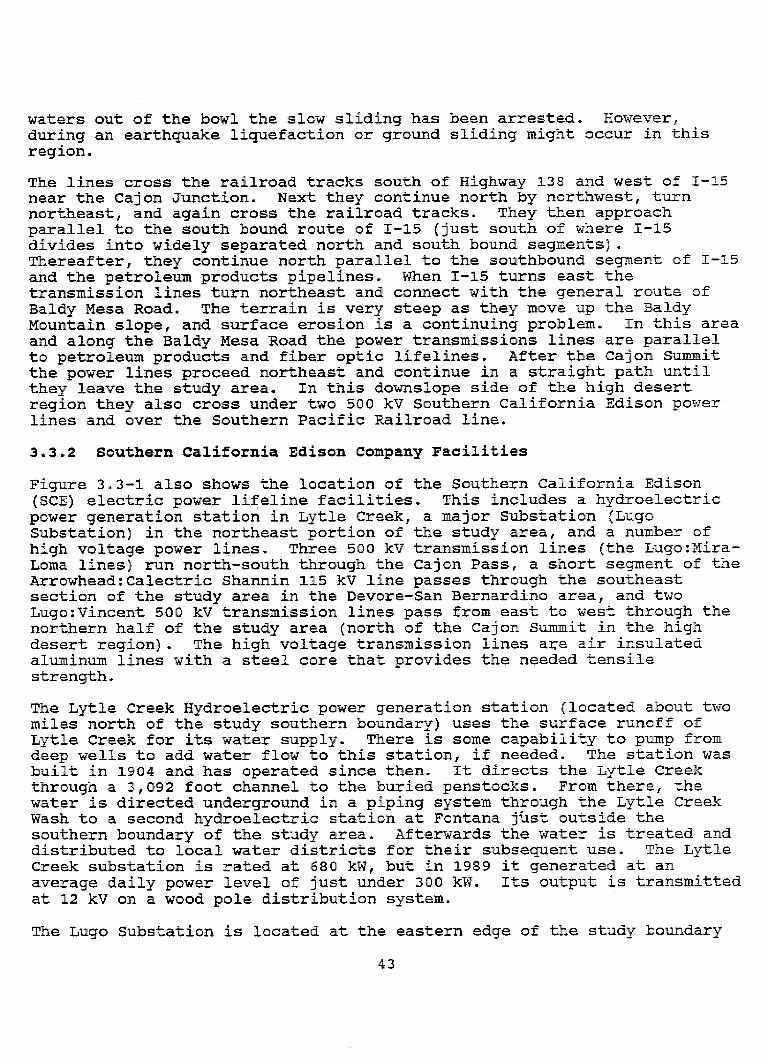
waters out of the bowl the slow sliding has been arrested. However,during an earthquake liquefaction or ground sliding might occur in thisregion.
The lines cross the railroad tracks south of Highway 138 and west of I-15near the Cajon Junction. Next they continue north by northwest, turnnortheast, and again cross the railroad tracks. They then approachparallel to the south bound route of I-15 (just south of where I-15divides into widely separated north and south bound segments).Thereafter, they continue north parallel to the southbound segment of I-15and the petroleum products pipelines. When I-15 turns, east thetransmission lines turn northeast and connect with the general route ofBaldy Mesa Road. The terrain is very steep as they move up the BaldyMountain slope, and surface erosion is a continuing problem.. In this areaand along the Baldy Mesa Road the power transmissions lines are parallelto petroleum products and fiber optic lifelines. After the Cajon Summitthe power lines proceed northeast and continue in a straight path untilthey leave the study area. In this downslope side of the high desertregion they also cross under two 500 kV Southern California Edison powerlines and over the Southern Pacific Railroad line.
3.3.2 Southern California Edison Company Facilities
Figure 3.3-1 also shows the location of the Southern California Edison(SCE) electric power lifeline facilities. This includes a hydroelectricpower generation station in Lytle Creek, a major Substation (LugoSubstation) in the northeast portion of the study area, and a number ofhigh voltage power lines. Three 500 kV transmission lines (the Lugo:Mira-Loma lines) run north-south through the Cajon Pass, a short segment of theArrowhead:Calectric Shannin 115 kV line passes through the southeastsection of the study area in the Devore-San Bernardino area, and twoLugo:Vincent 500 kV transmission lines pass from east to west through thenorthern half of the study area (north of the Cajon Summit in the highdesert region). The high voltage transmission lines are air insulatedaluminum lines with a steel core that provides the needed tensilestrength.
The Lytle Creek Hydroelectric power generation station (located about twomiles north of the study southern boundary) uses the surface runoff ofLytle Creek for its water supply. There is some capability to pump fromdeep wells to add water flow to this station, if needed. The station wasbuilt in 1904 and has operated since then. It directs the Lytle Creekthrough a 3,092 foot channel to the buried penstocks. From there, thewater is directed underground in a piping system through the Lytle CreekWash to a second hydroelectric station at Fontana jiast outside thesouthern boundary of the study area. Afterwards the water is treated anddistributed to local water districts for their subsequent use. The LytleCreek substation is rated at 680 kW, but in 1989 it generated at anaverage daily power level of just under 300 kW. Its output is transmittedat 12 kV on a wood pole distribution system.
The Lugo Substation is located at the eastern edge of the study boundary
43