Embed Size (px)
Citation preview

Federal Aviation Administration Aviation Rulemaking Advisory Committee Transport Airplane and Engine Issue Area Loads and Dynamics Harmonization Working Group Task 14 – Engine Windmilling Imbalance Loads

Task Assignment

[Federal Register: July 3, 1996 (Volume 61, Number 129)] [Notices] [Page 34922-34923] From the Federal Register Online via GPO Access [wais.access.gpo.gov] [DOCID:fr03jy96-154] ----------------------------------------------------------------------- DEPARTMENT OF TRANSPORTATION Aviation Rulemaking Advisory Committee; Transport Airplane and Engine Issues--New Task AGENCY: Federal Aviation Administration (FAA), DOT. ACTION: Notice of a new task assignment for the Aviation Rulemaking Advisory Committee (ARAC). ----------------------------------------------------------------------- SUMMARY: Notice is given of a new task assigned to and accepted by the Aviation Rulemaking Advisory Committee (ARAC). This notice informs the public of the activities of ARAC. FOR FURTHER INFORMATION CONTACT: Stewart R. Miller, Manager, Transport Standards Staff, ANM-110, FAA, Transport Airplane Directorate, Aircraft Certification Service, 1601 Lind Ave. SW., Renton, WA 98055-4056, telephone (206) 227-2190, fax (206) 226-1320. SUPPLEMENTARY INFORMATION: Background The FAA has established an Aviation Rulemaking Advisory Committee to provide advice and recommendations to the FAA Administrator, through the Associate Administrator for Regulation and Certification, on the full range of the FAA's rulemaking activities with respect to aviation- related issues. This includes obtaining advice and recommendations on the FAA's commitment to harmonize its Federal Aviation Regulations (FAR) and practices with its trading partners in Europe and Canada. One area ARAC deals with is Transport Airplane and Engine issues. These issues involve the airworthiness standards for transport category airplanes in 14 CFR parts 25, 33, and 35 of the FAR and parallel provisions in 14 CFR parts 121 and 135 of the FAR. The corresponding European airworthiness standards for transport category airplanes are contained in Joint Aviation Requirements (JAR)-25, JAR-E and JAR-P, respectively. The corresponding Canadian Standards are contained in Chapters 525, 533 and 535 respectively. The Task This notice is to inform the public that the FAA has asked ARAC to provide advice and recommendation on the following harmonization task: Engine Windmilling Imbalance Loads. Define criteria for

establishing the maximum level of engine imbalance that should be considered, taking into account fan blade failures and other likely causes of engine imbalance. Develop an acceptable methodology for determining the dynamic airframe loads and accelerations resulting from an imbalanced windmilling engine. Validate the proposed methodology with a demonstrative ground or flight test program (as deemed appropriate by ARAC) that has the objective of establishing confidence in the proposed methodology. The validation process should answer the following questions: (1) What are the parameters to consider in determining the minimum degree of dynamic structural modeling needed to properly represent the imbalanced condition; (2) Is the proposed analytical methodology taken in conjunction with the traditional ground vibration tests, flight flutter tests, and tests performed under Sec. 33.94 of 14 CFR sufficient, or are there additional tests and measurements that need to be made to address this condition? Within 12 months from the date of the published notice of new task in the Federal Register, complete the above tasks and submit a report to the FAA with recommendations detailing the criteria and methodology. ARAC Acceptance of Task ARAC has accepted this task and has chosen to assign it to the existing Loads and Dynamics Harmonization Working Group. The working group will serve as staff to ARAC to assist ARAC in the analysis of the assigned task. Working group recommendations must be reviewed and approved by ARAC. If ARAC accepts the working group's recommendations, it forwards them to the FAA as ARAC recommendations. Working Group Activity The Loads and Dynamics harmonization Working Group is expected to comply with the procedures adopted by ARAC. As part of the [[Page 34923]] procedures, the working group is expected to: 1. Recommend a work plan for completion of the tasks, including the rational supporting such a plan, for consideration at the meeting of ARAC to consider Transport Airplane and Engine Issues held following publication of this notice. 2. Give a detailed conceptual presentation of the proposed recommendations, prior to proceeding with the work stated in item 3 below. 3. For each task, draft appropriate documents with supporting analyses, and/or any other related guidance material or collateral documents the working group determines to be appropriate. 4. Provide a status report at each meeting of ARAC held to consider Transport Airplane and Engine Issues. Participation in the Working Goup The Loads and Dynamics Harmonization Working Group is composed of experts having an interest in the assigned task. A working group member need not be a representative of a member of the full committee. An individual who has expertise in the subject matter and wishes to

become a member of the working group should write to the person listed under the caption FOR FURTHER INFORMATION CONTACT expressing that desire, describing his or her interest in the tasks, and stating the expertise he or she would bring to the working group. The request will be reviewed by the assistant chair, the assistant executive director, and the working group chair, and the individual will be advised whether or not the request can be accommodated. The Secretary of Transportation has determined that the formation and use of ARAC are necessary and in the public interest in connection with the performance of duties imposed on the FAA by law. Meetings of ARAC will be open to the public, except as authorized by section 10(d) of the Federal Advisory Committee Act. Meetings of the Loads and Dynamics harmonization Working Group will not be open to the public, except to the extent that individuals with an interest and expertise are selected to participate. No public announcement of working group meetings will be made. Issued in Washington, DC, on June 26, 1996. Chris A. Christie, Executive Director, Aviation Rulemaking Advisory Committee. [FR Doc. 96-16960 Filed 7-2-96; 8:45 am] BILLING CODE 4910-13-M

Recommendation Letter

~ BOEING
October 24, 1997 B-TOOO-ARAC-97-012
Mr. Guy Gardner
The Boeing Company PO. Sox 3707 Seattle. WA 98124-2207
Associate Administrator for Regulation and Certification Department of Transportation Federal Aviation Administration 800 Independence Avenue, S.W. Washington, DC 20591
Dear Mr. Gardner:
' )
fjr tJ r_ i -I .
Subject: Submittal of Loads Imbalance Working Group Final Report
The final report from the Engine Imbalance Loads Working Group was reviewed by the ARAC TAEIG at their meeting of July 29 - 30, 1997. The report was unanimously approved for submittal by the ARAC T AEIG Members with one editorial change. On page 11-1 of the report, last sentence, the wording was revised as follows: " .. .level of safety, these criteria shaala alsa he &ssl:lfflea ta apply etta&lly [may be applicable] to airplanes ... ".
The ARAC T AEIG Members wished to take this opportunity to commend the efforts of this Working Group.
Please accept this letter as formal submittal of the above item. Copies of the submittals have been previously sent to FAA Office of Rulemaking.
The members of ARAC T AEIG appreciate the opportunity to participate in the FAA rulemaking process.
Sincerely,
Ed A. Kupcis Chief Engineer, Certification Requirements, Boeing Commercial Airplane Group Tele: (425) 234-4304, FAX: (425) 237-4838
/ r'-

Acknowledgement Letter

U.S. Department of Transportation
Federaf Avtaflon Administration
JAN 2 3 1998
Mr. Craig Bolt Aviation Rulemaking Advisory Committee Pratt & Whitney 400 Main Street East Hartford, CT 06108
Dear Mr. Bolt:
800 Independence Ave , SW Washington. DC. 20591
This letter is in response to Mr. Ed Kupcis' letter in which he submitted the Engine Windmilling Imbalance Loads Final Report. This report establishes acceptable criteria and methodology for determining the dynamic airplane loads and accelerations resulting from an imbalanced windmilling engine. ·-
I would like to thank the Engine Imbalance Loads Working Group and the aviation community for its expenditure of resources to develop this Final Report, and its commitment to the Aviation Rulemaking Advisory Committee. A draft advisory circular on this final report is anticipated early 1998.
Sincerely,
.,'\~~ Q~~~C-\ 't \ ..
i,-<'Guy S. G~dner - · ~ Associate Administrator for
Regulation and Certification

Recommendation

Engine Windmilling Imbalance Loads
Final Report- July 1, 1997
Aviation Rulemaking Advisory Committee
Engine Imbalance Loads Working Group
DRAFT
•

1. Contents
EXECUTIVESU}d),{ARY ••••••••••••••••••••••••••••••••••• i
UST OF CONI'RIBUTORS •••••••••••••••••••••••••• -•••••••• ill
CON'I'ENTS •••••••••••••••••••••••••• -.................. . 1-1
IN'I'R.ODUcnON ••••••••••••••••••••••• • ...................... ,_~ 2-1
SER.VICE lilSTORY. • • • • • • • • • • • • • • • • • • • • • • • • • • • • • • • • • • • • • 3-1
RECOMMENDED CRITERIA . . . . . . . . . . . . . . . . . . . . . . . . ..... 4-1
OBJECTIVE OF ANALYSIS •••••••••••••••••••• ............. 5-1
OO'EGRA. 'I'ED MODEi.. •••••••••••••••••••••••••••••••••••• 6-1
AIR.FR.A,ME STR.UCI't.JRA.L. MODEi.. • • • • • • • • •••••••••••••••••• 7-1
ENGrnE. MODEL • • • • • • • • • • • • • • • • • • • • • •••••••••••••••••• 8-1
AERODYN'AMIC MODEi.. ••••••••••••••••••••••••••••••••• 9-1
VALIDATION OF INTEGRA.TED MODEL ••••••••••••••••••••••• 10-1
CONCLUSIONS AND RECOMMENDATIONS •••••••••••••••••••• 11-1
1-1

ARAC Engine Imbalance Working Group
Membership
Partha Mukhopadhyay (Chairman) Jeff Bland Chet Lewis C-1 Neidermeyer Wayne Tygert Bob Wilkinson Christian Beaufils Jean-Yves Beaufils Michel Llcabanne John Galligher Amos Hoggard Bill Barron Tony Linsdell Doug McKissack Brian Adams Dave Klassen Eduord Jadczak Mike Pollard Mike Romanowski Al Weaver Jim Haynes Lanny Pinkstaff Jay Turnberg Vic Card
iii
Boeing Boeing Boeing Boeing Boeing Boeing Airbus Airbus Airbus Douglas Douglu Lockheed Canad•ir Gulfstream Rolls-Royce GE SNECMA Pratt & Whitney Pratt & Whitney Pratt & Whitney FAA FAA FAA JAA

Executive Summary
This report is submitted to complete the task published in the Federal Register
(Vol. 61, Number 129) on July 3, 1996 and usigned to the Aviation Rulemaking
Advisory Committee (ARAC) entided "Engine Wmchnifling Imbalance Loads." This
report details the work performed in establish!ng an acceptable criteria and methodology
for determining the dynamic airplane loads and accelerations resulting from an
imbalanced windmi1Jing engine. The conclusions and recommendations of this report
represent the fully agreed position of the Loads and Dynamics Harmonization Working
Group.
This report addresses fan blade failure events as well as other likely c.anses of
significant engine vibratory loads such as loss of centerline support.
Thorough examination of all known events indicates that none resulted in
significant airplane damage and all resulted in continued safe flight and landing.
However, an examination of the existing criteria did not identify any specific
requirements that would continue to guarantee the positive outcome experienced in the
known events. Therefore, the worlcing group developed recommended criteria to assure
safety of flight in all future airplanes in the event of windmilling under engine imbalance.
The criteria recommended in this report arc applicable to high bypass ratio
engines with fan diameters greater than 60 inches. In the absence of evidence justifying
an alternative approach providing an equivalent level of safety, these criteria should also
be assumed to apply equally to airplanes with smaller diameter engines.
Based on statistical analysis of the service history data of large high bypass ratio
engines under windmilling imbalance condition, design evaluation criteria have been
developed to ensure continued safe flight and landing following a fan blade loss event

This is accomplished by establishing the maximum level of engine imbalance and
associated diversion times to be used for analytical detennination of the airplane loads
and accelerations.
Recommendations are included addressing the level of detail required for engine
and airframe modelin& to adequately describe the dynamic characteristics needed to
provide valid loads and accelerations. The working group reviewed the traditional . .
ground vibration tests, flight flutter tests, and tests performed under Sec. 33.94 of 14 CPR
and concluded that no further demonstrative ~d or flight test programs would be -
needed in order to_ achieve the objective of establishing confidence in the proposed
methodology.
The working group recommends that a harmonized FAR Part 25 Advisory
Circular and an ACJ to JAR 2S be developed based on the technical information
contained in this report.
ii

2. Introduction
The gradual evolution of the turbofan engines has led to the introduction of
engines with increasing bypass ratio to achieve high fuel efficiency. These engines have
the same propulsion principle as the earlier generation high bypass ratio engines. A gas
turbine drives a multi-bladed fan that accelerates the oncoming airmass, generating thrust
for propelling the aircraft. A small amount 09et _thrust is also provided from the engine
core. Need for higher efficiency and greater robustness has resulted in fan design
consisting of fewer blades of larger mass than previously used.
In the service experience of the existing high bypass ratio engines there bad been
instances, though very rare, of blade loss and even more rarely, fan shaft support loss. In
most cases the fan continues to rotate produciug an imbalance load even after the engine
combustor has been extinguished. 'Ibis phenomenon is called imbalance load under -
engine windmiJiing. In all cases the airplane safely landed with no other significant
damage to the airplane, and without any injury to the passengers or crew.
With the advent of heavier fan blades, the FAA became concerned whether the
past design practice that resulted in safe designs will continue to produce safe design for
the 'new engine-airframe combinations. To address this concern the FAA is requiring . detailed evaluation of airplanes by means of Issue Papers on new certification programs.
In these Issue Papers, the PAA has cited existing sections of the FAR Part 25 as the basis
for compliance. The Issue Paper process does not afford sufficient sharing of knowledge
with the industry as a whole and the FAA. Therefore, to address the issue the Aviation
Rulemaking Advisory Committee (ARAC) has assigned a task to the Loads and
Dynamics Harmonization Working Group that consists of experts in this field. The task
has been published on July 3, 1996 in the Federal Register, Vol. 61, Number 129, and is
reproduced below.
2-1

"~ Task-This notice is to inform the public that the FAA has asked ARAC to
provide advice and recommendation on the following harmonization task: "
"EngiM Windmilling Imbalance Loads. Define criteria for establishing th4
ma.%imum level of engiM imbalance that should be considered, taking into account fan
blade failures and oth4r liuly causes of engiM imbalance. Develop an acceptabk
methodology for tktermining th4 dynamic ai,frMM loads and accekratio,u resulting
from an imbalanced windmilling engiM. Validate th4 proposed methodology with a
tkmonstratiw ground or flight test program ( as d4oned appropriate by ARAC) that ha.r
the objective of establishing conjidmce iatlw proposed methodology. 1'1u! validation
process should answer th4 following questioru; ( 1) What are th4 fJ(U(llMters to consuur
in tktermining the minimum tkgree of dynamic stnu:tural mouling needed to properly
represent tlw imbalanadcondition; (2) Is th4 proposed analytical methodology taun ·in
conjunction with th4 traditional ground vibration tests, flight flutter test.I, and tut8
performed lllllkr Sec. 33.94 of 14 CFR sujJicient, or are there additional test.I
measuranenu that need to be 1tUMU to address this condition. "
"Within 12 monlh.rfrom th4 date oftM published notice of new task in the
Federal Register, compkte the abo_ve ta.sic and submit a report to th4 FAA with
recommendations tktailing the criteria and methodology. "
In this report a thorough review of the service history of high bypass ratio engines
under windmilling imbalance condition is presented. The service history data have been
examined by the engine companies, the ain:raft manufacturers, and the FAA and IAA
specialists. Based on the evaluation of the service history data, recommendations have
been made on design evaluation criteriL
Extensive industry experience of ground and flight testing pertaining to dynamic
behavior of the airframe-engine combination has been reviewed. Analytical results have
been correlated with the test results. Appropriate methodology for determining airframe
loads and accelerations are presented. The methodology has been essentially validated by
ground and flight tests currently perfonned to satisfy various sections of the 14 CFR.
2-2

3. Service History
The service history of large high bypass ratio turbofan engines from entry into
service up to May 1996 is comprised of 426 million engine flight hours. During this
period 152 notable events have OCCUITed. A notable event represents either a condition
where an imbalance equivalent to one fourth of a fan blade or greater is experienced, or a
condition resulting from the failure of a support element of the rotor. (Large is defmed as
engines with a fan diameter of 60 inches or greater. Engine flight hours are defmed as the
time period from the start of takeoff roll to tOllChdown.) While events involving loss of
fan blade material equivalent to less than one fourth of a blade have occurred in service,
these have not caused significant vibrations. The fan blade loss events are more common
than fan rotor support loss events: 146 vs. 6. In this chapter the service history data for
both of these imbalance conditions are analyud.
Fan Blade Loss
Fan blade loss has occurred in service for various reasons, for example, bird
strike, foreign object ingestion and high and low cycle fatigue. Service history data
indicates a gradual improvement in the robustness of the fan blades as a result of the
industry's effort to improve all aspects of fan blade design, manufacture, and
maintenance. Though significant improvement has been achieved over time, to be
conservative, the entire service history is considered as a single set.
The available service history data consist of blade loss material release fractions
and subsequent windmilling time for large modem high by-pass ratio turbofan engines.
The database includes events occurring from entry into service through May 1996, a
period of approxirnarety three decades. A total of 146 events in the resulting database are
used for statistical analysis.
3-1

Where additional tests can contribute to further increase confidence, they have been
identified.
This report completes the above mentioned task assi$11ed to the Loads and
Dynamics Harmonization Working Group.
2-3

distributions may be more realistic for predicting the behavior of future events since they
are weighted by the bulk of the data. Thus, the effect of potentially anomalous data at the
extreme end of the sample is damped which reduces overly conservative estimates of
events.
Histograms of design fraction and windmill time are shown in Figures 3.1 and 3.2
together with the actual numbers of events. The histograms are included in modified
form in other figures for comparison with tbe distribution fits.
The data were tested for fit using thRe-different statistical distributions: gamma,
Weibull and lognonnal. These distributions were chOlell becaJ•se they do not have
negative values and they can be shaped to minimize tbe effect of tbe lack of data between
O and 0.1 IDF (0.25 blade fraction) where data was not collected.
The parameters for the gamma. Weibull, and lognonnal distributions are obtained
by fmding the maximum likelihood estimators (MLE) for each of tbe distributions based
on the data sets. Once the parameters are determined, the data are compared graphically
to the distribution in two ways.
The first comparison is of the three distributions to a nonnalin:d histogram of the
data. The area under the normalized histogram is one. This allows comparison against a
probability density function (pdf) and is shown in Figure 3.3a. All three of the
distributions follow the same trend, but the gamma pdf and the lognonnal pdf follow the I
shape of the histogram more closely. The peak of the lognonnal pdf is slightly closer to
the peak of the histogram than the gamma pdf.
3-3

The primary parameters used in the statistical analysis are imbalance design
fraction (IDF) and the windmilling time . Windmilling time is defmed as the time in
minutes from blade release to landing. An IDP of 1.0 is defined as the mass imbalance
that would result from failure of the most critical turbine, compressor, or fan blade under
the conditions specified for the blade containment and rotor i.mba1ance tests in section
33.94 of 14 CPR. Blade fraction is defined as the vector sum of the mass moments of the
lost rotor material divided by the mass imba1lnce of one blade removed at the dovetail
fillet. Mathematically this value is expressed as:
Where,
m = a missing rotor mass
r = the radius from the rotor center to the center of gravity of m
9 = an angle meuure4 from a fixed axis (normal to the axis of rotation)
to the radial line, r
And subscripts are,
i identifies the ith missing mass of n items
b identifies a removed blade
The statistical analysis is used to derive exceedance curves, and thus to detennine
exceedance rates over a wide range of IDP and windmilling time values. In order to
accomplish this task, the cumulative distribution functions (CDF) for the IDF and
windmilling times were generated. At least two methods could be used to generate the
CDF s for the two distributions. The first would be to use the ranked raw data, and the
second would be to use continuous distributions. There are good reasons for considering
both approaches. The raw data is the historical record with all of the events included,
even those that may be considered anomalous. The perspective provided may be useful
in bounding the issues considered in this document. However, the continuous
3-2
•

top of climb without fuel dump, and any event which occurs up to top of climb with a
fuel dump before return, respectively. The Weibull distribution appeared to fit slightly
better than the other two distributions but the lognormal distribution is chosen for further
analyses since it is most conservative at the high end of the distribution.
Figure 3.5 shows a scatter plot of ~ndmill time versus design fraction. The
correlation coefficient CRi between blade fraction and windmill time was computed for a
linear fit to be O.OS. Based on R2. IDF and windmill time are statistically independent of
one another. Thus, the joint probability function is defined as follows:
P(z.w)• (1- F,c(z)Xl • F,,(w)}
where: P = probability of an event with x 2: z and w 2 w.
x = imbalance design fraction w = windmill time (minutes) Fx = CDF for imbalanc:e design fraction F" = CDF for windmill time (minutes)
The joint probability function is used to calculate the probability of having an
event with an IDF of x or greater, and a windmill time of w or greater.
The exceedance rate curves are generated using the previously defined joint
probability function with the number of reported fan blade separation incidents which
occ_µrred in flight and the corresponding total number of hours accumulated by all large
hig~ bypass ratio engines. The fonnula used to calculate the exceedance rate is:
Exceedance Rate= N, · P(x.w) CT
where: CT = total number of engine flight hours in database N, =_number of reported incidents in database above V1
Note that the exceedance rates are based on the number of fan blade loss events
that occurred during the flight phase; i.e., at speeds greater than decision speed (V,). If
one were to include all blade loss events from start of takeoff roll to airplane stop after
landing, the exceedance rate would be approximately thirty percent greater than that
computed for th~ 124 in flight events. However, the resulting probabilities would then
require scaling by the probability that the blade release event occurred in flight (about
3-5

The second graphical method compares the MLE distributions against the ranked
data for the CDF and 1 - CDF. This is accomplished by ordering the data and assigning
an order number, i. The CDF is estimated u follows:
CDF(i) • ..!;!;!_ N+0.4
where: . N = total data points that occurred in flight i = order number
The comparisons of the MLE distributions against the ranked data for design
fraction are shown in Figures 3.3b and 3.Jc.
A correlation coefficient {R3) estimate of the fitted distributions bu been
determined. These are seen in Figure 3.Jc, along with plots of the CDF. The lognormal
distribution bu a greater value of R2 than the other two distributions.
The parameter estimates are listed in Figure 3.3b and shows 1 - CDF, which is the
probability of that event or greater occurring. The tails of the distributions in Figure 3.3b
shows that the lognonnal distribution will giw the highest probability for a given event
or larger, making the lognormal distribution the most conservative at the high end of the
distribution.
Since the lognormal distribution gives the best representation of the data and is
the most conservative for extreme values, it is used to represent the IDF distribution in
the rest of die analyses.
The statistics for windmilling eve~t duration after blade loss are also fitted with
the three types of distributions. Similar comparisons that are shown in Figure 3.3 for
imbalance design fraction are shown in Figure 3.4 for the windmilling duration. The
reporting of windmill times is typically split into 10 minute increments, causing difficulty
in fitting a continuous distribution. In addition there are three notable clusters at twenty,
thirty, and fifty minutes. These times are typical of events which occur early in climb and
3-4

Engine Rundown and Shutdown Experience
Service experience indicates that rundowns occur at all levels of blade fraction
within the database. Engines which have experienced a full blade loss or more have
always rundown to idle or below within a few seconds after blade release. All were shut
down by the flight crew within a few le!C()Dds after l'UDdown.
Rundown experience is less clear for blade fractions less than one. The consensus
of the engine manufacturers is that 20 seconds nm-on f«-self shutdown or crew
intervention is a reasonable time for blade ~o~ greater than 0.50 but less than 1.0.
Some events between 0.25 and less than O.S blade fraction may run on indefinitely unless
the crew takes action to shut down the engine. Although these events cause higher
frequency vibration than windrni1Jing events and are not a tbrelt to the airplme s~
they have caused crew confusion as to which engine should be shut down. Engine
secondary damage resulting from the run on at power bas in some cases caused engine
conditions which could be hazardous to the airplane (for example through ID engine fire).
Consideration should be given to ensure that on future airplane designs the crew members
are able to make the decision to shut down the appropriate engine in a timely manner.
Fan Rotor Support Loss
Service history database contains six events where fan rotor support loss has resulted in
moderate to heavy vibration as characterized by crew comments. These events are shown
in Table 3.1. In all cases the crew were able to fly the airplane to complete a safe flight
and landing. There were no reports of airplane damage beyond loss of some small access
panels and minor structural element cracks (which were not substantiated as being caused
by the event) for any of the support loss events. There are six fan rotor support loss
events, giving ID estimated cumulative probability of 1.41 x 10"' per engine flight hour.
However, five of the events have occurred since 1995 leaving a twenty year gap between
the first event .. When this data is viewed from a three year rolling rate perspective the
rates are about three times greater. A cumulative rate comparison of FBO and loss of
support events is shown in Figure 3.7
3-7

0.76), bringing the result back to the one in the above equation. The engine hour
exceedance rates for various design fractions and windmill times are shown in Figure 3.6.
The joint probability function used in this calculation was generated using the lognormal
distributions for JDF and windmilling time. The reader may substitute the actual data
CDF s to obtain an actual data estimate of the exceedanc:e curveS if desiml.
Exceedance rates in airplane hours may be obtained from Figure 3.6 by
multiplying the ordinate by the number of engines used on the airplane.
A conservative estimate of the impact of including the loss of centerline support
events in the analysis showed that the exceectaoce values at 1.0 JDF and windmilling
times greater than zero. 60 lllcl 180 minutes increased to 3.S x Ur', 6.3 x l<t and 1 x 10·11
per engine flight hour, respectively. These changes to the exceedauce estimates would
not alter the conclusions drawn in this report.
3-6

Table 3.1 Pan Rotor Support Loss
Data 1/5/H 8/17n4 1215195 '316/H 81105 7/Zl/95 LwledSdely Y• Y• Y• Y• Y• Y• Vlbndoll I MOMl'lltelmp Hip 'Hip Rip Rip Rip
RablllDs Y• Y• Y• Y• Y• Y• Permaeat Saft No Y• No No No
De8ecdolt Beuiap .. Shar 1·1.0-0 0-1 0-1 0-1 1-0 0-1·1 CUM Baurd IAnl3 0 ld ld 0 0 0
1 BUld oa crew COllllllllat . 21'1ae d ..... dom la dlltl row npnseat tbl ......... codprad• oa die low rotor
of die eapae type repr••ted la die ff8lt. . A "0" lad1cate, a IOII of aamllae at dult aadoll (a bearina Wan or a ~pied
beulaa •pport or boda). A "1" laclicaw a IOlllld llearfaa mad -,port.
3 CUM (Coad......a Alnortldwl A.a rnrnt Medaodoloo) bmrd leTel ld sipifles minor dalm&e to die airplaae. la dalle ca111 It Wiii tbe IOII of acclll ,.._, or wiq tip aateaaM, or minor ltrllt NCOadar7 mactan c:ncJdq.
3-9
•

In loss of support events, the induced vibration results from the displacement of
the center of the mass of the fan or turbine from the geometric center of the rotating
system. The rotor displacement is controlled by a combination of gaps in the shaft
support system and shaft deflection due to the elastic and (sometimes) plastic
deformation of the rotor shaft
As seen. in Table 3.1, loss of a bearing support can result in crew reports of high
vibration. However, e-ve:: in tbele cases the airplanes were landed safely. Investigation
of these airplanes showed tbll the primary muc:tule sustained no darnap. From this
service experience, it is concluded that current airplanes should have adequat.e strength to
meet this condition. However, this may not always be the case, especially if new airplane
designs are significandy different from conventional configurations-in 'Vertical and
longitudinal mass distributions of fuel. payload. engine location. etc. and operational
roles. Without a specific "loss of centerline support" condition.- the current engine failure
requirements do not guarantee that-the neeessary stllic and fatigue strength will always
be present. Therefore, consideration has been given to the introduction of a specific "loss
of centerline support" condition in addition to the fan blade imbalance condition.
Recommended criteria for both of these conditions are given in Chapter 4.
3-8
•

w I -·-
-
-10-· · ... · .... · · · ..
---s ,.. ....... .
-
-
Distribution of Windmill Events
. . : Numben in ~theses ue : imbalance desi~ friction . .
. . . ...... ~ ........... : ..... ·:· ................. : ................. . . . . . . . . . . . . . . . . . . . . . . . . . . . . . . . . . . . . . . . . . . . . . . . . . . . . . . . . . . . . . . . . ~: : : cri: : : 0· . .
..... ~r···················'.--······ ···········!···· ....... . o: . .
~! ~ e: o - ~ e -
-~ ---
. .. ·-
i e QL...-L.' ~L-..&L....U.--u~n ...u.....&-..-IL-.-..1.....&..n _..___.· --'--'-..._.· ---L-11, O W ~ ~ ~
Windmill Time (Min.) 100 lW
l-May-91 Fipre3.2

IM I -0
Distribution of Imbalance Design Fraction Events
--2S-······ .. ....... : ..................................... : .................. : .................. : ................. . . . . . . . . . . . . . . . . . . . . . . . . . . . . . . . . . . . . . . . . ....... : : : . . .. . . . . . . . . . .
. .. · ................. ! .................. : ................. ·:· ................. : .................• 20~ ...... . . . . . . . . . . . . . . . . . . . . . . . . . . . . . : : : : Q
Numbers (It parentheses are: windmill time ~n,) . . . . ···············~ ··················::··················:··················!·················-
-10 ~ · · .. .. . . . .............. ·····.;··················.······················ ..... .
-.s ~.. . . .. . . . . . . . . . .
o o o o o o o • o o o o O o o • I o O o, o o o o o o o o o O o o o o O O o '•' 0 o o o o o • o • o o o I O o o o Io • • • o o O • o • • • o o • • ••
:6' : : , ..... )5f i 1 m 1 ! n
o . .s 1 1 . .S 2 2 . .S Imbalance Design Fnction
Figure 3.1
s ~
n 3

Maximum Liblihood Estimation for 3 Oisttibutions - 79 Data Points - fbodb I
a. 0.0,---------"""r"----------,.----------
;i 0.04 = . lo.o3
············ .. ·············· 0 . Dara -Oamma-MLB - - Weibull - MLB
. . . . . . . . . . . . . . . . . . . . . . . . ..... ~ . . . . . . . . . ...... :· .......... - · - · - Lopormal - MLB . . ...... ' . . . . .
. .. ~....... . ..... : ................ ; ................. ~--·· ............. ; .............. . ;..-,~,-,, . . . . . .
. . . . .. ................ ~ ................................ . . . . . . . . . . . . .
20 ..0 60 80 100 W-mdmill Tam (Min.)
b.
. . . .................................. ,. ...... . . . ·-~----. :
120
--.... o·-··-=-. . : :' ........... 0 : ·-··- ..... __
················:·················:·················:··················:········:-,.·,·~ :··············· . . . . ...... . . . . . ' . . . . . '
.............. .l.~~~·=.ma:-3~· .~~l ......... ~ ............... ) ...... ~.~-~ .... . . . . . . . . . . . . . . . . . . . . . . . . . . . . . . . . . . lO~L-------11.-----'--------'-------------...... --------"'----___.
O 20 ..0 60 80 100 120 W-mdmill Tam (Min.)
c.
········:···········.·······:················-:················ . . . . . . 0.8 ........ · ....... ; ............... · · , .... . . . . . . . . .
···············<········ ···!·················:··················:·················:················ . . . . . . . . . . . ,--------------. . . . . . .
0.6
a 0.4
- R"'l-0.9798 - - R"'2=0.9803
. . ............ ! ................. :· ................ ~ ..... .
. . . .
· - · - R"'l:m0.973 . . . . . . . . ... : ................. : . . . . . . . . ....... ·~ ................ '. ...... ___________ ___.
. . . . 0.2
. . . . . . . .
20 40 60 80 Windmill Tame (Min.)
100 120
Pigure3.4
3-13

.3 1..5 ::c
t ~
I
Maximum I.Jkelihood Estimation for 3 Di.sttibucions - 146 Dala Points - fbodbl
' :
0.5
L
··········:·················:················ . . . . . . . . . . . .
O Dala -Gamma-MU! - - WeibuU-MLB . - .... l..olftCXIIIU - MLB
. . . ............... ·:- ................ ~ ................. ~ .............. . . . . . . . . .
l ,., 1 lml,el1DCC Delip PrlCdoa
b.
3
100 r-....... lllliii._~;;~:::-:---------r--------~---------y---------i 10-• · · · · · · · · · · · .. · · ·:· .. · · · ..... · · · · ............. ··~ ................ ~- ............... ·~ .............. .
10-2
p,. 10_,
~ 10 ...
10-'
104
~~~.: : : . . . . . . . . . . . . . . . ... . . . . . . . . . . . . . . . . . . . . . . . . . . . . . . . . .
,. . . . . .
. :.er ... ._1,·-·: ~ ~:,:: .............. -~ ................ . ·- ... .
10~'------------IL......-------..:...&.--------...a.---------'--------------------' 0 0..5 1.5 2 2.5 3
lmbelenc:e Delip Friction
c.
- R"2-0.9SS1
0.8 - - RA2-o.9S06 · - · - R"2-0.9724
··i·················:··················:······ . . . . . . . . . . . . . . . . .
··············:·················:··················:···· ............ · ............... . . . . 0.6 . . . . . . . . . . . . . . . a 0.4 ··:·················:·················:··················:··· . . . . . . . . . . . . . . . . . . . .
0.2 . . . . ............................................................ -................................. . : . : : : : : : : . . . .
0.5 1.5 2 lmba1lnce Desip Friction
3
Figure 3.3 ..........
3-12

10-13
............................... ·-................... . .............................. . ......................... :. ................. ; ................. ; ................ .
. . . .
················ ·················
·:· ................ -~ ................. : ................. : .................................. . . . . . ·:· ................. :- ................. : ..... ' ........... : ............. ' ... ~ ................ .
. . . . . . . . . . . . ... . . . . . . . . . . . . . . . . ... . . . . . . . . . . . . . . . . . . . . . . . . . . . . . . . . . . . . . . . . . . . . . . . . . . . . . .. . . . . . . . . . . . . ..
. • . . . . . . . . . • -:- •.••••••••••.•••• :- •..•••••••••.•••• :- ••••.•.•.•.•••••• i ••••••••••••••••• ~ •••.••••••••••.
........... ' ·:- ................. :· ................. ~ ................. ~ ................. ~ ................ .
. . . . . . . . . . . . -:- ................. ; .................. : ................. : ................. ~ ................ . . . ............. : .................. :. ................. ; ................. ; ................. ~ ................ . . . . . .
===:·l . . v=:==:===============::=============: ::: : Cyclels 1.663e+08, Hours= 4.256e+OS, Events= 124(::;::::::::::::::::: ~::::::::::::::::: . . . . . . .. : ................. ~ ................ . ..... . . . . . . . . . . ·: .................. :· ................. : ................. : ................. ~ ................ . . . . . . . . . . . . . . . . . : .................. : .................. i ................. ; ...... ' .......... ~ ................ . . . . . . . .
10-••...._~~~ ...... ~~~~~--~~~~--~~~~~--~~~~~--~~~~ ..... 0.1 0.5 1.5 2 2.5 3
Imbalance Design Fnccion ,,_,....,,
Figure 3.6
3-15
120+ Mia
IIO+Mia

w I -.,.
Scatter Plot of Imbalance Design Fraction Ind Windmill Time
. . . . 100~ · · · · · · · · · · .. · · · · ·:·· · · · · · · · · · ... · · · · :·· · .... · · · .. · · · .. ·: · · · · · · · · · .. · · · · .. ~- .. · · · .. · · ····· · · · ·: · · · · · · · · · · · .. · · · ..
0 o:
. . 80 .................... ·:· ................. '. .................. ~ ................. ~- ................. : .................•
i 0:
.! 60 ~ · · · · · · · · · · · · ·0 · ·:· · · · · · · · · · · · · · · · · · ~- · · · · · · · · · · · · · · · · ·:· · · · · · · · ·· · · ·· · · · · ·i· · · · · ·· · · ·· · · · · ... ; ................. .
I.
= 0 0 : : : : . : . . . . . . . . 0 0 0 :0 0 0 CD() p : :
~ O : 0 0: : :
40'" · · · · · · · · · · · · · · · · ). -~ · · · · · · · · · · ·O · ~ · · · · · · · · · · · · · · · · · · !. · · · · · · · · · · · · · · · · · .!. · · · · · · · · --~ · · · · · · · i ................. . O : O ! 0 : : : 0 0: : ; :
0 0 CII>: GO O: : : : :o : : . : o o· . . : :
20 - · · · · ·(i&"'B°o-G · · · · ·O · · · · · · ·O · ;. · · · ·· · · · · · · · · · · · .; · · · · · · · · · · · · · · · · · ~- · · · · · · ........... ; ................ ·-
n... m 6 d. 0 1 ~ ! -uo () . . . . O ooo · :0 : : :
O oo: . : : : (D) : 0 : : :
; I ; I ,
o.s 1 1.5 2 2.S 3 Imbalance Design Fnction
Figure 3.5

-----------~--~-----
4. Recommended Criteria
In this chapter the recommended criteria for engine windmilling imbalance load
are presented. These criteria apply to airplanes with high bypass ratio engines with fan
diameters greater than 60 inches. In the absence of evidence justifying an alternative
approach providing an equivalent level of safety this criteria should also be assumed to
apply equally to airplanes with smaller diameter engines. The ~uirements are intended
to ensure continued safe flight and landing following-a blade loss event This is
accomplished by defining windrni11ing conditions for evaluation of structure, systems
including operating engine(s), and flight crew perfonnance under the vibratory loads
resulting from engine windmj11ing with imbalance. The level of imbalance recommended
is an imbalance design fraction (lDF) of 1.0. An IDF of 1.0 is equal to the level of mass
imbalance that would result from engine tests required under section 33.94 of 14 CFR..
The wimimilling duration required for evaluation should account for the maximum
diversion profile appropriate to the airplane model, but not exceeding 180 minutes for any
given engine and airframe configuration. The fleet service data presented in Chapter 3
show that the combined probability of having an IDF of 1.0 along with a 180 minutes
diversion is less than 10., per airplane flight hour. In light of this, it is recommended that
this-condition should be evaluated using nominal and realistic flight conditions and
parameters.
A recommended methodology is presented for the structural evaluation that
consists of static strength, fatigue, and damage tolerance analyses. Additional evaluations
for other factors such as systems and flight crew perf onnance should also be considered.
These additional evaluations, while out of the scope of this task, should use criteria
recommended here for definition of the windmilling conditions.
The criteria presented pertain to sustained imbalance due to fan blade loss events.
The criteria do not specifically address situations where the engine does not shut down
4-1

F1pre 3. 7 Fan ltotor Blade and Support Loss Rate Trends
- • - • CIIIDPBO
.... ' " • , .
........ . .... . ....
I I
-----3Yr0..,..._-+---;.-----+-'-' ...... -----+--------+---------.,~'------1 PIO I ...... -·, - • • -3Yr0m
s..,.. ' - - - CIII. • •
........ .......... ...... J ........ .
' • l....,..._ ______ ...._ ______ .............. ____ ...... ____________________________ __
lHS 1"75 lNS lffl
Ymn
3-16

2. Windmilling Vibration Loads
Loads on the airplane components should be detennined by dynamic analysis.
The analysis should take into account unsteady aerodynamic characteristics and
all significant structural degrees of ~m including rigid body modes. The
vibration loads should be determined for the significant phases of the diversion
profiles described in l(a) and l(b). The significant phases are:
(a) an initial phase during which the pilot establishes a cruise condition,
(b) the cruise condition,
( c) the descent phase, and
( d) the approach to landing phase
The flight phases may be further subdivided to account for variation in
aerodynamic and other parameters.
The calculated loads parameters should include the accelerations-needed to define
the vibration environment for the systems and flight deck evaluations.
3. Static Strength Analysis
(a) The primary airframe structure should be shown capable of sustaining the
flight and windmilling vibration loads combinations defined in (i), (ii), and
(iii) below.
(i) The peak vibration loads for the flight phases described in (2)(a)
and 2(c) combined with appropriate lg flight loads. These loads
are to be considered limit loads, and a factor of safety of 1.375
shall be applied.
(ii) The peak vibration loads for the approach to landing phase
described in (2)(d) combined with appropriate lg flight loads and
incremental loads corresponding to a positive limit symmetric
4-3

immediately following the fan blade loss event Recommendations are also proposed for
the loss of rotor support condition discussed earlier in Chapter 3.
I. Windmilling Condition Definition
The airplane is assumed to be in level flight with typical payload and realistic fuel
loading. The speeds, altitudes, and flap configurations considered may be
established in accordance with airplane flight manual (AFM) procedures. Unless
it can be shown otherwise, the engine-fan shaft is assumed to be windmilling with
a rotating imbalance resulting from the loss of fan blade material. An IDF of 1.0
shall correspond to the mass imbalance that would result from failure of the most
critical turbine, compressor, or fan blade under the conditions specified for the·
blade containment and rotor imbalance tests in section 33.94 of 14 CPR.
Significant changes in structural stiffness and geometry within the engine that
would result from the specified blade failure conditions should be accounted for.
The following conditions should be evaluated using assumptions consistent with
the probability of occurrence (Reference Chapter 3):
(a) 1.0 IDF in conjunction with the maximum diversion time of the airplane,
but limited to a maximum of 180 minutes.
(b) 1.0 IDF in conjunction with a 60 minute diversion.
4-2

For multiple load path "fail-safe" structure, where it can be shown by observation,
analysis, and/or test that a load path failure, or partial failure in crack arrest
structure, will be detected by general visual inspection prior to the failure of the
remaining structure, either a fatigue analysis or damage tolerance analysis may be
performed to demonstrate structural capability. All other structure should be
shown to have capability using only the damage tolerance approach.
(a) Fatigue Analysis
If a fatigue analysis is used for substantiation of a multiple load path ''fail
safe" structure then the total fatigue.damage accrued during the well phase
and the windmillin1 phase should be considered. The analysis should be
conducted considering the following:
(i) For the well phase, the fatigue damage should be calculated using
an approved load spectrum (such as used in satisfying the
requirements of FAR(IAR) 25.571)) for the duration specified in
Table 4.1. Average material properties may be used.
(ii) For the windmilling phase, fatigue damage should be calculated for
the diversion profiles usin1 a mission that envelopes the AFM
recommended operation accounting for transient exposure to peak
vibrations as well as the more sustained exposures to vibrations
(ref. 2(a) through 2(d)). Average material properties may be used.
(iii) For each component the accumulated fatigue damage due to 4(a)(i)
and 4(a)(ii) multiplied by the appropriate factor (if any) specified
in Table 4.1 should be shown to be less than or equal to the fatigue
damage to failure.
4-5

balanced maneuvering load factor of 0. lSg. These loads are to be
considered limit loads, and a factor of safety of 1.375 shall be
applied.
(iii) The vibration loads for the cruise phase described in (2)(b)
combined with the appropriate lg flight loads and 7&1, of the flight
maneuver loads and. separately, 40'11 of the limit gust velocity
(vertical or lateral) as specified at Ve up to the maximum likely
operational speed following the event. These loads are to be
considered ultimate loads.
(b) In selecting material streng1h pioperties for the static strength
analysis, the requirements of section 25.613 apply·.
Note: The factor of safety (1.375) wu chosen using the criterion that bu been applied
as a special condition for the interaction of systems and structure. That criterion allows
the factor of safety to vary from 1.5 at a rate of oc:cum:nce of 10"' per hour to 1.25 at 10 ..
per hour. The database has been conservatively interpreted as justifying a rate of
occurrence of 10·1 per hour for the 1.0 IDF event resulting in the 1.375 factor of safety.
This conservatism is justified for the sustained imbalance condition because of the many
applications of the load u the resonant peak is traversed.
4. Assessment of Structural Durability
Requirements for fatigue and damage tolerance evaluations are summarized in
Table 4-1. Both Conditions l(a) and l(b) should be evaluated. The specific
conditions listed represent two different targets for structural durability based on
the overall probability of the event occurring. Condition l(a) is established at a
50'11 probability and condition l(b) is established at a 95'11 probability.

Table 4.1 • Fatigue and Damage Tolerance Criteria
for Windmilling Event
Fadpe"' Damap Tolenac:ei.' (averap material properties) (uerqe material properties)
Coad Desc Well Wind· Criteria Well Wind· Criteria Pbue ..... Pbue milUJII
Pbue' Plaae"'
la 1-IDF Damaae' Damqe' The tOCII MQF Addidoaal Posilive ISO due to due to lSO ciama,e' ·c1ue to grown for era M.S. wrt
Min. 1 DSO mimate mu' tbe well pbue l/2DSG powdlfora residual Mu' diversion aaddle lSOmiaufe streagtb
witbUl wiDdmil1 max' due to tbe IDP•l.O pbae 1 sl.O divenioa limitloa
with an specified iD IDP• 1.0 3(a) fortbe
final cnct length
lb 1-IDP Dlmqe' Damap' 2timatbe MQF' Addilional Posiliw 60 due to dueto60 tOCII damage' grown for era M.S.wrt
Mia. 1 DSG mimle cmeotbewell I DSG powtbdue residual divenioa phueaad toa60 strqtb witblD wiDdmill miDuCe due to tbe
IDP=l.O ptwe.zs1.o diversion limit IOlds with an specified in
lDP= l.0 3(a) fortbe final era
length .
Notes: .1 The analysis medlod that may be used is defined in section 4.0. 2 Load spectrum to be used for tbe analysis is tbe same load spectrum qualified for use in showing
compliance to FAR(JAR) 2S.571 augmented with windmilljng loads u appropriate. 3 WinclmiJlin1 pbae is to be demoastnaed following application of well phase spectrum loads. 4 The initial flaw for dlmage tolel'IDCO analysis of the windmilling phase need not be greater than
the flaw size det.ermined u the detectable flaw size plus growth under well phase spec:ttum loads for one inspeccioa period for rn•nd•ted inspections.
S MQF is tbe manufacturing quality flaw usociated with 9',9S probability of exisrence.(Reference -'Verification of Methods For Damage Tolerance Evaluation of Aira'aft Structures to PAA Requirements', Tom Swift PAA. 12dl Interuliooal Commitree on Aeronautical Fatigue. 2S May 1983, Figura 42. llld 43)
6 Maximum diversion time for Condition la is tbe maximum diversion time established for the airplane, not to exceed 180 minutes.
7. The allowable cycles to failure may be used in the damage calculation where DSG equals Design Service Goal.
4-7

(b) Damage Tolerance Analysis
Where a damage tolerance analysis is used for substantiation the airplane
should be shown to have adequate residual strength. The extent of damage
for residual strength should be established taking into account growth
from an initial flaw during the well phase followed by growth during the
windmilling phase. The analysis should be conducted considering the
following:
(i)- 'Ibe size of the initial flaw should be equivalent to a manufacturing
quality flaw associated with a 95~ probability of existence with
95'1 confidence (95,9SJ.
(ii) For the well phase, crack growth should be calculated starting from
the initial flaw defined in 4(b )(i) using an approved load spectrwn
(such as used in satisfying the requirements of PAR(IAR) 25.571))
for the duration specified in Table 4.1. Average material properties
may be used.
(iii) For the windmi11ing phase, crack growth should be calculated for
the diversion profile starting from the crack length calculated in
4(b)(ii) using a mission that envelopes the AFM recommended
opention 1CCOUDting for transient exposure to peak vibrations as
well u the more sustained exposures to vibrations (Ref. 2( a)
through 2(d)). Average material properties may be used.
(iv) The residual strength for the structure with damage equal to the
crack length calculated in 4(b)(iii) should be shown capable of
sustaining the combined loading conditions defined in 3(a) of this
section with a factor of safety of 1.0.
4-6

5. Objective of Analysis
The airplane response analysis for engine windmill imbalance is a structural
dynamic problem. The task is to develop acceptable analysis methodology for
conducting dynamic investigations of imbalance events. The task further requires that the
proposed methodology be validated. The objectives of the analysis methodology are to
obtain representative or conservative airplane response characteristics. The goal of the
windmilling analysis is to produce loads and accelerations suitable for the following
evaluations:
( 1) Structural
(2) Systems
(3) Flight deck and human factors
The analytical model should be valid to the highest windmiJling frequency
expected. The validation of the analytical model discussed in subsequent sections of this
report will address the following aspects:
( 1) Modeling details necessary to represent airframe structural dynamic characteristics
(2) Engine model detail for the windmilling engine
(3) Aerodynamic representation
The normal output of the windmilling analysis would be expected to yield loads
and accelerations for all parts of the primary structure. The evaluation of equipment and
human f~ may require additional analysis or test. For example, the analysis may
need to produce floor vibration levels, and the human factors evaluation may require a
test where the seat and the human subject is subjected to floor vibration.
5-1

5. Loss Of Centerline Analysis
The above recommendations pertain to sustained imbalance due to fan blade loss
and do not include loss of centerline support events except those that are designed
to occur as an intentional result of the fan blade loss event The following
approach is recommended to address the loss of centerline condition with no fan.
blade loss.
Once the fan blade loss windmilling loads are determined, the design should be
evaluated to determine if a loss of centerline event produces a more severe
dynamic condition to the airplane. If the dynamic loads are greater for the loss of
centerline event than those resulting from the fan blade loss imbalance in the
windmi1Jing range they should be evaluated as a design condition for the airplane
in a manner approved by the authorities.
To evaluate the loss of centerline condition, the low pressure (LP) rotor system
should be analyzed with each bearing removed, one at a time, with the imbalance
consistent with the airborne vibration monitor (A VM) advisory level.
The windmilling analysis should account for secondary damage occurring during
rundown from the maximum LP rotor speed (assumed centerline support loss
speed).
4-8

windmilling frequencies. More detailed finite element modeling of the airframe is also
acceptable.
Structural damping used in the windmilling analysis may be based on Ground
Vibration Test (GVT) measured damping.
Engine Structural Model
The engine structural model consists of the engine, strut, and nacelle. Engine and
nacelle models at the same level of detail as the models used for FAR §33.94 test
simulation are acceptable for windmilling analysis. Optionally, a simplified engine
model may be used in the windmilling analysis if shown to be valid. Engine models
typically include the following:
( 1) Structural mass distribution and stiffness of static components
(2) Each major rotor mass and rotor stiffness
(3) Each shaft support
( 4) Engine mounts and additional load paths
(5) Strut
The airplane model should use the modes and frequencies in the windmilling
range extracted from the engine model described above. The engine subjected to the
imbalance forces is recommended to be modeled in this level of detail.
Undamaged engines that are operating normally need only be modeled to
represent their sympathetic response to the airplane windmilling conditions.
6-2

6. Integrated Model
Airplane dynamic responses should be calculated with a complete integrated
airframe and engine analytical model. The airplane model should be to a similar level of
detail to that used for certification flutter and dynamic gust analyses, except that it must
also be capable of representing uymmetric responses. Toe dynamic model used for
windmi11ing analyses should be representative of the airplane ~o the highest windmilling
frequency expected. The integrated dynamic ~odel consists of the following
components:
(I) Structural Model (A) Airframe (B) Engine
(2) Control System Model
(3) Aerodynamic Model
(4) Forcing Function
(5) Gyroscopics
In the following sections of this chapter, the recommended level of model details
are presented. These model parameters have been selected using ground and flight test
based validation experience. In subsequent chapters, the test data is compared with
analysis results to demonstrate the validation. Most of the test data utilized for this ·
purpose are presently perfonned to satisfy various requirements of 14 CFR.
Airframe Structural Model
The structural model should include the mus, stiffness, and damping of the
complete airframe. A lumped mus and finite element beam representation is
recommended to model the airframe. This type of modeling represents each airframe
component, such u fuselage, empennage and wings, u distributed lumped masses rigidly
connected to weightless finite element beams that incorporate the stiffness properties of
the component. Appropriate detail should be included to ensure fidelity of the model at
6-1

7. Airframe Structural Model
An analytical model of the airframe is required to calc.'Ulate the response at any
point on the airframe due to the rotating imbalance of a windmilling engine that bas lost
some portion of its fan blades. The airframe manufacturers cummdy use a reduced
lumped mass finite element analytical model of the airframe for certification of
aeroelastic stability (flutter) and dynamic loads including gust and dynamic landing. A
typical model as shown in Figure 7 .1 consists of a relatively few lumped masses
connected by massless beams. As stated previously in Chapter 6, a full airplane model
capable of representing asymmetric responses is necessary for windmilling.
Windmilling, dynamic gust, and landing analyses are based on calculating the
dynamic response of the ahframe due to a force input The winctmimng analysis should
require calculating the response of the airframe at higher frequencies than are usually
required to obtain accurate results for the other analyses mentioned above. Flutter
analyses normally include frequencies exceeding the nominal engine windmilling
frequencies.
In order to verify that the lumped mass model of the airframe gives an accurate
representation of the response of the airframe in the windmi11ing range a comparison was
made between analysis and test data for representative commercial airplanes. Six
airframe manufacturers submitted data comparing analysis modal frequencies to
measured Ground Vibration Test (GV11 frequencies for eighteen different airplanes.
These airplanes included two, three, and four engine airplanes with wing, fuselage, and
tail mounted engines. A sample of the data submitted, as shown in Figure 7 .2, define the
airplane and the typical engine fan windmilling frequencies. Also included is a
description of each of the natural modes of the airplane along with their test frequency,
analysis frequency, percent difference, and test damping.
7-1

Control System Model
The automatic flight control system should be included in the analysis unless it
can be shown to have an insignificant effect on the airplane response due to engine
imbalance.
Aerodynamic Model
The use of uasteady tbree-dimcosional panel theory: methods for incompressible
or compressible flow, u app.oprime. is recomDJMdcd for modeling_ of the windmi11ing
event Interaction between aerodynamic surfaces and main surface aerodynamic loading
due to control surface deflection should be considered where significant. The level of
detail of the aerodynamic model should be supported by tests or previous experience with
applications to similar configurations. Main and control surface aerodynamic data are
commonly adjusted by weighting factors in the aeroelutic response solutions. The
weighting factor for steady flow (k=O) are usually obtained by comparing wind tunnel
test results with theoretical data.
Forcing Function and Gyroscopics
Engine gyroscopic forces and imbalance forcing function inputs should be
considered. Toe forcing function should be calibrated to the results of test perfonned
under Sec. 33.94 of 14 CFR.
6-3

IOI G> NODE LOCA110NS
Figure 7 .1 Typical Airframe Structural Model
7-3

A plot of the analysis frequencies vers\1$ the GVT frequencies is shown in Figure
7 .3 and a plot of the difference of analysis and GVT is shown in Figure 7 .4. Most of the
typical windmilling frequencies reported are within the range from 15 to 25 hertz.
Figure 7.3 and 7.4 indicate that the analytical model is as accurate for the windmilling
range u for lower frequencies. The histogram in Figure 7.5 shows that for all the
reported data the vast majority of differences are within ± 1 OC., which is considered
adequate for windmilling analysis.
Structural damping used 4.1 the wJncfmilling analylia may bo bwd on Ground
Vibration Test (GVT) measured damping.
A lumped mass beam model is currently accepted for certificadon analysis
including: dynamic gust. dynamic landing. and flutter. The measured GVT data has . -· .
validated the analytical model through the windmi11ing range. Therefore, a Jumped mass
beam model of the airframe is acceptable for frequency response analyses due to engine
fan blade loss windmi11ing. Additional detail may be needed to insure adequate fidelity
for windmilling frequencies. Fmite element models should be used u necessary.
7-2

~~-----~-------------------
ANALYSIS VS GVT FREQUENCY
90.000
--
80.000 • 70.000
• i 80.000
• • > I so.ooo I IE ...
• r: .-~
I 40.ooo >
i 30.000
20.000
10.000
0.000 0.000 10.000 20.000 30.000 40.000 50.000 80.000 70.000 80.000 I0.000
GVT FREQUENCY (HZ) Flgcn7.3
1-S

Modal Frequencies Comparison
(WINDMILLING FREQUENCY: TYPICAL::20 HZ.)
DUCRIP110N GYT ANALYSIS DIFl'IRINCB TEST
FAIQUENCY FAEGUINCY DAIIPINCI (HZ) (HZ) ("") ('krltlcll)
SYMMETRIC:
RIGID BODY PfTCH 0.27 0.271 3.33
RIGID BODY FORE & AFT 0.78 C>.121 5.71
RIGID BODY PLUNGE 1.1 1.54 -3.71 1.48%
WING 1 ST BENDING 1.71 1.751 ·1.73 0.45%
WING ENGINE YAW 2.tl1 2.087 1.30 1.72%
FUSE BEND I WetG 1":TCH 3.22 3.204 -0.50 0.82%
WING INNER PANS. TORSION 4..1 4.117 0.41 0.81%
AFT ENGINE PfTCH 4.1 4.771 -o.52 0.30%
HORIZ STAB 1ST BENDING 5.31 5.111 3.21 o.sn. WING 2ND BENDING 5.5 5.225 -1.00
WING 1ST FORE & AFT t.01 1.0I 1.33 O.lfft
WING ENGINE ROLL 1.41 UOI 0.41 ·o.78% WING 3RD BENDING U1- 8.411 .a.II
MAIN LANDING GEAR YAW 9.12 t.111 -0.02 2JM%
WING 2NO TORSION 11.87 11.117 -1.71 2.22%
WING OUTER PANEL TORSION 12.5 12.417 -0.Gl 1.7ftt
HOAIZ STAB 1ST FORE I AFT 14.4 14.432 0.22 1.41%
VERT STAB 1ST FORE I AFT 15.75 15.783 O.CII
HORIZ STAB 2ND BINDING 17.11 17.311 1.11
HORIZ STAB 1ST TORSION 25.18 21.211 2.31
ANTl-8YIIIIETAl
RIGID BODY YAW 0.43 0.4CII -5.12
RIGID BODY LATEAAL 0.11 0.718 ·13.IO
RIGID BODY ROU. 1.29 1.3CII 1.24 1.04%
WING 1ST BENDING 2.13 2.121 -0.05 0.81%
WING ENGINE YAW 2.35 2.311 1.41 1.27"lft
FUSEIWINGIVS CPLD 2.78 2.• ·2..11 0.43%
VERT STAB 1ST BENDING 3.15 3.117 ·7.18 0.57%
. WING ENGINE PITCH 4.15 4.005 -3.41 0.41%
HOAIZ STAB 1ST 8ENDING 4.5 4.235 ·5.11 0.82%
FWD FUSE BENDIWG F & A 4.15 4.97 0.40 0.57%
AFT ENGINE Ra.I. 5.57 5.508 ·1.115 1.32%
WING ENGM ROLL 8.37 1.411 1.74 0.81%
WING 2NO BENDING 7.11 e.a ·7.04 1.48%
HOAIZ STAB YAW 7.38 7.271 ·1.10 0.99%
MAit WONG GEAR CPI.D 8.32 , .. 4.11 2.78%
VERT STAB 2ND BENDING 8.78 9.267 5.71 1.38%
MAIN LANDING GEAR YAW 9.14 10.085 1.21
WING OUTER PANEL TOASION 11.81 11.84 1.54
HOAIZ STAB 2ND BENDING 15.41 11.881 8.25
UPPER WINGLET 1ST BENDING 21.51 22.122 1.17
HOAIZ STAB 181' TORSION 25.18 26.1154 1.81
WING 3AD BENDING
Figure7.2
7-4

. - .....
·30 .l0% ·20. )0%
DISTRIBUTION DIEFERENCE ANALYSIS VS GVT
. - ---~·- \
- \ , ~- - \
I
-- --...
~ ~ . -- ~
/ __ ~
J _:- \ --/' '-~-...... - .... --·10. )0% o.c !)'lo 10. - 20.
----
Figure 7.S
7-7
.... . - - . - - .... - 30., ft 40.1 ~

ANALYSIS VS GVT FREQUENCY
40.0%,-----r-----,-----,-----r----.,-----r----------,..---~
• ~-O"lft+----t-----+-----t-----t-----+----+----+-----1~---1
30.0"lft
i > i 25.0"lft -Ill i r~D% ! 15.0%
i 10.0"lft
5.0%
0.0% 0.000
•
• •• ' • • • •
•
• 10.000 20.000 30.000 40.000 50.000 60.000 70.000 60.000 80.000
GVT FREQUENCY (HZ) Flgln7.4
7-6

Features modeled specifically for blade loss windmilling analysis typically include fan
imbalance, component failure and wear, rubs, (blade to casing, and intershaft), and
resulting stiffness changes. Manufacturers whose engines fail the rotor support structure
by_ design during the blade loss event should also evaluate the effect of the loss of support
on engine structural response during windmilling.
Features which should be modeled specifica!Jy for loss of centerline windmilling events •
include the effects of gravity, inlet steady air loads, rotor to stator structure friction and
gaps, and rotor eccentricity. Secondary damage, such as additional mass loss, overload of
other bearings, permanent shaft deformation, or other structural changes affecting the.
system dynamics, occurring during rundown from maximum LP rotor speed and
subsequent windmilling should be accounted for.
The definition of the model should be mutually agreed upon between the airframe
and engine manufacturers based on test and experience. The model is validated based on
dedicated vibration tests and results of FAR 33.94 fan blade loss test. In cases where
compliance to FAR 33.94 is granted by similarity instead of test, the windmill model .
should be correlated to prior experience.
Validation of the engine model static structure including the strut is achieved by a
combination of engine and component tests which include structural tests on major load
path com~nents. The adequacy of the engine model to predict rotor critical speeds and
forced response behavior is verified by measuring engine vibratory response when
imbalances arc added to the fan, LPC (or IPC), HPC, HPT, (IPl' if for a three shaft
engine) and LPT rotors . Vibration data are routinely monitored on a number of engines
during the engine development cycle, thereby providing a solid basis for model
correlation.
8-2
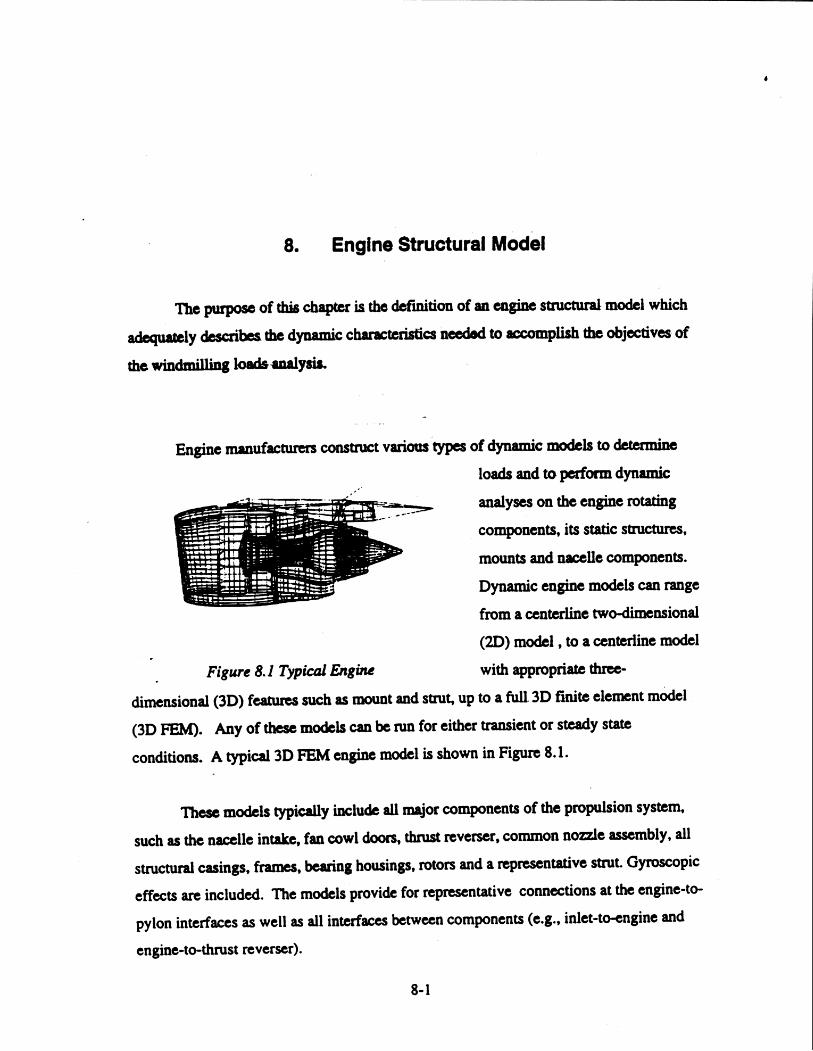
8. Engine Structural Model
The purpose of this chapter is the def'mition of an engine structural model which
adequarely describes the dynamic characteri.sties needed to accomplish the objectives of
the windmilling load&ualysia.
Engine manufacturers construct various types of dynamic models to determine
loads and to pelform dynamic
.. ··3:_::::»-
Figure 8.1 Typical EngiM
analyses on the engine rotating
components, its static sttuctures,
mounts and nacelle components.
Dynamic engine models can range
from a centerline two-dimensional
(20) model , to a centerline model
with appropriate three-
dimensional (3D) features such as mount and strut, up to a full JD fmite element model
(30 FEM). Any of these models can be run for either transient or steady state
conditions. A typical 30 FEM engine model is shown in Figure 8.1.
These models typically include all major components of the propulsion system.
such as the nacelle intake, fan cowl doors, thrust reverser, common nozzle assembly, all
structural casings, frames, bearing housings, rotors and a representative struL Gyroscopic
effects are included. The models provide for representative connections at the engine-to
pylon interfaces as well as all interfaces between components (e.g., inlet-to-engine and
engine-to-thrust reverser).
8-1

9. Aerodynamic Model
The airframe manufacturers currently use an aerodynamic model of their
airframes for calculation of dynamic gust lo~ and flutter analyses that generally covers
all of the significant frequencies required for windmilling analyses.
Flight test results have been collected by the aircraft manufacturers in order to
provide a basis for validation of aerodynamic forces which will be used for dynamic
analysis in windmilling conditions. Available flight test data for control surface sweep
inputs were reviewed indicating good correlation between calculated and measured
response. Figures 9 .1 through 9 .3 arc representative results showing the response of the
fuselage due to aileron, elevator, and rudder sweep inputs respectively. All the
comparisons of analysis predictions versus flight test data showed good correlation up to
approximately 8Hz. Reliable flight test data above 8Hz is difficult to obtain with control
surface sweeps since the actuators roll off at these frequencies giving a low signal versus
noise ratio.
The airframe manufacturers have evaluated the sensitivity of the windmilJing
analysis to the accuracy of the unsteady aerodynamic model. Responses at several
different locations on the airplane were calculated for an engine fan imbalance at
frequencies from zero through the maximum expected windmilling frequency. The
~lane configurations analyzed consisted of a wing mounted twin, a wing mounted four
engine airplane, and a fuselage mounted twin. The frequency response analyses were
performed for the following aerodynamic variations:
( 1) _ Nominal aerodynamics.
(2) ±10., applied to all unsteady aerodynamic forces.
(3) ±20% applied to nacelle unsteady aerodynamic forces.
9-1

While the validation aspects listed above are important for representation of the
windmillinl loads, the fan blade loss conelation is also pertinent to the windmill event
because the event involves predictinl the response of the entire propulsion system under
a high level imbalance load. Correlation of the model against the FAR 33.94 fan blade
loss engine test is a demonstration that the model accurately predicts initial blade release
evenl loads, any nmdowa. resonant iespoaN behavior, frequencies, potential structural
failure sequences, and 1eneral ~ne -,vements ~ displacements. To enable this
correlation to be paformed. ~IL~ the b~ 1• engine test is used, for
example high speed c• llld video cameras,. accelerometers, strain pups, continuity
wires, and shaft speed~
8-3

wing and stabilizer vanes are sometimes used to excite the acroclastic modes of the
airplane at frequencies up to 30 Hz. These tests have shown that analytically predicted
stability characteristics are acceptable for all significant structural modes.
Flight flutter tests demonstrate that currently employed aerodynamic modeling is
reliable for frequencies of windmilling. These methods are accepted for certification
flutter analyses that are more sensitive to aerodynamic variations than airplane response
due to windmilling. imbala~. Aerodynamic forces are well behaved and are continuous
functions in the tligb~ regime involved in windmilling diversions (subsonic and low
transonic).
9-3

Figure 9.4 is a plot of the acceleration response of the cockpit versus frequency
for one of the airplanes analyzed with the aerodynamic variations listed above. The smaJI
magnitude of differences shown in the Figure is representative of aH of the results
reviewed. This magnitude of difference indicates that the engine imbalance response
analyses are not sensitive to reasonable variation in aerodynamics.
Analyses were also performed with no aerodynamics and the results indicated in
general a significant effect on the response of the airplane. The analysis with no
aerodynamics was generally conservative at ff!Ost frequencies, but not always.
Validation of Aerodynamic Model
Available flight test data covers frequencies up to 8Hz. In this range of .
frequencies, flight test and analysis shows good agreement Flight flutter tests
demonstrate that currently employed aerodynamic modeling is reliable for frequencies
within the windmilling range. These methods are accepted for flutter analysis which is
more sensitive to aerodynamic variation than response to windmi11ing imbalance.
Generalized aerodynamic forces for all modes up through the windmilling range
behave smoothly and do not exhibit large variations versus reduced frequencies in the
flight regime (subsonic and low transonic) involved in windmilling diversions~ Based on
the. above observations, it is concluded that aerodynamic modeling currently used in
certification flutter analyses is adequate for windmilling analysis.
Generally, airplane response data from flight test shows good correlation
compared to analysis up to approximately 8 Hz. Correlated analysis to test data generally
are not available above 8 Hz. Airplane response data are usually obtained by control
surface sweep inputs. These data are normally limited to approximately 8 Hz because of
the frequency response characteristics of the control surface actuators, which are
incapable of exciting the airplane at higher frequencies. During flight flutter testing,
9-2

I i
i i
Flight Test vs Analysis Fuselage Response due to Elevator Sweeps
Forward Fuselage
Test Anlty1i1
tu...-Test
2 3 5 6 7 8 Hz
Aft Fu11l1gt ..
Anlly1i1 Test
Hz
Figure9.2
9-S

I i
Flight Test vs Analysis Fuselage Response due to Aileron Sweeps
Analysis --•
Analysis
Test
Forward Fu11laqe
'-A I ,.. d
Anilysit . Aft Fus1la91
Test
I 2 3 I 4 I • ~ al 6 7
Figure 9.1 9-4
Hz
Hz

FREQUENCY RESPONSE DUE TO ENGINE BLADE LOSS
-+-BASELINE -+10%NPAERO
"-"--......f,.,--.--1---+---......j,..----I -.-.1o,r. NP AERO ·
-M-+20% NAC AERO
-·20'Wt NAC AERO
i
0 5 10 15 20 25
FREQUINCY (HZ)
Figure 9.4
9-7

0 1
AMPUTIJDE
0 1
0 1
Flight Test vs Analysis Fuselage Response due to Rudder Sweeps
CASE1
=-~==, 2 3 4 5 9 7 a 9 10 11
FREQUENCY (Hz
CASE2
Flghl T• CordlDn ~LoMIModll
2 3 4 5 6 7 6 9 10 11 FREQUENCY (Hz)
CASE3
Fight Teet Conlttlon ==t Dynemlc LoMI Modll
,'\ . ' I ' ,' \ ' \ I • ' . J I
I ' I I
/ I I
12 13 14
r, ' \ ..
I ' ' . I ' : \ . \
12 13 14
·" ' \ l \ . ' I • . \ ,' \
' '
2 3 4 5 6 7 8 9 10 11 12 13 14 FREQUENCY (Hz)
Figure 9.3
9-6

to completely identify all of the aircraft modes necessary for windmilling analysis,
multiple shaker locations are needed. including locations on the engine.
The dynamic behavior of the whole airplane in the structural frequency range
associated with windmilling is nonnally validated by the flight flutter tests performed
under 25.629 14 CFR. Some typical results are presented in Chapter 9.
10-2

1 O. Validation of Integrated Model
The model parameters recommended in Chapter 6 are based on analysis methods
that are well understood and represent present industry practice for demonstrating
compliance with various sections of 14 CFR. The analysis techniques have a long history
of ground and flight test based validation.
The airframe model is validated by ground vibration tests that typically consist of
a complete airframe and engine configuration-subjected to vibratory forces imparted by
electro-dynamic shakers. Although the forces applied are small compared to windmilling
forces, these tests yield reliable dynamic characteristics (structural modes) of the
airframe engine combination. Structural damping values obtained in these tests are
conservative for application to windmill analysis. Application of higher values of
damping appropriate for the larger amplitudes on the windmill analysis, need to be
justified.
These characteristics are valid within the linear range of structural material
properties. The windmilling forces, though greater than test shaker forces, are far less
than forces required to induce nonlinear behavior of the structural material; i.e. yielding.
Thus, a structural dynamic model that is validated by ground vibration test is considered
appropriate for the windmilling analysis.
However, the ground vibration test of the aircraft does not necessarily provide
sufficient information to assure that the transfer of the windmilling imbalance loads from
engine is correctly accounted for as described in Chapter 8. The load transfer
characteristics of the engine to airframe interface via the strut should be validated by test
and analysis correlation. In particular, the effect of the point of application of the load on
the dynamic characteristics of the integrated model needs to be understood. To this end,
the modes and frequencies of several airplanes have been determined by tests where the
point of application of the loads is changed; e.g., at the wing, at the fuselage, tail surfaces,
and at the engine. The results are presented in Tables 10.1 to 10.3 . The results show that
10-1

Table 10.2 avr Multiple Shaker Configurations
Test Frequencies and Modeshapes
,Mode J&scrigggo Rigid Body Yaw Rigid Body Lat Trans w/Roll Rigid Body F/ A Trans w/Pitch Rigid Body Roll Rigid Body Pitch w/Roll Rigid Body Vert Trans w/Roll Sym 1st Wing Vert Bend Antisym 1st Wing Vert Bend SymNacSB Antisym Nae SB Antisym Aft Body Tor/W'mg VB Sym Wing VB/Nae VB/Body VB Antisym Wing VB/H Stab Opp Phase/Body Tor/Nae VB Sym Wing VB/Nae VB/Body VB Antisym Wmg VB/Body Tor/Nae VB . Antisym H Stab Roll Sym Wing VB/Stab VB Opp Phase Antisym Wing VB/Stab VB in Phase/Fm B Sym Wing VB/Antisym Stab VB/Fin B Sym Wing VB/Stab VB Opp Phase/Fin LB/NLG Lat Sym Wing VB/F'm LB Sym Wing VB/Fm LB(Fm &. Stab Phase Change) Antisym Wing VB/Stab VB Opp ~m LB/NLG Lat/Body LB Sym Stab VB/Antisym Wmg CW Sym Stab VB/Sym W'mg VB NLg Lat/Antisym W'mg VB/Antisym Stab CW SymWingCW Sym.WingCW Antisym Wing VB/Nonsym H Stab/Fm LB Sym Wing VB/Stab VB/Nae Tor RH Dominate/Fm CW Antisym H Stab CW/Fin CW LHNacTor Antisym Wing VB/Stab CW/NLG FAIMLO FA Antisym Wing/Stab CW/Fm &. Body Lat Antisym Wmg/Stab CW/MLG FA/Nae Tor/Body Lat Nonsym W'mg VB/Stab VBIMLG FA/F'm CW Sym Wing VB/MLG FA Sym Wing VB/MLO FAINLO FA/F'm CW Antisym Wing CW/MLG FA/Sym H Stab VB/Body Tor Antisym Wing CW/H Stab CW Opp Phase.lF'm LB/Body LB
10-4
Run 2 R1111~ Ruoti 0.389 0.379 0.379 0.451 0.452 0.453 0.548 0.546 0.552 0.713 0.712 0.717 0.783 0.779 0.788 0.970 0.968 0.975 1.620 1.622 1.620 2.008 2.010 2.009 2.479 2.370 2.224 2.666 2.623 2.613 2.981 2.979 2.985 3.00.S 3.042 3.028 3.319 3.316 3.316 3.404 3.405 3.406 3.661 3.642 3.705 3.794 3.817 3.862 4.089 4.090 4.127 4.269 4.263 4.296 4.343 4.340 4.376 4.528 4.436 4.446
4.531 4.550 4.578 4.580 4.964 4.921 4.921 5.159 5.129 5.126 S.182 5.165 5.205 5.557 5.586 5.594 5.621 5.616 5.631 5.723 5.710 5.739 5.939 5.997 6.011 6.333 6.276 6.123 6.422 6.406 6.638 6.894 6.740 6.694 7.263 7.113 7.189 7.388 7.362 7.696 7.795 7.596 8.113 8.244 8.243 8.250 8.481 8.483 8.453 8.683 8.902 8.917 8.945

1 2 3 4 5 6
Table 10.1 GVT Multiple Shaker Configurations
Shaker Location CPirectionl
Both wing tips vert, LH stab vert, fin lateral Both wing tips vert, LH stab vert, fin lateral LH wing vert, LH stab vert, both nacs lat LH wing vert, LH stab vert, both nacs lat Rudder, elevator, aileron Left and right nae vertical and lateral
10-3
Freg. Ranee CHzl
O to.6.25 Oto 25 Oto 6.25 Oto25 Oto25 Oto25

Table 10.3 Gvr Multiple Shaker Positions Analysis and Test Comparison
Anal. Test Freq. Mode Freq. Damping Description Run No. (Hz) No. (Hz) g ---1.65 1.62 0.007 Symmetric. 1st Wmg Bendiq
2.04 2 2.01 0.006 Antisymmetric, 1st Wmg Bendiq 1
2.45 3 2.32 0.041 Symmetric. Nse11e Latenl 3
2.60 4 2.65 0.022 Antilymmeeric, N8Celle Lani 1
2.90 s 2.98 0.011 Antisymmecric, t• Body~ JlendincJAft body 1 Torsion/2nd W'mg Beadiqllst W'm1 Clordwise 1
3.02 6 3.02 0.108 Symmetrici. lst Body Vertical BendinglNICelle
Verticalllnd W'm1 Bendias 3.33 7 3.31 0.013 Antisymmm:ic. Nacelle VncaJJMBody 1
Toniont2• Wmg Bendina 3.34 8 3.40 0.018 Symmeeric, NICelle Vertical/2nd W'm1 Bending(t• 1
Body Vertical Boadin1
9 3.63 0.034 Antisymmeaic:, Main GaN-PIBform Fore-Aft 1
3.84 10 3.78 0.024 Antisymmetric, Aft Body Tcnioallst Stabilizer 1 Bending
4.36 11 4.08 0.028 Symmecric, Main Gear+Plalform Labnl
4.33 12 4.26 0.023 Antisymmetric, 1st Fin Bendingflnd W'mg Bending
(Wing and Stab Tips in l'hlse)
4.44 13 4.33 0.022 Alllisymmecric. lit Fin Bendiql2nd W'm1 Bending (Wing aad Stab Tips Out of Phase)
14 4.45 0.030 Antisymmecric, Nose Oear+Plalform Lateral 6
S.04. lS 4.Sl 0.028 Symmelric, 3rd W'mg Bending 3
16 4.98 0.048 Antisymmecric, Wing Chordwisellst Body Labn1 Bending/Nose Gear Labn1
17 S.lS 0.029 Antisymmetric. Main gear Lateral/Wing Chordwise
S.10 18 S.18 0.020 Symmetric. 1st Stab. Beading/1st Fin Cbordwise 2
S.27 19 S.27 0.°'4 Antisymmetric, Wing Chordwile s S.53 20 S.56 0.017 Antisymmetric, 3rd Wins Bending/Stabilizer 2
Cbordwile/Nose Gear Labn1
S.51 21 5.72 0.025 Symmetric, Wing Chordwiselfin Chordwise 2
6.92 22 6.01 0.038 Right Nacelle Torsion 6
6.18 23 6.41 0.046 Antisymmetric:, Stabilizer ChordwisdBody 4
Ovalizing
10-6

Table 10.2 (continued) AIRPLANE GVT MODESHAPES AND FREQUENCIES (HZ)
PRELIMINARY TEST FREQUENCIES
Mode l&~dgti20 BJ&o 2 B.uo~ Run 6 Nonsym Wing VB/Antisym W'mg CW/Stab CW Opp PbaselFm LB 9.134 9.121 9.171 Antisym Wing VB/Sym H Stab VB Opp Pbue/F'm CW/Body VB 9.229 9.371 Antisym Wing VB/Stab CW/Body Tor 9.Sll 9.501 9.536 Antisym W'mg VB/H Stab VB/Fin LB/Body Tor 10.250 Antisym W'mg VB/H Stab VB/Fm LB/Body Tor 10.269 10.190 Sym Wing VB/H Stab VB in/Body VB 10.325 10.322 10.369 Sym Wing Tor+VB/H Stab VB Opp/Body VB - 10.773 10.776 Sym Wing VB/H Stab VB Opp/Body VB 10.840 Antisym W'mg CW/H Stab CW in Pbase/Pin LB/Body LB 10.919 Antisym Wing Tor/H Stab VB/Fin Rudder LB/MLG L 11.282 11.294 11.195 Antisym Wing VB/H Stab VB/Fin LB 11.348 11.348 Antisym Wing VB/H Stab VB/Fm LB Opp Phase 11.445 Sym Wing VB/Nonsym H Stab VB/Pin Rudder LB 11.874 Antisym W'mg Tor/H Stab VB/Fm Rudder LB/F Body L 12.063 12.0SS 12.077 Antisym Wing Tor/H Stab VB/Pin Rudder LB 12.081 H Stab Elev/Fin Rudder 2nd VB 12.598 Sym Wing VB/Nonsym H Stab VB 12.671 12.611 Sym Wing VB/Nonsym H Stab VB/Rud&F'm LB 12.730 12.801 Sym Wing Tor/Asym H Stab&Elev VB & Rot/Rud&F'm LB 13.341 12.993 Sym Wing Tor/Antisym H Stab VB/Rud&Fin LB 13.376 13.694 13.526 Antisym Wing Tor/H Stab VBIF'm Rudder LB 14.027 LH Asym Elev Rot 14.215 14.477 Sym Wing Tor/Asym H StaM:Elev VB & Rot/Rud&Pin LB 14.667 Antisym Wing VB/LH Stab VB/Elev RotJRad&Fin LB 14.638 Antisym Wing VB/Fin Rudder LBIL H Stab TorJR H Stab VB 14.725 Sy~ Wing Tor+VB/H Stab VB Opp/Body VB 14.870 Asym Wing VB RH Dominate/Sym H Stabcl:Elev VB/Rudder LB 15.0S4 Sym Wing CWINK Tor/Rudder Opp P"m LB 15.343 Asym Wing VB -90LH to RH 15.955 15.967 15.715 Sym Wing Tip VB 16.033 Antisym Wing Tip VB 16.044 16.492 16.283 Antisym W'mg VB/H Stab Tor/Rudder LB 16.539 16.563 16.593 Antisym W'uig Tip VB/F'm&Rudder LB/Rud-Tab Rot/H Stab in Pbue w/Wing 16.613 LHElevTor 18.156 Antisym Wing Tor/H Stab VB/Rudder LB 18.882 18.779 18.950 Antisym Wing Tip VB/F'm&Rudder LB/Rud-Tab Rot/H Stab Opp Phase w/Wing 19.075 Antisym Wing Tip VB/N.c LB/Rudder TorlH Stab Opp Phase w/Wing 19.601 Sym Wing Tip Tor 19.931 Sym Wing Tip Tor/H Stab Tip VB/Elev Tor 20.030 20.014 Antisym Wing Tip VB/H Stab VB/Rudder Bending 20.314 H Stab Tip VB/Elev Tor 20.647 20.538 Fin Tip LB/Rudder Tor/Rud-Tab Rot 22.861 20.953 Asym Wing Tip Tor CWINK Diag @ 45/Rudder Tor 21.194 Antisym Wing Tip VB/Rudder Tor/Rud-Tab Rot 24.121
10-5

11. CONCLUSIONS AND RECOMMENDATIONS
This report is submitted to complete the task published in the Federal Register
(Vol. 61, Number 129) on July 3, 1996 and assigned to the Aviation Rulemaking
Advisory Committee (ARAC) entitled "Engine Windmilling Imbalance Loads." This
report details the work perf onned in establishing an acceptable criteria and methodology
for determining the dynamic airplane loads and accelerations resulting from an
imbalanced windmilling engine. It addresses fan blade failure events as well as other
likely causes of significant engine vibntory loads such as loss of centerline support.
The service history data of high by-pass ratio engines under windmilling
imbalance condition was reviewed. The review concluded that current airplanes have
demonstrated adequate capability to withstand loss of fan blade and loss of centerline
support. However, this may not always be the case, especially if new airplane and engine
designs are significantly different from past conventional configurations. An examination
of the existing criteria did not identify any specific requirements that would continue to
guarantee the positive outcome experienced in the known events. Therefore, the working
gr~up developed recommended criteria to be used in assuring safety of flight in all future
airplanes in the event of windmilling under engine imbalance. These criteria include the
windmilling condition definition which should be used in evaluating structure, systems
including operating engine(s), and flight crew performance. Specific criteria for
evaluating structure have been developed.
The criteria recommended in this report are applicable to high bypass ratio
engines with fan diameters greater than 60 inches. In the absence of evidence justifying
an alternative approach providing an equivalent level of safety, these criteria should also
be assumed to apply equally to airplanes with smaller diameter engines.
11-1

Table 10.3 (continued)
GVT Multiple Shaker Positions Analysis and Test Comparison
Anal. Test Freq. Mode Freq. Dampin1 Description Run No. (Hz) No. (Hz) I ·----
24 6.64 0.023 F'm Chordwise 6 6.94· 25 6.69 0.038 Left Nacelle Torsion 6 6.33 26 7.36 0.040 Antisymmetric. Body Ovalizing(Body RoWStab. 4
ChordwiwNose Gear Lateral
27 7.69 0.031 Antisymmetric, 3rd Win1 Bending/N1eelle 2 VerticaJ/Body Ovalizing/Main Gear Vertical
1.85 28 1.85 0.043 Symmeeric, Nose Gear VerticaUMain Gear 6 Pcn-AftlPiD Cbardwise/Stlbilizer lit Bending/N1eelle Vertical/Body 1st Vertical
Bending/Wins 3rd Bending
29 8.24 0.023 Symmetric, 3rd Wins Bending/Main Gear Fore-aft 2
30 8.68 0.023 Antisymmetric, Fore Body Ovalizin1 out of Phase 2
with Aft Body Ovalizin,,Wing 2nd Chordwise
8.80 31 8.90 0.022 Antisymmetric, Fore Body Ovalizing in Phase with 2
Aft Body ovalizing/Body Roll/Main Gear Vertical/
F'm 1 • Bending/Stabilizer 1 • Bending/Stabilizer 1 •
Chordwise
32 9.13 0.025 Antisymmetric, Aft Body Ovalizing in Phase with 2
1 • Bending/Wing 2• Cbordwise out of Phase with
Stabilizer 1 • Chordwise/Stabilizer 1 • Bending/Wing
3• Beodina,Main Gear Vertical
8.92 33 9.23 0.006 Symmetric, Body 2nd Vertical Bending/Fin 2
Chordwise/Stabili7.er 1st BendinglN1eelle Vertical
Bending
9.81 34 . 9.51 0.035 Antisymmetric, Wing 3rd Bending/Fore Body 2
9.85 Ovalizing in Phase with Aft Body Ovalizing/Wing 2
1 • Cbordwise out of Phase with Stabili7.er
Chordwise/R.udder Rotation
9.33 35 10.19 0.025 Symmetric, Wing 1st Torsion out of Phase NICelle 6
Vertical Bending/Wing 3rd Bending
36 10.27 0.027 Antisymmetric, Aft Body Ovalizing out of Phase 2
with Fin lst Bending/Stabilizer lst Bending/Wing
3• Bending/Stabilizer Chordwise
10-7
The working group reviewed the traditional ground vibration tests, flight flutter
tests, and tests perfonned under Sec. 33.94 of 14 CFR and concluded that no further
demonstrative ground or flight test programs would be needed in order to achieve the
objective of establishing confidence in the proposed methodology. However, it is
recommended that the GVT conducted to validate the suuctural dynamic model should
include multiple shaker locations, including locations on the engine.
The working group recommends that a hannonized FAR Part 2S Advisory
Circular and an ACJ to JAR 25 be developed based on the technical information
contained in this report.
11-3

For the blade loss event, design evaluation criteria for future airplanes have been
developed and presented in Chapter 4. These establish the maximum level of engine
imbalance and associated diversion times to be used for analytical determination of the
airplane loads and accelerations. The maximum level of engine imbalance for blade loss
is recommended to be 1.0 imbalance design fraction, which is the mass imbalance
resulting from the FAR 33.94 blade containrneut and rotor imbalance test. The two
recommended diversion times are 60 minutes and the maximum diversion time up to 180
minutes. In addition, an approach for evaluating the loss of centerline support condition
has been recommended in Chapter 4.
Service experience indicates that engine rundowns occur at all levels of blade
fraction. Engines which have experienced a full blade loss or more have always rundown
to idle or below within a few seconds after blade release. All were shut down by the
flight crew within a few seconds after rundown. Some events between 0.25 and less than
0.5 blade fraction may run on indefinitely unless the crew takes action to shut down the
engine. These events cause higher frequency vibration than windmilling events but are
concluded not to be a threat to the airplane structure. However, they have caused crew
confusion as to which engine should be shut down. Consideration should be given to
ensure that on future airplane designs the crew members are able to make the decision to
shut down the appropriate engine in a timely manner.
Recommendations are included addressing the level of detail required for engine
and airframe modelling to adequately describe the dynamic characteristics needed to
provide valid loads and accelerations. Airplane dynamic responses should be calculated
with a complete integrated airframe and engine analytical model. The airplane model
should be comparable to those used for certification flutter and dynamic gust analyses.
The engine and nacelle model would normally be to the same level of detail as the model
used for FAR 33.94 test simulation. Optionally a simplified engine model may be used
in the windmilling analysis if shown to be valid for the airplane/engine configuration and
the frequencies of interest
11-2

cc:
Mr. Joseph Hawkins Department of Transportation Federal Aviation Administration - ARM- I 800 Independence Avenue S.W. Washington, D.C. 20591
Mr. Stewart Miller Department of Transportation Federal Aviation Administration - ANM-110 1601 Lind Avenue S.W. Renton, WA 98055
Mr. Vic Card UK Civil Aviation Authority Aviation House Gatwick Airport RH6 OYR England
Mr. Thaddee Sulocki Joint Aviation Authorities Saturnusstraat 10 2130 KA Hoofddorp The Netherlands
Mr. Craig Bolt Pratt & Whitney 400 Main Street Mail Stop 162-24 East Hartford, CT 06108
Ms. Jacquelin Smith Department of Transportation Federal Aviation Administration - ARM-209 800 Independence Avenue S.W. Washington, D.C. 20591

FAA Action – Not Available