Embed Size (px)
Citation preview

1Airbus and The Boeing Company
Hank ReedAviation Safety
The Boeing Company
Hank ReedAviation Safety
The Boeing Company
Aviation Safety Challenges and Opportunities for COSCAP Regional
Safety Teams
Aviation Safety Challenges and Opportunities for COSCAP Regional
Safety Teams
Gerard GuyotSafety Consultant
Airbus
Gerard GuyotSafety Consultant
Airbus
A Manufacturer’s PerspectiveA Manufacturer’s Perspective

2Airbus and The Boeing Company
Aviation Safety: Some PerspectiveAviation Safety: Some Perspective
Worldwide:
An airplane is landing approximately every two seconds somewhere in the world– Approximately 53,000 flights per day
More than 3 million people fly each day
In 2006, Over 1.2 billion people flew on over 20 million flights
In 2006, there was 7 fatal accidents
Airbus and The Boeing Company
09-15-04 PUB-015
Airline Travel is Extraordinarily SafeAirline Travel is Extraordinarily Safe
42,643
CommercialAirlines*
Generalaviation
Recreationalboating
and othermarine
Railtransportation
Highway Othercommercial
aviation
703 767626
4773
U.S. Transportation Fatalities – 2003*Source: NTSBNumber
ofFatalities
Bicycles
622
*5-Year (ending in 2003) average for commercial Jets, U.S. operations only

Airbus and The Boeing Company
Hull Loss Accident RateWestern-Built Worldwide Commercial Jets (>60,000 lbs) 1993 - 2005
… And we are making progress!… And we are making progress!
0.00
0.40
0.80
1.20
1.60
2.00
1994 1995 1996 1997 1998 1999 2000 2001 2002 2003 2004 2005 2006
5 year running average5 year running average
Hull Loss Accident Rate(per million departures)
Hull Loss Accident Rate(per million departures)
Industry/Government Collaborative Efforts

5Airbus and The Boeing Company
1-19-05 FT-004Wc
Annual Hull loss accident rate[Accidents per million departures]
We Need to Continuously ImproveAviation Safety…
We Need to Continuously ImproveAviation Safety…
0
5
10
15
20
25
30
35
40
45
50
1960 1970 1980 1990 2000 2010 2020

6Airbus and The Boeing Company
1-19-05 FT-004Wc
Annual Hull loss accident rate[Accidents per million departures]Annual Hull loss accident rate[Accidents per million departures]
Airplanes in service
2006 2021
20,042
32,495
We Need to Continuously ImproveAviation Safety…
We Need to Continuously ImproveAviation Safety…
Departures, MillionsDepartures, Millions
0
5
10
15
20
25
30
35
40
45
50
1960 1970 1980 1990 2000 2010 2020

7Airbus and The Boeing Company
1-19-05 FT-004Wc
Hull loss accidentsper year
Hull loss accidentsper year
Annual Hull loss accident rate[Accidents per million departures]Annual Hull loss accident rate[Accidents per million departures]
Departures per year, MillionsDepartures per year, Millions
Business as usual
Reductions possible with continued Industry effort
Airplanes in service
2006 2021
20,042
32,495
We Need to Continuously ImproveAviation Safety…
We Need to Continuously ImproveAviation Safety…
0
5
10
15
20
25
30
35
40
45
50
1960 1970 1980 1990 2000 2010 2020

8Airbus and The Boeing Company
Departures and Flight HoursWorldwide Operations* 1987 through 2006
Departures and Flight HoursWorldwide Operations* 1987 through 2006
*Western fleet
• 487.5 million cumulative departures since 1959 (396.1 million on Boeing airplanes)
• 874.4 million cumulative flight hours since 1959 (684.9 million on Boeing airplanes)
• 7 manufacturers – 35 significant types (14 Boeing) in service as of 12/31/2006
Annual departures
andflight hours (millions)
Year
20.0
40.3Flight hoursDepartures
0
5
10
15
20
25
30
35
40
45
87 88 89 90 91 92 93 94 95 96 97 98 99 00 01 02 03 04 05 06

Airbus and The Boeing Company
25000
20000
15000
10000
5000
02005 2010 2020
Number ofairplanes at
years end
2002
32,000
30000
GROWTH
• Public Confidence• Strong Economies• Peace & Prosperity
LIMITS TO GROWTH
2015
• Safety/SecurityPerceptions
• Traffic Congestion• Environmental Factors
Worldwide Commercial Jet Fleet is Growing, But There are Limits to Growth
Worldwide Commercial Jet Fleet is Growing, But There are Limits to Growth

Airbus and The Boeing Company
Because the Aviation System Is Complex,All Parts of Industry Must Work TogetherBecause the Aviation System Is Complex,All Parts of Industry Must Work Together
More than 21,000 airplanes
150,000+ flight crew200+ languages
200+ countries800+ airlines
1,350+ major airports
240,000+ maintenance personnel

Airbus and The Boeing Company
Safety Responsibilities Are SharedSafe Airplane + Safe Operation + Safe Infrastructure = Safe Air Travel
Safety Responsibilities Are SharedSafe Airplane + Safe Operation + Safe Infrastructure = Safe Air Travel
Safe airplane design Safety-enhancing technology
development Flight and maintenance
operations, recommendations,documents, training, andsupport
Maintenance planning Safety-related analysis Safety initiatives
Operations policy andprocedures
Airplane/pilot publications Approved maintenance
program Maintenance, policy, and
procedures Maintenance publications Safety program Training
ManufacturersGovernments
Operators
Aviation law Operations specification Rules and regulations Inspectors policy,
procedures, and training Airline policy and
procedures requirements Safety, health, environmental
law, and regulations Navigation facilities/operations Airport facilities Departure en route, arrival,
approach policy, andprocedures
Air traffic control services Safety-related analysis
Air Safety

12Airbus and The Boeing Company
Fatalities by CAST/ICAO Taxonomy Accident CategoryFatalities by CAST/ICAO Taxonomy Accident Category
Number of fatal accidents (89 total)
20 5 8 2 2 3 3 219 162 2 15 71
1643 (67)
262 (77)
156 (71)
126 (0) 124 (2) 120 (0) 110 (10) 110 (4) 109 (1)
2 (0) 1 (0)
Fatalities
External fatalities [Total 249]
Onboard fatalities [Total 5,149]
1655 (0)
546 (0)
ARC Abnormal Runway ContactCFIT Controlled Flight into or Toward TerrainF-NI Fire/Smoke (Non-Impact)FUEL Fuel RelatedLOC-G Loss of Control – GroundLOC-I Loss of Control – In flight MAC Midair/Near Midair CollisionOTHR OtherRAMP Ground HandlingRE Runway ExcursionRI-VAP Runway Incursion – Vehicle, Aircraft or PersonSCF-NP System/Component Failure or Malfunction
(Non-Powerplant)SCF-PP System/Component Failure or Malfunction
(Powerplant)TURB Turbulence EncounterUSOS Undershoot/OvershootUNK Unknown or UndeterminedWSTRW Wind shear or Thunderstorm
No accidents were noted in the following categories:AMAN Abrupt ManeuverADRM AerodromeATM Air Traffic Management/
Communications, Navigation, SurveillanceCABIN Cabin Safety EventsEVAC EvacuationF-POST Fire/Smoke (Post-Impact)GCOL Ground CollisionICE IcingLALT Low Altitude OperationsRI-A Runway Incursion – AnimalSEC Security Related
For a complete description go to: http://www.intlaviationstandards.org/
107 (1)55 (9)
23 (0) 0 (7)
External fatalities
Onboard fatalities
Note: Principal categories as assigned by CAST.
Fatal Accidents – Worldwide Commercial Jet Fleet – 1997 Through 2006
0
200
400
600
800
1000
1200
1400
1600
1800
LOC-I CFIT SCF-NP
RE MAC LOC-G OTHR UNK RI-VAP F-NI USOSWSTRW ARC FUEL RAMP SCF-PP
TURB

Airbus and The Boeing Company
Fatal Accidents and Onboard Fatalities by Phase of FlightFatal Accidents and Onboard Fatalities by Phase of Flight
Fatal accidents
Onboard fatalities
Taxi, load/unloadparked,
tow
Takeoff Initialclimb
Climb Cruise Descent Initialapproach
Finalapproach
Landing
11
4
Fatal accidents
617
7
625
967
9
Initialapproach
10%
14%
12%
Descent
5%
6%
11%
Finalapproach
10%
15%
3%
Percentage of accidents/fatalities
Takeoff
11%
12%
1%
Initialclimb
8%
17%
1%
Landing
22%
5%
1%
Taxi, load/unload parked,
tow
13%
0%
Climb(flaps up)
11%
12%
14%
Cruise
10%
19%
57%
19% 32%
29% 20%
Fatal Accidents
Onboard Fatalities
Distribution of fatal accidents and onboard fatalities
0
20
40
60
80
100
0
500
1000
1500
2000
858
299 275
Onboard fatalities
716 788
4
Exposure* (Percentage of flight time estimated for a 1.5 hour flight)
Initial approach
fixFinal
approach fix
212006 STATISTICAL SUMMARY, JULY 2007
10 10 9 9
20
<1%
*Percentages do not sum to 100% due to numerical rounding.
Worldwide Commercial Jet Fleet – 1997 Through 2006

14Airbus and The Boeing Company
Fatal Accidents - Asia (including China) Airline Domicile - 1997 Through 2006
Number ofFatal
Accidents(22)
Number ofFatal
Accidents(22)
88 66 11 22 33 11 11
980980
462(61)462(61)
225225
108108
38(3)38(3)11 11
FatalitiesFatalities
External fatalities [Total 64]
Onboard fatalities [Total 1,815]
External fatalities [Total 64]
Onboard fatalities [Total 1,815]
ARC Abnormal Runway ContactCFIT Controlled Flight into or Toward TerrainF-NI Fire/Smoke (Non-Impact)LOC-I Loss of Control – In flight RE Runway ExcursionSCF-NP System/Component Failure or Malfunction
(Non-Powerplant)SCF-PP System/Component Failure or Malfunction
(Powerplant)
No accidents were noted in the following categories:AMAN Abrupt ManeuverADRM AerodromeATM Air Traffic Management/
Communications, Navigation, SurveillanceCABIN Cabin Safety EventsEVAC EvacuationF-POST Fire/Smoke (Post-Impact)FUEL Fuel RelatedGCOL Ground CollisionICE IcingLALT Low Altitude OperationsLOC-G Loss of Control – GroundMAC Midair/Near Midair CollisionOTHR OtherRAMP Ground HandlingRI-A Runway Incursion – AnimalRI-VAP Runway Incursion – Vehicle, Aircraft or PersonSEC Security RelatedTURB Turbulence EncounterUSOS Undershoot/OvershootUNK Unknown or UndeterminedWSTRW Wind shear or Thunderstorm
For a complete description go to: http://www.intlaviationstandards.org/
External fatalitiesExternal fatalities
Onboard fatalitiesOnboard fatalities
Note: Principal categories as assigned by CAST.Note: Principal categories as assigned by CAST.
Fatalities by CAST/ICAO Taxonomy Accident CategoryFatalities by CAST/ICAO Taxonomy Accident Category
0
200
400
600
800
1000
1200
CFIT LOC-I SCF-NP
RE ARC FIRE-NI SCF-PP

Airbus and The Boeing Company
Asia (Including China) Airline Domicile Fatal Accidents by CAST/ICAO Taxonomy Accident CategoryAsia (Including China) Airline Domicile Fatal Accidents by CAST/ICAO Taxonomy Accident Category
1997 1998 1999 2000 2001 2002 2003 2004 2005 2006
CFIT
LOC-I
ARC
RE
SCF-NP
F-NI
SCF-PP
8
6
3
2
1
1
1
ARC Abnormal Runway ContactCFIT Controlled Flight into or Toward TerrainF-NI Fire/Smoke (Non-Impact)LOC-I Loss of Control – In flight RE Runway ExcursionSCF-NP System/Component Failure or Malfunction (Non-Powerplant)SCF-PP System/Component Failure or Malfunction (Powerplant)
RI-A Runway Incursion – AnimalRI-VAP Runway Incursion – Vehicle, Aircraft
or PersonSEC Security RelatedTURB Turbulence EncounterUSOS Undershoot/OvershootUNK Unknown or UndeterminedWSTRW Wind shear or Thunderstorm
AMAN Abrupt ManeuverADRM AerodromeATM Air Traffic
Management/Communications, Navigation, Surveillance
CABIN Cabin Safety EventsEVAC EvacuationF-POST Fire/Smoke (Post-Impact)
No accidents were noted with the following principal categories:
FUEL Fuel RelatedGCOL Ground CollisionICE IcingLALT Low Altitude OperationsLOC-G Loss of Control – GroundMAC Midair/Near Midair CollisionOTHR OtherRAMP Ground Handling
For a complete description go to: http://www.intlaviationstandards.org/
Note: Principal categories as assigned by CAST

16Airbus and The Boeing Company
Western-built transport hull loss accidents, by airline domicile, 1997 through 2006
Accidents permillion departures
Accident Rates Vary by Region of the WorldRegional PerspectiveRegional Perspective
United Statesand Canada
0.5
Latin Americaand Caribbean
2.4
Europe0.7
China0.3
Middle East3.0
Africa12.0
Asia1.9
World1.16
Oceania0.0
(ExcludingChina)
C.I.S.4.9
ESSI
PAAST
CAST
ASET
COSCAPS

17Airbus and The Boeing Company
Possible Reasons for Regional Accident Rate Differences
Possible Reasons for Regional Accident Rate Differences
Infrastructure– Air traffic control– Navigation aids– Airport equipment– Weather services
Airline operations– Procedures– Training– Maintenance– Dispatch
Regulatory oversight– Aviation law– Regulation– Personnel qualifications– Resource constraints

18Airbus and The Boeing Company
*Representing P&W and RR
DODFAA
• Aircraft Certification• Flight Standards• System Safety• Air Traffic Operations• Research
NASAICAOEASATCCNATCANTSB
AIAAirbusALPAAPAATANACABoeingGE*RAAFSFIATAAAPAATACAPFA
Commercial Aviation Safety Team (CAST)Commercial Aviation Safety Team (CAST)
Industry Government
Commercial Aviation Commercial Aviation Safety TeamSafety Team
(CAST)(CAST)

19Airbus and The Boeing Company
Worldwide Risk AnalysisWorldwide Risk AnalysisWorldwide Risk AnalysisWorldwide Risk Analysis
CAST plan developed to reduce fatality risk in U.S. Part 121 operations
Question was raised by ICAO, PAAST and ESSI as to effectiveness of CAST plan worldwide
Worldwide fatal accident data from 1987 – 2001 analyzed using the CAST selection tool
– 331 accidents, which had sufficient data, were analyzed and scored

20Airbus and The Boeing Company
Portion of Regional Fatality Risk
10
20
30
40
50
60
70
80
90
100
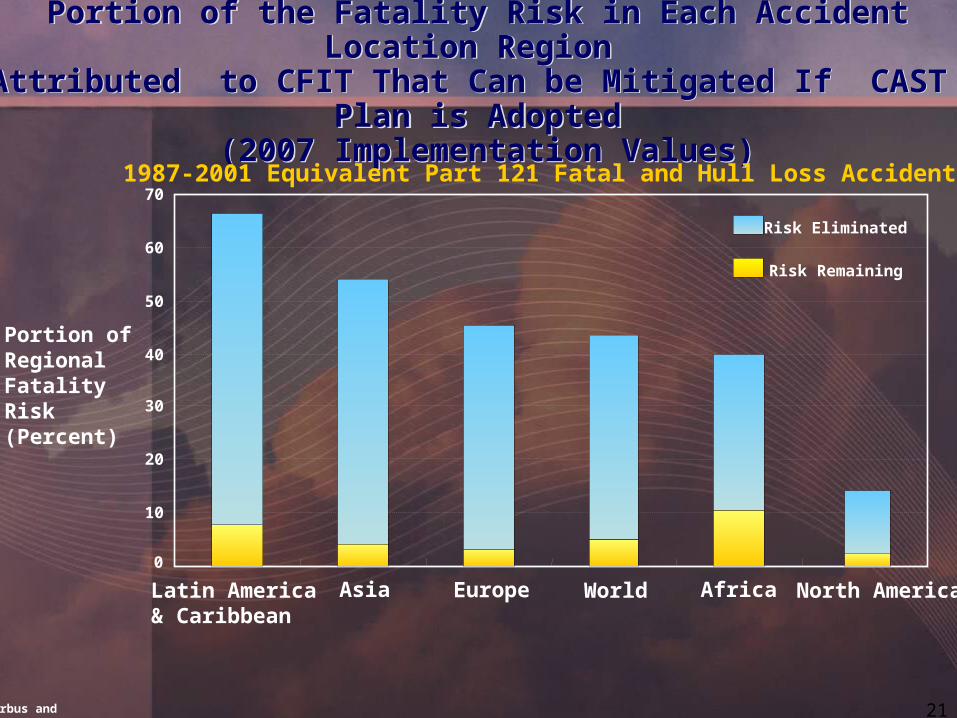
Portion of the Fatality Risk in Each Accident Location RegionAttributed to CFIT
Portion of the Fatality Risk in Each Accident Location RegionAttributed to CFIT
(1987-2001 Equivalent Part 121 Fatal Accidents)
Latin America & Caribbean
Asia Europe Africa North America
21Airbus and The Boeing Company
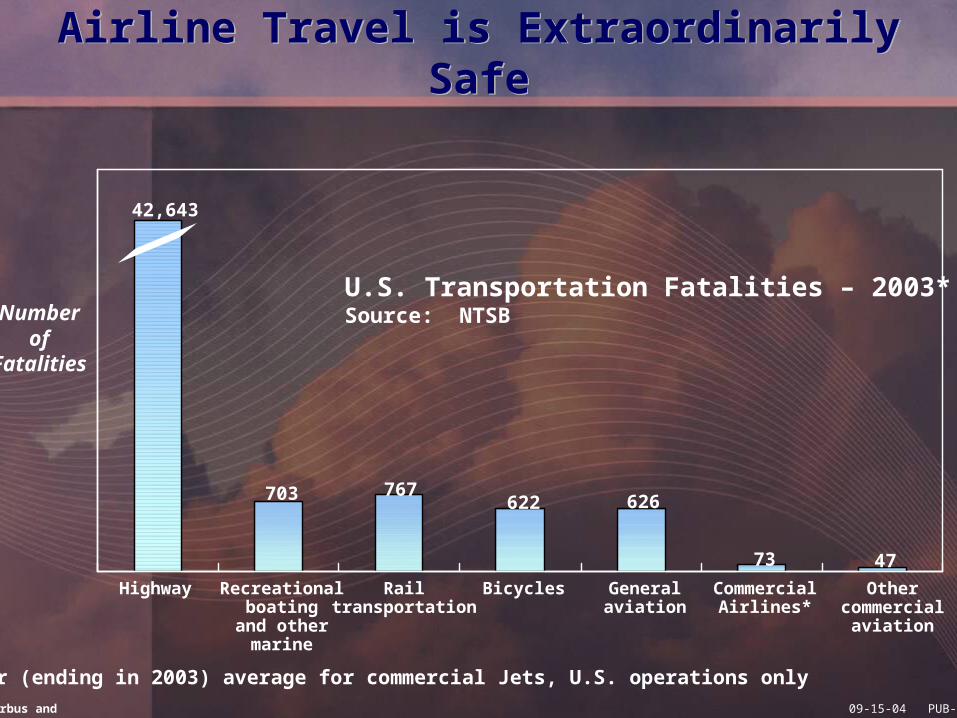
Portion of the Fatality Risk in Each Accident Location Region Attributed to CFIT That Can be Mitigated If CAST Plan is Adopted
(2007 Implementation Values)
Portion of the Fatality Risk in Each Accident Location Region Attributed to CFIT That Can be Mitigated If CAST Plan is Adopted
(2007 Implementation Values)
0
10
20
30
40
50
60
70
Latin America & Caribbean
Asia Europe World Africa North America
Portion of Regional Fatality Risk (Percent)
1987-2001 Equivalent Part 121 Fatal and Hull Loss Accidents
Risk Eliminated
Risk Remaining

Airbus and The Boeing Company
ConclusionConclusion
Commercial air travel is extraordinarily safe, but improvements must continue to be made
Not all areas or environments of the world are the same — we need to use facts, data, and continuing insight to focus appropriate improvement efforts
Improving safety in Asia is a shared responsibility of the manufacturers, the airline operators, and Government/State authorities, but it will take willingness and commitment to make it happen
COSCAP regional safety teams and similar safety organizations can help to reduce accident risk
Considerations should be given to implementing appropriate CAST Safety Enhancements to reduce fatality risk
Airbus and Boeing are committed to help enhance aviation safety
Rapid growth of commercial aviation in ASIA presents significant challenges
Airbus and The Boeing Company
Next StepsNext Steps
Measure implementation levels and effectiveness of processes and procedures already put in place (e.g. adopted CAST Safety Enhancements)
Integrate appropriate elements of the Global Aviation Safety Roadmap
Identify gaps that exist and form plans to address
Establish an information-sharing process to better gauge effectiveness of enhancements and identify emerging threats