Embed Size (px)
Citation preview

1
February 13, 2014
Biosystematics and Nomenclature.
Phylogenetic Species Concept. Cracraft.Biological Species. Mayr.
---
Coehesive Species Concepts.
vs
Historical Species Concepts.
*Cracraft's ideas:
Conspecificity in the BSC is measured by relative phenotypic similarity, which Mayr claimsfunctions as a surrogate for a direct measurement of reproductive compatability. But look atCracraft’s paper.
*In some groups this is subjective.
Cinclosoma-species limits - -development of a true phylogeny- hindered because of the relational concept of BS.
Cracraft points out that a hybridization event between two species in the range is occurring,
-The BSC illustrates the idea that these two species could again overlap in range and hybridizeon a wholesale scale if the climate changed.
HOWEVER, the phylogeny shows that these two species are not their closest relatives.
*Application of the BSC has created paraphyletic taxa. (Mistake - our own ideas superimposedin a true phylogeny.
*The problem is essentially solved when the phylogenetic species concept is applied in this case.

2
2- Speciation in Daphoenositta.
-Recognition of a single polytypic species - or MEGASUBSPECIES -
Convention: Ancestor with wide distribution - with 5 populations becoming isolated in humidrefugia during a more xeric period. Populations the spread once the climatemoderated.
Q’s1. What is the unit of evolution here? - the single species is not the unit. Here it has been
treated as the sub-species.
2. Mayr 1982 indicated that subspecies are units of convenience not of evolution.
3. There is ontological confusion here - what are they species, subspecies, megasubspecies?
4. A phylogeny seems to really help here. However, many times - at levels below thespecies, phylogenetic methods break down.
-> Coding the characters and creating the table diagnoses:
-the analysis shows that the forms are not the same ages-placing all them into a single spececies masks the historical pattern

3
How do we discover species?
First: We have to know what they are...
See page 106 of Brooks and McLennan.
Brooks starting on page 104 –
::Cohesion Concepts of Species - Species are groups of individuals held together by somecohesive systems.
Paterson (1978 - 1987). ::Recognition Species Concept: Groups of individuals held together by a specific materecogntion system.
Dobzhansky (1937) – Advocated by Mayr (1942 etc...). ::Biological Species Concept: A group of interbreeding or potentially interbreedingorganisms reproductively isolated from other such groups.
Van Valen - (1976)
::Ecological Species Concept: Each species has its own unique niche and it is the nichethat defines the species.
–These provide definition of what species are. That is after we know that they exist.
We need to find out how to discover species.
Brooks and McLennan consider the Evolutionary Species Concept as the fundamentalOntological species concept for evolutionary biology.
-Brooks and McLennan consider this concept non operational:
-Does not specify discovery criteria or evaluation criteria.
-The operational surrogate for the evoluitionary species concept begins with aphylogenetic analysis of the collectoins of organisms given names bytaxonomists.
-Not all organisms have the defining characters of the species - male characters, vs.female as in the paper by Cracraft.

4

5
:: Historical Concepts of Species.
Wiley from Brooks -
1. Species concept – must encompass species persistence through time as well asdivergence.
2. Species are cohesive wholes
3. Inherent historical context of species (historicity ?????)
Brooks claims that the evolutionary species concept is non operational. We need an operationalcriterion for species.
*most taxonomists propose species names that do not require a particular species concept.
(Basically the typological species concept) -
*Brooks pointed out that The Operational Surrogate For the Evolutionary Species Concept startswith a Phylogenetic Analysis of the collection of organisms given names by taxonomists.
**Character analysis:: characters are not properties of membership, but evidence of inclusion orbeing part of a phylogenetic lineage.
Historical Species Concepts – Page 109 Brooks and McLennanThere are 3 distinct categories: They differ in how we recognize species on a phylogenetic tree.
1. Composite Species Concept - Conceived by Kornet in 1993.
-The CSC recognizes a distinct species for each character. This concept recognizes eachinstance of character fixation is evidence of past lineage splitting.
-Origination and fixation of each apomorphic trait requires permanent lineage splitting.-Each apomorphic trait indicates the present or prior existence of a distinct species.-No Anagenesis - No development of apomorphic traits within a species. Is anagenesisimportant? Yes. We want to study various evolutionary phenomena and can’t do it if we do notrecognize anagenetic evolution.
Thus: The CSC limits what we can understand about species - Placing constraints on the kinds ofphenomena evolutionary biologists may study.

6
–>This is not acceptable so I reject this species concept<– AS DO Brooks and McLennan.

7
a b d e c f g
a d e f g
a b d e c f g
b c
7 s p e c i e s6 a n c e s t o r s
g
f
b
a d e
c
2. Phylogenetic Species Concept - 2 (PSC-2):
-From what we can get from the book: This concept may seem to be the most consistent of theHSC’s-It takes into account only the branching structure of the tree.-It rules out the idea of persistent ancestors–To me this was a difficult problem when I was first learning about and trying to apply themethods of phylogenetic systematics.
–>> Since the PSC-2 rules out modes of speciation, then we reject it along with the CSC.
3. Phylogenetic Species Concept - 1 (PSC-1):
-Allows the recognition of persistent ancestors and budding of species from species that existnow.
-Most conservative approach --
Requires: Evidence of both lineage splitting and character evolution to recognize species.
Does Not A-Priori - Rule out any evolutionary processes that may occur. p 110

8
How do we evaluate species?
2 main research programs relative to evaluation of species.
-how they formed-ways they maintain their identity once formed
1) How speciation started: Coupling of phylogenetic pattern with geographical distributionsto determine conditions in which speciation was started.
2) How speciation was completed: Quantitative Genetics, demographics, mate choiceexperiments.
- Mayr 1963-
3 General classes of speciation.
1. Reductive speciation = compilo-species two species join to form a new one. There are nodocumented cases of this.
Draw.
2. Phyletic speciation = progression of forms within a single lineage are assigned speciesstatus at different points in time.
Draw. PSC-1 then allows each lineage evolving independently to undergo change - anagenesis.The CSC would not allow this.
3. Additive Speciation or Cladogenesis - Characterized by an increase in the number ofspecies.
-most speciation models - while mechanistically different - are based on models of
9
additive speciation.
–Production of sister species is what we are studying.
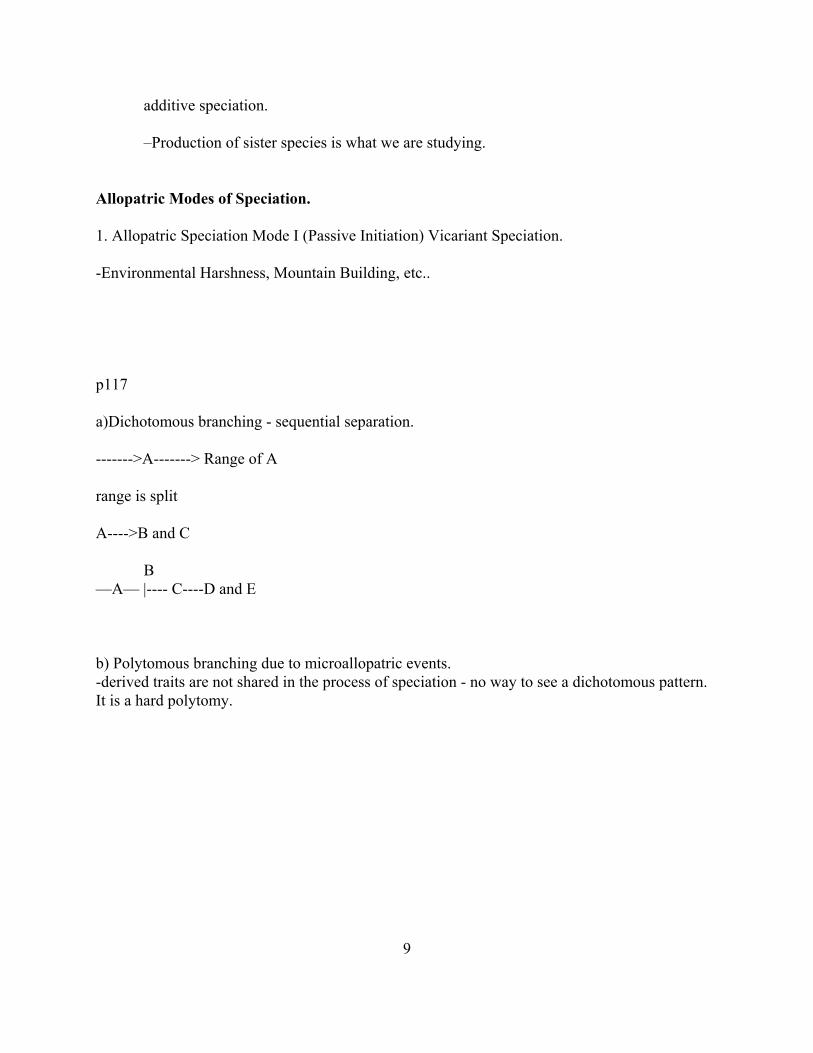
Allopatric Modes of Speciation.
1. Allopatric Speciation Mode I (Passive Initiation) Vicariant Speciation.
-Environmental Harshness, Mountain Building, etc..
p117
a)Dichotomous branching - sequential separation.
------->A-------> Range of A
range is split
A---->B and C
B—A— |---- C----D and E
b) Polytomous branching due to microallopatric events.-derived traits are not shared in the process of speciation - no way to see a dichotomous pattern. It is a hard polytomy.

10
2. Allopatric Speciation Mode II. (Active Initiation)Periphral isolates or Peripatric Speciation.
-Centrifugal Model- -new species arising on the edges of the range of the parental species. Different habitats,different selective pressures and speciation begins.
-two patterns result.
A) If isloation is due to random settling of individuals - we get hard polytomies.Repeated cycles of periphral isolation from same ancestor could produce a bifurcatingtree.
B) Alternating episodes of dispersal and isolation. (P. 121)
3. NON-ALLOPATRIC MODES
-Speciation initiation when there is incomplete separation of two or more populations.
-Speciation progresses despite continual gene flow between populations.
[Divergence with Gene Flow model]
-Sympatric speciation - Rice et al, found that species can diverge with gene flow.
Some Examples –
How do we test vicariance? Look at more than one species group. Similar patterns overgeographic space will point to a similar process.
Vicariance seems to be the predominant mode of speciation.
How do we evaluate reproductive isolation?
-no general mechanism for completing speciation.
-no general combination of factors unique to a speciation mode.

11
1. Allopolyploidy - Occurs often in plants.
-Examples in many different plant groups.
2. Heterochrony - Cricket example.
-Sympatric in space allopatric in time. Since we know that time and space are not separable,then we know that this is actually an allopatric mode of speciation. -Microallopatric ? Syntopic but micro allopatric?
3. M.J.D. White. Moribane Grasshopper example. Stasipatric Speciation - an example ofsympatric speciation.
Remember that sympatry means geographic area, syntopic means same area and same nichespace.
Speciation Models.
• allochronic• allopatric• centrifugal• clinal• dumbbell model• explosive• geographic• parapatric• quantum• saltational• stasipatric• sympatricStasipatric Speciation
1. Chromosomal Model2. Species Range was replaced by the incipient species or groups of species3. Identical karyotypes4. One species is living ancestor - direct descendant5. Field work showed - 1 fusion event; 1 pericentric inversion gave rise to acrocentric x-
xsome.6. Spreading from origin occurred despite segregational load at meiosis7. Spreading was due to -
a. homozygote advantagei. Homozygote for new arrangement was adaptively superior to homnozygote for
original karyotype.

12
ii. Genetic Driftiii. Perhaps - Segregational advantage
8. Entire process involved fragmentation of original range and occupation by new types.9. No general sympatry except in areas of hybridization.
a. Kangaroo Island - Zone of Overlap is 200 - 300 meters wide.b. Hybrid females found no males c. Evidence of limited gene flowd. Meiosis normale. Some females transmit one chromosomal type more readily to offspring than the other
type, indicating some meiotic load
-----
Frequency of Initiation Modes in Speciation.
1. Allopatric Speciation.
-majority of speciation events fall in this arena -
2. Non-Allopatric Speciation
Evaluation of Speciation Event : Reproductive Isolation. How do we evaluate this?
-There is no one general mechanism for completion of speciation.
-There is no particular combination of these factors that are unique to a speciation mode.
-There are some general mechanisms that produce reproductively isolated groupsinstantaneously.
—>This is a case of initiation of speciation and completion simultaneously.
Ploidy in plants
Kornet et al., 1995. (From Brooks p 157).Also See Maddison from handout.
Microspecies : General term All assemblages of conspecific organisms that we calledsubspecies – Combined complement of smaller lineages extendingthrough time.
-term have implied links.-1st. Groups under study can be distingushed objectively in some manner.

13
-2nd. There is a probability that this group will become a macrospecies not doneso yet.
Expect extinctions, microspecies fusions, gene flow, etc. to limit macrospeciesformation.
Macrospecies: A divergent lineage irreversably split from its ancestor with no possibility ofrecombining with the parental species.
– In intraspecific phylogeography - the research program studies deployment of genetic variationwithin a species.
Generalization: relationships are complex and reticulated-moderate to little resolution (many equally parimonious trees).-statistically indistinguishable trees.
reticulated and polytomous tree (show)
[This is predicted by Dobzhansky, Mayr, Simpson - SPECIES ARE THE KEYEVOLUTIONARY ENTITIES]

14
We predict:
-Microspecies shold be more numerous than macrospecies.
-Macrospecies should be more easy to identify because they are created via historical non-reversable changes.
The Fish from Lake Victoria (400,000 yrs old) with 3 major dessication events.
The fish from Lake Tanganyika.
-show only 171 species-these species display more extreme morphological and behavorial specalizations than do thefish in the younger lakes. (Lake Victoria). See page 163-165
Fish from Lake Victoria and Lake Tanganyika.
Feb - 2014
Sticklebacks - Read the stickleback page example.
-Gasterosteus aculeatus -look at the speces patterns and see if they fit the results of what is expected with a centrifugal orperipatric speciation model.
You read on pages 166 - 167.
Two possible scenarios.
1. Sympatric speciation - benthic limnetic species pairs independently in each of 6 lakes.
2. 2 waves of anadromous colonists wafted into the lakes from the marine incursion.
a. First colonizer was closer to the benthic form.b. Second colonizer was closer to the limnetic morph.

15
This has been termed – Ecological Speciation – speciation was completed via reinforcement(favoring premating isolation mechanisms) caused by slection against hybrids.
1. -Ecological Speciation (Dolf Schluter) -
Refers to specific involvement of ecological factors – ie.-Competition or-predator driven divergence.
What type of phylogenetic patterns are predicted?
1. Double invasion of the same ancestor at different times.
-Polytomy - Hard - Both waves represent multiple instances of periphral isolation from the same ancestor.
2. Sympatric speciation should also produce a polytomy.
Result of a phenetic analysis on page 170 shows a complicated relationship. However, aWagner analysis of the genetic data (with bootstrap resampling) shows an almost completepolytomy.
-This is what is expected from multiple independent colonization events from a commonancestor population species!


16
Chapter 4.
Historical Biogeography. History sensu Daniel Brooks.
3 major events in the mid 60's occurred:
1. Island Biogeography by MacArthur and Wilson 1963. Stimulated EcologicalBiogeography
-narrative in nature-discussing relationships between current environments and number and relative abundanceof species in areas.
2. Continental Drift. Acceptance. 1960's
3. Phylogenetic Systematic Methods. 1960's onward.
Reliance only on contemporary ecology to look at patterns of species in areas (numbers ofspecies on islands
-This all led to the development of a system of biogeographic analysis called VicarianceBiogeography. This was based on “Component Analysis” for phylogenetic trees.
This method was shown to be somewhat workable, but it dropped data due to complexity of theanalysis.
Meanwhile: == Farris 1970, 1982, 1988 developed methods of tree comparisons in cladistics thatwere applied by Brooks 1981 to look at host parasite phylogenies and later applied tobiogeography.
-identify points of congruence and incongruence between host and parasite phylogenies and forhistorical biogeography.
Wiley called this Brooks Parsimony Analysis (BPA).
-Questions are: which of the speciation events in the groups under study conform to ageneral pattern of vicariance?
And Which could be due to other modes of speciation / dispersal etc...?

17
68
7
9
A. foliaceaA. japonicum A. elongata
A. liguloideus
A. africanus
Brooks -
Spatial scale influences complexity of phylogenetic influences on biogeographic patterns.
1. larger spatial scale - • more likely to find repeated or replicated speciation events.• greater phylogenetic effects on diversity• the older the origins of the biota studied.• more complicated the historical explanations for the species composition in those biotas
2. Scale also influences the types of questions that can be asked.
Cladogram = Branching diagram
Area Cladogram = Branching diagram of a biogeographic area
Phylogenetic Tree = estimate of relationships among species based on characters intrinsic tothem.
Study of the Amphilinidea : Platyhelminthes (sister group to the tapeworms).8 species known

18
42 3
51
68
7
9
Search for possible historical connections in assoication between these flatworms and theirgeographical distributions.
1. Reconstruct the phylogeny. Bandoni and Brooks, 198746 characters single tree with aCI of 87.5%
2. Designate areas in which the species occur as if they were taxa.
Area Species Species NameA Eurasia 1 Amphilina foliaceaB North America 2 A. japonicaC Australia 3 Gigantolina elongataD South America 4 Schizochoerus liguloideusE Africa 5 S. africanus
3. Now treat these as a completely polarized ordered multistate transformation series in whicheach branch of the tree is numbered.
4. Each species has a code that indicates its identiy and its common ancestry.

19
68
7
9
A EDCB
LaurasiaGondwana
Pangea
Eurasia NA Aust SA Africa
Binary codes representing the phylogenetic relationships among the 5 species of theseamphilinid flatworms in our example.
Species Code1 Amphilina foliacea 1000010012 A. japonica 0100010013 Gigantolina elongata 0010000114 Schizochoerus liguloideus 0001001115 S. africanus 000010111
5. Replace the species names in table 4.2 with their geographic distributions.
6. Construct an area cladogram based on the binary codes representing the phylogeneticrelationships of the amphilinids.
Species CodeA Eurasia 100001001B North America 010001001C Australia 001000011D South America 000100111E Africa 000010111
7. Use geological evidence to produce an area cladogram showing the historical connectionsindependent of any species living in them. It is not necessary to have a-priori information onthe geological history to describe the pattern, but it helps to EXPLAIN the pattern.
The area cladogram ofthe geological evidence andthe area cladogram of thephylogenetic relationshoipsare identical (CI = 100%).
Vicariant speciation.
What about Noise?
1. Redundant species

20
1 2 6 3 47 8 5Gigagantolina m
agna
Schizo
coeru
s paragon
opora
Schizo
coerus ja
nickii
The rest of the species names are the same as previous example.
Decompose into matrix to showarea relationships
(more than one member of clade endemic to same area)2. Widespread species (one species in
more than one area)3. Missing species (one or more clades
do not have species in an area).
Brooks Parsimony Analysis
Area Duplication Convention:
Whenever areas have reticulate historieswith respect to the species inhabitingthem, assumption 0 will be violated
unless those areas are represented as separate entities for each separate historical episode.
Primary BPA -Phylogenetic analyses that do not invoke the duplication rule.
Secondary BPA -Phylogenetic analyses that do invoke the duplication rule.
-
I. Redundant species in an area.
-complete phylogenetic tree for Amphilinidea.
1. Include complete data in tree - adding the three addtional species.
2. Convert the tree (Fig 4.6) into a binary coded matrix. Table 4.4-when more than one species occurs in an area - combine codes.
3. The area cladogram is reconstructed from Table 4.4.
label the tree by hand from page 184

21
A B C D EF
A 100000001000001B 010000001000001C 001000000100011D 000100010011111E 000010000011111F 000001100100111
label by hand from page 185.
The CI is 93.8% - 10 appears twice onthe tree. The common ancestor of species 3 and 6ancestor 10 in fig above.
Problem: FIND AN EXPLANATIONFOR THE HOMOPLASY.
A. Species 3 evolved in area C (derived from ancestor 10 in same area).B. Ancestor 10 in area F must have been via a dispersal event.C. –>occurance of species 7 is due to common history
–>occurance of species 6 is due to dispersal of an ancestor into the area.
–>a dispersal event by a part of species 10 that carried the synapomorphies that allows usto recognize these species.
D. ::Area F has a reticulate history with respect to this clade.E. Test dispersal of 10 and the reticulate history by using the taxon duplication convention.
Build our new tree with the matrix below:

22
A Eurasia 100000001000001B NA 010000001000001C Australia 001000000100011D South Am 000100010011111E Africa 000010000011111F1 Indo-Mal. 000001000100011F2 Indo-Mal. 000000100000111
Problems and how to solve them:
1. Patterns of species distribution include dispersal events,2. Either with speciation3. Or without speciation.4. –>Result more than one species in same area<–
::When this happens - binary code for area in primary BPA is a composite of the codesfrom all taxa in that area –
5. Codes for taxa 6 7 were combined to give composite code for area F.6. Codes for taxa 4 8 were combined to give composite code for area D.
See Cressy et al., 1983 (inclusive Oring).7. Dispersal appeared as homoplasy (reversal)8. Two speciation events appeared as autapomorphies.9. Ambiguity - solved by assuming indo-malaysia for species 6 was different from indo-
malaysia for species 7.

23
I. Problem with BPA.
a. Many Young Species Dispersing into Areas Inhabited by Older Members of the Clade.
This is solved by using the secondary BPA and duplicating the areas. See examples p 188 - 190.Know how to do this.
b. Ambiguity Due to Widespread Species.
Any given species may occur in more than one of the areas being studied.
Dispersal from area of origin without speciating.orFailed to speciate due to vicariant events.
Secondary BPA seems to work to fix these problems using the area duplication convention.Compare matrix on page 191 with that on page 195.
See fig 4.18 on page 193. For dispersal schema
c. What about Missing Species?
-what do we do if there were extinctions?-what if we have not surveyed intensively enough to find all the species yet?
*** Primitive absence or secondary loss (or not enough data?).,???