Embed Size (px)
Citation preview

Feasibility Study of 3D Printing of Concrete for Transportation InfrastructureFinal ReportSeptember 2020
Sponsored byIowa Highway Research Board(IHRB Project TR-756)Iowa Department of Transportation(InTrans Project 18-674)

About the Institute for TransportationThe mission of the Institute for Transportation (InTrans) at Iowa State University is to develop and implement innovative methods, materials, and technologies for improving transportation efficiency, safety, reliability, and sustainability while improving the learning environment of students, faculty, and staff in transportation-related fields.
Iowa State University Nondiscrimination Statement Iowa State University does not discriminate on the basis of race, color, age, ethnicity, religion, national origin, pregnancy, sexual orientation, gender identity, genetic information, sex, marital status, disability, or status as a US veteran. Inquiries regarding nondiscrimination policies may be directed to the Office of Equal Opportunity, 3410 Beardshear Hall, 515 Morrill Road, Ames, Iowa 50011, telephone: 515-294-7612, hotline: 515-294-1222, email: [email protected].
Disclaimer NoticeThe contents of this report reflect the views of the authors, who are responsible for the facts and the accuracy of the information presented herein. The opinions, findings and conclusions expressed in this publication are those of the authors and not necessarily those of the sponsors.
The sponsors assume no liability for the contents or use of the information contained in this document. This report does not constitute a standard, specification, or regulation.
The sponsors do not endorse products or manufacturers. Trademarks or manufacturers’ names appear in this report only because they are considered essential to the objective of the document.
Iowa DOT Statements Federal and state laws prohibit employment and/or public accommodation discrimination on the basis of age, color, creed, disability, gender identity, national origin, pregnancy, race, religion, sex, sexual orientation or veteran’s status. If you believe you have been discriminated against, please contact the Iowa Civil Rights Commission at 800-457-4416 or the Iowa Department of Transportation affirmative action officer. If you need accommodations because of a disability to access the Iowa Department of Transportation’s services, contact the agency’s affirmative action officer at 800-262-0003.
The preparation of this report was financed in part through funds provided by the Iowa Department of Transportation through its “Second Revised Agreement for the Management of Research Conducted by Iowa State University for the Iowa Department of Transportation” and its amendments.
The opinions, findings, and conclusions expressed in this publication are those of the authors and not necessarily those of the Iowa Department of Transportation.

Technical Report Documentation Page
1. Report No. 2. Government Accession No. 3. Recipient’s Catalog No.
IHRB Project TR-756
4. Title and Subtitle 5. Report Date
Feasibility Study of 3D Printing of Concrete for Transportation Infrastructure September 2020
6. Performing Organization Code
7. Author(s) 8. Performing Organization Report No.
Kejin Wang (orcid.org/0000-0002-7466-3451), Kwangwoo Wi
(orcid.org/0000-0001-9415-3187), Simon Laflamme (orcid.org/0000-0001-
5666-3215), Sri Sritharan (orcid.org/0000-0001-9941-8156), Peter Taylor
(orcid.org/0000-0002-4030-1727), and Hantang Qin (orcid.org/0000-0003-
4180-7911)
InTrans Project 18-674
9. Performing Organization Name and Address 10. Work Unit No. (TRAIS)
Institute for Transportation
Iowa State University
2711 South Loop Drive, Suite 4700
Ames, IA 50010-8664
11. Contract or Grant No.
12. Sponsoring Organization Name and Address 13. Type of Report and Period Covered
Iowa Highway Research Board
Iowa Department of Transportation
800 Lincoln Way
Ames, IA 50010
Final Report
14. Sponsoring Agency Code
IHRB Project TR-756
15. Supplementary Notes
Visit https://intrans.iastate.edu/ for color pdfs of this and other research reports.
16. Abstract
Three-dimensional (3D) printing concrete technology has already been adopted for structural applications. Many houses and
pedestrian bridges have been 3D printed in the US and other countries. In spite of exploratory applications, 3D concrete printing
technology remains fragmentary, and its full-scale uses in transportation infrastructure are still rarely seen. In order to bring the
full benefits of this technology to the construction industry, it still requires a much better understanding of the relationships
among digital design, operation/processing, mechanisms of building materials, formulation of printing materials, and
performance of printed products. The present study aimed at exploring the feasibility of developing 3D printable concrete
mixtures and evaluating their potential uses for transportation infrastructure.
In this project, a commercial 3D clay printer was used to print small-scale clay, paste, and mortar objects. The effects of printing
parameters and procedures, printable materials, and mix proportions on printing properties, such as flowability, extrudability,
printability, buildability as well as on mechanical properties (compressive and tensile strength) of printed objects, were
investigated. The methods for characterizing the quality of 3D printed objects were examined.
The results indicate that paste and mortar mixtures made with cement, silica fume, a rapid-set grout powder, viscosity modifying
agents (VMAs), and superplasticizer can be engineered to have desirable flowability, extrudability, printability, and buildability
for 3D printing. Samples that were 3D printed with different printing paths and tested under different loading direction showed
clear anisotropic behavior in their mechanical properties. Printing qualities, such as geometric accuracy, distortion, surface
roughness, etc., of printed objects can be well evaluated using image analysis. In addition, a qualitative ranking system was also
developed for evaluation of the printing qualities of 3D concrete printing.
17. Key Words 18. Distribution Statement
3D concrete printing technology—3D printing—additive manufacturing—
concrete manufacturing—concrete mixtures—printing qualities
No restrictions.
19. Security Classification (of this
report)
20. Security Classification (of this
page)
21. No. of Pages 22. Price
Unclassified. Unclassified. 67 NA
Form DOT F 1700.7 (8-72) Reproduction of completed page authorized


FEASIBILITY STUDY OF 3D PRINTING OF CONCRETE
FOR TRANSPORTATION INFRASTRUCTURE
Final Report
September 2020
Principal Investigator
Kejin Wang, Professor
Civil, Construction, and Environmental Engineering, Iowa State University
Co-Principal Investigators
Simon Laflamme, Associate Professor
and Sri Sritharan, Professor
Civil, Construction, and Environmental Engineering, Iowa State University
Peter Taylor, Director
National Concrete Pavement Technology Center, Iowa State University
Hantang Qin, Assistant Professor
Industrial and Manufacturing Systems Engineering, Iowa State University
Research Assistants
Kwangwoo Wi and Karthick Manikandan
Authors
Kejin Wang, Kwangwoo Wi, Simon Laflamme, Sri Sritharan, Peter Taylor, and Hantang Qin
Sponsored by
Iowa Highway Research Board and
Iowa Department of Transportation
(IHRB Project TR-756)
Preparation of this report was financed in part
through funds provided by the Iowa Department of Transportation
through its Research Management Agreement with the
Institute for Transportation
(InTrans Project 18-676)
A report from
Institute for Transportation
Iowa State University
2711 South Loop Drive, Suite 4700
Ames, IA 50010-8664
Phone: 515-294-8103 / Fax: 515-294-0467
https://intrans.iastate.edu/


v
TABLE OF CONTENTS
ACKNOWLEDGMENTS ............................................................................................................. ix
EXEUTIVE SUMMARY .............................................................................................................. xi
1. INTRODUCTION .......................................................................................................................1
1.1 Research Background ....................................................................................................1 1.2 Objectives ......................................................................................................................2 1.3 Scope and Tasks .............................................................................................................2
2. LITERATURE REVIEW ............................................................................................................4
2.1 General Information on 3D Concrete Printing ...............................................................4 2.2 Key Properties of 3D Printing Concrete ........................................................................4 2.3 Materials and Mix Proportions of 3D Printing Concrete ...............................................5 2.4 Effects of Other Cementitious Materials and Additives ................................................6 2.5 Effects of Admixtures ....................................................................................................7
3. INITIAL TRIAL OF 3D PRINTING ........................................................................................10
3.1 Materials ......................................................................................................................10 3.2 Mix Design and Procedure...........................................................................................11 3.3 Printing Procedure and Test Methods ..........................................................................11 3.4 Test Results ..................................................................................................................12 3.5 Summary ......................................................................................................................14
4. PRINTER SELECTION AND PRINTING PARAMETER STUDY .......................................15
4.1 Introduction of 3D Printer ............................................................................................15 4.2 Printing Parameter Study .............................................................................................16 4.3 Summary ......................................................................................................................21
5. 3D PRINTING CONCRETE MIX DESIGN AND OPTIMIZATION .....................................22
5.1 Materials ......................................................................................................................22 5.2 Mix Proportions and Mixing Procedure ......................................................................23 5.3 Printing Parameters and Procedure ..............................................................................24 5.4 Evaluation Methods .....................................................................................................25 5.5 Test Results ..................................................................................................................26
6. MIXTURE CHARACTERIZATION AND PROPERTIES OF 3D PRINTED
PRODUCTS .......................................................................................................................30
6.1 Overview ......................................................................................................................30 6.2 Materials, Mix Proportions, and Procedure .................................................................30 6.3 Printing Parameters and Procedure ..............................................................................30 6.4 Test Methods ................................................................................................................31 6.5 Test Results ..................................................................................................................33
7. OBJECT DESIGN AND QUALITY EVALUATION ..............................................................39
7.1 Object Design...............................................................................................................39 7.2 Printing Quality Evaluation .........................................................................................40

vi
8. SUMMARY, CONCLUSION, AND FUTURE STUDY..........................................................46
8.1 Summary ......................................................................................................................46 8.2 Conclusions ..................................................................................................................47 8.3 Further Study ...............................................................................................................49
REFERENCES ..............................................................................................................................51

vii
LIST OF FIGURES
Figure 3.1. Syringe and printing path ........................................................................................... 12 Figure 3.2. Effects of VMA on the 3D printing by syringe .......................................................... 12 Figure 3.3. Effects of superplasticizer on the 3D printing by syringe .......................................... 13 Figure 3.4. Effects of chemical admixtures on the printing qualities of mixtures with silica
fume .................................................................................................................................. 13 Figure 3.5. Pop outs by air bubbles in the syringe ........................................................................ 14 Figure 4.1. 3D printer used in this study ....................................................................................... 15 Figure 4.2. 3D modeling images ................................................................................................... 17 Figure 4.3. Effects of different printing speeds on the printing qualities ..................................... 18 Figure 4.4. Effects of different extrusion speeds on the printing qualities ................................... 19 Figure 4.5. Effects of printing speed and extrusion speed on the layer width .............................. 19 Figure 4.6. Effects of infill rates on the printing qualities ............................................................ 20 Figure 4.7. Problems during clay printing process ....................................................................... 21 Figure 5.1. Strength development of grout used ........................................................................... 23 Figure 5.2. 3D modeling image .................................................................................................... 24 Figure 5.3. Curing method ............................................................................................................ 25 Figure 5.4. Effects of VMA and superplasticizer on concrete printing ........................................ 26 Figure 5.5. Effects of the grout and superplasticizer on the concrete printing ............................. 27 Figure 5.6. Effects of w/b on the concrete printing ...................................................................... 27 Figure 5.7. Effects of printing speed on the printing qualities...................................................... 28 Figure 5.8. Problems during concrete printing process ................................................................ 29 Figure 6.1. Sample preparation for mechanical properties ........................................................... 32 Figure 6.2. Cut samples for mechanical properties....................................................................... 32 Figure 6.3. Buildability of printable mortars illustrated by the shape of printed objects ............. 34 Figure 6.4. Failures during direct tension tests ............................................................................. 35 Figure 6.5. Compressive strength at 7 and 28 days ...................................................................... 35 Figure 6.6. Failure modes of samples under compression tested at 28 days ................................ 36 Figure 6.7. Flexural strength at 7 and 28 days .............................................................................. 37 Figure 6.8. Failure modes of samples under flexural load tested at 28 days ................................ 38 Figure 7.1. Different objects printed with clay and concrete ........................................................ 39 Figure 7.2. Printing quality evaluation and comparison ............................................................... 41 Figure 7.3. Photos and 3D-SLSS images of 3D printed clay samples .......................................... 42 Figure 7.4. Illustration of 2D plot development from 3D-SLSS images of a 3D printed
sample ............................................................................................................................... 43 Figure 7.5. 3D-SLSS measurements of geometric parameters of 3D printed samples ................. 44

viii
LIST OF TABLES
Table 2.1. Definition of key properties in 3D printing concrete ..................................................... 5 Table 2.2. Frequency of w/b ratios used in studies on 3D printing concrete .................................. 5 Table 2.3. Frequency of s/b ratios used in studies on 3D printing concrete ................................... 6 Table 2.4. Effects of SCMs on the properties of 3D printing concrete .......................................... 7 Table 2.5. Effects of admixtures on the properties of 3D printing concrete ................................... 8 Table 3.1. Materials and their sources .......................................................................................... 10 Table 3.2. Chemical composition of cementitious materials ........................................................ 10 Table 3.3. Mix proportion for initial trial ..................................................................................... 11 Table 4.1. Physical and chemical properties of clay ..................................................................... 16 Table 4.2. Printing parameters for clay printing ........................................................................... 16 Table 4.3. Printing parameters for clay printing ........................................................................... 17 Table 5.1. Fluidity and setting time of grout ................................................................................ 22 Table 5.2. Mix proportion for 3D printable concrete.................................................................... 23 Table 5.3. Printing parameters for concrete printing .................................................................... 24 Table 6.1. Mix proportion with different replacement ratio of grout ........................................... 30 Table 6.2. Results from flow table test ......................................................................................... 33

ix
ACKNOWLEDGMENTS
The authors would like to acknowledge the Iowa Department Transportation (DOT) and Iowa
Highway Research Board (IHRB) for their sponsorship for this study. Valuable input on the
project activities and comments on this report from the technical advisory committee (TAC)
members, Ahmad Abu-Hawash, Michael Nop, and Kimball Olson, are also greatly appreciated.
Special thanks to Ted Huisman with the Iowa State University Department of Civil,
Construction, and Environmental Engineering for his help on three-dimensional (3D) printer
setup, Joseph Schaefer with the Department of Aerospace Engineering (strength test) for their
help on mechanical tests, and Bowen Li and Vignesh Suresh with the Department of Mechanical
Engineering for their help on image analysis in quantifying the quality of printed objects.


xi
EXEUTIVE SUMMARY
Recently, there has been a growing interest in the use of three-dimensional (3D) printing
technology in concrete manufacturing. Instead of placing, leveling, consolidating, and finishing
concrete, 3D concrete printing technology brings all the traditional manufacturing steps into one
process by adding a building material to itself with automation and digitalization. 3D printing
technology also permits the creation of concrete structures having complex geometry (e.g.,
various shapes and cross sections) with high precision. It enables concrete construction under
extreme conditions that are difficult and/or very costly for conventional concrete construction to
have traditional formwork setup, placing, and/or consolidation. Using such an innovative
technology can significantly alter the way society constructs today, facilitating immense time
and cost savings in construction and opening a new door for innovation in structural concrete
design and construction.
However, in spite of exploratory applications, 3D concrete printing technology remains
fragmentary, and its full-scale uses in transportation infrastructure are still rarely seen. In order to
bring the full benefits of this technology to the construction industry, it still requires a much
better understanding of the relationships among digital design, operation/processing,
mechanisms of building materials, formulation of printing materials, and performance of printed
products. The present study aimed at exploring the feasibility of developing 3D printable
concrete mixtures and evaluating their potential uses for transportation infrastructure.
The specific objectives of this project included the following:
1. Develop a printable and functional 3D printing concrete mixture
2. Characterize the 3D printed concrete properties and have a better understanding of the
concrete behavior
3. Explore the potential applications of 3D printed concrete in the field of transportation
engineering, realize the challenges and future perspectives, and lay a foundation for extended
studies and applications of 3D printed concrete in Iowa
The following activities were performed in this project:
1. Literature review – Based on the information collected from existing publications, key
properties of fresh 3D printing concrete, such as flowability, extrudability, printability,
buildability, and open time, were defined, and their testing methods were defined. Materials
and proportions of typical 3D printing concrete mixes were reviewed, and the effects of
different types of materials on the required properties for 3D printing concrete were
comprehended, and related information was adopted in the mix design and evaluation of the
present study.

xii
2. Printing procedure and parameter study – A commercial 3D clay printer (3D potter bot) was
selected and used to print small-scale clay and concrete objects in this study. Due to its small
size, only paste and mortar were printed in the present study. Printer setup (selections of
nozzle size and shape, stand-off distance, etc.), different printing parameters (printing and
extrusion speed), and printing procedures (material preparation, loading time, and printing
time) were also investigated.
3. Design of 3D printable mortar mixtures – Based on the information collected from the
literature review, different types of materials, including cement, silica fume, viscosity
modifying agents (VMAs), and superplasticizer, and different water-to-binder (w/b) ratios
were selected for design of 3D printing mixtures. Trial and error tests were conducted to
identify paste and mortar mixtures with proper flowability that are suitable for being placed
in the printer, extruded out, and printing well-shaped filaments layer-by-layer easily and
mixtures with proper thixotropic behavior for holding the shape of printed objects. A
commercially available highly flowable, rapid-set grout was used to facilitate the mixtures to
reach the desired 3D printing properties.
4. 3D printable mix optimization – The effects of materials, mix proportions, and printing
parameters on fresh printable concrete properties, such as flowability, extrudability,
printability, and open time, were investigated. Based on the easiness of the printing processes
and the quality of the printed objects, the optimal mortar mix was identified.
5. Design of 3D printing objects – Small-scale samples with simple geometries, such as circular
columns, cubes, and prisms, with different infill rates (0%, 60%, and 80%), were printed with
clay, pastes, and mortar in the present study.
6. 3D printed concrete performance evaluation – Mechanical properties (compressive and
flexural strength) of printed objects made with various mortar mixtures were measured.
Samples were 3D printed with different printing paths and tested under different loading
directions to understand the anisotropic behavior of the printed objects. Printing qualities of
the printed objects were evaluated using image analysis.
The following are the major finding obtained from the present project:
1. Materials had significant effects on key printing properties, including flowability,
extrudability, buildability, and open time, of the 3D printing mortar. Use of silica fume and
VMAs decreased flowability and extrudability but increased buildability and shape-holding
ability. Increase in the dosage of superplasticizer enhanced flowability and extrudability, but
it decreased buildability. Use of a highly flowable, rapid-set grout significantly accelerated
the setting behavior of the mortar mixtures, leading to enhanced buildability.

xiii
2. Mix proportions also significantly influenced printing properties. Mixtures with a very low
w/b ratios showed unacceptable flowability and extrudability, causing difficulty in feeding
mortars into the extruder or blockage at the nozzle tip. Increase in the w/b ratio generally led
to increased flowability and extrudability of 3D printing mortar mixtures. However,
excessive flowability could result in structural deformation, such as slump, of the printed
objects, thus reducing buildability. Based on the test results, Mix 0.32-G20, made with a
binder containing portland cement, silica fume (2.5% by weight of binder), and 20% grout,
and a w/b ratio of 0.32, was the best mortar mixture among all mixtures studied. This mixture
was easily placed into the printer, extruded out smoothly and consistently, and able to hold
the shape of the designed objects during and after printing.
3. Several defects were identified during the 3D concrete printing, and they were (a) air bubble
pop outs, (b) discontinuity, (c) slumping, and (d) cracking. The first three were largely
related to the flow behavior of the 3D printing concrete mixtures, while the last one was
mainly due to plastic shrinkage. Prompt and proper curing is essential for 3D printing
concrete in order to reduce slump and plastic shrinkage cracking.
4. The compressive and flexural strength of the 3D printing mortar samples printed with
different printing paths were measured under different loading directions, and the results
were compared with those of mold-cast samples made with the same mortar mixture. It was
found that the mold-cast samples had a higher compressive strength than the printed samples
regardless of loading directions. This might be attributed to the existence of weak interlayers
between printed filaments. However, under flexural loading, the printed samples had a higher
flexural strength than the mold-cast sample regardless of loading directions. This might be
because the mixtures were densified during the 3D printing/extrusion process, leading to
higher flexural strength when the 3D printed samples were loaded in the direction
perpendicular to the filaments. However, little explanation could be made on why the 3D
printed samples had higher flexural strength than the cast samples when they were loaded
parallel to the filaments.
5. The 3D printed samples displayed different compressive and flexural strength values when
loaded in different directions, which clearly evidenced anisotropic behavior of the bulk
material. The compressive strength of the 3D printed samples loaded in the direction parallel
to the filaments was much lower than that of the corresponding samples loaded in the
direction perpendicular to the filaments, which was probably due to potential buckling of the
filaments under compression. However, the difference in flexural strength of the 3D printed
samples loaded in the two different directions was much smaller.

xiv
6. In order to evaluate the quality of the 3D printed concrete objects, a qualitative ranking
system based on visual inspection was developed in the present study. Based on this ranking
system, the samples printed with the best mortar mixtures used in the present study could be
ranked as 2 (the second to the best) out of 5, since they showed uniform layers and a bit of a
rough surface. Quantitative evaluation for the printing qualities was also conducted with a 3D
structured light scanning system (3D-SLSS). The results showed that all the printed samples
exhibited certain differences between their measured and designed values, even for those that
appeared well-printed. Compared with the designed object, the printed samples generally had
reduced total height, diameter, and layer thickness but increased layer width, mainly due to
slump. In addition to printing materials (concrete mixtures), various printing parameters,
including printing speed, extrusion speed, nozzle size and shape, stand-off distance, etc.,
could affect printing qualities of 3D printed objects. These affecting parameters should be
further studied to improve 3D printing quality.

1
1. INTRODUCTION
1.1 Research Background
Recently, there has been a growing interest in the use of three-dimensional (3D) printing
technology in concrete manufacturing. Instead of placing, leveling, consolidating, and finishing
concrete, 3D concrete printing technology brings all the traditional manufacturing steps into one
process by designing and building full-scale concrete objects in the laboratory with automation
and digitalization. 3D printing technology also permits the creation of concrete structures having
complex geometry (e.g., various shapes and cross sections) with high precision. It enables
concrete construction under extreme conditions that are difficult and/or very costly for
conventional concrete construction to have traditional formwork setup, placing, and/or
consolidation. Using such an innovative technology can significantly alter the way society
constructs today, facilitating immense time and cost savings in construction and opening a new
door for innovation in structural concrete design and construction.
The 3D printing process employs an additive manufacturing (AM) process whereby products are
built from a digital model on a layer-by-layer basis. The first application of 3D printing
technology for concrete construction can be dated to 1998 when Khoshnevis introduced a
technique termed contour crafting to build a structural component layer-by-layer using a crane
and a robotic arm (Khoshnevis and Dutton 1998, Khoshnevis 2004). Since then, various types of
houses, bridges, and architectural elements have been built using layer-by-layer 3D printing
methods, also called additive manufacturing (Sevenson 2015, Malaeb et al. 2015, ArchDaily
2017, Massachusetts Institute of Technology 2017).
Recently, applications of 3D concrete printing technology have been extended to transportation
infrastructure. In 2017, the world’s first 3D printed pedestrian bridge (12 m long by 1.75 m
wide) was constructed using microfiber-reinforced concrete in the urban park of Castilla-La
Mancha, Madrid, Spain (Institute for Advanced Architecture of Catalonia 2017). In 2018, two
robots completed a 3D printed steel bridge with a span for the Amsterdam Canal (Block 2018).
In the US, the U.S. Marine Corps 3D printed a 500 ft2 concrete barrack room at the U.S. Army
Engineer Research and Development Center in Champaign, Illinois, in only 40 hours (Rogers
2018). Later, the U.S. Marines successfully 3D printed the first reinforced concrete bridge in the
US at Camp Pendleton, California, within only 14 hours (Harkins 2019). In 2019, the world’s
largest 3D printed concrete bridge (26.3 m long by 3.6 m wide) was completed in Shanghai,
China, which was built within 420 hours (Ravenscroft 2019).
In spite of exploratory applications, 3D concrete printing technology remains fragmentary, and
its full-scale uses in transportation infrastructure are still rarely seen. In order to bring the full
benefits of this technology to the construction industry, it still requires a much better
understanding of the relationships among digital design (e.g., automation for complicated
structures), operation/processing (e.g., optimization of printer setup and printing procedure),
mechanisms of build (e.g., requirements for extrudability and shape stability), formulation of
printing materials (e.g., mixture proportioning for adequate workability and solidification
behavior), and performance of printed products (e.g., strength and durability). The present study
2
aimed at exploring the feasibility of developing 3D printable concrete mixtures and evaluating
their potential uses for transportation infrastructure.
1.2 Objectives
The goal of the present study was to apply 3D concrete printing technology to transportation-
related infrastructure. The specific objectives of this projects were as follows:
Develop a printable 3D concrete printing mixture using materials commonly available in
Iowa
Better understand the requirements of 3D printing technology for concrete mixture behavior
Characterize the 3D printed concrete properties and evaluate the potential of 3D printed
concrete for the field of transportation engineering
1.3 Scope and Tasks
To accomplish the above-mentioned goal and objectives, the main scope of this project was set
to develop and evaluate printable concrete mixtures using available concrete materials and a
commercial 3D printer. The following major tasks were performed:
Task 1: Literature review – A literature review was conducted covering 3D printing methods,
equipment, materials, processes, and characterizations of printed products.
Task 2: 3D printer selection – Based on the literature review results, a laboratory-scale concrete
printer was selected, purchased, and used in the project.
Task 3: Design of 3D concrete printing mixtures – Based on the literature review results,
several sets of paste and mortar mixes were designed with various materials, water-to-
binder (w/b) ratio, and additives/admixtures. These mixes were evaluated according to
Task 5.
Task 4: Design of 3D printing objects – Commonly used computer software was employed to
automate simple 3D objects, like cylinders and prisms, which were then cut to form
cubes and beams for mechanical property and microstructure evaluations.
Task 5: Characterization and performance evaluation of 3D printed concrete – The
characterizations and evaluations were focused on fresh concrete mixtures, which
included flowability, printability, and buildability or shape stability). The key
engineering properties (e.g., compressive sand flexural strength and anisotropic
behavior) of the printed samples were also evaluated in comparison with the mold-cast
samples.
Task 6: Data analysis – In addition to compiling all testing data, the effects of key mix design
parameters, e.g., w/b ratio and additive/admixture content, on properties of printed
concrete were identified. The criteria for accepting the 3D concrete printing mixes and
the feasibility of using 3D concrete printing for structural components were considered.
Task 7: Final project report – This final project report includes a summary of the literature

3
review, details on concrete mix proportions, test methods, and performance properties
of printed concrete. It also includes the conclusions from the data analysis as well as
recommendations for extended studies and potential transportation applications of 3D
concrete printing technology in the field of transportation engineering.

4
2. LITERATURE REVIEW
2.1 General Information on 3D Concrete Printing
As mentioned previously, 3D concrete printing technology was first reported in 1998, when Dr.
Khoshnevis at the University of Southern California (USC) printed a concrete wall component
using an AM process with a contour crafting system (Khoshnevis and Dutton 1998). Since then,
many applications of 3D concrete printing technology have been reported. Although still in its
infancy stage, studies of 3D concrete printing have been rapidly extended to the printing of
reinforced concrete, fiber-reinforced concrete, high-performance concrete, and prestressed
concrete over the past couple of years (Ogura et al. 2018).
In principle, a 3D concrete printing process uses 3D modeling software that slides and represents
the object to be printed as a series of two-dimensional (2D) layers and exports the data to a
printing machine, which prints the object layer-by-layer directly onto targeted areas. There are
several approaches to conduct a 3D printing process. One is a contour crafting process, where
nozzles are used to extrude concrete materials for printing, and trowels are used to shape the
printed layers, thus creating smooth and accurate planar and free-form surfaces. Another is a
modern 3D printing process, where only a print head is used for concrete deposition/extrusion
(Zhang et al. 2019). The modern 3D printer is simple and easy to operate, and it is commonly
used and can provide more opportunities for concrete mix design studies.
2.2 Key Properties of 3D Printing Concrete
Research has indicated that in addition to the proper printing equipment and automation design
tools, a core requirement for a successful 3D printed concrete project is a desirable and robust
“ink,” i.e., an engineered concrete mixture. Presently, most 3D concrete mixtures are designed
by trial and error, and the performance of the mixtures depends largely upon the equipment used
(nozzle size and applied pressure) as well as the configurations and dimensions of the objects to
be printed. Optimization of the concrete mixtures is now mainly based on early age concrete
properties, such as flowability, extrudability, printability, buildability, and open time. Table 2.1
shows the key properties of 3D printable concrete defined in several studies.

5
Table 2.1. Definition of key properties in 3D printing concrete
Properties Definition Ref.
Flowability The level of ease of moving a printing material from a
mixer (via a storage tank) to the nozzle of a printer Malaeb et al. 2015
Extrudability The ability for material to be extruded out of the
nozzle of a printer smoothly and consistently Wu et al. 2016
Printability The ease, consistency, and reliability of deposition of a
printing material through a deposition device Lim et al. 2012
Buildability The ability of a printed filament to maintain its shape
under the weight of subsequently printed layers during
and after the printing process
Soltan and Li 2018
Open time The period of time in which the workability is
consistent within certain tolerances acceptable for 3D
printing
Lim et al. 2012
It should be noted that the requirements for flowability, printability, extrudability, buildability,
and open time of 3D printable concrete mixtures vary with the features of the printer used and
the objects to be printed, and they also differ with printing parameters (deposition distance,
extrusion speed, and printing speed) and printing procedure (loading of printing material and
design of printing paths) used. Therefore, 3D printing concrete mixtures should be designed and
adjusted to fit these features, parameters, and procedures. Among the properties listed in Table
2.1, extrudability and buildability are the most important, but they are inherently in conflict.
Good extrudability requires certain flowability, while good buildability demands a high
resistance to flow or deformation. However, for successful 3D concrete printing, both properties
must be achieved at the same time.
2.3 Materials and Mix Proportions of 3D Printing Concrete
In order to develop a mix design for 3D printable concrete, a wide variety of mix proportions has
been reported, and Tables 2.2 and 2.3 show the frequency of w/b and sand-to-binder (s/b) ratios
used in different mix designs used in studies.
Table 2.2. Frequency of w/b ratios used in studies on 3D printing concrete
w/b Frequency (%)
w/b <0.2 0.3
0.2 < w/b < 0.3 23.3
0.3 < w/b < 0.4 37.5
0.4 < w/b < 0.5 17.7
0.5< w/b 11.2

6
Table 2.3. Frequency of s/b ratios used in studies on 3D printing concrete
s/b Frequency (%)
s/b <0.5 4.3
0.5 < s/b < 1.0 10.8
1.0 < s/b < 1.5 41.5
1.5 < s/b < 2.0 19.8
2.0 < s/b < 2.5 21.2
2.5 < s/b 2.4
The most frequently used w/b ratio was 0.30–0.40, and 0.20–0.30 was the second most
frequently used in mix proportions for 3D printable concrete, as shown in Table 2.2. This could
be due to the fact that a low w/b ratio could accelerate the cement hydration and reduce empty
spaces in a cementitious matrix after water evaporates. These low w/b ratios inevitably require
the usage of a superplasticizer that attaches on the surface of particles and leads to well-dispersed
cementitious materials. This is because 3D printable concrete should have high flowability to be
transported through the delivery system and smoothly extruded.
It has been reported that the s/b ratio affects the rheological and mechanical properties of 3D
printable concrete; the frequency of s/b used in studies on the 3D printing concrete was presented
previously in Table 2.3. The most frequently used s/b ratio was 1.0–1.5, and s/b ratios of 1.5–2.0
and 2.0–2.5 were also frequently used in mix designs of 3D printable concrete. The mixture with
a high s/b generally has high yield stress or low flowability due to high interparticle friction
(Ogura et al. 2018, Zhang et al. 2019).
2.4 Effects of Other Cementitious Materials and Additives
In order to achieve fast stiffness and strength development for buildability, geopolymers and
different types of cement, such as rapid-setting cement, calcium aluminate cement (CAC), and
calcium sulfoaluminate cement (CSA), have been used (Soltan and Li 2018, Khalil et al. 2017,
Ma et al. 2018).
Supplementary cementitious materials (SCMs), such as fly ash and silica fume, have been widely
employed in 3D printing concrete, as they significantly affect the properties of 3D printable
concrete.
Additives, like limestone powder and gypsum, have been used to enhance the performance of 3D
printing concrete The effects of some SCMs and additives on the key properties are presented in
Table 2.4.

7
Table 2.4. Effects of SCMs on the properties of 3D printing concrete
Materials Effects Ref.
Fly ash To enhance flowability and maintain consistent
viscosity with increased time
Lee et al. 2018,
Ahmaruzzaman 2010
Silica fume To accelerate cement hydration and increase yield
stress and viscosity
Ma et al. 2017,
Benaicha et al. 2015
Limestone
powder
To densify the microstructure and control the
hydration of cementitious paste
Bentz et al. 2019,
Oey et al. 2013
Gypsum To accelerate the setting behavior Vaitkevičius et al. 2018,
Kovler 1998
The spherical shape of fly ash can enhance the flowability of 3D printable concrete by the ball
bearing effect, and this leads to decreased water requirements for a given slump. According to
Lee et al. (2018), mixtures with 30% of fly ash led to only a 2% reduction in viscosity; whereas,
ordinary portland cement (OPC) showed a 32% reduction in viscosity. This result indicates that
the open time for 3D printable concrete can be extended by using fly ash in the mix design.
Silica fume has been widely used in different types of concrete, since it can increase the
segregation resistivity and early strength. Due to its very fine particle size and large surface area,
it accelerates the cement hydration and fills fine gaps in a cementitious matrix (Mehdipour and
Khayat 2017). In addition, the large surface area of silica fume leads to high water absorption
and the formation of flocculation structures in the cement matrix; thus, it increases the yield
stress and viscosity (Benaicha et al. 2015, Mehdipour and Khayat 2017).
Limestone powder is widely used in concrete, and especially in self-consolidating concrete. It
has been reported that limestone powder can influence concrete performance through filler,
nucleation, and chemical effects (Berodier and Scrivener 2014). The filler effect leads to a
densified microstructure. The nucleation effect accelerates cement hydration (with the chemical
effort, forming hemi- or mono-carboaluminates by reacting with aluminates in cement,
stabilizing ettringite, and further reducing porosity of cement matrix) (Wang et al. 2018).
Gypsum is normally added into cement during the clinker grinding process to control the setting
behavior of cement. According to Vaitkevičius et al. (2018), the final set time was decreased
from 20 to 16 min when the gypsum-to-cement ratio increased from 20% to 60%. Caution should
be taken when gypsum is used to control setting. Dosage is very dependent on cement chemistry,
and negative side effects such as flash/false set and even later expansions can be significant.
2.5 Effects of Admixtures
Various admixtures have been explored to enhance the rheological properties of 3D printable
concrete, and it is crucial to balance the two conflicting rheological properties: high flowability
and high thixotropy. As a result, most 3D printable concrete contains both superplasticizer and

8
viscosity modifying agents (VMAs). In addition, accelerator and retarder have been used, and the
detailed effects of these materials are presented in Table 2.5.
Table 2.5. Effects of admixtures on the properties of 3D printing concrete
Materials Effects Ref.
VMAs To improve dimension stability and
segregation resistance
Kazemian et al. 2017
Superplasticizer To enhance flowability Mardani-Aghabaglou et al. 2013,
Chandra and Björnström 2002
Accelerator To accelerate setting behavior and
enhance buildability
Malaeb et al. 2015,
Le et al. 2012a
Retarder To delay setting behavior and extend
open time
Malaeb et al. 2015,
Zhang et al. 2018
VMAs have been increasingly used in self-consolidating concrete (SCC) due to their unique
properties, such as enhancements in segregation resistance. and water retention. VMAs can be
divided in to two groups: inorganic and organic. Nanoclay and nanosilica are the most
representative materials in inorganic VMAs. Natural or synthetic polymers are included in
organic VMAs. One of the organic VMAs, hydroxypropyl methylcellulose (HPMC), has been
reported in several studies (Zhi et al. 2018).
As mentioned previously, a low w/b ratio has been preferred by most 3D concrete printing
studies. In addition to an increase in concrete strength, a low w/b concrete also provides a high
yield stress for the concrete to hold its shape after being extruded. However, before being
extruded out, concrete mixtures must be sufficiently flowable to be placed into a printer and
extruded out easily. Therefore, the use of a superplasticizer is often necessary in a 3D printable
concrete mixture. It should be noted that extensive usage of a superplasticizer can also lead to the
retardation of cement hydration, since the polymers in a superplasticizer attach onto the surface
of cement particles and prevent them from reacting with water (Leemann and Winnefeld 2007).
An accelerator speeds up cement hydration and results in early setting and early strength
development of concrete. Accelerators have been widely used in concrete repair, which requires
the fast evolution of mechanical properties. In 3D printing concrete use of an accelerator helps
freshly extruded concrete to hold its shape, thus, increasing buildability. There is a concern that
use of an accelerator may decrease the extrudability due to the fast cement hydration . To
overcome this shortage, Maleab et al. (2015) added an accelerator right before extrusion and
found its effect on the flowability was minor, although the cement hydration was enhanced.
It has been reported that the usage of a retarder significantly affected both flowability and
buildability depending on the dosage. According to Zhang et al. (2018), the mixture with retarder
showed the lowest loss of flowability among samples, and it led to extended open time. The
effects of retarder on the mechanical properties of 3D printable concrete were found in the study
by Le et al. (2012b), and it indicated that use of more than 1% (by weight of binder) of retarder

9
decreased the early compressive strength; however, its effect on later mechanical properties was
minimal.

10
3. INITIAL TRIAL OF 3D PRINTING
The initial trial tests were performed while the research team was waiting for the delivery of a
commercial 3D concrete printer. Therefore, instead of a 3D printer, a plastic syringe was used to
print objects manually and to simulate a 3D printing process. The objective of the initial trial for
3D printing was to get familiar with the behavior of pastes made with different materials and mix
proportions and to select mix candidates for the commercial 3D concrete printer.
3.1 Materials
Materials for 3D printing concrete used in this study included cementitious materials and
chemical admixtures. The types and source of these materials are listed in Table 3.1.
Table 3.1. Materials and their sources
Materials Type Source
Cementitious materials
Portland cement Type I/II Ash grove
Silica fume Eucon MSA Euclid
Chemical admixtures
VMA Vmar-3 GCP Applied
Technologies
Superplasticizer (SP) Eucon 1037 Euclid
3.1.1 Cementitious Materials
Cementitious materials used in this study include Type I/II portland cement and silica fume.
Their chemical compositions are presented in Table 3.2.
Table 3.2. Chemical composition of cementitious materials
Oxides (%)
Raw materials
Portland
cement Silica fume
SiO2 20.1 97.10
Al2O3 4.4 0.20
Fe2O3 3.1 -
SO3 2.8 0.25
CaO 64 0.81
MgO 2.22 0.13
Na2O 0.14 0.17
K2O 0.58 0.80

11
3.1.2 Chemical Admixtures
Two different admixtures, a VMA and superplasticizer, were used to prepare a 3D printable
paste for the initial trial.
3.2 Mix Design and Procedure
Table 3.3 shows the mix proportions of the initial trial tests for 3D printing concrete using a
plastic syringe.
Table 3.3. Mix proportion for initial trial
Mix ID w/b Cement Silica fume
VMA
(binder %)
Superplasticizer
(binder %)
C100-V0.5-SP0.5 0.30 100 - 0.5 0.5
C100-V1.0-SP0.5 0.30 100 - 1.0 0.5
C100-V1.5-SP0.5 0.30 100 - 1.5 0.5
C100-V1.0-SP0.75 0.30 100 - 1 0.75
C100-V1.0-SP1.0 0.30 100 - 1 1
C100-V1.0-SP1.25 0.30 100 - 1 1.25
C97.5-SF2.5-V0.5-SP1.0 0.30 97.5 2.5 0.5 1
C97.5-SF2.5-V1.0-SP1.0 0.30 97.5 2.5 1 1
C97.5-SF2.5-V1.0-SP1.25 0.30 97.5 2.5 1 1.25
The sum of binder (cement+silica fume) is 100. The Mix IDs describe the proportion of cement (C), silica fume
(SF), VMA (V), and superplasticizer (SP) for each test.
All the dry powder (cement and silica fume) was mixed for 3 min to prevent the agglomeration
of particles, and then half the water and all the superplasticizer were added and mixed for 1 min.
Then, the rest of water and VMA were added and mixed for 1 min. Finally, the complete
mixtures were mixed for 3 min. The total mixing time was 8 min including the dry mix.
3.3 Printing Procedure and Test Methods
A plastic syringe was used to print the 3D printable paste to simulate the real 3D printing
process. The pastes were poured into the syringe, and hand-tamping was conducted to eliminate
air bubbles in the syringe. Then, based on the printing path shown in Figure 3.1b, the mixtures
were printed with a constant speed.

12
(a) Plastic syringe (100 ml) (b) Printing path
Figure 3.1. Syringe and printing path
When the mixtures could not be extruded or the printed layers started to be deformed, the
printing process was stopped. Then, a visual inspection was conducted to check the printing
qualities of the printed samples.
3.4 Test Results
Figure 3.2 shows the effects of the VMA dosage has on the printing qualities.
(a) C100-V0.5-SP0.5 (b) C100-V1.0-SP0.5 (c) C100-V1.5-SP0.5
The Mix IDs describe the proportion of cement (C), VMA (V), and superplasticizer (SP) for each test.
Figure 3.2. Effects of VMA on the 3D printing by syringe
As the dosage of VMA increased, the mixture became more difficult to be extruded from the
syringe because the flowability of the mixture decreased with the increased viscosity as the
VMA dosage increased. Therefore, extrudability decreased, and the total number of deposited
layers eventually decreased.
Figure 3.3 illustrates the effects of superplasticizer on the printing qualities.

13
(a) C100-V1.0-SP0.75 (b) C100-V1.0-SP1.0 (c) C100-V1.0-SP1.25
The Mix IDs describe the proportion of cement (C), VMA (V), and superplasticizer (SP) for each test.
Figure 3.3. Effects of superplasticizer on the 3D printing by syringe
Compared to the C100-V1.0-SP0.5, Figure 3.3a shows that the layers could not hold their shape
right after extrusion, and the bottom layers started to widen. As the dosage of superplasticizer
increased, it was easier to extrude the mixtures through the syringe, since the superplasticizer
enhanced the flowability of the mixtures. However, the extruded layers could not hold their
shape and resist the weight of the following deposited layers, and it led to collapse. Although
Figure 3.3c shows more deposited layers, it collapsed inside, such that a larger number of layers
seemed to be stacked.
In order to improve the shape stability of the mixtures, 2.5% of the cement was replaced by silica
fume. Figure 3.4 shows the effects of chemical admixtures (VMA and superplasticizer) on the
printing qualities of mixtures with silica fume.
(a) C97.5-SF2.5-V0.5-SP1.0 (b) C97.5-SF2.5-V1.0-SP1.0 (c) C97.5-SF2.5-V1.0-SP1.25
The Mix IDs describe the proportion of cement (C), silica fume (SF), VMA (V), and superplasticizer (SP) for each
test.
Figure 3.4. Effects of chemical admixtures on the printing qualities of mixtures with silica
fume
Compared to the C100-V1.0-SP1.0 test in Figure 3.3b, the C97.5-SF2.5-V1.0-SP1.0 sample in
Figure 3.4b shows the usage of 2.5% silica fume significantly enhanced the buildability (shape
stability). However, when the dosage of superplasticizer increased from 1.0% to 1.25%, the
shape stability of the printed layers decreased, and the total number of deposited layers also
decreased due to the wideness at the bottom layers.

14
During the printing process, one of the biggest problems was pop outs, and several samples
demonstrated this problem as shown in Figure 3.5.
(a) C100-V0.5-SP0.5 (b) C100-V1.0-SP0.5
The Mix IDs describe the proportion of cement (C), VMA (V), and superplasticizer (SP) for each test.
Figure 3.5. Pop outs by air bubbles in the syringe
This defect happened frequently when air bubbles were created in the syringe. The entrapped air
bubbles in the syringe came out of the nozzle, and it damaged the printed layers and discontinued
the printing process. As discussed later, a similar problem also occurred when a commercial 3D
printer was used for printing.
3.5 Summary
In this chapter, it was confirmed that the usage of VMA and superplasticizer had great impacts
on printability. The VMA enhanced the viscosity of paste printing mixtures. However, it
eventually decreased extrudability if the dosage was too high. Conversely, the superplasticizer
increased the flowability and extrudability. However, if the dosage of superplasticizer was too
high, the printed layers could not hold their shape and were deformed by the weight of
subsequent deposited layers. Those test results indicated that it is essential to balance the dosage
of materials to have proper flowability, extrudability, and printability.
In addition, it was observed during experiments that air bubbles came out of the nozzle and
broke the layers. It is possible that air bubbles were created when the mixtures were placed into
the syringe and came out of the nozzle due to the extrusion. This problem would be handled with
suitable methods in the future tests.

15
4. PRINTER SELECTION AND PRINTING PARAMETER STUDY
4.1 Introduction of 3D Printer
A 3D pottery printer (3D plotter 7) was selected and used to print clay and concrete in this study,
and it was selected to achieve a balance between its functionality and cost. Figure 4.1 shows
photographs of the printer.
(a) 3D printer without mounting extruder (b) 3D printer with mounting extruder
(c) 3D printing process (d) Interface of 3D printer
Figure 4.1. 3D printer used in this study
The plotter had dimensions of 73.66 cm (wide), 81.28 cm (long), and 91.44 cm (high), and the
maximum height is 195.5 cm when the extruder is fully extended. A platform moves along an x-
and y-axis, and an extruder moves along a z-axis. An important feature of the printer is that users
can control the extrusion and printing speed by using the interface shown in Figure 4.1d.

16
4.2 Printing Parameter Study
4.2.1 Overview
Before printing concrete, clay printing was conducted to get familiar with the new 3D printer. In
addition to the operation, clay possesses less time-dependent behavior than concrete, since
concrete sets significantly faster than clay. The tests with clay indicate that the printer is easy to
use and convenient to control the overall printing process and investigate the effects of the
printing parameters by conducting actual printing processes without wasting materials.
4.2.2 Materials
A commercial pottery clay (PRAI 3D) was used in this study, and its physical and chemical
properties are presented in Table 4.1.
Table 4.1. Physical and chemical properties of clay
Water
content (%)
Plasticity
(IP Atterberg)
Carbonate
content (%)
Drying
shrinkage (%)
Porosity at
Cone 10
Clay 25.42 16 0 8.5 0
4.2.2 Printing Parameters
Among many printing parameters including printing speed, extrusion speed, infill rates, nozzle
size and shape, printer type, stand-off distance, etc., two printing parameters (printing speed and
extrusion speed) were selected for testing a variety of settings, and the other parameters were
fixed in order to assess the effects of those specific printing parameters on the printing qualities.
Table 4.2 shows the detailed printing parameters.
Table 4.2. Printing parameters for clay printing
Mix ID
Printing
speed
(mm/s)
Extrusion
speed
(mm/s)
Nozzle
diameter
(mm)
Infill
rate
(%)
Layer
thickness
(mm)
Stand-off
distance
(mm)
P30-E90 30
90
5 0 1.6 1.6
P60-E90 60
P90-E90 90
P60-E45 60
45
P60-E135 135
Default values for printing and extrusion speed were set at 60 and 90 mm/s, respectively. The Mix IDs describe the
differing printing speeds (P), mm/s, and extrusion speeds (E), mm/s.

17
Three different printing speeds (30, 60, and 90 mm/s) and extrusion speeds (45, 90, and 135
mm/s) were set, respectively. A circular nozzle was used, and its diameter was 5 mm. Layer
thickness and stand-off distance were set at 1.6 mm. Total printing time was limited to 1 min in
order to use the same batch material to print three objects using three different printing speeds.
In addition to the effects of printing and extrusion speed on the printing qualities, infill rate was
also selected for further study. Three different infill rates (0%, 60%, and 80%) were set, and the
other parameters were fixed. Layer thickness and stand-off distance were set to 2 mm (Table
4.3).
Table 4.3. Printing parameters for clay printing
Mix ID
Infill
rate
(%)
Printing
speed
(mm/s)
Extrusion
speed
(mm/s)
Nozzle
diameter
(mm)
Layer
thickness
(mm)
Stand-off
distance
(mm)
IR0 0
30 38.5 5 2 2 IR60 60
IR80 80
The Mix IDs describe the varying infill rates (IR).
As shown in Figure 4.2b, a cylindrical object, with the dimensions of 40 mm in height and 80
mm in diameter, was printed with different infill rates.
(a) 3D modeling for effects of printing speed
and extrusion speed (a) 3D modeling for effects of infill rates
Figure 4.2. 3D modeling images
4.2.3 Printing Procedure and Test Methods
Clay was manually poured into the extruder and it was mounted on the printer shown in Figure
4.1. Before starting to print an object, initial layers were printed to check the extrudability of
clay. After confirming the extrudability, the object printing process started based on the printing
parameters set.

18
After finishing printing, layer width was measured by a ruler three times, and the average value
was used as a test result. In addition, the overall shape of the printed objects was inspected
visually.
4.2.4 Test Results
Figure 4.3 shows the effects of different printing speeds on the printing qualities.
Side
view
Top
view
(a) P30-E90 (b) P60-E90 (c) P90-E90
The Mix IDs describe the differing printing speeds (P), mm/s, and extrusion speeds (E), mm/s.
Figure 4.3. Effects of different printing speeds on the printing qualities
As printing speed increased from 30 mm/s to 90 mm/s, the height of the printed objects
increased, since the printer head moved faster, and the extruder extruded more clay in the given
time. Also, the layer width also increased as shown in Figures 4.3 and 4.5. This was because
more clay was extruded than the setting, and as the number of printed layers increased, the
amount of over-extruded clay also increased leading to the wider layer width.
Figure 4.4 illustrates the effect of different extrusion speeds on the printing qualities.

19
Side
view
Top
view
(a) P60-E45 (b) P60-E90 (c) P60-E135
The Mix IDs describe the differing printing speeds (P), mm/s, and extrusion speeds (E), mm/s.
Figure 4.4. Effects of different extrusion speeds on the printing qualities
As the extrusion speed increased from 45.8 mm/s to 137.5 mm/s, the layer width was
significantly increased, as shown in Figures 4.4 and 4.5. Also, the height of printed samples
increased with increased extrusion speed. In addition to the geometry, the printing qualities of
the objects’ surface decreased as extrusion speed increased. It’s possible this is because as the
extrusion speed increased, excessive clay was extruded, which led to increased layer geometries
(width and height) and poor printing qualities. Figure 4.5 shows the effects of printing and
extrusion speed on the layer width.
Figure 4.5. Effects of printing speed and extrusion speed on the layer width
It was found that both printing and extrusion speed affected the layer width, and the extrusion
speed had more impact on the geometry of the printed objects than the printing speed. This result
indicated that the combination of printing and extrusion speed was essential to print objects. As

20
shown in Figure 4.4a, the object printed with 60 mm/s printing speed and 45 mm/s extrusion
speed was considered as the best printed sample. When the extrusion or printing speed changed,
the overall printing quality deteriorated.
Figure 4.6 shows the effects of infill rates on the printing qualities.
Side
view
Top
view
(a) IR0 (b) IR60 (c) IR80
Mix IDs describe the varying infill rates (IR)
Figure 4.6. Effects of infill rates on the printing qualities
When the infill rate was set at 0%, there was no extruded clay in the printed sample, which
looked like a hollow column. However, as the infill rate increased, the inside of the printed
samples was filled with clay. This indicated that infill rate directly affected the density of the
printed samples, and the infill rate should be set at 100% in order to print a solid column.
There were some problems during the printing process, which also had been noticed in the initial
trial tests with the syringe. Air bubbles were found in several spots such as in the middle of
printed layers and in the extruder. When the size of the air bubble was small, there was no
significant defect in the printing qualities as shown in Figure 4.7a.

21
(a) Small air bubbles (b) Big air bubbles
Figure 4.7. Problems during clay printing process
However, when the size was big enough, the air bubble popped out of the printer nozzle and
destroyed the printed layers as shown in Figure 4.7b. These results indicated that the ability to
control the creation of air bubbles was as important as the printing parameters.
4.3 Summary
In this chapter, the printing parameters were investigated, and the research team found those
settings significantly affected the printing qualities including the geometry of printed objects.
Among various printing parameters, printing speed and extrusion speed were selected to test
various rates, and other parameters were fixed. It was observed that layer width widened with
increased printing and extrusion speed, and extrusion speed affected the layer width more than
printing speed Therefore, it is essential to find the best combination of printing parameters. In
addition to the printing parameters, it was also found that infill rates could affect the printing
qualities. As the infill rates increased, the density of objects increased since the inside space was
filled with clay.
As mentioned in the previous chapter, air bubbles were observed during clay printing. Normally,
clay has higher viscosity than concrete, and it was more difficult to eliminate air bubbles when
clay was poured into the extruder. Thus, bigger bubbles were created in the extruder, and they
destroyed the printed layers when they came out of the nozzle. The findings indicated that
suitable methods to eliminate air bubbles should be considered when concrete is used to print.

22
5. 3D PRINTING CONCRETE MIX DESIGN AND OPTIMIZATION
From the initial trial tests as described in Chapter 3, Figure 3.4b indicates that Mix C97.5-SF2.5-
V1.0-SP1.0, which is made with 97.5% portland cement, 2.5% silica fume, 1% VMA, and 1%
superplasticizer, showed good performance in terms of extrudability and buildability for 3D
printing. However, when the 3D pottery printer was used, this mix proportion had to be re-
adjusted to be able to be easily placed in the printer, extruded out consistently, and hold its shape
during and after printing. VMA and superplasticizer were used for the flowability adjustment.
However, it was found that uniformity in the printable mixtures was difficult to achieve as slight
differences in the mixture’s flowability and stiffening behavior could lead to quite different
properties of printing concrete.
In addition to VMA and superplasticizer, an accelerator appeared necessary for a mixture to
develop stiffness rapidly to carry the weight of subsequent concrete layers without distortion. To
simplify the mix design procedure, the researchers of this project decided to use a highly
flowable, rapid-set grout as a partial cement replacement to adjust the extrudability and
printability of the 3D printing concrete mixtures, instead of trying various admixtures (VMA,
superplasticizer, and accelerator/retarder). The results from the use of a grout to develop 3D
printable concrete mixtures are presented in the following sections.
5.1 Materials
Cementitious materials used in this study included Type I/II portland cement, silica fume, and a
highly flowable, rapid-set grout. The chemical composition of portland cement and silica fume
are presented in Table 3.2. The grout was a commercial product from China, which was used in a
previous Iowa Highway Research Board (IHRB) research project (TR-708B). It consisted of
calcium sulfoaluminate cement, fine sand, and various additives. Fluidity and setting time of
grout are presented in Table 5.1, and the strength development of grout is shown in Figure 5.1.
Table 5.1. Fluidity and setting time of grout
Material
Fluidity (s) Setting time (min)
0 min 30 min Initial Final
Grout 15 18 120 150

23
(a) Compressive strength (b) Flexural strength
Wang and Hong 2019, Institute for Transportation
Figure 5.1. Strength development of grout used
Detailed information on this grout can be found in Wang and Hong (2019) and Hong et al.
(2019). A small amount of additional VMA and superplasticizer were also used to adjust the
segregation resistance and flowability of the 3D printing mortar.
5.2 Mix Proportions and Mixing Procedure
Different types and dosages of materials were used to develop 3D printable concrete/mortar
mixtures, and the mix proportions studied are presented in Table 5.2.
Table 5.2. Mix proportion for 3D printable concrete
Mix ID w/b Cement
Silica
fume Grout
VMA
(binder %)
Superplasticizer
(binder %)
V0-SP1.00 0.30 97.5 2.5 - - 1.00
V1.00-SP1.00 0.30 97.5 2.5 - 1.00 1.00
V1.00-SP1.25 0.30 97.5 2.5 - 1.00 1.25
V1.25-SP1.25 0.32 97.5 2.5 - 1.25 1.25
V1.50-SP1.25 0.32 97.5 2.5 - 1.50 1.25
V1.75-SP1.25 0.32 97.5 2.5 - 1.75 1.25
G20-SP1.25 0.32 77.5 2.5 20 1.50 1.25
G20-SP1.25 0.32 67.5 2.5 30 1.50 1.25
G30-SP0.30 0.32 67.5 2.5 30 1.50 0.30
0.28-G20 0.28 77.5 2.5 20 1.50 -
0.30-G20 0.30 77.5 2.5 20 1.50 -
0.32-G30 0.32 77.5 2.5 20 1.50 -
The sum of binder (cement+silica fume+grout) is 100. The Mix IDs describe the proportion of VMA (V),
superplasticizer (SP), grout (G), and w/b for each test.

24
All mixtures were fabricated at the Portland Cement Concrete Pavement and Materials Research
Laboratory (PCC Lab) at Iowa State University (ISU). For uniform dispersion, raw materials
were first dry-mixed for 5 min using a Hobart mixer. Then, half the water and all of the
superplasticizer were added into the mixture and mixed for 1 min. Next, the remaining half of the
water and all of the VMA were added into the mixture and mixed for another 1 min. Next, the
mixture rested for 1 min while the residuals were scraped off the surfaces of the mixing blade
and bowl. Finally, the mixture was mixed for another 3 min. Thus, the total mixing time was 11
min including 1 min of rest.
5.3 Printing Parameters and Procedure
A cylindrical object (60 mm in diameter and 120 mm in height) was designed by AutoCAD and
saved in a structure file (.str). Then, using the Simplify3D software, which is a slicer program,
the object was sliced into several layers shown in Figure 5.2.
Figure 5.2. 3D modeling image
Detailed printing parameters used in this study are presented in Table 5.3.
Table 5.3. Printing parameters for concrete printing
Printing
speed
(mm/s)
Extrusion
speed
(mm/s)
Nozzle
diameter
(mm)
Layer
thickness
(mm)
Stand-off
distance
(mm)
Mixing
time
(minutes)
Starting
time
(minutes)
Concrete
printing 12 61.5 6.5 3 3 11 45
After completion of the printing process, the printed objects were immediately covered by a
plastic cover and a plastic sheet for 6 hours to prevent water evaporation (Figure 5.3).
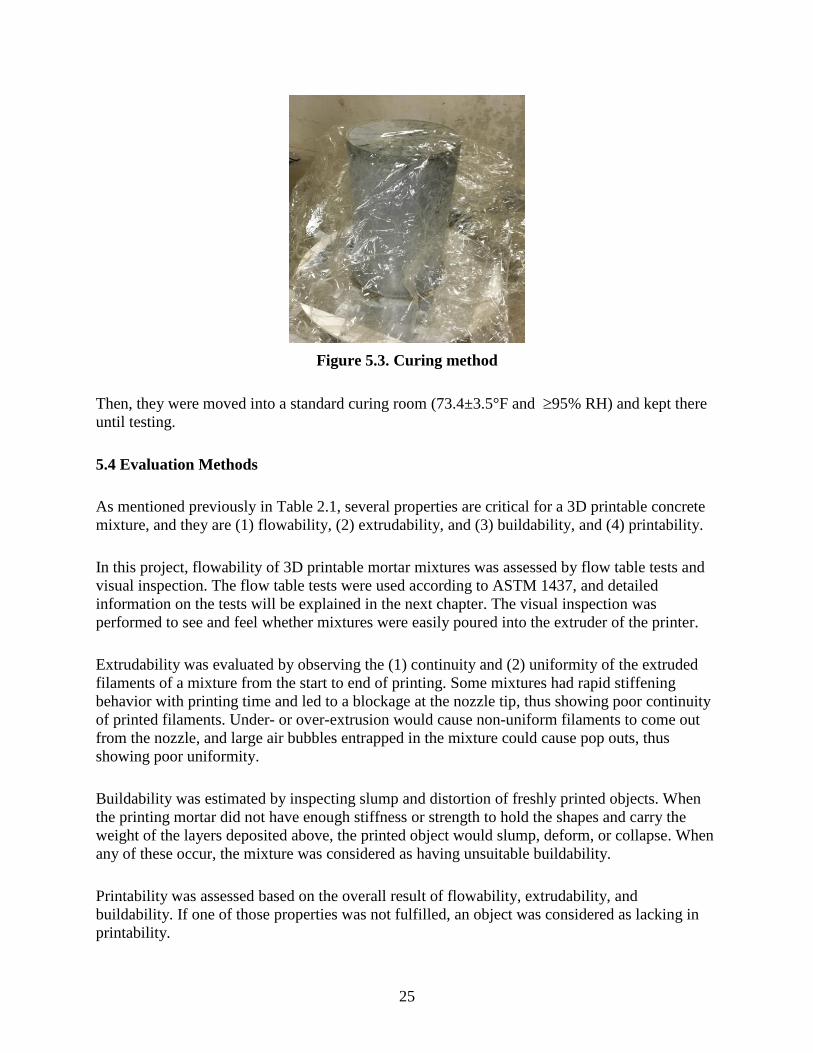
25
Figure 5.3. Curing method
Then, they were moved into a standard curing room (73.4±3.5°F and 95% RH) and kept there
until testing.
5.4 Evaluation Methods
As mentioned previously in Table 2.1, several properties are critical for a 3D printable concrete
mixture, and they are (1) flowability, (2) extrudability, and (3) buildability, and (4) printability.
In this project, flowability of 3D printable mortar mixtures was assessed by flow table tests and
visual inspection. The flow table tests were used according to ASTM 1437, and detailed
information on the tests will be explained in the next chapter. The visual inspection was
performed to see and feel whether mixtures were easily poured into the extruder of the printer.
Extrudability was evaluated by observing the (1) continuity and (2) uniformity of the extruded
filaments of a mixture from the start to end of printing. Some mixtures had rapid stiffening
behavior with printing time and led to a blockage at the nozzle tip, thus showing poor continuity
of printed filaments. Under- or over-extrusion would cause non-uniform filaments to come out
from the nozzle, and large air bubbles entrapped in the mixture could cause pop outs, thus
showing poor uniformity.
Buildability was estimated by inspecting slump and distortion of freshly printed objects. When
the printing mortar did not have enough stiffness or strength to hold the shapes and carry the
weight of the layers deposited above, the printed object would slump, deform, or collapse. When
any of these occur, the mixture was considered as having unsuitable buildability.
Printability was assessed based on the overall result of flowability, extrudability, and
buildability. If one of those properties was not fulfilled, an object was considered as lacking in
printability.

26
5.5 Test Results
Figure 5.4 shows the effects of the VMA and superplasticizer on the concrete printing.
(a) V0-SP1.00 (b) V1.00-SP1.00 (c) V1.00-SP1.25
(d) V1.25-SP1.25 (e) V1.50-SP1.25 (f) V1.75-SP1.25
The Mix IDs describe the proportion of VMA (V) and superplasticizer (SP) for each test.
Figure 5.4. Effects of VMA and superplasticizer on concrete printing
In the case of V0-SP1.00 and V1.00-SP1.00, the objects could not be printed because the
material was too flowable and too thick, respectively. When V1.00-SP1.25 was used to print, at
the beginning, the object was printed. However, as time passed, the bottom layers started to
collapse, and the overall shape was eventually distorted. Therefore, the addition of more VMAs
was required, and 1.25%, 1.50%, and 1.75% of the VMA was incorporated in the mixtures
(Figure 5.4d, e, and f). If 1.75% of the VMA was added in the mix design, the mixture was too
thick to be extruded from the nozzle, and extrudability decreased. Even though V1.50-SP1.25
seemed to be well-printed, the bottom layers widened, and the object ended up a bit slumped.

27
Figure 5.5 shows the effects of grout and superplasticizer on the printing qualities of the 3D
printed concrete objects.
(a) G20-SP1.25 (b) G30-SP1.25 (c) G30-SP0.3
The Mix IDs describe the proportion of grout (G) and superplasticizer (SP) for each test.
Figure 5.5. Effects of the grout and superplasticizer on the concrete printing
Since grout includes powder-form superplasticizer, as the replacement ratio of grout increased,
the mixtures became flowable. Therefore, when the dosage of superplasticizer decreased from
1.25% to 0.3%, with 30% of grout, the cylindrical object (Figure 5.5c) was able to be printed but
with slump.
Figure 5.6 shows the effects of the w/b ratio on the printing qualities.
(a) 0.28-G20 (b) 0.30-G20 (c) 0.32-G20
The Mix IDs describe the w/b ratio and proportion of grout (G) for each test.
Figure 5.6. Effects of w/b on the concrete printing

28
As the ratio increased, the mixtures became flowable, and 0.32-G20 offered the best mix
proportions. Although 0.30-G20 seemed to be well-printed, extrudability decreased as time
passed, and the last printed layer was not smoothly extruded, leading to the discontinuity.
Figure 5.7 shows the effects of printing speed on the printing qualities when all the printed
objects were printed with 0.32-G20, which was the best mix design based on the overall shape.
(a) 12 mm/s (b) 24 mm/s (c) 12+24 mm/s
Figure 5.7. Effects of printing speed on the printing qualities
As the printing speed doubled, the bottom layers became wide, and the overall shape was
distorted even though the same mixture was used (Figure 5.7b). It’s possible the printed layers
were not able to harden due to the increased printing speed, and the layers could not hold the
weight of the subsequent layers. When two different printing speeds (12 and 24 mm/s) were
used, the overall shape was better than only the higher printing speed (24 mm/s); however,
distortion at the bottom layers was still observed.
Several defects were identified during 3D concrete printing, and they were (a) air bubble pop
outs, (b) discontinuity, (c) slumping, and (d) cracking (Figure 5.8).

29
(a) Air bubble pop outs (b) Discontinuity
(c) Slump (d) Cracks
Figure 5.8. Problems during concrete printing process
Air bubbles were a major problem during the printing process. Under extrusion pressure, air
bubbles often popped out (Figure 5.8a), and they destroyed printed layers, or led to discontinuity
of printed layers. Air bubble pop outs were mostly observed in the mixtures having relatively
high flowability. When the mixtures had relatively low flowability, discontinuity of filaments
was often observed (Figure 5.8b). Slump of objects occurred when the flowability of the mixture
was slightly higher, and the rate of stiffening of the mixture was a little slower. Visible slump of
printed objects indicates impaired buildability (Figure 5.8c). In order to improve buildability,
most 3D printable concrete mixtures were designed to have a low w/b, which often led to a high
potential for plastic shrinkage cracking (Figure 5.8d). Prompt curing was essential to reduce
slump as well as plastic shrinkage cracks, for which all printed objects were covered with a
plastic sheet immediately after being printed and before being moved into a standard curing
room.

30
6. MIXTURE CHARACTERIZATION AND PROPERTIES OF 3D PRINTED
PRODUCTS
6.1 Overview
After the 3D printable concrete mix design tests, it was confirmed that use of grout to replace
some cement facilitated rapid development of a mixture’s stiffness and brought about better
buildability. Therefore, different replacement ratios of grout were estimated by printing a
cylindrical object. Then, the mechanical properties of a printed sample with the best mix
proportion were assessed.
6.2 Materials, Mix Proportions, and Procedure
As binder materials, portland cement, silica fume, and grout were used to prepare 3D printable
concrete. In addition, VMA and superplasticizer were added into the mixtures to enhance the
segregation resistance and flowability. Detailed information on the materials including chemical
composition and properties were presented previously in Tables 3.2 and 5.1 and Figure 5.1.
To find the best mix proportion, the weight of a percentage of cement was replaced by grout (at
rates of 0%, 10%, 20%, and 30%); Table 6.1 shows the mix proportions used in the tests.
Table 6.1. Mix proportion with different replacement ratio of grout
Mix ID w/b Cement
Silica
fume Grout
VMA
(binder %)
0.32-G00
0.32
97.5
2.5
0
1.5 0.32-G10 87.5 10
0.32-G20 77.5 20
0.32-G30 67.5 30
The sum of binder (cement+silica fume+grout) is 100% (by weight). The Mix IDs describe the w/b ratio and
proportion of grout (G) for each test.
The mixing procedure was based on the one described in the previous chapter.
6.3 Printing Parameters and Procedure
The printing parameters and procedure were based on tests from the previous chapter.

31
6.4 Test Methods
6.4.1 Fresh Concrete Properties
Flow table tests were used to measure the flowability of the mixtures based on ASTM C1437. A
conical cone was filled with a mixture, the spread diameters were measured at three different
diameters after the cone was lifted up, and the flow table was dropped 25 times. The average
value of spread diameters was used as the flowability result in this study.
In addition, the changes in flowability with increased time were assessed by measuring the
spread diameters at 0, 20, 40, and 60 min after the mortar was mixed. The printing of the
designed object could start approximately 40 min after the mortar was mixed, since the
preparation for 3D printing, including feeding mortars into the extruder, printer setup, and pre-
printing, took approximately 40 min. Moreover, the printing process took approximately 20 min
to complete the cylindrical object.
Extrudability and printability were assessed based on visual observations.
6.4.2 Mechanical Properties
Due to the unique property of the 3D printed object, which is its anisotropic behavior, the
mechanical properties were closely related to the relationship between the printing and loading
direction. Therefore, in this study, two different configurations of prisms were printed to prepare
cubic and slab samples for compressive and flexural strength tests shown in Figure 6.1.

32
(a) Prisms with two different printing directions: red and yellow squares represent cutting
area of samples for compressive and flexural strength, respectively
(b) Cubic sample for compression test (c) Slab samples for flexural h test
Figure 6.1. Sample preparation for mechanical properties
The cut cubic samples and slab samples could be loaded in two different loading directions,
perpendicular and parallel to the printing direction.
The mechanical properties were assessed at different testing ages (7 and 28 days of curing), and
Figure 6.2 shows the cut samples at 28 days.
Figure 6.2. Cut samples for mechanical properties
In addition to the cut samples from the printed samples, mold-cast samples were prepared for a
comparison. The compressive strength and flexural strength were tested based on ASTM C109

33
and ASTM C293, respectively. For each test, five cut samples were tested, and the average value
was used as the final result.
6.5 Test Results
6.5.1 Flowability
Table 6.2 shows the flow table test results of mortar mixtures performed at 0, 40, and 60 min
after completion of mixing.
Table 6.2. Results from flow table test
Mix ID
Final flow diameter (mm) at different rest time (minutes)
0 min 40 min 60 min 0–40 min 40–60 min
0.32-G00 203 197 192 6 5
0.32-G10 190 174 170 16 4
0.32-G20 220 182 176 38 6
0.32-G30 244 207 200 37 7
All mixes had a w/b of 0.32 but different amount of grout (G) replacement for cement.
The data in the table were the final flow spread (at 25 drops) values, because after 40 min rest,
the initial and final flow spread values were very close as some pastes were about to set.
Therefore, only the final flow spread results are presented here. The flowability at 0 min rest
indicates the flowability of the tested mixture at the time of being placed into the 3D printer. The
higher this flow is, the easier the mixture is placed. The flowability at 40 min rest presents the
flowability of the tested mixture at the beginning of the extrusion or printing, which is related to
extrudability and buildability. If this flow is too low, the mixture will be difficult to extrude. If it
is too high, the filament will not hold its shape. The flowability at 60 min signified the
flowability of the tested mixture at the end of the extrusion or printing.
In addition to the flowability value at each of the specified rest times, which is essential, the
differences (reductions) in flowability from 0 to 40 min and from 40 to 60 min rest times are also
important. A large flowability reduction from 0 to 40 min rest times suggests that the mixture
would be easily placed into the printer, and the filaments could be well printed out with a
uniform shape. The flowability reduction from 40 to 60 min rest times is related to open time, the
period during which the mixture is printable. The larger this reduction, the shorter the open time
of the mixture.
It can be observed from Table 6.2 that with 0 min rest, the samples containing a higher amount
of grout had a higher flowability. However, Mix 0.32-G10 (10% grout) showed a reduced flow
than Mix 0.32-G0 (no grout). This is because the grout consisted of rapid-set CSA cement and
dry-powder superplasticizer. At small dosages, the effect of CSA cement hydration, which
reduced flow, exceeded the effect of the superplasticizer, which increased flow, thus reducing the
overall flow of the mortar. After 40 min rest, the flowability of all mixtures decreased when
compared with those at 0 min rest, due to cement hydration. Mix 0.32-G10 had the lowest flow

34
at 40 min rest among all mixtures studied, which was difficult to extrude from the nozzle. The
rest of the mixes were able to be extruded from the nozzle, but those having a high flow at 40
and 60 min rest and a small flow reduction during 0-60 min rest, e.g., Mix 0.32-G0, were unable
to hold the shape of extruded filaments and/or printed objects. As a result, only Mixes 0.32-G20
and 0.32-G30 were suitable for printing. Additional related discussions on extrudability and
buildability are presented in the following section.
6.5.2 Extrudability and Buildability
As discussed previously, among the four mixes made with different amounts of grout, only
Mixes 0.32-G20 and 0.32-G30 were able to be printed. Figure 6.3 illustrates the freshly printed
object with Mixes 0.32-G20 and 0.32-G30.
(a) Mix 0.32-G20 (b) Mix 0.32-G30
The Mix IDs describe the w/b ratio and proportion of grout (G) for each test.
Figure 6.3. Buildability of printable mortars illustrated by the shape of printed objects
It can be observed that Mix 0.32-G20 had very close to the designed 3D model, and it indicated
that it had a good printability. However, Mix 0.32-G30 showed slump and distortion. Because of
the high flow values of Mix 0.32-G30 at 40 and 60 min rest, the object printed with Mix 0.32-
G30 slumped under the weight of itself, having a larger diameter at the bottom and a non-
uniform overall layer thickness. Because the slump occurred during printing, the layers were not
deposited at the locations set by the 3D modeling tool, thus reflecting poor extrudability and
buildability. Therefore, Mix 0.32-G20 was chosen for further study on the mechanical properties
of 3D printing concrete (sections 6.5.3 and 6.5.4).
6.5.3 Compressive Strength
The samples used for mechanical tests (compressive and flexural strength) were all prepared
from Mix 0.32-G20. The mechanical properties of the 3D printed samples were compared with
those of mold-cast samples. Direct tension tests were also performed. However, due to the

35
limitations of sample size and testing equipment, as well as the brittle failure of the samples
immediately after loading started, no measurements were able to be taken. Figure 6.4 shows
photographs of the broken samples from the direct tension tests. Therefore, only compressive
and flexural strength test results are presented in this report.
Figure 6.4. Failures during direct tension tests
Figure 6.5 shows the compressive strength test results of mold-cast and 3D printed samples at 7
and 28 days.
Figure 6.5. Compressive strength at 7 and 28 days
For the printed samples, load was applied to the direction perpendicular and parallel to the
filaments of the samples to examine the anisotropic behavior of the 3D printed concrete.

36
It can be seen from the figure that the compressive strength of the cast samples was around 67
MPa, at 7 and 28 days, the highest among all samples tested. The reason for which there was
little to no change in compressive strength from 7 to 28 days might be related to the CSA in
grout. It has been reported that CSA cement showed strength loss at later ages due to the
conversion of ettringite to less volumetric monosulfate, leading to increased porosity. Thus, the
strength increase resulting from portland cement hydration was offset by the strength loss
resulting from the phase transformation of CSA cement hydration products.
Figure 6.4 also shows that 3D printed samples had significantly lower strength than the cast
sample at both 7 and 28 days. Most researchers believe that this is attributed to the weak bonds
between the printed filaments of the printed samples. Several researchers have studied the bond
properties of 3D printed concrete and proposed different methods to improve the bond strength
(Marchment et al. 2019). In addition, the samples loaded in the direction perpendicular to printed
filaments had a 28 day compressive strength of 50 MPa, about 17% lower than the mold-cast
sample; while samples loaded in the direction parallel to printed filaments had a 28 day
compressive strength of 44 MPa, about 27% lower than mold-cast sample. This clearly
demonstrated the anisotropic behavior of 3D printing concrete.
Figure 6.6 illustrates the failure modes of these samples.
(a) Cast sample
(b) Sample loaded in the
direction perpendicular to
printed filaments
(c) Sample loaded in the
direction parallel to printed
filaments
Figure 6.6. Failure modes of samples under compression tested at 28 days
It can be seen from the figure that the mold-cast sample had a typical brittle failure shown by
very few, nearly vertical cracks. The sample loaded in the direction perpendicular to printed
filaments showed a major diagonal crack, across the cross section of many filaments of the
sample, indicating that these filaments had a shear failure under the compressive load.
Alternatively, the sample loaded in the direction parallel to printed filaments showed a larger
number of vertical cracks than others, probably caused by the separation of the adjacent
filaments. These vertical cracks were larger at the edges and finer at the center of the tested
sample. This might be because the vertical filaments had less/no restraint at the edges of the
sample, and they were easier to bend (or buckle) under the vertical compressive load. The
bending deformation generated tensile stresses that separated the filaments and caused bond

37
failures or large cracks. At the center of the sample, individual filaments were difficult to bend
due to the restraint supplied by adjacent filaments, thus causing small cracks.
6.5.4 Flexural Strength
Figure 6.7 shows the flexural strength test results of cast and printed samples at 7 and 28 days.
Figure 6.7. Flexural strength at 7 and 28 days
Different from the results of compressive strength, flexural strength of the printed samples was
higher than that of the cast sample, regardless of interlayers between filaments and loading
directions.
As seen in the figure, the flexural strength values of the cast samples were 3.8 MPa and 4.0 MPa
at 7 and 28 days, respectively. For the samples loaded in the direction perpendicular to printed
filaments, these strength values were 4.9 MPa and 5.7 MPa, about 29% and 45% higher than
those of the mold-cast sample at 7 and 28 days, respectively. For the samples loaded in the
direction parallel to printed filaments, these strength values were 4.6 MPa and 5.2 MPa, about
21% and 32% higher than those of the mold-cast sample at 7 and 28 days, respectively.
Compared with compressive strength values, the differences in flexural strength values of the 3D
printed samples loaded in different directions were much smaller, indicating less severe
anisotropic behavior of 3D printing concrete under flexural loading.
The phenomenon that the 3D printed samples had higher flexural strength than mold-cast
samples was also observed by other researchers (Marchment et al. 2019). One explanation is that
during the printing process mortars were compacted and densified, and it led to a densified
microstructure. More studies are necessary to verify this inference. However, little explanation
could be made on why the 3D printed samples had higher flexural strength than cast samples
when they were loaded parallel to the filaments. Further study on this subject is necessary.
The failure modes of the mold-cast and 3D printed beams are presented in Figure 6.8.

38
(a) Cast sample
(b) Sample loaded perpendicular to printed filaments
(c) Sample loaded parallel to printed filaments
Figure 6.8. Failure modes of samples under flexural load tested at 28 days
It appears that all samples displayed a similar brittle failure. It should be noted that at 28 days,
the ratio of flexural strength-to-compressive strength of the cast sample was about 6% for cast
samples, while it was over 11% for the 3D printed samples in both loading directions. This
implies that for a given concrete mixture, a component manufactured with a 3D printing process
may have a higher cracking resistance than one manufactured with a conventional mold-cast
process.
It should be noted that the mechanical behavior of 3D printing concrete depends upon not only
the concrete materials, mix proportion, printing direction, and curing conditions but also printing
parameters (e.g., extrusion and printing speeds), sample and filament sizes, open time, etc. Much
more work needs to be done to have a better understanding of the overall mechanical behavior of
3D printing concrete.

39
7. OBJECT DESIGN AND QUALITY EVALUATION
7.1 Object Design
With clay and concrete, different shapes of objects were printed, and Figure 7.1 shows the
objects printed using the 3D printer in this present study.
Cup Small bottle Rectangular
(a) Clay objects with different shapes
0% Infill 60% Infill 80% Infill
(b) Clay objects (80 mm × 40 mm cylinder) with different infill rates
60 mm × 120 mm
cylinder
60 mm × 60 mm × 120
mm prism (Vertical)
60 mm × 120 mm × 60 mm prism
(Horizontal)
(c) Concrete objects
Figure 7.1. Different objects printed with clay and concrete

40
Cup, bottle, and rectangular shapes were designed and printed with clay. In addition, different
infill rates were used to print cylindrical objects to investigate their effects on the printed objects.
After the printing parameter studies, concrete was used as an ink for 3D printing, and cylindrical
and rectangular shapes were printed with concrete.
7.2 Printing Quality Evaluation
Although 3D printing quality attracts great attention, there is very limited information on how to
evaluate the quality of 3D printed objects. The commonly used evaluation method is visual
inspection. In order to compare the quality of the 3D printed concrete objects created in the
present study with that of objects printed by other researchers, a qualitative ranking system based
on visual inspection was developed in the present study.
Figure 7.2 illustrates the qualitative ranking system developed for evaluation of the printing
qualities of 3D concrete printing, where 1 and 5 represent the best and worst printing qualities,
respectively.
The 3D printed objects ranked 1 have smooth or uniform layers and those ranked 5 were not able
to be evaluated due to the incapability to be printed. The images used in the ranking system were
collected from various publications as labeled in the figure, and their citations can be found at
the end of this report. Based on this ranking system, the samples printed with the best mortar
mixtures used in the present study could be ranked as 2, since they showed quite uniform layers
and only slightly rough surfaces.
In order to have a quantitative evaluation of the printing qualities, a 3D structured light scanning
system (3D-SLSS) was applied to assess the printing qualities of the 3D printed clay samples
(Wi et al. 2020). To conduct the analysis, a 3D-SLSS was used to scan the printed objects and
create 3D images of the samples. The images then were sliced to generate a number of 2D plots,
from which various parameters (e.g., sample total height, outer/inner diameter, layer thickness,
layer width, and surface roughness) were measured with high accuracy. The quality of the
printed objects can be evaluated by comparing the measurements of the printed samples with the
designed values.

41
Figure 7.2. Printing quality evaluation and comparison

42
Figure 7.3 shows photographs and 3D images of selected 3D printed clay samples.
Sample 1 Sample 2 Sample 3
Side view image of Sample 1 Side view image of Sample 2 Side view image of Sample 3
Top view image of Sample 1 Top view image of Sample 2 Top view image of Sample 3
(a) Sample 1 (b) Sample 2 (c) Sample 3
Figure 7.3. Photos and 3D-SLSS images of 3D printed clay samples
The designed dimensions of these hollow cylindrical samples were 80 mm (outer diameter) The
designed dimensions of these hollow cylindrical samples were 80 mm (outer diameter) × (40 mm
(height) × 2 mm (thickness), and the layer width was designed as 5 mm. The images were
captured from side and top views using the 3D-SLSS.
The color differences indicate the distance of the surfaces of objects from the camera light
source. For example, yellow represents the closest distance from the camera to the sample
surface in a side view, and blue represents the farthest distance of the surface of the sample from
the camera light source. If the printed sample was perfectly cylindrical, the middle portion of the
printed samples in the side view should be the closest to the 3D-SLSS camera, showing yellow
on the center line and other colors symmetrical to the center line. If the sample was printed with
uniform width and well-leveled, the top view image of the samples should show a uniform color
(40 mm [height] × 2 mm [thickness], with the layer width designed as 5 mm).
However, Figure 7.3 shows that none of the tested samples had a color distribution symmetrical
to the center line, suggesting that they are not perfectly cylindrical. The top view images did not
show uniform color either, implying the top layer filaments were not well-leveled, and the width

43
of the samples were not perfectly uniform. Among the three samples studied, the 3D-SLSS
images of Sample 1 appeared the best, showing a relatively regular shape and uniform color
distribution. The 3D-SLSS images of Samples 2 and 3 showed clear distortion in shape and large
differences in color, and non-uniform color distribution, signifying a poorer 3D printing quality
than Sample 1.
To measure the geometry of the 3D printed samples, e.g., layer thickness, layer width, surface
roughness, and degree of distortion, the 3D images of the printed samples were sliced, and 16
different 2D plots were obtained (Figure 7.4).
(a) Side view (b) Top view (c) Sample of 2D plot
Figure 7.4. Illustration of 2D plot development from 3D-SLSS images of a 3D printed
sample
From these 2D plots, the geometrical parameters (total height, layer thickness, layer width, etc.)
of the 3D printed samples were assessed.
Figure 7.5 shows the geometrical parameters of the 3D printed samples measured from the 3D-
SLSS images. The measurements were compared with corresponding designed values. The
figure demonstrates that none of the 3D printed samples had any geometrical parameter meeting
the designed value, even for Sample 1, which had a very good visual appearance.
In the present study, the designed object height was 40 mm, but the height measurements of all
3D printed samples were below 40 mm (Figure 7.5a).
LayerWidth (WL)

44
(a) Object height (b) Object outer diameter
(c) Layer thickness (d) Layer width
After Wi et al. 2020, Additive Manufacturing
Figure 7.5. 3D-SLSS measurements of geometric parameters of 3D printed samples
This may be because the printed clay filaments did not develop sufficient stiffness in time to
resist the weight of the subsequently deposited filaments, thus causing slump and/or distortion.
Figure 7.5b shows that the outer diameters of all 3D printed samples were less than the designed
value of 80 mm. This could partially result from a printer-related error by which the printing
mortar did not deposit to the positions as designed. Distortion of the objects at an early stage of
the printing process, e.g., the bottom layers in Samples 2 and 3 (Figure 7.3, side view), could
also cause the average diameters of the printed objects to be different from the designed value.

45
Figure 7.5c illustrates that the average layer thickness measurements of the 3D printed samples
were all slightly smaller than the designed value of 2 mm. However, Figure 7.5d shows that the
layer widths of two out of the three 3D printed samples were larger than the designed value, 5
mm. This was because each layer of filament deformed under the weight of the subsequently
deposited layers, which compressed the filaments, reducing the layer thickness and widening the
layer width.

46
8. SUMMARY, CONCLUSION, AND FUTURE STUDY
8.1 Summary
The following activities were conducted in this research project:
1. A literature review was conducted to learn about 3D printing methods, equipment, materials,
processes, and characterizations of printed products. Definitions of key properties of 3D
printing concrete, e.g., printability, extrudability, buildability, flowability, pumpability, and
open time, were clarified.
2. Before the arrival of a commercial 3D concrete printer, a plastic syringe was used to simulate
the printing process and different materials were explored to identify the effects of materials
on concrete printing. It was observed that silica fume and VMAs could enhance the
buildability, and superplasticizer could increase flowability. The tests indicated that it was
important to develop a mix proportion using different materials.
3. For 3D concrete printing, a commercial 3D clay printer was purchased. The platform moves
along an x- and y-axis, and the printer head with the extruder moves along a z-axis.
Moreover, the printer has its own control box, which users can employ to directly control
extrusion and printing speeds.
4. Printing parameters, such as printing speed, extrusion speed, stand-off distance, and nozzle
size and shape, could affect the printing qualities of printed objects. In this study, printing
speed and extrusion speed were chosen to investigate the effects of printing parameters on
the printing qualities with clay. It was observed that both affected the geometry of printed
objects, and it indicated that the combination of printing and extrusion speeds is important
for 3D printing.
5. Through trial printing with the plastic syringe, it was confirmed that the dosages of VMA and
superplasticizer are important to printing cylindrical objects. As the dosage of VMA
increased, extrudability decreased. Conversely, as the dosage of superplasticizer increased,
flowability was enhanced. However, if the flowability increased, buildability decreased.
Therefore, it was important to balance the flowability and buildability by using different
materials and changing mix proportions.
6. Grout containing CSA cement, powder-form superplasticizer, filler, and various additives
was incorporated into the mix design, since it could increase flowability and buildability due
to the superplasticizer and CSA cement. By printing a cylindrical object, it was confirmed
that a w/b ratio of 0.32 and 20% grout by weight (0.32-G20) was the best mix design.

47
7. The compressive strength of the printed samples was lower than that of the mold-cast
sample, and the perpendicular strength was greater than the parallel, showing anisotropic
behavior. This could be due to the fact that the interlayers created during the printing process
acted as weak zones and decreased the compressive strength. However, the flexural strength
of the printed samples was higher than that of the mold-cast sample. It’s possible that the
mixtures were compacted when they were extruded from the extruder and their
microstructure was densified by the pressure.
8. Based on the ranking system developed in the present study, the research team’s printed
samples could be ranked as 2, meaning a printed object has rather uniform layers and a bit of
a rough surface. In addition, a qualitative method with a 3D-SLSS to assess the printing
qualities was developed.
8.2 Conclusions
The following are major conclusions drawn from the present study:
1. Due to the layer-by-layer additive manufacturing manner, different properties were required
for 3D printing concrete rather than those from conventionally mold-cast concrete. The key
properties for printable concrete mixtures include flowability, printability, extrudability,
buildability, and open time. The 3D printable concrete mixtures should have suitable
flowability in order to be easily transported from a mixer to a printer. They should have
proper extrudability in order to be extruded out smoothly and consistently. Finally, the
mixtures should develop sufficient stiffness to hold the object’s shape or resist the weight of
the subsequently deposited filaments without distortion or collapse.
2. The requirements for flowability, printability, extrudability, buildability, and open time of 3D
printable concrete mixtures vary with the features of the printer used and the objects to be
printed, and they also differ from printing parameters (deposition distance, extrusion speed,
and printing speeds) and printing procedures (loading of printing material and design of
printing paths) used. Therefore, the 3D printing concrete mixtures should be designed and
adjusted to fit these features, parameters, and procedures.
3. Results from the literature review indicated that at present, cement pastes and mortars are the
most commonly used 3D concrete printing materials. Various types of cement (portland
cement and rapid-setting cement), supplementary cementitious materials (fly ash, silica fume,
limestone powder, etc.), superplasticizers, and accelerators are frequently used in 3D printing
concrete. The w/b ratio and s/b ratio of 3D printable concrete are often in the ranges of 0.30–
0.40 and 1.0–1.5, respectively.

48
4. The present study suggests that the use of a highly flowable, rapid-setting grout that is
commercially available to replace cement can simplify the 3D printing mortar mix design
and achieve proper extrudability and buildability very effectively. Based on the test results,
Mix 0.32-G20, made with a binder containing portland cement, silica fume (2.5% by weight
of binder), and 20% grout and a w/b ratio of 0.32, showed satisfactory flowability,
extrudability, and printability when a 3D potter printer was used for 3D concrete printing.
The flow table test results showed that Mix 0.32-G20 had a final flow spread of 220 mm
immediately after completion of mixing; 180 mm after 40 min rest, when printing/extrusion
started; and 176 mm after 60 min. rest, when printing/extrusion was completed. This mixture
was easily placed into the printer, extruded out smoothly and consistently, and able to hold
the shape of the designed objects during and after printing.
5. Several defects were identified during the 3D concrete printing, and they were (a) air bubble
pop outs, (b) discontinuity, (c) slumping, and (d) cracking. The first three were largely
related to the flow behavior of the 3D printing concrete mixtures, while the last one was
mainly due to plastic shrinkage. Prompt and proper curing is essential for 3D printing
concrete in order to reduce slump and plastic shrinkage cracking.
6. The compressive and flexural strength of the 3D printing concrete were measured, and the
results were compared with those of mold-cast samples. In order to take into account the
direction of filaments, printed samples were loaded in two different directions (perpendicular
and parallel to the printed filament). It was found that the mold-cast sample had a higher
compressive strength than the printed samples regardless of loading directions. This might be
attributed to the existence of interlayers between printed filaments. However, under flexural
loading, the printed samples had a higher flexural strength than the mold-cast sample
regardless of loading directions. Similar observations also had been made by other
researchers. One explanation might be that the mixtures were densified during the 3D
printing/extrusion process, leading to higher flexural strength when the 3D printed samples
were loaded in the direction perpendicular to the filaments. However, little explanation could
be made on why the 3D printed samples had higher flexural strength than the cast samples
when they were loaded parallel to the filaments. Further study on this subject is necessary.
7. The 3D printed samples displayed different compressive and flexural strength values when
loaded in different directions, which provided clear evidence of the anisotropic behavior of
the bulk material. The compressive strength of the 3D printed samples loaded in the direction
parallel to the filaments was much lower than that of the corresponding samples loaded in the
direction perpendicular to the filaments, which was probably due to potential buckling of the
filaments under compression. However, the difference in flexural strength of the 3D printed
samples loaded in the two different directions was much smaller.

49
8. In order to evaluate the quality of the 3D printed concrete objects, a qualitative ranking
system based on visual inspection was developed in the present study. Based on this ranking
system, the samples printed with the best mortar mixtures used in the present study could be
ranked as 2, since they showed uniform layers and a bit of a rough surface. Quantitative
evaluation for the printing qualities was also conducted with a 3D-SLSS. The results showed
that all the printed samples exhibited certain differences between their measured and
designed values, even for those that appeared well-printed. Compared with the designed
object, the printed samples generally had reduced total height, diameter, and layer thickness
but increased layer width, mainly due to slump. In addition to printing materials (concrete
mixtures), various printing parameters, including printing speed, extrusion speed, nozzle size
and shape, stand-off distance, etc., could affect the printing qualities of the 3D printed
objects. These affecting parameters should be further studied to improve the 3D printing
quality.
8.3 Further Study
The goal of the further study is to transfer the startup research as presented in this report to
scaleup research.
Through the present exploration study, the research team has gained sufficient experience to
develop mortar mixtures that will be able to print “structural components” with a larger printer.
The research team has investigated some commercially available 3D printer candidates, such as
gantry, crane, and robot arm systems, and a Delta 3D printer, and learned their features,
advantages, and limitations. Selection of an intermediate-sized robot arm with a mixing-pumping
system is now under a special consideration due to its flexibility and functions.
Using a larger 3D printer, the research team will study properties of various mortar or concrete
mixtures made with various materials, including various types and contents of fibers. Objects,
such as columns and beams with a dimension around 3–4 ft will be printed and used for
structural performance. The feasibility for printing small-scale structure components, such as
small frames, slabs, and joints/connections, will also be explored, and the properties of these
printed components will also be evaluated.
It is expected that this continued study will lead to the development of the scalability that links
the behaviors of the small-scale 3D printing objects as conducted in the present project with the
intermediate (pilot) scale and to provide a solid foundation for transferring the research results to
full scale production.


51
REFERENCES
Ahmaruzzaman, M. 2010. A Review on the Utilization of Fly Ash. Progress in Energy and
Combustion Science, Vol. 36, No. 3, pp. 327–363.
ArchDaily. 2017. Office of the Future / Killa Design. ArchDaily.
https://www.archdaily.com/875642/office-of-the-future-killa-
design?ad_medium=gallery.
Benaicha, M., X. Roguiez, O. Jalbaud, Y. Burtschell, and A. H. Alaoui. 2015. Influence of Silica
Fume and Viscosity Modifying Agent on the Mechanical and Rheological Behavior of
Self Compacting Concrete. Construction and Building Materials, Vol. 84, pp. 103–110.
Bentz, D. P., S. Z. Jones, I. R. Bentz, and M. A. Peltz. 2019. Towards the Formulation of Robust
and Sustainable Cementitious Binders for 3D Additive Construction by Extrusion. 3D
Concrete Printing Technology, Vol. 2019, pp. 307–331.
Berodier, E. and K. Scrivener. 2014. Understanding the Filler Effect on the Nucleation and
Growth of C‐S‐H. Journal of the American Ceramic Society, Vol. 97, No. 12, pp. 3764–
3773.
Block, I. 2018. Robots Complete Span of 3D-Printed Bridge for Amsterdam Canal. Dezeen.
https://www.dezeen.com/2018/04/17/mx3d-3d-printed-bridge-joris-laarman-arup-
amsterdam-netherlands/.
Chandra, S. and J. Björnström. 2002. Influence of Cement and Superplasticizers Type and
Dosage on the Fluidity of Cement Mortars—Part I. Cement and Concrete Research, Vol.
32, No. 10, pp. 1605–1611.
Harkins, G. 2019 The Marines Just 3D-Printed an Entire Bridge in California. DOD Buzz
Military News. https://www.military.com/dodbuzz/2019/01/31/marines-just-3d-printed-
entire-bridge-california.html.
Hong, J., K. Wang, Z. Xiong, M. Gong, C. Deng, G. Peng, and H. Zhu. 2019. Investigation into
the Freeze–Thaw Durability of Semi-Flexible Pavement Mixtures. Road Materials and
Pavement Design, pp. 1–17.
Institute for Advanced Architecture of Catalonia. 2017. World’s First 3D Printed Pedestrian
Bridge Built in Catalonia. Designboom.
https://www.designboom.com/technology/worlds-first-3d-printed-pedestrian-bridge-
catalonia-24-01-2017/.
Kazemian, A., X. Yuan, E. Cochran, and B. Khoshnevis. 2017. Cementitious Materials for
Construction-Scale 3D Printing: Laboratory Testing of Fresh Printing Mixture.
Construction and Building Materials, Vol. 145, pp. 639–647.
Khalil, N., G. Aouad, K. El Cheikh, and S. Rémond. 2017. Use of Calcium Sulfoaluminate
Cements for Setting Control of 3D-Printing Mortars. Construction and Building
Materials, Vol. 157, pp. 382–391.
Khoshnevis, B. and R. Dutton. 1998. Innovative Rapid Prototyping Process Makes Large Sized,
Smooth Surfaced Complex Shapes in a Wide Variety of Materials. Materials Technology,
Vol. 13, No. 2, pp. 53–56.
Khoshnevis, B. 2004. Automated Construction by Contour Crafting—Related Robotics and
Information Technologies. Automation in Construction. Vol. 13, No. 1, pp. 5–19.
52
Kovler, K. 1998. Setting and Hardening of Gypsum-Portland Cement-Silica Fume Blends, Part
1: Temperature and Setting Expansion. Cement and Concrete Research, Vol. 28, No. 3,
pp. 423–437.
Le, T. T., S. A. Austin, S. Lim, R. A. Buswell, A. G. Gibb, and T. Thorpe. 2012a. Mix Design
and Fresh Properties for High-Performance Printing Concrete. Materials and Structures,
Vol. 45, No. 8, pp. 1221–1232.
Le, T. T., S. A. Austin, S. Lim, R. A. Buswell, R. Law, A. G. Gibb, and T. Thorpe. 2012b.
Hardened Properties of High-Performance Printing Concrete. Cement and Concrete
Research, Vol. 42, No. 3, pp. 558–566.
Lee, H., W.-W. Kim, and J.-H. Moon. 2018. Study on Rheological Properties of Mortar for the
Application of 3D Printing Method. Journal of the Korean Recycled Construction
Resources Institute, Vol. 6, No. 1, pp. 16–24.
Leemann, A. and F. Winnefeld. 2007. The Effect of Viscosity Modifying Agents on Mortar and
Concrete. Cement and Concrete Composites, Vol. 29, No. 5, pp. 341–349.
Lim, S., R. A. Buswell, T. T. Le, S. A. Austin, A. G. F. Gibb, and T. Thorpe. 2012.
Developments in Construction-Scale Additive Manufacturing Processes. Automation in
Construction, Vol. 21, pp. 262–268.
Ma, T., R. Yang, Z. Zheng, and Y. Song. 2017. Rheology of Fumed Silica/Polydimethylsiloxane
Suspensions. Journal of Rheology, Vol. 61, No. 2, pp. 205–215.
Ma, G., Z. Li, and L. Wang. 2018. Printable Properties of Cementitious Material Containing
Copper Tailings for Extrusion Based 3D Printing. Construction and Building Materials,
Vol. 162, pp. 613–627.
Malaeb, Z., H. Hachem, A. Tourbah, T. Maalouf, N. El Zarwi, and F. Hamzeh. 2015. 3D
Concrete Printing: Machine and Mix Design. International Journal of Civil Engineering,
Vol. 6, No. 6, pp. 14–22.
Marchment, T., J. Sanjayan, and M. Xia. 2019. Method of Enhancing Interlayer Bond Strength in
Construction Scale of 3D printing with Mortar by Effective Bond Area Amplification.
Materials and Design, Vol. 169, 107684.
Mardani-Aghabaglou, A., M. Tuyan, G. Yılmaz, Ö. Arıöz, and K. Ramyar. 2013. Effect of
Different Types of Superplasticizer on Fresh, Rheological, and Strength Properties of
Self-Consolidating Concrete. Construction and Building Materials, Vol. 47, pp. 1020–
1025.
Massachusetts Institute of Technology. 2017. System Can 3-D Print an Entire Building: Tech
Could Enable Faster, Cheaper, More Adaptable Building Construction. ScienceDaily.
https://www.sciencedaily.com/releases/2017/04/170426183028.htm.
Mehdipour, I. and K. H. Khayat. 2017. Effect of Particle-Size Distribution and Specific Surface
Area of Different Binder Systems on Packing Density and Flow Characteristics of
Cement Paste. Cement and Concrete Composites, Vol. 78, pp. 120–131.
Oey, T., A. Kumar, J. W. Bullard, N. Neithalath, and G. Sant. 2013. The Filler Effect: The
Influence of Filler Content and Surface Area on Cementitious Reaction Rates. Journal of
the American Ceramic Society, Vol. 96, No. 6, pp. 1978–1990.
Ogura, H., V. N. Nerella, and V. Mechtcherine. 2018. Developing and Testing of Strain-
Hardening Cement-Based Composites (SHCC) in the Context of 3D-Printing. Materials,
Vol. 11, No. 8, pp. 1–18.

53
Ravenscroft, T. 2019. World’s Longest 3D-Printed Concrete Bridge Opens in Shanghai. Dezeen.
https://www.dezeen.com/2019/02/05/worlds-longest-3d-printed-concrete-bridge-
shanghai/.
Rogers, J. 2018. Marines 3D-Print Concrete Barracks in Just 40 Hours. Fox News Proud
American. https://www.foxnews.com/tech/marines-3d-print-concrete-barracks-in-just-40-
hours.
Sevenson, B. 2015. Shanghai-Based WinSun 3D Prints 6-Story Apartment Building and an
Incredible Home. 3DPrint.COM. http://3dprint.com/38144/3d-printed-apartment-
building/.
Soltan, D. G. and V. C. Li. 2018. A Self-Reinforced Cementitious Composite for Building-Scale
3D Printing. Cement and Concrete Composites, Vol. 90, pp. 1–13.
Vaitkevičius, V., E. Šerelis, and V. Kerševičius. 2018. Effect of Ultra-Sonic Activation on Early
Hydration Process in 3D Concrete Printing Technology. Construction and Building
Materials, Vol. 169, pp. 354–363.
Wang, D., C. Shi, N. Farzadnia, Z. Shi, H. Jia, and Z. Ou. 2018. A Review on Use of Limestone
Powder in Cement-Based Materials: Mechanism, Hydration and Microstructures.
Construction and Building Materials, Vol. 181, pp. 659–672.
Wang, K. and J. Hong. 2019. Hybrid Concrete for Advancing Pavement Performance. Midwest
Transportation Center, Institute for Transportation, Iowa State University, Ames, IA.
https://intrans.iastate.edu/app/uploads/2019/03/hybrid_concrete_for_pvmt_performance_
w_cvr.pdf.
Wi, K., V. Suresh, K. Wang, B. Li, and H. Qin. 2020. Quantifying Quality of 3D Printed Clay
Objects Using a 3D Structured Light Scanning System. Additive Manufacturing, Vol. 32,
100987.
Wu, P., J. Wang, and X. Wang. 2016. A Critical Review of the Use of 3-D Printing in the
Construction Industry. Automation in Construction, Vol. 68, pp. 21–31.
Zhang, Y., Y. Zhang, G. Liu, Y. Yang, M. Wu, and B. Pang. 2018. Fresh Properties of a Novel
3D Printing Concrete Ink. Construction and Building Materials, Vol. 174, pp. 263–271.
Zhang, Y., Y. Zhang, W. She, L. Yang, G. Liu, and Y. Yang. 2019. Rheological and Harden
Properties of the High-Thixotropy 3D Printing Concrete. Construction and Building
Materials, Vol. 201, pp. 278–285.
Zhi, Z., B. Ma, H. Tan, Y. Guo, Z. Jin, H. Yu, and S. Jian. 2018. Effect of Competitive
Adsorption between Polycarboxylate Superplasticizer and Hydroxypropylmethyl
Cellulose on Rheology of Gypsum Paste. Journal of Materials in Civil Engineering, Vol.
30, No. 7, 04018141.


THE INSTITUTE FOR TRANSPORTATION IS THE FOCAL POINT FOR TRANSPORTATION AT IOWA STATE UNIVERSITY.
InTrans centers and programs perform transportation research and provide technology transfer services for government agencies and private companies;
InTrans contributes to ISU and the College of Engineering’s educational programs for transportation students and provides K–12 outreach; and
InTrans conducts local, regional, and national transportation services and continuing education programs.
Visit InTrans.iastate.edu for color pdfs of this and other research reports.