Embed Size (px)
Citation preview

Feasibility Study and Performance Evaluation of Vehicle-to-Everything
(V2X) Communications Applications
Junsung Choi
Dissertation submitted to the Faculty of
Virginia Polytechnic Institute and State University
in partial fulfillment of the requirement for the degree of
Doctor of Philosophy
in
Electrical Engineering
Carl B. Dietrich, Chair
Alan T. Asbeck
Harpreet S. Dhillon
Jeffrey H. Reed
Yaling Yang
July 24, 2018
Blacksburg, VA
Keywords: DSRC, V2R,V2T, LTE, V2X, C-V2X, WiFi, propagation channel characteristics,
adjacent channel interference, ITS band

Feasibility Study and Performance Evaluation of Vehicle-to-Everything (V2X)
Communications Applications
Abstract
Junsung Choi
Vehicular communications are a major subject of research and policy activity in industry,
government, and academia. Dedicated Short-Range Communications (DSRC) is currently the
main protocol used for vehicular communications, and it operates in the 5.9 GHz band. In
addition to DSRC radios, other potential uses of this band include Wi-Fi, LTE-V, and
communication among unlicensed devices. This dissertation presents an architecture and a
feasibility analysis including field measurements and analysis for vehicle-to-train (V2T)
communications, a safety-critical vehicular communication application. The dissertation
also presents a survey of research relevant to each of several possible combinations of radio-
spectrum and vehicular-safety regulations that would affect use of the 5.9 GHz band,
identifies the most challenging of the possible resulting technical challenges, and presents
initial measurements to assess feasibility of sharing the band by DSRC radios and other
devices that operate on adjacent frequencies using different wireless communication
standards.
Although wireless technology is available for safety-critical communications, few
applications have been developed to improve railroad crossing safety. A V2T communication
system for a safety warning application with DSRC radios can address the need to prevent
collisions between trains and vehicles. The dissertation presents a V2T early warning

application architecture with a safety notification time and distance. We conducted channel
measurements at a 5.86–5.91-GHz frequency and 5.9-GHz DSRC performance
measurements at railroad crossings in open spaces, shadowed environments, and rural and
suburban environments related to the presented V2T architecture. DSRC systems can provide
good communication range; however, the range is likely to be reduced in the presence of
interference and / or Non-Line-of-Sight (NLoS) conditions. Such environmental factors are
the major influence on DSRC performance. By knowing the relationship between DSRC and
environmental factors, DSRC radios can be set up in a way that promotes good performance
in an environment of interest. Although independent, the DSRC performance measurements
and propagation channel characteristic measurements were conducted in the same locations
and share the same distance parameters. Results of linear regression to analyze the
relationship between DSRC performance and propagation channel characteristics indicate
that additional data are required to enable robust statistical modeling. However, the DSRC
links performed well in V2T measurements conducted near rural and suburban railroad
crossings with varying numbers and types of obstacles to the radio signals. These results
provide a strong indication that the DSRC protocol can be adapted to serve the purpose of a
V2T safety warning system.
Several stakeholders, including traditional mobile operators, unlicensed Wi-Fi proponents
and Cellular-Vehicle-to-Everything (C-V2X) proponents, are seeking access to the 5.9 GHz
band currently used by DSRC. The FCC and National Highway Traffic Safety
Administration (NHTSA), the two major organizations that are responsible for regulations
related to vehicular communications, have not finalized rules regarding this band. The
relative merits of the above mentioned wireless communication standards and coexistence

issues between these standards are complex. There has been considerable research devoted
to understanding the performance of these standards, but in some instances there are gaps in
needed research. We have analyzed regulation scenarios that FCC and NHTSA are likely to
consider and have identified the technical challenges associated with these potential
regulatory scenarios. The technical challenges are presented and for each a survey of relevant
technical literature is presented. In our opinion for the most challenging technical
requirements that could be mandated by new regulations are interoperability between DSRC
and C-V2X and the ability to detect either adjacent channel or co-channel coexisting
interference. We conducted initial measurements to evaluate the feasibility of adjacent
channel coexistence between DSRC, Wi-Fi, and C-V2X, which is one of the possible
regulatory scenarios. We set DSRC at Channel 172, Wi-Fi at Channel 169 for 20 MHz
bandwidth and at Channel 167 for 40 MHz, and C-V2X at Channel 174 with almost 100%
spectrum capacity. From the measurements, we observed almost no effects on DSRC
performance due to adjacent channel interference. Based on our results, we concluded that
adjacent channel coexistence between DSRC, C-V2X, and Wi-Fi is possible.

Feasibility Study and Performance Evaluation of Vehicle-to-Everything (V2X)
Communications Applications
General Audience Abstract
Junsung Choi
Researchers and regulators in industry, government, and academic institutions are interested
in vehicular communications. Dedicated Short-Range Communications (DSRC) is currently
the standard protocol for communication between vehicles, including for safety applications,
and operates in the band of radio frequencies near 5.9 GHz. In addition to operators of DSRC
radios, other potential users are interested in using the 5.9 GHz band. This dissertation
presents an architecture and a feasibility analysis including field measurements for vehicle-
to-train (V2T) communications, a safety-critical vehicular communication application. The
dissertation also identifies major technical challenges that could become important in the
future for users of the 5.9 GHz band. The challenges will be different depending on what
decisions government regulators make about the types of radios and communication
protocols that are allowed in the 5.9 GHz band and about which types of radios should be
used for vehicular safety.
Although wireless technology is available for safety-critical communications, few
applications have been developed to improve railroad crossing safety. To prevent collisions
between trains and vehicles, we present a vehicle-to-train (V2T) communication system that
uses DSRC radios to provide safety warnings to motorists. Although the term V2T is used,
the emphasis is on communication from the train to vehicles. We present a high-level design,
or architecture, of the warning system that includes goals for safety notification time and

vi
distance. We conducted measurements of radio channels near 5.9 GHz as well as
measurements of 5.9 GHz DSRC radio link performance at the same locations (railroad
crossings in open spaces, shadowed or obstructed environments, and rural and suburban
environments). The measurements were performed to help decide whether the V2T warning
system architecture would work.
A DSRC system can provide good communication range; however, that range could be
reduced if the DSRC system experiences interference from other radios or if the signal is
partially blocked due to objects between the DSRC radios. The environmental factors are the
most important influence on DSRC performance. By knowing the relationship between
DSRC and environmental factors, manufacturers and operators can set up the radios to
perform well in environments of interest. Although DSRC performance and radio channel
characteristics were measured separately, they were measured in the same locations near
railroad crossings. This made it possible to perform a statistical analysis of the relationship
between DSRC performance and propagation channel characteristics. This analysis indicated
that additional measurements will be required to collect enough data to develop robust
statistical models that relate DSRC performance directly to measured channel characteristics.
However, the results of the V2T measurements that we conducted near rural and suburban
railroad crossings with varying numbers and types of obstacles to the radio signals provide a
strong indication that DSRC can be used for to provide V2T safety warnings.
The 5.9 GHz band has been sought after by several stakeholders, including traditional mobile
operators and others who support use of the band for DSRC, unlicensed Wi-Fi, and Cellular-
Vehicle-to-Everything (C-V2X) communication. The FCC and National Highway Traffic
Safety Administration (NHTSA), the two major organizations that are responsible for

vii
regulations related to vehicular communications, have not finalized the rules regarding this
band. The relative merits of the above mentioned communication standards and coexistence
issues between these standards are complex. There has been considerable research devoted
to understanding the performance of these standards, but in some instances there are gaps in
needed research. We have analyzed regulation scenarios that FCC and NHTSA are likely to
consider and have identified the technical challenges associated with these potential
regulatory scenarios. The technical challenges are presented and for each a survey of relevant
technical literature is presented. In our opinion for the most challenging technical
requirements that could result from new regulations are interoperability between DSRC and
C-V2X and the ability to detect either adjacent channel or co-channel coexisting interference.
We conducted initial measurements to evaluate the feasibility of adjacent channel coexistence
between DSRC, Wi-Fi, and C-V2X, which is one of the possible regulatory scenarios. From
the measurements, we observed almost no effect on DSRC performance when other types of
radios used frequencies adjacent to the frequencies used by the DSRC radios. Based on our
results, we concluded that adjacent channel coexistence between DSRC, C-V2X, and Wi-Fi
is possible.

viii
Acknowledgements
I really thank God for my 13 years of successful study abroad since high school. I appreciate
my parents, Dr. Yongseok Choi and Eunkyung Choi, and my sister, Jinyoung Choi, for their
support and prayers from South Korea at the opposite side of the Earth.
I highly appreciated my advising professor, Dr. Carl B. Dietrich, for his advice and support
for my career since undergraduate research. Also, I appreciate Dr. Jeff Reed, Dr. Harpreet S.
Dhillon, Dr. Alan Asbeck, and Dr. Yaling Yang for being my committee members.
I acknowledge Dr. Christopher R. Anderson, Dr. Vuk Marojevic, Dr. Xiaofu Ma, Dr.
Seungmo Kim, Biniyam Zewede, and Aakanksha Sharma for co-authorships on several
publications, guidance about how to research, and many hours to discuss research topics. For
my research, I appreciate the Federal Railroad Administration and Ford Motor Company for
providing funding and opportunities for conducting the research. Other than researches, I
could not get through living in Blacksburg and finish degrees for the past nine years without
my dearest friends, Dr. David Park, James Nutter, and Taekyoung Oh. I hope their careers in
the future will go well.
It was great being a Hokie for 9 years!
No temptation has seized you except what is common to man. And God is faithful; he will not
let you be tempted beyond what you can bear. But when you are tempted, he will also provide
a way out so that you can stand up under it.
1 Corinthians 10:13

ix
Contents
Abstract ....................................................................................................................................... i
General Audience Abstract ........................................................................................................ v
Acknowledgements ................................................................................................................ viii
Contents .................................................................................................................................... ix
List of Figures ........................................................................................................................ xiii
List of Tables .......................................................................................................................... xix
Abbreviations ........................................................................................................................... xx
Chapter 1 Introduction ............................................................................................................... 1
1.1 Vehicle-to-Everything (V2X) Communication ......................................................... 1
1.2 V2T Communications ................................................................................................ 2
1.3 C-V2X Communications ........................................................................................... 3
1.4 Propagation Channels for Vehicular Communications.............................................. 4
1.5 Overview of Dissertation ............................................................................................. 5
Chapter 2 Summary of Contributions ........................................................................................ 6
2.1 V2T Communication Feasibility Study Performance Evaluation, and Statistical
Analysis.............................................................................................................................. 6
2.2 ITS Band Regulatory Survey ..................................................................................... 7
2.3 Adjacent Channel Interference Evaluation ................................................................ 8
Chapter 3 .................................................................................................................................... 9
V2T Communication Feasibility Study and Performance Evaluation ....................................... 9
3.1 Introduction ................................................................................................................ 9
3.2 Related Works .......................................................................................................... 13

x
3.3 V2T Communication Scenarios and Requirements ................................................. 15
3.4 Measurements Characteristics ................................................................................. 18
3.4.1 Measurement Category ................................................................................... 18
3.4.2 Measurement Parameters/Settings .................................................................. 20
3.5 Data Analysis Methods ............................................................................................ 26
3.5.1 DSRC Data Analysis....................................................................................... 26
3.5.2 Propagation Data Analysis .............................................................................. 27
3.6 TTCI Results/Evaluations ........................................................................................ 29
3.6.1 TTCI Sites ....................................................................................................... 30
3.6.2 Propagation Channel Measurements ............................................................... 31
3.6.3 DSRC Performance Measurements ................................................................ 32
3.6.4 Conclusions of TTCI Measurements .............................................................. 35
3.7 SVRR Results/Evaluations ...................................................................................... 36
3.7.1 SVRR Sites ..................................................................................................... 38
3.7.2 Electromagnetic Interference (EMI) ............................................................... 40
3.7.3 Propagation Channel Measurements ............................................................... 42
3.7.4 DSRC Performance Measurements ................................................................ 53
3.7.5 Reliability Analysis ......................................................................................... 59
3.7.6 Conclusions of SVRR Measurements ............................................................. 61
3.8 Detailed Propagation Channel Characteristics......................................................... 62
3.9 Robust Estimation Methods ..................................................................................... 64
3.10 Analyses of Results .............................................................................................. 66
3.11 Conclusions for Estimation Methods Analysis .................................................... 75
Chapter 4 .................................................................................................................................. 77

xi
ITS Band Regulatory Survey ................................................................................................... 77
4.1 Introduction ................................................................................................................ 77
4.2 Possible FCC and NHTSA’s Regulations.................................................................. 79
4.3 Technical Surveys Related to Regulation Scenarios ................................................. 85
4.3.1 DSRC Only ..................................................................................................... 85
4.3.2 C-V2X Only .................................................................................................... 88
4.3.3 Coexistence between DSRC and C-V2X ........................................................ 90
4.4 Conclusion of ITS band regulatory contingency and technical survey ..................... 92
Chapter 5 .................................................................................................................................. 94
Adjacent Channel Interference Evaluation .............................................................................. 94
5.1 Introduction ................................................................................................................ 94
5.2 Measurements Overview ........................................................................................... 94
5.3 Hardware Setup .......................................................................................................... 97
5.3.1 DSRC .............................................................................................................. 97
5.3.2 Interference Sources........................................................................................ 97
5.3.3 Emulated RF Channel ..................................................................................... 99
5.4 Results ...................................................................................................................... 107
5.4.1 LTE/C-V2X Interference Scenario Results .................................................. 107
5.4.2 20 MHz Wi-Fi Interference Scenario Results ............................................... 109
5.4.3 40 MHz Wi-Fi Interference Scenario Results ............................................... 110
5.5 Conclusions for Adjacent channel interference measurements ............................... 111
Chapter 6: ............................................................................................................................... 113
Summary ................................................................................................................................ 113
6.1 Summary of V2T Communications ......................................................................... 113

xii
6.2 Summary of ITS Band Regulatory Study ................................................................ 114
6.3 Summary of Adjacent Channel Interference Measurements ................................... 114
6.4 List of All Publications ............................................................................................ 115
6.4.1 Published Journal Papers .............................................................................. 115
6.4.2 Published Conference Papers ........................................................................ 115
References .............................................................................................................................. 118
Appendix A: TTCI Channel Sounder Results ....................................................................... 130
A.1 RTT Channel Measurement Results ....................................................................... 130
A.2 PTT Channel Measurement Results ........................................................................ 134
A.3 RTT Channel Modelling Results ............................................................................ 138
A.4 PTT Channel Modelling Results ............................................................................. 142
A.5 Small Scale Fading Model Results ......................................................................... 146
Appendix B: TTCI RSU PER Results ................................................................................... 147
Appendix C: Validations of DSRC and Interference Signals ................................................ 150
Appendix D: Propagation channel characteristics for each crossings ................................... 152

xiii
List of Figures
Figure 1 DSRC and proposed U-NII-4 spectrum bands ............................................................ 4
Figure 2 V2T communication scenario.................................................................................... 16
Figure 3 Antenna installations for TTCI .................................................................................. 21
Figure 4 (a) DSRC OBU and RSU displacement for wide-open space TTCI, (b) DSRC OBU
and RSU displacement for artificial shadowing TTCI .................................................... 21
Figure 5 (a) DSRC OBU installation for shadowing TTCI, (b) DSRC OBU installation for
SVRR, (c) DSRC RSU installation for SVRR................................................................. 22
Figure 6 Displacement of the cargos for the TTCI track ......................................................... 22
Figure 7 (a) Omnidirectional antenna’s elevation pattern, (b) horizontal pattern, (c)
bidirectional antenna’s elevation pattern, (d) horizontal pattern ..................................... 24
Figure 8 Omnidirectional antenna ........................................................................................... 25
Figure 9 Bi-directional antenna ............................................................................................... 25
Figure 10 TTCI Tracks: (a) wide-open space and (b) artificial shadowing environment and
radio displacement ........................................................................................................... 29
Figure 11 TTCI tracks: Test site 1 (wide-open space) and test site 2 (artificial shadowing) .. 30
Figure 12 DSRC performance with different speeds for the wide-open space (a) distribution
of the DSRC performance (1-PER), (b) proportion of received packets ......................... 34
Figure 13 DSRC performance with different speeds for the artificial shadowing (a)
distribution of the DSRC performance (1-PER), (b) proportion of received packets ..... 35
Figure 14 SVRR tracks: (a) Crossings #1, #2, and #3; (b) crossings #4, #5, and #6............... 37
Figure 15 Crossing locations and crossing sites ...................................................................... 38

xiv
Figure 16 EMI measurement result (outside antenna, 25 mph, idle notch, no brakes, 5.92–
5.93 GHz). ........................................................................................................................ 40
Figure 17 EMI measurement result (outside antenna, 10 mph, notch #5, no brakes, 5.9–5.91
GHz). ................................................................................................................................ 41
Figure 18 EMI measurement result (outside antenna, 10 mph, notch #8, no brakes, 5.898–
5.908 GHz). ...................................................................................................................... 41
Figure 19 Ch sounder result (omnidirectional crossing #3)..................................................... 44
Figure 20 Ch sounder result (bi-directional crossing #3) ........................................................ 45
Figure 21 Ch sounder result (omnidirectional crossing #4)..................................................... 46
Figure 22 Ch sounder result (bi-directional crossing #4) ........................................................ 47
Figure 23 Ch sounder result (crossing #5) ............................................................................... 48
Figure 24 Comparison of measured path loss values and 3GPP path loss models for (a)
crossing #2, (b) crossing #3, (c) crossing #4, (d) crossing #5, and (e) crossing #6 ......... 50
Figure 25 Crossing #1: (a) PER with omnidirectional antenna, (b) PDP with bi-directional
antenna, (c) PER with bi-directional antenna .................................................................. 54
Figure 26 Crossing #2: (a) PDP with omnidirectional antenna, (b) PER with omnidirectional
antenna, (c) PDP with bi-directional antenna, (d) PER with bi-directional antenna ....... 54
Figure 27 Crossing #3: (a) PDP with omnidirectional antenna, (b) PER with omnidirectional
antenna, (c) PDP with bi-directional antenna, (d) PER with bi-directional antenna ....... 55
Figure 28 Crossing #4: (a) PDP with omnidirectional antenna, (b) PER with omnidirectional
antenna, (c) PDP with bi-directional antenna, (d) PER with bi-directional antenna ....... 55
Figure 29 Crossing #5: (a) PDP with omnidirectional antenna, (b) PER with omnidirectional
antenna, (c) PDP with bi-directional antenna, (d) PER with bi-directional antenna ....... 56

xv
Figure 30 Crossing #6: (a) PDP with omnidirectional antenna, (b) PER with omnidirectional
antenna, (c) PDP with bi-directional antenna, (d) PER with bi-directional antenna ....... 56
Figure 31 Crossing #4: CDF of successfully decoded packets before the crossing for (a)
omnidirectional and (b) bi-directional ............................................................................. 59
Figure 32 Crossing #5: CDF of successfully decoded packets before the crossing for (a)
omnidirectional and (b) bi-directional ............................................................................. 60
Figure 33 Number of correctly received packets for crossing #5 with QPSK and low power
transmission for (a) omnidirectional and (b) bi-directional ............................................. 61
Figure 34 Example of Generated PDP ..................................................................................... 63
Figure 35 Example of Instantaneous PDP ............................................................................... 64
Figure 36 Distribution of Ricean K ......................................................................................... 67
Figure 37 Distribution of RMS Delay ..................................................................................... 67
Figure 38 Distribution of path loss exponent ........................................................................... 68
Figure 39 PER vs Ricean K ..................................................................................................... 69
Figure 40 PER vs RMS Delay ................................................................................................. 69
Figure 41 PER vs Path loss exponent ...................................................................................... 70
Figure 42 Ricean K vs Distance............................................................................................... 71
Figure 43 Path loss exponent vs Distance................................................................................ 72
Figure 44 RMS Delay vs Distance........................................................................................... 72
Figure 45 Ricean K for rural crossings .................................................................................... 74
Figure 46 RMS delay for rural crossings ................................................................................. 75
Figure 47 Path loss exponent for rural crossings ..................................................................... 75
Figure 48 FCC and NHTSA’s regulation plan ........................................................................ 82
Figure 49 Scenario for DSRC Tx, Rx, and LTE coexistence .................................................. 96

xvi
Figure 50 Scenario for DSRC Tx, Rx, and Wi-Fi coexistence ................................................ 96
Figure 51 (a) Region of recorded 20 MHz Wi-Fi signal, (b) region of recorded 40 MHz Wi-Fi
signal ................................................................................................................................ 98
Figure 52 RF channel emulator implemented as variable attenuators ..................................... 99
Figure 53 Photo of attenuators ................................................................................................. 99
Figure 54 Parts labels for USRP and DSRC Tx/Rx connections for LTE measurements ..... 101
Figure 55 Wi-Fi interference signal recording diagram for 20 & 40 MHz ........................... 102
Figure 56 Parts labels for USRP and DSRC Tx/Rx connections for Wi-Fi measurements .. 102
Figure 57 Waterfall plot of recorded LTE signal ................................................................... 104
Figure 58 Instantaneous recorded LTE signal ....................................................................... 104
Figure 59 Waterfall plot of 20 MHz Wi-Fi signal (lower and upper end) ............................. 105
Figure 60 Instantaneous 20 MHz Wi-Fi signal ...................................................................... 105
Figure 61 Waterfall plot of 40 MHz Wi-Fi signal (lower and upper end) ............................. 106
Figure 62 Instantaneous 40 MHz Wi-Fi signal (lower and upper end) ................................. 106
Figure 63 PER of DSRC for different LTE BS-DSRC Distances ......................................... 108
Figure 64 PER of DSRC with C-V2X ................................................................................... 109
Figure 65 PER of DSRC with 20 MHz Wi-Fi adjacent channel transmissions..................... 110
Figure 66 PER of DSRC with 40 MHz Wi-Fi adjacent channel transmissions..................... 111
Figure 67 Horn RTT Delay Spread Visualization in Google Earth ....................................... 130
Figure 68 Horn RTT Doppler Spread Visualization in Google Earth ................................... 131
Figure 69 Discone RTT Delay Spread Visualization in Google Earth .................................. 132
Figure 70 Discone RTT Doppler Spread Visualization in Google Earth .............................. 133
Figure 71 Horn PTT Delay Spread Visualization in Google Earth ....................................... 134
Figure 72 Horn PTT Doppler Spread Visualization in Google Earth .................................... 135

xvii
Figure 73 Discone PTT Delay Spread Visualization in Google Earth .................................. 136
Figure 74 Discone PTT Doppler Spread Visualization in Google Earth ............................... 137
Figure 75 Path loss model for the horn antenna at a height of 6ft ......................................... 139
Figure 76 Path loss model for the horn antenna at a height of 25ft ....................................... 139
Figure 77 Path loss model for the horn antenna at a height of 32ft ....................................... 140
Figure 78 Path loss model for the discone antenna at a height of 6ft .................................... 140
Figure 79 Path loss model for the discone antenna at a height of 25ft .................................. 141
Figure 80Path loss model for the discone antenna at a height of 32ft ................................... 141
Figure 81 Path loss model for the horn antenna at 6ft ........................................................... 143
Figure 82 Path loss model for the horn antenna at 20ft ......................................................... 143
Figure 83 Path loss model for the horn antenna at 40ft ......................................................... 144
Figure 84 Path loss model for the discone antenna at 6ft ...................................................... 144
Figure 85 Path loss model for the discone antenna at 20ft .................................................... 145
Figure 86 Path loss model for the discone antenna at 40ft .................................................... 145
Figure 87 Google Earth plot of K values in dB ..................................................................... 146
Figure 88 RTT RSU Omnidirectional Low Power 200m from crossing ............................... 147
Figure 89 RTT RSU Omnidirectional High Power 200m from crossing .............................. 147
Figure 90 RTT RSU Omnidirectional Low Power 50m from crossing ................................. 148
Figure 91 RTT RSU Omnidirectional High Power 50 m from crossing ............................... 148
Figure 92 PTT RSU Omnidirectional Low Power ................................................................ 149
Figure 93 PTT RSU Omnidirectional High Power ................................................................ 149
Figure 94 Spectrum Analyzer Photo for DSRC Signal (ch 172) and LTE Signal (ch 174) .. 150
Figure 95 Validation of 20 MHz Wi-Fi and DSRC Signal .................................................... 150
Figure 96 Validation of 40 MHz Wi-Fi and DSRC Signal .................................................... 151

xviii
Figure 97 Ricean K for before/after Crossing #3................................................................... 152
Figure 98 Ricean K for before/after Crossing #4................................................................... 152
Figure 99 Ricean K for before/after Crossing #6................................................................... 153
Figure 100 RMS delay for before/after Crossing #3 ............................................................. 153
Figure 101 RMS delay for before/after Crossing #4 ............................................................. 153
Figure 102 RMS delay for before/after Crossing #6 ............................................................. 154
Figure 103 Path loss exponent for before/after Crossing #3.................................................. 154
Figure 104 Path loss exponent for before/after Crossing #4.................................................. 154
Figure 105 Path loss exponent for before/after Crossing #6.................................................. 155
Figure 106 Ricean K for before/after rural crossings ............................................................ 155
Figure 107 RMS delay for before/after rural crossings ......................................................... 155
Figure 108 Path loss exponent for before/after rural crossings ............................................. 156

xix
List of Tables
Table I Regulatory and Environmental parameters ................................................................. 11
Table II Vehicles’ Average Stopping Distance With Related to Speed [26] ........................... 17
Table III Notification Distances for Different Locomotive Speeds ......................................... 18
Table IV Hardware Configurations ......................................................................................... 23
Table V Propagation Channel Parameters for Wide-open Space and Artificial Shadowing ... 31
Table VI Propagation Channel Parameters for SVRR Tracks ................................................. 42
Table VII Mean and variance of Ricean K, path loss exponent, RMS delay .......................... 66
Table VIII List of technical challenges .................................................................................... 83
Table IX Summary of technical surveys .................................................................................. 90
Table X Measurements Configurations ................................................................................. 100
Table XI Part names from Figure 40 ..................................................................................... 101
Table XII Part names from Figure 42 .................................................................................... 103
Table XV List of papers related to contributions................................................................... 115
Table XIV Summary of Horn RTT Delay and Doppler Spread Measurements .................... 130
Table XV Summary of Discone RTT Delay and Doppler Spread Measurements ................ 132
Table XVI Summary of Horn PTT Delay and Doppler Spread Measurements .................... 134
Table XVII Summary of Discone PTT Delay and Doppler Spread Measurements .............. 136
Table XVIII RTT Path Loss Model Summary ...................................................................... 138
Table XIX PTT Path loss model summary ............................................................................ 142
Table XX Average Ricean K-Factors (dB) ............................................................................ 146

xx
Abbreviations
1G first generation
3GPP 3rd
Generation Partnership Project
4G 4th
generations
5G 5th
generations
BPSK Binary Phase Shift Keying
BSM Basic Safety Message
C-V2X Cellular Vehicle to Everything
CCH Control Channel
CDF Cumulative Distribution Function
CH Channel
DAV Detect and Vacate
DL Downlink
DSRC Dedicated Short Range Communications
DSSS Direct Sequence Spread Spectrum
EMI Electro-Magnetic Interference
FCC Federal Communications Commission
GPS Global Positioning System
GSM-R Global System for Mobile Communication - Railway
ICWS Intersection Collision Warning System
IoT Internet of Things
IoV Internet of Vehicles
IP Internet protocol
xxi
ITS Intelligent Transportation Systems
LCX Leaky Coaxial Cables
LoS Line of Sight
LTE-R LTE-Railroad
LTE-U LTE Unlicensed
LTE-V LTE for Vehicles
LTE Long-term evolution
NHTSA National Highway Traffic Safety Administration
NLoS Non Line of Sight
NPRM Notice of Proposed Rulemaking
OBU Onboard Unit
OFDM Orthogonal Frequency Division Multiplexing
PDP Power Delay Profile
PDR Packet Delivery Ratio
PER Packet Error Rate
PL Path Loss
QAM Quadrature Amplitude Modulation
QoS Quality of Service
QPSK Quadrature Phase Shift Keying
RF Radio Frequency
RMa Rural Macro
RMS Root Mean Square
RoF Radio Over Fiber
RSU Roadside Unit

xxii
Rx Receiver
SAE Society of Automotive Engineers
SCH Service Channel
SINR Signal to Interference plus noise Ratio
SMa Suburban Macro
SPS Semi Persistent Scheduling
SVRR Shenandoah Valley Railroad
TDD Time Division Duplex
TTCI Transportation Technology Center, Inc.
Tx Transmitter
U-NII Unlicensed National Information Infrastructure
UL Uplink
UMa Urban Macro
V2I Vehicle to Infrastructure
V2P Vehicle to Pedestrian
V2R Vehicle to Railroad
V2T Vehicle to Train
V2V Vehicle to Vehicle
V2X Vehicle to Everything
WIMAX Worldwide Interoperability for Microwave Access

1
Chapter 1 Introduction
1.1 Vehicle-to-Everything (V2X) Communication
Commercial cellular wireless communication systems evolved from analog first generation
(1G) cellular systems to the current fourth generation (4G) and long-term evolution (LTE),
which is intended to promote further continuous evolution. Fifth-generation (5G) wireless
systems are expected to extend and improve current 4G LTE cellular systems. As 5G
becomes more flexible in the future, it will develop the capability to support a wide range of
services: gigabit per second data throughput and low latency will enable 5G systems to
support such applications as smart city cameras, self-driving cars, augmented reality, etc.
Self-driving cars, a 5G application, can be developed with a technology called connected car
or the Internet of Vehicles (IoV), which is a combination of Internet of Things (IoT) and
intelligent transportation systems (ITSs). Dedicated short-range communications (DSRC) is a
current standard for ITS applications, so it is a natural candidate for use in IoV systems.
DSRC uses center frequencies near 5.9 GHz, and it is closely related to WiFi. DSRC has
been deployed to the market and its usage is slowly growing.
The distinctive end users of IoV will be vehicles and drivers, but IoV also has the potential to
enable communications between road vehicles and pedestrians, trains, ships, airplanes,
unmanned aerial vehicles, and much more. This is referred to as vehicle-to-everything (V2X).
V2X enables numerous convenient, but not necessarily time-critical applications and services.
Because V2X applications do not rely on classical vehicular communication, sufficient
validation of the feasibility of these applications is required. Therefore, V2X system designs
must be proven effective for desired applications.

2
Within V2X communications, we consider and provide contributions in three important areas:
vehicle-to-train (V2T) communication, also referred to as vehicle-to-railroad (V2R), cellular
vehicle-to-everything (C-V2X) communication, and propagation channels for vehicular
communication.
1.2 V2T Communications
A collision between a train and a vehicle happens about once per 90 minutes in the US [1].
These accidents, which lead to injury and death, are mainly caused by drivers’ lack of
awareness about approaching trains. Most accidents happen near railroad-grade crossings [1,
2]. Despite efforts, like by Operation Lifesaver, installing safety related features at grade
crossings, more than 80% of U.S. crossings are considered as “unprotected,” meaning the
crossing has no safety devices such as lights, warnings, or gates [1]. In addition, during
January–December 2012, about 10% of reported train accidents were V2T collisions,
accounting for almost 95% of reported train accident fatalities [2].
Through direct communication between vehicles and trains or indirect communication with
the aid of a relay, V2T communication comprising the transmission and reception of warning
messages will be possible. Unlike typical vehicle-to-vehicle (V2V) or vehicle-to-
infrastructure (V2I) communications, the presented system is transmitting warning of an
approaching train that is running on a known and fixed track. Therefore, the focus of a V2T
communication application would be different from V2V or V2I communication. Because
DSRC is currently used for communication among vehicles and between vehicles and
roadside infrastructure, the new V2T application requires a proper feasibility study and
performance evaluation in typical railroad environments.

3
1.3 C-V2X Communications
On February 20, 2013, the Federal Communications Commission (FCC) issued a notice of
proposed rulemaking (NPRM) regarding the potential use of the 5.9-GHz DSRC spectrum by
Unlicensed National Information Infrastructure (U-NII) devices. According to FCC Docket
ET 13-49 [3], the FCC is considering the sharing of the 5.85–5.925-GHz spectrum between
DSRC and unlicensed devices. The 5.85–5.925-GHz spectrum was originally used for DSRC
with seven different channels, each with a 10-MHz bandwidth. The proposed U-NII-4
Channel 163, with a center frequency at 5.815 GHz, will correspond to the 160-MHz
bandwidth. Meanwhile, the proposed U-NII-4 Channel 171, with a center frequency at 5.855
GHz, will correspond to 80 MHz, and the proposed U-NII-4 Channel 175, with a center
frequency at 5.875 GHz, will correspond to 40 MHz. Finally, the proposed U-NII-4 Channel
177, with a center frequency at 5.885 GHz, will correspond to 20 MHz. As shown in the
proposed U-NII-4 channel allocation in Figure 1, the lower 45-MHz bandwidth of the DSRC
band may be allocated for co-channel existence or adjacent channel existence with unlicensed
devices. The primary unlicensed devices could be 802.11ac or LTE devices. If LTE is used
for vehicular communication and a substitute DSRC application, LTE for vehicular
communication will be termed C-V2X. If 802.11ac uses the spectrum, both U-NII-4 devices
and DSRC will be categorized as WiFi devices. To inform the FCC decision about permitting
C-V2X or WiFi in DSRC spectrum bands, it is necessary to characterize performance of
DSRC in the presence of co-channel interference and adjacent channel interference due to C-
V2X and due to WiFi.

4
Figure 1 DSRC and proposed U-NII-4 spectrum bands
1.4 Propagation Channels for Vehicular Communications
A DSRC system has a communication range of up to 1.0 km with strong line-of-sight (LoS)
communication and no interference. However, the range of communication is highly relying
on the surrounded environment, and it is possible to significantly reduce due to the existence
of any surrounding interference sources or non-line-of-sight (NLoS). DSRC radios and
protocols already contain mechanisms that allow reliable communication in typical vehicular
environments. However, the reliability is also affected by interference at the same time.
Propagation channel parameters, such as root mean square (RMS) delay spread, Ricean-K
factor, and path loss exponent, can represent the conditions of the surrounding propagation
environment. Use of the same physical setup for DSRC radio measurements and propagation
measurements can provide instantaneous numeric DSRC performance values and propagation

5
statistics at the same time. The relationship or correlation between propagation channel
statistics and DSRC performance can be found using the same physical setting for the two
types of measurements. By knowing the relationship between DSRC performance and
propagation channel statistics, when a service provider is planning to implement a vehicular
communication-related application in a certain place, it can estimate the DSRC performance,
reducing the need for field testing. Therefore, validating the relationship between DSRC
performance and propagation channel statistics reduces the cost of deploying a new DSRC
infrastructure and applications.
1.5 Overview of Dissertation
The vehicular communication field is a focus of industrial and academic research and will be
a major 5G wireless research area. For future research in the field, vehicular communication
requires contributions from industry, the academy, and government. Their interests in
vehicular communication will be different: companies must fulfill customers’ needs,
academic researchers seek technical advances for the field and future works, and government
must ensure that development of vehicular communication is safe and protects citizens’ lives.
Therefore, this dissertation presents one type of vehicular communications as a critical safety
application, considers upcoming regulation issues and associated technical and research
challenges that would result from possible regulatory decisions, and presents measurements
that evaluate feasibility of adjacent-channel band sharing between vehicular communications
and other wireless technologies.

6
Chapter 2 Summary of Contributions
This research presents three major contributions:
1. A V2T communication feasibility study and performance evaluation
2. A strategic survey of literature related to potential regulatory decisions that identifies
technical challenges associated with several possible decisions and summarizes
relevant research to date related to these challenges. The results of this study can be
used to set a research agenda in vehicular communications.
3. An experimental evaluation of DSRC performance in the presence of adjacent
channel interference from Wi-Fi, LTE, and C-V2X signals.
2.1 V2T Communication Feasibility Study Performance Evaluation,
and Statistical Analysis
The first contribution of this research is a feasibility study of V2T communication in wide-
open space and shadowing environments and a performance evaluation of a DSRC radio for
V2T communication in wide-open space, shadowing, rural, and suburban environments. The
key aspects of the research are described below:
This work presented a V2T communication scenario for broadcasting warning
messages, which is a new type of application for V2X communication.
This work presented the numeric requirements for and a feasibility study of V2T
communications with DSRC, which is differs from prior works.
It proposed and implemented a measurement methodology for the feasibility study
and performance evaluation, which only able to find simple methods from prior
works.

7
It provided a recommended configuration of hardware tools used for measuring
propagation channel statistics and a DSRC performance evaluation measurement.
It characterized the impact of the propagation environment, modulation schemes,
transmit power level, and antenna types on the performance of DSRC for V2T
communication.
It presented tools for propagation channel measurements and a DSRC performance
measurement, similar to that presented for Contribution 1.
It provided a measurement methodology to align two independent measurement
results.
It presented results showing propagation channel statistics relative to positions in
locations shared with a DSRC performance evaluation.
It presented a linear regression model among propagation channel statistics, the
Packet Error Rate (PER), and the relative distance from a train to a crossing.
It compared the observed models from previous works.
2.2 ITS Band Regulatory Survey
The second contribution of the research is a regulatory contingency study for FCC and
NHTSA’s possible spectrum sharing plan at ITS bands, presented potential technical
challenges, and technical surveys related to presented technical challenges.
FCC and NHTSA’s 5.9 GHz ITS band possible scenarios are presented
The ITS band sharing scenarios can be adaptable for sharing spectrum in other bands
Based on technical surveys, more papers were found that related to usage of DSRC
or C-V2X only than papers related to coexistence
8
Technical challenges/research priorities identified for multiple regulatory
contingencies
If mandated, interoperability between DSRC and C-V2X would be the most difficult
technical challenge
2.3 Adjacent Channel Interference Evaluation
The third contribution of the research is a performance evaluation of DSRC (5.855–5.865
GHz) with the existence of C-V2X, which acts as adjacent channel interference (5.865–5.875
GHz and 5.875–5.885 GHz). The outcomes of the research to date are described below:
It provided tools not yet deployed in the actual market for measurements relevant to
broadcasting DSRC-deployed technology in the spectrum band and broadcasting Wi-
Fi, LTE, and modified C-V2X signals at adjacent channels.
It provided a measurement methodology to evaluate DSRC performance by setting
the adjacent interference sources at desired spectrum bands.
It provided results about the impact of adjacent channel interference from Wi-Fi, LTE, and C-
V2X on DSRC performance.

9
Chapter 3
V2T Communication Feasibility Study and
Performance Evaluation
3.1 Introduction
Collisions between trains and vehicles that lead to injury or death are mainly caused by a
driver’s lack of awareness of an approaching train. According to reference [2], most accidents
happen near railroad-grade crossings. Efforts such as Operation Lifesaver to implement
safety related features at crossings improved the safety at many grade crossings, but about 80%
of U.S. crossings are still considered as unprotected, meaning the crossing has no lights,
warnings, or gates [4]. In addition, in 2016, about 95% of all reported railroad accidents were
due to V2T collisions [2].
For ITSs, DSRC [4] is the major recommended protocol for V2V and V2I communications.
DSRC’s center frequency is at 5.9 GHz, with seven 10-MHz channels between 5.850 and
5.925 GHz. One feature of DSRC is an early warning system to avoid a potential vehicle
collision [5].
Unlike typical V2V or V2I, V2T collisions feature several different aspects. The usual
communication environment near a crossing is similar to an intersection on a vehicle road;
however, the visibilities of trains and vehicles are different. At typical vehicle intersections,
drivers are able to view the other vehicles at the other points of the intersection, as well as to
prepare for a potential accident, to an extent. However, drivers find it hard to prepare for
oncoming trains due to a blocked view or the fact that it is difficult for a vehicle to stop once

10
the driver notices an oncoming train. In addition, the time to stop is different; trains take
much longer than a vehicle to stop, and vehicle drivers are able to react faster to avoid
collisions. Therefore, the safety warning applications used for trains must differ from those
used for vehicles.
In this section, the V2T communications architecture for an early warning application is
presented. Because it is more difficult for a train driver to react than for a vehicle driver, the
train’s role is always transmitter and the vehicle’s role is receiver in the architecture. The
designed system targets messages transmitted from a train approaching a crossing and
running on a known track. The DSRC receivers in the road vehicles near the crossing
determine whether to trigger a warning based on the location difference between the
oncoming train and the position of the vehicle.
We measured the DSRC performance, as well as the wireless propagation environment, under
a variety of operational conditions. The measurements used place at crossings of the
Transportation Technology Center, Inc. (TTCI) at Pueblo, Colorado, and the Shenandoah
Valley Railroad (SVRR) at Staunton, Virginia.
We presented a V2T communications architecture for early warning systems with scenarios
and safety requirements related to train and vehicle speeds and stopping distances. Through
the DSRC performance measurements, we evaluated the feasibility of adapting DSRC to the
proposed V2T communications architecture to enable a warning application that meets the
safety requirements, such as packet reception within the stopping distance, to prevent
collisions. From the wireless propagation measurements, we compared the propagation
channel characteristics of our measurements and characteristics of V2V or V2I cases from
previous works to identify near environments.

11
The setups for DSRC radios can be defined into regulatory parameters which are fixed and
selective by the environments that radios face and the setup is highly effective by
environmental parameters which are flexible and easily different by where the radio will
deploy. By knowing the expected DSRC performance under certain combinations of
environmental parameters, DSRC can select the setup based on fixed regulatory parameters
and provide the best performance under the environment. Table I showed the types of
environmental parameters, values for DSRC, and considerable environmental parameters.
Within the considerable parameters, we selected propagation channel characteristics to
evaluate the relationship between the parameters and DSRC performance. For generating the
models, the estimation methods are mainly using in the process. The estimation methods used
are 1) finding mean and variance for finding one independent value at the certain setup of an
experiment, 2) finding a linear model by applying linear regression models where
independent and dependent aspects existing at the certain setup of the experiment.
By knowing the relationship between DSRC performance and propagation channel statistics,
when a service provider is planning to implement a vehicular communication related
application to a certain place, they can estimate the DSRC performance, reducing the need for
field testing. Therefore, validating the relationship between DSRC performance and
propagation channel statistics reduce the cost of deploying new DSRC infrastructure and
applications.
Table I Regulatory and Environmental parameters
Parameter type Parameter name Value

12
Regulatory
Parameter
Available BW 75 MHz (10 MHz x 7 ch + 5 MHz extra) @ 5.9 GHz
Coexisting
Technologies
Co-channel, adjacent channel
User multiplexing
schemes
TDM only
Data channel coding Convolutional
Resource Selection CSMA-CA
Modulation support Up to 64QAM
Waveform OFDM
Transmission period Once every 100ms/50ms
MIMO support No
Data messages 50 symbols
CP 1.6 us
Subcarrier spacing 156.25 kHz
Flexibility Flexible number of OFDM symbols
Environmental
Parameter
# of vehicles/km2
Traffic speed <25mph, 25~45 mph, 65mph<
Vehicle spacing <2m, <15m, <50m, <100m
Terrain
Rural: wide open space, one or two low height building
Suburban: more number of low height buildings
CH condition LOS

13
3.2 Related Works
Researchers have studied use of Wi-Fi-based and LTE-based systems for warning
applications such as V2V and Vehicle to Pedestrian (V2P). In [6], the authors combined
IEEE 802.11p-based multi-hop clustering and a 4G cellular system. Similar to the concept in
[6], [7] presented Wi-Fi-associated warning applications; the difference from [6] was they
focused on the performance of a single device. In [8], the authors compared the performance
between IEEE 802.11p and LTE for vehicles (LTE-V) under the intersection collision
warning system (ICWS), which is an environment similar to our warning application, a
crossing. Moreover, we observed a similarity in the architecture in the use of a roadside unit
(RSU) placed near the intersection and acting as a relay. The concept is also shown in [9],
which presented a V2V relay network in an obstructed environment. The authors of [10]
presented a warning application for pedestrians, named V2P. In the presented system, the
minimum notification distance was represented, and our architecture has the minimum
notification time and distance for safety, as well. As shown in [6]–[10], we observed a
warning application representing methodologies by showing the major components,
architecture, and minimum requirements for using the application, and some were similar to
the methodology used to represent our architecture.
There are studies on train communications services using advanced wireless technologies,
such as LTE and Global System for Mobile Communication - Railway (GSM-R). In [11], the
author presents an LTE-railroad (LTE-R) testbed with an Internet protocol (IP)-based
network architecture. The authors demonstrate the performance of the testbed and confirm
that reliable communications and multimedia services that require high data rates are feasible.
In [12], the authors propose a feasible quality-of-service (QoS) management scheme for

14
control train traffic using a conventional LTE system. In [11], the authors presented a GSM-
R-based train-related monitoring system for the entire rail network in the UK. The authors of
[14] presented technical surveys of possible candidates for railroad technologies, including
GSM-R, Wi-Fi, Worldwide Interoperability for Microwave Access (WIMAX), LTE-R, Radio
Over Fiber (RoF), Leaky Coaxial Cables (LCX), and cognitive radio. They concluded that
WIMAX and LTE could be the best technologies for train-related communications;
interestingly, the authors did not consider DSRC a candidate. We presented train
communication using a DSRC protocol, one that was not considered by the authors of [11]–
[13].
The concept of V2T communications was introduced in [15], which describes a vehicle-to-
train early warning system that are designed and managed for trains and vehicles near
railroad crossings in Australia [15]. In [15], the authors were more focused on the warning
architecture and the degree of noticing warnings than the reception performance of the radio
communications; without considering the reception performance, the noticing performance
can differ in the various conditions in which the application will be implemented. In addition,
there have been many related theoretical studies and measurement campaigns. In [16] and
[17], the authors explore the antenna criteria for a railroad crossing safety application and
derive an optimal antenna pattern for practical installation. While [16] and [17] present
theoretical antennas, [16] presents empirical models and measurement results for 5.8-GHz
propagation channels in train environments. The authors of [19] introduce a V2T early
warning system architecture, and they present their DSRC performance and propagation
channel measurements at the measurement sites. In [16]–[19], DSRC performance and
propagation channels are measured. This paper extends our prior work in [16], [17], and [19].
In those works, DSRC technology was proven to have the potential to offer a cost-effective

15
approach to the deployment of an early warning system to avoid V2T collisions. We
presented a more detailed V2T early warning system architecture with safety requirements
and DSRC performance evaluations in six more crossings than in [19]; the results that will be
presented in later sections are an extension of the studies in [16]–[19].
Studies on 5.9-GHz or vehicular communication environment propagation channel
characteristics are presented in [20]–[25]. The authors of [20] measured and analyzed the
propagation channel measurements at 930 MHz in a practical high-speed railway and
provided a Ricean K-factor and path loss equation with the relative distance and height of a
viaduct. In [21], the authors presented a path loss exponent from the measured path loss
values of urban and suburban scenarios at 5.9 GHz with transmitter antenna heights of 1.5
and 3.5 m. The measurements were performed at 5.6 GHz. Also, the authors compared
measured results between time- and frequency-varying K-factor in [22] and delay and
Doppler spreads in [23]. Similarly, the authors of [24] and [25] measured the propagation
channel at 5.9 GHz and presented a delay spread and Doppler spread in rural, urban, and
highway environments. The methodology of [18] and [25], using the PDP, is used for our
analysis method. From our measurement results at 5.9 GHz, including those extended from
[18] and [19], we compared the values in [20]–[25] to evaluate the measurement site types
and how the V2T propagation channel differs from that of V2V or V2I
3.3 V2T Communication Scenarios and Requirements
The considered V2T communication scenario comprises an oncoming train, vehicles
approaching to crossing, and an infrastructure transceiver, such as a light signal or a signal

16
pole near the crossing. The possible early warning system for V2T communication scenarios
comprises a direct case and indirect warning cases. The scenarios are shown in Figure 2.
Figure 2 V2T communication scenario
For direct warning, the driver of vehicles receives the message about warning directly from
the transmitter in the train. This scenario is preferred at low vehicle speeds and where the
radio channel between the train and vehicle is a strong LoS condition.
For indirect warning, the train is broadcasting messages of warning to the infrastructure
transceiver which placed near the crossing, a RSU, and it retransmits the messages to the on-
board unit (OBU) on the vehicles; the RSU has a role of a relay. The indirect warning is
preferable when the speed of the vehicle is higher and the propagation channel between the
infrastructure and when the train has a stronger LoS component than that between the train
and the vehicle.
17
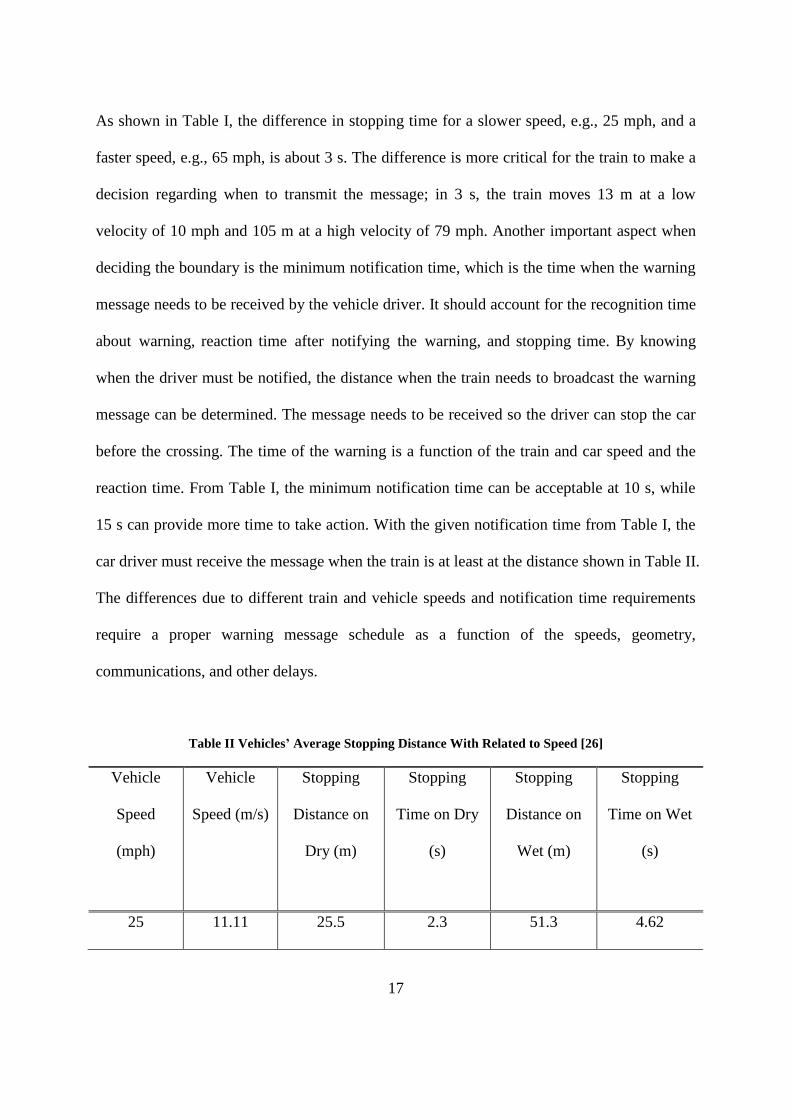
As shown in Table I, the difference in stopping time for a slower speed, e.g., 25 mph, and a
faster speed, e.g., 65 mph, is about 3 s. The difference is more critical for the train to make a
decision regarding when to transmit the message; in 3 s, the train moves 13 m at a low
velocity of 10 mph and 105 m at a high velocity of 79 mph. Another important aspect when
deciding the boundary is the minimum notification time, which is the time when the warning
message needs to be received by the vehicle driver. It should account for the recognition time
about warning, reaction time after notifying the warning, and stopping time. By knowing
when the driver must be notified, the distance when the train needs to broadcast the warning
message can be determined. The message needs to be received so the driver can stop the car
before the crossing. The time of the warning is a function of the train and car speed and the
reaction time. From Table I, the minimum notification time can be acceptable at 10 s, while
15 s can provide more time to take action. With the given notification time from Table I, the
car driver must receive the message when the train is at least at the distance shown in Table II.
The differences due to different train and vehicle speeds and notification time requirements
require a proper warning message schedule as a function of the speeds, geometry,
communications, and other delays.
Table II Vehicles’ Average Stopping Distance With Related to Speed [26]
Vehicle
Speed
(mph)
Vehicle
Speed (m/s)
Stopping
Distance on
Dry (m)
Stopping
Time on Dry
(s)
Stopping
Distance on
Wet (m)
Stopping
Time on Wet
(s)
25 11.11 25.5 2.3 51.3 4.62

18
35 15.55 41.4 2.66 82.8 5.32
45 20 59.1 2.96 118.2 5.91
55 24.44 79.8 3.27 159.3 6.52
65 28.89 103.2 3.57 206.7 7.15
Table III Notification Distances for Different Locomotive Speeds
Locomotive Speed
(mph)
Locomotive Speed
(m/s)
Notification Time (s) Notification Distance
(m)
10 4.44 10 44.4
15 66.6
20 8.88 10 88.8
15 133.2
50 22.22 10 222.2
15 333.3
79 35.11 10 351.1
15 526.7
3.4 Measurements Characteristics
3.4.1 Measurement Category
We took two major measurements: the DSRC performance measurement and radio frequency
(RF) propagation characterization measurement. Both measurements shared the same
crossing points and same locomotive; however, the tools differed.

19
1) DSRC Performance Measurement
The purpose of DSRC performance measurements is to evaluate the performance of V2T
communication to determine whether the performance can cover the minimum notification
distance for both the locomotive and the vehicle. The performance metric of DSRC is the
PER, within a certain distance window, 20 m, related to the distance to the crossing point.
The distance values are calculated between the crossing and instantaneous Global Positioning
System (GPS) locations. The PER was calculated from the post-process by comparing the
received packets and the transmitted packets.
2) RF Propagation Characterization
The RF propagation characterization measurements’ purpose is to measure the propagation
channel characteristics parameters for the area close to the train tracks where DSRC
performance measurements were taken. Because of the DSRC performance measurements
used (5.875–5.885 GHz and Channel 176), the RF propagation characterization measures the
5.86–5.91-GHz frequency range, which covers the measuring spectrum bands, with the direct
sequence spread spectrum (DSSS) channel sounder [26]. The channel sounder [26] that we
used transmitted a continuous waveform with a 2,047-m long sequence-spreading code,
which is clocked at the rate of 25 MHz; using 50 MHz RF bandwidth. Both radios used a
GNU Radio program and USRP B210. The data were scanned and saved at intervals of 0.5 s.

20
3.4.2 Measurement Parameters/Settings
1) DSRC Radios
For the DSRC performance measurements, Cohda MK5 DSRC radios for both the OBU and
RSU [27] are used. For both the TTCI and SVRR tracks, one DSRC OBU, which acted as the
transmitter, was installed on the locomotive engine and it used Channel 174 (center frequency
of 5.87 GHz). The OBU antenna was placed on top of the train’s long hood, right after the
engineer’s cab; the height from the ground to the tip of the antenna, including the height of
the train, was approximately 5 m. The antenna installation is shown in Figure 3. For both the
TTCI and SVRR tracks, the radios on the vehicles or the infrastructures acted as the receiver.
2) DSRC Radio Displacements
For both the TTCI and SVRR tracks, the DSRC OBU that performs as the receiver is on the
roof of a bucket truck, which is about 1.7 m in height, as shown in Figure 4(b) and Figure 5(a)
for the TTCI track and Figure 5(b) for the SVRR track. For the TTCI track wide-open space,
named the railroad test track (RTT) setup, the DSRC OBU is placed about 50 m away from
the crossing. For the TTCI track artificial shadowing, named the precision test track (PTT)
setup, the DSRC OBU is placed about 3 m away from the railroad cargos, and the cargos
were about 2 m away from the operating track. The displacements of the cargos are shown in
Figure 6. The DSRC RSUs are placed about 6–7 m from the ground, as shown in Figure 4(a)
and (b). For the SVRR track, the DSRC OBU at Crossing #2 is about 42 m away from the
track, and at Crossing #5, it is about 36 m away from the track. For the DSRC RSU that
performs as a receiver, the radio is hanged on the tip of a 3-m-tall tripod, as shown in Figure
5(c), and it is placed about 4–7 m away from the crossing.

21
Figure 3 Antenna installations for TTCI
Figure 4 (a) DSRC OBU and RSU displacement for wide-open space TTCI, (b) DSRC OBU and RSU
displacement for artificial shadowing TTCI

22
Figure 5 (a) DSRC OBU installation for shadowing TTCI, (b) DSRC OBU installation for SVRR, (c)
DSRC RSU installation for SVRR
Figure 6 Displacement of the cargos for the TTCI track

23
3) Channel Sounder Radio Displacements
For both the TTCI and SVRR tracks, the receiver is on top of the train engine, where the
DSRC transmitter is placed. For the TTCI track, the channel sounder transmitter is hanged
about 10 m from the ground and placed at the end of the track; the channel sounder antenna is
placed above the DSRC RSUs. For the SVRR track, the channel sounder transmitter is
hanged on the tip of 3-m-tall tripod, similar to the DSRC RSU, and it is placed about 4–7 m
away from the crossing.
4) Configurations
For both the TTCI and SVRR tracks, the DSRC OBU and RSU as receivers used a 6-dBi
omnidirectional antenna [28]; the antenna pattern is shown in Figure 7(a) and (b). The
transmitter for the TTCI track used a 12-dBi omnidirectional antenna [28] with a 23-dBm
power level; the antenna pattern of the 12-dBi omnidirectional antenna [28] is the same as
that of the 6-dBi antenna. The transmitter for the SVRR track used a 12-dBi omnidirectional
and 12-dBi bi-directional antenna [29] with power levels of 11 and 23 dBm, respectively; the
antenna pattern of the bi-directional antenna is shown in Figure 7(c) and (d). The installed
omnidirectional antenna is shown in Figure 8, and the installed bi-directional antenna is
shown in Figure 9. The modulation scheme for the TTCI track is QPSK, while the
modulation schemes for the SVRR track are BPSK, QPSK, and 16 QAM. The hardware
configuration is shown in Table IV.
Table IV Hardware Configurations
Parameter Configuration

24
Antenna Type 12dBi Omnidirectional [28]/ Bi-directional [29]
(Transmitters)
6dBi Omnidirectional [28] (Receivers)
Transmit Power 11 / 23 dBm
Modulation BPSK, QPSK, 16QAM
Figure 7 (a) Omnidirectional antenna’s elevation pattern, (b) horizontal pattern, (c) bidirectional
antenna’s elevation pattern, (d) horizontal pattern

25
Figure 8 Omnidirectional antenna
Figure 9 Bi-directional antenna

26
5) Train Operations
For both the TTCI and SVRR tracks, the train made a “pass” through the measurement region.
For each pass, the train started 1 km for the TTCI track and 300–400 m for the SVRR track
before the crossing and it accelerated until hits the desired test speeds of 20, 50, and 79 mph
for the TTCI track and 10 mph for the SVRR track. The rate of 79 mph is the highest speed a
locomotive can run in the US, and 10 mph is the maximum speed allowed due to the SVRR’s
track regulations. For all cases, the locomotive maintained a constant speed through the test
area and then decelerated after the train passed a certain distance beyond the crossing.
3.5 Data Analysis Methods
Because V2T communication is for safety-critical applications, the performance metric
should be related to the distance between the locomotive and the crossing. To be effective,
the system must provide a reliable warning signal at/before the minimum notification
distance for the driver to be able to react and safely stop the vehicle before the crossing.
With the different regions of interest, the evaluations of performance should be highlighted in
the region; performance beyond the region may also be important because of the potential for
applications other than V2T communication. If the performance is good enough within the
regions, we could assume the driver is able to receive the warning messages within the
minimum notification time, preventing a potential collision.
3.5.1 DSRC Data Analysis
For the DSRC performance measurements, the application named basic safety message (BSM)
which using a packet size of 99 bytes was used. Each packets are continuously transmitted
every 0.05 s. The PER is calculated by comparing the transmitted and received packets within

27
a 20-m range window. The number of transmitted packets’ average is 94 within the 20-m
range window, and we decided the threshold about packet reception as should receiving more
than 10 packets in the window range, which represents at least one packet captured per 2-m
range. With the threshold, we decided that if less than 10 packets were received within the
window ranges, we would consider this to mean reliable communication was not achieved.
When the PER is equal to or less than 0.9, we consider the DSRC performance as having
satisfied the minimum requirement for safety and succeeded in receiving the warning
message. PER can be given by:
PER = 1 −𝑁𝑢𝑚𝑏𝑒𝑟 𝑜𝑓 𝑅𝑒𝑐𝑒𝑖𝑣𝑒𝑑 𝑃𝑎𝑐𝑘𝑒𝑡𝑠
𝑁𝑢𝑚𝑏𝑒𝑟 𝑜𝑓 𝑇𝑟𝑎𝑛𝑠𝑚𝑖𝑡𝑡𝑒𝑑 𝑃𝑎𝑐𝑘𝑒𝑡𝑠 (1)
3.5.2 Propagation Data Analysis
With the recorded data from the channel sounder, we created the power delay profile (PDP)
to evaluate the propagation channel characteristics. The PDP contains one bin per 65 ns of
delay, which is the shortest time delay we can evaluate.
With the created PDP, we calculated the propagation channel characteristics. The path loss
exponent, RMS delay spread, and Ricean K-factors are post-processed with the recorded data.
We calculated Ricean K-factors by the ratio between the LoS, a dominant path signal power,
to the multipath signal power. Ricean K-factors were calculated with the following equation:
K =𝑆𝑝𝑒𝑐𝑢𝑙𝑎𝑟 𝑃𝑜𝑤𝑒𝑟
𝑁𝑜𝑛𝑠𝑝𝑒𝑐𝑢𝑙𝑎𝑟 𝑃𝑜𝑤𝑒𝑟 (2)
We considered the specular power as the LoS power and the non-specular power as the
reflected power in the PDP.
We calculated the RMS delay spread (τrms) and the path loss exponent (n) by comparing the
LoS signal and the multipath signal. The RMS delay spread (τrms), defined as the square root
of the second central moment of the PDP, is:

28
𝜏𝑟𝑚𝑠 = √𝜏2̅̅ ̅ − 𝜏̅2 (3)
The second moment is given by:
𝜏2̅̅ ̅ =∑ 𝑃(𝜏𝑖)𝜏𝑖
2
∑ 𝑃(𝜏𝑖) (4)
The first moment of the PDP, mean excess delay, is given by:
𝜏̅ =∑ 𝑃(𝜏𝑖)𝜏𝑖
∑ 𝑃(𝜏𝑖) (5)
P(τi) is the power level observed in the PDP.
The path loss exponent (n) is defined by:
n =−(𝑃𝑡−𝑃𝑟+10𝑙𝑜𝑔10𝐾0)
10𝑙𝑜𝑔10𝑑 (6)
K0 is the free-space path loss at the reference point where the transmitter is placed, and K0 is
given by:
K0 = 20𝑙𝑜𝑔104𝜋
𝜆 (7)
where d is the distance between the channel sounder transmitter (the crossing) and the
receiver (the train). With these calculations, the channel characteristic parameters can be
obtained from the PDP. All calculations were done with the relative position of the train from
the crossing.
For DSRC measurements, we used (1) for packets within a 20-m distance window and
evaluated the performance by a metric of the PER related to distances. With the threshold of
the PER at 0.9, we define whether the performance can be considered to satisfy. For
propagation channel characteristic measurements, we used (2), (3), and (6) for the same
distance window as the DSRC measurement, and we averaged the total value.

29
3.6 TTCI Results/Evaluations
The TTCI track tests evaluated the DSRC performance for possibly the best- and worst-case
scenarios a train can face. Two scenarios are a wide-open space without any interference
sources near a crossing and an artificial shadowing environment, as shown in Figure 10 and
Figure 11. DSRC performance was measured in each of these environments in terms of PER
as a function of the distance of the train from the crossing.
Figure 10 TTCI Tracks: (a) wide-open space and (b) artificial shadowing environment and radio
displacement

30
Figure 11 TTCI tracks: Test site 1 (wide-open space) and test site 2 (artificial shadowing)
3.6.1 TTCI Sites
The TTCI track’s environmental setups are different. As shown in Figure 10(a), the first setup
is a wide-open space with no existence of any potential reflection or fading sources near the
track. As shown in Figure 10(b), the second setup is an artificial shadowing environment. We
artificially set seven railroad cargos, approximately 4 m in height and 10 m in length,
between the track and DSRC radio, as shown in Figure 4(b). The railroad cargos are
displaced between the track and DSRC receiver, so shadowing is generated.
With these two different scenarios, we evaluated the feasibility of DSRC radios for V2T
communication with possibly the best- and worst-case scenarios in communications: a wide-
open space and a shadowing environment.
For the TTCI track, the DSRC OBU was placed 50 m away from the track, which can be
represented as a 25-mph stopping distance. The locomotive operated at speeds of 20, 50, and
79 mph. The minimum notification time of 10 s is enough time for a 25-mph speed scenario;

31
therefore, the regions of interest for different speeds are 88.8, 222.2, and 351.1 m before and
after the crossing; these values are from Table III.
3.6.2 Propagation Channel Measurements
The propagation channel parameters, average Ricean K-factor (Kavg), RMS delay spread
(rms), path loss exponent (n), and its standard deviation (σ) for the wide-open space and
artificial shadowing scenarios are shown in Table V. We find that the Ricean K-factors are
generally consistent across the entire track, but the difference appears in different speeds;
therefore, we calculated average Ricean K-factors for both tracks’ PDPs with different speeds.
In addition, the path loss exponents are not relevant to the different train speeds; therefore,
we calculated the value for each setup. More detailed evaluations and figures are shown in
Appendix A.
Table V Propagation Channel Parameters for Wide-open Space and Artificial Shadowing
Scenario Train Speed
(mph)
Train
Speed
(m/s)
Propagation Channel
Kavg (dB) rms (ns) n σ
Wide-open Space 20 8.88 10.9 <1 2.7 5.5
50 22.22 9.8 8
79 35.11 11.3 14
Shadowing 20 8.88 10.9 3 2.7 3.1
50 22.22 9.8 9
79 35.11 11.3 4

32
Interestingly, the propagation channel parameters for both tracks are similar. The delay
spreads are different; however, because the unit is ns, the values are still low enough.
Furthermore, the differences in the delay spreads for the different speeds are small. We
expect the reason to be that the two setups have similar propagation channel parameters due
to the significant height of the channel sounder transmitter. The height of the channel sounder
transmitter is higher than the blocked railroad cargos; therefore, the channel sounder
transmitter and receiver have clean sight and they are minimally affected by the cars. In
addition, two buildings placed beside the tracks for the artificial shadowing scenario may
have a minor effect.
We observe Ricean K-factors in the range of 9.76–11.31, and [22] provided 14.2 as a rural
and 14.6 as an on-bridge value. Other than these two cases, the measured Ricean K-factor is
higher than any values from other previous works. For the path loss exponent, we observe it
near 2.8, while [21] measured it as 1.12 for suburban and 1.98 for urban regions; we can
assume V2T communication faces a higher path loss exponent than the vehicle
communication environment. The measured RMS delay spread is much lower than any cases
shown in [23]–[25]. Therefore, under the assumption of operating in a rural environment,
V2T will face a similar fading environment and greater power degradation due to a higher
path loss exponent, but a lower effect from multipath components.
3.6.3 DSRC Performance Measurements
To evaluate DSRC performance, we used 1-PER to see the distribution and cumulative
distribution function (CDF) of the received packets. Using these plots, we can evaluate

33
whether the performance can be defined as satisfactory in the proper regions. For a proper
comparison, we choose OBU results instead of comparing both the OBU and RSU results
because of a different displacement of RSU for the wide-open space and artificial shadowing
environments. The results of RSU for both scenarios are shown in Appendix B.
Figure 12 shows the results of the DSRC performance for the wide-open space scenario. We
can identify the DSRC performance by the PER within the region, as shown in Figure 12(a).
The proper regions for speeds of 20, 50, and 79 mph are +/- 88.8, 222.2, and 351.1 m with
the center at the crossing and a minimum notification time of 10 s. For the wide-open space
scenario, the best environment a locomotive can face, we can identify that the performance
can be satisfied for all three different speeds. The coverage range after the crossing is shorter
than that before the crossing; we assume the existence of a blockage after the position of the
antenna degraded the transmitted power, causing the results. Interestingly, we observe that
the performance of DSRC might not be affected by speed in the wide-open space scenario, as
shown in Figure 12(b). The coverage region seems to make a huge difference (100-m
difference between each speed), but when we compare the overall packet distribution, 50% of
packets were received approximately 200 m before the crossing.
Figure 13 shows the DSRC performance results for the artificial shadowing environment
setup. As shown in Figure 13(a), we are able to observe the effect of shadowing. For all
speeds, we observe a certain gap range, where 1-PER equals 0, and the reason for the event is
due to the shadowing by the railroad cars. The DSRC performance can be identified as
satisfied for all speeds at the minimum notification distances. The interesting aspects of the
artificial shadowing environment are that the performance can be identified as satisfied
whenever a weak signal is captured and the effect of shadowing is lesser for a faster speed.

34
Figure 12 DSRC performance with different speeds for the wide-open space (a) distribution of the DSRC
performance (1-PER), (b) proportion of received packets

35
Figure 13 DSRC performance with different speeds for the artificial shadowing (a) distribution of the
DSRC performance (1-PER), (b) proportion of received packets
3.6.4 Conclusions of TTCI Measurements
From the DSRC performance and the propagation channel measurements in the wide-open
space and artificial shadowing setups, we observe that the DSRC performance could be
identified as satisfactory for both the wide-open space and artificial shadowing environments,
regardless of the train speed. At the same time, we observe that DSRC could receive a BSM,
even if the signal is weak; whenever shadowing appears, no packet is captured by the DSRC

36
radio. In addition, with the assumption of operating in a rural environment, a V2T
communication propagation environment will be similar to the vehicle communication-
propagation environment, with a lesser effect of multipath components. From the TTCI track
experiments, we identify DSRC as a feasible V2T early warning communication environment
for operation in both the best- and worst-case propagation environments—a wide-open space
and shadowing, respectively—a train can face.
3.7 SVRR Results/Evaluations
The SVRR tracks were used to evaluate the DSRC performance in a real environment with
the desired V2T communication setup and to confirm the communication environment
through propagation channel characteristic measurements. We took measurements at six
different crossings, as shown in Figure 14 and Figure 15. The SVRR tracks are placed in a
small town, Staunton, Virginia; therefore, the environment near the crossings has real vehicle
traffic, buildings, woods, and parking lots, as shown in Figure 14. Three crossings, shown in
Figure 14(a), were considered a rural environment, and three crossings, shown in Figure
14(b), were considered a suburban environment (Sheriffs-Skyview Circle in Figure 15).

37
Figure 14 SVRR tracks: (a) Crossings #1, #2, and #3; (b) crossings #4, #5, and #6

38
Figure 15 Crossing locations and crossing sites
3.7.1 SVRR Sites
We used six different crossings along the SVRR tracks, as shown in Figure 14. Figure 14(a)
shows the environments near crossings #1, #2, and #3, while Figure 14(b) shows the

39
environments near crossings #4, #5, and #6. We placed the DSRC RSU at crossings #1, #3,
#4, and #6, and we placed the DSRC OBU at crossings #2 and #5 for the measurements.
As shown in Figure 14(a), the environments of crossings #1, #2, and #3 feature a small
number of buildings near the crossings and many open spaces between the locomotive and
DSRC radios, and the potential fading sources are woods. Buildings with too low a height
exist near the DSRC radio position at crossing #2.
As shown in Figure 14(b), the environments of crossings #4, #5, and #6 are somewhat more
likely suburban environments than those of crossings #1 to #3. There are more buildings near
crossings #4, #5, and #6 than near crossings #1–#3. Crossing #4 is located right beside a four-
lane vehicle road, while crossing #5 suddenly opens from wood walls, and there are
additional buildings nearby.
From the performance evaluations of the SVRR track, we may make detailed parametric
decisions about V2T communications in a real environment with both a direct and an indirect
warning case. The crossings using the DSRC RSU—#1, #3, #4, and #6—represent the
indirect warning, and the crossings using the DSRC OBU—#2 and #5—represent the direct
warning case.
On the SVRR tracks, the speed limit for vehicles is 25 mph. For this speed limit, the stopping
distance is 51.3 m and the stopping time is 4.62 s, as shown in Table II. As with the TTCI
scenarios, the minimum notification time of 10 s is enough for the SVRR track scenarios.
Due to track regulations, the locomotive is only able to operate at 10 mph on the SVRR
tracks. Therefore, the regions of interest for the SVRR tracks are 44.4 m before and after the
crossings.

40
3.7.2 Electromagnetic Interference (EMI)
The scenarios for electromagnetic interference (EMI) measurements are 1) a 10-mph run
with the throttle notch in idle, 2, 5, 8 and 2) a 25-mph run with the throttle notch in idle, 2, 5,
8.
For each locomotive scenario, the measurement was taken using two SA-2500 spectrum
analyzers; one measured EMI inside the crew cabin and the other measured EMI outside the
locomotive. The SA-2500 settings were: span of 10 MHz, resolution bandwidth of 50 kHz,
and reference level of -50 dBm. Each scanning process searches for 10 MHz starting from
5.85 GHz until 5.93 GHz, which covers all DSRC channels.
Sample result plots in Figure 16, Figure 17, and Figure 18 show essentially noise.
Figure 16 EMI measurement result (outside antenna, 25 mph, idle notch, no brakes, 5.92–5.93 GHz).

41
Figure 17 EMI measurement result (outside antenna, 10 mph, notch #5, no brakes, 5.9–5.91 GHz).
Figure 18 EMI measurement result (outside antenna, 10 mph, notch #8, no brakes, 5.898–5.908 GHz).

42
Occasionally, RF signals were captured, but only for one swipe, which means the signal is
not generated by the locomotive. Rather, there is a possibility that when the locomotive
passed a certain point at a certain time, other wireless sources were captured by our spectrum
analyzers. Other than these three figures, all other plots showed consistent RF power levels
corresponding to noise.
From these results, we can conclude there is no EMI from the locomotive. Some cases
showed a few excursions into higher power; however, the peaks were instant and the power
level was only 20–30 dBm above the baseline and lower than -70 dBm. Hence, we conclude
that these signals did not come from the locomotive.
3.7.3 Propagation Channel Measurements
The propagation channel parameters for six crossings are shown in Table VI. Unfortunately,
we were unable to record proper data for crossing #1 with an omnidirectional antenna. The
Ricean K factor values over time and PDP values of approaching, at the crossing of, and
departing from crossings #3, #4, #5 are shown in Figure 19–23 and Figures 25–30
Table VI Propagation Channel Parameters for SVRR Tracks
Crossing # Considerable
Environment
Antenna Propagation Channel
Kavg
(dB)
rms
(ns)
n
(dB)
σ
(dB)
1
Rural Omni N/A N/A N/A N/A
Bi 8.01 152 2.27 7.74
2 Rural Omni 3.81 204 2.62 4.11

43
Bi 6.3 136 1.97 5.65
3
Rural Omni 3.96 205 2.5 3.48
Bi 7.7 125 2.07 8.41
4
Suburban Omni 3.16 227 3.04 5.35
Bi 5.08 140 2.52 5.87
5
Suburban/
Urban
Omni 4.25 840 3.6 4.81
Bi 6.83 632 3.34 6.28
6
Rural Omni 4.56 184 2.79 4.64
Bi 6.54 96 2.16 6.73

44
Figure 19 Ch sounder result (omnidirectional crossing #3)

45
Figure 20 Ch sounder result (bi-directional crossing #3)

46
Figure 21 Ch sounder result (omnidirectional crossing #4)

47
Figure 22 Ch sounder result (bi-directional crossing #4)

48
Figure 23 Ch sounder result (crossing #5)
To confirm the communication environment for each crossing, we compare each crossing’s
path loss with the omnidirectional antenna from the PDP and path loss model from the 3rd
Generation Partnership Project (3GPP) [31]. We consider certain models to compare: Rural
Macro LoS (RMa LoS), Suburban Macro LoS (SMa LoS), Suburban Macro NLoS (SMa
NLoS), Urban Macro LoS (UMa LoS), and Urban Macro NLoS (UMa NLoS).
RMa LoS is given by:
𝑃𝐿𝑅𝑀𝑎 𝐿𝑜𝑆 = 20𝑙𝑜𝑔10 (40𝜋𝑑𝑓𝑐
3) + 0.48𝑙𝑜𝑔10𝑑 − 0.7 + 0.0014𝑑 (8)
SMa LoS is given by:
𝑃𝐿𝑆𝑀𝑎 𝐿𝑜𝑆 = 20𝑙𝑜𝑔10 (40𝜋𝑑𝑓𝑐
3) + 1.57𝑙𝑜𝑔10𝑑 − 2.31 + 0.002𝑑 (9)

49
SMa NLoS is given by:
𝑃𝐿𝑆𝑀𝑎 𝑁𝐿𝑜𝑆 = 122.14 + 38.63(𝑙𝑜𝑔10𝑑 − 3) + 20𝑙𝑜𝑔10𝑓𝑐 (10)
UMa LoS is given by:
𝑃𝐿𝑈𝑀𝑎 𝐿𝑂𝑆 = 22𝑙𝑜𝑔10𝑑 + 28 + 20𝑙𝑜𝑔10𝑓𝑐 (11)
UMa NLoS is given by:
𝑃𝐿𝑈𝑀𝑎 𝑁𝐿𝑜𝑆 = 130.8 + 39.1(𝑙𝑜𝑔10𝑑 − 3) + 20𝑙𝑜𝑔10𝑓𝑐 (12)
Figure 24 shows the measured path loss and 3GPP path loss model for crossings #2–#6. We
confirm the communication environment of each crossing by comparing the path loss with
the 3GPP model, as shown in Figure 24, and other propagation channel parameters. Because
the 3GPP path loss model is applicable for longer than 10 m, each figure was plotted with a
boundary at -10 and 10 m.
For crossing #5, we determine that the calculated value for the Ricean K-factor was
inaccurate due to the low power of the LoS path signal. The Ricean K-factor is calculated
using the ratio between the LoS path signal power and the reflected signal power. Because
the LoS path signal power is as low as the reflected signal power, the calculated Ricean K-
factor is reasonably higher. Therefore, even though the calculated value is 4.25 dB, the actual
Ricean K-factor is supposed to be lower.
Ricean K-factor. From [22], the author categorized road crossing-suburban environments as
having a K-factor of 3.7 with traffic and 4.5 without traffic, and our measured results show
values of 3.81–4.56 for rural and 3.16 for suburban environments. Even though our
assumption was that crossings #1, #2, #3, and #6 were rural and crossings #4 and #5 were
suburban, all crossings fall into the road crossing-suburban category given in [22].

50
Figure 24 Comparison of measured path loss values and 3GPP path loss models for (a) crossing #2, (b) crossing #3, (c) crossing #4, (d) crossing #5, and (e)
crossing #6

51
The Ricean K-factor results from the omnidirectional antenna are 3.16–4.56, while they are
5.08–8.01 for the bi-directional antenna. We can definitively conclude that the bi-directional
antenna will face lesser fading than the omnidirectional antenna. In addition, the Ricean K-
factor from [22] shows 7.6 for a general LoS highway environment, and the results for the bi-
directional antenna can be considered within this category.
Furthermore, by comparing the results from the TTCI tracks, where there are no obstructions
near the crossings, we measure the Ricean K-factor as 9.76–11.31, while we measure it as
3.16–4.56 for the SVRR tracks. Within our measurements, we can conclude that the Ricean
K-factor for rural environments can be considered representative of a no-obstruction
environment for a V2T communication propagation environment and that a suburban
environment can be considered representative rural and suburban regions.
Path Loss. By looking at the measured path loss and 3GPP path loss model, reasonably,
crossings #1, #2, #3, and #6 can be considered in a rural environment. Even though crossing
#1, with an omnidirectional antenna, does not have values, the values for a bi-directional
antenna are relatively similar for crossings #2, #3, and #6. Therefore, we considered crossing
#1 to be rural, as well. As shown in Figure 24(a) and (e), crossings #2 and #6 almost match
the RMa LoS path loss values. As shown in Figure 24(b), crossing #3 has a somewhat lesser
path loss shown than the 3GPP model. With Figure 24, we could assume crossings #1, #2, #3,
and #6 fall into the rural environment category.
Crossings #4 and #5 can be considered to be in a suburban environment. As shown in Figure
24(c), shorter distances, such as in the range of -100–0 m, are considerable for the rural
environment; however, most distances are between SMa LoS and NLoS. Therefore, we
assumed crossing #4 to be in a suburban environment. In addition, as shown in Figure 8(d),
interestingly, the measured path loss is almost identical to SMa NLoS before the crossing and

52
UMa NLoS after the crossing. With this result, we are able to assume crossing #5 to be
somewhat between a suburban and an urban environment.
The interesting aspect relating to path loss is that the path loss is much lower at +/- 100 m
than the 3GPP path loss model. As shown in Figure 24(a), (c), and (e), which show
considerably classic rural and suburban environments, we are able to see that both the
measured and 3GPP models match at distances farther away from the crossing; however, in a
near region, within +/- 100 m, the path loss is much lower than the 3GPP model. We assume
this behavior is due to the special environment of crossings; the environment around the
crossing is reasonably wide open, with possibly a strong LoS environment and a lack of
interference sources nearby.
RMS Delay Spread. We observe the RMS delay spread to be in the range of 184–227 for the
omnidirectional antenna and 96–152 for the bi-directional antenna, and these values are much
higher than those that were observed at the TTCI tracks. We assume the difference appeared
due to the existence of a few obstructions, such as trees, buildings, or parked cars, near the
crossings.
The omnidirectional antenna results are much higher than any values from [23] and [24], but
the urban LoS with a 600-m distance result from [25] is somewhat similar. The bi-directional
antenna results are similar to the street crossing-suburban category from [23] and highway
LoS from [25].
Through the propagation channel characteristic measurements and analyzed values, we are
able to confirm the communication environment of the crossings, where we also measured
the DSRC performance. When comparing our outcomes with the results from [22]–[25], we
observe a V2T communication propagation environment similar to the suburban environment
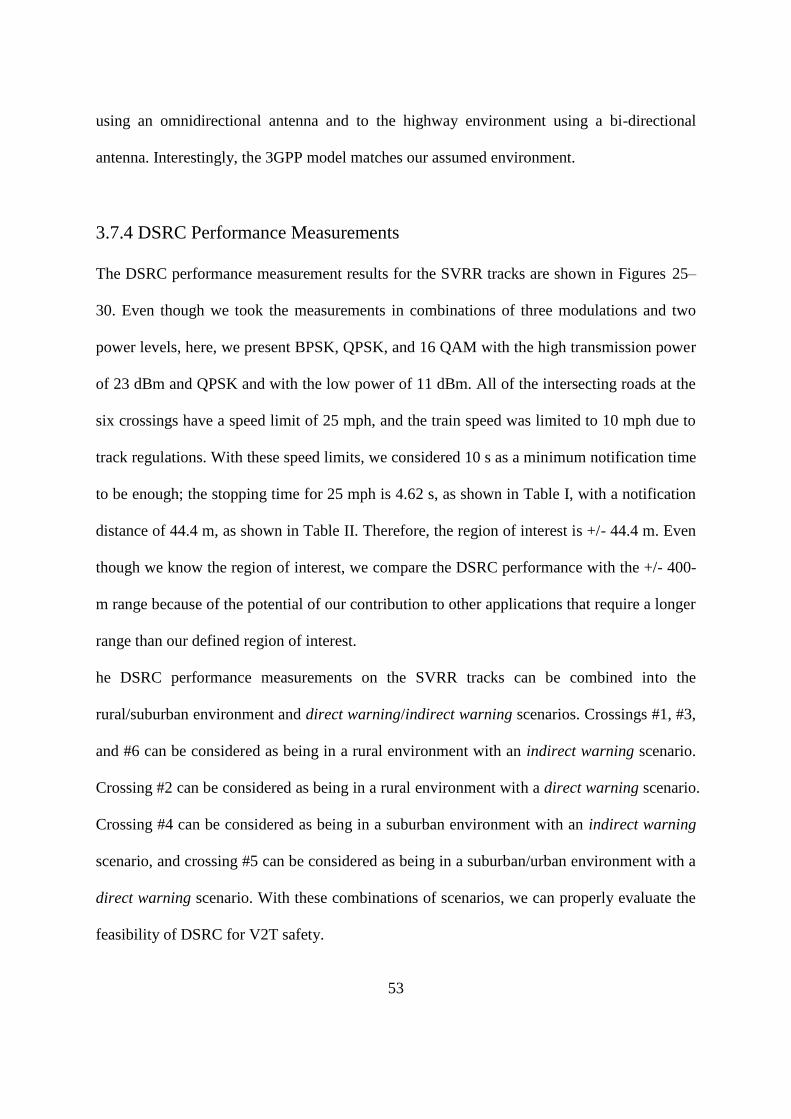
53
using an omnidirectional antenna and to the highway environment using a bi-directional
antenna. Interestingly, the 3GPP model matches our assumed environment.
3.7.4 DSRC Performance Measurements
The DSRC performance measurement results for the SVRR tracks are shown in Figures 25–
30. Even though we took the measurements in combinations of three modulations and two
power levels, here, we present BPSK, QPSK, and 16 QAM with the high transmission power
of 23 dBm and QPSK and with the low power of 11 dBm. All of the intersecting roads at the
six crossings have a speed limit of 25 mph, and the train speed was limited to 10 mph due to
track regulations. With these speed limits, we considered 10 s as a minimum notification time
to be enough; the stopping time for 25 mph is 4.62 s, as shown in Table I, with a notification
distance of 44.4 m, as shown in Table II. Therefore, the region of interest is +/- 44.4 m. Even
though we know the region of interest, we compare the DSRC performance with the +/- 400-
m range because of the potential of our contribution to other applications that require a longer
range than our defined region of interest.
he DSRC performance measurements on the SVRR tracks can be combined into the
rural/suburban environment and direct warning/indirect warning scenarios. Crossings #1, #3,
and #6 can be considered as being in a rural environment with an indirect warning scenario.
Crossing #2 can be considered as being in a rural environment with a direct warning scenario.
Crossing #4 can be considered as being in a suburban environment with an indirect warning
scenario, and crossing #5 can be considered as being in a suburban/urban environment with a
direct warning scenario. With these combinations of scenarios, we can properly evaluate the
feasibility of DSRC for V2T safety.
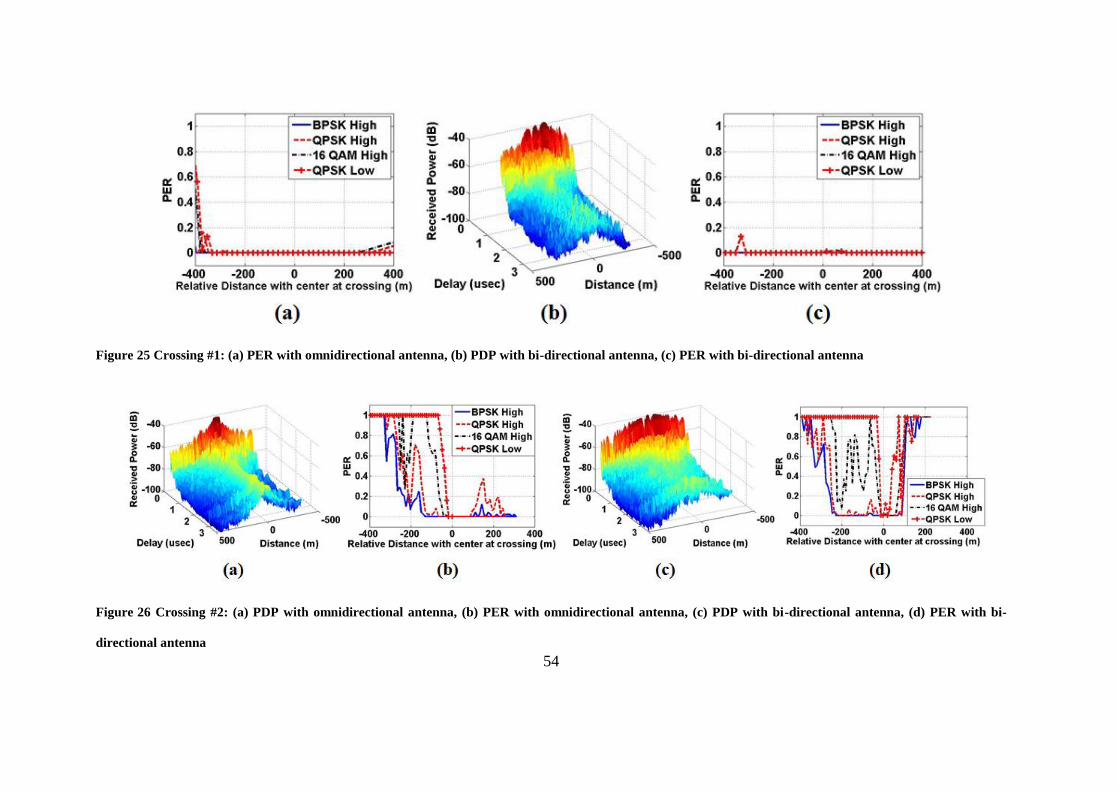
54
Figure 25 Crossing #1: (a) PER with omnidirectional antenna, (b) PDP with bi-directional antenna, (c) PER with bi-directional antenna
Figure 26 Crossing #2: (a) PDP with omnidirectional antenna, (b) PER with omnidirectional antenna, (c) PDP with bi-directional antenna, (d) PER with bi-
directional antenna

55
Figure 27 Crossing #3: (a) PDP with omnidirectional antenna, (b) PER with omnidirectional antenna, (c) PDP with bi-directional antenna, (d) PER with bi-
directional antenna
Figure 28 Crossing #4: (a) PDP with omnidirectional antenna, (b) PER with omnidirectional antenna, (c) PDP with bi-directional antenna, (d) PER with bi-
directional antenna

56
Figure 29 Crossing #5: (a) PDP with omnidirectional antenna, (b) PER with omnidirectional antenna, (c) PDP with bi-directional antenna, (d) PER with bi-
directional antenna
Figure 30 Crossing #6: (a) PDP with omnidirectional antenna, (b) PER with omnidirectional antenna, (c) PDP with bi-directional antenna, (d) PER with bi-
directional antenna

57
Figures 25, 27, and 30 show the results for a rural environment with an indirect warning
scenario. From all three figures, the DSRC performance in a rural environment with an
indirect warning scenario can be said to satisfy the minimum requirement for safety. The
range that satisfies the requirement, PER <0.9, is more than +/-400 m for all three crossings.
The performances with a bi-directional antenna are also similar to those with an
omnidirectional antenna. However, as clearly shown for crossings #1 and #6, the
performance with an omnidirectional and 16 QAM high power/QPSK low power shows an
increase in the PER at 400 m before the crossing, and it is expected to not satisfy around the
500-m range. Meanwhile, the performance with a bi-directional antenna is steady for the
whole range. From these comparisons, we can expect DSRC with an omnidirectional or bi-
directional antenna to provide a similar performance, but using a bi-directional antenna can
provide a slightly longer range. In addition, with these results, we can identify that a DSRC
radio is adaptable for a V2T communication system in a rural environment with an indirect
warning scenario.
Figure 26 presents the results for a rural environment with a direct warning scenario. The
DSRC performance with an omnidirectional antenna can be considered to satisfy the
minimum requirement for safety, but QPSK with low power is near the minimum notification
distance. However, if the minimum notification time is 15 s, QPSK with low power may not
satisfy. Interestingly, the performances between the omnidirectional and bi-directional
antennas for this scenario are similar; the coverage range is similar for each combination of
modulation schemes and power levels. Moreover, the performance of the bi-directional
antenna after the crossing is worse due to a blockage from a building placed after the crossing,
which is the reason for creating the NLoS environment. With the comparison, we are able to
identify that a bi-directional antenna performs worse than an omnidirectional antenna for the

58
NLoS environment. From the evaluations, we confirm the DSRC radio is adaptable for a V2T
communication system in a rural environment with a direct warning scenario. In addition,
different from the evaluation of a rural environment with an indirect warning scenario,
omnidirectional and bi-directional antennas can provide a similar performance, but bi-
directional antennas can be worse when the communication environment changes to NLoS
from LoS.
For a suburban environment with an indirect warning scenario, we evaluated in Figure 28.
The DSRC performance with an omnidirectional, as well as bidirectional antenna is able to
considered to satisfy the minimum requirement for safety. The DSRC performance with a bi-
directional antenna shows an advantage in terms of coverage range over an omnidirectional
antenna for this scenario, and the performances after the crossing are similar for all
modulation schemes and power levels. However, the performances before the crossing, which
can be more important than after the crossing, show more variation than with an
omnidirectional antenna. More interestingly, the performance difference is larger for a higher
power level and lower modulation scheme; the difference in BPSK and QPSK is larger than
the difference in 16 QAM high power and QPSK with lower power; the effect of antenna
beamforming is higher for lower modulations From these evaluations, we confirm the DSRC
radio is adaptable for a V2T communication system in a suburban environment with an
indirect warning scenario. Moreover, we observe that using a bi-directional antenna can
provide benefits in terms of coverage range over the omnidirectional antenna.
For a suburban environment with a direct warning scenario, we evaluated in Figure 29. The
DSRC performance with an omnidirectional and with a bi-directional antenna is able to
consider to satisfy the minimum notification range. The advantage of using the bi-directional
antenna is able to observe in this scenario. The performance difference between the

59
omnidirectional and the bi-directional antennas is larger for higher power levels and lower
modulation schemes, and this is observed in the suburban environment with an indirect
warning scenario, as well. The difference is larger for a direct warning scenario than for an
indirect warning scenario. Through the evaluation, we confirm a DSRC radio is adaptable for
a V2T communication system in a suburban environment with a direct warning scenario.
Furthermore, we can identify the advantages of using a bi-directional antenna in a suburban
environment for both the indirect and direct warning scenarios.
3.7.5 Reliability Analysis
We choose crossing #4, one of the best performing crossings, and crossing #5, one of the
worst performing crossings, to discuss the reliability of packet reception before the crossing
using the CDF. We generate the CDF based on the number of correctly received packets at
the granularity of 20 m as the train advances toward the crossing. Figure 31 and Figure 32
show the CDF for crossings #4 and #5.
Figure 31 Crossing #4: CDF of successfully decoded packets before the crossing for (a) omnidirectional
and (b) bi-directional

60
Figure 32 Crossing #5: CDF of successfully decoded packets before the crossing for (a) omnidirectional
and (b) bi-directional
When the CDF curves are approximately linear with a slope of one over the distance where
packets are being received, and if this distance is sufficiently long for an effective warning,
the system can be considered reliable. This is the case for crossing #4, among others. For
crossing #5, the reliability is high only for the bi-directional antenna system configuration
and for a lower-order modulation and high power transmission.

61
Figure 33 Number of correctly received packets for crossing #5 with QPSK and low power transmission
for (a) omnidirectional and (b) bi-directional
Even though the system reliability of the omnidirectional antenna configuration for crossing
#5 is low, a good amount of packets is actually being received before the minimum
notification distance of 67 m. As shown in Figure 33, more than 60 packets are received
before the critical distance of 67 m before the crossing. Therefore, we conclude the DSRC
system is a good candidate for the proposed V2T safety-critical communications system,
which warns cars well ahead of time of an approaching train.
3.7.6 Conclusions of SVRR Measurements
In Figure 25-30, we evaluate the DSRC performance in rural/suburban environments with
direct/indirect warning scenarios. Through all combinations of scenarios, we conclude that
DSRC is adaptable for use in a V2T communication for early warning application, as its
performance can be considered to satisfy most of the scenarios with all modulation schemes
and high/low transmit power levels within the minimum notification range with a minimum

62
notification time of 10 s. Unlike the TTCI track measurements, the interference sources were
the real environment and random number of existence, and moving vehicles and objects
existed during the measurement procedure. The measured results confirm that DSRC is
adaptable for a V2T communication system in a real environment.
In Figure 24 and Table VI, we evaluate the propagation channel characteristics, path loss
exponents, Ricean K-factors, and RMS delay spreads for the SVRR crossings. The measured
path loss results have a fit similar to the 3GPP path loss models for urban, suburban, and rural
environments with our assumed environment category. For fading-related parameters, Ricean
K-factors, and RMS delay spreads, all crossings with the omnidirectional antenna are similar
to suburban categories, as mentioned in [22]–[25]. In addition, the results with a bidirectional
antenna show all crossings can be considered as within the highway category from [22] and
[25], which is the major difference in performance between omnidirectional and bidirectional
antennas.
3.8 Detailed Propagation Channel Characteristics
The interested propagation channel parameters are Ricean K-factor, path loss exponent and
its standard deviation, and RMS delay spread. The channel parameters were calculated by
PDP which generated by recorded waveform through channel sounder. An example of
generate PDP plot is shown in Figure 34.
A generated PDP contains the strongest LoS signal and the signals that are delayed by
interferences, which is able to capture up to 3.5 μsec. Each signal is captured where the
locomotive started to move and where stopped move. The saved data contains GPS

63
information which can directly allocate propagation channel signal and the distance away
from the crossing.
Figure 34 Example of Generated PDP
The calculation of propagation parameters is done with each recorded GPS location. One
instantaneous signal is shown in Figure 35. In Figure 35, the continuous received signal is
shown as blue line and each peak are represented as red lines. The power data at delay time 0
sec represents the strongest LoS signal and all others represents delayed signal. The
calculation was done with using these signals.

64
Figure 35 Example of Instantaneous PDP
3.9 Robust Estimation Methods
From PER and channel characteristics, the parameters are collected certain range window
with sharing same distance parameter. With this information, we can estimate the channel
characteristics values for V2T communication environment and find the linear form
equations between PER and channel characteristics or distance and channel characteristics.
For the estimation process, we will use the similar method used in [20]-[25]; 1) mean and
variance, 2) linear regression and R2, a coefficient of determination, to evaluate the goodness
of fit.
For evaluate the channel characteristics, the measurements were done in a mixture of
suburban and rural; therefore, we will use mean and variance with the assumption of
Gaussian distribution to estimate. The estimation will not consider other potential affecting
parameters. All of the calculated parameters are discrete results. The mean is defined by:

65
E(channel characteristics) = μ = ∑ 𝑐ℎ𝑎𝑛𝑛𝑒𝑙 𝑐ℎ𝑎𝑟𝑎𝑐𝑡𝑒𝑟𝑖𝑠𝑡𝑖𝑐𝑠𝑛
𝑖=1
𝑛 (13)
The variance is defined by:
Var(channel characterisitcs) = 𝐸[(𝑐ℎ𝑎𝑛𝑛𝑒𝑙 𝑐ℎ𝑎𝑟𝑎𝑐𝑡𝑒𝑟𝑖𝑠𝑡𝑖𝑐𝑠 − 𝜇)2] (14)
With (13) and (14), we can estimate the channel characteristics for mixed suburban and rural
environment for V2T communication.
Since we’re interested the relationship between PER and channel characteristics or distance
and channel characteristics, the linear regression is applied to estimate. The linear regression
representation is defined by:
z = H ∗ x + e (15)
where z is dependent variables, H is an estimator, x is an independent variable, and e is an
error between the estimated value and measured value. Since the interesting parameters are
one-to-one variables, the linear regression can be simplified into:
z = 𝛽0 + 𝛽1𝑥 + 𝑒 (16)
where β0 is intercepted at z and β1 is regression coefficient. This can be rewritten into vector
form as:
[
𝑧1
𝑧2
⋮𝑧𝑛
] = [
1 𝑥1
1 𝑥2
⋮1 𝑥𝑛
] [𝛽0
𝛽1] (17)
The coefficient of determination, R2, is defined by:
𝑅2 = 1 −∑ (𝑥𝑚𝑒𝑎𝑠.−𝑥𝑒𝑠𝑡.)
2𝑛𝑖=1
∑ (𝑥𝑚𝑒𝑎𝑠.−𝜇)2𝑛𝑖=1
(18)
Also, R2 can be rewritten with residuals:
𝑅2 = 1 −𝑆𝑢𝑚 𝑜𝑓 𝑆𝑞𝑢𝑎𝑟𝑒𝑑 𝑅𝑒𝑠𝑖𝑑𝑢𝑎𝑙𝑠
𝑆𝑢𝑚 𝑜𝑓 𝑆𝑞𝑢𝑎𝑟𝑒𝑑 𝑑𝑖𝑓𝑓𝑒𝑟𝑒𝑛𝑐𝑒𝑠 (19)

66
R2 can be observed as the range of 0 to 1 and larger value considered as better to fit or better
estimator.
With the linear regression process, we can generate estimated linear form equation for PER
and channel characteristics or distance and channel characteristics. After observing the
equations, R2 can support whether the equation is good to use or more measurement is
required to reduce randomness. The evaluations with measured and estimated results are
shown in the next Section.
3.10 Analyses of Results
The mean and variance of Ricean K, path loss exponent, and RMS delay are shown in Table
VII and their distributions are shown in Figure 36, Figure 37, and Figure 38. Due to units of
variables, large or small value of variance is not good to compare. Interestingly, the
distribution shape for Ricean K, RMS delay, and path loss exponent seems different. Only
Ricean K distribution seems normal Gaussian distribution. RMS delay and path loss exponent
seem exponential distribution or other than normal Gaussian. Therefore, finding the best fit
distribution will make the mean and the variance to be useful to use for simulation or
modeling for wireless communications.
Table VII Mean and variance of Ricean K, path loss exponent, RMS delay
Ricean K (dB) Path loss exponent
(dB)
RMS Delay (μs)
Mean 3.9945 2.7738 0.1960
Variance 13.2669 0.1905 0.0029
Standard deviation 3.6424 0.4365 0.0539
Confidence interval -1.5~13.5 2.34~4.00 0.13~0.33

67
Figure 36 Distribution of Ricean K
Figure 37 Distribution of RMS Delay

68
Figure 38 Distribution of path loss exponent
The linear regressions between PER and channel characteristics are shown in Figure 39,
Figure 40, and Figure 41. Interestingly, all of them are flat lines with R2 of around 0.002,
which represent “poor” to fit. However, as shown in Figure 39, Figure 40, and Figure 41, the
PER values are most likely 0s than well distributed; not much variance appears in PER values.
Therefore, the evaluation of linear regression between PER and channel characteristics are
useless until more vary PER values are collected. As the point of view to evaluate the
performance of DSRC for V2T communications, the performance is really great due to
properly working in different parameters of channel characteristics. However, as the point of
view to evaluate the relationship, the data set is worse and the linear equation is useless due
to less distributed PER values.

69
Figure 39 PER vs Ricean K
Figure 40 PER vs RMS Delay

70
Figure 41 PER vs Path loss exponent
The linear regressions between the relative distance of train and crossing and channel
characteristics are shown in Figure 42, Figure 43, and Figure 44. These are more interesting
than the linear regressions between PER and channel characteristics. The linear regression of
Ricean K is shown as:
K = 0.008d + 2.85 (20)
with R2 of 0.034. With this information, this model does not explain the relationship for
Ricean K and relative distance, and more data are needed for solid relationship model. The
linear regression of path loss exponent is shown as:
n = −0.002d + 3.04 (21)
with R2 of 0.144. With this information, we also can assume the model does not explain the
relationship for path loss exponent and relative distance well. However, we expect using the
exponent of distance or exponential relationship instead of linear can increase R2, which
represents a better model to estimate the model from the measured results. The linear
regression of RMS delay is shown as:

71
RMS delay = 5.85𝑒−6𝑑 + 0.195 (22)
with R2 of 9.24e-5. Based on this information, the data used in this analysis do not show a
significant relationship between RMS delay and relative distance. From all three linear
regression evaluation processes, none of the models provide a robust estimate of channel
parameters based on relative distances. Other variables not considered in this model may
explain more of the variation in channel parameters. However, more data collections may
provide solid relationship model, also, the factor other than relative distance need to be
considered.
Figure 42 Ricean K vs Distance
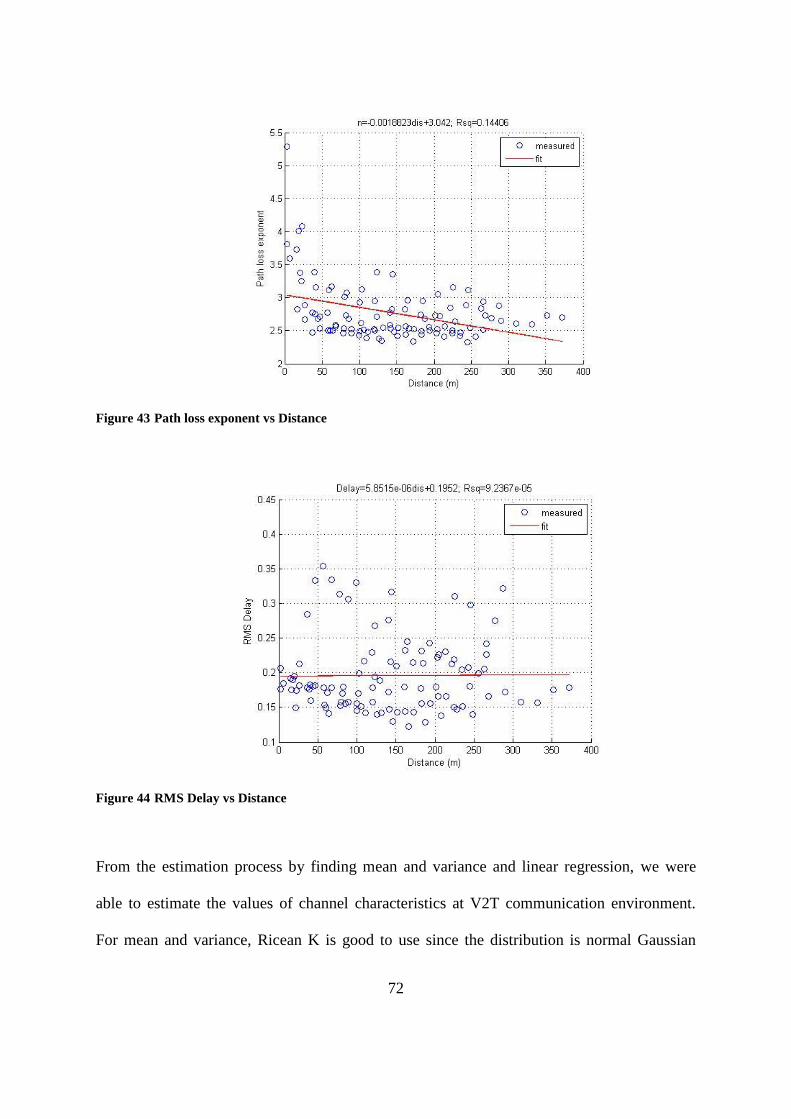
72
Figure 43 Path loss exponent vs Distance
Figure 44 RMS Delay vs Distance
From the estimation process by finding mean and variance and linear regression, we were
able to estimate the values of channel characteristics at V2T communication environment.
For mean and variance, Ricean K is good to use since the distribution is normal Gaussian

73
distribution, which is usually used in simulation models. However, for RMS delay and path
loss exponent, the distributions do not fit with the normal Gaussian distribution. Therefore,
finding better-fitted distribution model is required and the new variance will be given after
finding the new fitted distribution model. For linear regressions between PER and channel
characteristics, we observe more vary PER values is required to identify the relationship
between PER and channel characteristics. For linear regressions between relative distance
and channel characteristics, the linear equation for Ricean K is not good due to low R-
squared value. Also, the linear regression for path loss exponent is required to process with
other than linear equational form. Also, we observe the no relationship between RSM delay
and relative distance due to flat slope observed in the linear equation.
The authors of [20] presented a linear model of Ricean K-factor in relation to distance and
given by:
K = 0.012d + 0.29 (23)
Interestingly, our model from the measurement, (20), and the model presented in [20], (23),
have a similar relationship between the distance and the Ricean K-factor, as 0.008 and 0.012,
respectively. There are certain error observed; however, the similarity between V2T and V2V
can be found.
More specific comparison between terrain parameters and crossings, we plotted propagation
channel characteristics with related to distances in Appendix D. From each crossing figures,
we observed similar behaviors in Ricean K factor and path loss exponent for rural crossing
environments, Crossing #3 and #6; however, there are some outliers especially in Ricean K
factor, which are due to in the transition between rural to suburban/urban like crossings.
Since Crossing #4 is only suburban crossing, we plotted rural like crossings for figures 45-47.
From Figure 45, we observed similar results as shown in Figure 42 due to the outliers shown

74
in the ranges of 200 m. Based on Figure 97 and Figure 99, those points are observed after the
crossings, and the region after Crossing #3 and #6 contains a large forests and buildings. The
RMS delay stays as same conclusion as before. For the path loss exponent values, all of them
are in the range of 2.5-3, except the values after the Crossing #6. Interestingly, the outliers of
path loss exponents were not shown from Crossing #3, but from Crossing #6.
Figure 45 Ricean K for rural crossings

75
Figure 46 RMS delay for rural crossings
Figure 47 Path loss exponent for rural crossings
3.11 Conclusions for Estimation Methods Analysis
We faced a limitation in obtaining PER models due to PERs of zero for the range of
propagation channel measurements. More measurements at different sites that will give non-

76
zero PERs are needed for a more accurate relationship model. From the measured results, we
estimated the results by 1) mean and variance with the assumption of Gaussian distribution, 2)
linear regressions between PER or distance and channel characteristics. From mean and
variance, we observed only Ricean K is following Gaussian distribution while the other two
does not. Therefore, the properly fitted distribution to find mean and variance is required.
From linear regression of PER, we observed more varied PER is required to collect to
estimate proper equation. From linear regression of distance, we won’t find good fitted line,
which give us the conclusion for more data collection is required. The suggested equations
are not sufficient enough to use in the field yet due to low R2 parameters for all fitted line,
collected data in few crossings, which may not representative, and the parameter, especially
path loss exponent, consider other equation than linear regression. Therefore, careful
approaches to evaluate the equations for propagation characteristics with more field trial are
required to suggest for design guidelines. Also, PER values are almost zero for all scenarios;
therefore, another propagation channel measurement with worse performing DSRC
environment is required for developed design guidelines.

77
Chapter 4
ITS Band Regulatory Survey
4.1 Introduction
A literature survey was performed to identify technical challenges and related prior research
associated with possible future regulatory decisions related to the 5.9 GHz ITS band. These
decisions relate to band sharing and mandatory use of a wireless communication standard or
standards for vehicular safety communication. This study will help investigators to plan
research that is highly relevant to the future regulatory environment of the 5.9 GHz band and
to future ITS bands that may be subject to different combinations of regulations.
DSRC has been the dominant protocol recommended for vehicular communication such as
V2V and V2I communications. In FCC Report and Order FCC-03-324 [32], the FCC
allocated 75 MHz of the spectrum in the 5.9 GHz band for vehicular communications. DSRC
has been using the 75 MHz of spectrum with seven different channels; each is 10 MHz
bandwidth as per the recommendation of ITS.
However, more recently the FCC issued a NPRM regarding the potential use of the 5.9 GHz
band for U-NII devices. Also, the FCC is considering sharing the spectrum of 5.85-5.925
GHz by both DSRC and U-NII devices, as mentioned in FCC Docket ET 13-49 [33]. The
primary unlicensed devices that included in the FCC NPRM use a signal based on IEEE
802.11ac and operate at U-NII-4 band shown in Figure 1.
The channel allocations being considered for DSRC and U-NII-4 are shown in Figure 1. In
the FCC NPRM, two interference mitigation approaches are presented: “Detect and Vacate
(DAV)” and “Re-channelization”. DAV represents no changes to DSRC, but requires

78
unlicensed devices to avoid DSRC interference by detecting the DSRC signal up to Channel
178. “Re-channelization” is an allocation process where safety-related DSRC applications
use the upper 30 MHz (Channels 180, 182, and 184) while non-safety-related DSRC and U-
NII devices share the lower 45 MHz (Channels 172, 174, 176, and 178).
Furthermore, new developments of Vehicle-to-Everything (V2X), are expected over the next
few years with releases 3GPP releases 16 and 17. One potential apporach is to provide
services through LTE, which is refered to as C-V2X [34]. Recently, 3GPP presented the
sidelink interface and the LTE cellular interface in Release 14 with fulfilling the requirements
of V2X services [34]. Also, Society of Automotive Engineers (SAE) established five levels
of vehicle automations, complete driver control (level 0) to complete autonomy (level 5), and
the autonomous driving will highly rely on the communication functionality [35]. Although
the technical details are still under development, C-V2X will brings additional complexity
to the discussion on how to allocate spectrum bands in the 5.9 GHz band due to involvement
of traditional vehiclular communication in the architecture.
As Wi-Fi, LTE, and DSRC are competeing for the 5.9 GHz spectrum, numerous technical
challenges to research will arise. Since allocating the spectrum is organized by FCC, and
possibly the NHTSA may affect the regulation, there are some technical challenges that we
further analysis in this paper. However, when a regulatory of 5.9 GHz spectrum band is fixed
by both FCC and NHTSA, the technical challenges to research should somewhat align with
expected regulations.
DSRC is the dominant protocol for 5.9 GHz band; however, deploying C-V2X, Wi-Fi, and
other unlicensed devices at the band is considered. Within possible hypothesis about FCC and
NHTSA’s decisions, we can generate possible combinations of regulations and associated
technical challenges related to possible regulation scenarios. Moreover, we present a

79
comperhensive technical assessment that is related to the potential technical challenges for
those regulations.
4.2 Possible FCC and NHTSA’s Regulations
For adopting certain regulations for vehicular communication, FCC and NHTSA have the
major role. Their decision may or may not conflict to each other; however, it is obvious to
say that C-V2X or DSRC or both will be using the 5.9 GHz. Also, based on announced
NPRM, FCC’s position can be expected as using UNII-4 and DSRC with Re-channelization
and under discussion about DAV while NHTSA is more focused on whether the technologies
can satisfy their minimum safety requirements.
Possible FCC actions are following:
Number of vehicular safety communication technologies in band: 1) one technology; or 2)
two technologies
If one safety technology in band: 1) DSRC Only; or 2) C-V2X Only
If two or more safety technologies in band: 1) co-channel coexistence; or 2) adjacent
channel coexistence
Re-channelization: 1) Re-channelize, safety-related DSRC using upper 30 MHz and
unlicensed devices using lower 45 MHz; or 2) Do not re-channelize
Wi-Fi sharing: 1) Allowed through DAV; 2) Not allowed
Other unlicensed technologies, most prominently LTE-U, LAA, and MuLTEfire: 1)
Allowed; 2) Not allowed
Re-channelization and Wi-Fi sharing by DAV are considered as two different interference
mitigation approaches. However, they can be used at the same time: using safety-related

80
DSRC to re-channelize at upper 30 MHz and allocate non-safety-related DSRC at 45 MHz
with allowing Wi-Fi sharing through DAV. For the re-channelization scenario, Wi-Fi sharing
is always allowed. For the do-not-re-channelization scenario, Wi-Fi sharing could either be
allowed or not allowed.
With the interests of NHTSA, which technology using for vehicular communication, we can
identify the possible NHTSA’s regulations as:
DSRC only
C-V2X only
Coexistence DSRC & C-V2X
Interoperable
Non-Interoperable
No regulations
NHTSA is more interested about which technology is preferred for vehicular communication
with fulfilling the safety requirements while FCC is interested about both the technology and
how to efficiently using the 5.9 GHz band with the technologies. The scenario of coexistence
can be considered as interoperable or non-interoperable. Interoperable represents as vehicles
are using a device that allows DSRC and C-V2X to communicate each other. No regulation
scenario represents the case when NHTSA does not impose a regulation for vehicular
communication.
With the combinations of identified FCC and NHTSA’s regulation scenarios, we have
generated scenario regulation chart as shown in Figure 48.
For each combination of scenarios, certain technical challenges are inherent. The technical
challenges are shown as alphabet code in Figure 48. The details of these technical challenges
are listed in Table VIII.
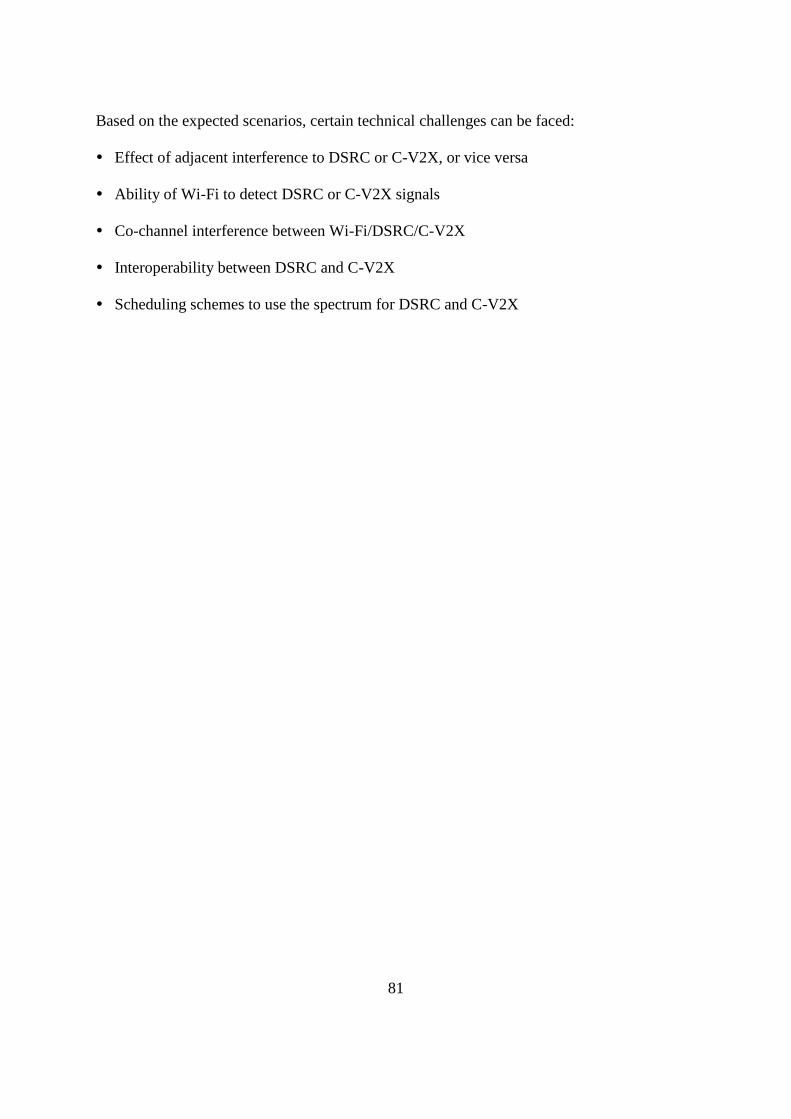
81
Based on the expected scenarios, certain technical challenges can be faced:
Effect of adjacent interference to DSRC or C-V2X, or vice versa
Ability of Wi-Fi to detect DSRC or C-V2X signals
Co-channel interference between Wi-Fi/DSRC/C-V2X
Interoperability between DSRC and C-V2X
Scheduling schemes to use the spectrum for DSRC and C-V2X

82
Figure 48 FCC and NHTSA’s regulation plan

83
Table VIII List of technical challenges
Alphabet Code
from Figure 48
Description
Alphabet
Code from
Figure 48
Description
a Ability of Wi-Fi to detect DSRC signals to vacate f
Co-channel interference between Wi-Fi and C-
V2X
b
Adjacent interference to DSRC: out-of-band rejection of
DSRC
g
Analyzing adjacent interference from DSRC to C-
V2X and from C-V2X to DSRC. Depending on
which system will use the lower frequency band,
adjacent interference from Wi-Fi need to be
analyzed
c Co-channel interference between Wi-Fi and DSRC h
How the co-channel coexistence between DSRC
and C-V2X will affect the performance to each
other

84
d Ability of Wi-Fi to detect C-V2X signals to vacate i Interoperability between DSRC and C-V2X
e
Adjacent interference to C-V2X: out-of-band rejection
of C-V2X
j
The “No Regulation” will inherit all technical
issues in the column above it

85
4.3 Technical Surveys Related to Regulation Scenarios
By categorizing technical challenges as shown in Table VIII, we surveyed papers and
categorized them into the related technical challenge topics. For the current FCC and
NHTSA’s plan is the scenario of DSRC only using for 5.9 GHz spectrum band, we found the
greatest number of papers address this scenario. However, the least number of studies are
related to the technical challenges for coexistence of DSRC and C-V2X scenario. Therefore,
in this section, we identify the technology gaps that have not been addressed in the technical
literature. Table IX summarizes addressed technical challenges that found in the literature and
their key findings.
4.3.1 DSRC Only
Authors of [36] evaluated the effects of adjacent channel interference in multi-channel
vehicular networks. In the model setup, a target node is observing in Service Channel (SCH)
4 and various numbers of nodes transmit on SCH3 to cause adjacent channel interference on
the target node. Their study shows that a node tuning into a channel with a low transmission
power, so to mitigate adjacent channel interference effects would preserve the
communication quality at some extent. They also found that despite the blocking, channel
access delay may be reduced and transmissions may be less prone to collisions.
The authors in [37] studied the effects of adjacent channel interference signal energy levels
and channel access delay and packet loss in the multi-channel vehicular networks using an
adjacent channel interference model through simulation that is able to control time, space,
and frequency parameters for mobile nodes. They explored two scenarios: 1) vehicular nodes
are arranged in a square and adjacent channel interference effects at the center are measured;

86
2) 60 cars are exponentially distributed over 3-lane highway. Through the simulations, they
found that the effect of adjacent channel interference to be significant for transmission power
settings of 20 dBm and when the involved nodes are at a distance lower than 7m. The results
show that the increased packet losses is the more evident effect of adjacent channel
interference in mixed co-channel and adjacent channel interference scenarios.
Impact of adjacent channel interference on DSRC Control Channel (CCH) communication
due to communication in adjacent SCH channel is evaluated in [38]. They setup two devices
communicating on CCH and two on SCH. Two nodes, one on each channel, are kept close
together while the other two are farther away. 5, 10, 15, 20, and 33 dBm power levels used
and 5-500 m separations used. Through the tests, the authors observed that 1) a transmit
power of 33dBm is not applicable because the adjacent channel will be found busy by the
nearby node; 2) it is not applicable to run both channels with a similar transmit power due to
the reduction of the communication range to 100 m on both channels; 3) the best power
difference seems to be 10 dB where the best communication range on the CCH and SCH can
be achieved.
The impact of on-board 802.11a Wi-Fi device communication with an electronic toll
collector on the vehicle’s DSRC communication is evaluated in [39]. The tests were done
with 3 lanes and 100 cars in each lane. Two traffic cases were considered: 1) normal traffic
case, in which cars move at 54 km/h and the average inter-car distance is 10 m; 2) traffic jam
case, which assumes that cars are moving at 3.6 km/h and the average inter-car distance is 3
m. Also, sensitivity to power was considered by: 1) vary percentage of cars using 802.11a; 2)
vary transmit power of 802.11a with percentage cars held constant; 3) vary transmit power of
802.11p RSU. Through the tests, authors of [39] found that the effect of 802.11a interference

87
can’t be eliminated just by increasing the 802.11p transmit power and need further
mechanisms to make DSRC more reliable and rugged.
Authors of [40] tested the interference to DSRC communication when the interferer is
another DSRC radio on the same vehicle as well as on another vehicle. They tested with two
scenarios: 1) V2V communications with equipped 6 dBi antenna; 2) V2I communications
with RSU equipped 16 dBi and OBU equipped 6 dBi antenna and 33 dBm transmit power.
For V2V scenario, they observed the receiver can only receive other adjacent signals within
14.19 m and non-adjacent signals within 71.13 m with full transmission rate, 27 Mbps. For
V2I scenario, they observed the receiver can only receive other adjacent signals within 174.6
m and non-adjacent signals within 875.1 m with full transmission rate, 27 Mbps.
Reference [41] analyzed the coexistence between Wi-Fi and DSRC by analyzing the physical
layer challenges and the MAC layer challenges for the two systems to coexist. At short
distances between DSRC transmitter and receiver from there is no significant coexistence
issues. For long range DSRC communications, there is high DSRC packet loss due to
interference from Wi-Fi, but long distances are not critical for safety related DSRC
applications. At medium distances, outdoor Wi-Fi can coexist better than indoor Wi-Fi, the
latter creating non-negligible packet loss, which can be problematic for DSRC safety
applications. Their results show that even with DAV, indoor Wi-Fi can cause interference to
DSRC, and it was recommended to reduce the Wi-Fi transmit power in this case to avoid
creating an interference to the DSRC. Also, the results shows the DAV provides better
coexistence mechanism for the DSRC, and it was recommended in the paper to adopt this
technique if Wi-Fi and DSRC share the same band.
From the surveys, we expect following additional technical analysis is needed for DSRC
Only regulatory scenario:

88
Evaluation of adjacent channel or co-channel Wi-Fi interference effects
Technical improvement of Wi-Fi to detect DSRC signal for advanced DAV algorithm
4.3.2 C-V2X Only
Reference [42] analyzed the effect of the aggregate adjacent channel interference generated
from LTE small-cells to a user in macro-cells. The authors propose an interference
approximation model for the interference generated from small-cell to a device connected to
the macro-cell as a weighed-sum of lognormal-based distributions. They found that if small-
cell intensity increases, the outage probability of victim user increases and under same small-
cell intensity, as the distance between victim user and macro-cell BS increases, outage
probability increases.
The authors of [43] proposed a modified OFDM-based scheme for V2X communication to
improve performance and robustness of the vehicular communications against fast fading,
which will happen when vehicles travelling at high speed. The authors analyzed the effect of
subcarriers numbers on the date rate under different relative speeds. They concluded that
when the data rate increases from 1 Mbps to 10 Mbps under a relative speed of 200 km/h, the
larger number of subcarriers is preferred to satisfy the link performance requirements,
especially to prevent frequency selective fading.
The authors of [44] evaluate the performance of V2I communications based on a freeway
scenario in which the coverage is provided by LTE-A. The authors used an LTE system
simulation platform for which the system throughput performance and signal-to-interference-
plus-noise ratio (SINR) have been rigorously assessed. For the case in which the network is
dense and the reliability requirement is high, the results indicate there is a need for novel

89
resource allocation and interference mitigation techniques to meet the performance
requirements. For the case in which the minimum and maximum distances between vehicles
are 200 m and 300m, respectively (which corresponds to around 40 vehicles connected to
each RSU), the result shows that about 50% of vehicles can achieve an SINR of 15 dB and
cell edge vehicles (5% from CDFs) can achieve SINR of 2 dB.
The authors of [45, 46] studied about performances of LTE-V mode 4 for C-V2X and
presented LTE-V mode 4 with using sidelink. From [44], the authors compared the
performances of DSRC and LTE-V under highway fast and slow environments and evaluated
LTE-V performances with different modulation schemes. From the studies, the authors
observed LTE-V outperforms DSRC when DSRC is using low data rate and alternative
DSRC due to its improved link budget, the support for redundant transmissions per packet,
and different sub-channelization schemes. However, the careful configuration parameters are
required for more efficient usage. The authors of [45] analyzed the performance with
different Semi-Persistent Scheduling (SPS) parameters of C-V2X. The authors of [45]
observed Packet Delivery Ratio (PDR) improved as the number of available sub-channels and
increasing of resource reservation interval can obtain increasing of PDR in dense networks.
From the surveys related to C-V2X Only regulatory scenarios, we expect following technical
challenges are needed:
Observation of the configuration of C-V2X that can outperforms DSRC
Evaluations of adjacent or co-channel Wi-Fi interference effect to C-V2X
Signal scheduling schemes for C-V2X networks
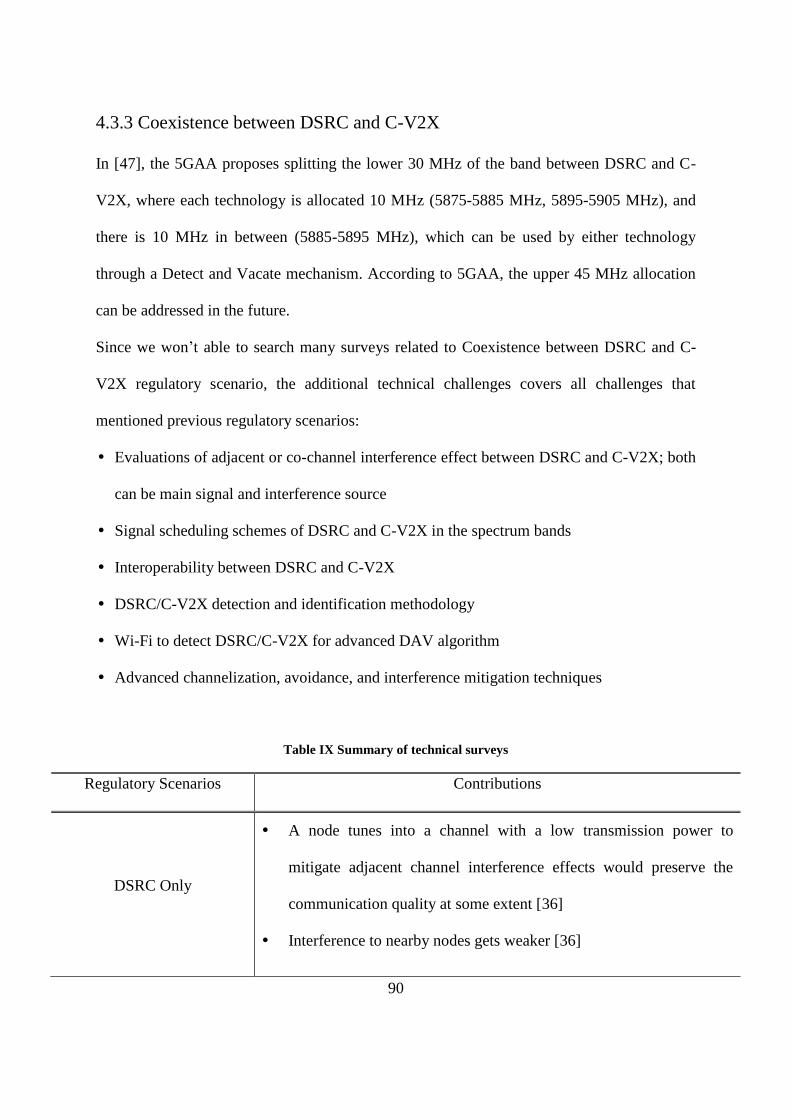
90
4.3.3 Coexistence between DSRC and C-V2X
In [47], the 5GAA proposes splitting the lower 30 MHz of the band between DSRC and C-
V2X, where each technology is allocated 10 MHz (5875-5885 MHz, 5895-5905 MHz), and
there is 10 MHz in between (5885-5895 MHz), which can be used by either technology
through a Detect and Vacate mechanism. According to 5GAA, the upper 45 MHz allocation
can be addressed in the future.
Since we won’t able to search many surveys related to Coexistence between DSRC and C-
V2X regulatory scenario, the additional technical challenges covers all challenges that
mentioned previous regulatory scenarios:
Evaluations of adjacent or co-channel interference effect between DSRC and C-V2X; both
can be main signal and interference source
Signal scheduling schemes of DSRC and C-V2X in the spectrum bands
Interoperability between DSRC and C-V2X
DSRC/C-V2X detection and identification methodology
Wi-Fi to detect DSRC/C-V2X for advanced DAV algorithm
Advanced channelization, avoidance, and interference mitigation techniques
Table IX Summary of technical surveys
Regulatory Scenarios Contributions
DSRC Only
A node tunes into a channel with a low transmission power to
mitigate adjacent channel interference effects would preserve the
communication quality at some extent [36]
Interference to nearby nodes gets weaker [36]

91
Effect of adjacent channel interference should not be neglected for
transmission power of 20 dBm at a distance lower than 7 m [37]
Increase of channel access delay due to adjacent channel interference
is largely negligible when co-channel interference is also
experienced [37]
The best power difference is around 10 dB where the best
communication range on the CCH and SCH can be achieved [38]
Effect of 802.11a interference can’t be eliminated by increasing
802.11p transmit power [39]
Receiver can receive other adjacent signals within 174.6 m and non-
adjacent signals within 875.1 m with 27 Mbps transmission rate [40]
Even with DAV, indoor Wi-Fi can cause interference to DSRC and
recommended to reduce Wi-Fi transmit power to avoid creating an
interference to DSRC [41]
C-V2X Only
If small-cell intensity increases, the outage probability of victim user
increase [42]
As the distance between victim user and macro-cell BS increases,
outage probability increase [43]
When the data rate is increasing from 1 Mbps to 10 Mbps under a
relative speed of 200 km/h, the larger number of subcarriers is
preferred to satisfy maintain the link, especially to in the presence of
frequency selective fading [43]
When the network is dense and reliability requirements are high,

92
there is a need for novel resource allocation and interference
mitigation techniques to meet the performance requirements [44]
LTE-V outperforms DSRC when DSRC is at 6 Mb/s, but DSRC can
improve the performance with 18 Mb/s [45]
LTE-V can be an alternative of DSRC due to the improved link
budget, the support for redundant transmissions per packet, and
sub-channelization schemes; however, a careful configuration of the
transmission parameters is required for transmitting more packets-per
seconds (pps) [45]
PDR improves as the number of available sub-channels for sidelinks
[46]
PDR increase from 10-25% to 60-85% when the resource reservation
interval increased 100 to 1000 ms [46]
Coexistence between DSRC
and C-V2X
5GAA proposed splitting lower 30 MHz of band between DSRC and
C-V2X and upper 45 MHz allocation can be addressed in the future
[47]
4.4 Conclusion of ITS band regulatory contingency and technical
survey
We have analyzed the potential regulatory rules that can be made by FCC and NHTSA about
5.9 GHz spectrum band for vehicular communications and have created possible regulation
scenarios. We have listed the technical challenges that can be brought up from the several

93
combinations of scenarios as shown in Table VIII. We have presented a complete survey for
the vehicular communication related research work in the literature and have mapped this
work into the different technical challenges we analyzed.
Through configuring possible regulation scenarios and technical surveys, we have identified
that certain technical challenge topic had been researched more than the others. Even the
frequent researches were done in related to DSRC only, C-V2X only, or coexistence of
DSRC and C-V2X, we believe coexistence of DSRC and C-V2X will be the regulation in
near future and C-V2X only will be the regulation for further future when the configurations
of C-V2X that can outperform DSRC is confirmed. With the expected regulation, we believe
interoperability technical issue should be investigated more due to the announcement of FCC,
U-NII4 devices share with DSRC band, and rising of C-V2X. Beyond near-term regulatory
decisions for the 5.9 GHz band, the survey will help researchers set appropriate agendas for
investigations related to V2X communication in future bands that may be subjected to
different combinations of regulations.

94
Chapter 5
Adjacent Channel Interference Evaluation
5.1 Introduction
From the technical survey for ITS band regulatory planning, we observed several technical
challenges and distributions of studies related to possible 5.9 GHz band regulatory scenarios.
Based on our observation, coexistence between DSRC and C-V2X scenario is not as
thoroughly researched as other possible scenarios mentioned in the previous chapter.
Therefore, we planned to conduct measurements to evaluate the feasibility of adjacent
channel coexistence.
We conducted the measurements to evaluate the effect of adjacent channel interference, using
interference sources such as IEEE 802.11ac and approximated C-V2X, to DSRC performance.
With the results from the experiments, we can evaluate the possibility for DSRC Only & Re-
channelization and DSRC and C-V2X adjacent channel coexistence & Re-channelization
scenarios. We measured the performance of DSRC as metric of PER with adjacent channel
interferences as IEEE 802.11ac, 20 and 40 MHz bandwidth, and approximated C-V2X
signals and different path loss values.
5.2 Measurements Overview
The objective of our experiments is to empirically evaluate the performance of DSRC using
PER as the performance metric, in the presence of interference from LTE and IEEE 802.11ac
signal in adjacent channels. Because C-V2X equipment was not available at the time of
writing, we used standard LTE/modified C-V2X signals to provide a rough approximation of

95
C-V2X. C-V2X includes provisions to reduce interference that are not included in the LTE
waveform used in the experiments, so the interference from C-V2X to DSRC is likely to be
less than observed in the experiments. With these evaluations, we can identify the effect of
Wi-Fi, LTE, and C-V2X on DSRC to assess implications of the FCC’s proposed plan for ITS
band.
For C-V2X adjacent experiments, DSRC operates on Channel 172 and C-V2X on Channel
(ch) 174. Since current Wi-Fi devices do not operate in the DSRC bands, we operate DSRC
in ch 172 and record IEEE 802.11ac signals and upconvert them to ch 169 for a 20 MHz
bandwidth Wi-Fi signal and to ch 167 for a 40 MHz wide signal. This allows us to conduct
adjacent channel interference measurements and analyses.
We consider varying path loss between DSRC radios and Wi-Fi, LTE, and C-V2X radios. As
shown in Figure 49 and Figure 50, our scenario contains a DSRC transmitter (Tx), receiver
(Rx), and Wi-Fi, LTE, and C-V2X radio as the adjacent-channel interferer. We assume that
both channels, DSRC Tx to Rx and interference source to DSRC Rx, are LOS. We consider
DSRC Tx to DSRC Rx distances (D1) of 50, 75, 100, 150, 225, 300, and 415 m. The
interference source to DSRC Rx distances (D2) are 25, 50, 75, and 100 m. Figure 49 and
Figure 50 shows the desired setup for D1 and D2.
We used the Urban Micro LOS (UMi LOS) path loss model from 3GPP TR 36.814 [31]. The
UMi LOS equations are
PL = 22.0𝑙𝑜𝑔10(𝑑) + 28.0 + 20𝑙𝑜𝑔10(𝑓𝑐) (23)
Where fc is a center frequency in GHz, d the distances between two nodes in m. (23) applies
to distances, d, below 1180 m, which are considered in these experiments.

96
Figure 49 Scenario for DSRC Tx, Rx, and LTE coexistence
Figure 50 Scenario for DSRC Tx, Rx, and Wi-Fi coexistence

97
5.3 Hardware Setup
The hardware platform has three major components: (1) DSRC radios; (2) a recorded
interference source; and (3) an emulated RF channel. All components are connected through
short shielded cables to remove any external random effects.
5.3.1 DSRC
Savari MobiWAVE radios are used for the measurements. The DSRC signal has a transmit
power level of 23 dBm, a bandwidth of 10 MHz, a packet length of 143 bytes, a packet
interval of 100 ms, and transmits 6000 packets. We assume BSM types of applications. The
BSM application contains these messages per each packet: transmit power, bit rate, channel,
message length, message count (msg_cnt), id, section mark (secMark), latitude (lat),
longitude (long), elevation, speed, heading, angle, acceleration in latitude, acceleration in
longitude, acceleration in vertical, acceleration in yaw, brake status, width, and length. We
post-process the transmitted and received packet by comparing ‘msg_cnt’, ‘secMark’, ‘lat’,
and ‘long’ parameters to determine the number of correctly received and dropped packets to
calculate the PER as
PER = 1 −𝑁𝑢𝑚𝑏𝑒𝑟 𝑜𝑓 𝑅𝑒𝑐𝑒𝑖𝑣𝑒𝑑 𝑃𝑎𝑐𝑘𝑒𝑡𝑠
𝑁𝑢𝑚𝑏𝑒𝑟 𝑜𝑓 𝑇𝑟𝑎𝑛𝑠𝑚𝑖𝑡𝑡𝑒𝑑 𝑃𝑎𝑐𝑘𝑒𝑡𝑠 (24)
5.3.2 Interference Sources
The recorded LTE signal consists of Time Division Duplex (TDD) LTE Uplink (UL) and
Downlink (DL) signals which were generated by a Rhode & Schwarz CMW 500 Wideband
Radio Communication Tester with center frequency at 2.4 GHz and bandwidth of 10 MHz.
We used USRP B210 to playback the recorded LTE signal by adjusting transmit power level

98
to 23 dBm and center frequency at Channel 174 to provide a rough approximated C-V2X
signals with nearly 100% channel capacity.
The recorded Wi-Fi signal is generated using a TP-LinkAC1900 IEEE 802.11ac Wi-Fi AP.
The 20 MHz signal uses ch 161 and the 40 MHz signals uses ch 159 with a transmit power of
36 dBm. Wi-Fi AP is connected to a Microsoft Surface Pro 3 notebook to record both uplink
and downlink signals. The channel capacity is nearly 100 %, as controlled by iperf. The
recording is done using GNU Radio with a USRP B210. The recorded signal is played back
at a desired center frequency using the same software-defined radio setup. Since a large
amount of memory is required for recording the wideband signal and the out-of-band signal
leakage, we only record the 15 MHz of the Wi-Fi signal/leakage portion that overlaps with
the DSRC signal. This is illustrated in Figure 51.
Figure 51 (a) Region of recorded 20 MHz Wi-Fi signal, (b) region of recorded 40 MHz Wi-Fi signal

99
Figure 52 RF channel emulator implemented as variable attenuators
Figure 53 Photo of attenuators
5.3.3 Emulated RF Channel
To emulate large-scale path loss (PL), we physically connect attenuators to the junction
between DSRC Tx to Rx and Wi-Fi interference to DSRC Rx separately as shown in Figure
52. The attenuated signals are combined at the input of the DSRC Rx. The actual connections

100
of attenuators are shown in Figure 53. The attenuation values are obtained based on (23).
Since the center frequencies for DSRC and 20 and 40 MHz Wi-Fi signals are different, the
calculated PL values differ; however, the difference is less than 1 dB, which is the minimum
step size of the controllable attenuators that we have. Therefore, attenuator values for 50, 75,
and 100 m LOS distances for the Wi-Fi and DSRC paths are set to the same values of 81, 84,
and 87 dB, respectively. The selected distances for Wi-Fi to DSRC Rx path are 25, 50, 75,
and 100 m with path loss of 74, 81, 84, and 87 dB. The selected distances for DSRC Tx to Rx
path are 50, 75, 100, 150, 225, 300, and 415 m with path loss of 81, 84, 87, 91, 95, 98, and
101 dB. Table X captures the experimental paraemters, including path loss values between
DSRC Tx and Rx and adjacent interference source to DSRC Rx, as well as the emulated
distance values. The signal validations are shown in Appendix C.
Table X Measurements Configurations
Configurations Parameters
DSRC transmit power 23 dBm
LTE/C-V2X transmit power 40/23 dBm
Wi-Fi
transmit power
36 dBm
DSRC channel 172
C-V2X channel 174
Distance between DSRC Tx and Rx (D1) 50, 75, 100, 150, 225, 300, 400 m
Path loss on DSRC link 81, 84.6, 87.4, 91, 95, 97.9, 100.7 dB
Adjacent Channel Tx and DSRC Rx distance D2 25, 50, 75, 100 m
Path loss along D2 74, 81, 84.6, 87.4 dB
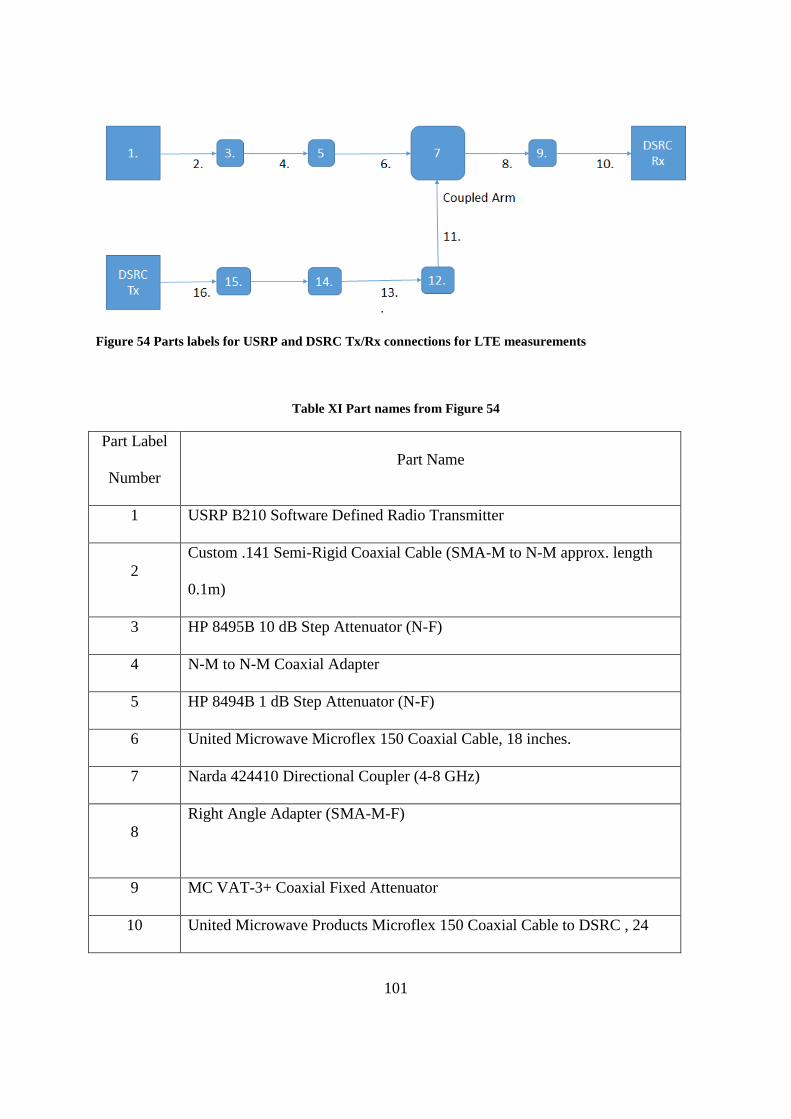
101
Figure 54 Parts labels for USRP and DSRC Tx/Rx connections for LTE measurements
Table XI Part names from Figure 54
Part Label
Number
Part Name
1 USRP B210 Software Defined Radio Transmitter
2
Custom .141 Semi-Rigid Coaxial Cable (SMA-M to N-M approx. length
0.1m)
3 HP 8495B 10 dB Step Attenuator (N-F)
4 N-M to N-M Coaxial Adapter
5 HP 8494B 1 dB Step Attenuator (N-F)
6 United Microwave Microflex 150 Coaxial Cable, 18 inches.
7 Narda 424410 Directional Coupler (4-8 GHz)
8
Right Angle Adapter (SMA-M-F)
9 MC VAT-3+ Coaxial Fixed Attenuator
10 United Microwave Products Microflex 150 Coaxial Cable to DSRC , 24

102
inches.
11 United Microwave Products Microflex 150 Coaxial Cable, 12 inches
12 HP 8495B 10 dB Step Attenuator (sma-f)
13 United Microwave Microflex 150 Coaxial Cable , 24 inches.
14 MC VAM-3W2 Coaxial Fixed Attenuator (substitute as required)
15 MC VAT-6+ Coaxial Fixed Attenuator (substitute as required)
16 United Microwave Microflex 150 CoaxialCable from DSRC, 72 inches
Note: Components tested as an assembly using R&S ZVL-13 Vector Network Analyzer
calibrated with ZV-Z132 calibration kit.
Figure 55 Wi-Fi interference signal recording diagram for 20 & 40 MHz
Figure 56 Parts labels for USRP and DSRC Tx/Rx connections for Wi-Fi measurements

103
Table XII Part names from Figure 56
Part Label
Number
Part Name
1 USRP B210 Software Defined Radio Transmitter
2 United Microwave Microflex 165 Coaxial Cable, 24 inches
3 HP 8495B 10 dB Step Attenuator (N-F)
4 N-M to N-M Coaxial Adapter
5 HP 8494B 1 dB Step Attenuator (N-F)
6 United Microwave Microflex 150 Coaxial Cable, 18 inches
7 Narda 424410 Directional Coupler (4-8 GHz)
8 Right Angle Adapter (SMA-M-F)
9 MC VAT-3+ Coaxial Fixed Attenuator
10
United Microwave Products Microflex 150 Coaxial Cable to DSRC, 72
inches
11 United Microwave Products Microflex 150 Coaxial Cable, 12 inches
12 HP 8495B 10 dB Step Attenuator (SMA-F)
13 United Microwave Microflex 150 Coaxial Cable, 24 inches.
14 MC VAM-3W2 Coaxial Fixed Attenuator (substitute as required)
15 MC VAT-6+ Coaxial Fixed Attenuator (substitute as required)
16 MC VAM-3W2 Coaxial Fixed Attenuator (substitute as required)
17
Times Microwave LMR-200 Coaxial Cable from DSRC Tx to fixed
attenuators, 24 inches

104
Note: Components tested as an assembly using R&S ZVL-13 Vector Network Analyzer
calibrated with ZV-Z132 calibration kit.
Figure 57 Waterfall plot of recorded LTE signal
Figure 58 Instantaneous recorded LTE signal

105
Figure 59 Waterfall plot of 20 MHz Wi-Fi signal (lower and upper end)
Figure 60 Instantaneous 20 MHz Wi-Fi signal

106
Figure 61 Waterfall plot of 40 MHz Wi-Fi signal (lower and upper end)
Figure 62 Instantaneous 40 MHz Wi-Fi signal (lower and upper end)

107
5.4 Results
Since the number of transmitted packet is 6000, we plot the PER value as <10-4
when no
packets are dropped at the receiver. We conduct each scenario one time, 6000 packet
transmissions; therefore, there is a possibility of capturing higher PER than our results if
more packets transmitted.
5.4.1 LTE/C-V2X Interference Scenario Results
We analyze LTE and C-V2X coexisting in adjacent channel with DSRC. The PER is around
0.5 for D2 of 25 m; however, the PER is around 0.1 for all other D2 distances. The PER is
almost zero for all scenarios except for the D1 of 50 m and D2 of 25 m. This scenario has the
strongest effect of the interference, which is reflected by the results. The PER value of
1.5*10^-3 is low and has little effect on the service. Therefore, we conclude that LTE
adjacent channel signal has significant impact on DSRC for short distances and less for
further distances, and C-V2X adjacent channel signal has almost no effect on the DSRC
performance and both can coexist in adjacent channels.

108
Figure 63 PER of DSRC for different LTE BS-DSRC Distances

109
Figure 64 PER of DSRC with C-V2X
5.4.2 20 MHz Wi-Fi Interference Scenario Results
When Wi-Fi is operating in channels of DSRC transmissions, the PER of Figure 65 is
obtained. We observe low PERs for all scenarios except for Wi-Fi distances of 25 m. For Wi-
Fi distances between 50 and 100 m, we observe PER in the range between 1.65e-4
and 6.57e-4
,
which represents packet losses of 1-4 packets out of 6000 transmission. When comparing this
with the C-V2X results, we conclude that Wi-Fi is a worse channel neighbor than C-V2X.
However, even though the Wi-Fi distance of 25 m leads to non-negligible PER, the
performance of DSRC will not be critically affected. Therefore, we conclude that 20 MHz
Wi-Fi adjacent channel signals will affect DSRC performance only when the Wi-Fi AP is
within 25 m of the DSRC receiver. Also, interestingly, we observe that the PER is less
affected by the path loss changes on the D1 link than on D2. From this observation we

110
conclude that the effect of changes in the out-of-band emission of Wi-Fi is more harmful than
the effect of path loss changes of DSRC.
Figure 65 PER of DSRC with 20 MHz Wi-Fi adjacent channel transmissions
5.4.3 40 MHz Wi-Fi Interference Scenario Results
Figure 66 illustrates the PER of DSRC with a 40 MHz adjacent channel Wi-Fi system.
Interestingly, we find a lower PER for all scenarios when compared to the 20 MHz Wi-Fi
case. The highest PER occurs at D1 of 50 m and D2 of 25 m; however, the two lost packets
out of 6000 transmitted can be considered a negligible performance degradation of DSRC.
Therefore, we conclude that 40 MHz Wi-Fi adjacent channel signal will not affect DSRC
performance. Also, we find as before that the effect of DSRC path loss changes is less severe
than changes in the Wi-Fi out-of-band emission.

111
Figure 66 PER of DSRC with 40 MHz Wi-Fi adjacent channel transmissions
5.5 Conclusions for Adjacent channel interference measurements
We conducted the measurements to evaluate the effect of adjacent channel interference, the
sources as Wi-Fi, roughly adjusted C-V2X, and LTE, to the performance of DSRC. The setup
was DSRC at Channel 172, Wi-Fi at Channel 169 for 20 MHz bandwidth and at Channel 167
for 40 MHz, and LTE/C-V2X at Channel 174 with almost 100% spectrum capacity. From the
measurements, we observed higher PER values for D1 of 50 m and D2, Wi-Fi scenario, of 25
m; however, we concluded as not much critically affect the DSRC performance. Also, we
concluded C-V2X adjacent interference does not critically affect the DSRC performance as
well as 20 and 40 MHz Wi-Fi adjacent interferences. However, LTE adjacent interference
has significant effect to DSRC performance with shorter distances and decreases as the
distance increases.

112
From the measurements, we conclude adjacent channel coexistence between DSRC, C-V2X,
and Wi-Fi can be deployable for 5.9 GHz spectrum band. However, the real environment
testing is required to make a solid conclusion for adjacent channel coexistence.
113
Chapter 6:
Summary
6.1 Summary of V2T Communications
We presented a V2T early warning application architecture with requirements. For the
feasibility study, we conducted propagation channel measurements and DSRC performance
measurements at railroad crossings in open spaces, artificial shadowed environments, rural,
and suburban environments. From the analysis of the results, we concluded that DSRC
protocol can be adapted to the early warning application architecture and feasibility analyses
provide guidance for implementation of V2T warning systems. Contribution 1 also benefits
researchers by presenting methodologies for measurements of V2T radio channels and V2T
warning system radio link performance. The higher level of architecture of V2T is
combinations of V2V and V2I, but in more detail, we presented numeric regions, distances,
and the notification time based on the speed of vehicles or trains. From the conducted
propagation channel and DSRC performance measurements, we used estimation methods to
generate linear regression models. From the models and comparison between existing works,
we observed more physical experiments are required, but collected Ricean K factor under
V2T communications are similar to V2V model. Estimation methods evaluation benefits
researchers by presenting mathematical approaches and methodology for vehicular
communication modelling and will benefit system designers and operators by presenting
measured and calculated models for use in simulation and field trials.

114
6.2 Summary of ITS Band Regulatory Study
The 5.9 GHz band has been sought after by several stakeholders, including traditional mobile
operators, DSRC proponents, and C-V2X proponents. FCC and NHTSA are responsible for
regulations related to vehicular communications, and have not finalized the rules regarding
this band. We provided possible regulatory scenarios that could result from rule-making by
these agencies, and identified relevant technical challenges for these scenarios. We identified
interoperability between DSRC and C-V2X as the most challenging of the potential new
technical requirements. The study provides information that can support regulatory decision-
making and spectrum-sharing system deployments by presenting the issues and possible
solutions.
6.3 Summary of Adjacent Channel Interference Measurements
Based on the technical survey and technical challenges, we observed that more study related
to coexistence between DSRC and C-V2X is needed. Therefore, we conducted adjacent
channel interference measurements with Wi-Fi, LTE, and modified C-V2X as the
interference sources. From the results, we concluded DSRC can coexist with adjacent
channels of Wi-Fi, LTE, and C-V2X, although additional measurements that include fading will
help to confirm this. The study supports regulatory decision-making by a summary and
analysis of relevant research, and by providing an assessment of interference between
wireless technologies that are candidates for co-existing deployments in ITS bands.

115
6.4 List of All Publications
Table XIII List of papers related to contributions
Contributions Title of Papers Status
V2T
Communications
Measurement and Configuration of DSRC
Radios for Vehicle-to-Train (V2T) Safety-
Critical Communications
IEEE Wireless
Communications Letters
(Published)
7 conference papers Published
6.4.1 Published Journal Papers
1. J. Choi et al., "Measurement and Configuration of DSRC Radios for Vehicle-to-Railroad
(V2R) Safety-Critical Communications," IEEE Wireless Communications Letters, vol. 7,
no. 3, pp. 428-431.
2. S. Kim, J. Choi, and C. Dietrich, "PSUN: An OFDM-pulsed radar coexistence technique
with application to 3.5 GHz LTE," Mobile Information Systems, 2016.
6.4.2 Published Conference Papers
3. J. Choi et al., “ Measurements and Analysis of DSRC for V2TSafety-Critical
Communications,” 2018 IEEE Connected and Automated Vehicles Symposium (IEEE
CAVS 2018)
4. J. Choi et al., “Measurement and Configuration of DSRC Radios for Vehicle-to-
Railroad (V2R) Safety-Critical Communications,”2018 IEEE International Conference
on Communications (ICC), Kansas City, MO, 2018.

116
5. X. Ma, S. Guha, J. Choi, C. R. Anderson, R. Nealy, J. Withers, J. H. Reed, C. Dietrich,
"Analysis of directional antenna for railroad crossing safety applications," 2017 14th
IEEE Annual Consumer Communications & Networking Conference (CCNC), Las
Vegas, NV, 2017, pp. 1-6.
6. X. Ma, S. Guha, J. Choi, C. R. Anderson, R. Nealy, J. Withers, J. H. Reed, C. Dietrich,
"Prototypes of using directional antenna for railroad crossing safety applications," 2017
14th IEEE Annual Consumer Communications & Networking Conference (CCNC), Las
Vegas, NV, 2017, pp. 594-596.
7. S. Kim, J. Choi and C. B. Dietrich, "Coexistence between OFDM and pulsed radars in
the 3.5 GHz Band with imperfect sensing," 2016 IEEE Wireless Communications and
Networking Conference Workshops (WCNCW), Doha, 2016, pp. 437-442.
8. J. Choi, S. Guha, X. Ma, C.B. Dietrich, “PHY and MAC Layer Simulator for
Dedicated Short Range Communication (DSRC) Vehicular Communications,” 25th
Anniversary Wireless Symposium (Wireless@VT), May 2015.
9. X. Ma, J. Choi, S. Guha, C. Anderson, C.B. Dietrich, “DSRC Feasibility Study for
Railroad Grade Crossing Safety Improvement - A Measurement Plan, ” 25th
Anniversary Wireless Symposium (Wireless@VT), May 2015.
10. J. Choi, S. Guha, C.B. Dietrich, "A Simulink-Based Model and Analysis of the PHY
Layer in Vehicular Communications," SDR / WInnComm 2015, San Diego, CA, March
24-26, 2015.
11. J. Choi, S. Guha, F. M. Romano, R. Galeshi, T. Smith-Jackson and C. B. Dietrich,
"Exploration of efficient testing methodology for effective spectrum sharing," 2014

117
USNC-URSI Radio Science Meeting (Joint with AP-S Symposium), Memphis, TN, 2014,
pp. 297-297.
12. J. Choi, S. Guha, F.M. Romano, T.L. Smith-Jackson, C.B. Dietrich, "A flexible and
extensible cognitive radio test system (CRTS)," SDR / WInnComm 2014, Schaumburg,
IL, March 11-13, 2014.

118
References
[1] P. Levin, Thomas, Mitchell, Echsner & Proctor, Attorneys at Law. (2012). Railroad
Accident Questions. Available: http://train-accident-law.com/
faq.html
[2] Federal Railroad Administration, “FRA Office of Safety Analysis,” Feb. 2018. [Online].
Available: http://safetydata.fra.dot.gov/OfficeofSafet
y/Default.aspx
[3] Federal Communications Commission, “In the Matter of Revision of Part 15 of the
Commission’s Rules to Permit Unlicensed National Information Infrastructure (U-NII)
Devices in the 5 GHz Band,” ET Docket No. 13-49, February 20, 2013.
[4] A. Rostami et al., “Stability challenges and enhancements for vehicular channel
congestion control approaches,” IEEE Trans. Intell. Transp. Syst., vol. 17, no. 10, pp.
2935-2948, 2016.
[5] X. Xiang, W. Qin, and B. Xiang, “Research on a DSRC-based rear-end collision warning
model,” IEEE Trans. Intell. Transp. Syst., vol. 15, no. 3, pp. 1054-1065, 2014.
[6] S. Ucar, S. C. Ergen, and O. Ozkasap, “Multihop-cluster-based IEEE 802.11p and LTE
hybrid architecture for VANET safety message dissemination,” IEEE Trans. Veh.
Technol., vol. 65, no. 4, pp. 2621-2636, 2016.
[7] K. Dhondge et al., “WiFiHonk: smartphone-based beacon stuffed WiFi Car2X-
communication system for vulnerable road user safety,” In Proc. IEEE Vehicular
Technology Conference, 2014, pp. 1-5.

119
[8] M. Shi et al., “DSRC and LTE-V communication performance evaluation and
improvement based on typical V2X application at intersection,” In Proc. Chinese
Automation Congr., 2017, pp. 556-561.
[9] R. He et al., “Measurement-based analysis of relaying performance for Vehicle-to-
Vehicle communications with large vehicle obstructions,” In Proc. IEEE Vehicular
Technology Conference, 2016, pp. 1-6.
[10] J. J. Anaya et al., “Vehicle to pedestrian communications for protection of vulnerable
road users,” In Proc. IEEE Intelligent Vehicles Symposium, 2014 pp. 1037-1042.
[11] Y. Song et al., “Long term evolution for wireless railway communications: testbed
deployment and performance evaluation,” IEEE Commun. Mag., vol. 54, no. 2, pp.
138-145, 2016.
[12] J. Kim et al. “Automatic train control over LTE: Design and performance evaluation,”
IEEE Commun. Mag., vol. 53, no. 10, pp. 102-109, 2015.
[13] F. Balouchi, A. Bevan, and R. Formston, “Detecting railway under-track voids using
multi-train in-service vehicle accelerometer,” In Proc. IET Conf. on Railway Condition
Monitoring, 2016, pp. 1-6.
[14] S. Banerjee, M. Hempel, and H. Sharif, “A survey of wireless communication
technologies & their performance for high speed railways,” Journal of Transportation
Technologies, vol. 6, pp. 15-29.
[15] J. Singh et al., “Cooperative intelligent transport systems to improve safety at level
crossing,” In Proc. 19th
ITS World Congr., 2012.
[16] X. Ma et al., “Analysis of directional antenna for railroad crossing safety applications,”
in Proc. Consum. Commun. Netw. Conf., 2017, pp. 1-6.
120
[17] X. Ma et al, “Prototypes of using directional antenna for railroad crossing safety
applications,” in Proc. Consum. Commun. Netw. Conf., 2017, pp. 594-596.
[18] T. W. Tedesso et al., “Propagation Measurements at 5.8 GHz for Railroad Intelligent
Transportation Systems,” in Proc. 2017 IEEE Wireless Commun. and Net. Conf., 2017,
pp. 1-6.
[19] J. Choi et al., “Measurement and configuration of DSRC radios for Vehicle-to-Train
(V2T) safety-critical communications,” IEEE Commun. Lett., vol. 7, no. 3, pp. 428-431.
[20] R. He et al., “Measurements and analysis of propagation channels in high-speed railway
viaducts,” IEEE Trans. Wireless Commun., vol. 12, no. 2, pp.794-805, 2013.
[21] M. Yang et al., “Path loss characteristics for vehicle-to-infrastructure channel in urban
and suburban scenarios at 5.9 GHz,” In Proc. General Assembly and Scientific Symp.
of the Int. Union of Radio Science, 2017, pp. 1-4.
[22] L. Bernado et al., “Time- and frequency- varying K-factor of non-stationary vehicular
channels for safety-relevant scenarios,” IEEE Trans. Intell. Trans. Syst., vol. 16, no. 2,
pp. 1007-1017, 2015.
[23] L. Bernado et al., “Delay and Doppler spreads of nonstationary vehicular channels for
safety-relevant scenarios,” IEEE Trans. Veh. Technol., vol. 63, no. 1, pp. 82-93, 2014.
[24] P. Alexander, D. Haley, A. Grant, “Cooperative intelligent transport systems: 5.9-GHz
field trials,” Proc. of the IEEE, vol. 99, no. 7, pp. 1213-1235, 2011.
[25] I. Tan et al., “Measurement and analysis of wireless channel impairments in DSRC
vehicular communications,” In Proc. IEEE Int. Conf. on Comm., 2008, pp. 4882-4888.
[26] Virginia Department of Motor Vehicles. “Virginia driver’s Manual,” Feb. 2018. [Online].
Available: http://www.dmv.state.va.us/webdoc/pdf/
dmv39.pdf

121
[27] C. R. Anderson, “Design and implementation of an ultrabroadband milli meter-
wavelength vector sliding correlator channel sounder and in-building multipath
measurements at 2.5 & 60 GHz,” M. S. thesis, Dept. Elect. Eng., Virginia Tech,
Blacksburg, VA, USA, 2002.
[28] Cohda Wireless. “MK5 OBU,” Feb. 2018. [Online]. Available:
http://www.cohdawireless.com/soltions/hardware/mk5-obu/
[29] Mobile Mark. “Broadband, Omni-Directional DSRC 5.9 GHz,” Feb. 2018. [Online].
Available: https://www.mobilemark.com/wp-content/uploads/2015/04/antenna-spec-
144-eco-5900.pdf
[30] Ventev. “4.9-6.1 GHz, 20.5-23 dBi Dual Polarized Outdoor Panel Antenna With N
Connectors”, 2017. [Online]. Available: http://www.ventevinfra.com/
[31] 3rd
Generation Partnership Project, “Technical Specification Group Radio Access
Network; Evolved Universal Terrestrial Radio Access (E-UTRA); Further
advancements for E-UTRA physical layer aspects; 3GPP TR 36.814 (Release 9),”
3GPP, Valbonne, France, Mar. 2010.
[32] Federal Communications Commission, “Amendment of the Commission’s Rules
Regarding Dedicated Short-Range Communication Services in the 5.850-5.925 GHz
Band (5.9 GHz Band); Amendment of Parts 2 and 90 of the Commission’s Rules to
Allocate the 5.850-5.925 GHz Band to the Mobile Service for Dedicated Short Range
Communications of Intelligent Transportation Systems, ET Docket No. 98-95, WT
Docket No. 01-90, FCC 03-324,” FCC, Feb. 2004.
[33] Federal Communications Commission, “Unlicensed national information infrastructure
(U-NII) devices in the 5 GHz band, ET Docket No. 13-49, FCC 16-68,” FCC, Jun.
2016.

122
[34] S. Sun, et al. "Support for vehicle-to-everything services based on LTE," IEEE Wireless
Commun. vol. 2, no. 3, pp 4-8, Jun. 2016.
[35] A. Kousaridas, et al., “Recent advances in 3GPP Networks for vehicular
communications,” in IEEE Conf. on Standards for Commun. and Networking, Helsinki,
Finland, 2017, pp. 91-97.
[36] C. Campolo, A. Molinaro and A. Vinel, "Understanding adjacent channel interference in
multi-channel VANETs," in IEEE Vehicular Networking Conf., Paderborn, Germany,
2014, pp. 101-104.
[37] C. Campolo, et al., "On the impact of adjacent channel interference in multi-channel
VANETs," in IEEE Int. Conf. on Commun., Kuala Lumpur, Malaysia, 2016, pp. 1-7.
[38] R. Lasowski, et al., "Evaluation of adjacent channel interference in single radio
vehicular Ad-Hoc networks," in IEEE Consumer Commun. and Networking Conf., Las
Vegas, NV, 2011, pp. 267-271.
[39] K. Lan, C. Chou, and D. Jin, “The effect of 802.11a on DSRC for ETC communication,”
in IEEE Wireless Commun. and Networking Conf., Shanghai, China, 2012, pp. 2483-
2487.
[40] L. Zhao, et al., “Feasibility analysis of mlti-radio in DSRC vehicular networks,” in Int.
Symp. on Wireless Personal Multimedia Commun., Atlantic City, NJ, 2013, pp.1-6.
[41] I. Khan and J. Harri, “Can IEEE 802.11p and Wi-Fi coexist in the 5.9 GHz ITS band?,”
in IEEE Int. Symp. on A World of Wireless, Mobile and Multimedia Networks, Macau,
China, 2017, pp. 1-6.
[42] M. Zhang, et al., "Analysis of adjacent channel interference in heterogeneous cellular
networks," in Int. Conf. on Wireless Commun. & Signal Process., Nanjing, China, 2015,
pp. 1-5.

123
[43] M. Hossen, et al., "Performance analysis of an OFDM-based method for V2X
communication," in Int. Conf. on Ubiquitous and Future Networks, Shanghai, China,
2014, pp. 238-242.
[44] P. Luoto, et al., "System Level Performance Evaluation of LTE-V2X Network," in
European Wireless Conference, Oulu, Finland, 2016, pp. 1-5.
[45] R. Molina-Masegosa and J. Gozalvez, “LTE-V for Sidelink 5G V2X,” IEEE Veh. Tec.
Mag., vol. 12, no. 4, pp. 30-39, Dec. 2017.
[46] Nabil, Amr, et al. "Performance Analysis of Sensing-Based Semi-Persistent Scheduling
in C-V2X Networks." arXiv preprint arXiv:1804.10788 (2018).
[47] 5G Autonomous Association (Jun. 2017), Coexistence of C-V2X and 802.11p at 5.9 GHz
[Online]. Apr. 2018, Available: http://5gaa.org/news/position-paper-coexistence-of-c-
v2x-and-802-11p-at-5-9-ghz/
[48] Transportation Technology Center, Inc. (2017). Available: http://www.aar.com
[49] Shenandoah Valley Railroad, LLC. (2017). Available: http://www.svrr-llc.com
[50] Cohda Wireless. (2017). Available: http://www.cohdawireless.com
[51] J. Singh, A. Desai, F. Acker, S. Ding, S. Prakasamul, A. Rachide, et al., "Cooperative
intelligent transport systems to improve safety at level crossing," in The 12th Global
Level Crossing and Trespass Symp., London, 2012.
[52] Lansford, Jim, John B. Kenney, and Peter Ecclesine. "Coexistence of unlicensed devices
with DSRC systems in the 5.9 GHz ITS band." In Vehicular Networking Conference
(VNC), 2013 IEEE, pp. 9-16. IEEE, 2013.
[53] Moller, Andreas, Jorg Nuckelt, Dennis M. Rose, and Thomas Kurner. "Physical layer
performance comparison of LTE and IEEE 802.11 p for vehicular communication in an

124
urban NLOS scenario." In Vehicular Technology Conference (VTC Fall), 2014 IEEE
80th, pp. 1-5. IEEE, 2014
[54] Matolak, David W., Qiong Wu, Juan J. Sanchez-Sanchez, David Morales-Jiménez, and
M. Carmen Aguayo-Torres. "Performance of LTE in vehicle-to-vehicle channels." In
Vehicular Technology Conference (VTC Fall), 2011 IEEE, pp. 1-4. IEEE, 2011.
[55] Liu, Jinshan, Gaurang Naik, and Jung-Min Jerry Park. "Coexistence of DSRC and Wi-Fi:
Impact on the performance of vehicular safety applications." In Communications (ICC),
2017 IEEE International Conference on, pp. 1-6. IEEE, 2017.
[56] Molisch, Andreas F., Fredrik Tufvesson, Johan Karedal, and Christoph F.
Mecklenbrauker. "A survey on vehicle-to-vehicle propagation channels." IEEE
Wireless Communications 16, no. 6 (2009): 12-22.
[57] Zajić, Alenka. Mobile-to-mobile wireless channels. Artech House, 2012.
[58] A. P. Subramanian, V. Navda, P. Deshpande, and S. R. Das, "A measurement study of
inter-vehicular communication using steerable beam directional antenna," presented at
the Proceedings of the fifth ACM international workshop on VehiculAr Inter-
NETworking, San Francisco, California, USA, 2008.
[59] F. R. A. Office of Safety Analysis. (2013). FRA Office of Safety Analysis Web Site.
Available: http://safetydata.fra.dot.gov/OfficeofSafety/Default.aspx
[60] J. B. Kenney, "Dedicated Short-Range Communications (DSRC) Standards in the
United States," Proceedings of the IEEE, vol. 99, pp. 1162-1182, 2011.
[61] C. Hsu, C. Liang, L. Ke, and F. Huang, “Verification of On-Line Vehicle Collision
Avoidance Warning System using DSRC,” World Academy of Science, Engineering
and Technology, vol. 55, pp. 377-383, 2009.

125
[62] Y. Xue, L. Jie, N. F. Vaidya, and Z. Feng, "A vehicle-to-vehicle communication
protocol for cooperative collision warning," in The First Annual International
Conference on Mobile and Ubiquitous Systems: Networking and Services, 2004, pp.
114-123.
[63] G. M. Jan Fischer-Wolfarth, Advanced Microsystems for Automotive Applications:
Springer, 2013.
[64] "Railroad-Highway Grade Crossing Handbook," 2007.
[65] Z. Shaozhen, T. S. Ghazaany, S. M. R. Jones, R. A. Abd-Alhameed, J. M. Noras, T.
Van Buren, et al., "Probability Distribution of Rician K-Factor in Urban, Suburban and
Rural Areas Using Real-World Captured Data," IEEE Transactions on Antennas and
Propagation, vol. 62, pp. 3835-3839, 2014.
[66] G. Acosta-Marum and M. A. Ingram, "Six Time- and Frequency Selective Empirical
Channel Models for Vehicular Wireless LANs," IEEE Vehicular Technology Magazine,
2007.
[67] Recommendation, I. T. U. R. M. "1225, Guidelines for evaluation of radio transmission
technologies for IMT-2000." International Telecommunication Union (1997).
[68] Doufexi, Angela, et al. “A comparison of the HIPERLAN/2 and IEEE 802.11 a
wireless LAN standards.” IEEE Communications magazine 40.5 (2002): 172-180.
[69] Electro – Motive Division, General Motors Corporation, “SD40 Operators Manual,” 6th
Edition, May 1971. Available at: http://rr-fallenflags.org/manual/manual.html
[70] G. I. P. P. Partnership, “5G Vision,” February, 2015.
[71] J. G. Andrews, S. Buzzi, W. Choi, S. V. Hanly, A. Lozano, A. C. Soong, et al., “What
will 5G be?,” Selected Areas in Communications, IEEE Journal on, vol. 32, pp. 1065-
1082, 2014.

126
[72] H. Moiin, “Looking ahead to 5G – A symbiotic convergence of new and existing
technologies,” presented at the EUCNC, 2014.
[73] J. Morrish. (June 2013). The Connected Life. Available: www.gsma.com
[74] B. C. Cheng et al., “Survey on networking for Internet of Vehicles,” J. Internet Technol.,
vol. 14, no. 7, pp. 1007-1020, Dec. 2013.
[75] N. H. T. S. Administration, “Safety in Numbers,” vol. Volume 1 Issue 4, ed, August
2013.
[76] N. H. T. S. Administration, “Traffic Safety Facts, 2012 Data: Pedestrian,” Annals of
Emergency Medicine, vol. 65, p. 452, 2015.
[77] A. Vinel, “3GPP LTE versus IEEE 802.11 p/WAVE: which technology is able to
support cooperative vehicular safety applications?,” Wireless Communications Letters,
IEEE, vol. 1, pp. 125-128, 2012.
[78] S. Kato, M. Hiltune, K. Joshi, and R. Schlichting, “Enabling vehicular safety
applications over LTE networks,” in Connected Vehicles and Expo (ICCVE), 2013
International Conference on, 2013, pp. 747-752.
[79] L. Gallo and J. Harri, “Short paper: A LTE-direct broadcast mechanism for periodic
vehicular safety communications,” in Vehicular Networking Conference (VNC),2013
IEEE, 2013, pp. 166-169.
[80] Z. H. Mir and F. Filali, “LTE and IEEE 802.11 p for vehicular networking: a
performance evaluation,” EURASIP Journal on Wireless Communications and
Networking, vol. 2014, pp. 1-15, 2014.
[81] K. Trichias, v. d. J. Berg, G. Heijenk, d. J. Jongh, and R. Litjens, “Modeling and
evaluation of LTE in intelligent transportation systems,” 2012.

127
[82] G. Araniti, C. Campolo, M. Condoluci, A. Iera, and A. Molinaro, “LTE for vehicular
networking: a survey,” Communications Magazine, IEEE, vol. 51, pp. 148-157, 2013.
[83] H. Onishi and F. Mlinarsky, “Wireless technology assessment for automotive
applications,” in Proc. ITS World Congress, 2012.
[84] R. Atat, E. Yaacoub, M. S. Alouini, and F. Filali, “Delay efficient cooperation in public
safety vehicular networks using LTE and IEEE 802.11 p,” in Consumer
Communications and Networking Conference (CCNC), 2012 IEEE, 2012, pp. 316-320.
[85] P. Caballero-Gil, C. Caballero-Gil, and J. Molina-Gil, “Design and implementation of an
application for deploying vehicular networks with smartphones,” International Journal
of Distributed Sensor Networks, vol. 2013, 2013.
[86] S. Tornell, C. T. Calafate, J. C. Cano, P. Manzoni, M. Fogue, and F. J. Martinez,
“Evaluating the feasibility of using smartphones for ITS safety applications,” in
Vehicular Technology Conference (VTC Spring), 2013 IEEE 77th
, 2013, pp. 1-5.
[87] Honda Demonstrates Advanced Vehicle-to-Pedestrian and Vehicle-to-Motorcycle Safety
Technologies Available: http://www.prnewswire.com/news-releases/honda-
demonstrates-advanced-vehicle-to-pedestrian-and-vehicle-to-motorcycle-safety-
technologies-221495031.html
[88] A. Mostafa, A. M. Vegni, R. Singoria, T. Oliveira, T. D. Little, and D. P. Agrawal, “A
V2X-based approach for reduction of delay propagation in vehicular Ad-hoc networks,”
in ITS Telecommunications (ITST), 2011 11th
International Conference on 2011, pp.
756-761.
[89] L. Reggiani, L. Dossi, L. G. Giordano, and R. Lambiase, Small LTE Base Stations
Deployment in Vehicle-to-Road-Infrastructure Communications: INTECH Open
Access Publisher, 2013.

128
[90] E. Abd-Elrahman, A. M. Said, T. Toukabri, H. Afifi, and M. Marot, “Assisting V2V
failure recovery using Device-to-Device Communications,” in Wireless Days (WD),
2014 IFIP, 2014, pp. 1-3.
[91] G. Hattori, C. Ono, S. Nishiyama, and H. Horiuchi, “Implementation and evaluation of
message delegation middleware for its application,” in Applications and the Internet
Workshops, 2004, SAINT 2004 Workshops. 2004 International Symposium on, 2004, pp.
326-333.
[92] A. Elmurtada, Y. Awad, and M. Elnourani, “Adaptive Smart Antennas in 3G Networks
and Beyond,” in Research and Development (SCORed) IEEE Student Conference 2012,
pp. 148-153.
[93] S. Pyun, H. Widiarti, and Y. Kwon, “Group-Based Channel Access Scheme for a V2I
Communication System using Smart Antenna,” IEEE Communications Letters, no. 8
(2011), pp. 804-806.
[94] H. Wu, C. Liu, and Y. Dai, “Adaptive Pattern Nulling Design of Linear Array Antenna
by Phase Perturbations Using Invasive Weed Optimization Algorithm,” in 2013 IEEE
Third International Conference on Information Science and Technology (ICIST). 2013.
[95] X. Z. D. Qiao, “Quality, Reliability, Securit and Robustness in Heterogeneous Networks.”
[96] W. Vandenberghs, I. Moerman, and P. Demeester, “Approximation of the IEEE 802.11
p standard using commercial off-the-shelf IEEE 802.11 a hardware,” in ITE
Telecommunications (ITST), 2011 11th
International Conference on, 2011, pp. 21-26.
[97] L. M. s. Committee, “Part 11: Wireless lan medium access control (mac) and physical
layer (phy) specifications,” IEEE-SA Standards Board, 2003.

129
[98] IEEE 802.11a WLAN Physical Layer, MathWorks, Available:
http://www.mathworks.com/help/releases/R2015b/comm/examples/ieee-802-11a-wlan-
physical-layer.html
[99] J. Choi, S. Guha, C. B. Dietrich, “A Simulink-based Model and Analysis of the PHY
Layer in Vehicular Communications,” presented at the WInnComm 2015, San Diego,
CA, 2015.
[100] Chen, Shanzhi, et al. "LTE-V: A TD-LTE-Based V2X Solution for Future Vehicular
Network." IEEE Internet of Things Journal 3.6 (2016): 997-1005.
[101] Qualcomm Technologies, Inc. “Making 5G NR a reality: Leading the technology
innovations for a unified, more capable 5G air interface.” September, 2016.
[102] Borroni-Bird, Chris. “Enabling Connected and Electric Vehicles.” Qualcomm. 2014.
[103] Zaki, Maged. “Accelerating C-V2X toward 5G for autonomous driving.” Qualcomm.
2017. Available: https://www.qualcomm.com/news/onq/2017/02/24/accelerating-c-
v2x-toward-5g-autonomous-driving
[104] Qualcomm. “Leading the world to 5G: Cellular Vehicle-to-Everything (C-V2X)
technologies.” June 2016.
[105] Lu, Ning, et al. "Connected vehicles: Solutions and challenges." IEEE internet of things
journal 1.4 (2014): 289-299.
[106] Alleven, Monica. “Qualcomm: ‘Steadfast’ supporter of DSRC sees C-V2X providing
clear path forward.” FierceWireless. Available:
http://www.fiercewireless.com/wireless/qualcomm-steadfast-supporter-dsrc-sees-c-
v2x-providing-clear-path-forward
[107] Qualcomm Research. “Cooperative ITS for all: Enabling DSRC in mobile devices.”
Feb. 6, 2013.

130
Appendix A: TTCI Channel Sounder Results
A.1 RTT Channel Measurement Results
Table XIV Summary of Horn RTT Delay and Doppler Spread Measurements
Figure 67 Horn RTT Delay Spread Visualization in Google Earth

131
Figure 68 Horn RTT Doppler Spread Visualization in Google Earth

132
Table XV Summary of Discone RTT Delay and Doppler Spread Measurements
Figure 69 Discone RTT Delay Spread Visualization in Google Earth

133
Figure 70 Discone RTT Doppler Spread Visualization in Google Earth

134
A.2 PTT Channel Measurement Results
Table XVI Summary of Horn PTT Delay and Doppler Spread Measurements
Figure 71 Horn PTT Delay Spread Visualization in Google Earth

135
Figure 72 Horn PTT Doppler Spread Visualization in Google Earth

136
Table XVII Summary of Discone PTT Delay and Doppler Spread Measurements
Figure 73 Discone PTT Delay Spread Visualization in Google Earth

137
Figure 74 Discone PTT Doppler Spread Visualization in Google Earth

138
A.3 RTT Channel Modelling Results
The calculated path loss exponents fall in the expected range between 2 and 3. These results
are expected because the system was operating in an environment with few obstructions. The
higher path loss exponents seen by the Discone antenna suggest that the system was operating
in a more obstructed environment. The Discone antenna’s path loss exponents do decrease as
the antenna height is raised because the stronger line of sight component. These path loss
models are also a based on an estimated receiver location since the GPS location of the
receiver was not recorded. Consequently, the plots could show up to 164 ft of error due to the
train speed and the estimated locations. While the error could some effect on path loss
exponent, it does not affect Ricean channel model parameter, K.
Table XVIII RTT Path Loss Model Summary

139
Figure 75 Path loss model for the horn antenna at a height of 6ft
Figure 76 Path loss model for the horn antenna at a height of 25ft

140
Figure 77 Path loss model for the horn antenna at a height of 32ft
Figure 78 Path loss model for the discone antenna at a height of 6ft

141
Figure 79 Path loss model for the discone antenna at a height of 25ft
Figure 80Path loss model for the discone antenna at a height of 32ft

142
A.4 PTT Channel Modelling Results
The calculated path loss exponents fall in the expected range of between 2 and 3, this time
falling closer to 3. These results are expected because the system was operating under a more
cluttered, urban-like environment. These path loss models are also based on an estimated
receiver location, since the GPS location of the receiver was not recorded. Consequently, the
plots could show up to 164 ft of error, due to the speed of the train and the estimated GPS
location. The path loss models show that the path loss increases as the transmitter and
receiver distance gets shorter. The increase occurs because the obstructions were placed only
around the receiver, otherwise the transmitter was operating in an environment that was
closer to free space but still had more obstructions than the RTT test site.
Table XIX PTT Path loss model summary

143
Figure 81 Path loss model for the horn antenna at 6ft
Figure 82 Path loss model for the horn antenna at 20ft

144
Figure 83 Path loss model for the horn antenna at 40ft
Figure 84 Path loss model for the discone antenna at 6ft
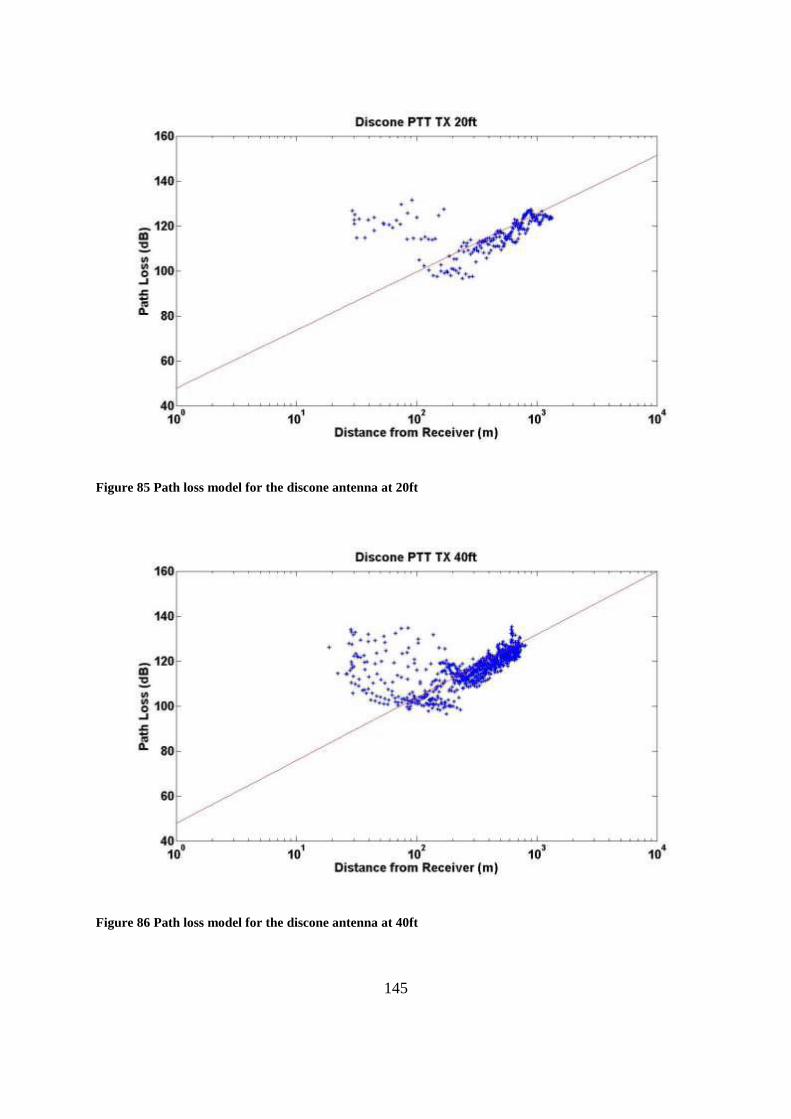
145
Figure 85 Path loss model for the discone antenna at 20ft
Figure 86 Path loss model for the discone antenna at 40ft

146
A.5 Small Scale Fading Model Results
Ricean models were chosen because the propagation environment did not show the severe
fading effects where different K values were needed for different distances away from the
receiver as suggested in literature. Instead the K values were generally consistent and were
taken as an average for each speed of the conducted tests. The K values are generally
consistent across the entire track that is made evident by the lack of change in color across
the plots. The K-factors suggest that there is a line of sight component that is present which is
expected because the RTT test site had minimal obstructions.
Table XX Average Ricean K-Factors (dB)
Figure 87 Google Earth plot of K values in dB

147
Appendix B: TTCI RSU PER Results
Figure 88 RTT RSU Omnidirectional Low Power 200m from crossing
Figure 89 RTT RSU Omnidirectional High Power 200m from crossing

148
Figure 90 RTT RSU Omnidirectional Low Power 50m from crossing
Figure 91 RTT RSU Omnidirectional High Power 50 m from crossing

149
Figure 92 PTT RSU Omnidirectional Low Power
Figure 93 PTT RSU Omnidirectional High Power

150
Appendix C: Validations of DSRC and Interference
Signals
Figure 94 Spectrum Analyzer Photo for DSRC Signal (ch 172) and LTE Signal (ch 174)
Figure 95 Validation of 20 MHz Wi-Fi and DSRC Signal
DSRC LTE
DSRC
C
Wi-Fi

151
Figure 96 Validation of 40 MHz Wi-Fi and DSRC Signal
DSRC
C
Wi-Fi

152
Appendix D: Propagation channel characteristics
for each crossings
Figure 97 Ricean K for before/after Crossing #3
Figure 98 Ricean K for before/after Crossing #4

153
Figure 99 Ricean K for before/after Crossing #6
Figure 100 RMS delay for before/after Crossing #3
Figure 101 RMS delay for before/after Crossing #4

154
Figure 102 RMS delay for before/after Crossing #6
Figure 103 Path loss exponent for before/after Crossing #3
Figure 104 Path loss exponent for before/after Crossing #4

155
Figure 105 Path loss exponent for before/after Crossing #6
Figure 106 Ricean K for before/after rural crossings
Figure 107 RMS delay for before/after rural crossings

156
Figure 108 Path loss exponent for before/after rural crossings