Embed Size (px)
Citation preview

Research ArticleFeasibility of Using Improved Convolutional Neural Network toClassify BI-RADS 4 Breast Lesions: Compare Deep LearningFeatures of the Lesion Itself and the Minimum BoundingCube of Lesion
Meihong Sheng ,1,2 Weixia Tang,2 Jiahuan Tang,2 Ming Zhang,2 Shenchu Gong,2
and Wei Xing 1
1Department of Imaging, The Third Affiliated Hospital of Soochow University, Changzhou 213003, Jiangsu, China2Department of Imaging, Affiliated Hospital 2 of Nantong University, Nantong First People’s Hospital, Nantong 226001,Jiangsu, China
Correspondence should be addressed to Wei Xing; [email protected]
Received 8 July 2021; Revised 3 August 2021; Accepted 6 August 2021; Published 8 September 2021
Academic Editor: Khin wee Lai
Copyright © 2021 Meihong Sheng et al. This is an open access article distributed under the Creative Commons AttributionLicense, which permits unrestricted use, distribution, and reproduction in any medium, provided the original work isproperly cited.
To determine the feasibility of using a deep learning (DL) approach to identify benign and malignant BI-RADS 4 lesions withpreoperative breast DCE-MRI images and compare two 3D segmentation methods. The patients admitted from January 2014 toOctober 2020 were retrospectively analyzed. Breast MRI examination was performed before surgical resection or biopsy, and themasses were classified as BI-RADS 4. The first postcontrast images of DCE-MRI T1WI sequence were selected. There were two3D segmentation methods for the lesions, one was manual segmentation along the edge of the lesion slice by slice, and the otherwas the minimum bounding cube of the lesion. Then, DL feature extraction was carried out; the pixel values of the image dataare normalized to 0-1 range. The model was established based on the blueprint of the classic residual network ResNet50,retaining its residual module and improved 2D convolution module to 3D. At the same time, an attention mechanism wasadded to transform the attention mechanism module, which only fit the 2D image convolution module, into a 3D-Convolutional Block Attention Module (CBAM) to adapt to 3D-MRI. After the last CBAM, the algorithm stretches the outputhigh-dimensional features into a one-dimensional vector and connects 2 fully connected slices, before finally setting two outputresults (P1, P2), which, respectively, represent the probability of benign and malignant lesions. Accuracy, sensitivity, specificity,negative predictive value, positive predictive value, the recall rate and area under the ROC curve (AUC) were used as evaluationindicators. A total of 203 patients were enrolled, with 207 mass lesions including 101 benign lesions and 106 malignant lesions.The data set was divided into the training set (n = 145), the validation set (n = 22), and the test set (n = 40) at the ratio of 7 : 1 : 2;fivefold cross-validation was performed. The mean AUC based on the minimum bounding cube of lesion and the 3D-ROI oflesion itself were 0.827 and 0.799, the accuracy was 78.54% and 74.63%, the sensitivity was 78.85% and 83.65%, the specificitywas 78.22% and 65.35%, the NPV was 78.85% and 71.31%, the PPV was 78.22% and 79.52%, the recall rate was 78.85% and83.65%, respectively. There was no statistical difference in AUC based on the lesion itself model and the minimum boundingcube model (Z = 0:771, p = 0:4408). The minimum bounding cube based on the edge of the lesion showed higher accuracy,specificity, and lower recall rate in identifying benign and malignant lesions. Based on the lesion 3D-ROI segmentation using aminimum bounding cube can more effectively reflect the information of the lesion itself and the surrounding tissues. Its DLmodel performs better than the lesion itself. Using the DL approach with a 3D attention mechanism based on ResNet50 toidentify benign and malignant BI-RADS 4 lesions was feasible.
HindawiWireless Communications and Mobile ComputingVolume 2021, Article ID 4430886, 9 pageshttps://doi.org/10.1155/2021/4430886

1. Introduction
Breast cancer is a serious threat to women’s health and hasbecome the world’s most common cancer [1]. Early detection,early diagnosis, and early treatment can improve both survivaland prognosis of breast cancer patients [2–4]. Greenwoodet al. [5] have reported that breastMRI plays an important rolein screening and assessing the extent of ductal carcinoma insitu (DCIS) and predicting the potential invasiveness. Thedegree of early enhancement reflects the vascular richnessand blood perfusion of the lesion and can reflect the character-istics of the lesion. According to the guideline of the AmericanCollege of Radiology (ACR), the possibility range of the BI-RADS 4 of malignancy is 2%-95% as defined by the breastimaging report and data system (BI-RADS) [6]. Lesions withBI-RADS 4 classification are difficult to define clearly. Thesigns of the lesions are overlapping and intricate. Theselesions, benign or malignant, are all classified as BI-RADS 4,along with recommended invasive procedures such as needlebiopsy to obtain pathological evidence [7–9]. Therefore, com-prehensive understanding and improved evaluation methodsof benign and malignant breast lesions are urgently neededto reduce invasive operations and the burden on patients.
In recent years, with the rapid development of artificialintelligence-assisted diagnosis systems, deep learning hasemerged as a subfield of machine learning [10–13]. Its appli-cation in medical imaging has attracted much attention,along with its wide use in image recognition, segmentation,and analysis [14]. Several studies [15, 16] have attemptedto increase the number of layers of CNNs from the original5 layers of the AlexNet network [17] to the 19 layers of theVGG network. Theoretically, a deeper network leads to bet-ter effect, but the increase in network depth will also bringadditional problems that in turn cause reduced performance.The main reason for the performance reduction was gradi-ent dispersion (vanishing gradients in backpropagation leadto weakened error signal) and gradient explosion (accumula-tion of large error gradients results in infinity in loss func-tion) that were caused by the increase in the number ofnetwork layers. The residual module was proposed by Kha-lili and Wong [15], which could effectively solve the afore-mentioned problems above and has become the standardconfiguration of CNNs.
The CNNs learned a large number of features. Some fea-tures were not important for the final result, while some othersplayed a key role in predicting results thus deserve more atten-tion. Based on this theory, Woo et al. [18] proposed the Con-volutional Block Attention Module (CBAM). The so-calledgreater attention was to give higher weight to those key fea-tures. In this study, the efficiency of feature extraction andclassification of BI-RADS 4 breast lesions with two segmenta-tionmethods was compared by the DLmodel with a 3D atten-tion mechanism, so as to verify the feasibility of using animproved convolutional neural network.
2. Materials and Methods
2.1. Study Cohort and Imaging Protocol. The patients whounderwent breast MRI examinations at Nantong First Peo-
ple’s Hospital were retrospectively collected from January2014 to October 2020. A total of 296 patients with breastlesions were enrolled in the study. Inclusion criteria: (1)the diameter of the lesion was greater than 1 cm, or lesionswere visible to naked eyes at least two consecutive slices;(2) the image quality was high without obvious artifacts ordistortion; (3) the lesions were all mass and showed irregu-lar margins, or inhomogeneous enhancement, or ringenhancement in MRI and classified as BI-RADS 4 by theradiologist. Exclusion criteria: (1) the breast mass showedno enhancement; (2) radiotherapy/chemotherapy or inva-sive operations such as biopsy before breast MRI; (3) thecharacteristics of the lesion and the pathological diagnosiswere not clear.
All MRIs in this study were acquired using a Siemens 3.0T magnetic resonance scanner (Verio; Siemens, Erlangen,Germany) with 16-channel phased array breast-specific coil.The patients were placed in the prone position with head-first entry; the breasts naturally hanged in the breast coil,and the nipple remained at the center of the coil. The scansequence parameters were as follows: DCE T1-weightedaxial fat suppression 3D spoiler gradient echo: TR 4.67ms,TE 1.66ms, flip angle 10o, FOV 340mm × 340mm, slicethickness 1.2mm, scanning of 6 phases without interval,scan time 6min 25 s, high-pressure syringe injection of 15-20mL contrast agent Gd-DTPA based on body weight(0.2ml/kg) at a flow rate of 2mL/s, and then injection ofthe same amount of normal saline to flush the tube. Afterthe 25 s injection, scanning was triggered, and each phasewas collected for 1min. The first phase was nonenhance-ment, and phases 2-6 were enhanced. Our study focusedon phase 2 images which was named DCE-MRI T1WI firstpostcontrast sequence.
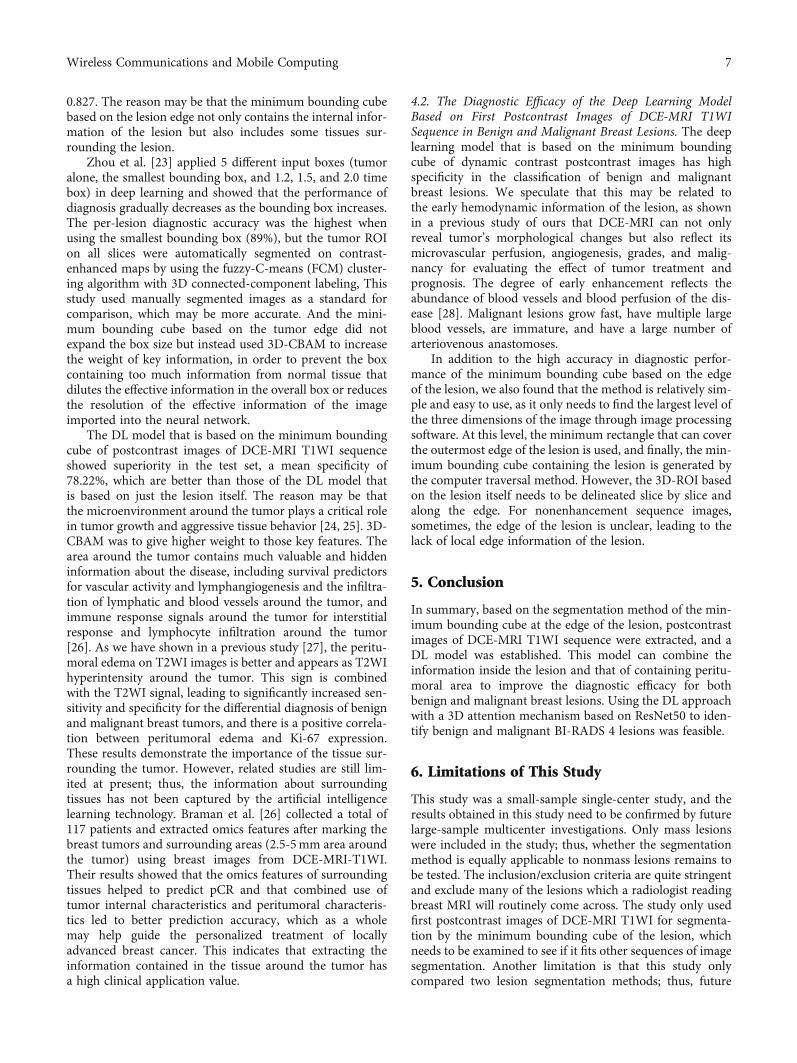
2.2. 3D-ROI Lesion Segmentation. All DCE-MRI T1WI firstpostcontrast images of breast mass that meet the inclusioncriteria were imported into the image processing softwareITK-SNAP 3.8.0 in DICOM format, and the lesions weremanually segmented by an attending physician with 8 yearsof experience in breast MRI diagnosis and reviewed by achief physician with more than 10 years of experience inbreast MRI diagnosis: (1) based on the ROI of the lesionitself (Figures 1 and 2), the 3D-ROI segmentation methodwas used to manually delineate the boundary of the lesionslice by slice along the edge of the lesion, containing cysticdegeneration, necrosis, and calcification within the lesion;(2) based on the minimum bounding cube, the maximumdiameter of the lesion was then projected onto 3 coordinateaxes of the image to determine its coverage range of x, y, andz axes, and the bounding box of the lesion was finallyobtained (Figures 3 and 4).
2.3. Lesion Feature Extraction. There are two methods of fea-ture extraction. One is to take the minimum bounding cubeof the lesion (including the lesion and part of the peritu-moral area), and the other is to take only the lesion itselfand set the value of the image pixels of part of the nonlesionarea to 0. The minimum bounding cube is the smallest cir-cumscribed cube containing the lesion. In addition, before
2 Wireless Communications and Mobile Computing

inputting to the CNN, the pixel values of the image data arenormalized to 0-1 range. The formula is as follows:
x = X − XminXmax − Xmin
, ð1Þ
where x represents the normalized image pixel value, X repre-sents the original image pixel value, and Xmax and Xmin repre-sent the maximumpixel value and theminimum pixel value ofthe minimum bounding cube of all lesions, respectively.
In this study, a total of 207 masses were obtained, ofwhich 106 were malignant and 101 were benign. The data
Figure 1: 3D-ROI segmentation method based on the lesion itself. Shows a case of fibroadenoma of the left breast.
Figure 2: 3D-ROI segmentation method based on the lesion itself. Shows a case of invasive ductal carcinoma of the right breast (stage II).
3Wireless Communications and Mobile Computing

set was divided into the training set (n = 145), the validationset (n = 22), and the test set (n = 40) at the ratio of 7 : 1 : 2. Toavoid the selection bias of the benign and malignant lesionsof the test set samples, the test set was generated by randomsampling of 20 malignant lesions and 20 benign lesions. Theremaining samples were randomly divided into the trainingset and the validation set in the ratio of 7 : 1. Fivefold cross-validation was performed.
2.4. Model Establishment. The model was established basedon the blueprint of the classic residual network ResNet50[19], retaining its residual module but changing the convolu-tion module to a 3D convolution module. At the same time,
an attention mechanism was added to transform the atten-tion mechanism module, which only fit the 2D image convo-lution module, into 3D-Convolutional Block AttentionModule (CBAM) to adapt to 3D-MRI, as shown inFigure 5. CBAM includes a channel attention module anda spatial attention module, which together can solve thequestion of which channel and which position characteris-tics play decisive roles in final prediction [18]. Input module,residual module, channel attention module, downsamplingmodule, and fully connected module constitute the mainmodules of the network. Among them, the residual modulewas mainly used to extract features, the CBAM modulewas mainly used to give higher weight to key features, andthe downsampling module was used to reduce the size ofthe feature map and to increase the number of channels inthe feature map. Blocks are used (Figure 5) to reflect the sizechange of the feature map. After the last CBAM, the algo-rithm stretches the output high-dimensional features intoa one-dimensional vector and connects 2 fully connectedslices. Lesion classification network parameters are shownin Table 1. The network uses cross-entropy cost functionas the loss function and stochastic gradient descent (SGD)whose weight decay is 0.0001 and momentum is 0.9 as theoptimizer. The batch size is 16. Dynamic learning rate strat-egy is taken during the train process. The initial learningrate is 0.1, which is considered as a big number, halvedevery 25 epochs of iterations. Before finally setting two out-put results (P1, P2), which, respectively, represent the prob-ability of benign and malignant lesions. The lesion isclassified as benign if P1 > P2. Otherwise, the lesion is clas-sified as malignant.
Figure 3: 3D-ROI segmentation method based on the minimum bounding cube at the edge of the lesion. Segmentation based on theminimum bounding box of the mass edge, showing a case of fibroadenoma of the left breast.
Figure 4: 3D-ROI segmentation method based on the minimumbounding cube at the edge of the lesion. The cubic model ofsegmentation based on the minimum bounding cube of themass edge.
4 Wireless Communications and Mobile Computing

2.5. Model Evaluation. The two DL feature models based onthe lesion itself and the minimum boundary cube of lesion inthe diagnosis of benign and malignant breast lesions werecompared. Model performance was evaluated using the areaunder the ROC curve (AUC), accuracy, sensitivity, specific-ity, positive predictive value (PPV), negative predictive value(NPV), precision, and recall rate. The AUC of the two DLmodels was compared by the DeLong test.
3. Results
3.1. Patient Characteristics. A total of 296 patients withbreast lesions were investigated in the study. The followingcases were excluded: 3 patients with unqualified imagesdue to the presence of motion artifacts, 12 patients with ahistory of biopsy or mastectomy before breast MRI examina-tion, 53 patients with a single focal lesion or multiple focal
Input-modality 3D-Resmodule 3D-CBAM Down-sampling FC-layer
Flatten Output {p1, p2}
Data-flow
Figure 5: Structure of monomodal network.
Table 1: Tumor classification network parameters.
Layer_name Input_size Detailed_parameters Output_size
conv 1 ∗ 64 ∗ 64 ∗ 64 Kernel = 3, stride = 1, padding = 1 8 ∗ 64 ∗ 64 ∗ 64res conv ∗ 2 8 ∗ 64 ∗ 64 ∗ 64 Kernel = 3, stride = 1, padding = 1 8 ∗ 64 ∗ 64 ∗ 643D_CBAM 8 ∗ 64 ∗ 64 ∗ 64 1 ∗ 1 ∗ 1 convolution 8 ∗ 64 ∗ 64 ∗ 64conv 8 ∗ 64 ∗ 64 ∗ 64 Kernel = 2, stride = 2, padding = 0 16 ∗ 32 ∗ 32 ∗ 32res conv ∗ 4 16 ∗ 32 ∗ 32 ∗ 32 Kernel = 3, stride = 1, padding = 1 16 ∗ 32 ∗ 32 ∗ 323D_CBAM 16 ∗ 32 ∗ 32 ∗ 32 1 ∗ 1 ∗ 1 convolution 16 ∗ 32 ∗ 32 ∗ 32conv 16 ∗ 32 ∗ 32 ∗ 32 Kernel = 2, stride = 2, padding = 0 32 ∗ 16 ∗ 16 ∗ 16res conv ∗ 4 32 ∗ 16 ∗ 16 ∗ 16 Kernel = 3, stride = 1, padding = 1 32 ∗ 16 ∗ 16 ∗ 163D_CBAM 32 ∗ 16 ∗ 16 ∗ 16 1 ∗ 1 ∗ 1 convolution 32 ∗ 16 ∗ 16 ∗ 16conv 32 ∗ 16 ∗ 16 ∗ 16 Kernel = 2, stride = 2, padding = 0 64 ∗ 8 ∗ 8 ∗ 8res conv ∗ 4 64 ∗ 8 ∗ 8 ∗ 8 Kernel = 3, stride = 1, padding = 1 64 ∗ 8 ∗ 8 ∗ 83D_CBAM 64 ∗ 8 ∗ 8 ∗ 8 1 ∗ 1 ∗ 1 convolution 64 ∗ 8 ∗ 8 ∗ 8conv 64 ∗ 8 ∗ 8 ∗ 8 Kernel = 2, stride = 2, padding = 0 128 ∗ 4 ∗ 4 ∗ 4res conv ∗ 4 128 ∗ 4 ∗ 4 ∗ 4 Kernel = 3, stride = 1, padding = 1 128 ∗ 4 ∗ 4 ∗ 43D_CBAM 128 ∗ 4 ∗ 4 ∗ 4 1 ∗ 1 ∗ 1 convolution 128 ∗ 4 ∗ 4 ∗ 4Flatten 128 ∗ 4 ∗ 4 ∗ 4 8192
Full connection 8192 2048
Full connection 2048 512
Softmax 512 2
“res_conv” is a residual convolution block which contains shortcut connection, and “res conv ∗N” means the block has N convolution blocks that share thesame parameters. 3D_CBAM uses 1 × 1 × 1 convolutions to adjust the channel numbers of the current feature map.
5Wireless Communications and Mobile Computing

lesions in the breast, 14 patients with incomplete examina-tion or perfusion scan breast MRI, and 11 patients withbreast lesions combined with nonmass enhancement lesions.Eventually, 203 patients were enrolled for analyses (Table 1).The patients were 17-86 years old with an average age of48:5 ± 13:1 years old. Among them, there was only one malepatient, aged 54 years. There were 105 patients with malig-nant lesions with an average age of 55:5 ± 11:3 years and98 patients with benign lesions with an average age of 41:0± 10:6 years old. A total of 207 masses were included inthe study (Table 2).
3.2. Model Characteristics
3.2.1. Comparison of the Two Deep Learning Feature ModelBased on the Lesion Itself and the Minimum BoundaryCube of Lesion in the Diagnosis of Benign and MalignantBreast Lesions. Using first postcontrast images of DCE-MRI T1WI sequence, the two deep learning feature modelbased on the lesion itself (model 1) and the minimumboundary cube of lesion (model 2) in the diagnosis of benignand malignant breast lesions were compared. The means areshown in Table 3. In comparison, the model 1 analysisachieved mean AUC of 0.799, accuracy of 74.63%, sensitivityof 83.65%, specificity of 65.35%, NPV of 71.31%, PPV of79.52%, and recall rate of 83.65% and the model 2 analysisachieved an average AUC of 0.827, accuracy of 78.54%, sen-sitivity of 78.85%, specificity and PPV of 78.22%, NPV andrecall rate of 78.85%. There was no statistical difference inAUC based on the lesion itself model and the minimumbounding cube model (Z = 0:771, p = 0:4408). The mini-mum bounding cube based on the edge of the lesion showedhigher accuracy, specificity, and lower recall rate in identify-ing benign and malignant lesions.
4. Discussion
Deep learning in convolutional neural networks (CNNs) isusually based on manually or semiautomatically segmentedtags to learn to recognize image features. Because breastMRI is different from MRI for abdomen and lung lesions,its position is fixed in a special breast coil and is less affectedby breathing movement, leading to relatively higher repro-ducibility of the segmentation method for breast lesions.
However, the segmentation methods are quite different. Pre-vious studies have mostly extracted the two-dimensional fea-tures of the lesion (2D-ROI) [20], selected the largest slice ofthe lesion or the most obvious slice of lesion enhancement[21], and segmented along the edge of the lesion. 2D-ROIcan only represent the information covered by the currentarea and cannot reflect all the information of the lesion.Therefore, this will definitely affect the reliability of DLmodels. The use of 3D-ROI is helpful to observe the lesion’soverall morphology, leading to more accurate and compre-hensive reflection of the characteristics of the lesion [22].And more weight is given to the hemodynamic characteris-tics of the relevant lesion in the model based on the usualimaging physicians’ reading habits and the advantages ofearly enhanced MRI.
4.1. The Efficacy of a Deep Learning Model Based on theMinimum Bounding Cube of the Lesion in Breast LesionClassification. This study used two different segmentationmethods for 3D-ROI of the lesion: one was based on thelesion itself, and the other one was based on the minimumbounding cube of the lesion edge. These two different seg-mentation methods were compared for their impact on theaccuracy of the DL model. Our results revealed that the DLmodel based on the minimum bounding cube of the lesionedge is more accurate, with a mean AUC value of about
Table 2: Age and pathological information of patients with benign and malignant breast tumors.
Benign patients (n = 98) Malignant patients (n = 105)Age (year) 41:0 ± 10:6 55:5 ± 11:3
Pathology (207 masses)
Fibrocystic adenosis (n = 18) Invasive ductal carcinoma (n = 81)Fibroadenoma (n = 71) Mucinous adenocarcinoma of the breast (n = 7)
Intraductal papilloma (n = 4) Invasive lobular carcinoma (n = 3)Intraductal papillomatosis (n = 4) Intraductal carcinoma or tubular carcinoma (n = 8)Benign phyllodes tumor (n = 4) Solid papillary carcinoma (n = 2)
Malignant phyllodes tumor (n = 1)Small lymphocytic lymphoma (n = 1)
Medullary carcinoma (n = 3)
Table 3: Comparison of two 3D-ROI segmentation methods basedon the lesion itself and the minimum bounding cube at the edge ofthe lesion.
Evaluation index Lesion itself Minimum bounding cube
AUC 0.799 0.827
Accuracy (%) 74.63 78.54
Sensitivity (%) 83.65 78.85
Specificity (%) 65.35 78.22
Negative prediction (%) 71.31 78.85
Positive prediction (%) 79.52 78.22
Precision (%) 71.31 78.85
Recall (%) 83.65 78.85
DeLong test Z = 0:771, p = 0:4408
6 Wireless Communications and Mobile Computing
0.827. The reason may be that the minimum bounding cubebased on the lesion edge not only contains the internal infor-mation of the lesion but also includes some tissues sur-rounding the lesion.
Zhou et al. [23] applied 5 different input boxes (tumoralone, the smallest bounding box, and 1.2, 1.5, and 2.0 timebox) in deep learning and showed that the performance ofdiagnosis gradually decreases as the bounding box increases.The per-lesion diagnostic accuracy was the highest whenusing the smallest bounding box (89%), but the tumor ROIon all slices were automatically segmented on contrast-enhanced maps by using the fuzzy-C-means (FCM) cluster-ing algorithm with 3D connected-component labeling, Thisstudy used manually segmented images as a standard forcomparison, which may be more accurate. And the mini-mum bounding cube based on the tumor edge did notexpand the box size but instead used 3D-CBAM to increasethe weight of key information, in order to prevent the boxcontaining too much information from normal tissue thatdilutes the effective information in the overall box or reducesthe resolution of the effective information of the imageimported into the neural network.
The DL model that is based on the minimum boundingcube of postcontrast images of DCE-MRI T1WI sequenceshowed superiority in the test set, a mean specificity of78.22%, which are better than those of the DL model thatis based on just the lesion itself. The reason may be thatthe microenvironment around the tumor plays a critical rolein tumor growth and aggressive tissue behavior [24, 25]. 3D-CBAM was to give higher weight to those key features. Thearea around the tumor contains much valuable and hiddeninformation about the disease, including survival predictorsfor vascular activity and lymphangiogenesis and the infiltra-tion of lymphatic and blood vessels around the tumor, andimmune response signals around the tumor for interstitialresponse and lymphocyte infiltration around the tumor[26]. As we have shown in a previous study [27], the peritu-moral edema on T2WI images is better and appears as T2WIhyperintensity around the tumor. This sign is combinedwith the T2WI signal, leading to significantly increased sen-sitivity and specificity for the differential diagnosis of benignand malignant breast tumors, and there is a positive correla-tion between peritumoral edema and Ki-67 expression.These results demonstrate the importance of the tissue sur-rounding the tumor. However, related studies are still lim-ited at present; thus, the information about surroundingtissues has not been captured by the artificial intelligencelearning technology. Braman et al. [26] collected a total of117 patients and extracted omics features after marking thebreast tumors and surrounding areas (2.5-5mm area aroundthe tumor) using breast images from DCE-MRI-T1WI.Their results showed that the omics features of surroundingtissues helped to predict pCR and that combined use oftumor internal characteristics and peritumoral characteris-tics led to better prediction accuracy, which as a wholemay help guide the personalized treatment of locallyadvanced breast cancer. This indicates that extracting theinformation contained in the tissue around the tumor hasa high clinical application value.
4.2. The Diagnostic Efficacy of the Deep Learning ModelBased on First Postcontrast Images of DCE-MRI T1WISequence in Benign and Malignant Breast Lesions. The deeplearning model that is based on the minimum boundingcube of dynamic contrast postcontrast images has highspecificity in the classification of benign and malignantbreast lesions. We speculate that this may be related tothe early hemodynamic information of the lesion, as shownin a previous study of ours that DCE-MRI can not onlyreveal tumor’s morphological changes but also reflect itsmicrovascular perfusion, angiogenesis, grades, and malig-nancy for evaluating the effect of tumor treatment andprognosis. The degree of early enhancement reflects theabundance of blood vessels and blood perfusion of the dis-ease [28]. Malignant lesions grow fast, have multiple largeblood vessels, are immature, and have a large number ofarteriovenous anastomoses.
In addition to the high accuracy in diagnostic perfor-mance of the minimum bounding cube based on the edgeof the lesion, we also found that the method is relatively sim-ple and easy to use, as it only needs to find the largest level ofthe three dimensions of the image through image processingsoftware. At this level, the minimum rectangle that can coverthe outermost edge of the lesion is used, and finally, the min-imum bounding cube containing the lesion is generated bythe computer traversal method. However, the 3D-ROI basedon the lesion itself needs to be delineated slice by slice andalong the edge. For nonenhancement sequence images,sometimes, the edge of the lesion is unclear, leading to thelack of local edge information of the lesion.
5. Conclusion
In summary, based on the segmentation method of the min-imum bounding cube at the edge of the lesion, postcontrastimages of DCE-MRI T1WI sequence were extracted, and aDL model was established. This model can combine theinformation inside the lesion and that of containing peritu-moral area to improve the diagnostic efficacy for bothbenign and malignant breast lesions. Using the DL approachwith a 3D attention mechanism based on ResNet50 to iden-tify benign and malignant BI-RADS 4 lesions was feasible.
6. Limitations of This Study
This study was a small-sample single-center study, and theresults obtained in this study need to be confirmed by futurelarge-sample multicenter investigations. Only mass lesionswere included in the study; thus, whether the segmentationmethod is equally applicable to nonmass lesions remains tobe tested. The inclusion/exclusion criteria are quite stringentand exclude many of the lesions which a radiologist readingbreast MRI will routinely come across. The study only usedfirst postcontrast images of DCE-MRI T1WI for segmenta-tion by the minimum bounding cube of the lesion, whichneeds to be examined to see if it fits other sequences of imagesegmentation. Another limitation is that this study onlycompared two lesion segmentation methods; thus, future
7Wireless Communications and Mobile Computing

investigation is needed to test whether other ROIs contain-ing peritumoral area may be better.
Data Availability
All data generated or analyzed during this study are availablefrom the corresponding author Wei Xing upon reasonablerequest.
Ethical Approval
The retrospective study was approved by the Ethical ReviewBoard of Nantong First People’s Hospital (No. 2020KY236)and was conducted according to the Declaration of Helsinkiprinciples.
Consent
All patients signed informed consent.
Conflicts of Interest
The authors declare that they have no conflict of interest.
Authors’ Contributions
All authors made a significant contribution to the workreported, whether that is in the conception, study design,execution, acquisition of data, analysis, and interpretationor in all these areas; took part in drafting, revising, or criti-cally reviewing the article; gave final approval of the versionto be published; have agreed on the journal to which the arti-cle has been submitted; and agree to be accountable for allaspects of the work. Meihong Sheng and Weixia Tang areco-first authors.
Acknowledgments
This project was funded by the Jiangsu Province Maternaland Child Health Research Project (F202037), the “SixOne” Research Funding Program for high-level health tal-ents in Jiangsu Province (LGY2018036 and LGY2020048 in2018 and 2020), and the Jiangsu Province Science and Tech-nology Project (BE2018646).
References
[1] H. Sung, J. Ferlay, R. L. Siegel et al., “Global cancer statistics2020: GLOBOCAN estimates of incidence and mortalityworldwide for 36 cancers in 185 countries,” CA: a Cancer Jour-nal for Clinicians, vol. 71, no. 3, pp. 209–249, 2021.
[2] P. D. P. Pharoah, B. Sewell, D. Fitzsimmons, H. S. Bennett, andN. Pashayan, “Cost effectiveness of the NHS breast screeningprogramme: life table model,” BMJ, vol. 346, p. f2618, 2013.
[3] B. Lauby-Secretan, C. Scoccianti, D. Loomis et al., “Breast-can-cer screening —viewpoint of the IARC working group,” TheNew England Journal of Medicine, vol. 372, no. 24, pp. 2353–2358, 2015.
[4] M. G. Marmot, D. G. Altman, D. A. Cameron, J. A. Dewar,S. G. Thompson, and M. Wilcox, “The benefits and harms of
breast cancer screening: an independent review,” Lancet,vol. 380, pp. 1778–1786, 2012.
[5] H. I. Greenwood, L. J. Wilmes, T. Kelil, and B. N. Joe, “Role ofbreast MRI in the evaluation and detection of DCIS: opportu-nities and challenges,” Journal of Magnetic Resonance Imaging,vol. 52, no. 3, pp. 697–709, 2020.
[6] E. A. Morris, C. E. Comstock, and C. H. Lee, ACR BI-RADSMagnetic Resonance Imaging, in: American College of Radiol-ogy, BI-RADS Committee, Editor. ACR BI-RADS Atlas: BreastImaging Reporting and Data System, American College ofRadiology, Reston, 5th edition, 2013.
[7] R. M. Strigel, E. S. Burnside, M. Elezaby et al., “Utility of BI-RADS assessment category 4 subdivisions for screening breastMRI,” AJR. American Journal of Roentgenology, vol. 2086,pp. 1392–1399, 2017.
[8] J. R. Maltez de Almeida, A. B. Gomes, T. P. Barros, P. E. Fahel,and M. de Seixas Rocha, “Subcategorization of suspiciousbreast lesions (BI-RADS category 4) according to MRI criteria:role of dynamic contrast-enhanced and diffusion-weightedimaging,” AJR. American Journal of Roentgenology, vol. 205,no. 1, pp. 222–231, 2015.
[9] N. Houssami, S. Ciatto, I. Ellis, and D. Ambrogetti, “Underes-timation of malignancy of breast core-needle biopsy: conceptsand precise overall and category-specific estimates,” Cancer,vol. 109, no. 3, pp. 487–495, 2007.
[10] K. Doi, “Computer-aided diagnosis in medical imaging: his-torical review, current status and future potential,” Computer-ized Medical Imaging and Graphics, vol. 31, no. 4-5, pp. 198–211, 2007.
[11] Y. Zhang, S. Wang, K. Xia, Y. Jiang, and P. Qian, “Alzheimer’sdisease multiclass diagnosis via multimodal neuroimagingembedding feature selection and fusion,” Information Fusion,vol. 66, pp. 170–183, 2021.
[12] Y. Zhang, Z. Zhou, H. Bai, W. Liu, and L. Wang, “Seizure clas-sification from EEG signals using an online selective transferTSK fuzzy classifier with joint distribution adaption and man-ifold regularization,” Frontiers in Neuroscience, vol. 14, p. 496,2020.
[13] Y. Zhang, F. Chung, and S. Wang, “Clustering by transmissionlearning from data density to label manifold with statisticaldiffusion,” Knowl Based Syst, vol. 193, p. 105330, 2020.
[14] A. Hosny, C. Parmar, J. Quackenbush, L. H. Schwartz, andH. J. W. L. Aerts, “Artificial intelligence in radiology,” NatureReviews. Cancer, vol. 18, no. 8, pp. 500–510, 2018.
[15] M. Khalili and R. J. Wong, “Underserved does not meanundeserved: unfurling the HCV care in the safety net,”Digestive Diseases and Sciences, vol. 63, no. 12, pp. 3250–3252, 2018.
[16] C. Vasile, A. L. Udriștoiu, A. E. Ghenea et al., “Intelligent diag-nosis of thyroid ultrasound imaging using an ensemble of deeplearning methods,” Medicina (Kaunas), vol. 57, no. 4, p. 395,2021.
[17] A. Krizhevsky, I. Sutskever, and G. E. Hinton, “Imagenet clas-sification with deep convolutional neural networks,” Advancesin Neural Information Processing Systems, vol. 25, pp. 1097–1105, 2012.
[18] S. Woo, J. Park, J. Y. Lee, and I. S. Kweon, “CBAM: convolu-tional block attention module,” European Conference on Com-puter Vision (ECCV), pp. 3–19, 2018.
[19] S. M. Anwar, M. Majid, A. Qayyum, M. Awais, M. Alnowami,and M. K. Khan, “Medical image analysis using convolutional
8 Wireless Communications and Mobile Computing

neural networks: a review,” Journal of Medical Systems, vol. 42,no. 11, p. 226, 2018.
[20] P. Herent, B. Schmauch, P. Jehanno et al., “Detection andcharacterization of MRI breast lesions using deep learning,”Diagnostic and Interventional Imaging, vol. 100, no. 4,pp. 219–225, 2019.
[21] K. Holli-Helenius, A. Salminen, I. Rinta-Kiikka et al., “MRItexture analysis in differentiating luminal A and luminal Bbreast cancer molecular subtypes - a feasibility study,” BMCMedical Imaging, vol. 17, no. 1, p. 69, 2017.
[22] C. Song, W. S. Zhu, S. Y. Shi et al., “Differentiation betweenbenign and malignant non-mass enhancement lesions usingvolumetric quantitative dynamic contrast-enhanced MRimaging,” Radiology Practice, vol. 35, no. 2, pp. 190–196, 2020.
[23] J. Zhou, Y. Zhang, K. T. Chang et al., “Diagnosis of benign andmalignant breast lesions on DCE-MRI by using radiomics anddeep learning with consideration of peritumor tissue,” Journalof Magnetic Resonance Imaging, vol. 51, no. 3, pp. 798–809,2020.
[24] Y. Kim, M. A. Stolarska, and H. G. Othmer, “The role of themicroenvironment in tumor growth and invasion,” Progressin Biophysics and Molecular Biology, vol. 106, no. 2, pp. 353–379, 2011.
[25] J. S. Wu, S. R. Sheng, X. H. Liang, and Y. L. Tang, “The role oftumor microenvironment in collective tumor cell invasion,”Future Oncology, vol. 13, no. 11, pp. 991–1002, 2017.
[26] N. M. Braman, M. Etesami, P. Prasanna et al., “Intratumoraland peritumoral radiomics for the pretreatment prediction ofpathological complete response to neoadjuvant chemotherapybased on breast DCE-MRI,” Breast Cancer Research, vol. 19,no. 1, p. 57, 2017.
[27] W. X. Tang, M. H. Sheng, S. C. Gong, H. T. Chen, J. B. Ge, andY. Zhu, “Diagnostic value of T2WI relative signal intensityratio combined with peritumoral edema in benign and malig-nant breast lesions,” Journal of Clinical Radiology, vol. 39,no. 12, pp. 2411–2414, 2020.
[28] M. H. Sheng, W. X. Tang, Y. H. Lu et al., “Value of early-phaseenhancement ratio combined with peripheral vascular diame-ter in the differential diagnosis of benign and malignant breastlesions under dynamic contrast enhanced MRI,” Chinese Jour-nal of Radiology, vol. 50, no. 5, pp. 324–328, 2016.
9Wireless Communications and Mobile Computing


![Constrained Convolutional Neural Networks for …vgg/rg/slides/ccnn1.pdf · Constrained Convolutional Neural Networks for Weakly Supervised Segmentation ... [CCNN] Convolutional Neural](https://img.dokumen.tips/doc/110x75/5baa6a3809d3f2c9618bd4b3/constrained-convolutional-neural-networks-for-vggrgslidesccnn1pdf-constrained.jpg)