Embed Size (px)
Citation preview
FEASIBILITY OF INCORPORATING ELECTROGASTROGRAPHY
INTO AN UNDERGRADUATE PHYSIOLOGY LABORATORY
CURRICULUM
by
Lauren Foropoulos
A thesis submitted to the faculty of The University of Mississippi in partial fulfillment of
the requirements of the Sally McDonnell Barksdale Honors College.
Oxford
May 2015
Reader: Dr. Debra Young

ii
© 2015
Lauren Anne Foropoulos
ALL RIGHTS RESERVED
iii
ABSTRACT
Lauren Foropoulos: Feasibility of Incorporating Electrogastrography into an
Undergraduate Physiology Laboratory Curriculum
(Under the direction of Carol Britson)
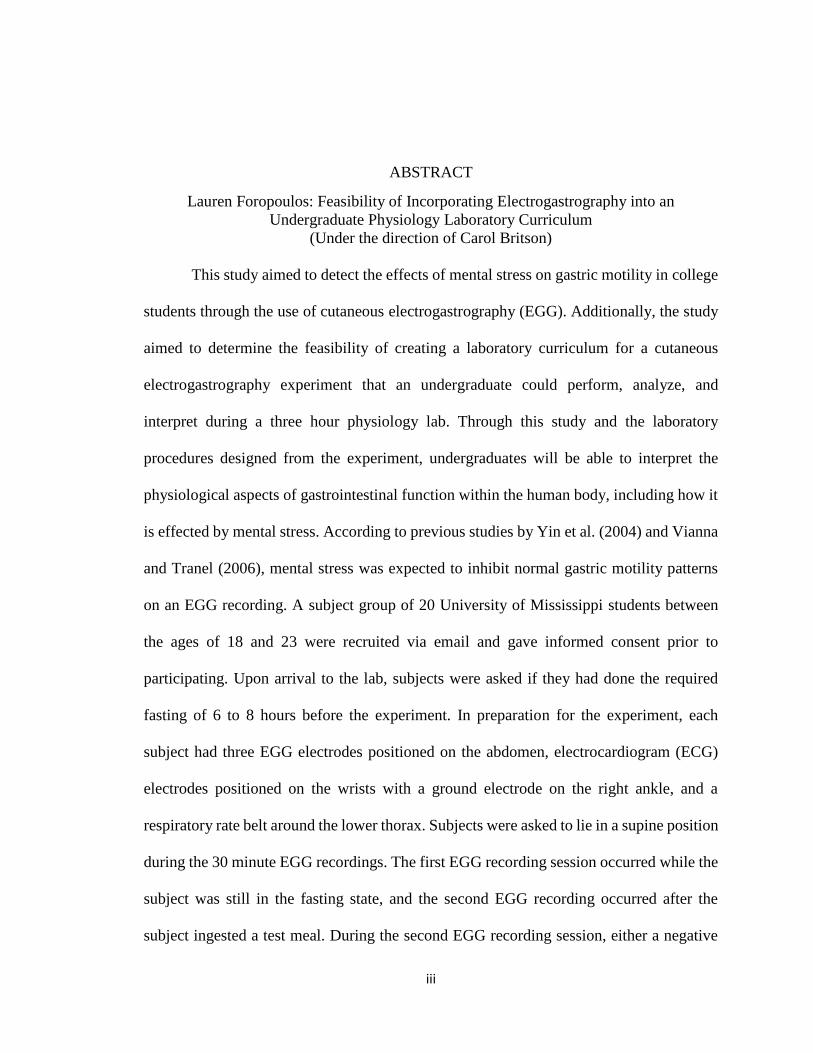
This study aimed to detect the effects of mental stress on gastric motility in college
students through the use of cutaneous electrogastrography (EGG). Additionally, the study
aimed to determine the feasibility of creating a laboratory curriculum for a cutaneous
electrogastrography experiment that an undergraduate could perform, analyze, and
interpret during a three hour physiology lab. Through this study and the laboratory
procedures designed from the experiment, undergraduates will be able to interpret the
physiological aspects of gastrointestinal function within the human body, including how it
is effected by mental stress. According to previous studies by Yin et al. (2004) and Vianna
and Tranel (2006), mental stress was expected to inhibit normal gastric motility patterns
on an EGG recording. A subject group of 20 University of Mississippi students between
the ages of 18 and 23 were recruited via email and gave informed consent prior to
participating. Upon arrival to the lab, subjects were asked if they had done the required
fasting of 6 to 8 hours before the experiment. In preparation for the experiment, each
subject had three EGG electrodes positioned on the abdomen, electrocardiogram (ECG)
electrodes positioned on the wrists with a ground electrode on the right ankle, and a
respiratory rate belt around the lower thorax. Subjects were asked to lie in a supine position
during the 30 minute EGG recordings. The first EGG recording session occurred while the
subject was still in the fasting state, and the second EGG recording occurred after the
subject ingested a test meal. During the second EGG recording session, either a negative
iv
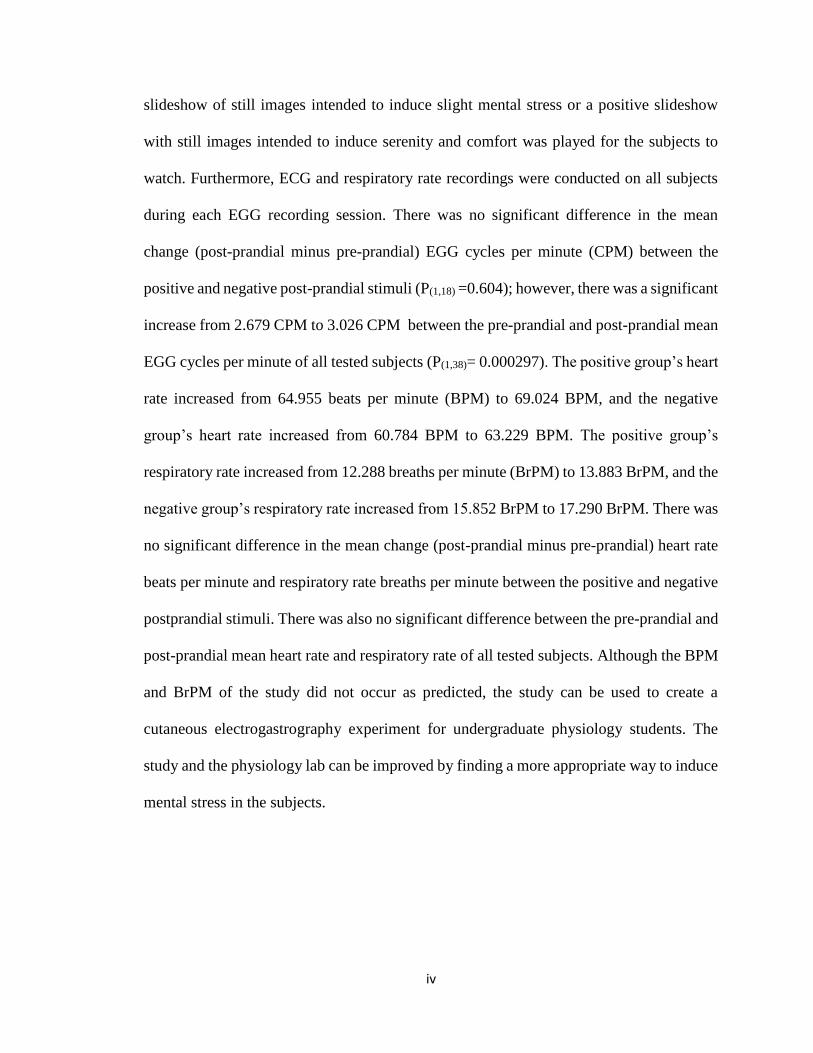
slideshow of still images intended to induce slight mental stress or a positive slideshow
with still images intended to induce serenity and comfort was played for the subjects to
watch. Furthermore, ECG and respiratory rate recordings were conducted on all subjects
during each EGG recording session. There was no significant difference in the mean
change (post-prandial minus pre-prandial) EGG cycles per minute (CPM) between the
positive and negative post-prandial stimuli (P(1,18) =0.604); however, there was a significant
increase from 2.679 CPM to 3.026 CPM between the pre-prandial and post-prandial mean
EGG cycles per minute of all tested subjects (P(1,38)= 0.000297). The positive group’s heart
rate increased from 64.955 beats per minute (BPM) to 69.024 BPM, and the negative
group’s heart rate increased from 60.784 BPM to 63.229 BPM. The positive group’s
respiratory rate increased from 12.288 breaths per minute (BrPM) to 13.883 BrPM, and the
negative group’s respiratory rate increased from 15.852 BrPM to 17.290 BrPM. There was
no significant difference in the mean change (post-prandial minus pre-prandial) heart rate
beats per minute and respiratory rate breaths per minute between the positive and negative
postprandial stimuli. There was also no significant difference between the pre-prandial and
post-prandial mean heart rate and respiratory rate of all tested subjects. Although the BPM
and BrPM of the study did not occur as predicted, the study can be used to create a
cutaneous electrogastrography experiment for undergraduate physiology students. The
study and the physiology lab can be improved by finding a more appropriate way to induce
mental stress in the subjects.
v
TABLE OF CONTENTS
LIST OF FIGURES……………………………………………………………………... vi
ACKNOWLEDGMENTS……………………………………………………………... viii
INTRODUCTION……………………………………………………………………….. 1
MATERIALS AND METHODS……………………………………………………....... 6
RESULTS………………………………………………………………………………. 17
DISCUSSION…………………………………………………………………………... 20
FIGURES……………………………………………………………………………….. 28
LIST OF REFERENCES……………………………………………………………….. 37

vi
LIST OF FIGURES
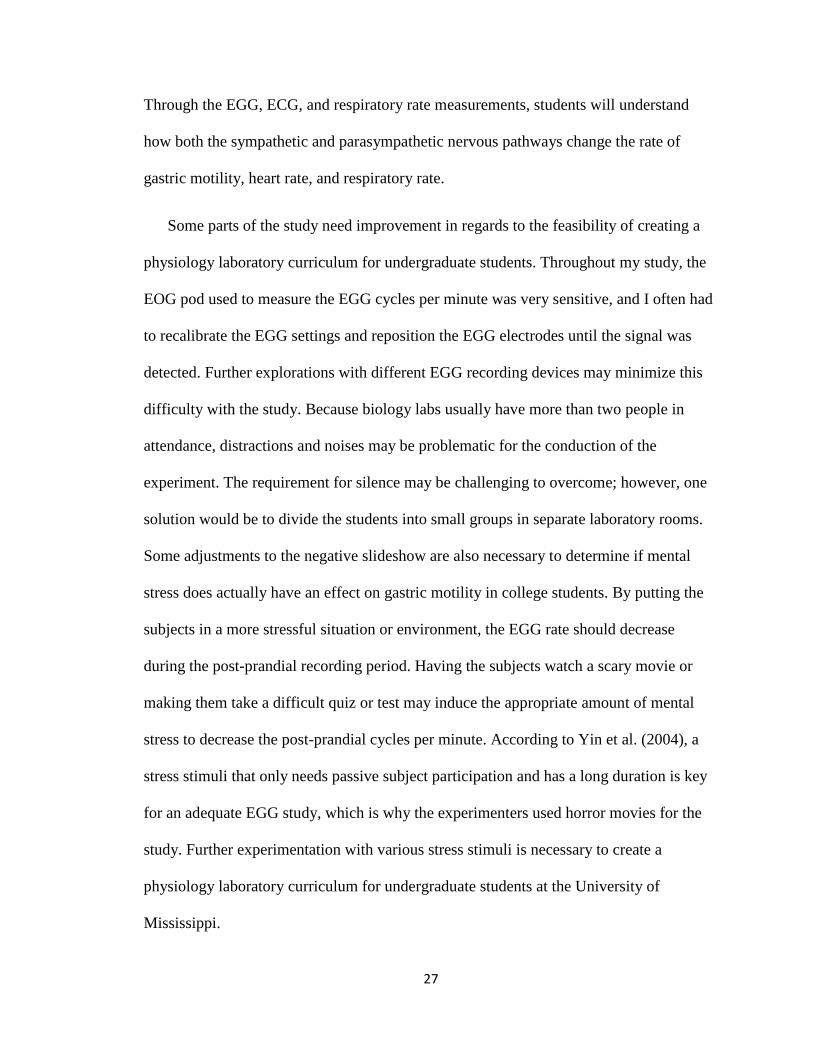
FIGURE 1: EGG electrode placement on the subject’s abdomen (modified from Stendel
(1997)). Electrode 1 was placed close to the ventral midpoint about halfway between the
xyphoid and umbilicus. Electrode 2 was placed about five centimeters away and at a 45
degree angle above and to the left of the first electrode. Electrode 3 was positioned on the
right side of the subject about ten to fifteen centimeters away and on the same plane as
the first electrode. ………………………………………………………………………. 28
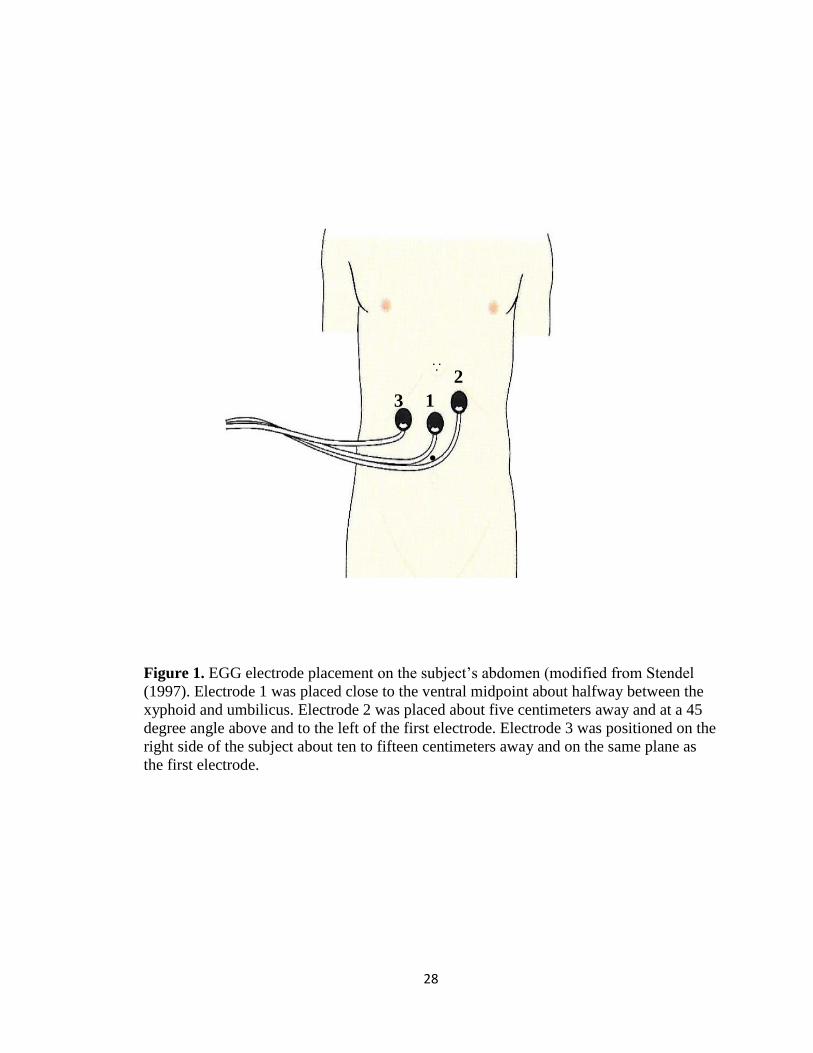
FIGURE 2: Examples of slides found in the negative slideshow intended to induce slight
mental stress in the experimental subjects group……………………………………….. 29
FIGURE 3: Examples of slides found in the positive slideshow intended to induce
happiness in the control subjects group………………………………………………… 30
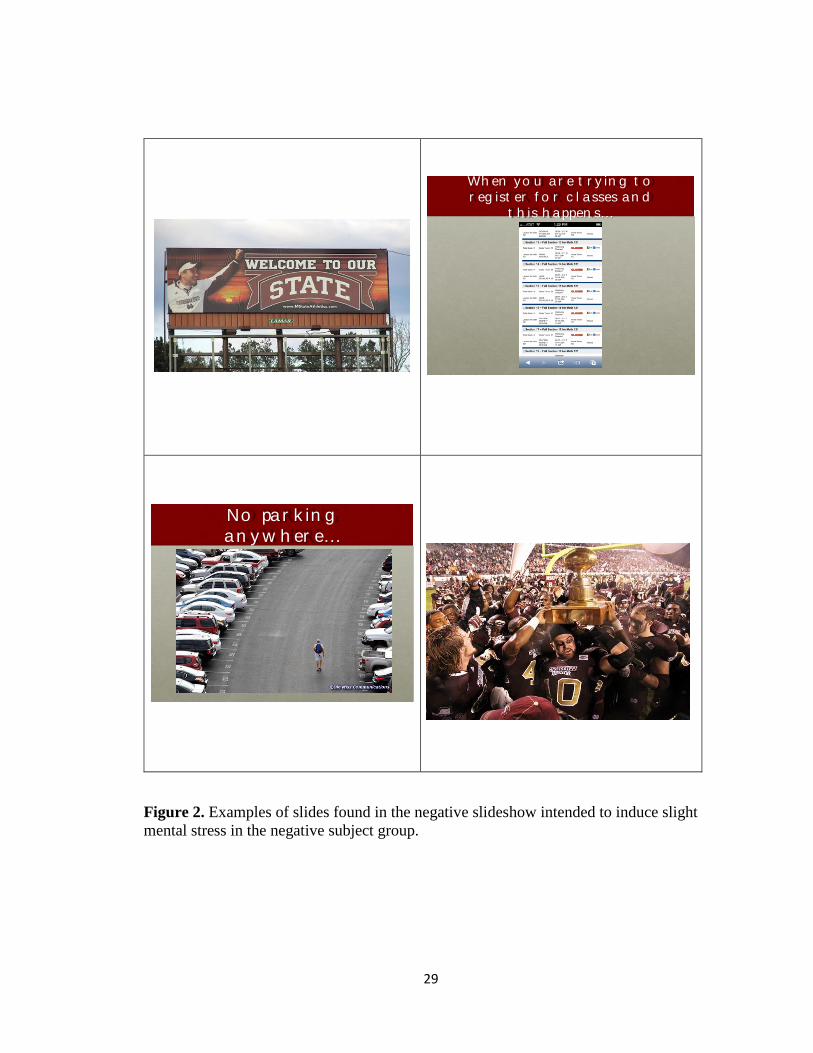
FIGURE 4: Mean change (pre-prandial minus post-prandial) EGG cycles per minute
(CPM) in subjects viewing positive or negative imagery after meal consumption (P(1,18)
=0.604) …..……………………………………………………………………………... 31
FIGURE 5: Difference between pre-prandial and post-prandial mean EGG cycles in per
minute (CPM) of all tested subjects (P(1,38)= 0.000297) ……...………………………... 32
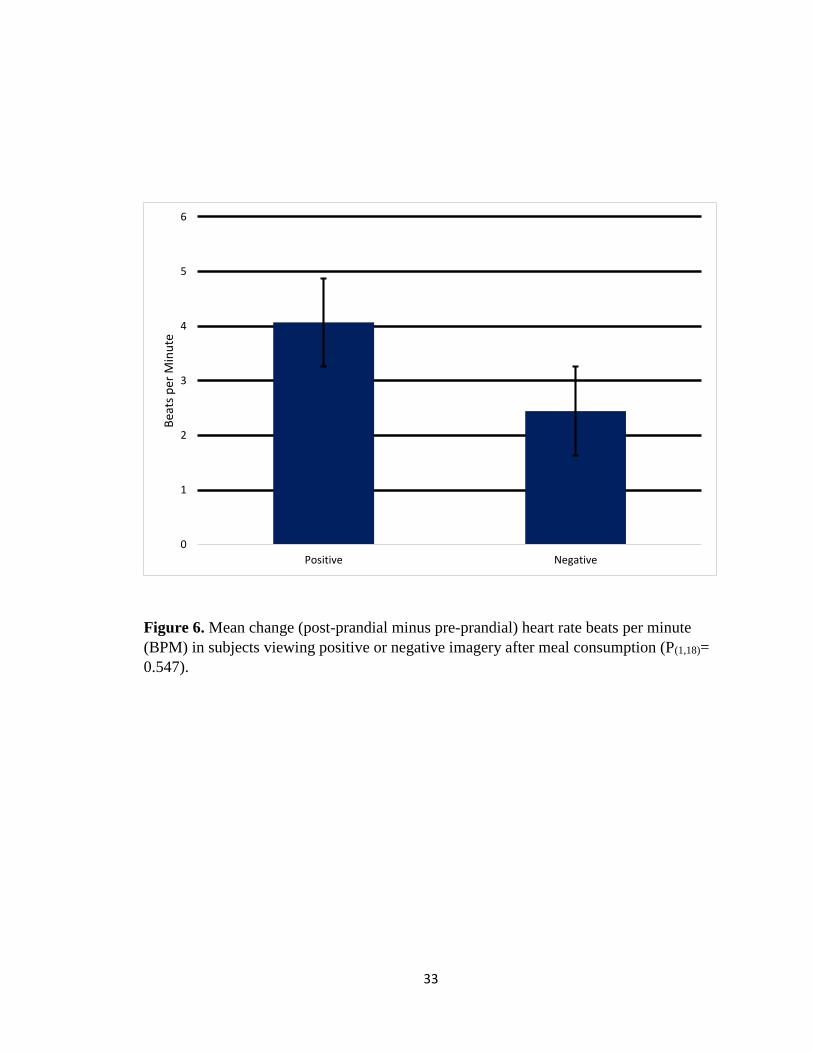
FIGURE 6: Mean change (pre-prandial minus post-prandial) heart rate beats per minute
(BPM) in subjects viewing positive or negative imagery after meal consumption (P(1,18)
=0.547) …………………………..………………………………………………...…… 33
vii
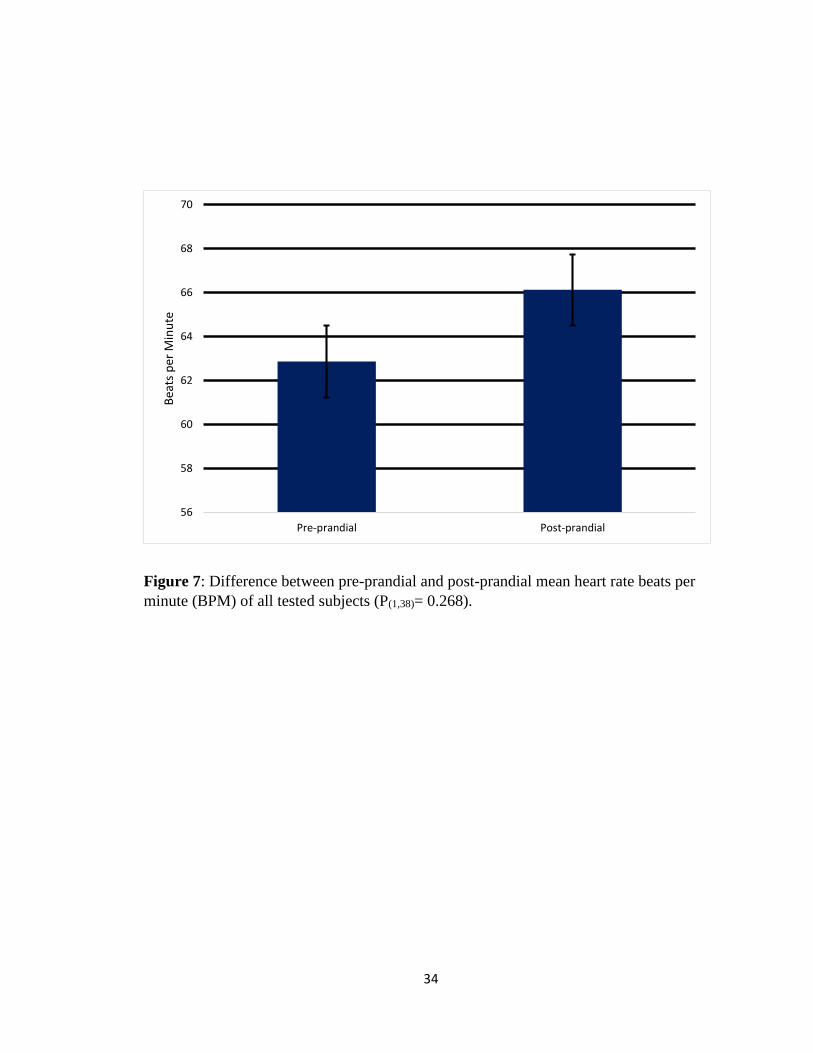
FIGURE 7: Difference between pre-prandial and post-prandial mean heart rate in beats
per minute (BPM) of all tested subjects (P(1,38)= 0.268) …………………...................... 34
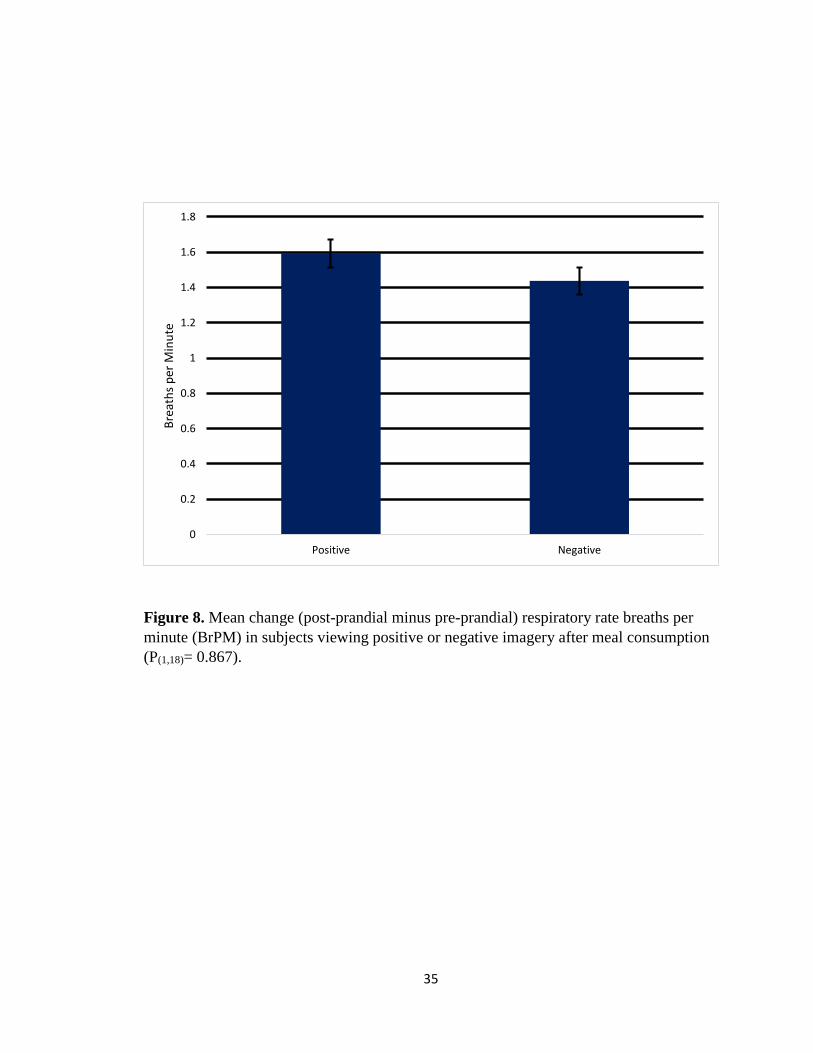
FIGURE 8: Mean change (pre-prandial minus post-prandial) respiratory rate breaths per
minute (BrPM) in subjects viewing positive or negative imagery after meal consumption
(P(1,18) = 0.867) .……………………………………………………..………………….. 35
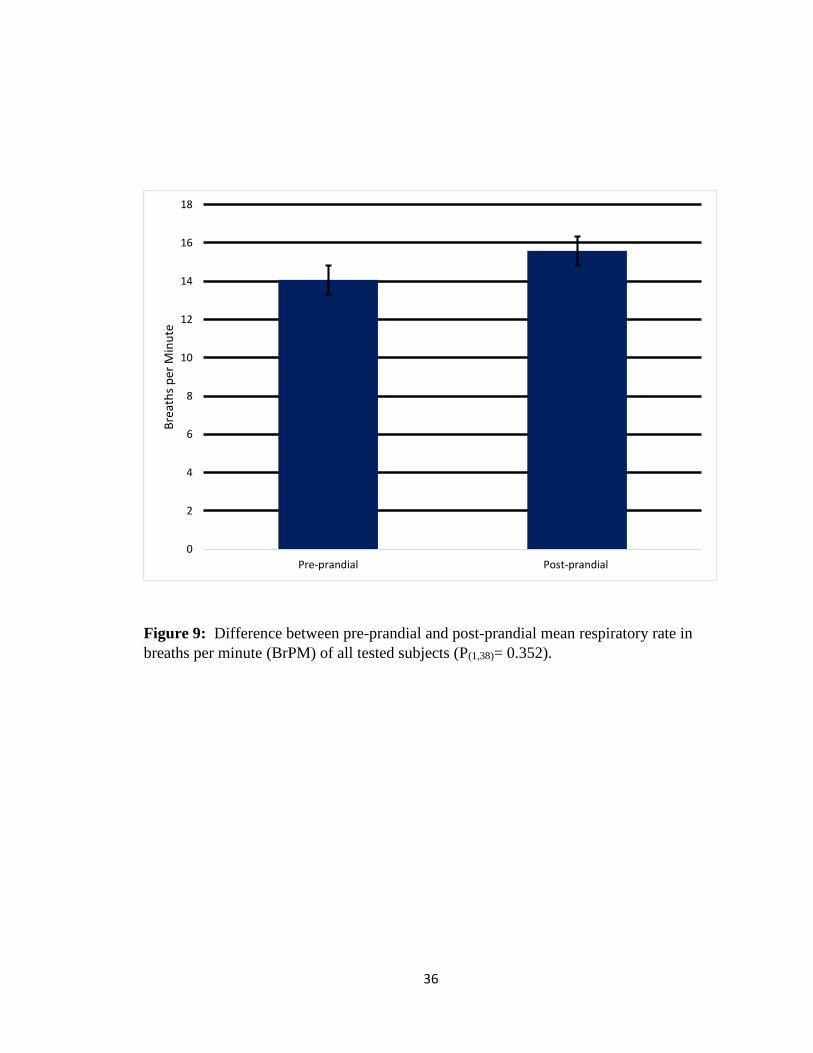
FIGURE 9: Difference between pre-prandial and post-prandial mean respiratory rate in
breaths per minute (BrPM) of all tested subjects (P(1,38)= 0.352) …...…………………. 36
viii
ACKNOWLEDEMENTS
I would like to thank Dr. Britson for her invaluable counsel and support given to
me over the last year and a half. When I was struggling to find a thesis advisor, she took
me under her wing and provided exemplary guidance. As a thesis advisor, she imparted
immeasurable knowledge to my research, experimentation, and revisions of my work. I
am extremely grateful for all the hard work and many hours she has dedicated to my
thesis. I would also like to thank my second reader, Dr. Richard Buchholz, and my third
reader, Dr. Debra Young, for their suggestions and comments. In addition, I wish to
thank all the Department of Biology professors and staff for their superior endeavors in
providing an excellent education and fostering support of my thesis.
Furthermore, my experience and education at the University of Mississippi has
been greatly enhanced through the Honors College. I would like to thank all the Honors
College professors for challenging me academically and assisting in my overall
educational growth. I am beyond blessed and grateful for the unending support and
enduring love of my parents, Jef and Terri Foropoulos. I would also like to extend my
gratitude to my friends for encouraging and supporting me throughout this process.
Lastly, I would like to thank Josh Shumaker for his unwavering faith in me and my
abilities.
1
INTRODUCTION
Mayer (2000) defines stress as acute threats to the homeostasis of an organism,
either physically or psychologically, that induces adaptive responses to maintain the
stable internal environment and guarantee the organism’s survival by altering its bodily
functions. When discussing how stress affects the human body, the focus should be on
the autonomic nervous system, which is the involuntary branch of the efferent division of
the peripheral nervous system that includes the parasympathetic and sympathetic
pathways (Sherwood, 2013). Because it prepares the body to fight against or escape a
bodily threat, the sympathetic nervous pathway dominates during times of “fight-or-
flight” by increasing the heart rate, constricting the blood vessels, decreasing the
digestive tract’s motility, dilating the bronchioles (airways of the lungs), and dilating the
pupils of the eye (Sherwood, 2013). The parasympathetic nervous pathway response,
known as the “rest-and-digest” response, is dominant during peaceful and relaxed
situations because it allows the body to concentrate on its normal maintenance activities
by decreasing the heart rate, dilating the blood vessels, increasing the digestive tract’s
motility, constricting the bronchioles, and constricting the pupils of the eye (Sherwood,
2013). When the human body experiences a stressful situation (even mentally stressful),
the sympathetic nervous pathway should be activated. As a result, the person’s heart rate
will increase, respiratory rate will increase, and gastric motility will decrease.
2
Gastric myoelectrical activity (GMA) is the self-generated recurrent rhythmic
electrical activity (slow-wave potentials) that paces the contractile activity of smooth
muscle in the stomach (Riezzo et al., 2013). GMA originates in the pacemaker area of the
stomach, which is lateral to the gastroesophageal junction (Vianna and Tranel, 2006) and
is found along the greater curvature in the main body of the stomach and extends toward
the pyloric antrum and pylorus (Riezzo et al., 2013). This idea of a pacemaker is
correlated to the highest frequency of slow waves produced in the body in regards to
other regions of the stomach, which permits a dominant pacemaker area (Riezzo et al.,
2013). The interstitial cells of Cajal (the pacemaker cells of the stomach) are found
throughout the layers of muscularis externa, which is the main smooth muscle coat of the
digestive tract wall (Sherwood, 2013). The pacemaker cells produce the slow-wave
potentials (GMA) that propagate via gap junctions to adjacent smooth muscle cells in the
stomach (Sherwood, 2013). The gastric slow-wave potentials are continuous and regulate
the rate and propagation of the stomach contractions (Vianna and Tranel, 2006). Driven
by the pacemaker region of the stomach, the electrogastric wave has a standard frequency
of 3 cycles per minute (CPM) (Stern et al., 2000). GMA is vital in the regulation of
gastric motility, which is defined as the involuntary peristaltic movements of the stomach
that assist in the digestion of food through the digestive system of the body (Yin et al.,
2004; Sherwood, 2013). Gastric motility can be measured through the use of non-
invasive cutaneous electrogastrography (EGG) (Riezzo et al, 2013). Electrogastrography
uses electrodes strategically placed on the surface of the abdomen to non-invasively
record gastric myoelectrical activity (Riezzo et al., 2013). EGG can provide extended and
repeated recordings of gastric myoelectrical activity similar to the recordings of the
3
electrical activity of the heart collected by an electrocardiogram (ECG).
Electrocardiography records the changes in the waves of electrical activity during each
heartbeat. Similarly, Nelsen and Kohatsu (1968) confirmed that the purpose of an EGG is
to record gastric slow wave activity or the action potentials of the stomach’s pacemaker,
and the EGG signals determine the frequency of stomach contractions. The EGG
recording device collects the electrical rhythmic contractions of the stomach as illustrated
in Figure 4.8 in Stendal’s guide (1997).
Few studies have investigated how mental stress effects gastric motility. Yin et al.
(2004) studied the inhibitory effects of stress on gastric myoelectrical activity after a
subject ingested a meal. The study recorded gastric myoelectrical activity using the non-
invasive technique of electrogastrography (EGG) while the subjects watched a horror
movie that induced stress or a guided mediation video that induced relaxation (Yin et al.,
2004). Normally, gastric myoelectrical activity produces 2-4 cycles per minute slow
waves of the EGG. Changes in EGG can be measured as the percentage of time in which
normal 2-4 cycles per minute slow waves existed during each 30-minute recording
session (Yin et al., 2004). According to Yin et al. (2004), ingestion of a meal produces an
increase in the percentage of normal 2-4 cycles per minute slow waves of the EGG;
however, the study found that the mental stress induced by the horror film prevented the
normal post-prandial responses due to the involvement of both the vagal
(parasympathetic) and sympathetic pathways. Vianna and Tranel (2006) investigated the
effects of emotionally prominent stimuli on gastric motility by measuring skin
conductance, heart rate, and electrogastrogram (EGG) while the subjects watched film
clips intended to induce a specific emotional response such as happiness, disgust, fear,
4
sadness, or no emotion. The study found that the no emotion condition had lower EGG
peak amplitudes than those produced during the disgust, happiness, sadness, and fear
states (Vianna and Tranel, 2006). I interpret these findings to provide evidence that a
change in the post-prandial gastric motility pattern will occur when subjects are viewing
emotional stimuli.
The aim of this study is to detect the effects of mental stress on gastric motility in
college students through the use of cutaneous electrogastrography (EGG). A second aim
of this research is to gather information about what an electrogastrogram can convey and
to allow the transfer of that information from research to education. By interpreting the
EGG information gained from my study, I will determine whether it is feasible to create a
laboratory curriculum for cutaneous electrogastrography that an undergraduate can do
and interpret in a three hour physiology lab. Conducting experiments in physiology lab
will enhance the students’ education in a way that lectures and papers are unable to do.
With laboratory experiments, students can get an interactive and more in-depth
understanding of the physiological aspects of the body including gastric motility of the
stomach, which is vital to the understanding of many gastrointestinal diseases.
In an effort to meet the aims of my study, I developed the following two
contradictory hypotheses. The null hypothesis: Mental stress will not have an effect on
gastric motility in college students by allowing the normal increase in the post-prandial
EGG cycles per minute. The alternative hypothesis: Mental stress will have an effect on
gastric motility in college students by preventing an increase in the post-prandial EGG
cycles per minute. I predict that if college students are subjected to a mentally stressful
stimulus, then the sympathetic nervous pathway will be dominant, which will cause a

5
decrease in the post-prandial EGG cycles per minute and an increase in the heart rate and
respiratory rate.
6
MATERIALS AND METHODS
Subjects
Twenty college students were recruited to participate in this study, including 10
females and 10 males. The specific group of college students recruited were between the
ages of 18 and 23 and had to have some upper level biology lab experience. All twenty
volunteers were Caucasian, in good health, and had no history of gastrointestinal disease.
Some gastrointestinal diseases that would have excluded a subject from the study include
chronic constipation, gastroesophageal reflux disease (GERD), gastroparesis, and gastric
dysmotility. Gastric dysmotility, for example, would eliminate a subject from the study
because it may be caused by disturbances in the gastric electrical rhythm and rate (Riezzo
et al., 2013). If a subject with gastric dysmotility participated in the experiment, a normal
pre-prandial baseline of 3 cycles per minute would not be established, and it would be
difficult to determine if mental stress effected the gastric motility or if the disease caused
the effect. I recruited the subjects to participate in the study via email. The experiment
was approved by the University of Mississippi Institutional Review Board (#15-021), and
all participants gave their consent. The subjects were not compensated in any way other
than the provided test meal that they were required to eat prior to post-prandial testing.
A few days prior to the experiment, I met with each participant to review the
experimental procedures and explain all the risks and benefits of the study. I obtained
written consent from each subject before he or she participated in the study. Several
7
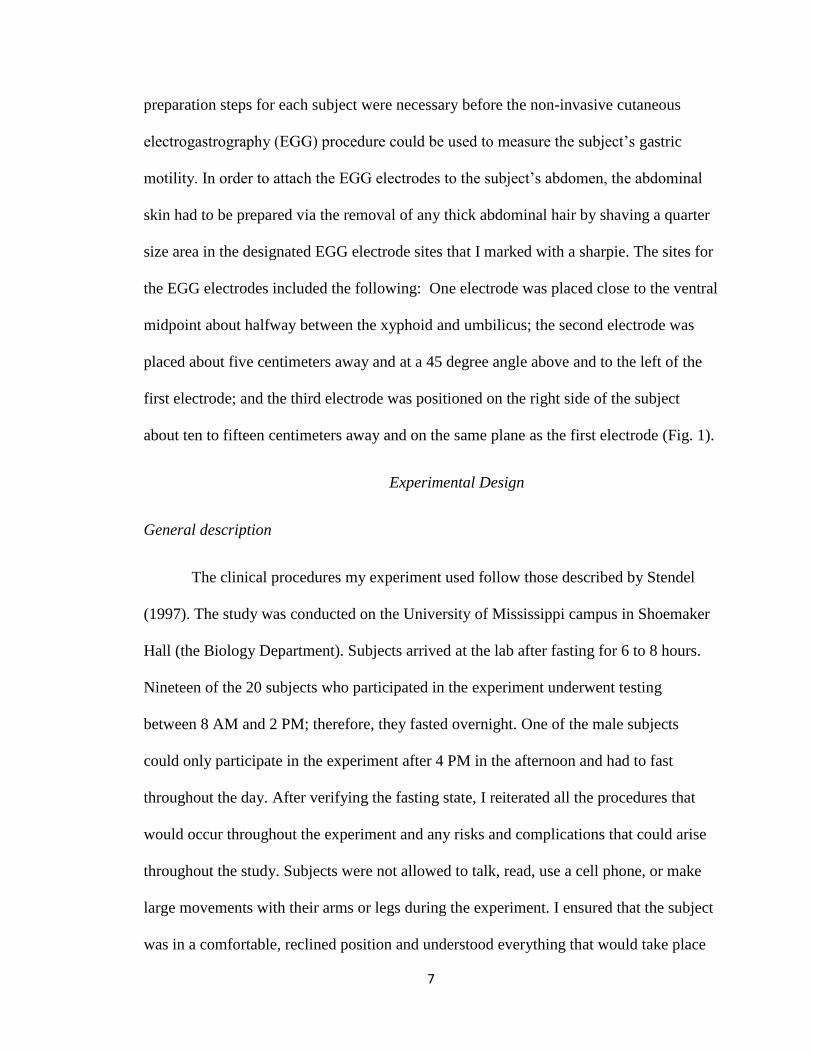
preparation steps for each subject were necessary before the non-invasive cutaneous
electrogastrography (EGG) procedure could be used to measure the subject’s gastric
motility. In order to attach the EGG electrodes to the subject’s abdomen, the abdominal
skin had to be prepared via the removal of any thick abdominal hair by shaving a quarter
size area in the designated EGG electrode sites that I marked with a sharpie. The sites for
the EGG electrodes included the following: One electrode was placed close to the ventral
midpoint about halfway between the xyphoid and umbilicus; the second electrode was
placed about five centimeters away and at a 45 degree angle above and to the left of the
first electrode; and the third electrode was positioned on the right side of the subject
about ten to fifteen centimeters away and on the same plane as the first electrode (Fig. 1).
Experimental Design
General description
The clinical procedures my experiment used follow those described by Stendel
(1997). The study was conducted on the University of Mississippi campus in Shoemaker
Hall (the Biology Department). Subjects arrived at the lab after fasting for 6 to 8 hours.
Nineteen of the 20 subjects who participated in the experiment underwent testing
between 8 AM and 2 PM; therefore, they fasted overnight. One of the male subjects
could only participate in the experiment after 4 PM in the afternoon and had to fast
throughout the day. After verifying the fasting state, I reiterated all the procedures that
would occur throughout the experiment and any risks and complications that could arise
throughout the study. Subjects were not allowed to talk, read, use a cell phone, or make
large movements with their arms or legs during the experiment. I ensured that the subject
was in a comfortable, reclined position and understood everything that would take place
8
during the study. The study consisted of two sessions (control and experimental) during a
two hour time period in the lab. After the recording equipment (description to follow)
was placed on the subject’s abdomen, pre-prandial testing occurred. The pre-prandial
(control) session was comprised of a 30-minute baseline recording while the subject was
in the fasting state. The subject then ingested a standardized test meal which consisted of
a six inch Subway® sandwich, a bag of potato chips, a bottle of water, and a cookie.
After the subject ingested the test meal, the subject underwent post-prandial testing. The
post-prandial (experimental) session was composed of a second 30-minute recording.
During the experimental session, the subject watched a slideshow composed of images
that were intended to induce slight mental stress (Fig. 2) or serenity and comfort (Fig. 3).
My study used still images played continuously in slideshow format to induce stress
rather than the film clips and movies of the previous studies, Vianna and Tranel (2006)
and Yin et al. (2004). After the study was completed, the subject was allowed to return to
his or her normal activities.
Equipment Description
A PowerLab 26T (LTS) electronic data acquisition system from ADInstruments
Inc. recorded the EGG, ECG, and respiratory rate data using LabChart software package
version 8.0.2.
I used a ML317 electrooculography (EOG) recorder connected to the PowerLab
system to record the EGG data. The three MLA2504 Shielded Lead Wires were
connected to the rear of the EOG pod according to the color-coded, positive, negative,
and ground leads, and the EOG pod was plugged into the Input 1 Pod Port on the front
panel of the PowerLab system. Each of the color-coded lead wires was attached to a
9
disposable adhesive electrode before being placed on the subject’s abdomen (Fig. 1). The
ML317 EOG pod was calibrated to 0 mV before the experiment began. If the signal read
above 4 mV or below -4 mV, the EGG data was not recorded. I had to carefully watch the
EGG data line to ensure that proper recording was taking place throughout the entire
experiment. The sensitivity range for the ML317 EOG pod is ±4 mV.
For the ECG equipment, I used a MLA2540 Five-lead Shielded Bio Amp Cable
and MLA2505 snap-connect Lead Wires. I plugged the Bio Amp cable into the Bio Amp
socket of the PowerLab system. Three MLA1010 disposable ECG adhesive electrodes
were attached to the three MLA2505 snap-connect Lead Wires, which were then attached
to the subject via the standard ECG equipment connection with the positive electrode
attached to the anterior side of the subject’s left wrist, the negative electrode attached to
the anterior side of the subject’s right wrist, and the ground electrode attached to the
medial side of the subject’s right ankle. The sensitivity range for the MLA2540 Five-lead
Shielded Bio Amp Cable is ±5 μV to ±100 mV full scale in 14 steps (combined
PowerLab and Bio Amp).
The respiratory rate for each subject was collected via the ADInstruments Inc.
Pneumo Trace MLT1132/D respiratory belt transducer (DIN). I connected the BNC plug
on the respiratory belt cable to the BNC connector for Input 2 on the front of the
PowerLab system. The respiratory belt was placed directly on the subject’s skin under his
or her shirt to allow for better data readings. While wearing gloves, I placed the
respiratory belt around the subject’s lower thorax (approximately in line with the
subject’s 7th rib). The transducer portion of the belt was placed on the anterior of the
subject’s body.
10
Response Variables
EGG
Only two of the 20 subjects who participated in the study were required to shave
their abdomen. Thick abdominal hair had to be shaved before the study began because it
reduces the conduction between the subject’s skin and the PowerLab recording equipment
(Riezzo, 2013). I wore gloves throughout the following steps when dealing with the
subject’s exposed abdomen. Before the study began, the abdominal skin was prepared by
abrading the skin with an abrasive pad (or pumice) and alcohol cleansing. The abrasive pad
was rubbed on the subject’s abdomen at the sites where the electrodes were to be placed
until the skin was pinkish in color. The rubbing of the skin and the alcohol cleansing
removed any dead skin cells that would interfere with the conduction between the skin and
the recording equipment. Skin preparation procedures, including use of an abrasive pad
and alcohol cleansing, have been empirically demonstrated to reduce the level of
electromagnetic interference in obtaining quality signals in electrographic measurements
(Melendez and Peno, 2012; Clochesy et al, 1991; Medina et al., 1989). Next, electrode
conductive cream was placed on the metal portion of each EGG electrode to allow for
better conduction between the subject’s skin and PowerLab recording equipment. The last
specific EGG preparation step was placing the EGG electrodes in their designated spots.
ECG
To prepare the subject for ECG data collection, the anterior side of each wrist was
abraded with an abrasive pad until the skin was a pinkish color. The skin was then cleansed
with a sterile alcohol wipe. The medial side of the subject’s right ankle was also abraded
11
with an abrasive pad and cleansed with a sterile alcohol wipe. A dot of electroconductive
cream was placed on the metal center of each ECG disposable electrode to allow for better
conduction between the subject’s skin and PowerLab equipment.
Respiratory Rate
To prepare the subject for respiratory rate measurement, the respiratory rate belt
was placed on the subject’s lower thorax region approximately on the 7th rib of the rib cage.
The respiratory rate belt transducer was placed on the anterior side of the subject directly
on the subject’s skin. The respiratory rate belt was secured where it would not slide off
during the experiment. I made sure that the belt was not too tight that it would inhibit the
subject’s normal breathing rate and make the subject uncomfortable.
Testing Procedure
Before a study session began, I checked the PowerLab equipment to make sure it
was all connected correctly and all working properly. Another important part of the testing
procedure was checking that the subject was comfortable. If the subject was uncomfortable,
he or she would fidget throughout the data recording sessions and cause inaccurate data
collections. Because the experiment requires the subject to lie still in a reclined position
for two 30-minute recording sessions, a large cot with a pillow was provided to make the
subject as comfortable as possible. The cot was long enough and sturdy enough to endure
the weight of all 20 subjects during the study. I also placed the cords of the ECG electrodes
so that they did not interfere with the subject’s minor arm movements (description to
follow) and cause discomfort.
12
Once the subject was in a comfortable, reclined position, pre-prandial testing
occurred for 30 minutes while the subject was in the fasting state. EGG, ECG, and
respiratory rate recordings were made throughout the entire 30-minute session. During pre-
prandial testing, the subject was not allowed to talk, read, use a cell phone, or make
significant musculoskeletal movements (i.e., sitting upright, standing upright, or lifting the
legs above the waist). Movements to maintain comfort were allowed. Each subject also had
the option of completing a crossword puzzle provided by the experimenter during the 30
minute time period (18 of the 20 subjects completed the puzzle), and movements for this
were allowed (i.e., turning the head from one side to the other, forearm movements to circle
words in the puzzle book, holding the puzzle book in front of the face, hand movements to
flip the pages, etc.).
Immediately after pre-prandial testing, the subject ingested a standardized test
meal. The test meal consisted of a six inch Subway® sandwich of the subject’s choice, a
bag of potato chips, a bottle of water, and either a Chip’s Ahoy® or Oreo® cookie. Because
each subject was allowed to choose the type of sandwich they consumed, the nutritional
value of the test meal varied. Each Subway® sandwich consisted of 18 to 38 grams of
protein, 280 to 570 calories, and 3.5 to 28 grams of fat. Each subject was allowed to pick
a bag of chips from a Frito-Lay® Flavor Mix Variety Pack that included the following
chips: Lays® sour cream and onion, Lays® barbeque, Cheetos®, nacho cheese Doritos®,
cool ranch Doritos®, and chili cheese Fritos®. Each bag of chips was 28.35 grams. The
bags of chips were 160 calories or less and contained about 2 grams of protein. The water
bottles contained approximately 591 milliliters of water and had 0 calories and 0 grams of
protein. The subject could also have one cookie if they desired. The Chip’s Ahoy® cookie
13
contained about 54 calories, 2.667 grams of fat, and 0.667 grams of protein. The Oreo®
cookie contained 54 calories, 2.333 grams of fat, and 0.667 grams of protein. The subject
was only required to eat until satiation and did not have to finish the entire test meal. The
meal consumption portion of the experiment lasted from 15 to 20 minutes. The subject was
unhooked from the equipment to give them a break from lying down. The subject could
stand, sit, or move around as he or she pleased. The subjects were allowed to use the
restroom if necessary.
Post-prandial testing occurred for 30 minutes after the subject ingested the test
meal. EGG, ECG, and respiratory rate recordings were made throughout the entire
recording session. During post-prandial testing, the subject watched a slideshow composed
of either negative images intended to induce slight mental stress or positive images
intended to induce serenity and comfort. Both slideshows are composed of still images
played in a 17 minute continuous loop and were shown twice during post-prandial
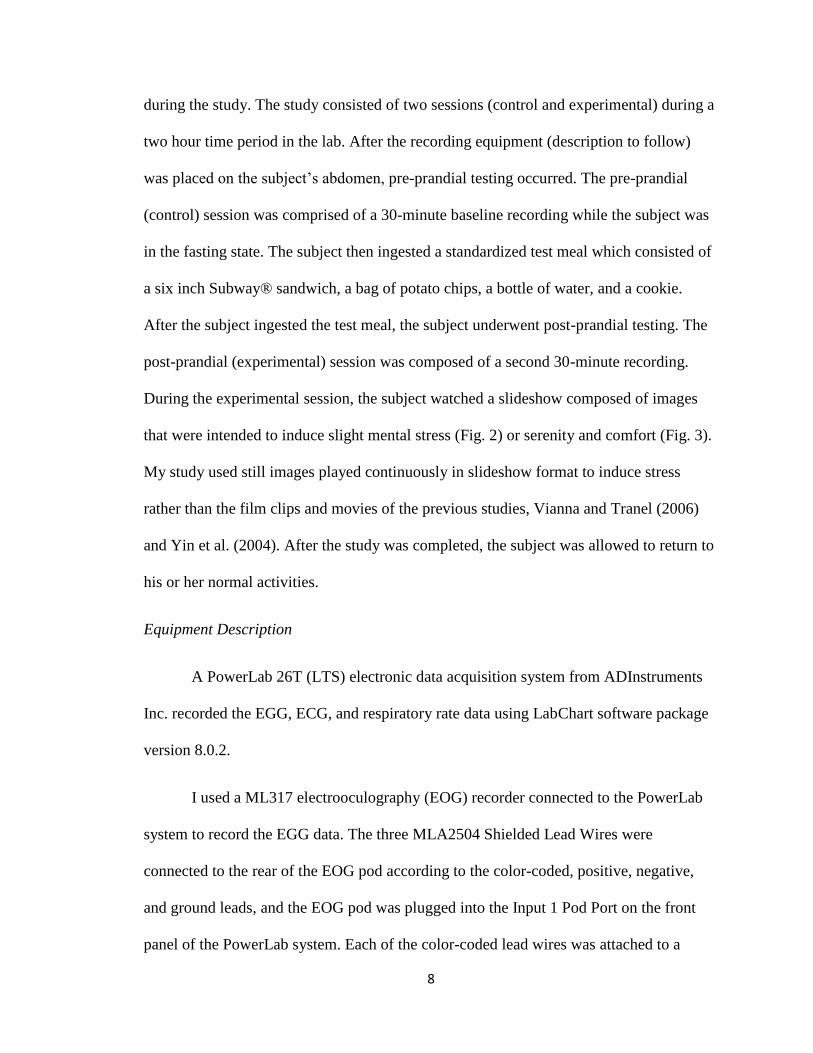
recording. The negative slideshow is composed of images of daily life at the University of
Mississippi that may cause slight mental stress for students. These images include the
University of Mississippi football team losing games and the Egg Bowl, the battle
surrounding the University’s mascot, jokes about the education students receive at the
University, and the University’s commuter parking problems. Because creating a negative
slideshow catered to each individual subject’s ideas of stress would be impossible to
implement in a 3-hour physiology laboratory curriculum, we decided to create a negative
slideshow that we believed would induce mental stress in the general student population at
the University of Mississippi. Our definition of stress that we utilized in the study was
fairly broad in order to ensure that the general population of college students we recruited
14
would be effected by the negative slideshow. With this definition, we wanted stress to be
induced in the mental capacity, and this could be done in a number of ways from anger to
frustration. We wanted our slideshow to focus on issues at the University of Mississippi
rather than an infinite number of stressful stimuli in the world today. In addition, our
slideshow had to be fairly innocuous in order for it to be approved by the University of
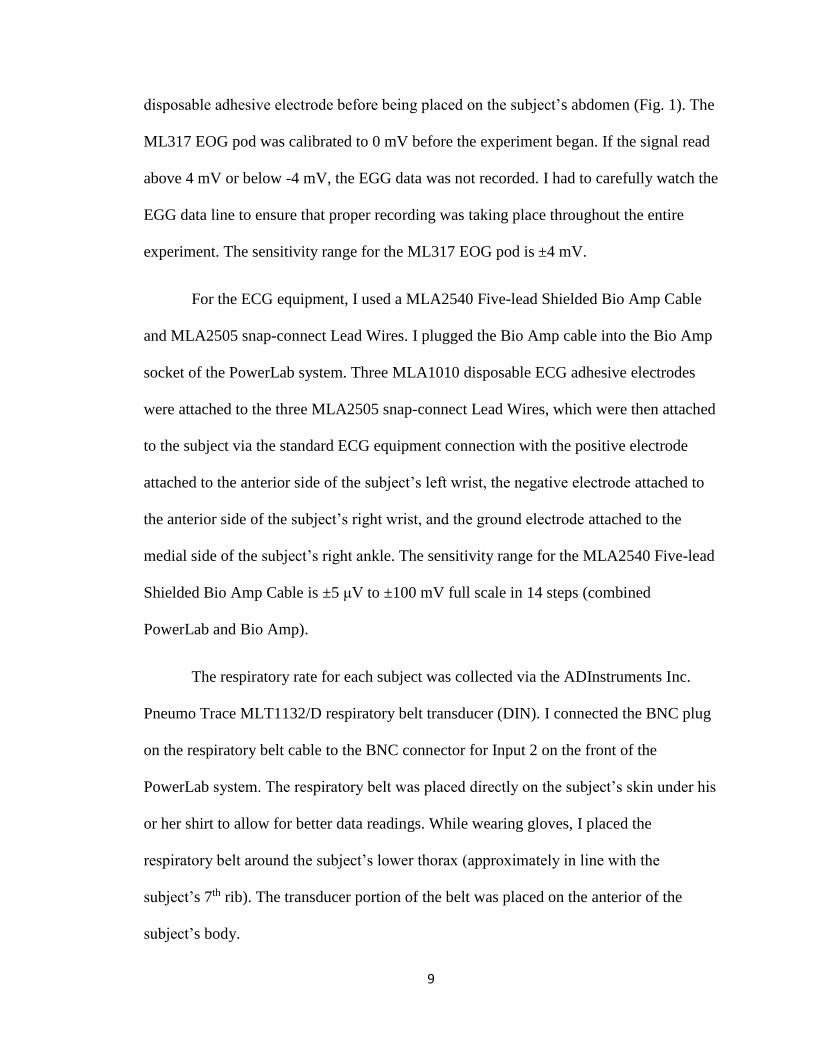
Mississippi’s Institutional Review Board. The positive slideshow is composed of images
that induce serenity and comfort in students at the University of Mississippi such as
graduation, the University of Mississippi baseball team going to Omaha, Double Decker
weekend, the beautiful campus, and the University of Mississippi football team winning
games. The subjects were randomly assigned into negative and positive slideshow groups
by flipping a coin. If the coin landed on heads, the subject watched the positive slideshow,
and if the coin landed on tails, the subject watched the negative slideshow. To ensure that
there were 10 subjects randomly assigned to each group, the flipping of the coin occurred
after all 20 subjects had agreed to participate in the study.
Analyses
LabChart version 8.0.2 and the Cyclic Measurements window of the software were
used to analyze the data collected during all 20 testing periods. The rates per each
experimental minute were calculated by using the Multiple Add to Data Pad tool on the
LabChart software tool bar. The rates were found using time. I selected 1.0 minute for
every 1.0 minute for the whole file. This step of the analysis created a readable data pad
that could be copied into an Excel file.
Yin et al. (2004) measured the percentage of normal 2-4 cycles per minute (CPM)
slow waves of the EGG, which refers to the amount of time in which normal 2-4 CPM
15
slow waves existed during each 30-minute recording session. This differs from the mean
cycles per minute (CPM) of my study where I used the mean pre- and post-prandial
cycles per minute of each individual subject and then the average pre- and post-prandial
means of the positive subject group and the negative subject group. Vianna and Tranel
(2006) measured the EGG peak amplitudes; however, we did not use amplitude for
measuring the EGG signals because it is challenging to reliably measure due to minute-
to-minute variability. Therefore, it would not be feasible to create an experiment for
undergraduate physiology students in which EGG cycles per minute was measured in
amplitude.
Description of EGG, ECG, and respiratory rate data
In Excel, I utilized the Descriptive Statistics under Data Analysis to find both the
pre-prandial and post-prandial means, minimums, and maximums for the EGG rate in
cycles per minute. These data were compiled into an Excel sheet that separated the
subjects by the type of treatment they received during the study. The subjects who
watched the positive slideshow were grouped together in the positive group, and those
that watched the negative slideshow were the negative group. I then calculated the
average pre-prandial mean and the average post-prandial mean for the positive group of
subjects. I also found the pre-prandial minimum, pre-prandial maximum, post-prandial
minimum, and post-prandial maximum of all the subjects in the positive group. I did the
same analysis for the negative group of subjects.
The change in the mean EGG cycles per minute was calculated by subtracting the
pre-prandial mean from the post-prandial mean. The change in the mean was calculated for
each subject in both the positive and negative groups. This data was used for the statistical
16
analysis. The same procedures were used to find the pre-prandial and post-prandial means,
minimums, and maximums for the heart rate (ECG) in beats per minute and the respiratory
rate in breaths per minute.
Statistical analysis
The change in mean (post-prandial minus pre-prandial) EGG cycles per minute
(CPM) for each subject was compiled into a table on Excel for statistical analysis. A single
factor Analysis of Variance (ANOVA) was used to test the hypotheses with a significance
level P ≤ 0.05 for all tests. The same steps were used for the statistical analysis of the heart
rate and respiratory rate data. An additional single factor ANOVA was used to analyze the
difference between the pre-prandial and post-prandial mean data of all tested subjects for
each response variable. The same significance level P ≤ 0.05 was used for all tests.
17
RESULTS
EGG (CPM)
The positive group’s average pre-prandial mean for the EGG rate was 2.654
cycles per minute (CPM) with a minimum and maximum of 0.300 CPM and 4.006 CPM,
respectively. The negative group’s average pre-prandial mean for the EGG rate was 2.705
CPM with a minimum and maximum of 0.760 CPM and 5.076 CPM, respectively. The
positive group’s average post-prandial mean for the EGG rate was 2.958 CPM with a
minimum and maximum of 1.078 CPM and 4.584 CPM, respectively. The negative
group’s average post-prandial mean for the EGG rate was 3.095 CPM with a minimum
and maximum of 1.194 CPM and 4.744 CPM, respectively.
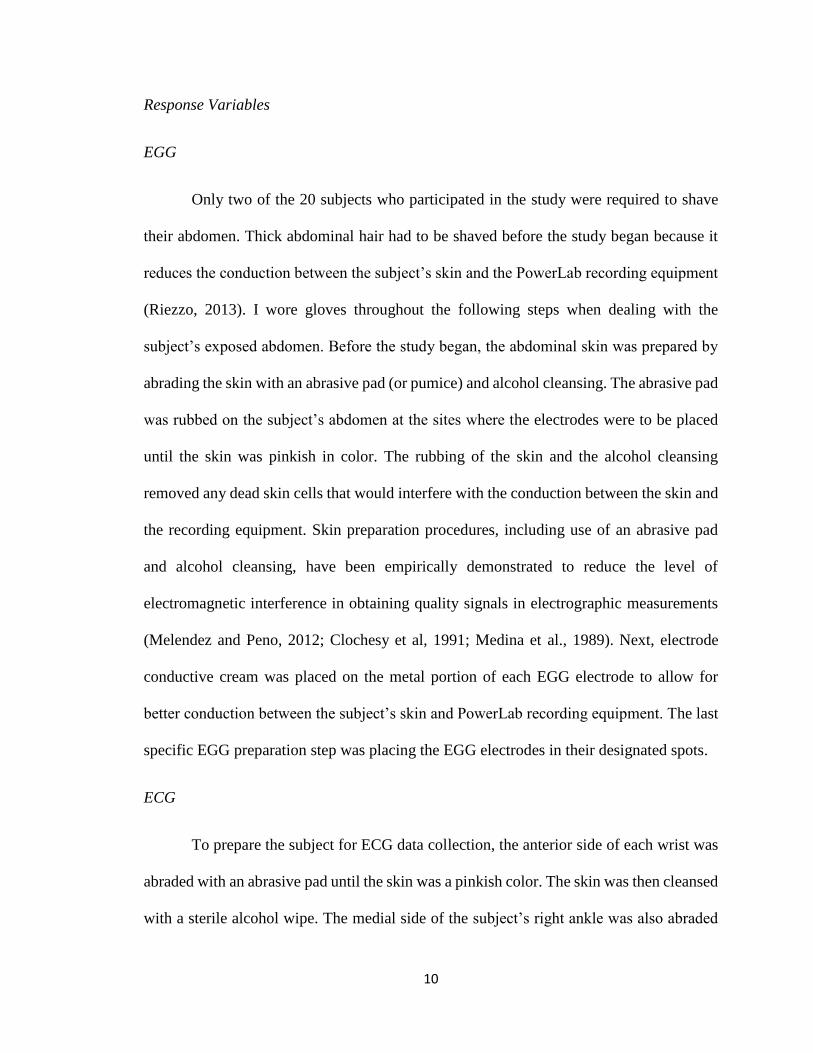
Through statistical analysis with ANOVA, it was determined that there was no
significant difference in the change in EGG cycles per minute between subjects viewing
the positive or negative visual stimuli (P(1,18) = 0.604) (Fig. 4). However, there was a
significant difference between the pre-prandial and post-prandial mean EGG cycles per
minute of all tested subjects (P(1,38)= 0.000297) (Fig. 5).
ECG (BPM)
The positive group’s average pre-prandial mean for the heart rate was 64.955
beats per minute (BPM) with a minimum and maximum of 52.165 BPM and 92.341
BPM, respectively. The negative group’s average pre-prandial mean for the heart rate
18
was 60.784 BPM with a minimum and maximum of 48.316 BPM and 81.571 BPM,
respectively. The positive group’s average post-prandial mean for the heart rate was
69.024 BPM with a minimum and maximum of 49.667 BPM and 101.845 BPM,
respectively. The negative group’s average post-prandial mean for the heart rate was
63.229 BPM with a minimum and maximum of 28.335 BPM and 88.304 BPM,
respectively.
Using ANOVA, it was determined that there was no significant difference in the
change in heart rate beats per minute between subjects viewing the positive or negative
visual stimuli (P(1,18) = 0.547) (Fig. 6). There was also no significant difference between
the pre-prandial and post-prandial mean heart rate beats per minute of all tested subjects
(P(1,38)= 0.268) (Fig. 7).
Respiratory Rate (BrPM)
The positive group’s average pre-prandial mean for the respiratory rate was
12.288 breaths per minute (BrPM) with a minimum and maximum of 0.384 BrPM and
21.131 BrPM, respectively. The negative group’s average pre-prandial mean for the
respiratory rate was 15.852 BrPM with a minimum and maximum of 0.652 BrPM and
24.749 BrPM, respectively. The positive group’s average post-prandial mean for the
respiratory rate was 13.883 BrPM with a minimum and maximum of 0.399 BrPM and
23.143 BrPM, respectively. The negative group’s average post-prandial mean for the
respiratory rate was 17.290 BrPM with a minimum and maximum of 10.611 BrPM and
25.980 BrPM, respectively.
19
By using ANOVA, it was determined that there was no significant difference in
the change in respiratory rate breaths per minute between subjects viewing the positive or
negative visual stimuli (P(1,18) = 0.867) (Fig. 8). There was also no significant difference
between the pre-prandial and post-prandial mean respiratory rate breaths per minute of all
tested subjects (P(1,38)= 0. 0.352) (Fig. 9).
20
DISCUSSION
According to the studies conducted by Yin et al. (2004) and Vianna and Tranel
(2006), the negative group’s post-prandial average mean cycles per minute (EGG rate)
should have decreased because mental or emotional stress should prevent the normal
post-prandial response of an increase in cycles per minute. However, there was no
significant difference in the mean change (post-prandial minus pre-prandial) EGG cycles
per minute between the positive and negative post-prandial stimuli.
Yin et al. (2004) found that the ingestion of a meal should increase the natural EGG
rhythm rate of 3 cycles per minute to a higher EGG rate. For subjects in the positive post-
prandial stimuli group, the post-prandial cycles per minute (CPM) should increase due to
the activation of the parasympathetic pathway of the autonomic nervous system resulting
in a normal post-prandial gastric motility rate (Sherwood, 2013). The positive slideshow
shown to the positive group was intended to elicit serenity and comfort in the subjects.
With the parasympathetic nervous pathway activated, the subjects’ gastric motility
increased from the pre-prandial recording period to the post-prandial recording period.
The increase in the gastric motility was demonstrated through the increase in the cycles
per minute recorded by the cutaneous EGG electrodes. Further statistical analysis of the
EGG data validates this conclusion. By using single factor Analysis of Variance
(ANOVA), it was determined there was a significant difference between the pre-prandial
and post-prandial mean EGG cycles per minute of all tested subjects. The EGG cycles
21
per minute increased from the pre-prandial recording to the post-prandial recording as a
result of the activation of the parasympathetic nervous pathway which stimulated
digestion of the meal.
The subjects in the negative post-prandial stimuli group should have had a
decrease in the post-prandial cycles per minute (CPM) due to the activation of the
sympathetic pathway of the autonomic nervous system (Sherwood, 2013). The negative
slideshow shown to the negative group was intended to elicit slight mental stress in the
subjects. However, the negative slideshow did not cause the normal sympathetic response
of decreased gastric motility in the negative group as illustrated by the results of my
study. The cutaneous EGG electrodes recorded an increase in gastric motility during the
post-prandial recording session, illustrating that the parasympathetic nervous pathway
was active during my study. As a result, the null hypothesis stating that mental stress will
not have an effect on gastric motility in college students by allowing the normal increase
in post-prandial EGG cycles per minute was accepted, and the alternative hypothesis was
rejected.
Subject movements especially during the post-prandial recording period did have
an effect on the EGG cycles per minute. It is a difficult task for a person to lie still for
two 30-minute time periods, and as a result, many of the subjects were fidgety while they
viewed the slideshow during the post-prandial period. Even though subjects were
permitted to make slight movements, many of them did make larger movements, such as
crossing the legs and raising the arms above the head. When the subjects made large
movements, the electrooculography (EOG) recorder had difficulty distinguishing
between gastric motility and other muscle movements. Reliably measuring the EGG
22
amplitude like Vianna and Tranel (2006) would be challenging due to these large
movements, and as a result, we decided to measure the EGG in cycles per minute to
reduce measurement errors. Noise in the testing room or hallway also caused the subjects
to make large movements and effected the EGG because the noises either scared the
subject or interested him or her. Since distractions cause movement and the cutaneous
EGG electrodes detect extracutaneous electrical signals due to movement, EGG
recordings must be conducted in a quiet room; however, no reliable method to reduce or
abolish movements has been discovered (Riezzo et al., 2013). Another difficulty with the
subjects was keeping them entertained with the slideshow because many of them found it
boring after the first loop was played. I hypothesize that if the subjects were feeling bored
instead of stressed this would affect the EGG results of the negative subject group by
allowing the normal post-prandial increase in EGG cycles per minute.
Vianna and Tranel (2006) measured skin conductance response (SCR) and heart rate
as a way to have a point of comparison for the EGG measurements because both SCR
and heart rate are dependable and reputable measures of the activation of the sympathetic
and parasympathetic pathways during emotional conditions (Akselrod et al., 1981; Burch
and Greiner, 1960; Edelberg, 1972; Gunn et al., 1972). Vianna and Tranel (2006) found
that the emotional film clips used in the study caused an increase in skin conductance and
a decrease in the parasympathetic activity (high frequency band of the ECG spectrum)
compared to the neutral film clips. Therefore, the sympathetic nervous pathway was
dominant over the parasympathetic pathway while subjects viewed the emotional film
clips (Vianna Tranel, 2006). Yin et al. (2004) measured heart rate variability along with
electrogastrography to investigate the activity of the vagus nerve, which is part of the
23
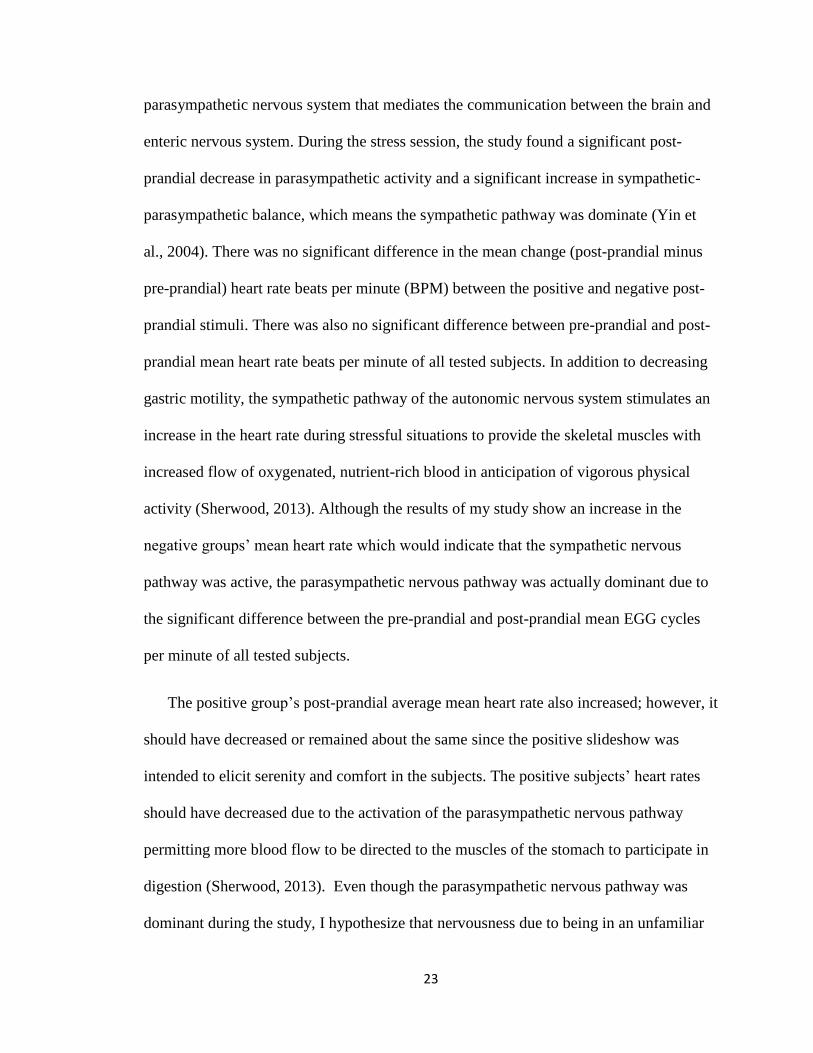
parasympathetic nervous system that mediates the communication between the brain and
enteric nervous system. During the stress session, the study found a significant post-
prandial decrease in parasympathetic activity and a significant increase in sympathetic-
parasympathetic balance, which means the sympathetic pathway was dominate (Yin et
al., 2004). There was no significant difference in the mean change (post-prandial minus
pre-prandial) heart rate beats per minute (BPM) between the positive and negative post-
prandial stimuli. There was also no significant difference between pre-prandial and post-
prandial mean heart rate beats per minute of all tested subjects. In addition to decreasing
gastric motility, the sympathetic pathway of the autonomic nervous system stimulates an
increase in the heart rate during stressful situations to provide the skeletal muscles with
increased flow of oxygenated, nutrient-rich blood in anticipation of vigorous physical
activity (Sherwood, 2013). Although the results of my study show an increase in the
negative groups’ mean heart rate which would indicate that the sympathetic nervous
pathway was active, the parasympathetic nervous pathway was actually dominant due to
the significant difference between the pre-prandial and post-prandial mean EGG cycles
per minute of all tested subjects.
The positive group’s post-prandial average mean heart rate also increased; however, it
should have decreased or remained about the same since the positive slideshow was
intended to elicit serenity and comfort in the subjects. The positive subjects’ heart rates
should have decreased due to the activation of the parasympathetic nervous pathway
permitting more blood flow to be directed to the muscles of the stomach to participate in
digestion (Sherwood, 2013). Even though the parasympathetic nervous pathway was
dominant during the study, I hypothesize that nervousness due to being in an unfamiliar
24
setting, such as the lab, will counter this change in heart rate of college students during
the experiment.
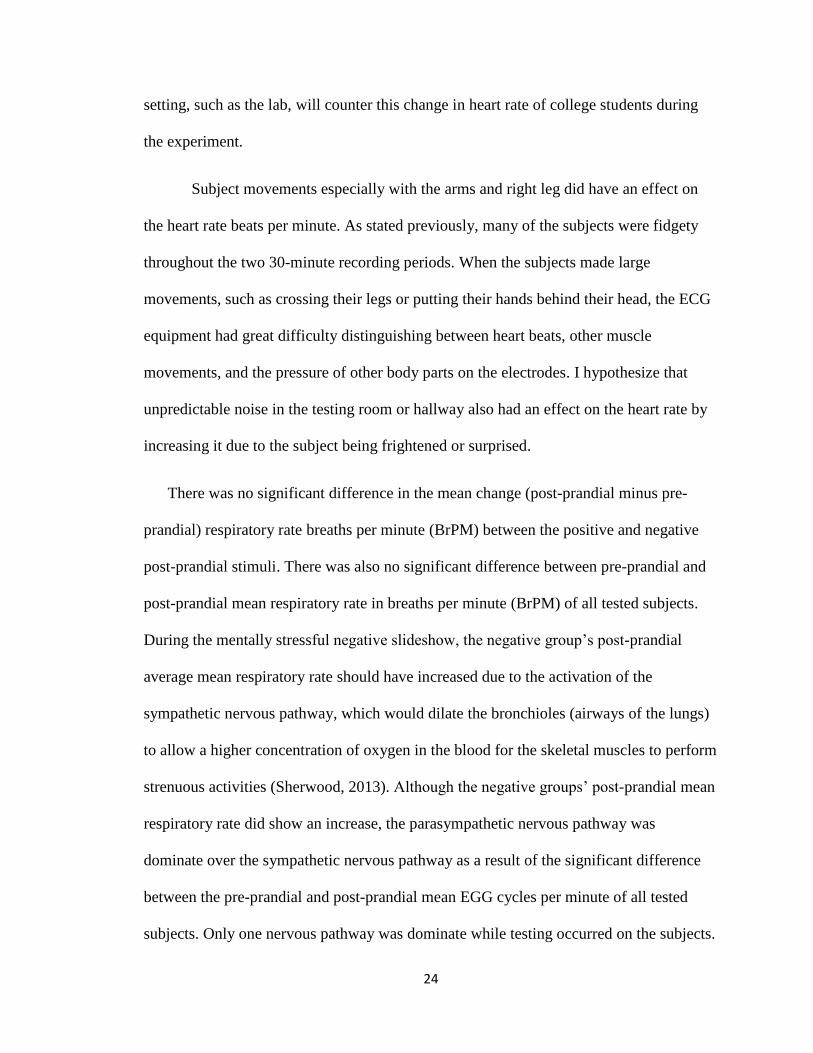
Subject movements especially with the arms and right leg did have an effect on
the heart rate beats per minute. As stated previously, many of the subjects were fidgety
throughout the two 30-minute recording periods. When the subjects made large
movements, such as crossing their legs or putting their hands behind their head, the ECG
equipment had great difficulty distinguishing between heart beats, other muscle
movements, and the pressure of other body parts on the electrodes. I hypothesize that
unpredictable noise in the testing room or hallway also had an effect on the heart rate by
increasing it due to the subject being frightened or surprised.
There was no significant difference in the mean change (post-prandial minus pre-
prandial) respiratory rate breaths per minute (BrPM) between the positive and negative
post-prandial stimuli. There was also no significant difference between pre-prandial and
post-prandial mean respiratory rate in breaths per minute (BrPM) of all tested subjects.
During the mentally stressful negative slideshow, the negative group’s post-prandial
average mean respiratory rate should have increased due to the activation of the
sympathetic nervous pathway, which would dilate the bronchioles (airways of the lungs)
to allow a higher concentration of oxygen in the blood for the skeletal muscles to perform
strenuous activities (Sherwood, 2013). Although the negative groups’ post-prandial mean
respiratory rate did show an increase, the parasympathetic nervous pathway was
dominate over the sympathetic nervous pathway as a result of the significant difference
between the pre-prandial and post-prandial mean EGG cycles per minute of all tested
subjects. Only one nervous pathway was dominate while testing occurred on the subjects.
25
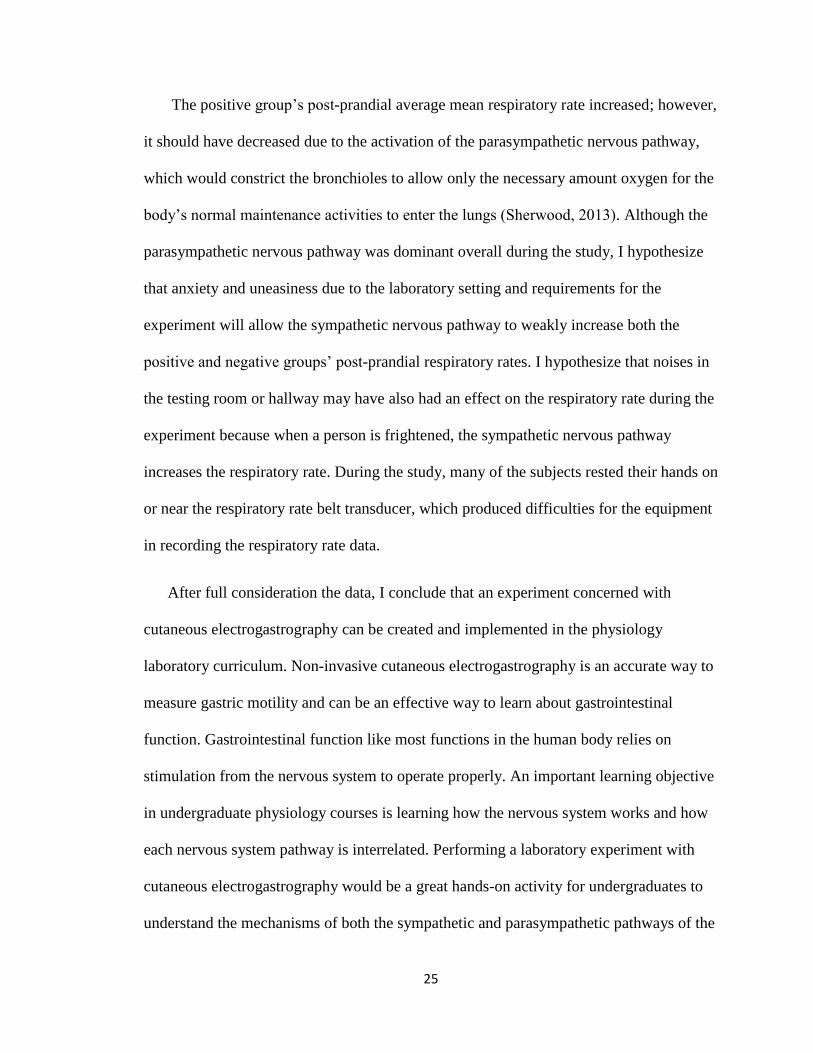
The positive group’s post-prandial average mean respiratory rate increased; however,
it should have decreased due to the activation of the parasympathetic nervous pathway,
which would constrict the bronchioles to allow only the necessary amount oxygen for the
body’s normal maintenance activities to enter the lungs (Sherwood, 2013). Although the
parasympathetic nervous pathway was dominant overall during the study, I hypothesize
that anxiety and uneasiness due to the laboratory setting and requirements for the
experiment will allow the sympathetic nervous pathway to weakly increase both the
positive and negative groups’ post-prandial respiratory rates. I hypothesize that noises in
the testing room or hallway may have also had an effect on the respiratory rate during the
experiment because when a person is frightened, the sympathetic nervous pathway
increases the respiratory rate. During the study, many of the subjects rested their hands on
or near the respiratory rate belt transducer, which produced difficulties for the equipment
in recording the respiratory rate data.
After full consideration the data, I conclude that an experiment concerned with
cutaneous electrogastrography can be created and implemented in the physiology
laboratory curriculum. Non-invasive cutaneous electrogastrography is an accurate way to
measure gastric motility and can be an effective way to learn about gastrointestinal
function. Gastrointestinal function like most functions in the human body relies on
stimulation from the nervous system to operate properly. An important learning objective
in undergraduate physiology courses is learning how the nervous system works and how
each nervous system pathway is interrelated. Performing a laboratory experiment with
cutaneous electrogastrography would be a great hands-on activity for undergraduates to
understand the mechanisms of both the sympathetic and parasympathetic pathways of the
26
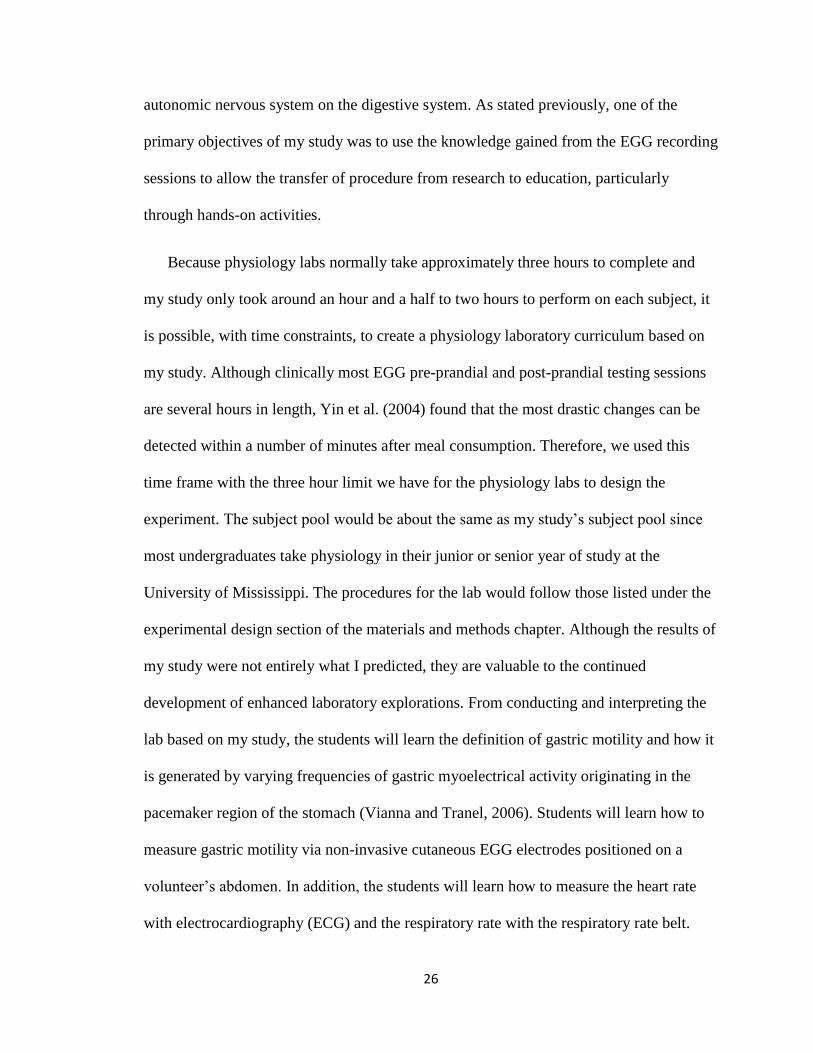
autonomic nervous system on the digestive system. As stated previously, one of the
primary objectives of my study was to use the knowledge gained from the EGG recording
sessions to allow the transfer of procedure from research to education, particularly
through hands-on activities.
Because physiology labs normally take approximately three hours to complete and
my study only took around an hour and a half to two hours to perform on each subject, it
is possible, with time constraints, to create a physiology laboratory curriculum based on
my study. Although clinically most EGG pre-prandial and post-prandial testing sessions
are several hours in length, Yin et al. (2004) found that the most drastic changes can be
detected within a number of minutes after meal consumption. Therefore, we used this
time frame with the three hour limit we have for the physiology labs to design the
experiment. The subject pool would be about the same as my study’s subject pool since
most undergraduates take physiology in their junior or senior year of study at the
University of Mississippi. The procedures for the lab would follow those listed under the
experimental design section of the materials and methods chapter. Although the results of
my study were not entirely what I predicted, they are valuable to the continued
development of enhanced laboratory explorations. From conducting and interpreting the
lab based on my study, the students will learn the definition of gastric motility and how it
is generated by varying frequencies of gastric myoelectrical activity originating in the
pacemaker region of the stomach (Vianna and Tranel, 2006). Students will learn how to
measure gastric motility via non-invasive cutaneous EGG electrodes positioned on a
volunteer’s abdomen. In addition, the students will learn how to measure the heart rate
with electrocardiography (ECG) and the respiratory rate with the respiratory rate belt.
27
Through the EGG, ECG, and respiratory rate measurements, students will understand
how both the sympathetic and parasympathetic nervous pathways change the rate of
gastric motility, heart rate, and respiratory rate.
Some parts of the study need improvement in regards to the feasibility of creating a
physiology laboratory curriculum for undergraduate students. Throughout my study, the
EOG pod used to measure the EGG cycles per minute was very sensitive, and I often had
to recalibrate the EGG settings and reposition the EGG electrodes until the signal was
detected. Further explorations with different EGG recording devices may minimize this
difficulty with the study. Because biology labs usually have more than two people in
attendance, distractions and noises may be problematic for the conduction of the
experiment. The requirement for silence may be challenging to overcome; however, one
solution would be to divide the students into small groups in separate laboratory rooms.
Some adjustments to the negative slideshow are also necessary to determine if mental
stress does actually have an effect on gastric motility in college students. By putting the
subjects in a more stressful situation or environment, the EGG rate should decrease
during the post-prandial recording period. Having the subjects watch a scary movie or
making them take a difficult quiz or test may induce the appropriate amount of mental
stress to decrease the post-prandial cycles per minute. According to Yin et al. (2004), a
stress stimuli that only needs passive subject participation and has a long duration is key
for an adequate EGG study, which is why the experimenters used horror movies for the
study. Further experimentation with various stress stimuli is necessary to create a
physiology laboratory curriculum for undergraduate students at the University of
Mississippi.
28
Figure 1. EGG electrode placement on the subject’s abdomen (modified from Stendel
(1997). Electrode 1 was placed close to the ventral midpoint about halfway between the
xyphoid and umbilicus. Electrode 2 was placed about five centimeters away and at a 45
degree angle above and to the left of the first electrode. Electrode 3 was positioned on the
right side of the subject about ten to fifteen centimeters away and on the same plane as
the first electrode.
1
2
3
29
Figure 2. Examples of slides found in the negative slideshow intended to induce slight
mental stress in the negative subject group.
No pa r k in g
an y w h er e…
Wh en yo u a r e t r y in g t o
r eg ist er f o r c l asses an d
t h is h appen s…

30
Figure 3. Examples of slides found in the positive slideshow intended to induce serenity
and relaxation in the positive subject group.
23-17 Th e Sq u ar e
To p 25 Mo st
Beau t if u l c ampu s Gr ad u at io n
31
Figure 4. Mean change (post-prandial minus pre-prandial) EGG cycles per minute
(CPM) in subjects viewing positive or negative imagery after meal consumption (P(1,18) =
0.604).
0
0.05
0.1
0.15
0.2
0.25
0.3
0.35
0.4
0.45
0.5
Postive Negative
Cyc
les
per
min
ute

32
Figure 5: Difference between pre-prandial and post-prandial mean EGG cycles per
minute (CPM) of all tested subjects (P(1,38)= 0.000297).
0
0.5
1
1.5
2
2.5
3
3.5
Pre-prandial Post-prandial
Cyc
les
per
Min
ute
33
Figure 6. Mean change (post-prandial minus pre-prandial) heart rate beats per minute
(BPM) in subjects viewing positive or negative imagery after meal consumption (P(1,18)=
0.547).
0
1
2
3
4
5
6
Positive Negative
Bea
ts p
er M
inu
te
34
Figure 7: Difference between pre-prandial and post-prandial mean heart rate beats per
minute (BPM) of all tested subjects (P(1,38)= 0.268).
56
58
60
62
64
66
68
70
Pre-prandial Post-prandial
Bea
ts p
er M
inu
te
35
Figure 8. Mean change (post-prandial minus pre-prandial) respiratory rate breaths per
minute (BrPM) in subjects viewing positive or negative imagery after meal consumption
(P(1,18)= 0.867).
0
0.2
0.4
0.6
0.8
1
1.2
1.4
1.6
1.8
Positive Negative
Bre
ath
s p
er M
inu
te
36
Figure 9: Difference between pre-prandial and post-prandial mean respiratory rate in
breaths per minute (BrPM) of all tested subjects (P(1,38)= 0.352).
0
2
4
6
8
10
12
14
16
18
Pre-prandial Post-prandial
Bre
ath
s p
er M
inu
te
37
LIST OF REFERENCES
Akselrod, S., Gordon, D., Andrew Ubel, F., Shannon, D.C., Clifford Barger, A., Cohen,
J.C. (1981). Power spectrum analysis of heart rate fluctuation: a quantitative prove of
beat to beat cardiovascular control. Science 213, 220-222.
Burch, N.R., Greiner, T.H. (1960). A bioelectric scale of human alertness: concurrent
recordings of the EEG and GSR. Psychiatric Research Report 12, 183-193.
Clochesy, J.M., Cifani, L. and K. Howe. (1991). Electrode site preparation techniques: a
follow-up study. Heart & Lung 20, 27-30.
Edelberg, R. (1972). Electrical activity of the skin: its measurements and uses in
psychophysiology. In: Greenfield, N.S., Sternbach, R.A. (Eds.), Handbook of
Psychophysiology. Holt, Rinehart and Winston, New York, 367-418.
Gunn, C.G., Wolf, S., Block, R.T., Person, R.J. (1972). Psychophysiology of the
cardiovascular system. In: Greenfield, N.S., Sternbach, R.A. (Eds.), Handbook of
Psychophysiology. Holt, Rinehart and Winston, New York.
Mayer, E.A. (2000). The neurobiology of stress and gastrointestinal disease. Gut 47, 861-
869.
Medina, V., Clochesy, J.M., and A. Omery. (1989). Comparison of electrode site
preparation techniques. Heart & Lung 18, 456-460.
38
Melendez, L.A. and R.M. Pino. (2012). Electrocardiogram interference: a thing of the
past? Biomedical Instrumentation & Technology 46, 470-477.
Nelsen, T.S. and S. Kohatsu. (1968). Clinical electrogastrography and its relationship to
gastric surgery. American Journal of Surgery 116, 215-222.
Riezzo, G., Russo, F., and and Indrio, F. (2013). Electrogastrography in Adults and
Children: The Strength, Pitfalls, and Clinical Signifcance of the Cutaneous Recording of
the Gastric Electrical Activity. BioMed Research International 2013, 14 pages.
Sherwood, L. (2013). Autonomic Nervous System. In Human Physiology: From Cells to
Systems. Alexander, Glubka, Crosby, and Oliveira ed., (Belmont, CA: Yolanda Cossio
and Brooks/Cole Cengage Learning), 12 pages.
Stendal, C. (1997). Practical Guide to Gastrointestinal Function Testing (Oxford:
Blackwell Science Ltd).
Stern, R.M., Koch, K.L., and Muth, E.R. (2000). The gastrointestinal system. In
Handbook of Psychophysiology, In: Cacciopo, J.T., Tassinary, L.G., Berntson, G.G.
(Eds.) ed., (Cambridge: Cambridge University Press)
Vianna, E.P.M., and D. Tranel. (2006). Gastric Myoelectrical Activity as an Index of
Emotional arousal. International Journal of Psychophysiology 61, 70-76.
Yin, J., Levanon, D. and J. D. Z. Chen. (2004). Inhibitory effects of stress on postprandial
gastric myoelectrical activity and vagal tone in healthy subjects. Neurogastroenterology
and Motility 16, 737-744.

39