Embed Size (px)
Citation preview

PEST Analysis Template
Situation being analysed: ______________________________________________________________________
PEST analysis (political, economical, social, technological) assesses a market, including competitors, from the standpoint of a particular proposition or a business.
criteria examples
ecological/environmental current legislationfuture legislationinternational legislationregulatory bodies and processesgovernment policiesgovernment term and changetrading policiesfunding, grants and initiativeshome market pressure- groupsinternational pressure- groupswars and conflicts
political economical criteria examples
home economyeconomy trendsoverseas economiesgeneral taxationtaxation specific to product/servicesseasonality issuesmarket/trade cyclesspecific industry factorsmarket routes trendsdistribution trendscustomer/end-user driversinterest/ exchange ratesinternational trade and monetary issues
criteria examples
lifestyle trendsdemographicsconsumer attitudes and opinionsmedia viewslaw changes affecting social factorsbrand, company, technology imageconsumer buying patternsfashion and role modelsmajor events and influencesbuying access and trendsethnic/religious factorsadvertising and publicityethical issues
social technological criteria examples
competing technology developmentresearch fundingassociated/dependent technologiesreplacement technology/solutionsmaturity of technologymanufacturing maturity and capacityinformation and communicationsconsumer buying mechanisms/technologytechnology legislationinnovation potentialtechnology access, licencing, patentsintellectual property issuesglobal communications
Note: PEST analysis can be useful before SWOT analysis because PEST helps to identify SWOT factors. PEST and SWOT are two different perspectives but can contain common factors. SWOT stands for strengths, weaknesses, opportunities, threats. A PEST analysis most commonly measures a market; a SWOT analysis measures a business unit, a proposi-
tion or idea.
PAO BBA CU 17

SWOT Analysis Template
Situation being analysed: _________________________________________________________________
This SWOT example is for a new business opportunity. Many criteria can apply to more than one quadrant. Identify criteria appropriate to your own SWOT situation.
criteria examples
Advantages of proposition?Capabilities?Competitive advantages?USP's (unique selling points)?Resources, Assets, People?Experience, knowledge, data?Financial reserves, likely returns?Marketing - reach, distribution, awareness?Innovative aspects?Location and geographical?Price, value, quality?Accreditations, qualifications, certifications?Processes, systems, IT, communications?Cultural, attitudinal, behavioural?Management cover, succession?Philosophy and values?
strengths weaknesses criteria examples
Disadvantages of proposition?Gaps in capabilities?Lack of competitive strength?Reputation, presence and reach?Financials?Own known vulnerabilities?Timescales, deadlines and pressures?Cashflow, start-up cash-drain?Continuity, supply chain robustness?Effects on core activities, distraction?Reliability of data, plan predictability?Morale, commitment, leadership?Accreditations, etc?Processes and systems, etc?Management cover, succession?
criteria examples
Market developments?Competitors' vulnerabilities?Industry or lifestyle trends?Technology development and innovation?Global influences?New markets, vertical, horizontal?Niche target markets?Geographical, export, import?New USP's?Tactics: eg, surprise, major contracts?Business and product development?Information and research?Partnerships, agencies, distribution?Volumes, production, economies?Seasonal, weather, fashion influences?
opportunities threats criteria examples
Political effects?Legislative effects?Environmental effects?IT developments?Competitor intentions - various?Market demand?New technologies, services, ideas?Vital contracts and partners?Sustaining internal capabilities?Obstacles faced?Insurmountable weaknesses?Loss of key staff?Sustainable financial backing?Economy - home, abroad?Seasonality, weather effects?
PAO BBA CU 17

PAO BBA CU 17
New Market Entrants, eg:
entry ease/barriers geographical factors incumbents resistance new entrant strategy routes to market
Buyer Power, eg:
buyer choice buyers size/number change cost/frequency product/service impor-
tance volumes, JIT schedul-
ing
Product and Technology Development, eg:
alternatives price/quality
market distribution changes
fashion and trends legislative effects
Supplier Power, eg:
brand reputation geographical coverage product/service level
quality relationships with cus-
tomers bidding processes/capa-
bilities
Competitive Rivalry, eg:
number and size of firms
industry size and trends
fixed v variable cost bases
product/service ranges
differentiation, strat-egy
Porter’s Five Forces of Competitive
Position

Porter’s Five Forces Analysis Example
Let’s say that you are in the on-line retail business and are looking to “optimize your merchandising effec-
tiveness” to foster industry change and derive competitive advantage. We can use the Five Forces model
to understand how big data analytics could be applied to merchandising optimization to impact your orga-
nization’s overall industry positioning and competitiveness.
PAO BBA CU 17

In the area of Competitive Rivalry, you could apply big data analytics to your Merchandising Optimization
initiative to derive competitive advantage in the following ways:
Use cross-media Conversion Attribution Analysis across search, display, social, and mobile adver-
tising to outflank competition on cross-channel pricing, placement, and promotional effectiveness
Leverage A/B Testing to uncover merchandising messaging and placement insights that drive cat-
egory market share growth and increased shopping occurrence profitability
In the area of Buyer Power, you could apply big data analytics to your Merchandising Optimization initiative
to uncover unique market, product, and customer insights to counter the growing power of buyers and
buying coalitions, including:
Leverage Sentiment Analysis from social media sites to identify and quantify micro-population
merchandising trends and insights to improve customer segmentation, targeting, pricing, and
packaging effectiveness
Leverage real-time customer sales and engagement data to optimize in-flight merchandise tar-
geting to increase on-site customer monetization (e.g., increase conversion rates, increase up-sell
and cross-sell effectiveness)
Leverage merchandising Recommendation Engines to improve the customer experience (e.g., net
promoter scores, repeat purchases, loyalty), optimize merchandising margins and minimize mer-
chandising markdowns
In the area of Supplier Power, you could apply big data analytics to your Merchandising Optimization initia-
tive to glean unique market, product and customer insights to counter the growing power of suppliers, in-
cluding:
Leverage detailed point-of-sale (POS) and RFID data to identify “hot” products more quickly than
competitors in order to “lock in” supplier inventories and favorable terms and conditions
Leverage detailed POS and RFID data to cancel and/or return slow movers and no movers faster
than competition in order to minimize merchandise markdown and inventory carrying costs
In the area of Product and Technology Innovation, you could apply big data analytics to your Merchandis-
ing Optimization initiative to identify areas where products and/or technology can be used to drive buyer or
supplier lock-in, or create barriers of entry for new market entrants, including:
Provide a software-as-a service dashboard and predictive analytics platform that leverages mer-
chandising data and insights to help suppliers minimize their procurement, inventory and distri-
bution costs
Couple merchandising data and insights with predictive analytics capabilities that recommends
in-flight supply chain and inventory adjustments to your key channel and distribution partners
In the area of New Market Entrants, you could use big data analytics to identify and pre-empt market op-
portunities before new market entrants can gain a foothold, including:
PAO BBA CU 17

Constantly monitor social media and mobile data for merchandising trending insights that can be
used to pre-empt new market entrantsSWOT Analysis Wal-Mart
WALLMART SWOTStrengths
Wal-Mart is a powerful retail brand. It has a reputation for value for money, convenience and a wide
range of products all in one store.
Wal-Mart has grown substantially over recent years, and has experienced global expansion (for ex-
ample its purchase of the United Kingdom based retailer ASDA).Opportunities
To take over, merge with, or form strategic alliances with other global retailers, focusing on specific
markets such as Europe or the Greater China Region.
The stores are currently only trade in a relatively small number of countries. Therefore there are
tremendous opportunities for future business in expanding consumer markets, such as China and In-
dia.
New locations and store types offer Wal-Mart opportunities to exploit market development. They di-
versified from large super centres, to local and mall-based sites.
Opportunities exist for Wal-Mart to continue with its current strategy of large, super centres.Threats
Being number one means that you are the target of competition, locally and globally.
Being a global retailer means that you are exposed to political problems in the countries that you op-
erate in.
The cost of producing many consumer products tends to have fallen because of lower manufacturing
costs. Manufacturing cost have fallen due to outsourcing to low-cost regions of the World. This has
lead to price competition, resulting in price deflation in some ranges. Intense price competition is a
threat.
‘Wal-Mart Stores, Inc. is the world’s largest retailer, with $256.3 billion in sales in the fiscal year ending Jan.
31, 2004. The company employs 1.6 million associates worldwide through more than 3,600 facilities in the
United States and more than 1,570 units.
Pest or Swot
PAO BBA CU 17

A PEST analysis most commonly measures a market; a SWOT analysis measures a business unit, a proposi-tion or idea.
Generally speaking a SWOT analysis measures a business unit or proposition, whereas a PEST analysis mea-sures the market potential and situation, particularly indicating growth or decline, and thereby market at-tractiveness, business potential, and suitability of access - market potential and 'fit' in other words. PEST analysis uses four perspectives, which give a logical structure, in this case organized by the PEST format, that helps understanding, presentation, discussion and decision-making. The four dimensions are an exten-sion of a basic two heading list of pro's and con's (free pro's and con's template here).
PEST analysis can be used for marketing and business development assessment and decision-making, and the PEST template encourages proactive thinking, rather than relying on habitual or instinctive reactions.
Here the PEST analysis template is presented as a grid, comprising four sections, one for each of the PEST headings: Political, Economic, Social and Technological.
As previously explained, extended variations of PEST (eg., PESTELI and STEEP, etc) include other factors, such as Environmental, Ethical, Legal or Legislative, etc., however in most situations you will find that these 'additional' factors are actually contributory causes or detailed perspectives which then manifest or take effect in the form or one or several of the original four main PEST factors. For example, Ethical and Environ-mental factors will always tend to produce an effect in at least one of the main four headings (Political, Eco-nomic, Social, Technological), but it will tend not to work the other way. Hence why the basic PEST model is often the most powerful - it puts more pressure on strategic appreciation and analysis than a longer list of headings. When you next see a PESTELI or a STEEPLED analysis ask yourself (or the author): "Okay, I under-stand that customers tend to be more ethically minded now, but what does that mean in terms of the basic four PEST factors - what's the effect going to be?..." or: "Okay we know that carbon emissions is an issue, but tell me where in the main four PEST factors will it impact..?
You will gather I am not a fan nor a particular advocate of extending the PEST model. It works great as it is - why make it more complicated and less specific? If you are worried about missing or forgetting a crucial point of ethics or legislation (or anything else) keep a reference list of these headings, and only build them into the model if you are sure that doing so will make it work better as a strategic tool.
The free PEST template below includes sample questions or prompts, whose answers are can be inserted into the relevant section of the PEST grid. The questions are examples of discussion points, and obviously can be altered depending on the subject of the PEST analysis, and how you want to use it. Make up your own PEST questions and prompts to suit the issue being analysed and the situation (ie., the people doing the work and the expectations of them). Like SWOT analysis, it is important to clearly identify the subject of a PEST analysis, because a PEST analysis is four-way perspective in relation to a particular business unit or proposition - if you blur the focus you will produce a blurred picture - so be clear about the market that you use PEST to analyse.
A market is defined by what is addressing it, be it a product, company, brand, business unit, proposition, idea, etc, so be clear about how you define the market being analysed, particularly if you use PEST analysis in workshops, team exercises or as a delegated task. The PEST subject should be a clear definition of the market being addressed, which might be from any of the following standpoints:
a company looking at its market
a product looking at its market
a brand in relation to its market
a local business unit
a strategic option, such as entering a new market or launching a new product
a potential acquisition
a potential partnership
PAO BBA CU 17

an investment opportunity
Be sure to describe the subject for the PEST analysis clearly so that people contributing to the analysis, and those seeing the finished PEST analysis, properly understand the purpose of the PEST assessment and impli-cations.
More on the difference and relationship between PEST and SWOT
PEST is useful before SWOT - not generally vice-versa - PEST definitely helps to identify SWOT factors. There is overlap between PEST and SWOT, in that similar factors would appear in each. That said, PEST and SWOT are certainly two different perspectives:
PEST assesses a market, including competitors, from the standpoint of a particular proposition or a busi-ness.
SWOT is an assessment of a business or a proposition, whether your own or a competitor's.
Strategic planning is not a precise science - no tool is mandatory - it's a matter of pragmatic choice as to what helps best to identify and explain the issues.
PEST becomes more useful and relevant the larger and more complex the business or proposition, but even for a very small local businesses a PEST analysis can still throw up one or two very significant issues that might otherwise be missed.
The four quadrants in PEST vary in significance depending on the type of business, eg., social factors are more obviously relevant to consumer businesses or a B2B business close to the consumer-end of the supply chain, whereas political factors are more obviously relevant to a global munitions supplier or aerosol pro-pellant manufacturer.
All businesses benefit from a SWOT analysis, and all businesses benefit from completing a SWOT analysis of their main competitors, which interestingly can then provide some feed back into the economic aspects of the PEST analysis.
PEST analysisPolitical (current and potential influences from political pressures)Economic (the local, national and world economy impact)
PAO BBA CU 17

Sociological (the ways in which a society can affect an organization)Technological (the effect of new and emerging technology)Legal (the effect of national and world legislation)Environmental (the local, national and world environmental issues)
PEST analysis ('Political, Economic, Social and Technological analysis''') describes a framework of macro-environmental factors used in the environmental scanning component of strategic management. Some analysts added Legal and rearranged the mnemonic to SLEPT; insertingEnvironmental factors expanded it to PESTEL or PESTLE, which is popular in the United Kingdom.[1]The model has recently been further extended to STEEPLE and STEEPLED, adding Ethics andDemographic factors. It is a part of the external analysis when conducting a strategic analysis or doingmarket research, and gives an overview of the different macro-environmental factors that the company has to take into consideration. It is a useful strategic tool for understanding market growth or decline, business position, potential and direction for operations. The growing importance of environmental or ecological factors in the first decade of the 21st century have given rise to green business and encouraged widespread use of an updated version of the PEST framework. STEER analysis systematically considers Socio-cultural, Technological, Economic, Ecological, and Regulatory factors.
The basic PEST analysis includes four factors:
Political factors are basically to what degree the government intervenes in the economy. Specifically, political factors include areas such as tax policy, labor law, environmental law, trade restrictions, tariffs, and political stability. Political factors may also include goods and services which the government wants to provide or be provided (merit goods) and those that the government does not want to be provided (demerit goods or merit bads). Furthermore, governments have great influence on the health, educa-tion, and infrastructure of a nation.
Economic factors include economic growth, interest rates, exchange rates and the inflation rate. These factors have major impacts on how businesses operate and make decisions. For example, interest rates affect a firm's cost of capital and therefore to what extent a business grows and expands. Exchange rates affect the costs of exporting goods and the supply and price of imported goods in an economy.
Social factors include the cultural aspects and include health consciousness, population growth rate, age distribution, career attitudes and emphasis on safety. Trends in social factors affect the demand for a company's products and how that company operates. For example, an aging population may imply a smaller and less-willing workforce (thus increasing the cost of labor). Furthermore, companies may change various management strategies to adapt to these social trends (such as recruiting older work-ers).
Technological factors include technological aspects such as R&D activity, automation, technology in-centives and the rate of technological change. They can determine barriers to entry, minimum efficient production level and influence outsourcing decisions. Furthermore, technological shifts can affect costs, quality, and lead to innovation.
Expanding the analysis to PESTLE or PESTEL adds:
PAO BBA CU 17

Legal factors include discrimination law, consumer law, antitrust law, employment law, and health and safety law. These factors can affect how a company operates, its costs, and the demand for its prod-ucts.
Environmental factors include ecological and environmental aspects such as weather, climate, and cli-mate change, which may especially affect industries such as tourism, farming, and insurance. Further-more, growing awareness of the potential impacts of climate change is affecting how companies oper-ate and the products they offer, both creating new markets and diminishing or destroying existing ones.
Other factors for the various offshoots include:
Demographic factors include gender, age, ethnicity, knowledge of languages, disabilities, mobility, home ownership, employment status, religious belief or practice, culture and tradition, living standards and income level.
Regulatory factors include acts of parliament and associated regulations, international and national standards, local government by-laws, and mechanisms to monitor and ensure compliance with these.
Applicability of the factor
The model's factors will vary in importance to a given company based on its industry and the goods it pro-duces. For example, consumer and B2Bcompanies tend to be more affected by the social factors, while a global defense contractor would tend to be more affected by political factors. Additionally, factors that are more likely to change in the future or more relevant to a given company will carry greater importance. For example, a company which has borrowed heavily will need to focus more on the economic factors (espe-cially interest rates).
Furthermore, conglomerate companies who produce a wide range of products (such as Sony, Disney, or BP) may find it more useful to analyze one department of its company at a time with the PESTEL model, thus fo-cusing on the specific factors relevant to that one department. A company may also wish to divide factors into geographical relevance, such as local, national, and global.
Use of PEST analysis with other models
The PEST factors, combined with external micro-environmental factors and internal drivers, can be classi-fied as opportunities and threats in a SWOT analysis. A graphical method for PEST analysis called 'PESTLEWeb' has been developed at Henley Business School in the UK. Research has shown that PESTLEWeb diagrams are considered by users to be more logical, rationale and convincing than traditional PEST analysis.[2][3]
PAO BBA CU 17

PAO BBA CU 17

PAO BBA CU 17

Value Chain Analysis
A value chain is a chain of activities that a firm operating in a specific industry performs in order to deliver a valuable product or service for the market. The concept comes from business management and was first described and popularized by Michael Porter in his 1985 best-seller, Competitive Advantage: Creating and Sustaining Superior Performance.[1]
The idea of the value chain is based on the process view of organizations, the idea of seeing a manufactur-ing (or service) organization as a system, made up of subsystems each with inputs, transformation pro-cesses and outputs. Inputs, transformation processes, and outputs involve the acquisition and consumption of resources - money, labour, materials, equipment, buildings, land, administration and management. How value chain activities are carried out determines costs and affects profits.
The concept of value chains as decision support tools, was added onto the competitive strategies paradigm developed by Porter as early as 1979.[dubious – discuss][3] In Porter's value chains, Inbound Logistics, Operations, Outbound Logistics, Marketing and Sales and Service are categorized as primary activities. Secondary activi-ties include Procurement, Human Resource management, Technological Development and Infrastructure (Porter 1985, pp. 11–15).[1][2]
According to the OECD Secretary-General (Gurría 2012)[4] the emergence of global value chains (GVCs) in the late 1990s provided a catalyst for accelerated change in the landscape of international investment and trade, with major, far-reaching consequences on governments as well as enterprises (Gurría 2012).[4]
The appropriate level for constructing a value chain is thebusiness unit,[5] not division or corporate level. Products pass through activities of a chain in order, and at each activity the product gains some value. The chain of activities gives the products more added value than the sum of added values of all activities.[5]
The activity of a diamond cutter can illustrate the difference between cost and the value chain. The cutting activity may have a low cost, but the activity adds much of the value to the end product, since a rough dia-mond is significantly less valuable than a cut diamond. Typically, the described value chain and the docu-mentation of processes, assessment and auditing of adherence to the process routines are at the core of the quality certification of the business, e.g. ISO 9001.[citation needed]
A firm's value chain forms a part of a larger stream of activities, which Porter calls a value system[citation needed]. A value system, or an industry value chain, includes the suppliers that provide the inputs necessary to the firm along with their value chains. After the firm creates products, these products pass through the value chains of distributors (which also have their own value chains), all the way to the customers. All parts of these chains are included in the value system. To achieve and sustain a competitive advantage, and to sup-port that advantage with information technologies, a firm must understand every component of this value system.[citation needed]
Primary activities
Inbound Logistics: arranging the inbound movement of materials, parts, and/or finished inventory from suppliers to manufacturing or assembly plants, warehouses, or retail stores
Operations: concerned with managing the process that converts inputs (in the forms of raw materials, labor, and energy) into outputs (in the form of goods and/or services).
Outbound Logistics: is the process related to the storage and movement of the final product and the related information flows from the end of the production line to the end user
Marketing and Sales: selling a product or service and processes for creating, communicating, delivering, and exchanging offerings that have value for customers, clients, partners, and society at large.
Service: includes all the activities required to keep the product/service working effectively for the buyer after it is sold and delivered.
PAO BBA CU 17

Secondary activities
Procurement: the acquisition of goods, services or works from an outside external source Human resources management: consists of all activities involved in recruiting, hiring, training, develop-
ing, compensating and (if necessary) dismissing or laying off personnel. Technological Development: pertains to the equipment, hardware, software, procedures and technical
knowledge brought to bear in the firm's transformation of inputs into outputs. Infrastructure: consists of activities such as accounting, legal, finance, control, public relations, quality
assurance and general (strategic) management.
Example1 (VCA)
Let’s again say that you are in the on-line retail business and are looking at how we can leverage big data
analytics to improve internal processes that power our “optimize merchandising effectiveness” business ini-
tiative. Let’s use the Value Chain technique to understand how to apply big data analytics.
Figure 2: Michael Porter’s Value Chain Analysis
In the area of Inbound Logistics, you could apply big data analytics to your sourcing and procurement activ-
ities to optimize your Merchandising Effectiveness initiative in the following way:
Use real-time POS data and an integrated data feed (API) to proactively notify suppliers of poten-
tial merchandising out-of-stock and over-stock situations prior to them becoming problems
In the area of Operations, you could apply big data analytics to your manufacturing and inventory activities
to optimize your Merchandising Effectiveness initiative in the following way:
Use real-time POS and RFID data to predict merchandise demand, manage merchandise mark-
downs, and identify slow and no movers in order to optimize in-store/on-site inventory
In the area of Outbound Logistics, you could apply big data analytics to optimize your Merchandising Effec-
tiveness initiative in the following ways:
PAO BBA CU 17

Leverage social media and mobile data to uncover merchandising insights that could impact stock
and inventory levels for in-flight campaigns
Use analytics sandbox to model event-driven logistics impacts (e.g., major league baseball game
in the area, unplanned construction work on a major travel artery)
In the area of Marketing & Sales, you could apply big data analytics to your advertising, marketing, and
sales activities to optimize your Merchandising Effectiveness initiative in the following way:
Use conversion attribution analysis across search, display, mobile, and social media to determine
the driving factors in order to optimize ad placement, keyword bids, and messaging more quickly
In the area of Service, you could apply big data analytics to your service, support, and maintenance activi-
ties to optimize your Merchandising Effectiveness initiative in the following ways:
Combine social media data with your customer loyalty data to create more-frequent, higher-fi-
delity customer scores for retention, fraud, up-sell/cross-sell, and net promoter
You can see some further examples of applying big data analytics valuation to the Value Chain Support Ac-
tivities in Figure 2.
Porter’s Value Chain Analysis Summary
The Porter Value Chain Analysis provides a business-centric approach to looking at how big data analytics
could potentially impact your organization’s internal value chain, or its internal value creation process. My
next blog will wrap up this series by looking at the power of combining both the Value Chain Analysis and
the Five Forces Analysis into the same business valuation exercise. Until then, continue reading your
Michael Porter books!!
Example2 (VCA)
The internal value chain of an online learning institution consists of all physically and technologically dis-tinct activities within the institution that add value to the learner's experience. The key to analyzing the value chain is understanding the activities within the institution that create a competitive advantage, and then managing those activities better than other institutions in the industry. Porter (1985) suggested that the activities of a business can be grouped under two headings: primary activities, those that are directly in-volved with the physical creation and delivery of the product or service; and support activities, which feed both into primary activities and into each other. Support activities (e.g., human resource management, technology development) are not directly involved in production, but have the potential to increase effec-tiveness and efficiency. It is rare for an organization to undertake all primary and support activities. Value chain analysis is thus a means for examining internal processes and identifying which activities are best pro-vided by others. Figure 3-4 presents a generic value chain adapted for an online learning institution.
Support activities consist of
1. organizational infrastructure, which is concerned with a wide range of support systems and functions, such as finance, planning, quality control, and general senior management.
2. human resource management, dealing with those activities concerned with recruiting, developing, motivating, and rewarding the workforce of the organization.
PAO BBA CU 17

3. technology development, dealing with those activities concerned with managing information processing and the development and protection of "knowledge" in the organization.
4. procurement, which deals with how resources are acquired for the organization (e.g., sourcing and negotiating with suppliers).
The overall primary structure in an online distance education organization such as the UK Open Univer-sity (http://www.open.ac.uk) or Athabasca University (http://www.athabascau.ca) can be described in terms of five sectors: inbound logistics, production, outbound logistics, delivery and marketing, and service to learners. These sectors are discussed briefly below.
Inbound logistics involves preparations for course development, including curriculum planning; acquir-ing or preparing for learning specific hardware (LSH), learning management systems (LMS), and learning content management systems (LCMS); hiring of authors; ordering of reference materials, including text-books; and formation of internal course teams.
Operations involve the actual process of course development, including writing, multimedia creation, editing, formatting, graphic design, printing, and Web publishing.
Outbound logistics concerns the packaging and storage of courses, and the process of mailing or other-wise delivering the material to the students. Providing registered students with access to their courses through an integrated portal where they can retrieve customized and relevant information about their ac-count is another aspect of outbound logistics. Student portals are important for online learning, as they help build a virtual campus community. In one secure place, a student can access their account to register in a course, order a transcript, ask for student financial aid, access the library and bookstore, and benefit from a variety of student orientation tools, including advising, support, counseling, and other resources.
The university enters into a contract for tuition and other services with a student when they register in a particular course. A registration is considered a sale, as funds change hands for access to the course and for purchase of the learning materials. The core revenue stream of the online learning institution derives from the provision of learning; therefore, tuition is often considered the main source of revenue for such institu-tions. Other sources of revenue include government funding; sales of in-house-developed products, design tools, and databases; and provision of other services to students (e.g., admission, contract extension, tran-scripts, challenge fees).
The preparation of brochures, advertising materials, and the university calendar is the traditional and main marketing strategy to promote the university's offerings. Given the nature of online learning, the on-line university must craft a branding strategy to communicate the benefits, attributes, culture, and com-petitive advantage of the institution and its unique online learning offerings; it must also establish strategic partnerships and alliances that are able to give the institution a unique position in the minds of stakehold-ers.
The service sector provides online support (technical and academic) to learners, counseling, tutoring, marking of assignments and examinations, delivery and invigilation of examinations, and maintenance of student records. It also includes learner self-service through Web sites and Web portals.
It may seem surprising that research is not mentioned explicitly as a sector in the value chain, especially as research has traditionally been considered a primary function of universities, one perceived by aca-demics and the public as a value adding activity, as it helps the university to make a significant contribution to society. As you can see in Figure 3-4, however, research and the generation of knowledge are compo-nents of many value chain activities. Research is an essential element in all world-class universities. It en-sures a vibrant academic environment, and enables the university to attract and retain good faculty, while building a strong academic reputation and contributing to the continual improvement of curriculum, learn-ing systems, and programs.
PAO BBA CU 17

Online learning value chain.
A value chain analysis explicitly recognizes the interdependencies and the profit cost efficiencies accru-ing from exploiting linkages among value activities across the organization. For example, the timing of pro-motional campaigns (one value activity) significantly influences capacity use in course production and oper-ations (another value activity). These linked activities must be coordinated if the full effect of the promo-tion is to be realized. Promoting a new program while a number of required program courses are unavail-able will damage the image of the institution and result in lost registrations (revenue). Consider also that a
PAO BBA CU 17

well-designed course (one value activity) will lose value if not complemented with a suitable delivery strat-egy (a second value activity), and by a well-thought-out student support strategy (a third value activity). By focusing on such linkages, the value chain analysis provides a powerful tool for strategic thinking to gain sustainable competitive advantage.
Value Chain Methodology
The methodology for constructing and using a value chain involves four steps: identify value chain activities, determine which value chain activities are strategic, trace costs to value chain activities, and use the activity cost information to manage the strategic value chain activities. An organization that can do these things better than its competitors creates a sustainable competitive advantage.
FIVE FORCES EXAMPLE
orter (1985) identified five competitive forces interacting within a given industry: the intensity of rivalry among
existing competitors, the barriers to entry for new competitors, the threat of substitute products and services,
the bargaining power of suppliers, and the bargaining power of buyers (see Figure 3-2). Analyzing these forces
will reveal the industry's fundamental attractiveness, expose the underlying drivers of average industry prof-
PAO BBA CU 17

itability, and provide insight into how profitability will evolve in the future, given different changes among sup-
pliers, channels, substitutes, competitors, or technology.
e
PAO BBA CU 17

STP Process
The STP process is an important concept in the study and application of marketing. The letters STP stand forsegmentation, targeting, and positioning.
The STP process demonstrates the links between an overall market and how a company chooses to compete in that market. It is sometimes referred to as a process, with segmentation being conducted first, then the selection of one or more target markets and then finally the implementation of positioning. The goal of the STP process is to guide the organization to the development and implementation of an appropriate marketing mix, as highlighted in the following diagram.
Definitions of segmentation, targeting and positioning
Market segmentation can be defined as:
The process of splitting a market into smaller groups with similar product needs or identifiable characteristics, for the purpose of selecting appropriate target markets.
Targeting (or target market selection) refers to:
An organization’s proactive selection of a suitable market segment (or segments) with the intention of heavily focusing the firm’s marketing offers and activities towards this group of related consumers.
And positioning (which is sometimes referred to as product positioning) is:
Positioning is the target market’s perception of the product’s key benefits and features, relative to the offerings of competitive products.
PAO BBA CU 17

The Full STP Process
The market segmentation, targeting and positioning (STP) process is a fundamental concept in understanding marketing and the strategies of firms. In most marketing textbooks, the STP approach is presented as a simple three step process. While that approach provides a good introduction to this marketing concept, it fails to adequately highlight the smaller steps of the STP process that should also be understood.
The following diagram highlights the overall STP process in nine steps:
The following is a quick discussion of the full market segmentation, targeting and positioning (STP) process, as shown above.
Step One – Define the market
In the first step in this more detailed model is to clearly define the market that the firm is interested in. This may sound relatively straightforward but it is an important consideration. For example, when Coca-Cola looks at market segmentation they would be unlikely to look at the beverage market overall. Instead they would look at what is known as a sub-market (a more product-market definition). A possible market definition that Coca-Cola could use might be diet cola soft drinks in South America. It is this more precise market definition that is segmented, not the overall beverage market, as it is far too generic and has too many diverse market segments.
Step Two – Create market segments
Once the market has been defined, the next step is to segment the market, using a variety of differentseg-
mentation bases/variables in order to construct groups of consumer. In other words, allocate the con-
sumers in the defined market to similar groups (based on market needs, behavior or other characteristics).
-----
Step Three – Evaluate the segments for viability
PAO BBA CU 17

After market segments have been developed they are then evaluated using a set criteria to ensure that
they are useable and logical. This requires the segments to be assessed against a checklist of factors, such
as: are the segments reachable, do they have different groups of needs, are they large enough, and so on.
Step Four – Construct segment profiles
Once viable market segments have been determined, segment profiles are then developed. Segment pro-
files are detailed descriptions of the consumers in the segments – describing their needs, behaviors, prefer-
ences, demographics, shopping styles, and so on. Often a segment is given a descriptive nickname by the
organization. This is much in the same way that the age cohorts of Baby Boomers, Generation X and Gener-
ation Y have a name.
Step Five – Evaluate the attractiveness of each segment
Available market data and consumer research findings are then are added to the description of the seg-
ments (the profiles), such as segment size, growth rates, price sensitivity, brand loyalty, and so on. Using
this combined information, the firm will then evaluate each market segment on its overall attractiveness.
Some form of scoring model will probably be used for this task, resulting in numerical and qualitative scores
for each market segment.
Step Six – Select target market/s
With detailed information on each of the segments now available, the firm then decides which ones are the
most appropriate ones to be selected as target markets. There are many factors to consider when choosing
a target market. These factors include: firms strategy, the attractiveness of the segment, the competitive ri-
valry of the segment, the firm’s ability to successfully compete and so on.
-------
Step Seven – Develop positioning strategy
The next step is to work out how to best compete in the selected target market. Firms need to identify how
to position their products/brands in the target market. As it is likely that there are already competitive of-
ferings in the market, the firm needs to work out how they can win market share from established players.
Typically this is achieved by being perceived by consumers as being different, unique, superior, or as provid-
ing greater value.
Step Eight – Develop and implement the marketing mix
Once a positioning strategy has been developed, the firm moves to implementation. This is the develop-
ment of amarketing mix that will support the positioning in the marketplace. This requires suitable prod-
ucts need to be designed and developed, at a suitable price, with suitable distribution channels, and an ef-
fective promotional program.
Step Nine – Review performance
After a period of time, and on a regular basis, the firm needs to revisit the performance of various products
and may review their segmentation process in order to reassess their view of the market and to look for
new opportunities.
PAO BBA CU 17

Market segmentationMarket segmentation involves grouping your various customers into segments that have common needs or will respond similarly to a marketing action. Each segment will respond to a different marketing mix strat-egy, with each offering alternate growth and profit opportunities.Some different ways you can segment your market include the following;
Demographics which focuses on the characteristics of the customer. For example age, gender, income bracket, education, job and cultural background.
Psychographics which refers to the customer group's lifestyle. For example, their social class, lifestyle, personality, opinions, and attitudes.
Behaviour which is based on customer behaviour. For example, online shoppers, shopping centre cus-tomers, brand preference and prior purchases.
Geographical location such as continent, country, state, province, city or rural that the customer group re-sides.
TargetingAfter segmenting the market based on the different groups and classes, you will need to choose your tar-gets. No one strategy will suit all consumer groups, so being able to develop specific strategies for your tar-get markets is very important.There are three general strategies for selecting your target markets:
Undifferentiated Targeting: This approach views the market as one group with no individual segments, therefore using a single marketing strategy. This strategy may be useful for a business or product with lit-tle competition where you may not need to tailor strategies for different preferences.
Concentrated Targeting: This approach focuses on selecting a particular market niche on which marketing efforts are targeted. Your firm is focusing on a single segment so you can concentrate on understanding the needs and wants of that particular market intimately. Small firms often benefit from this strategy as focusing on one segment enables them to compete effectively against larger firms.
Multi-Segment Targeting: This approach is used if you need to focus on two or more well defined market segments and want to develop different strategies for them. Multi segment targeting offers many bene-fits but can be costly as it involves greater input from management, increased market research and in-creased promotional strategies.
Prior to selecting a particular targeting strategy, you should perform a cost benefit analysis between all available strategies and determine which will suit your situation best.PositioningPositioning is developing a product and brand image in the minds of consumers. It can also include improv-ing a customer's perception about the experience they will have if they choose to purchase your product or service. The business can positively influence the perceptions of its chosen customer base through strate-gic promotional activities and by carefully defining your business' marketing mix.Effective positioning involves a good understanding of competing products and the benefits that are sought by your target market. It also requires you to identify a differential advantage with which it will deliver the required benefits to the market effectively against the competition. Business should aim to define them-selves in the eyes of their customers in regards to their competition.
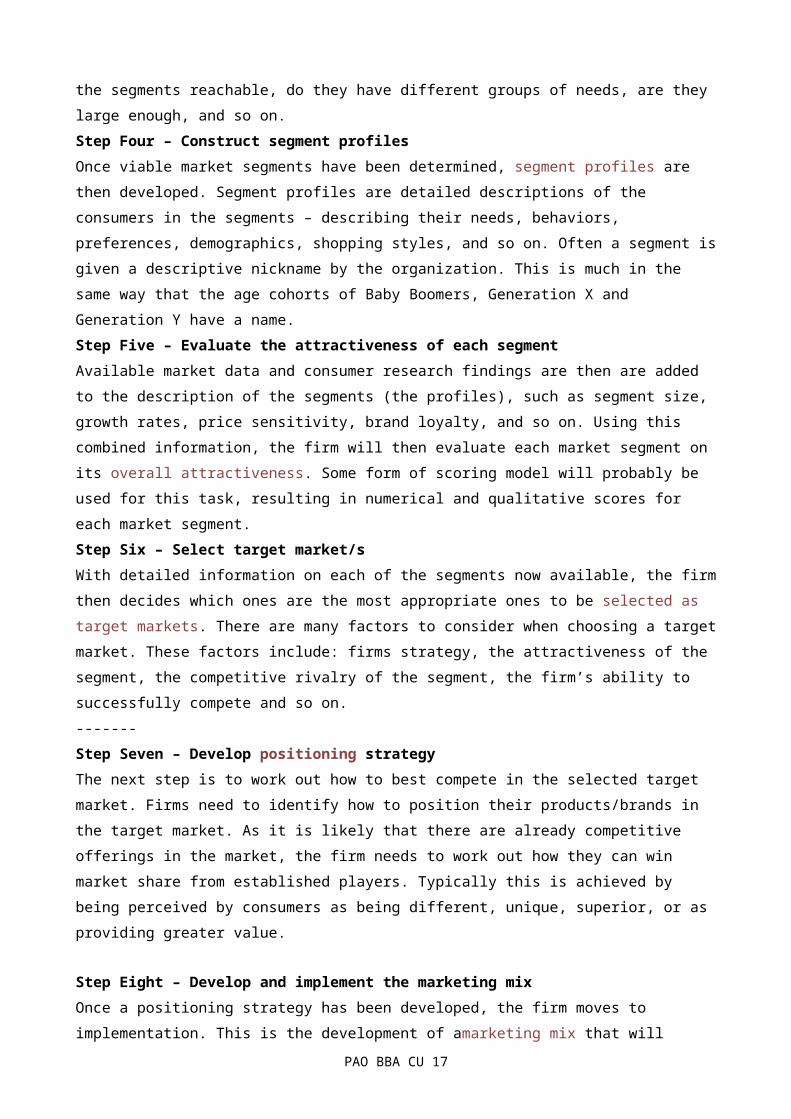
EXAMPLE : TESCO STP
Segmentation bases
Target customer segment for Tesco Technika 19-230 18.5 inch Widescreen HD Ready LCD TV
Geographic Region UK, and 13 other countries
PAO BBA CU 17

Density Rural and urban
Demographic
Age All age categories
Gender Males and females
Income Low and middle income category
Occupation Students, employees, professionals
Education High school, technical, Bachelors,
Social status Working class, skilled working class, lower middle class, mid-dle class
Family size Single individuals, nuclear and extended families
Psychographic Lifestyle Traditionalists, contended conformers
Personality Easy-going, determined
Behavioural
Occasions Regular
Benefits sought Cost advantage, variety
User status Active user
Attitude Sceptical, positive
Target customer segment for Tesco Technika TV
EXAMPLE :COKE STPTargeting :::::Segmentation enables Brands to define the appropriate products for different kind of customers. Coca Cola doesn’t target a specific segment but adapt its marketing strategy by developing new products.Age: Generally, Coke does not have a specific target and is addressed to everyone.But the main consumers are 12-30 years old people; even if there is no specific product or communication for less than 12 or more than 30, the brand succeed in reaching them, through partnerships for example (restaurants, fast foods such as McDonald’s…), or thanks to its value among consumers. So, the core target audience of Coca Cola is youngster or youth. Their targeting is not based on gender but the results show that both genders like this product and use it (almost 50/50). Finally, Coca Cola consider each customer as a target and a potential consumer. All age groups are being targeted but the most potential is the age group from 18-25 that covers around 40% of total age segments.Life style: no life style targeted but more and more busy life style and mobile generation (youth) are considered to be the most important part of Coke’s consumers.Occupation: no occupation targeted but consumers are mainly students and family oriented peopleNature: fun, joy, entertainment loving…Customer’s Media HabitsThere are some habits which are given as follow:· The young target audience of the brand loves media exposure
PAO BBA CU 17

· Mobile generation & social media is part of daily life· Connected people; they like innovations, they like being surprised.
Positioning :::::Coca Cola has strategically positioned itself within the world soft drink market. It faces a vital question: does it have to keep the same positioning or to adapt according to the 200 countries where the brand sells its products. The brand has understood this principle while ago: “think global, act local”. Coca is thus willing to keep the same core product which is coke, but it adapts the offer to local needs. They use strategic positioning in order to have the same image all around the world, which is a success because it is perceived today as a part of daily life everywhere. This perception of the brand by the consumer leads to a high degree of loyalty and makes the purchasing decision more automatic. Coca Cola has been successful by using Unique Selling preposition as “Live the coke side of life”, related to joy and happiness.Consumers basically associate this brand with these emotions. When the name of Coke is mentioned, the first thing that comes into mind is fun and entertainment.
4Ps::::::::Product300 beverages are produced by Coca Cola, including Sprite, Fruitopia, Coke, Fanta, powder juices and more. The packaging of the products varies massively, too, due to the sizes of the drinks. Sizes include 300ml, 600ml, 1.25 liters, 2 liters and also cans (usually 375ml). One of the most well-known products by the com-pany is Coca Cola itself; recognized by over 93% of the population. It holds an amazing reputation on the market.
PriceThe price of Coca Cola brands will vary on the size and the product. The population readily accepts the prices offered by the firm. This is due to the increase in the rate of demand for the products. Promotion is another important issue also involved with the marketing mix. The brand promoted from the very start in an effective manner to ensure that customers remained attracted to the product. Coca Cola utilises televi-sion, radio, Internet, billboard and pamphlet advertising.
PlaceCoca Cola is a leading brand that is easily available across the world. You will find the product in nearly all shops due to the huge rate of demand for it. Anywhere, at whatever time, you'll have access to the brand because of strategies implemented by Coca Cola.
PeopleThis is the final part of the marketing mix. The main demographic that Coca Cola targets is young people. Apart from young people; kids and the older generation do enjoy the products as well, meaning that there is a huge customer base.
PAO BBA CU 17

Product
The company has the widest portfolio in beverage industry comprising of 3300 products. Beverages are di -
vided into diet category, 100% fruit juices, fruit drinks, water, energy drinks, tea and coffee etc. As per Niel-
son’s data, Coca cola is the No.1 brand in sparkling beverages, juice, and retail packaged water in 2010.
Coca cola has its market presence around 200 countries. Coca cola brands in India are Fanta, Maaza, Limca,
sprite, Thums up, Minute Maid, Nimbu fresh, Nested iced tea etc.
Price
Due to the availability of wide range products the pricing is done according to the market and geographic
segment. Each sub-brand of coca cola has different pricingstrategy. Their pricing strategy is based on the
competitors pricing, Pepsi is the direct competitor to coke. Beverage market is said to be a oligopoly market
(few sellers and large buyers), hence they form into cartel contract to ensure a mutual balance in pricing
between the sellers.
Place
Coca cola is the world’s most favorite brand and is available all over the world. The distribution system of
coca cola follows the FMCG distribution pattern. The effective distribution network of coke has almost
eroded the small and middle level players in the market. In India they have captured even the rural market
by extensive distribution and have eroded the market share of Bovonto, Kalimark etc.
PAO BBA CU 17

Promotion
Coca cola adopts various advertising and promotional strategies to create an increased demand in the mar-
ket by associating with life style and behaviour and mainly targeting value based advertising. You are more
likely to see a coke ad individualised for a particular festival or in with a general positive message. Coca cola
uses CSR as its marketing tool to gain emotional benefits in consumers mind. The current promotions
through CSR include “Support my school” campaign with NDTV. It has many brand ambassadors like
Shahrukh khan, Hrithik Roshan, South Indian Actor Vijay and Trisha , Ghambir, Aamir khan etc and has
signed contract recently with Imran khan. It allows price discounts and allowances to distributors and retail-
ers in order to push more products into the market. It employs both push strategy through promotions and
pull strategy through advertisements and campaigns.
Marketing Mix: Product, Price, Place, and Promotion
PAO BBA CU 17
PAO BBA CU 17

GAP
The GAP ModelThe Service Quality Model, also known as the GAP Model, was developed in 1985. It highlights the main requirements for delivering a high level of service quality by identifying five ‘gaps' that can lead to unsuccessful delivery of service.
The diagram shows the different gaps in the model, including the Knowledge Gap discussed here.Customers generally have a tendency to compare the service they 'experience' with the service they 'expect' to receive; thus, when the experience does not match the expectation, a gap arises.
Customers compare the service they 'experience' with what they 'expect' and when it does not match the expectation, a gap arises.
TERMSService QualityA term which describes a comparison of a customer's expectations as it relates to a company's performance.Service quality modelHighlights the main requirements for delivering high service quality; it identifies five ‘gaps' that cause unsuccessful delivery.
GAP VERSION1
PAO BBA CU 17

Today’s consumer has become increasingly demanding. They not only want high quality products but they also expect high quality customer service. Even manufactured products such as cars, mobile phones and computers cannot gain a strategic competitive advantage through the physical products alone. From a consumer’s point of view, customer service is considered very much part of the product.
Delivering superior value to the customer is an ongoing concern of Product Managers. This not only includes the actual physical product but customer service as well. Products that do not offer good quality customer service that meets the expectations of consumers are difficult to sustain in a competitive market.SERVQUAL (service quality gap model) is a gap method in service quality measurement, a tool that can be used by Product Manager across all industries. The aim of this model is to:Identify the gaps between customer expectation and the actual services provided at different stages of service delivery
Close the gap and improve the customer serviceThis model developed by Parasuraman, Zeithalm and Berry in 1985 identifies five different gaps:
The Customer Gap: The Gap between Customer Expectations and Customer PerceptionsThe customer gap is the difference between customer expectations and customer perceptions. Customer expectation is what the customer expects according to available resources and is influenced by cultural background, family lifestyle, personality, demographics, advertising, experience with similar products and information available online. Customer perception is totally subjective and is based on the customer’s interaction with the product or service. Perception is derived from the customer’s satisfaction of the specific product or service and the quality of service delivery. The customer gap is the most important gap and in an ideal world the customer’s expectation would be almost identical to the customer’s perception.In a customer orientated strategy, delivering a quality service for a specific product should be based on a clear understanding of the target market. Understanding customer needs and knowing customer expectations could be the best way to close the gap.
The Knowledge Gap: The Gap between Consumer Expectation and Management PerceptionThe knowledge gap is the difference between the customer’s expectations of the service provided and the company’s provision of the service. In this case, managers are not aware or have not correctly interpreted the customer’s expectation in relation to the company’s services or products. If a knowledge gap exists, it may mean companies are trying to meet wrong or non-existing consumer needs. In a customer-orientated business, it is important to have a clear understanding of the consumer’s need for service. To close the gap between the consumer’s expectations for service and management’s perception of service delivery will require comprehensive market research.
The Policy Gap: The Gap between Management Perception and Service Quality SpecificationAccording to Kasper et al, this gap reflects management’s incorrect translation of the service policy into rules and guidelines for employees. Some companies experience difficulties translating consumer expectation into specific service quality delivery. This can include poor service design, failure to maintain and continually update their provision of good customer service or simply a lack of standardisation. This gap may see consumers seek a similar product with better service elsewhere.
The Delivery Gap: The Gap between Service Quality Specification and Service DeliveryThis gap exposes the weakness in employee performance. Organisations with a Delivery Gap may specify the service required to support consumers but have subsequently failed to train their employees, put good processes and guidelines in action. As a result, employees are ill equipped to manage consumer’s needs. Some of the problems experienced if there is a delivery gap are:Employees lack of product knowledge and have difficulty managing customer questions and issuesOrganisations have poor human resource policiesLack of cohesive teams and the inability to deliver
PAO BBA CU 17
The Communication Gap: The Gap between Service Delivery and External CommunicationsIn some cases, promises made by companies through advertising media and communication raise customer expectations. When over-promising in advertising does not match the actual service delivery, it creates a communication gap. Consumers are disappointed because the promised service does not match the expected service and consequently may seek alternative product sources.
Case Study: Amazon.comAmazon.com provides books, movies, music and games along with electronics, toys, apparel, sports, tools, groceries and general home and garden items. Amazon is a good example of an online business that tries to close the service gaps in order to thoroughly meet consumer expectations.Understanding Customer NeedsFrom the time the consumer starts to shop at Amazon’s online store, Amazon will attempt to understand their expectations. From when a customer first makes a product selection Amazon creates a consumer profile and attempts to offer alternative goods and services that may delight the consumer. The longer the consumer shops at Amazon, the more the company attempts to identify their preferences and needs.Customer Defined StandardsWhen a consumer buys a product from Amazon they selects the mode of delivery and the company tells them the expected number of days it will take to receive their merchandise.For example: standard shipping is three to five days but shipping in one or two days is also available. The company has set standards for how quickly customers are informed when a product is unavailable (immediately), how quickly customers are notified whether an out of print book can be located (three weeks), how long customers are able to return items (30 days) and whether they pay return shipping costs.These standards exist for many activities at Amazon from delivery to communication to service recovery.Service PerformanceApart from defining their service delivery, Amazon goes one step further and delivers on its promises. Amazon performs! Orders often arrive ahead of the promised dates; orders are accurate and are in excellent condition because of careful shipping practice.Customers can track packages and review previous orders at any time. Amazon also makes sure that all its partners who sell used and new books and other related items meet Amazon’s high standards. The company verifies the performance of each purchase by surveying the customer and posting scores that are visible to other customers.Managing promises is handled by clear and careful communication on the website. Every page is very easy to understand and to navigate.For example the page dealing with returns eliminates customer misunderstanding by clearly spelling out what can be returned. The page describes how to repack items and when refunds are given. The customer account page shows all previous purchases and exactly where every ordered item is in the shipping processAmazon strategy has been well received by its customers and the Amazon brand is known worldwide.
ConclusionEffective product management is a complex undertaking which includes many different strategies, skills and tasks. Product managers plan for creating the best products and operational excellence to maximize customer satisfaction, loyalty and retention. Recognising and closing gaps offers high quality customer service to the consumer and helps them to achieve their goal whilst maximising market position, market share and financial results through customer satisfaction. It also helps managers to identify areas of weakness and make improvements to a company’s service delivery.Check out our blog post on “The Value Curve: visualising the value proposition”. This tool allows product managers to take information gleaned from gap analysis to develop or refine products that are both compelling to customers and distinct from competitors.
PAO BBA CU 17

5W2H
Describe the Problem: Specify the problem by identifying in quantifiable terms the who, what, where, when, why, how, and how many (5W2H) for the problem.
Current Process and how it can be improve
When working on improving a process this is a very simple tool to help you think thorough improvement opportunities.
Who does this? This can lead to, could we do it with less people?What is done at this step? This can lead to, can we eliminate some of the steps?When does this start and finish? This can lead to, can we shorten the time it takes?Where is this work done? This can lead to, can we do this elsewhere or in various locations?Why are we doing this? This can lead to, do we need to do this?How do we do this? This can lead to, is there another way to do this?How much does this cost? This can lead to, how much would this cost if we made these changes?
What: create adequate precise descripion.- Who: individuals associated with the problem?- When: at what moment, frequency?- Where: location(s) of the problem?- Why: already known explanations contributing to the problem?- How: mode, situation, procedure of the the problem?- How many: extent of problem, statistics?
PAO BBA CU 17

TOPIC 4: ORG?HRM/NEGO
Departmentalization involves the dividing of an organization into different departments, which perform tasks according to the departments' specializations in the organization. Departmentalization as a means of structuring an organization can be found in both public and private organizations.
Functional departmentalization - Grouping activities by functions performed. Activities can be grouped according to function (work being done) to pursue economies of scale by placing employees with shared skills and knowledge into departments for example human resources, IT, accounting, manufac-turing, logistics, and engineering. Functional departmentalization can be used in all types of organiza-tions.
Product departmentalization - Grouping activities by product line. Tasks can also be grouped according to a specific product or service, thus placing all activities related to the product or the service under one manager. Each major product area in the corporation is under the authority of a senior manager who is specialist in, and is responsible for, everything related to the product line. LA Gear is an example of company that uses product departmentalization. Its structure is based on its varied product lines which include women’s footwear etc.
Customer departmentalization - Grouping activities on the basis of common customers or types of cus-tomers. Jobs may be grouped according to the type of customer served by the organization. The as-sumption is that customers in each department have a common set of problems and needs that can best be met by specialists. The sales activities in an office supply firm can be broken down into three departments that serve retail, wholesale and government accounts.
Geographic departmentalization - Grouping activities on the basis of territory. If an organization's cus-tomers are geographically dispersed, it can group jobs based on geography. For example, the organiza-tion structure of Coca-Cola has reflected the company’s operation in two broad geographic areas – the North American sector and the international sector, which includes the Pacific Rim, the European Com-munity, Northeast Europe, Africa and Latin America groups.
Process departmentalization - Grouping activities on the basis of product or service or customer flow. Because each process requires different skills, process departmentalization allows homogenous activi-ties to be categorized. For example, the applicants might need to go through several departments namely validation, licensing and treasury, before receiving the driver’s license.
Divisional departmentalization - When the firm develops independent lines of business that operate as separate companies, all contributing to the corporation profitability, the design is call divisional de-partmentalization or (M-FORM). For example, the Limited. Inc., has these division: Th Limited, Express, Lerner New York, Lane Bryant and Mast Industries.
Owing to the complexity of tasks and the competitive environment in which organisations operate, they often use a combination of the above-mentioned methods in departmentalization.
Span of management
span of management refers to the number of subordinates that a manger can efficiently manage. Number
of subordinate directly reporting to a manager is known as span. Span of management is important for
Determining the complexity of an individual manager’s job and
PAO BBA CU 17

Determining shape and structure of the organization
Fewer the number of subordinates reporting to a manger larger the number of managers required. There-
fore span for control should be fixed.
Factors determining the span of management:
Capacity of manager: Each manager has different capacity and ability in terms of decision making, leader-
ship, communication, judgment, guidance and control etc. mangers having more abilities in respect to
these factors may have more number of subordinates.
Capacity of subordinates: capacity of subordinates also affects the span of a manager. Efficient and trained
subordinates may work without much help of their manager. They may just need broad guidelines and they
will perform accordingly. They would require lesser time from their superior due to which manager can
have large number of subordinates under him.
Nature of work: If subordinates are performing similar and repetitive routine work they can do their work
without having much time of the manager. Frequent changes in work would require more detailed instruc-
tions from manager whenever there is change in work. Type of technology used also affects the span of
control.
Degree of Decentralization: degree of centralization or decentralization affects the span by affecting the in-
volvement in decision making process. If manager clearly delegates his authority and defines it fully this
would require less time to devote to manage his subordinates as subordinates will take most of the actions
by their own. Hence manager can have wider span.
Degree of Planning: If the planning is effectively done particularly if standing plans procedures rules meth-
ods are clear then subordinates can make their decisions on their own. If they have to make their own
plans they would require more guidelines by superiors and manager can handle narrow span in the case of
improper planning.
Communication System: If communication system is modern i.e. tools like electronic devices will save time
of face to face interaction, which require more time, span of manager can be increased
Level of Management: level of management also affects the span. Higher the level of management lesser
the number of subordinates as higher level management does not have much time to supervise. They
spend their most of time in planning and other functions. Lower level managers can have wider span than
the higher level managers.
Physical location: If all the persons to be supervised are located at same place within the direct supervision
of manager, he can supervise more number of people. If subordinates are at different locations then man-
ager can supervise less number of spans.
PAO BBA CU 17

PAO BBA CU 17

FormAn organizational structure defines how activities such as task allocation, coordination and supervision are directed towards the achievement of organizational aims.[1] It can also be considered as the viewing glass or perspective through which individuals see their organization and its environment.
LINE - Business or industry structure with self-contained departments. Authority travels downwards from
top and accountability upwards from bottom along the chain of command, and each
department manager has control over his or her department's affairs and employees.
Staff and line are names given to different types of functions in organizations. A "line function" is one that directly advances an organization in its core work. This always includes production and sales, and sometimes also marketing.[1] A "staff function" supports the organization with specialized advisory and support functions. For example, human resources, accounting, public relations and the legal department are generally considered to be staff functions.[2] Both terms originated in the military.
A matrix organization structure is usually defined as one where there are multiple reporting lines – that is, people have more than one formal boss.
This may incorporate solid lines (direct strong reporting) and dotted lines (a weaker reporting relationship,
but still indicating some formal level of ‘right’ to the individual’s time) or it may mean multiple solid lines to
more than one boss.
At this level, the definition of a matrix organization structure is quite simple but there are many different
types of complex structure.
The matrix organizational structure is atypical because it brings together employees and managers from different departments to work toward accomplishing a goal. The matrix structure is a combination of the functional and divisional structures. The former divides departments within a company by the functions performed, while the latter divides them by products, customers or geographical location. Small business owners should understand the benefits and limitations of the matrix structure before implementing it in their businesses.
Efficient Information ExchangeOne of the advantages of implementing the matrix organizational structure in a business is that it can lead to an efficient exchange of information. Departments work closely together and communicate with each other frequently to solve issues. Efficient lines of communication enhance productivity and allow for quick decision-making. For example, in a matrix structure, individuals from the marketing, finance and product departments may confer with one another to formulate strategies. The specialized information exchange allows managers to respond quickly to the needs of customers and the organization.
Increased MotivationThe matrix structure encourages a democratic leadership style. This style incorporates the input of team members before managers make decisions. The ability to contribute valuable information before decisions are made leads to employee satisfaction and increased motivation. In a matrix structure, each employee brings his expertise to the table. Managers are involved in the day-to-day operations, which allows them to make decisions through the viewpoint of employees.
Related Reading: Advantages of Hybrid Organizational StructuresInternal Complexity
PAO BBA CU 17

A disadvantage of the matrix structure is that it can result in internal complexity. Some employees may be-come confused as to who their direct supervisor is. For example, an employee may receive different direc-tions concerning the same thing from supervisors in different departments. The dual authority and commu-nication problems may cause division among employees and managers. Miscommunication and ineffective managing can result in employee dissatisfaction and low morale. Prolonged issues may cause an organiza-tion to experience high employee turnover.
Expensive to Maintain and Internal ConflictAnother disadvantage of the matrix organizational structure is that it is expensive to maintain. A company's overhead cost typically increases because of the need for double management. The extra salaries an orga-nization must pay can put a strain on its resources. The sharing of employees may cause unhealthy compe-tition between managers within a company. The expertise that employees bring to the table makes them valuable, which causes managers to seek their assistance. The competition for scare resources may cause hostility within the workplace and hinder production.
TOPIC5: FN AND ECO
What are the differences between financial and economic analysis?Posted on May 19, 2013 by AdminAPFMFinancial and economic analyses have similar features. Both estimate the net-benefits of a project invest-ment based on the difference between the with-project and the without-project situations. However, the financial analyses of the project compare benefits and costs to the enterprise, while the economic analyses compare the benefits and costs to the whole economy.
While financial analysis uses market prices to check the balance of investment and the sustainability of project, economic analysis uses economic price that is converted from the market price by excluding tax, profit, subsidy, etc. to measure the legitimacy of using national resources to certain project. Financial and economic analyses also differ in their treatment of external effects (benefits and costs), such as favorable effects on health.
PAO BBA CU 17

Suppose my wife and I are trying to coodinate when to reach home. If I go home and she is late, then I waste time. Same if she goes home and I go late, she wastes time. The Nash equilibrium occurs when both of us reach home early enabling us to spend time together or both of us working late making more money. These two circle points are the Nash equilibria.
[This is called a payoff matrix that shows how many points each player gets if a particular strategy is taken. For instance, if I go home and she goes home early (top-left quadrant) we both get 3 points. On the other hand if I work late and she comes home, I get two points, while she gets only 1 as she is bored.]
By mathematically proving that there exists at least one such equilibrium point in any such game, Nash helped economists, politicians, bureacrats and business strategists understand the world around us in a better way. It formed the basis of many strategies we see around the world. It also indirectly showed how different players can dance to the tune even without the need for contracts.
There can be multiple equilibria in a game. Each equilibrium point is like a lock out of which no player will be able to escape easily. For instance, India and Pakistan can fight each other like cats & dogs to infinity or an equilibrium where they can collaborate in a virtuous loop. When the players are locked into a bad position (such as an arms race) it is called the Pareto inferior equilibrium.
To sum it up, the simplicity of Nash equilibrium enabled the growth of game theory as a legitimate discipline and enabled strategists & regulators to model their environment better.Suppose my girlfriend and I have both lost our cell phones and cannot contact each other. Both of us would really like to spend more time at home with each other (utility 3). But both of us also have a slight preference in favor of working late and earning some overtime (utility 2). If I go home and my girlfriend's there and I can spend time with her, great. If I stay at work and make some money, that would be pretty okay too. But if I go home and my girlfriend's not there and I have to sit around alone all night, that would be the worst possible outcome (utility 1). Meanwhile, my girlfriend has the same set of preferences: she wants to spend time with me, she'd be okay with working late, but she doesn't want to sit at home alone.
This “game” has two Nash equilibria. If we both go home, neither of us regrets it: we can spend time with each other and we've both got our highest utility. If we both stay at work, again, neither of us regrets it: since my girlfriend is at work, I am glad I stayed at work instead of going home, and since I am at work, my girlfriend is glad she stayed at work instead of going home. Although we both may wish that we had both gone home, neither of us specifically regrets our own choice, given our knowledge of how the other acted.
PAO BBA CU 17

The Revised Game–Simultaneous Play (No Knowledge of Action)
The game will illustrate the benefit to limiting knowledge through simultaneous play. Because neither knows exactly the other response, each will be forced to mix strategies. The result is higher average payouts–for both businesses. This is very useful if the game is repeated or played over several products.
Simultaneous play can be represented by a matrix:
The key feature is there is no pure strategy Nash equilibrium. If you try to figure out the best response, you’ll end up with a cycle:
— “low-margin” is best responded by “match”, which is best responded by “high-margin”, which is best responded by “imitate”, which is best responded by “low-margin”, and so onâ€
The situation is similar to the game of rock-paper-scissors. Every action is best responded by another action and players are never happy to stay put in one given outcome.
What’s the answer? Like rock-paper-scissors, both players need to randomize strategies.
How do they do that? They will randomly choose actions until the opponent is indifferent between the pure strategy choices. An illustration: when you pick rock-paper-scissors in equal frequency, your opponent will win 1/3 of the time for the pure strategies of rock, paper, or scissors.
In other games, the probability weights might not be equal. In this game, it turns out that player 1 will pick L with probability 2/3 (and Hwith probability 1/3) and player 2 will pick I with probability 1/3 (andM with probability 2/3).
I’ve included the equations at the end for completeness, as I won’t go through the math here.
When all is said and done, both players will mix between their choices. What this does is it allows for some of the higher payoff outcomes to be included for both players. Sometimes players 1 or 2 capture the market entirely, and sometimes player 1 and 2 split the high and low outcomes.They are not stuck in the one choice of splitting the low-margin market.
As a consequence, the payoff to each player increases 33 percent from 1 million dollars to 1.33 million dollars.
I guess it can be better not to know. Ignorance can be business bliss
PAO BBA CU 17

PAO BBA CU 17