Embed Size (px)
Citation preview
Fast fMRI can detect oscillatory neural activityin humansLaura D. Lewisa,b,1, Kawin Setsompopb,c, Bruce R. Rosenb,c, and Jonathan R. Polimenib,c
aSociety of Fellows, Harvard University, Cambridge, MA 02138; bAthinoula A. Martinos Center for Biomedical Imaging, Massachusetts General Hospital,Boston, MA 02129; and cDepartment of Radiology, Harvard Medical School, Boston, MA 02114
Edited by Peter A. Bandettini, National Institute of Mental Health/NIH, Bethesda, MD, and accepted by Editorial Board Member Leslie G. UngerleiderSeptember 16, 2016 (received for review May 22, 2016)
Oscillatory neural dynamics play an important role in the coordinationof large-scale brain networks. High-level cognitive processes dependon dynamics evolving over hundreds of milliseconds, so measuringneural activity in this frequency range is important for cognitiveneuroscience. However, current noninvasive neuroimaging methodsare not able to precisely localize oscillatory neural activity above0.2 Hz. Electroencephalography and magnetoencephalography havelimited spatial resolution, whereas fMRI has limited temporal resolu-tion because it measures vascular responses rather than directlyrecording neural activity. We hypothesized that the recent develop-ment of fast fMRI techniques, combined with the extra sensitivityafforded by ultra-high-field systems, could enable precise localizationof neural oscillations. We tested whether fMRI can detect neuraloscillations using human visual cortex as a model system. Wedetected small oscillatory fMRI signals in response to stimuli oscillat-ing at up to 0.75 Hz within single scan sessions, and these responseswere an order of magnitude larger than predicted by canonical linearmodels. Simultaneous EEG–fMRI and simulations based on a biophys-ical model of the hemodynamic response to neuronal activity sug-gested that the blood oxygen level-dependent response becomesfaster for rapidly varying stimuli, enabling the detection of higherfrequencies than expected. Accounting for phase delays across voxelsfurther improved detection, demonstrating that identifying vasculardelays will be of increasing importance with higher-frequency activ-ity. These results challenge the assumption that the hemodynamicresponse is slow, and demonstrate that fMRI has the potential tomap neural oscillations directly throughout the brain.
oscillations | hemodynamics | imaging | BOLD
Neuronal information processing is shaped by ongoing oscil-latory activity, which modulates excitability in neuronal
populations and supports the coordination of large-scale brainnetworks (1–3). In particular, the occurrence of low-frequencydynamics (0.1–2 Hz) within specific cortical regions has beensuggested as a key mechanism underlying perception, attention,and awareness (4, 5), because conscious processes typically evolveon the timescale of hundreds of milliseconds (6) and may dependon cortical dynamics in this frequency range. Localizing >0.1-Hzoscillatory dynamics in the human brain is an essential step towardunderstanding the mechanisms of the many high-level cognitiveprocesses that occur on these timescales. Studies of the spatialproperties of neural oscillations in human subjects have beenfundamentally limited by the ill-posed inverse problem of elec-tromagnetic recordings: It is not possible to reconstruct the neuralgenerators of EEG and magnetoencephalography (MEG) signalsunambiguously, and signals from deep subcortical structures arerarely detected. Noninvasive neuroimaging approaches that candetect >0.1-Hz oscillations with higher spatial resolution are neededto advance studies of large-scale brain network function.We hypothesized that recent technical advances in fMRI could
potentially enable direct localization of neural oscillations in thehuman brain. fMRI measures brain function by tracking focalchanges in blood flow and oxygenation and therefore is an indirectmeasure of neuronal activity, with spatial and temporal specificity
intrinsically limited by the precision and responsiveness of the co-ordinated regulation of blood delivery in the brain (7, 8). TypicalfMRI experiments use stimuli or tasks designed to elicit large, easilydetectable hemodynamic responses, which lag the onset of neuronalactivation by several seconds, suggesting that these hemodynamicsignals are too slow to capture many aspects of ongoing neuronalactivity. However, new MRI technologies available in recent years,such as ultrahigh magnetic field systems, provide boosts in sensi-tivity, enabling more naturalistic stimulation paradigms that perturbthe vasculature only weakly.In addition to improvements in sensitivity, the recent development
of methods for simultaneous multislice (SMS) imaging (9–13) allowswhole-brain fMRI to be performed at relatively fast acquisition rates(<1 s). However, the temporal resolution of fMRI has generally beenthought to be limited by the sluggishness of the hemodynamic re-sponse itself rather than by data-acquisition rates. The slow dynamicsof the hemodynamic response function (HRF) result in strong at-tenuation of high-frequency neural activity (14). In addition, rapidlyrepeating neural stimuli typically result in smaller fMRI responses(15–20), further limiting the detectability of neural oscillations.The detection of patterns that are periodic in nature, rather than
irregular, is particularly challenging (14). The fMRI response toperiodic (nonjittered) stimuli declines rapidly with increasing fre-quency and has been detected down to a limit of a 6.7-s (21) or 4-s(22) period. Because of the strong attenuation of high-frequencyoscillatory signals, event-related fMRI paradigms that use relativelyshort interstimulus intervals (ISIs) typically either jitter the ISIs oralternate between different stimulus conditions (14, 23). These
Significance
A major challenge in neuroscience is our limited ability to imageneural signals noninvasively in humans. Oscillations in brain ac-tivity are important for perception, attention, and awareness,and progress in cognitive neuroscience depends on localizingthese patterns. fMRI is thought to be too slow to measure brainoscillations because it depends on slow changes in blood flow.Here, we use recently developed imaging techniques to showthat fMRI can measure faster neural oscillations than previouslythought, and responses are 10 times larger than expected. Withcomputational modeling and simultaneous electroencephalog-raphy we show that vascular responses are surprisingly fastwhen brain activity fluctuates rapidly. These results suggest thatfMRI can be used to track oscillating brain activity directly duringhuman cognition.
Author contributions: L.D.L., K.S., B.R.R., and J.R.P. designed research; L.D.L. and J.R.P.performed research; L.D.L. analyzed data; and L.D.L. and J.R.P. wrote the paper.
The authors declare no conflict of interest.
This article is a PNAS Direct Submission. P.A.B. is a Guest Editor invited by the EditorialBoard.
Freely available online through the PNAS open access option.1To whom correspondence should be addressed. Email: [email protected].
This article contains supporting information online at www.pnas.org/lookup/suppl/doi:10.1073/pnas.1608117113/-/DCSupplemental.
www.pnas.org/cgi/doi/10.1073/pnas.1608117113 PNAS | Published online October 11, 2016 | E6679–E6685
NEU
ROSC
IENCE
PNASPL
US

experimental design choices are made in part to lower the fun-damental frequency being studied. In general, the fact that fMRItemporal resolution is limited by slow neurovascular coupling hasrestricted the majority of fMRI studies to studying dynamics in the<0.1-Hz range, because periodic oscillations above that frequencyrange are expected to be vanishingly small.Despite this evidence, recent studies performed during the
resting state have suggested that there are significant neuronallydriven blood oxygenation level-dependent (BOLD) contributionsto fMRI signals at frequencies above 0.1 Hz (24–27). However, achallenge in interpreting fMRI oscillatory dynamics measuredduring the resting state is that the underlying brain activity is notknown. Electrophysiology studies have demonstrated a link be-tween infraslow (<0.1 Hz) EEG activity and the fMRI signal (28,29), but such studies have not been performed at higher frequen-cies. In the absence of neurophysiological recordings, it is difficultto ascertain the degree to which the >0.1-Hz fMRI signals aregenerated by >0.1-Hz neural activity or instead reflect other he-modynamic and physiological processes.This study aimed to determine whether fMRI signals contain
neurally generated oscillatory content above 0.2 Hz and to de-termine the frequency response to ongoing periodic neural ac-tivity. To link the dynamics of the fMRI signal to underlyingneural activity, we examined the fMRI response in the context ofa known, stimulus-induced neural oscillation and used rapid dataacquisition [repetition time (TR) <300 ms] to sample the fMRIoscillatory response directly. We found that fMRI oscillations ofup to 0.75 Hz can be detected and that the amplitude of theseoscillations is an order of magnitude larger than predicted bycanonical models. Using simultaneous EEG–fMRI and model-based simulations, we studied the link between neural activity,neurovascular coupling, and the BOLD signal to determine howfast fMRI responses are generated.
ResultsCanonical Linear Models Predict Undetectable fMRI Oscillations at0.5 Hz. We used a flickering checkerboard stimulus whose lumi-nance contrast oscillated at a frequency of interest, driving neuronaloscillations in human primary visual cortex (V1) and enabling us toquantify the fMRI response to a controlled oscillation with a knownfrequency (Fig. 1A).We first performed simulations of the predicted fMRI response
to neural oscillations at each frequency by convolving the idealizedneuronal activity (the sinusoidal stimulus waveform) with either thecanonical two-gamma HRF used in SPM software, a single-gammafunction, or the double-gamma HRF (Fig. 1B) described by Glover(30). The predicted response was estimated as the amplitude of theconvolved response once it reached a plateau value (Fig. 1C), dis-carding the initial transient response. The predicted response am-plitude declined exponentially with increasing frequency for allthree models (Fig. 1D and Fig. S1A). The amplitude of the fMRIresponse to a 0.5-Hz neural oscillation was predicted to be 0.8–1.3%of the response to a 0.2-Hz oscillation, suggesting that resolvingfMRI signals at delta-range frequencies could be quite challenging.We next added nonlinear effects to the hemodynamic model, be-cause at short ISIs the fMRI response becomes both smaller inamplitude and broader (15, 16, 20), and observed that this nonlin-earity is predicted to yield even more temporal smoothing and afurther reduction in fMRI signal at higher frequencies (Fig. 1E).However, these models were developed to describe task-evokedactivity in response to individual stimuli with long durations duringblock-design experiments, whereas periodic continuous neural ac-tivity, which may be closer to that observed in typical naturalisticcontexts, could potentially elicit different hemodynamic responses.
fMRI Oscillations at 0.5 Hz Are an Order of Magnitude Larger thanExpected. To test whether fMRI can detect neural oscillationsdirectly, we acquired fMRI data at 3 T using fast temporal
sampling (TR ≤280 ms) and analyzed the mean response in V1during the oscillatory visual stimulus (Fig. 2 A and B). We av-eraged the mean time series across all voxels in the region ofinterest (ROI) on every cycle of the stimulus contrast oscillation,discarding the first 3–10 cycles to avoid transient effects (SIMethods). The resulting plot shows a stimulus-triggered averageof the fMRI data. In experiment 1, we found a robust oscillationin response to the visual stimulation at 0.2 Hz, with an amplitudeof 0.73% [95% confidence interval (CI) 0.55, 0.92] (Fig. 2C). Asthe stimulus frequency increased, we continued to find signifi-cant oscillatory responses, with an amplitude of 0.21% (CI 0.09,0.33) at 0.33 Hz (Fig. 2D) and an amplitude of 0.06% at 0.5 Hz(CI 0.04, 0.09) (Fig. 2E). The induced oscillations also could beseen in the power spectrum of the V1 BOLD signal (Fig. S2),although the evoked analysis (Fig. 2C) enabled a better estima-tion of oscillation amplitude because it reduced the contributionof non–phase-locked noise. To ensure the replicability of theseresponses, we conducted a second experiment using SMS imag-ing to double the number of slices acquired. We again foundrobust induction of oscillatory responses in V1 when stimulationwas delivered at 0.2, 0.33, or 0.5 Hz (Fig. 2 F–H) at similaramplitudes (0.2 Hz = 1.05%, CI 0.83, 1.31; 0.33 Hz = 0.28%, CI0.15, 0.41; 0.5 Hz = 0.08%, CI 0.04, 0.13). The phase of theresponse was shifted at higher frequencies, as expected becauseof the filtering induced by the hemodynamic response (Fig. S1 Band C). Although the response amplitude was small at higher
0 5 10 15 20 25
0
1
Time (s)
Nor
mal
ized
am
plitu
de
HRFs used for simulations
GammaSPM
Glover 1999
GammaSPM
Glover
Checkerboard contrast
... 240 seconds for each run
Contrast modulation at 0.2 Hs, 0.33 Hz, or 0.5 Hz
A
B C
D E
0.1 0.2 0.3 0.4 0.5
0.2
0
0.4
0.6
0.8
1Predicted frequency response Predicted frequency response
Am
plitu
de o
f os
cilla
tory
res
pons
e
Am
plitu
de o
f os
cilla
tory
res
pons
e
Stimulus frequency (Hz)10-1
100
101
102
103 Linear (SPM HRF)Nonlinear
0.1 0.2 0.3 0.4 0.5Stimulus frequency (Hz)
Time (s)0 50 100
osci
llatio
nam
plitu
de
transient am
plitude
Predicted response(SPM HRF)
Stimulus
transient plateau
Sample stimulus frames
Fig. 1. Linear canonical models predict that the fMRI response to oscillatoryneural activity will decrease exponentially as the oscillation frequency in-creases. (A) Diagram of the visual stimulus. The luminance contrast of aflickering radial checkerboard was modulated at 0.2, 0.33, 0.5, or 0.75 Hz.(B) Time course of the HRFs used for simulations. (C) Example of the pre-dicted fMRI response to sinusoidally oscillating neural activity. As the fre-quency increases, the predicted response reaches a stable plateau, and theoscillation amplitude around that plateau becomes small. (D) Predicted fMRIresponse across stimulation frequencies. The predicted response declinesexponentially for all HRFs. (E) The predicted fMRI response on a log scale fora linear system and for a sample set of nonlinear parameters shows thatnonlinear adaptation effects would be expected to reduce the fMRI re-sponse amplitude further at high stimulus frequencies.
E6680 | www.pnas.org/cgi/doi/10.1073/pnas.1608117113 Lewis et al.
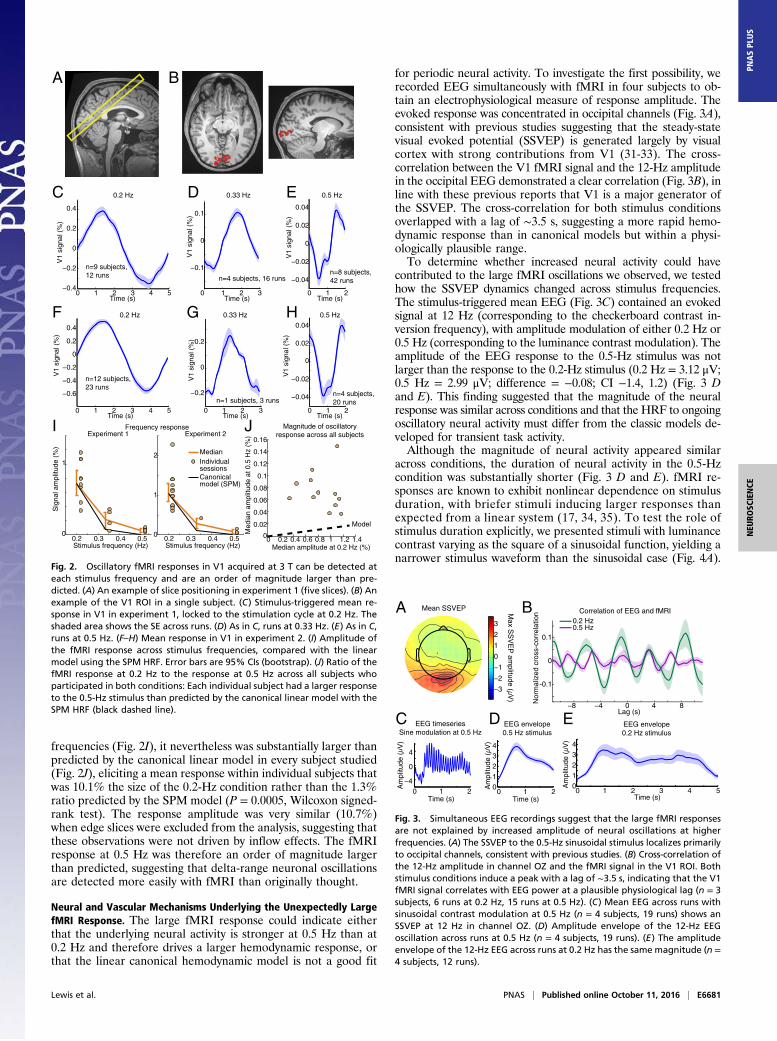
frequencies (Fig. 2I), it nevertheless was substantially larger thanpredicted by the canonical linear model in every subject studied(Fig. 2J), eliciting a mean response within individual subjects thatwas 10.1% the size of the 0.2-Hz condition rather than the 1.3%ratio predicted by the SPM model (P = 0.0005, Wilcoxon signed-rank test). The response amplitude was very similar (10.7%)when edge slices were excluded from the analysis, suggesting thatthese observations were not driven by inflow effects. The fMRIresponse at 0.5 Hz was therefore an order of magnitude largerthan predicted, suggesting that delta-range neuronal oscillationsare detected more easily with fMRI than originally thought.
Neural and Vascular Mechanisms Underlying the Unexpectedly LargefMRI Response. The large fMRI response could indicate eitherthat the underlying neural activity is stronger at 0.5 Hz than at0.2 Hz and therefore drives a larger hemodynamic response, orthat the linear canonical hemodynamic model is not a good fit
for periodic neural activity. To investigate the first possibility, werecorded EEG simultaneously with fMRI in four subjects to ob-tain an electrophysiological measure of response amplitude. Theevoked response was concentrated in occipital channels (Fig. 3A),consistent with previous studies suggesting that the steady-statevisual evoked potential (SSVEP) is generated largely by visualcortex with strong contributions from V1 (31-33). The cross-correlation between the V1 fMRI signal and the 12-Hz amplitudein the occipital EEG demonstrated a clear correlation (Fig. 3B), inline with these previous reports that V1 is a major generator ofthe SSVEP. The cross-correlation for both stimulus conditionsoverlapped with a lag of ∼3.5 s, suggesting a more rapid hemo-dynamic response than in canonical models but within a physi-ologically plausible range.To determine whether increased neural activity could have
contributed to the large fMRI oscillations we observed, we testedhow the SSVEP dynamics changed across stimulus frequencies.The stimulus-triggered mean EEG (Fig. 3C) contained an evokedsignal at 12 Hz (corresponding to the checkerboard contrast in-version frequency), with amplitude modulation of either 0.2 Hz or0.5 Hz (corresponding to the luminance contrast modulation). Theamplitude of the EEG response to the 0.5-Hz stimulus was notlarger than the response to the 0.2-Hz stimulus (0.2 Hz = 3.12 μV;0.5 Hz = 2.99 μV; difference = −0.08; CI −1.4, 1.2) (Fig. 3 Dand E). This finding suggested that the magnitude of the neuralresponse was similar across conditions and that the HRF to ongoingoscillatory neural activity must differ from the classic models de-veloped for transient task activity.Although the magnitude of neural activity appeared similar
across conditions, the duration of neural activity in the 0.5-Hzcondition was substantially shorter (Fig. 3 D and E). fMRI re-sponses are known to exhibit nonlinear dependence on stimulusduration, with briefer stimuli inducing larger responses thanexpected from a linear system (17, 34, 35). To test the role ofstimulus duration explicitly, we presented stimuli with luminancecontrast varying as the square of a sinusoidal function, yielding anarrower stimulus waveform than the sinusoidal case (Fig. 4A).
0.2 Hz 0.33 Hz 0.5 Hz
n=8 subjects, 42 runs
n=12 subjects,23 runs
n=1 subjects, 3 runsn=4 subjects, 20 runs
n=4 subjects, 16 runs
n=9 subjects, 12 runs
V1
sign
al (
%)
V1
sign
al (
%)
−0.2
0
0.2
−0.4
−0.6
−0.2
0
0.2
0.4
Time (s) Time (s)Time (s)0 1 2 3 4 5 0 1 2 3 0 1 2
0
0 1 2 3 4 5 0 1 2 3 0 1 2
−0.04
−0.02
0.02
0.04
V1
sign
al (
%)
−0.4
−0.2
0
0.2
0.4
V1
sign
al (
%)
−0.1
0
0.1
V1
sign
al (
%)
−0.04
−0.02
0
0.02
0.04
V1
sign
al (
%)
Time (s) Time (s)Time (s)
0.2 Hz 0.33 Hz 0.5 Hz
0
0.02
0.04
0.06
0.08
0.1
0.12
0.14
0.16
Magnitude of oscillatory response across all subjects
Med
ian
ampl
itude
at 0
.5 H
z (%
)
Model
0 0.2 0.4 0.6 0.8 1 1.2 1.4Median amplitude at 0.2 Hz (%)
0
1
2
0
1
Sig
nal a
mpl
itude
(%
)
Stimulus frequency (Hz)0.2 0.3 0.4 0.5
Stimulus frequency (Hz)0.2 0.3 0.4 0.5
Frequency response
MedianIndividual sessionsCanonicalmodel (SPM)
Experiment 1 Experiment 2
A
C
F G H
I J
D E
B
Fig. 2. Oscillatory fMRI responses in V1 acquired at 3 T can be detected ateach stimulus frequency and are an order of magnitude larger than pre-dicted. (A) An example of slice positioning in experiment 1 (five slices). (B) Anexample of the V1 ROI in a single subject. (C) Stimulus-triggered mean re-sponse in V1 in experiment 1, locked to the stimulation cycle at 0.2 Hz. Theshaded area shows the SE across runs. (D) As in C, runs at 0.33 Hz. (E) As in C,runs at 0.5 Hz. (F–H) Mean response in V1 in experiment 2. (I) Amplitude ofthe fMRI response across stimulus frequencies, compared with the linearmodel using the SPM HRF. Error bars are 95% CIs (bootstrap). (J) Ratio of thefMRI response at 0.2 Hz to the response at 0.5 Hz across all subjects whoparticipated in both conditions: Each individual subject had a larger responseto the 0.5-Hz stimulus than predicted by the canonical linear model with theSPM HRF (black dashed line).
0 1 2 0 1Time (s)Time (s)
2
−4
0
4
01234
EEG timeseriesSine modulation at 0.5 Hz
EEG envelope0.5 Hz stimulus
EEG envelope0.2 Hz stimulus
Am
plitu
de (
V)
Am
plitu
de (
V)
0 1 2 3 4 5Time (s)
Lag (s)
0
1
2
3
4
Am
plitu
de (
V)
C
A B
D E
−3
−2
−1
0
1
2
3
Max S
SV
EP
amplitude (
V)
Mean SSVEP Correlation of EEG and fMRI0.2 Hz0.5 Hz
−8 −4 0 4 8
-0.1
0
0.1
Nor
mal
ized
cro
ss-c
orre
latio
n
Fig. 3. Simultaneous EEG recordings suggest that the large fMRI responsesare not explained by increased amplitude of neural oscillations at higherfrequencies. (A) The SSVEP to the 0.5-Hz sinusoidal stimulus localizes primarilyto occipital channels, consistent with previous studies. (B) Cross-correlation ofthe 12-Hz amplitude in channel OZ and the fMRI signal in the V1 ROI. Bothstimulus conditions induce a peak with a lag of ∼3.5 s, indicating that the V1fMRI signal correlates with EEG power at a plausible physiological lag (n = 3subjects, 6 runs at 0.2 Hz, 15 runs at 0.5 Hz). (C) Mean EEG across runs withsinusoidal contrast modulation at 0.5 Hz (n = 4 subjects, 19 runs) shows anSSVEP at 12 Hz in channel OZ. (D) Amplitude envelope of the 12-Hz EEGoscillation across runs at 0.5 Hz (n = 4 subjects, 19 runs). (E) The amplitudeenvelope of the 12-Hz EEG across runs at 0.2 Hz has the same magnitude (n =4 subjects, 12 runs).
Lewis et al. PNAS | Published online October 11, 2016 | E6681
NEU
ROSC
IENCE
PNASPL
US

The EEG recordings in the sine-squared condition had the samemagnitude as in the sinusoidal condition (amplitude = 3.12 μV)but had a narrower waveform (Fig. 4B), suggesting that thisstimulus paradigm successfully elicited neural activity of similarmagnitude but briefer temporal dynamics. Simulations predictedthat the sine-squared stimulus would elicit a 15% larger fMRIresponse than the sine stimulus at either stimulus frequency (Fig.4C). In contrast, the measured fMRI response to the sine-squaredstimulus was 49% larger (CI 24%, 81%) than the response to thesinusoidal stimulus in the 0.2-Hz stimulus condition (Fig. 4D) andwas 93% larger (CI 21%, 399%) in the 0.5-Hz stimulus condition(Fig. 4E). We concluded that ongoing oscillatory activity canproduce relatively large fMRI responses if the waveform of thatactivity is narrow.What mechanism could underlie the production of a large fMRI
response to >0.1-Hz oscillatory neural activity? A recent studyproposed that a faster HRF should be used for resting-state fMRIsignals (25). We hypothesized that a fast HRF also should be usedfor task-driven activity when neural activity varies rapidly andcontinuously. To test whether a similar modification to the HRFcould account for our data, we simulated the predicted fMRIresponse using HRFs with different shapes. Narrower HRFsproduced larger responses at high stimulus frequencies: An HRFpeaking at 2.5 s predicted a response at 0.5 Hz that is five timeslarger than the canonical SPM HRF (Fig. S3 A and B). In ad-dition, the 93% increase in fMRI signal observed for the sine-squared vs. sine modulation at 0.5 Hz could be generated if theHRF shape depends on the duration of the neural activity, be-cause an additional reduction of the HRF width would generatethis increase (Fig. S3B). A single parsimonious model in whichthe temporal dispersion of the HRF is linked to the timescale ofneural activity could therefore explain these data.
Biophysical Modeling of Oscillatory fMRI Responses. To test whetherthis narrower shape for the HRF is physiologically plausibleduring task-evoked neural activity, we implemented the balloonmodel (36–38) and examined its responses to a brief input. Weconsidered two possible factors that could contribute to a fasterHRF in this experiment: (i) whether brief neural activity in-duces a narrower fMRI response, as suggested by Fig. 4, and (ii)whether continuous, rather than transient, activity would affectthe shape of the response. To test the first possibility, we ex-amined the predicted responses to a single cycle of a sinusoidalflow input with increasing frequency (Fig. S3C). We varied thetime constant for the viscoelastic effect, in which blood volumetransiently lags before achieving steady state. Setting this timeconstant to zero, as in the original model, yielded slow BOLDresponses similar to the canonical HRF (Fig. 5A and Fig. S3D).However, when this time constant was set to physiologicallyplausible nonzero values (37), the BOLD response to stimuli ofshorter duration was both faster (time-to-peak) and narrower(FWHM) (Fig. 5A and Fig. S3E). These sharper dynamics dem-onstrate that when cerebral blood volume (CBV) lags changes incerebral blood flow (CBF) rather than maintaining a steady-staterelationship, the fMRI response to high frequencies or brief ac-tivity is expected to increase.Another possibility is that continuous periodic stimuli may
shift the system to a new steady state in which baseline flow ishigher and the system can respond more rapidly to changes inneural activity. Higher baseline flow would reduce the meantransit time, used as a time constant in the balloon model. Varyingthis parameter demonstrated that higher baseline flow would speedup the BOLD response (Fig. S3F), although the effects were lessthan those seen when the viscoelastic parameter was varied.However, values near 2 s, which would be consistent with priorreports (39), were sufficient to replicate the responses we observed,suggesting that as long as the mean transit time is relatively shortat baseline, these oscillations could be expected.When using the modified balloon model with these parameter
settings to simulate the response to the visual stimulus, we obtainedpredictions much closer to the data: The model predicted that thefMRI response amplitude to a 0.5-Hz stimulus should be 7.5% ofthe response to a 0.2-Hz stimulus (Fig. 5 B and C), compared with∼8–10% in the data (whereas the canonical model predicted1.3%). These analyses demonstrated that a physiologically groundedmodel can produce the responses we observed, through vis-coelastic effects that cause blood volume to lag while changes inflow vary more rapidly, leading to a sharpened HRF waveformwhen neural activity is brief. The large fMRI responses we ob-served therefore may be explained by a shift in the shape of the
1 2 3 4 5 600
0.5
1
Sine modulation
Time (s)
Time (s)
Sine-squaredmodulation
Stim
ulus
con
tras
t
0 1 2 3 4 5
Sine Sine-squared Sine Sine-squared
0 1 2
0
0.1
-0.1
Sig
nal (
%)
Sig
nal (
%)
fMRI responses to the 0.2 Hz stimulus fMRI responses to the 0.5 Hz stimulus
0 1Time (s)
20
1
2
3
4
EEG amplitude envelopeacross conditions
Am
plitu
de (
µV)
Predicted fMRI response with varying
neural waveform
0 1 2 3
0.4
0.6
0.8
1
Exponent of sinusoid
A
D
C
E
BStimulus contrast conditions
−1
0
1
Time (s) Time (s) Time (s)0 1 2 3 4 5
−1
0
1
0 1 2
0
0.1
-0.1
Sig
nal (
%)
Pre
dict
ed fM
RI a
mpl
itude
Fig. 4. Continuous and rapidly varying neural activity can elicit faster he-modynamic responses. (A) Schematic of the contrast modulation used in thesine vs. sine-squared conditions. In the sine-squared case, the same range ofcontrasts is used, but the waveform shape is narrower. (B) Envelope of theEEG signal. As expected, the magnitude of the EEG is similar across condi-tions, but the waveform of the EEG response is narrower in the sine-squaredcase, suggesting successful modulation of the waveform of the underlyingneural oscillation. (C) The predicted fMRI response to oscillating neural ac-tivity varies with its waveform but is expected to change less than 15% in therange of our stimulus parameters. (D) The fMRI response to a sine-squaredwave at 0.2 Hz is 49% larger than the response to a sine wave. (E) Similarly,the fMRI response to a sine-squared wave at 0.5 Hz is 93% larger than theresponse to a sine wave, demonstrating that narrower neural oscillationsdrive larger fMRI signals. The shaded region shows the SE across runs.
A B C
Fig. 5. Modeling suggests that the vasculature can respond relativelyquickly to oscillatory neural activity. (A) Predicted responses to a 1-s sine flowinput using different parameters for the balloon model. (B) The predictedfrequency response demonstrates that modifying the time constants withinphysiological values is expected to lead to an order-of-magnitude increase infMRI oscillatory responses. (C) The predicted amplitude at 0.5 Hz (normal-ized to 0.2 Hz), depending on balloon model parameters. Low but stillplausible values for the mean transit time (τMTT) and the increased visco-elastic constant (τv) lead to values closer to the data (∼8%, orange/red re-gion of the plot).
E6682 | www.pnas.org/cgi/doi/10.1073/pnas.1608117113 Lewis et al.

HRF, with continuous and rapidly varying neural activity inducinga sharper HRF and thereby leading to rapid fMRI responses.
Extending Detection of Oscillatory Activity up to 0.75 Hz. This modelalso allowed us to extrapolate and generate predictions of thefMRI response at even higher frequencies, predicting thatstimuli at 0.75 Hz would elicit a response 1.9% as large as theresponse at 0.2 Hz (as opposed to 0.14% predicted by the linearconvolutional model). Our experiments at 3 T were unable todetect a significant neural response to the 0.75-Hz oscillation(amplitude, 0.02%; CI –0.02, 0.06), because the noise was largerthan the predicted signal. To increase the signal-to-noise ratio,we conducted a third experiment at 7 T. We found a significantfMRI oscillation during 0.75-Hz stimulation (Fig. 6 A and B)with an amplitude of 0.021% (CI 0.009, 0.034). This value cor-responded to 1.46% of the signal at 0.2 Hz, i.e., slightly below theballoon model prediction but an order of magnitude larger thanthe canonical model. The phase of the response again was shiftedwithin a range that would be expected with physiologicallyplausible models (Fig. S4). To control for the possibility that thedetected oscillation was caused by a physiological or motionartifact rather than by neural activation, we analyzed a controlgray matter region that was not visually driven and observed nosignificant oscillation (amplitude, 0.002%; CI –0.006, 0.010) (Fig.6 C and D). In addition, the 0.75-Hz oscillation in V1 was stilldetectable when physiological noise was reduced through nui-sance regression of white matter and ventricle signals (Fig. S5).The magnitude of the observed response was small but never-theless was detectable within a single session of scanning at 7 T,suggesting that the fMRI response is measurable and larger thanpredicted even at 0.75 Hz.
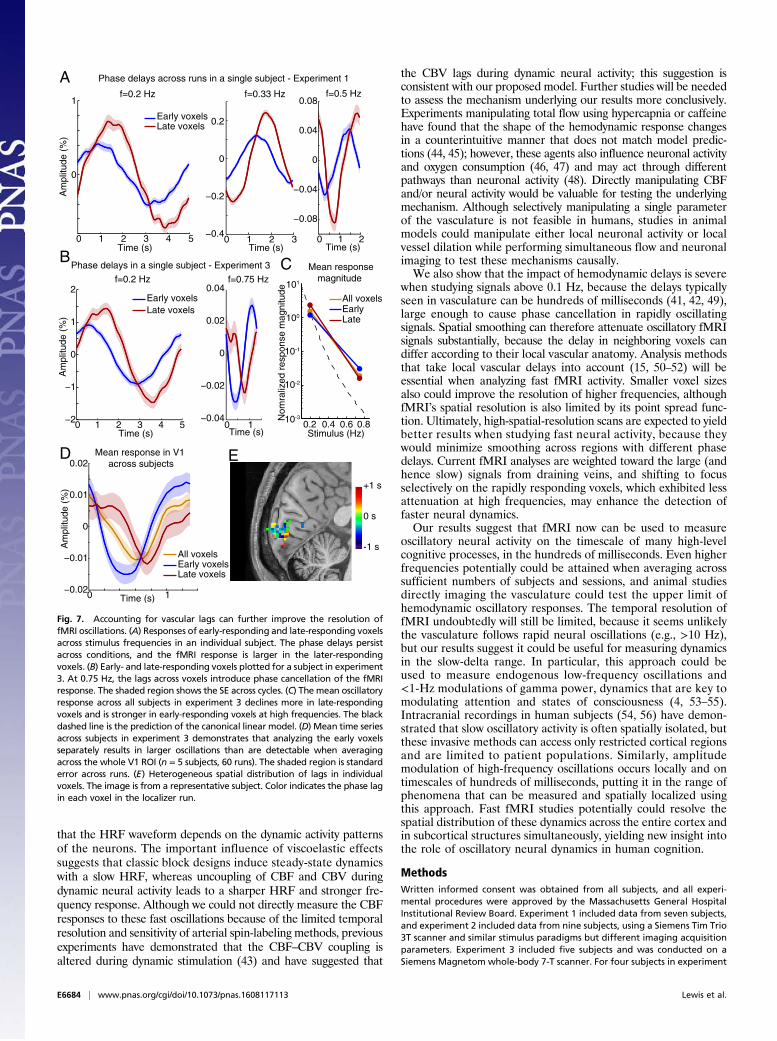
Accounting for Vascular Delays Improves Resolution of NeuralOscillations. The analyses described up to this point were aver-aged across all visually responsive voxels in V1, assuming similarresponse properties throughout that region. However, HRFsvary across the brain (40), and the structure of local vasculaturecan alter the timing of responses in individual voxels by hundredsof milliseconds (41). As stimulation frequencies approach 0.5 Hz(i.e., a period of 2 s), these delays can introduce cancellation intofMRI signals when averaging is performed across voxels. Wetherefore examined the response phase in individual voxels. Inthe localizer run, we selected voxels with the earliest peak re-sponse (in the 0–33rd percentile) and voxels with the latest peakresponse (in the 67th–100th percentile, median lag 635 ms). Wethen analyzed the response of these voxels on the other func-tional runs (Fig. 7A). In the 3-T experiments, the late-responding
voxels exhibited a signal 97% larger than the early-respondingvoxels in the 0.2-Hz condition (P = 0.0004) and 54% larger in the0.5-Hz condition (P = 0.02). Late and large-amplitude responsestypically correspond to larger draining veins (41), suggesting thateven large veins can contain periodic oscillatory signals at fre-quencies 0.2 Hz.The phase delays across voxels suggest that identifying and cor-
recting for hemodynamic delays could further improve the de-tection of oscillatory signals. In the 0.75-Hz condition, separatingearly- and late-responding voxels had a large impact, because theselags introduced major phase cancellation when averaged across allvoxels (Fig. 7B). The mean signal amplitude in the early-respondingvoxels alone was 0.033%, 45% larger than the results from aver-aging across all voxels within the ROI (Fig. 7C). Furthermore, thisresult was better aligned with the model prediction from the datagenerated at lower frequencies (0.027%). Overall, late-respondingvoxels exhibited a more severe drop-off in signal as stimulus fre-quency increased, and early-responding voxels exhibited slightlylarger responses at 0.75 Hz (Fig. 7D), suggesting that high-frequencyoscillatory activity may be detected more easily in voxels withrapid response onset. The oscillations in early-responding voxelswere also significant (P < 0.05) within a single scan session in threeof the five subjects, in addition to the mean being significant acrossthe group. The early- and late-responding voxels were spatiallyintermixed (Fig. 7E), suggesting that avoiding spatial smoothingduring preprocessing and then grouping individual voxels accordingto their lags in a localizer run before analysis can further improvethe detectability of high-frequency oscillations.
DiscussionWe conclude that the fMRI response to oscillatory neural activityis detectable up to at least 0.75 Hz within a single 7-T scan sessionin individual subjects, and higher frequencies may be detectablewith future gains in MRI sensitivity. The amplitude of the fMRIsignal at high frequencies is an order of magnitude larger thanpredicted by canonical linear models, suggesting that fMRI couldprovide a new method for noninvasively localizing oscillatoryneural activity in the human brain. The strong oscillatory re-sponses result from the faster dynamics of the BOLD responsewhen neural activity is continuous and rapidly varying, suggestingthat different models of the hemodynamic response should beused in studies seeking to analyze ongoing periodic activity orrapidly fluctuating activity rather than large, transient task-evokedactivations. The HRFs derived from these conventional block-design stimulation paradigms do not represent a true “impulseresponse” in the strict sense of the term; instead, for rapid stim-ulus presentations, the shape of the HRF varies as a function ofthe stimulus duration. The slow canonical hemodynamic responsefunctions may reflect the slow experimental paradigms used toobtain them, whereas hemodynamic responses to rapidly fluctu-ating neural activity are, in fact, fast. This interpretation also couldexplain the observations of previous studies that have reportednonlinear fMRI responses to short-duration stimuli (17, 25, 34,42). We suggest that, rather than representing a problem for fMRIbecause of the failure of the canonical linear models, these fastresponses in fact mean that fMRI has an unexpectedly strongability to measure naturalistic, rapidly varying neural activity.Updated models with faster HRFs may provide a generally betterrepresentation of the true hemodynamic response during high-level cognitive tasks, because it is likely that cortical activity typi-cally is ongoing at fluctuating rates rather than slowly alternatingbetween the silent and high firing rates that can be induced inprimary sensory cortices through a blocked experimental design.Our model suggests that both viscoelastic effects and a new
vascular baseline state during rapid neural activity could con-tribute to the fast dynamics we observed. The fact that increasingthe variability in neural firing rates through a narrower stimuluswaveform (Fig. 4) increased the fMRI response amplitude suggests
n=5 subjects, 5 runs
n=5 subjects, 5 runs
n=5 sub., 60 runs
n=5 subjects, 60 runs
Control ROI: 0.75 HzControl ROI: 0.2 HzV1: 0.75 HzV1: 0.2 Hz
Sig
nal c
hang
e (%
)
Time (s) Time (s) Time (s) Time (s)0 1 2 3 4 5
−1
0
1
0 1
−0.01
0
0.01
0 1 2 3 4 5−1
0
1
0 1
−0.01
0
0.01
A B C D
Fig. 6. fMRI responses can be detected reliably up to 0.75 Hz. (A) In ex-periment 3, at 7 T, oscillatory stimuli at 0.2 Hz evoked consistent and largeresponses. (B) At 0.75 Hz, the evoked oscillations were still statistically de-tectable and were ∼1% of the amplitude of the 0.2-Hz signal. (C and D) Anon-visually activated gray matter control ROI does not show oscillatoryresponses, suggesting that the detected oscillation is caused by neural ac-tivity rather than by motion or physiological noise. In all panels, the shadedregion shows the SE across runs.
Lewis et al. PNAS | Published online October 11, 2016 | E6683
NEU
ROSC
IENCE
PNASPL
US
that the HRF waveform depends on the dynamic activity patternsof the neurons. The important influence of viscoelastic effectssuggests that classic block designs induce steady-state dynamicswith a slow HRF, whereas uncoupling of CBF and CBV duringdynamic neural activity leads to a sharper HRF and stronger fre-quency response. Although we could not directly measure the CBFresponses to these fast oscillations because of the limited temporalresolution and sensitivity of arterial spin-labeling methods, previousexperiments have demonstrated that the CBF–CBV coupling isaltered during dynamic stimulation (43) and have suggested that
the CBV lags during dynamic neural activity; this suggestion isconsistent with our proposed model. Further studies will be neededto assess the mechanism underlying our results more conclusively.Experiments manipulating total flow using hypercapnia or caffeinehave found that the shape of the hemodynamic response changesin a counterintuitive manner that does not match model predic-tions (44, 45); however, these agents also influence neuronal activityand oxygen consumption (46, 47) and may act through differentpathways than neuronal activity (48). Directly manipulating CBFand/or neural activity would be valuable for testing the underlyingmechanism. Although selectively manipulating a single parameterof the vasculature is not feasible in humans, studies in animalmodels could manipulate either local neuronal activity or localvessel dilation while performing simultaneous flow and neuronalimaging to test these mechanisms causally.We also show that the impact of hemodynamic delays is severe
when studying signals above 0.1 Hz, because the delays typicallyseen in vasculature can be hundreds of milliseconds (41, 42, 49),large enough to cause phase cancellation in rapidly oscillatingsignals. Spatial smoothing can therefore attenuate oscillatory fMRIsignals substantially, because the delay in neighboring voxels candiffer according to their local vascular anatomy. Analysis methodsthat take local vascular delays into account (15, 50–52) will beessential when analyzing fast fMRI activity. Smaller voxel sizesalso could improve the resolution of higher frequencies, althoughfMRI’s spatial resolution is also limited by its point spread func-tion. Ultimately, high-spatial-resolution scans are expected to yieldbetter results when studying fast neural activity, because theywould minimize smoothing across regions with different phasedelays. Current fMRI analyses are weighted toward the large (andhence slow) signals from draining veins, and shifting to focusselectively on the rapidly responding voxels, which exhibited lessattenuation at high frequencies, may enhance the detection offaster neural dynamics.Our results suggest that fMRI now can be used to measure
oscillatory neural activity on the timescale of many high-levelcognitive processes, in the hundreds of milliseconds. Even higherfrequencies potentially could be attained when averaging acrosssufficient numbers of subjects and sessions, and animal studiesdirectly imaging the vasculature could test the upper limit ofhemodynamic oscillatory responses. The temporal resolution offMRI undoubtedly will still be limited, because it seems unlikelythe vasculature follows rapid neural oscillations (e.g., >10 Hz),but our results suggest it could be useful for measuring dynamicsin the slow-delta range. In particular, this approach could beused to measure endogenous low-frequency oscillations and<1-Hz modulations of gamma power, dynamics that are key tomodulating attention and states of consciousness (4, 53–55).Intracranial recordings in human subjects (54, 56) have demon-strated that slow oscillatory activity is often spatially isolated, butthese invasive methods can access only restricted cortical regionsand are limited to patient populations. Similarly, amplitudemodulation of high-frequency oscillations occurs locally and ontimescales of hundreds of milliseconds, putting it in the range ofphenomena that can be measured and spatially localized usingthis approach. Fast fMRI studies potentially could resolve thespatial distribution of these dynamics across the entire cortex andin subcortical structures simultaneously, yielding new insight intothe role of oscillatory neural dynamics in human cognition.
MethodsWritten informed consent was obtained from all subjects, and all experi-mental procedures were approved by the Massachusetts General HospitalInstitutional Review Board. Experiment 1 included data from seven subjects,and experiment 2 included data from nine subjects, using a Siemens Tim Trio3T scanner and similar stimulus paradigms but different imaging acquisitionparameters. Experiment 3 included five subjects and was conducted on aSiemens Magnetom whole-body 7-T scanner. For four subjects in experiment
A
E
+1 s
0 s
-1 s
0 1 2 3 4 5−2
−1
0
1
2
0 1−0.04
−0.02
0
0.02
0.04
Bf=0.2 Hz f=0.75 Hz
Phase delays in a single subject - Experiment 3
Time (s) Stimulus (Hz)Time (s)
Am
plitu
de (
%)
Late voxelsEarly voxels
CN
omra
lized
res
pons
e m
agni
tude
10-2
10-3
10-1
100
101
0.2 0.4 0.6 0.8
Late Early All voxels
Mean responsemagnitude
0 1 2 3 4 5 0 1 2
−0.08
−0.04
0
0.04
0.08
0 1 2 3Time (s) Time (s) Time (s)
Late voxelsEarly voxels
Am
plitu
de (
%)
f=0.2 Hz f=0.33 Hz f=0.5 Hz
Phase delays across runs in a single subject - Experiment 1
0
1
−0.4
−0.2
0
0.2
0 1
Am
plitu
de (
%)
Time (s)
D
−0.02
−0.01
0
0.01
0.02Mean response in V1
across subjects
Late voxelsEarly voxelsAll voxels
Fig. 7. Accounting for vascular lags can further improve the resolution offMRI oscillations. (A) Responses of early-responding and late-responding voxelsacross stimulus frequencies in an individual subject. The phase delays persistacross conditions, and the fMRI response is larger in the later-respondingvoxels. (B) Early- and late-responding voxels plotted for a subject in experiment3. At 0.75 Hz, the lags across voxels introduce phase cancellation of the fMRIresponse. The shaded region shows the SE across cycles. (C) The mean oscillatoryresponse across all subjects in experiment 3 declines more in late-respondingvoxels and is stronger in early-responding voxels at high frequencies. The blackdashed line is the prediction of the canonical linear model. (D) Mean time seriesacross subjects in experiment 3 demonstrates that analyzing the early voxelsseparately results in larger oscillations than are detectable when averagingacross the whole V1 ROI (n = 5 subjects, 60 runs). The shaded region is standarderror across runs. (E) Heterogeneous spatial distribution of lags in individualvoxels. The image is from a representative subject. Color indicates the phase lagin each voxel in the localizer run.
E6684 | www.pnas.org/cgi/doi/10.1073/pnas.1608117113 Lewis et al.

2 we also acquired a simultaneous EEG using an Electrical Geodesics 256-channelsystem. Visual stimuli consisted of a 12-Hz (inversion rate) flickering checkerboardwith luminance contrast modulation oscillating at the frequency of interest.Displayed fMRI time series show the mean fMRI data triggered on each cycle ofthe visual stimulus. Statistics for the magnitude of the fMRI oscillation werecomputedusinganonparametric bootstrap toestimate the95%CIs. Full details ofacquisition and analysis procedures are provided in SI Methods.
ACKNOWLEDGMENTS. This work was funded by the Athinoula A. MartinosCenter for Biomedical Imaging; NIH Grants K01-EB011498 and R01-EB019437(to J.R.P.); a Fellowship from the Harvard Society of Fellows (L.D.L.); NIHNational Institute of Biomedical Imaging and Bioengineering GrantP41-EB015896; and National Center for Research Resources Shared ResourceInstrumentation Grants S10-RR023401, S10-RR023403, S10-OD010759,and S10-RR020948.
1. Buzsáki G, Draguhn A (2004) Neuronal oscillations in cortical networks. Science304(5679):1926–1929.
2. Fries P (2005) A mechanism for cognitive dynamics: Neuronal communication throughneuronal coherence. Trends Cogn Sci 9(10):474–480.
3. Uhlhaas PJ, Singer W (2010) Abnormal neural oscillations and synchrony in schizo-phrenia. Nat Rev Neurosci 11(2):100–113.
4. He BJ, Raichle ME (2009) The fMRI signal, slow cortical potential and consciousness.Trends Cogn Sci 13(7):302–309.
5. Lakatos P, Karmos G, Mehta AD, Ulbert I, Schroeder CE (2008) Entrainment of neu-ronal oscillations as a mechanism of attentional selection. Science 320(5872):110–113.
6. Dehaene S, Changeux J-P (2011) Experimental and theoretical approaches to con-scious processing. Neuron 70(2):200–227.
7. O’Herron P, et al. (2016) Neural correlates of single-vessel haemodynamic responses invivo. Nature 534(7607):378–382.
8. Logothetis NK (2008) What we can do and what we cannot do with fMRI. Nature453(7197):869–878.
9. Larkman DJ, et al. (2001) Use of multicoil arrays for separation of signal from multipleslices simultaneously excited. J Magn Reson Imaging 13(2):313–317.
10. Feinberg DA, et al. (2010) Multiplexed echo planar imaging for sub-second wholebrain FMRI and fast diffusion imaging. PLoS One 5(12):e15710.
11. Moeller S, et al. (2010) Multiband multislice GE-EPI at 7 tesla, with 16-fold accelera-tion using partial parallel imaging with application to high spatial and temporalwhole-brain fMRI. Magn Reson Med 63(5):1144–1153.
12. Setsompop K, et al. (2012) Blipped-controlled aliasing in parallel imaging for simul-taneous multislice echo planar imaging with reduced g-factor penalty. Magn ResonMed 67(5):1210–1224.
13. Barth M, Breuer F, Koopmans PJ, Norris DG, Poser BA (2016) Simultaneous multislice(SMS) imaging techniques. Magn Reson Med 75(1):63–81.
14. Dale AM (1999) Optimal experimental design for event-related fMRI. Hum BrainMapp 8(2-3):109–114.
15. Friston KJ, Josephs O, Rees G, Turner R (1998) Nonlinear event-related responses infMRI. Magn Reson Med 39(1):41–52.
16. Huettel SA, McCarthy G (2000) Evidence for a refractory period in the hemodynamicresponse to visual stimuli as measured by MRI. Neuroimage 11(5 Pt 1):547–553.
17. Pfeuffer J, McCullough JC, Van deMoortele P-F, Ugurbil K, Hu X (2003) Spatial dependenceof the nonlinear BOLD response at short stimulus duration. Neuroimage 18(4):990–1000.
18. Birn RM, Bandettini PA (2005) The effect of stimulus duty cycle and “off” duration onBOLD response linearity. Neuroimage 27(1):70–82.
19. de Zwart JA, et al. (2009) Hemodynamic nonlinearities affect BOLD fMRI responsetiming and amplitude. Neuroimage 47(4):1649–1658.
20. Liu Z, et al. (2010) Linear and nonlinear relationships between visual stimuli, EEG andBOLD fMRI signals. Neuroimage 50(3):1054–1066.
21. Thomas CG, Menon RS (1998) Amplitude response and stimulus presentation frequency re-sponse of humanprimary visual cortex using BOLD EPI at 4 T.Magn ResonMed 40(2):203–209.
22. Bandettini PA, Cox RW (2000) Event-related fMRI contrast when using constant in-terstimulus interval: Theory and experiment. Magn Reson Med 43(4):540–548.
23. Dale AM, Buckner RL (1997) Selective averaging of rapidly presented individual trialsusing fMRI. Hum Brain Mapp 5(5):329–340.
24. Lin F-H, et al. (2015) Significant feed-forward connectivity revealed by high frequencycomponents of BOLD fMRI signals. Neuroimage 121(C):69–77.
25. Chen JE, Glover GH (2015) BOLD fractional contribution to resting-state functionalconnectivity above 0.1 Hz. Neuroimage 107(C):207–218.
26. Boubela RN, et al. (2013) Beyond noise: Using temporal ICA to extractmeaningful informationfrom high-frequency fMRI signal fluctuations during rest. Front Hum Neurosci 7:168.
27. Lee H-L, Zahneisen B, Hugger T, LeVan P, Hennig J (2013) Tracking dynamic resting-statenetworks at higher frequencies using MR-encephalography. Neuroimage 65(C):216–222.
28. He BJ, Snyder AZ, Zempel JM, Smyth MD, Raichle ME (2008) Electrophysiologicalcorrelates of the brain’s intrinsic large-scale functional architecture. Proc Natl Acad SciUSA 105(41):16039–16044.
29. Picchioni D, et al. (2011) Infraslow EEG oscillations organize large-scale cortical-sub-cortical interactions during sleep: A combined EEG/fMRI study. Brain Res 1374:63–72.
30. Glover GH (1999) Deconvolution of impulse response in event-related BOLD fMRI.Neuroimage 9(4):416–429.
31. Vialatte F-B, Maurice M, Dauwels J, Cichocki A (2010) Steady-state visually evoked poten-tials: Focus on essential paradigms and future perspectives. Prog Neurobiol 90(4):418–438.
32. Bianciardi M, et al. (2009) Single-epoch analysis of interleaved evoked potentials andfMRI responses during steady-state visual stimulation. Clin Neurophysiol 120(4):738–747.
33. Di Russo F, et al. (2007) Spatiotemporal analysis of the cortical sources of the steady-state visual evoked potential. Hum Brain Mapp 28(4):323–334.
34. Yesilyurt B, Ugurbil K, Uludag K (2008) Dynamics and nonlinearities of the BOLDresponse at very short stimulus durations. Magn Reson Imaging 26(7):853–862.
35. Birn RM, Saad ZS, Bandettini PA (2001) Spatial heterogeneity of the nonlinear dy-namics in the FMRI BOLD response. Neuroimage 14(4):817–826.
36. Buxton RB, Wong EC, Frank LR (1998) Dynamics of blood flow and oxygenationchanges during brain activation: The balloon model.Magn Reson Med 39(6):855–864.
37. Buxton RB, Uludag K, Dubowitz DJ, Liu TT (2004) Modeling the hemodynamic re-sponse to brain activation. Neuroimage 23(Suppl 1):S220–S233.
38. Mildner T, Norris DG, Schwarzbauer C, Wiggins CJ (2001) A qualitative test of the bal-loon model for BOLD-based MR signal changes at 3T. Magn Reson Med 46(5):891–899.
39. Obata T, et al. (2004) Discrepancies between BOLD and flow dynamics in primary andsupplementary motor areas: Application of the balloon model to the interpretationof BOLD transients. Neuroimage 21(1):144–153.
40. Handwerker DA, Ollinger JM, D’Esposito M (2004) Variation of BOLD hemodynamicresponses across subjects and brain regions and their effects on statistical analyses.Neuroimage 21(4):1639–1651.
41. Yu X, et al. (2012) Direct imaging of macrovascular and microvascular contributions toBOLD fMRI in layers IV-V of the rat whisker-barrel cortex. Neuroimage 59(2):1451–1460.
42. de Zwart JA, et al. (2005) Temporal dynamics of the BOLD fMRI impulse response.Neuroimage 24(3):667–677.
43. Simon AB, Buxton RB (2015) Understanding the dynamic relationship between ce-rebral blood flow and the BOLD signal: Implications for quantitative functional MRI.Neuroimage 116(C):158–167.
44. Cohen ER, Ugurbil K, Kim S-G (2002) Effect of basal conditions on the magnitude anddynamics of the blood oxygenation level-dependent fMRI response. J Cereb BloodFlow Metab 22(9):1042–1053.
45. Liu TT, et al. (2004) Caffeine alters the temporal dynamics of the visual BOLD re-sponse. Neuroimage 23(4):1402–1413.
46. Zappe AC, Uludag K, Oeltermann A, Ugurbil K, Logothetis NK (2008) The influence ofmoderate hypercapnia on neural activity in the anesthetized nonhuman primate.Cereb Cortex 18(11):2666–2673.
47. Xu F, et al. (2011) The influence of carbon dioxide on brain activity and metabolism inconscious humans. J Cereb Blood Flow Metab 31(1):58–67.
48. Iadecola C (2004) Neurovascular regulation in the normal brain and in Alzheimer’sdisease. Nat Rev Neurosci 5(5):347–360.
49. Saad ZS, Ropella KM, Cox RW, DeYoe EA (2001) Analysis and use of FMRI responsedelays. Hum Brain Mapp 13(2):74–93.
50. Liao CH, et al. (2002) Estimating thedelay of the fMRI response.Neuroimage 16(3 Pt 1):593–606.51. Calhoun VD, Stevens MC, Pearlson GD, Kiehl KA (2004) fMRI analysis with the general
linear model: Removal of latency-induced amplitude bias by incorporation of he-modynamic derivative terms. Neuroimage 22(1):252–257.
52. Chang C, Thomason ME, Glover GH (2008) Mapping and correction of vascular he-modynamic latency in the BOLD signal. Neuroimage 43(1):90–102.
53. Massimini M, Tononi G, Huber R (2009) Slow waves, synaptic plasticity and in-formation processing: Insights from transcranial magnetic stimulation and high-density EEG experiments. Eur J Neurosci 29(9):1761–1770.
54. Lewis LD, et al. (2012) Rapid fragmentation of neuronal networks at the onset ofpropofol-induced unconsciousness. Proc Natl Acad Sci USA 109(49):E3377–E3386.
55. Schroeder CE, Lakatos P (2009) Low-frequency neuronal oscillations as instruments ofsensory selection. Trends Neurosci 32(1):9–18.
56. Nir Y, et al. (2011) Regional slowwaves and spindles in human sleep.Neuron 70(1):153–169.57. Brainard DH (1997) The psychophysics toolbox. Spat Vis 10(4):433–436.58. Kleiner M, Brainard D, Pelli D (2007) What’s new in Psychtoolbox-3? Perception 36(14):
1–16.59. van der Kouwe AJW, Benner T, Salat DH, Fischl B (2008) Brain morphometry with
multiecho MPRAGE. Neuroimage 40(2):559–569.60. Polimeni JR, et al. (2016) Reducing sensitivity losses due to respiration and motion in
accelerated echo planar imaging by reordering the autocalibration data acquisition.Magn Reson Med 75(2):665–679.
61. Greve DN, Fischl B (2009) Accurate and robust brain image alignment using boundary-based registration. Neuroimage 48(1):63–72.
62. Fischl B (2012) FreeSurfer. Neuroimage 62(2):774–781.63. Fischl B, et al. (2008) Cortical folding patterns and predicting cytoarchitecture. Cereb
Cortex 18(8):1973–1980.64. Hinds O, et al. (2009) Locating the functional and anatomical boundaries of human
primary visual cortex. Neuroimage 46(4):915–922.65. Bokil H, Andrews P, Kulkarni JE, Mehta S, Mitra PP (2010) Chronux: A platform for
analyzing neural signals. J Neurosci Methods 192(1):146–151.66. Niazy RK, Beckmann CF, Iannetti GD, Brady JM, Smith SM (2005) Removal of FMRI en-
vironment artifacts from EEG data using optimal basis sets. Neuroimage 28(3):720–737.67. Delorme A, Makeig S (2004) EEGLAB: An open source toolbox for analysis of single-trial
EEG dynamics including independent component analysis. J Neurosci Methods 134(1):9–21.68. Havlicek M, et al. (2015) Physiologically informed dynamic causal modeling of fMRI
data. Neuroimage 122(C):355–372.69. Friston KJ, Mechelli A, Turner R, Price CJ (2000) Nonlinear responses in fMRI: The
Balloon model, Volterra kernels, and other hemodynamics. Neuroimage 12(4):466–477.
Lewis et al. PNAS | Published online October 11, 2016 | E6685
NEU
ROSC
IENCE
PNASPL
US