Embed Size (px)
Citation preview

RESEARCH ARTICLE
Fast and near-optimal monitoring for
healthcare acquired infection outbreaks
Bijaya AdhikariID1*, Bryan LewisID
2, Anil Vullikanti2,3, Jose Mauricio Jimenez4,
B. Aditya Prakash1*
1 Department of Computer Science, Virginia Tech, Blacksburg, Virginia, United States of America,
2 Biocomplexity Institute & Initiative, University of Virginia, Charlottesville, Virginia, United States of America,
3 Department of Computer Science, University of Virginia, Charlottesville, Virginia, United States of America,
4 Department of Systems Engineering, United States Military Academy, West Point, New York, United States
of America
* [email protected] (BA); [email protected] (BAP)
Abstract
According to the Centers for Disease Control and Prevention (CDC), one in twenty five hos-
pital patients are infected with at least one healthcare acquired infection (HAI) on any given
day. Early detection of possible HAI outbreaks help practitioners implement countermea-
sures before the infection spreads extensively. Here, we develop an efficient data and
model driven method to detect outbreaks with high accuracy. We leverage mechanistic
modeling of C. difficile infection, a major HAI disease, to simulate its spread in a hospital
wing and design efficient near-optimal algorithms to select people and locations to monitor
using an optimization formulation. Results show that our strategy detects up to 95% of
“future” C. difficile outbreaks. We design our method by incorporating specific hospital prac-
tices (like swabbing for infections) as well. As a result, our method outperforms state-of-the-
art algorithms for outbreak detection. Finally, a qualitative study of our result shows that the
people and locations we select to monitor as sensors are intuitive and meaningful.
Author summary
Healthcare acquired infections (HAIs) lead to significant losses of lives and result in heavy
economic burden on healthcare providers worldwide. Timely detection of HAI outbreaks
will have a significant impact on the health infrastructure. Here, we propose an efficient
and effective approach to detect HAI outbreaks by strategically monitoring selected peo-
ple and locations (sensors). Our approach leverages outbreak data generated by calibrated
mechanistic simulation of C. difficile spread in a hospital wing and a careful computa-
tional formulation to determine the people and locations to monitor. Results show that
our approach is effective in detecting outbreaks.
Introduction
Since the time of Hippocrates, the “father of western medicine”, a central tenet of medical care
has been to “do no harm.” Unfortunately, the scourge of healthcare acquired infections (HAI)
PLOS Computational Biology | https://doi.org/10.1371/journal.pcbi.1007284 September 16, 2019 1 / 22
a1111111111
a1111111111
a1111111111
a1111111111
a1111111111
OPEN ACCESS
Citation: Adhikari B, Lewis B, Vullikanti A, Jimenez
JM, Prakash BA (2019) Fast and near-optimal
monitoring for healthcare acquired infection
outbreaks. PLoS Comput Biol 15(9): e1007284.
https://doi.org/10.1371/journal.pcbi.1007284
Editor: Samuel Scarpino, Northeastern University,
UNITED STATES
Received: January 11, 2019
Accepted: July 24, 2019
Published: September 16, 2019
Copyright: This is an open access article, free of all
copyright, and may be freely reproduced,
distributed, transmitted, modified, built upon, or
otherwise used by anyone for any lawful purpose.
The work is made available under the Creative
Commons CC0 public domain dedication.
Data Availability Statement: All relevant data are
within the manuscript and its Supporting
Information files.
Funding: BA and BAP are partially supported by the
National Science Foundation (CAREER IIS-
1750407), the National Endowment for the
Humanities (HG-229283-15), Oak Ridge National
Laboratory, and a Facebook faculty gift. BL and AV
are partially supported by the following grants:
National Science Foundation grant IIS-1633028,
National Science Foundation grant ACI-1443054,
National Institutes of Health grant 1R01GM109718,

challenges the medical system to honor this tenet. When patients are hospitalized they are
seeking care and healing, however, they are simultaneously being exposed to risky infections
from others in the hospital, and in their weakened state are much more susceptible to these
infections than they would be normally. Acquiring these infections increases the chances of
either dying or becoming even sicker, which also lengthens the time the patient needs to stay
in the hospital (increasing costs). These infections can range from pneumonia and gastro-
intestinal infections like Clostridium difficile to surgical site infections and catheter associated
infections, which puts nearly any patient in the hospital at risk. Antibiotic treatments intended
to aid in recovery from one infection, may open the door for increased risk of infection from
another.
Healthcare acquired infections are a significant problem in the United States and around
the world. Some estimates put the annual cost between 28 and 45 billion US dollars per year
in the US [1]. More importantly, they inflict a significant burden on human health. A recent
study estimated more than 2.5 million new cases per year in Europe alone, inflicting a loss of
just over 500 disability-adjusted life years (DALYS) per 100,000 population [2]. Given their
burden and cost, their prevention is a high priority for infection control specialists. A simple
approach to monitor HAI outbreaks would be to test every patient and staff in the hospital and
swab every possible location for HAI infection. However, such a naive process is too expensive
to implement. A better strategy is required to efficiently monitor HAI outbreaks.
A recent review article [3] included 29 hospital outbreak detection algorithms described in
the literature. They found these fall into five main categories: simple thresholds, statistical pro-
cess control, scan statistics, traditional statistical models, and data mining methods. Compar-
ing the performance of these methods is challenging given the myriad diseases, definitions of
outbreaks, study environments, and ultimately the purpose of the studies themselves. How-
ever, the authors identify that few of these studies were able to leverage important covariates in
their detection algorithms. For example, including the culture site or antibiotic resistance was
shown to boost detectability. Past simulation based approaches [4] tackle optimal surveillance
system design, by choosing clinics as sensors, to increase sensitivity and time to detection for
outbreaks in a population. In contrast, our approach selects most vulnerable people and loca-
tions to infections as sensors to detect outbreaks in a hospital setting. Different kinds of mech-
anistic models have also been used for studying HAI spread [5, 6, 7, 8]. Most of these are
differential equation based models. We refer to [9] for a review of mechanistic models of HAI
transmission.
On a broader level, sensor selection problem for propagation (of contents, disease, rumors
and so on) over networks has gained much attention in the data mining community. Tradi-
tional sensor selection approaches [10, 11] typically select a set of nodes which require constant
monitoring. Instead, in this paper, we select sensor set as well as the rate to monitor each sen-
sor. Hence, our approach is novel from the data mining perspective as well. Recently Shao
et al. [12] proposed selecting a set of users on social media to detect outbreaks in the general
population. Similarly, Reis et al. [13] proposed an epidemiological network modeling approach
for respiratory and gastrointestinal disease outbreaks. Other closely related data mining prob-
lems include selecting nodes for inhibiting epidemic outbreaks (vaccination) [14, 15, 16] and
inferring missing infections in an epidemic outbreak [17].
We employ a simulation and data optimization based approach to design our algorithm
and to provide robust bounds on its performance. Additionally, our simulation model is richly
detailed in terms of the class of individuals and locations where sampling can occur. None of
the prior works explicitly model the multiple pathways of infections for HAI outbreaks and fail
in separating the location contamination and infections in people. We formalize the sensor set
problem as an optimization problem over the space of rate vectors, which represent the rates
Fast and near-optimal monitoring for healthcare acquired infection outbreaks
PLOS Computational Biology | https://doi.org/10.1371/journal.pcbi.1007284 September 16, 2019 2 / 22
NIH MIDAS Cooperative Agreement
U01GM070694, and Defense Threat Reduction
Agency (DTRA) grants HDTRA1-11-1-0016 and
HDTRA1-17-D-0023. The website of each funders
are as follows: 1) National Science Foundation:
https://www.nsf.gov/ 2) National Endowment for
the Humanities: https://www.neh.gov/ 3) Oak
Ridge National Laboratory: https://www.ornl.gov/
4) Facebook Faculty Gift: https://research.fb.com/
programs/faculty-awards/ 5) Defense Threat
Reduction Agency: http://www.dtra.mil/ 6) National
Institutes of Health: https://www.nih.gov/ The
funders had no role in study design, data collection
and analysis, decision to publish, or preparation of
the manuscript.
Competing interests: The authors have declared
that no competing interests exist.

at which to monitor each location and person. We consider two objectives, namely the proba-
bility of detection and the detection time, and show that the prior satisfies a mathematical
property called submodularity, which enables efficient algorithms. In addition, we leverage
data generated from a carefully calibrated simulation using real data collected from a local hos-
pital. Our extensive experiments show that our approach outperforms the state-of-the-art gen-
eral outbreak detection algorithm. We also show that our approach achieves the minimum
outbreak detection time compared to other alternatives. To the best of our knowledge, we are
the first to provide a principled data-driven optimization based approach for HAI outbreak
detection. Though we validate our approach for a specific HAI, namely C. difficile, our general
approach is applicable for other HAIs with similar disease model as well.
Materials and methods
Data
As previously mentioned, we propose a data-driven approach in selecting the sensors. There
are multiple challenges in obtaining actual HAI spread data such as high cost, data sparsity,
and the ability to safeguard patient personal information. For this reason, we rely on simulated
HAI contagion data. We use a highly-detailed agent-based simulation that employs a mobility
log obtained from local hospitals [18, 19] to produce realistic contagion data. All the steps of
this methodology are described in detail in [18], and we summarize them below for complete-
ness. Fig 1 shows a visualization of simulated HAI spread. In this simulation, people (human
agents) move across various locations (static agents) as defined by the mobility log and spread
HAI in stochastic manner.
The simulation was developed in the following three steps: design of an in-silico or com-
puter-based population and its activities, conceptualization of a disease model for a pathogen
of interest, and the employment of a highly-detailed simulation. The following sections
describe the data creation process in more detail.
In-silico population and mobility log. The first step in developing an HAI contagion
model is the creation of a complete hospital population based on realistic hospital parameters.
This will ensure high resolution and fidelity for the simulation. The hospital population was
initially developed by capturing actual patient schedule data from regional hospitals in South-
west Virginia. The de-identified data contains information regarding patient location, disposi-
tion, and activities within a hospital. In addition to the patient schedule, the population
incorporates the activities of healthcare workers such as nurses, doctors, therapists, and
Fig 1. Visualization of a possible HAI spread. The only healthcare worker in the example is marked with a ‘+’ sign.
The rest of the humans are patients and visitors. Each individual is assigned a unique combination of color and
silhouette pair. Infected humans are indicated by the green emoji and contaminated locations are indicated by the
bacteria emoji. As human agents move through various locations, they infect other agents and contaminate the
locations.
https://doi.org/10.1371/journal.pcbi.1007284.g001
Fast and near-optimal monitoring for healthcare acquired infection outbreaks
PLOS Computational Biology | https://doi.org/10.1371/journal.pcbi.1007284 September 16, 2019 3 / 22

environmental services personnel among others. Their activities were compiled into the popu-
lation based on direct observation of each type of healthcare worker. One additional level of
realism was added to the population by including detailed information of locations, such as
patient rooms and static objects such as furniture. We also use the term fomite to mean a loca-
tion. The locations/fomites were modeled as static agents.
The final mobility log of the hospital population consists of a detailed database that specifies
the type of agent, its location, specific agent, and the duration of the activity. Formally, the
mobility logs are represented as a bipartite temporal network G(P, L, E, T), with partition Prepresenting population of human agents, partition L representing locations, E representing
who-visits-what-location relationship and T representing time/duration of the visit. The sum-
mary statistics of the mobility log and the resulting social networks as as follows:
As shown in Table 1, the mobility log includes 72,146 unique locations with 96,281 unique
agents, and their interaction for the total duration of 200 days. The high spread in the average
number of visits per location is due to the fact that some locations for example reception and
staff room tend to get more visitors than others such as patients room. From the mobility log
200 social networks were created, one for each day. In these social networks, two agents have
an edge between them if they were in the same location at the same time. The summary statis-
tics of these social networks are presented in Table 1 as well.
Disease model. The next step in generating a realistic simulation is to model the disease
accurately. Mathematical models that have been proposed for the spread of C. difficile in a hos-
pital are either differential equation-based, e.g., [5], or agent-based, e.g., [19, 20, 21, 22]. We
use an agent-based approach, in which the disease model is a probabilistic finite-state machine
(FSM). The disease model was developed based on recent studies on C. difficile infections [23,
24, 25, 26, 27]. Different health states (shown in Fig 2) and various transition probabilities
were taken from these studies. Once the simulation is initiated, each agent will move through
the different disease/health states described in the disease model beginning with the uninfected
state. As the simulation progresses, agents are either colonized or not with the C. difficile bacte-
rium. It is important to note that the transition probabilities for each disease/health state utilize
current infection and recovery rates to capture the actual behavior of the pathogen in the hos-
pital setting. Fig 2 shows the disease model for humans.
An important characteristic of this model is that agents consist of both people and location/
objects (e.g., fomites), and there are two pathways for the disease to spread, namely, person to
person, and person to location. While differential equation-based models have typically only
represented person to person transmission, recent agent-based models have considered these
two pathways, e.g., [21, 22]—they represent rooms in the hospital, along with the dynamics of
pathogen load in these rooms. Since the infection in people and the contamination of fomites
Table 1. Summary statistics on the mobility log and the resulting social networks.
total no. of locations 72,146
total no. of agents 96,281
total no. of days 200
average no. of mobility entries per day 138,765.4 ± 6384.15
average no. of visits per location 384.6 ± 1949.22
average no. of nodes in social networks 6,924.8 ± 96.51
average no. of edges in social networks 45,503.8 ± 4267.97
average degree in social networks 13.2 ± 1.44
average clustering co-efficients in social networks 0.4 ±0.03
https://doi.org/10.1371/journal.pcbi.1007284.t001
Fast and near-optimal monitoring for healthcare acquired infection outbreaks
PLOS Computational Biology | https://doi.org/10.1371/journal.pcbi.1007284 September 16, 2019 4 / 22
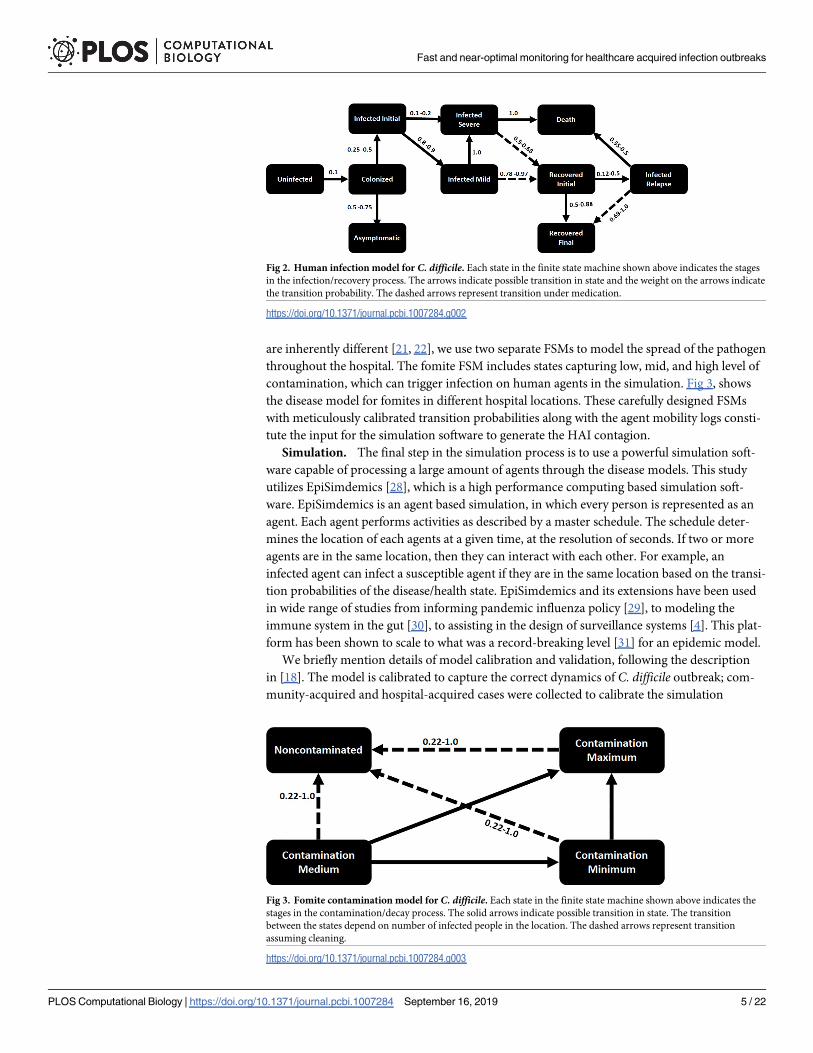
are inherently different [21, 22], we use two separate FSMs to model the spread of the pathogen
throughout the hospital. The fomite FSM includes states capturing low, mid, and high level of
contamination, which can trigger infection on human agents in the simulation. Fig 3, shows
the disease model for fomites in different hospital locations. These carefully designed FSMs
with meticulously calibrated transition probabilities along with the agent mobility logs consti-
tute the input for the simulation software to generate the HAI contagion.
Simulation. The final step in the simulation process is to use a powerful simulation soft-
ware capable of processing a large amount of agents through the disease models. This study
utilizes EpiSimdemics [28], which is a high performance computing based simulation soft-
ware. EpiSimdemics is an agent based simulation, in which every person is represented as an
agent. Each agent performs activities as described by a master schedule. The schedule deter-
mines the location of each agents at a given time, at the resolution of seconds. If two or more
agents are in the same location, then they can interact with each other. For example, an
infected agent can infect a susceptible agent if they are in the same location based on the transi-
tion probabilities of the disease/health state. EpiSimdemics and its extensions have been used
in wide range of studies from informing pandemic influenza policy [29], to modeling the
immune system in the gut [30], to assisting in the design of surveillance systems [4]. This plat-
form has been shown to scale to what was a record-breaking level [31] for an epidemic model.
We briefly mention details of model calibration and validation, following the description
in [18]. The model is calibrated to capture the correct dynamics of C. difficile outbreak; com-
munity-acquired and hospital-acquired cases were collected to calibrate the simulation
Fig 2. Human infection model for C. difficile. Each state in the finite state machine shown above indicates the stages
in the infection/recovery process. The arrows indicate possible transition in state and the weight on the arrows indicate
the transition probability. The dashed arrows represent transition under medication.
https://doi.org/10.1371/journal.pcbi.1007284.g002
Fig 3. Fomite contamination model for C. difficile. Each state in the finite state machine shown above indicates the
stages in the contamination/decay process. The solid arrows indicate possible transition in state. The transition
between the states depend on number of infected people in the location. The dashed arrows represent transition
assuming cleaning.
https://doi.org/10.1371/journal.pcbi.1007284.g003
Fast and near-optimal monitoring for healthcare acquired infection outbreaks
PLOS Computational Biology | https://doi.org/10.1371/journal.pcbi.1007284 September 16, 2019 5 / 22

parameters. It was ensured that the simulation output of hospital-acquired cases closely
matched the real value, given the community-acquired cases. The model is validated at various
levels. First, very detailed data on mobility and activities of patient, healthcare workers, and
visitors is used. These, and fomite behaviors, were estimated through direct observations at the
hospital. Finally, feedback from the Hospital Infection Preventionist and healthcare workers
was used to ensure that the dynamics of the simulation behaved in a similar manner to the
actual movements of patients and healthcare workers during normal hospital operations.
Simulation outputs. We ran EpiSimdemics multiple times with various initial conditions.
Each simulation instance produced a cascade (infection dendogram) consisting of information
on identity of newly infected agents, time of infection, the source of infection, and the activity
the agent was performing when infected. In the following, we use the terms simulationinstances and cascades interchangeably. Each simulation also produces information regarding
the infection status of each agent on each day for all 200 days. Formally, we have a set I of indi-
vidual simulation instances i of HAI spread. Each instance i is a simulation of HAI spread
starting from a particular initial stage. Overall, the average number of infection per simulation
is 22.94, with a median of 23.32 and a standard deviation of 6.92.
Fig 4 shows the distribution of infections over different categories of agents. The infections
are dominated by nurses, physicians, fomites, and patients. Patients have the highest infection
Fig 4. Infection distribution for various categories of agents. Note that “EV” stands for external visitors. (a) Infection for each agent category averaged
across simulation instances. (b) Average infection normalized by the number of agents in each category. High susceptibility of healthcare workers can be
attributed to their high mobility. Patients have the highest number of infections on average despite having a low normalized infection rate as they are the
largest population group.
https://doi.org/10.1371/journal.pcbi.1007284.g004
Fast and near-optimal monitoring for healthcare acquired infection outbreaks
PLOS Computational Biology | https://doi.org/10.1371/journal.pcbi.1007284 September 16, 2019 6 / 22
rate as they are the largest group by population. Nurses and physicians have a high infection
levels as well. This is because they are more mobile and hence are more exposed to HAIs. They
also have higher interactions with other health care workers.
In summary, our HAI contagion simulation data follows meticulous stages of development,
modeling and calibration. The simulation results produce intuitive and realistic infection pat-
terns. While this case of C. difficile in a particular hospital in Virginia is quite specific, these
results are generalizable. While the particulars of movement in different hospitals and dynam-
ics of different diseases may alter the specific values of our findings the general trends will be
similar. The infection control practices and rhythms of patient care in an intensive care unit
are similar across hospitals, and at the moment C. difficile remains a major contributor to
healthcare acquired infections.
Sensor set and rate selection
Recall that our goal is to select a set of agents as sensors, and the rate at which each such sen-sor should be monitored, such that future HAI outbreaks are detected with high probability,
and as early as possible. However, these have to be selected within given resource constraints.
We start with a formalization of these problems. Finding a minimum cost sensor set is a chal-
lenging optimization problem, and we present efficient algorithms by using the notion of
submodularity.
We first define some notations. Let bold letters represent vectors. Let P and L denote the
sets of human agents and locations respectively; let n = |P [ L|—this will be the total number
of agents in our simulations. Let B denote the budget on a number of samples that is permitted
(weighted by cost of agents), i.e, it is the sum of expected number of swabs to detect whether
a location is contaminated or a human is infected. As mentioned earlier, the mobility logs are
represented as a bipartite temporal network G(P, L, E, T), with two partitions P and L repre-
senting agents, E representing who-visits-what-location relationship and T representing time/
duration of the visit. We consider each agent to be a node in the temporal network G. Hence
we use the terms node and agent interchangeably. Now, let c 2 Rn, be the vector of costs, i.e.,
c[v] is the cost of monitoring node v. Let r 2 Rn be the vector of monitoring rates, where r[v]
denotes that the probability that node v is monitored (e.g., swabbed) each day. Finally, let Tmax
denote the maximum time in each simulation instance.
Optimizing probability of detection. Consider an arbitrary simulation instance i, an
arbitrary sensor set and associated monitoring rate vector r. Agent v is monitored at the rate of
r[v]. Let the number of days in which node v is in the infected state in simulation instance i be
τ(v, i). Then, the probability that node v is detected in simulation i is
Pdðvji; rÞ ¼ 1 � ð1 � r½v�Þtðv;iÞ ð1Þ
Next, the probability of at least one node being detected in simulation i, given the rate vec-
tor r, is
PðijrÞ ¼ 1 �Y
v2P[L
ð1 � Pdðvji; rÞÞ ð2Þ
PðijrÞ ¼ 1 �Y
v2P[L
1 � 1 � ð1 � r½v�Þtðv;iÞ
� �h ið3Þ
Fast and near-optimal monitoring for healthcare acquired infection outbreaks
PLOS Computational Biology | https://doi.org/10.1371/journal.pcbi.1007284 September 16, 2019 7 / 22

PðijrÞ ¼ 1 �Y
v2P[L
ð1 � r½v�Þtðv;iÞ
ð4Þ
Recall that I denotes the set of simulations. It follows that the expected number of cascades,
where at least one node is detected, given the rate vector r, isP
i2I P(i|r). The probability that
a sensor node is detected equals the fraction of cascades in which at least one sensor node is
infected. This motivates the first problem we study.
Problem 1. Find the vector r�, such that
r� ¼ arg maxr
X
i2I
PðijrÞ ð5Þ
and ∑v r[v] � c[v] � B.
Optimizing expected time of detection. As discussed above, the node v is sampled/
swabbed for infection each day with rate r[v]. Let the ordered list of days in which node v is
infected in simulation instance i be gðv; iÞ ¼ ftv1; tv
2; . . . tvng, where tvi represents the ith day in
which node v is infected.
Here, we are interested in the first day until node v is detected to be infected. On the days
where node v is not infected, sampling node v does not result in outbreak detection. The detec-
tion time is the first time at which v is infected and is sampled. Since node v is sampled each
day with probability r[v], the first time in γ(v, i) in which it gets detected (restricted to the
times in which v is infected) is a geometric process. Therefore, in expectation, node v is
detected to be infected on the 1/r[v]th day in γ(v, i). Let that be denoted as Det(v|i, r). For
example, let us consider a case when a node gets infected in day 5 of simulation and remains
infected until day 15. During this time, if we sample this node with a rate of 0.2, the node
is sampled and detected to be infected on the 5th day of infection which is the day 9 of the sim-
ulation in expectation. If 1/r[v] is greater than the length of γ(v, i), we consider that the infec-
tion to be undetected and set Det(v|i, r) as Tmax, the last time-stamp in any of the simulation
instances.
Formally, the minimum detection day for simulation instance i is,
DðijrÞ ¼ minv
Detðvji; rÞ ð6Þ
Our goal is to minimize D(i|r) over all i, r. This turns out to be a challenging computational
problem, and instead we consider its converse. Now, the problem to optimize for expected
time of detection can be posed as following:
Problem 2. Find the vector r�, such that
r� ¼ arg maxr
X
i2I
½Tmax � DðijrÞ� ð7Þ
and ∑v r[v] � c[v] � B.
Our methods
Unfortunately, Problems 1 and 2 are both computationally very challenging. In fact, both the
problems can be proven to be NP-hard.
Lemma 1. Problem 1 is NP-hard.
Lemma 2. Problem 2 is NP-hard.
We provide the proofs for both the lemmas in the supplementary, where we show that the
NP-Complete SETCOVER problem can be viewed as a special case of both the Problems 1 and 2.
Fast and near-optimal monitoring for healthcare acquired infection outbreaks
PLOS Computational Biology | https://doi.org/10.1371/journal.pcbi.1007284 September 16, 2019 8 / 22

Since our problems are in the computational class NP-hard, they cannot be solved opti-
mally in polynomial time even for simplistic instances, unless P = NP. The instances we need
to consider are pretty large, so a naive exhaustive search for the optimal solution is also not fea-
sible and will be too slow. Therefore, we focus on designing efficient near-optimal approximate
solutions.
We begin with Problem 1. The function we are trying to optimize for problem 1 is defined
over a discrete lattice, i.e. the rate vector r. Our approach is to show that this function is a sub-
modular lattice function. The notion of submodularity, which is typically defined over set
functions, can be extended to discrete lattice functions (e.g. recenty in [32]). Informally, sub-
modularity means that the objective value has a property of diminishing returns for a small
increase in the rate in any dimension. It is important to note that submodularity for lattice
functions is more nuanced than for simple set functions (we define it formally in the Supple-
mentary Information section). Fortunately, it turns out that this property implies that a natural
greedy algorithm (which maximizes the objective marginally at each step) gurantees a (1 − 1/
e)-approximation to the optimal solution. Without such a property, it is not clear how to solve
Problem 1 efficiently even for a small budget.
We have the following lemma.
Lemma 3. The objective in Problem 1 is a submodular lattice function.
The detailed description of the submodularity property and proof of lemma 3 are presented
in the supplementary.
Our HAIDETECT algorithm for Problem 1 selects the sensors to be monitored and rates such
that nodes which tend to get infected across multiple simulation instances have higher infection
rates. Specifically, at each step, HAIDETECT selects the node v and the rate r among all possible
candidate pairs of nodes and rates, such that the average marginal gain is maximized. HAIDETECT
keeps adding nodes and/or increasing the rates to monitor the selected nodes until the weighted
sum of the rates is equal to the budget B. The detailed pseudocode is presented in Algorithm 1.
Algorithm 1 HAIDETECT
Require: I, budget B1: for each feasible initial vector r0 do2: Initialize the rate vector r = r03: while ∑v r[v] � c[v] < B do4: Find a node v and rate r maximizing average marginal gain5: Let r[v] = r6: Remove all candidate pairs of nodes and rates which are not
feasible7: Return the best rate vector r
HAIDETECT has desirable properties in terms of both effectiveness and speed. The perfor-
mance guarantee of HAIDETECT is given by the following lemma.
Lemma 4. HAIDETECT gives a (1-1/e) approximation to the optimal solution.
The lemma above gives an offline bound on the performance of HAIDETECT, i.e., we can
state that the (1-1/e) approximation holds even before the computation starts. We can actually
obtain a tighter bound by computing an empirical online bound (once the solution is
obtained) which can be derived using the submodularity and monotonicity of Problem 1. For
us to state the empirical bound, let us define some notations.
Let the solution selected by HAIDETECT for a budget B be r. Similarly, let the optimal vector
for the same budget be r�. For simplicity, let the objective function in Problem 1 be R(�). For all
nodes v and for a 2 [0, 1], let us define Δv as follows:
Dv ¼ maxa
Rðr _ a � wfvgÞ � RðrÞ� �
ð8Þ
Fast and near-optimal monitoring for healthcare acquired infection outbreaks
PLOS Computational Biology | https://doi.org/10.1371/journal.pcbi.1007284 September 16, 2019 9 / 22

Similarly let us define σv as the argument which maximizes Δv
sv ¼ arg maxa
Rðr _ a � wfvgÞ � RðrÞ� �
ð9Þ
Now, let dv ¼Dv
c½v��sv. Note that for each node v, there is a single δ. Let the sequence of
nodes s1, s2, . . ., sn be ordered in decreasing order of δv. Now let K be the index such that
y ¼PK�1
i¼1c½si�ssi
� B andPK
i¼1c½si�ssi
> B. Now the following lemma can be stated.
Lemma 5. The online bound on R(r�) in terms of the current rate r assigned by HAIDETECT isas follows:
Rðr�Þ � RðrÞ þXK�1
i¼1
Dsi þB � y
c½sK�ssK
DsK
The lemma above allows us to compute how far the solution given by HAIDETECT is from
the optimal. We compute this bound and explore the results in detail in the Results section. In
addition to the performance guarantee, HAIDETECT’s running time complexity is as follows.
Lemma 6. The running time complexity of HAIDETECT is O(c � B2(|P| + |L|)), where c is thenumber of unique initial vectors r0, B is the budge, P is the set of human agents and L is the set oflocations.
Note that the constant c is much smaller than the total population, i.e., c << |P| + |L| in our
case as infections are sparse and we do not need to consider agents and locations which never
get infected. The most expensive computational step in Algorithm 1 is the estimation of the
node v and rate r that gives the maximum average marginal gain (Step (i) of 1(b)). This can be
expedited using lazy evaluations and memoization. Hence, the algorithm is also quite fast in
practice. Moreover, it also embarrassingly parallelizable. The steps (a) and (b) for each initial
vector can be performed in parallel.
We also propose a similar algorithm HAIEARLYDETECT for Problem 2. The main idea here
is that we assign higher rates to nodes which tend to get infected earlier in many simulation
instances. The pseudocode for HAIEARLYDETECT is presented in Algorithm 2.
Algorithm 2 HAIEARLYDETECT
Require: I, budget B1: for each feasible initial vector r0 do2: Initialize the rate vector r = r03: while ∑v r[v] � c[v] < B do4: Find a node v and rate r minimizing the average detection time5: Let r[v] = r6: Remove all candidate pairs of nodes and rates which are not
feasible7: Return the best rate vector r
As shown in Algorithm 2, HAIEARLYDETECT optimizes the marginal gain in the objective
in Problem 2 in each iteration. It turns out that the objective in Problem 2 is not submodular.
However, as shown by our empirical results, the greedy approach we propose works very well
in practice and outperforms the baselines. Moreover, it too runs fast in practice as the same
optimization techniques discussed earlier for HAIDETECT applies to HAIEARLYDETECT as well.
Baseline methods. We compare the performance of our approaches with data driven and
natural baselines from practice.
Baseline from practice. We compare the performance of monitoring the sensors selected
by HAIDETECT and HAIEARLYDETECT with different natural baselines motivated from practice.
An obvious heuristic to monitor HAI outbreaks would be to monitor all the agents (human
and fomites) every day. Other natural baselines we compare against include, monitoring all
Fast and near-optimal monitoring for healthcare acquired infection outbreaks
PLOS Computational Biology | https://doi.org/10.1371/journal.pcbi.1007284 September 16, 2019 10 / 22
patients, swabbing all locations for fomites, monitoring all nurses, and so on. These methods
get too expensive as the number of personnel and locations increase.
Data-driven baseline. An interesting baseline would be methods for general sensor
set selection problems. Here we compare our approach against CELF [10], a state-of-the-art
method for general sensor set selection problem. CELF was published in SIGKDD, a premiere
data mining venue in 2007 and is still used to solve sensor set selection problem. We run CELF
in the same set simulation as our methods. CELF is also a greedy algorithm designed for a sub-
modular set function (as opposed to a lattice function in our case). CELF tries to add node v to
the sensor set with rate r[v] = 1, such that the number of newly detectable simulation instances
is maximized. CELF has been previously used for selecting sensors in water distribution net-
work and in other network settings.
Results
We ran HAIDETECT and HAIEARLYDETECT and compared them with the baselines in various set-
tings for both qualitative and quantitative studies. We ask questions like: “How does the per-
formance of the methods change with different budget constraints and with more data?”, “Are
the sensors selected by our methods qualitatively the same?”, “Is there an advantage in using
HAIDETECT or HAIEARLYDETECT over CELF?”, and so on.
Quality of sensors w.r.t the bounds
In the previous section, we discussed two types of bounds on the performance of HAIDETECT.
Here we show how far the solution given by HAIDETECT is from the optimal value for various
budgets. For this experiment, we ran HAIDETECT on a set of 100 simulations and computed the
value of the objective in Problem 1 for the resulting rate vector. We also computed the overall
bound, based on (1 − 1/e) approximation and the empirical bound as per Lemma 5. Since the
objective value cannot exceed the number of simulations, we also compute the lowest bound
as the minimum of two bounds and the number of simulations. We repeat the experiment for
budget size from 1 to 50. The resulting plot is presented in Fig 5.
Fig 5 highlights several interesting aspects. First of all, we can see that the online bound is
always tighter than the offline bound. Moreover, we also observe that as the performance of
HAIDETECT reaches close to the optimal (with increase in budget), the online bound becomes
more and more tight until both the performance and bound are equal, indicating the values
of the budget for which HAIDETECT solves Problem 1 optimally. This results demonstrates that
HAIDETECT can accurately find sensors which can detect any observed outbreaks given suffi-
cient budget.
Sensor quality with budget
Given that HAIDETECT is near-optimal for the observed outbreaks, we evaluate its effectiveness
in detecting unseen (“future”) outbreaks. Here, we compare the performance of HAIDETECT
and CELF with respect to the budget on “unobserved” simulations. For this experiment, we per-
formed a 5-fold cross validation on 200 simulations. Specifically, we divided the simulations
into 5 groups, and at each turn we selected the sensors in the first four groups and computed
the sum of outbreak detection probability as shown in Eq 1 in the fifth group (the test set).
Then we normalize the resulting sum of outbreak detection probability by total number of
simulation instances in the the same group. The normalized value can be intuitively described
as the average probability of detecting a future outbreak. We repeat this process five times
ensuring each group is used for success evaluation. We then compute the overall average and
its standard error. We repeat the entire process for the budgets from 1 to 50.
Fast and near-optimal monitoring for healthcare acquired infection outbreaks
PLOS Computational Biology | https://doi.org/10.1371/journal.pcbi.1007284 September 16, 2019 11 / 22

The result of our experiment is show in Fig 6. The first observation is that HAIDETECT con-
sistently outperforms CELF for all values of the budget. The disparity between the methods
is more apparent for larger values of budget. The difference in quality of the sensors can be
explained by the fact that CELF only assigns rate of 0 or 1. However, HAIDETECT can strategically
assign non-integer rates so as to maximize the likelihood of detection.
We can also observe that the standard error for the HAIDETECT decreases and is negligible
for larger budgets. However, it is not the case for CELF. This shows that not only the quality of
sensors detected by HAIDETECT is better, but it is more stable as well. Finally, we see that proba-
bility of an outbreak being detected by sensors selected by HAIDETECT is 0.96 when budget is
Fig 5. The objective value due to the solution returned by HAIDETECT and the bounds for various budgets. The
region in the dashed box shows where HAIDETECT is optimal.
https://doi.org/10.1371/journal.pcbi.1007284.g005
Fig 6. Probability of detecting future outbreaks (normalized) for different budgets. HAIDETECT significantly
outperforms CELF implying that monitoring sensors selected by HAIDETECT have higher chance of detecting an
outbreak.
https://doi.org/10.1371/journal.pcbi.1007284.g006
Fast and near-optimal monitoring for healthcare acquired infection outbreaks
PLOS Computational Biology | https://doi.org/10.1371/journal.pcbi.1007284 September 16, 2019 12 / 22
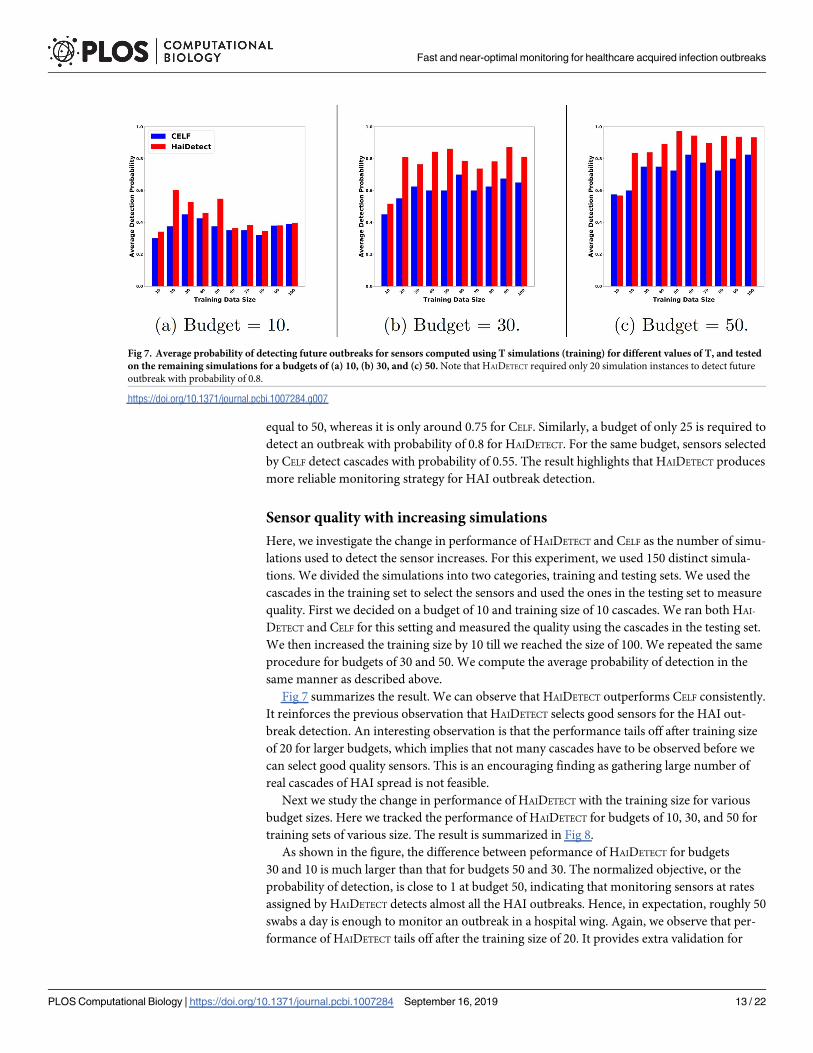
equal to 50, whereas it is only around 0.75 for CELF. Similarly, a budget of only 25 is required to
detect an outbreak with probability of 0.8 for HAIDETECT. For the same budget, sensors selected
by CELF detect cascades with probability of 0.55. The result highlights that HAIDETECT produces
more reliable monitoring strategy for HAI outbreak detection.
Sensor quality with increasing simulations
Here, we investigate the change in performance of HAIDETECT and CELF as the number of simu-
lations used to detect the sensor increases. For this experiment, we used 150 distinct simula-
tions. We divided the simulations into two categories, training and testing sets. We used the
cascades in the training set to select the sensors and used the ones in the testing set to measure
quality. First we decided on a budget of 10 and training size of 10 cascades. We ran both HAI-
DETECT and CELF for this setting and measured the quality using the cascades in the testing set.
We then increased the training size by 10 till we reached the size of 100. We repeated the same
procedure for budgets of 30 and 50. We compute the average probability of detection in the
same manner as described above.
Fig 7 summarizes the result. We can observe that HAIDETECT outperforms CELF consistently.
It reinforces the previous observation that HAIDETECT selects good sensors for the HAI out-
break detection. An interesting observation is that the performance tails off after training size
of 20 for larger budgets, which implies that not many cascades have to be observed before we
can select good quality sensors. This is an encouraging finding as gathering large number of
real cascades of HAI spread is not feasible.
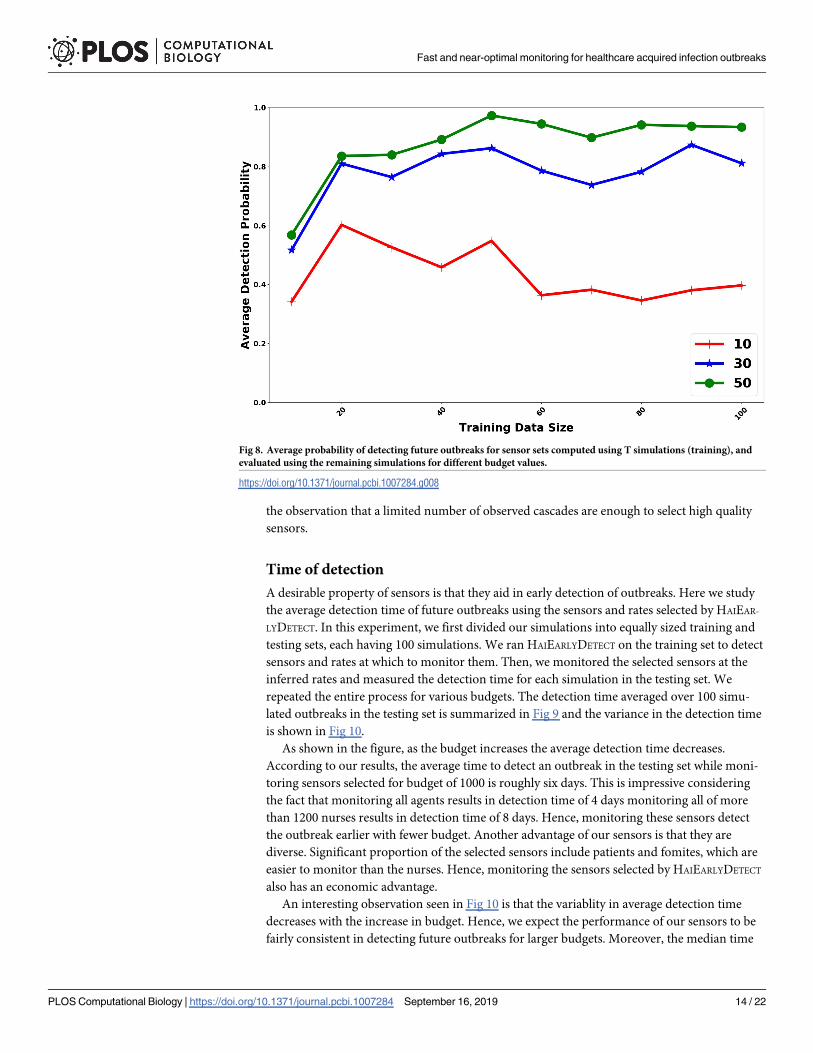
Next we study the change in performance of HAIDETECT with the training size for various
budget sizes. Here we tracked the performance of HAIDETECT for budgets of 10, 30, and 50 for
training sets of various size. The result is summarized in Fig 8.
As shown in the figure, the difference between peformance of HAIDETECT for budgets
30 and 10 is much larger than that for budgets 50 and 30. The normalized objective, or the
probability of detection, is close to 1 at budget 50, indicating that monitoring sensors at rates
assigned by HAIDETECT detects almost all the HAI outbreaks. Hence, in expectation, roughly 50
swabs a day is enough to monitor an outbreak in a hospital wing. Again, we observe that per-
formance of HAIDETECT tails off after the training size of 20. It provides extra validation for
Fig 7. Average probability of detecting future outbreaks for sensors computed using T simulations (training) for different values of T, and tested
on the remaining simulations for a budgets of (a) 10, (b) 30, and (c) 50. Note that HAIDETECT required only 20 simulation instances to detect future
outbreak with probability of 0.8.
https://doi.org/10.1371/journal.pcbi.1007284.g007
Fast and near-optimal monitoring for healthcare acquired infection outbreaks
PLOS Computational Biology | https://doi.org/10.1371/journal.pcbi.1007284 September 16, 2019 13 / 22
the observation that a limited number of observed cascades are enough to select high quality
sensors.
Time of detection
A desirable property of sensors is that they aid in early detection of outbreaks. Here we study
the average detection time of future outbreaks using the sensors and rates selected by HAIEAR-
LYDETECT. In this experiment, we first divided our simulations into equally sized training and
testing sets, each having 100 simulations. We ran HAIEARLYDETECT on the training set to detect
sensors and rates at which to monitor them. Then, we monitored the selected sensors at the
inferred rates and measured the detection time for each simulation in the testing set. We
repeated the entire process for various budgets. The detection time averaged over 100 simu-
lated outbreaks in the testing set is summarized in Fig 9 and the variance in the detection time
is shown in Fig 10.
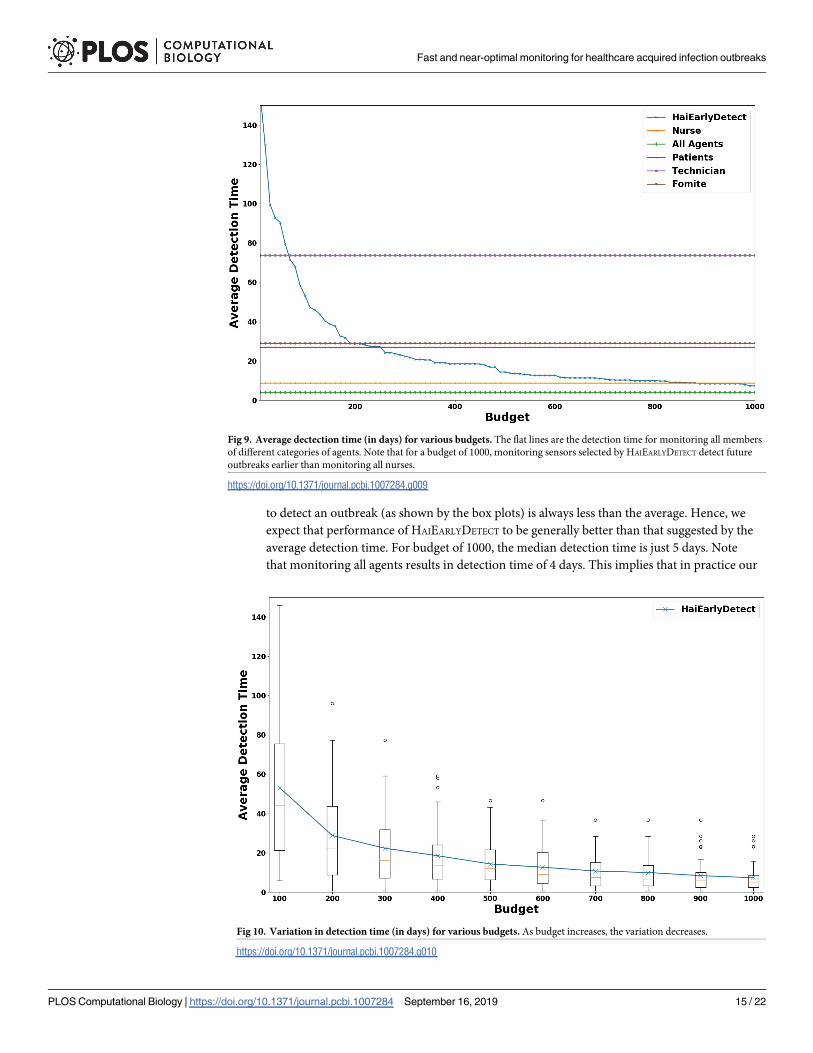
As shown in the figure, as the budget increases the average detection time decreases.
According to our results, the average time to detect an outbreak in the testing set while moni-
toring sensors selected for budget of 1000 is roughly six days. This is impressive considering
the fact that monitoring all agents results in detection time of 4 days monitoring all of more
than 1200 nurses results in detection time of 8 days. Hence, monitoring these sensors detect
the outbreak earlier with fewer budget. Another advantage of our sensors is that they are
diverse. Significant proportion of the selected sensors include patients and fomites, which are
easier to monitor than the nurses. Hence, monitoring the sensors selected by HAIEARLYDETECT
also has an economic advantage.
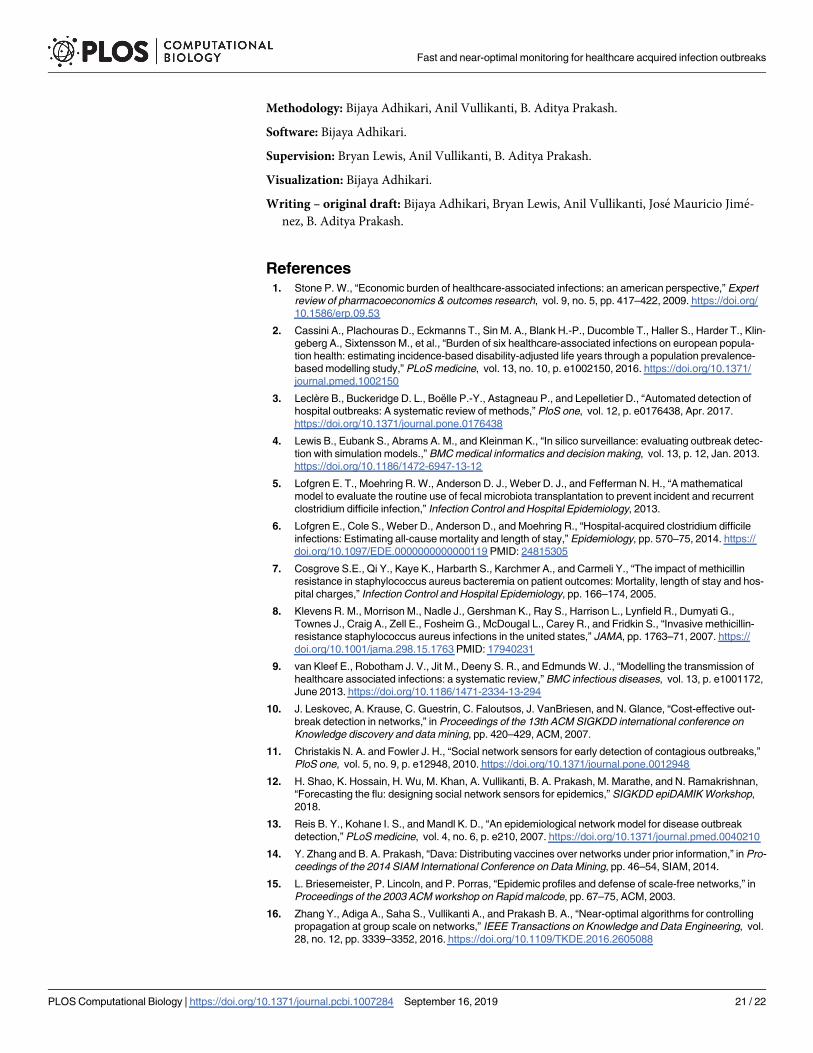
An interesting observation seen in Fig 10 is that the variablity in average detection time
decreases with the increase in budget. Hence, we expect the performance of our sensors to be
fairly consistent in detecting future outbreaks for larger budgets. Moreover, the median time
Fig 8. Average probability of detecting future outbreaks for sensor sets computed using T simulations (training), and
evaluated using the remaining simulations for different budget values.
https://doi.org/10.1371/journal.pcbi.1007284.g008
Fast and near-optimal monitoring for healthcare acquired infection outbreaks
PLOS Computational Biology | https://doi.org/10.1371/journal.pcbi.1007284 September 16, 2019 14 / 22
to detect an outbreak (as shown by the box plots) is always less than the average. Hence, we
expect that performance of HAIEARLYDETECT to be generally better than that suggested by the
average detection time. For budget of 1000, the median detection time is just 5 days. Note
that monitoring all agents results in detection time of 4 days. This implies that in practice our
Fig 9. Average dectection time (in days) for various budgets. The flat lines are the detection time for monitoring all members
of different categories of agents. Note that for a budget of 1000, monitoring sensors selected by HAIEARLYDETECT detect future
outbreaks earlier than monitoring all nurses.
https://doi.org/10.1371/journal.pcbi.1007284.g009
Fig 10. Variation in detection time (in days) for various budgets. As budget increases, the variation decreases.
https://doi.org/10.1371/journal.pcbi.1007284.g010
Fast and near-optimal monitoring for healthcare acquired infection outbreaks
PLOS Computational Biology | https://doi.org/10.1371/journal.pcbi.1007284 September 16, 2019 15 / 22

approach requires only 1000 swabs per day to detect an outbreak within a single day of the first
infection.
Number of cases prevented
An interesting question is how many potential cases can be prevented by monitoring the sen-
sors selected by HAIEARLYDETECT. Here we study how many nodes get infected before an out-
break is detected and how many potential infections can be prevented by monitoring our
sensors for various budgets. As in the previous experiment, for a given budget, we leverage
100 simulations to select sensors and their monitoring rates. Once the sensors are selected, we
count the number of infections that occur in a test simulation before a sensor is infected and
how many further infections occur following the infections of sensors. We then average these
numbers over 100 test simulations. The results are summarized in Table 2.
As shown in Table 2, for the budget of 10 samples/swabs, 4.31 potential future infections
could prevented. Note that there are only 23 infections on average per simulation. For the bud-
get of only 200, 15.02 infections could be prevented, which is about 66% of potential infections.
The number goes up to 17, or 74% for the budget of 1000. The result shows that even for a low
budget (less than 200 swabs per day), our approach could help prevent a significant number of
future infections.
Qualitative distribution of sensors
Next we study the types of agents that are selected by HAIDETECT as sensors. For this experi-
ment, we use 100 randomly selected simulations to detect sensors for a wide range of budgets.
After the sensors are selected, we sum up the rates of each category of agents like nurses, doc-
tors, patients, and so on.
Fig 11(a) shows the distribution of sensor allocation for each category of agents at low bud-
gets. We observe that for a budget of 10, nearly 60% of the total budget is spent on selecting
nurses. Since nurses are the most mobile agents, the result highlights the fact that HAIDETECT
selects the most important agents as sensors early on. Similarly, Fig 11 (b) shows the distribu-
tion of sensors for higher budgets. Here we observe that nearly 35% of the budget is allocated
for nurses. Fomites and patients have roughly equal allocations of about 20%. 17% of the bud-
get is allocated to doctors. The rest of the categories have minimal allocation. The distribution
shows that HAIDETECT selects heterogeneous sensors including both people and objects/loca-
tions as intended.
Finally, we are also interested on the scheduling implications of the sensors selected by
HAIDETECT. To this end, we measure the aggregated proportion of budget assigned to each rate
for the sensors we select. The results are summarized in Fig 12. As shown in Fig 12(a), most of
Table 2. Average number of infections (± standard deviation) before an outbreak that is detected by monitoring
sensors selected by HAIEARLYDETECT and potential number of infections prevented by detection the outbreak. For a
budget of 1000 roughly 77% of potential cases are prevented.
Budget # infections when detected # potential infections prevented
10 17.1 ± 5.8 4.3 ± 4.6
50 13.9 ± 5.9 6.5 ± 4.2
100 11.3 ± 4.4 8.2 ± 3.9
200 6.5 ± 0.5 15.0 ± 3.3
500 6.0 ± 0.2 16.2 ± 3.3
1000 5.4 ± 0.0 17.0 ± 3.2
https://doi.org/10.1371/journal.pcbi.1007284.t002
Fast and near-optimal monitoring for healthcare acquired infection outbreaks
PLOS Computational Biology | https://doi.org/10.1371/journal.pcbi.1007284 September 16, 2019 16 / 22

the sensors have rate of 0.1. Very few sensors have rate from 0.2 to 0.5. Finally, there is a sud-
den spike at rate = 1.0. When we look at rate distribution for each category separately, interest-
ingly we observe that only nurses have rates of 1.0. This implies that certain nurses have to be
monitored each day to detect HAI outbreak. The reason behind this unexpected behaviour
can be attributed to the fact that the hospital from where the mobility log was collected,
required all the nurses to attend a daily meeting. Hence, all the nurses were in contact with
each other every day and it is likely that nurses infect each other in case of an outbreak.
Hence, there is an advantage in monitoring some of the nurses everyday to quickly detect HAI
outbreak.
Discussion
Our results show that our sensor sets have good performance with respect to both the detec-
tion probability and detection time objectives, compared to the CELF baseline, as well as other
natural heuristics motivated by standard practices in a hospital. A relatively low budget ensures
a high detection probability, with low variance. Further, we find that training with a small set
of simulation cascades (e.g., 20) is able to ensure reasonably high detection probability (about
0.8). This suggests the strategy is quite practical, since, in general, detailed knowledge of how
HAIs cascade through a hospital system are difficult to obtain, thus motivating this agent-
based modeling approach.
Fig 11. Variation of sensor set distribution for HAIDETECT with budget. HAIDETECT selects intuitively meaningful sensors even for lower budgets.
https://doi.org/10.1371/journal.pcbi.1007284.g011
Fast and near-optimal monitoring for healthcare acquired infection outbreaks
PLOS Computational Biology | https://doi.org/10.1371/journal.pcbi.1007284 September 16, 2019 17 / 22

It is important to note that for simplicity of interpretation, we assume perfect detection
at each sensor, thus these results to provide an estimate of best case performance in the real
world. The sensitivity and specificity of detecting C. difficile on different fomites varies widely
and the stochastic nature of this process would require extensive sensitivity analyses, which is
beyond the scope of this particular study. Additionally, we did not simulate the course of care
for patients in this simulation, which is also highly stochastic, thus we did not include detec-
tion outside of the designed sensor scheme. This assumption removes clinically appropriate
detections, which would further improve the probability of detections reduce the time to
detection.
Fig 12. Distribution of allocation for different rates. Since most of the sensors selected by HAIDETECT have low rates, they have to
be monitored only sporadically.
https://doi.org/10.1371/journal.pcbi.1007284.g012
Fast and near-optimal monitoring for healthcare acquired infection outbreaks
PLOS Computational Biology | https://doi.org/10.1371/journal.pcbi.1007284 September 16, 2019 18 / 22

An area for improvement of the algorithm is the lengthy time of detection anticipated for
limited budgets under 100 sensors. A much larger budget is needed for quick detection times,
which is a harder problem for myriad reasons. In particular, a budget of about 1000 is needed
to get the detection time under a week. In contrast, monitoring strategies which monitor all
agents of a specific type (e.g., all patients, all technicians, all nurses) lead to much lower detec-
tion time bounds. However, the number of nurses is almost 20% larger than this budget; fur-
ther, monitoring all nurses is not a very practical strategy. Our sensor sets are much more
practical in the sense that they include different types of agents (including fomites). Only when
all nurses are monitored, is the detection time is close to a week. It is important to note that
this time to detection is being measured from the very beginning of infection from the first
case in the cascade. Many HAI infection cascades can remain undetected for many generations
of transmission, which is impossible to measure in the real-world, and indeed may persist in a
hospital for years. Thus a monitoring system that increases the probability of eventually detect-
ing a cascade and provides expected detection times in the order of several months can repre-
sent a significant improvement.
Our approach requires mobility and activity data in a hospital, along with data on disease
incidence. This type of data are difficult to obtain even well resourced field trials, especially
in the quantity needed for the robust sensitivity analyses presented here. While these limita-
tions were the primary motivation for the use of agent-based simulations, this simulated data
remains a major limitation. While a field trial would provide more convincing evidence of the
actual real-world performance of HAIDETECT, the purpose here was to evaluate its performance
and motivate its potential use in a resource intensive field trial. We also note that no prior
work on HAI modeling and control studies consider problems at the level of detail we consider
here.
Our approach shows how HAI outbreaks can be detected in a resource intensive case and
provides a way to prioritize detection efforts which are useful from practitioner’s viewpoint.
Based on our empirical results, we recommend monitoring nurses, physicians, objects/loca-
tions and patients. These results are generalizable to settings like most ICU units in the United
States that follow similar divisions of labor and intensity of care. To customize the approach to
other venues, we recommend practitioners to follow our calibration and simulation approach
to produce simulated outbreaks using similar data, which would provide better estimates on
the exact reductions one could expect and which exact individuals and locations to monitor.
Similarly, detecting HAI as early as possible is important and quite costly when not detected.
Our results show that using 1000 swabs a day, the infection could be detected with a delay of
a single day. With a budget for 200 swabs a day we could detect the outbreak within 16 days
on average. Practitioners can use our results or methodology, to weigh the costs and benefits
appropriate to their location based on their resources and desired need for timeliness and
cases prevented.
Our results on sensor rate distribution and comparison against the CELF show the bene-
fits of monitoring with lower rates on a larger set rather than higher rates on a smaller set.
This can be more robust in practice as compliance tends to fade when focused with high
intensity on a smaller set of individuals. Similarly, with a budget of 50 swabs a day, we can
detect future outbreaks with a success rate close to of 1. And with a budget of 200 swabs a
day, we can detect the outbreak within 16 days on average. This is quite surprising and useful
for practitioners. And finally, with a budget of around 200 swabs a day, the outbreak can be
detected before 70% of the infections occur. Hence, this approach can also aid in control of
HAI outbreak. From a practitioner’s perspective prevention of this level of potential future
cases is a great benefit.
Fast and near-optimal monitoring for healthcare acquired infection outbreaks
PLOS Computational Biology | https://doi.org/10.1371/journal.pcbi.1007284 September 16, 2019 19 / 22

Conclusion
Effective and early detection of HAI outbreaks are important problems in hospital infection
control, and have not been studied systematically so far. While these are challenging problems,
understanding their structure can help in designing effective algorithms and optimizing
resources. Current practices in hospitals are fairly simple, and do not attempt to optimize
resources. Our algorithms perform better than many natural heuristics, and our results show
that a combination of data and model driven approach is effective in detecting HAIs. Since
there is limited data on disease incidence, good models and simulations play an important role
in designing algorithms and evaluating them.
Supporting information
S1 Text. Appendix: Proofs for submodularity, NP-hardness, and online bound.
(PDF)
S1 Fig. Variation of sensor set distribution for Celf. Note that Celf picks more patients and
less nurses than HaiDetect for lower budgets, which explains its poor performance in the test
set (Fig 6).
(TIF)
S2 Fig. Average detection time on training data for HaiEarlyDetect. As expected, HaiEarly-
Detect has even better detection time on training data.
(TIF)
S3 Fig. Variation in average detection time on training data for HaiEarlyDetect.
(TIF)
S4 Fig. Overlap between sensors selected by HaiDetect and Celf various budgets. There is
only roughly 10% overlap between Celf and HaiDetect, highlighting that HaiDetect selects dif-
ferent nodes and rates than Celf.
(TIF)
S1 Data. Mobility logs for days 1 to 100.
(ZIP)
S2 Data. Mobility logs for days 101 to 200.
(ZIP)
S3 Data. Calibrated simulations of C. difficile outbreak.
(ZIP)
S4 Data. Social network resulted by the interactions in the mobility log.
(ZIP)
S5 Data. A documentation of the data. Describes the format of each file in detail.
(MD)
Author Contributions
Conceptualization: Bijaya Adhikari, Bryan Lewis, Anil Vullikanti, B. Aditya Prakash.
Data curation: Bijaya Adhikari, Bryan Lewis, Jose Mauricio Jimenez.
Formal analysis: Bijaya Adhikari, Anil Vullikanti, B. Aditya Prakash.
Fast and near-optimal monitoring for healthcare acquired infection outbreaks
PLOS Computational Biology | https://doi.org/10.1371/journal.pcbi.1007284 September 16, 2019 20 / 22
Methodology: Bijaya Adhikari, Anil Vullikanti, B. Aditya Prakash.
Software: Bijaya Adhikari.
Supervision: Bryan Lewis, Anil Vullikanti, B. Aditya Prakash.
Visualization: Bijaya Adhikari.
Writing – original draft: Bijaya Adhikari, Bryan Lewis, Anil Vullikanti, Jose Mauricio Jime-
nez, B. Aditya Prakash.
References1. Stone P. W., “Economic burden of healthcare-associated infections: an american perspective,” Expert
review of pharmacoeconomics & outcomes research, vol. 9, no. 5, pp. 417–422, 2009. https://doi.org/
10.1586/erp.09.53
2. Cassini A., Plachouras D., Eckmanns T., Sin M. A., Blank H.-P., Ducomble T., Haller S., Harder T., Klin-
geberg A., Sixtensson M., et al., “Burden of six healthcare-associated infections on european popula-
tion health: estimating incidence-based disability-adjusted life years through a population prevalence-
based modelling study,” PLoS medicine, vol. 13, no. 10, p. e1002150, 2016. https://doi.org/10.1371/
journal.pmed.1002150
3. Leclère B., Buckeridge D. L., Boelle P.-Y., Astagneau P., and Lepelletier D., “Automated detection of
hospital outbreaks: A systematic review of methods,” PloS one, vol. 12, p. e0176438, Apr. 2017.
https://doi.org/10.1371/journal.pone.0176438
4. Lewis B., Eubank S., Abrams A. M., and Kleinman K., “In silico surveillance: evaluating outbreak detec-
tion with simulation models.,” BMC medical informatics and decision making, vol. 13, p. 12, Jan. 2013.
https://doi.org/10.1186/1472-6947-13-12
5. Lofgren E. T., Moehring R. W., Anderson D. J., Weber D. J., and Fefferman N. H., “A mathematical
model to evaluate the routine use of fecal microbiota transplantation to prevent incident and recurrent
clostridium difficile infection,” Infection Control and Hospital Epidemiology, 2013.
6. Lofgren E., Cole S., Weber D., Anderson D., and Moehring R., “Hospital-acquired clostridium difficile
infections: Estimating all-cause mortality and length of stay,” Epidemiology, pp. 570–75, 2014. https://
doi.org/10.1097/EDE.0000000000000119 PMID: 24815305
7. Cosgrove S.E., Qi Y., Kaye K., Harbarth S., Karchmer A., and Carmeli Y., “The impact of methicillin
resistance in staphylococcus aureus bacteremia on patient outcomes: Mortality, length of stay and hos-
pital charges,” Infection Control and Hospital Epidemiology, pp. 166–174, 2005.
8. Klevens R. M., Morrison M., Nadle J., Gershman K., Ray S., Harrison L., Lynfield R., Dumyati G.,
Townes J., Craig A., Zell E., Fosheim G., McDougal L., Carey R., and Fridkin S., “Invasive methicillin-
resistance staphylococcus aureus infections in the united states,” JAMA, pp. 1763–71, 2007. https://
doi.org/10.1001/jama.298.15.1763 PMID: 17940231
9. van Kleef E., Robotham J. V., Jit M., Deeny S. R., and Edmunds W. J., “Modelling the transmission of
healthcare associated infections: a systematic review,” BMC infectious diseases, vol. 13, p. e1001172,
June 2013. https://doi.org/10.1186/1471-2334-13-294
10. J. Leskovec, A. Krause, C. Guestrin, C. Faloutsos, J. VanBriesen, and N. Glance, “Cost-effective out-
break detection in networks,” in Proceedings of the 13th ACM SIGKDD international conference on
Knowledge discovery and data mining, pp. 420–429, ACM, 2007.
11. Christakis N. A. and Fowler J. H., “Social network sensors for early detection of contagious outbreaks,”
PloS one, vol. 5, no. 9, p. e12948, 2010. https://doi.org/10.1371/journal.pone.0012948
12. H. Shao, K. Hossain, H. Wu, M. Khan, A. Vullikanti, B. A. Prakash, M. Marathe, and N. Ramakrishnan,
“Forecasting the flu: designing social network sensors for epidemics,” SIGKDD epiDAMIK Workshop,
2018.
13. Reis B. Y., Kohane I. S., and Mandl K. D., “An epidemiological network model for disease outbreak
detection,” PLoS medicine, vol. 4, no. 6, p. e210, 2007. https://doi.org/10.1371/journal.pmed.0040210
14. Y. Zhang and B. A. Prakash, “Dava: Distributing vaccines over networks under prior information,” in Pro-
ceedings of the 2014 SIAM International Conference on Data Mining, pp. 46–54, SIAM, 2014.
15. L. Briesemeister, P. Lincoln, and P. Porras, “Epidemic profiles and defense of scale-free networks,” in
Proceedings of the 2003 ACM workshop on Rapid malcode, pp. 67–75, ACM, 2003.
16. Zhang Y., Adiga A., Saha S., Vullikanti A., and Prakash B. A., “Near-optimal algorithms for controlling
propagation at group scale on networks,” IEEE Transactions on Knowledge and Data Engineering, vol.
28, no. 12, pp. 3339–3352, 2016. https://doi.org/10.1109/TKDE.2016.2605088
Fast and near-optimal monitoring for healthcare acquired infection outbreaks
PLOS Computational Biology | https://doi.org/10.1371/journal.pcbi.1007284 September 16, 2019 21 / 22

17. P. Rozenshtein, A. Gionis, B. A. Prakash, and J. Vreeken, “Reconstructing an epidemic over time,” in
Proceedings of the 22nd ACM SIGKDD International Conference on Knowledge Discovery and Data
Mining, pp. 1835–1844, ACM, 2016.
18. J. M. Jimenez, B. L. Lewis, and S. Eubank, “The application of macroergonomics and simulation to
improve control of healthcare acquired infections,” in Proceedings of the 2013 Winter Simulation Con-
ference: Simulation: Making Decisions in a Complex World, pp. 3938–3939, IEEE Press, 2013.
19. J. M. Jimenez, B. Lewis, and S. Eubank, “Hospitals as complex social systems: Agent-based simula-
tions of hospital-acquired infections,” in International Conference on Complex Sciences, pp. 165–178,
Springer, 2012.
20. J. M. Jimenez, The utilization of macroergonomics and highly-detailed simulation to reduce healthcare-
acquired infections. PhD thesis, Virginia Tech, 2014.
21. Rubin M. A., Jones M., Leecaster M., Khader K., Ray W., Huttner A., Huttner B., Toth D., Sablay T., Bor-
otkanics R. J., et al., “A simulation-based assessment of strategies to control clostridium difficile trans-
mission and infection,” PloS one, vol. 8, no. 11, p. e80671, 2013. https://doi.org/10.1371/journal.pone.
0080671
22. Nelson R. E., Jones M., Leecaster M., Samore M. H., Ray W., Huttner A., Huttner B., Khader K., Ste-
vens V. W., Gerding D., et al., “An economic analysis of strategies to control clostridium difficile trans-
mission and infection using an agent-based simulation model,” PloS one, vol. 11, no. 3, p. e0152248,
2016. https://doi.org/10.1371/journal.pone.0152248
23. R. Carrico, K. Bryant, F. Lessa, B. Limbago, L. Fauerbach, J. Marx, F. Sands, D. Stephens, K. Westhus-
ing, and T. Wiemken, “Guide to preventing clostridium difficile infections,” APIC, vol. 16, 2013.
24. Cohen S. H., Gerding D. N., Johnson S., Kelly C. P., Loo V. G., McDonald L. C., Pepin J., and Wilcox M.
H., “Clinical practice guidelines for clostridium difficile infection in adults: 2010 update by the society for
healthcare epidemiology of america (shea) and the infectious diseases society of america (idsa),” Infec-
tion Control & Hospital Epidemiology, vol. 31, no. 5, pp. 431–455, 2010. https://doi.org/10.1086/651706
25. Karadsheh Z. and Sule S., “Fecal transplantation for the treatment of recurrent clostridium difficile infec-
tion,” North American journal of medical sciences, vol. 5, no. 6, p. 339, 2013. https://doi.org/10.4103/
1947-2714.114163
26. Sunenshine R. H., McDonald L. C., et al., “Clostridium difficile-associated disease: new challenges from
an established pathogen,” Cleveland Clinic journal of medicine, vol. 73, no. 2, p. 187, 2006.
27. Yoo J. and Lightner A. L., “Clostridium difficile infections: what every clinician should know,” The Perma-
nente Journal, vol. 14, no. 2, p. 35, 2010. https://doi.org/10.7812/TPP/10-001
28. C. L. Barrett, K. R. Bisset, S. G. Eubank, X. Feng, and M. V. Marathe, “Episimdemics: an efficient algo-
rithm for simulating the spread of infectious disease over large realistic social networks,” in High Perfor-
mance Computing, Networking, Storage and Analysis, 2008. SC 2008. International Conference
for, pp. 1–12, IEEE, 2008.
29. Halloran M. E., Ferguson N. M., Eubank S., Longini I. M., Cummings D. A., Lewis B., Xu S., Fraser C.,
Vullikanti A., Germann T. C., et al., “Modeling targeted layered containment of an influenza pandemic in
the united states,” Proceedings of the National Academy of Sciences, vol. 105, no. 12, pp. 4639–4644,
2008. https://doi.org/10.1073/pnas.0706849105
30. Wendelsdorf K. V., Alam M., Bassaganya-Riera J., Bisset K., Eubank S., Hontecillas R., Hoops S., and
Marathe M., “Enteric immunity simulator: a tool for in silico study of gastroenteric infections,” IEEE trans-
actions on nanobioscience, vol. 11, no. 3, pp. 273–288, 2012. https://doi.org/10.1109/TNB.2012.
2211891
31. J.-S. Yeom, A. Bhatele, K. Bisset, E. Bohm, A. Gupta, L. V. Kale, M. Marathe, D. S. Nikolopoulos, M.
Schulz, and L. Wesolowski, “Overcoming the scalability challenges of epidemic simulations on blue
waters,” in 2014 IEEE 28th International Parallel and Distributed Processing Symposium, pp. 755–764,
IEEE, 2014.
32. T. Soma and Y. Yoshida, “Maximizing monotone submodular functions over the integer lattice,” in Inter-
national Conference on Integer Programming and Combinatorial Optimization, pp. 325–336, Springer,
2016.
Fast and near-optimal monitoring for healthcare acquired infection outbreaks
PLOS Computational Biology | https://doi.org/10.1371/journal.pcbi.1007284 September 16, 2019 22 / 22