Embed Size (px)
Citation preview

A Heuristic Method for IdentifyingNear-Optimal Defending Strategiesfor a Road Network Subject to TrafficCongestion
Mengyao Gao, Bo Zhang, Vicki M. Bier and Tao Yao
Abstract In this study we investigate the vulnerability of road networks to inter-dictions. We consider that an intentional attacker wants to maximize the congestionlevel on the network by interdicting some links of the network. The drivers areassumed to be selfish and always choose the route that minimizes the individual travelcost. In this case, network traffic flow follows user equilibrium (UE) traffic assign-ment, which however is affected by the interdiction initiated by the attacker. In thisproblem, the role of the defender is to minimize the damage that can be caused by anattack. A heuristic method is developed to solve for near-optimal attack (interdiction)and defense strategies, the effectiveness of which is demonstrated by simulationresults. Numerical experiments are conducted to examine factors that influence theapplication of this method. Specifically, we compare the efficiency of this methodwhen applied to different Cartesian grid-like networks. Managerial insights into thevulnerability and defense of road networks are drawn from the analysis.
1 Introduction
In recent decades, there have been more and more cases of terrorist attacks ontransportation systems, not only endangering human beings’ lives, but alsodestroying infrastructure systems such as food supply, telecommunication, financeand electric power. The most well-known are bombings of railway transit inMadrid, London, and Singapore, as well as “9.11.” Reports give an impression thatrailway and flight are at higher risk than other modes of transport. However, a
M. Gao � T. YaoPennsylvania State University, State College, PA, USA
B. ZhangDepartment of Industry Solutions, IBM Research-china, Beijing, China
V.M. Bier (&)University of Wisconsin, Madison, WI, USAe-mail: [email protected]
© Springer International Publishing Switzerland 2015K. Hausken and J. Zhuang (eds.), Game Theoretic Analysis of Congestion,Safety and Security, Springer Series in Reliability Engineering,DOI 10.1007/978-3-319-11674-7_6
143

project named “Light Rail Now” [10] reveals that most terrorist incidents actuallyoccurred on road networks, based on data from the US State Department andWikipedia for the 41-year period from 1967 to 2007. Figure 1 shows the terroristincident counts in different transport modes [10]. Over 80 % of terrorist incidentsoccurred on road networks, including 74.9 % involving private vehicles and 9.5 %involving buses, causing about 30,000 deaths and injuries. Thus, defending the roadnetwork against terrorist attacks is clearly important.
How can we defend a road network? Let us imagine a terrorist attack on a roadnetwork. At the beginning of the attack, no government agency would be able torespond immediately. Each driver or pedestrian on the road would try to rush to asafe place, which would make traffic highly congested. After a while (maybeseveral minutes, if the attack occurred in a large modern city), ambulances andpolice would rush to the site to save lives. However, they may not be able to get totheir destination quickly, because of congestion and damage to the transportationinfrastructure. Therefore, actions of defending should ideally be taken before anattack in order to increase the robustness and defensibility of the road network. Inthis chapter, we develop a heuristic method to determine a near-optimal group oflinks to be protected to minimize the cost associated with a potential terrorist attack.
Optimizing networks against interdiction is often a multi-objective problem.Royset and Wood [14] define an attacker’s network interdiction process as a bi-objective maximum-flow network-interdiction problem, i.e., minimizing post-inter-diction maximum flow (capacity of the network) and minimizing “total interdictioncost” (interdiction resource cost). The problem is modeled from the attackers’ per-spective, aiming at destroying as much of the network as possible at the lowest cost.They propose a new structure of algorithms to find the efficient frontier in the cost-to-effectiveness tradeoff. Murray and Mahmassani [11] create a bi-level mathematicalprogram to identify vulnerable links in various scenarios. Feng andWen [5] optimizea traffic control system for earthquake disasters which cause interdictions in thetransportation. To maximize the traffic volume and minimize travel time, they build abi-level programing model. A study by Ng et al. [12] about shelter allocation inemergency evacuations is also a bi-objective problem in static user equilibrium, usingbi-level programming. Objectives in that study are to maximize the volume of peoplesheltered and tominimize the routes. However, these researchers base their models onshortest path theory without considering congestion. In their models, each route is
Fig. 1 Terrorist incidentsinvolving transportation(1967–2007)
144 M. Gao et al.

given a fixed weight representing either distance or travel time, and each driver isassumed to choose the route with the minimum weight. If some link on that route isinterdicted, the driver will then select the route with the second minimum weight, etc.These models cannot accurately characterize road network flow when the traveldemand on the network is large enough to cause congestion on some links. However,congestion is widespread in urban traffic, and as we mentioned earlier will becomemore serious when the urban transportation network is attacked.
To our knowledge, only Bier and Hausken [2] take congestion into accountwhen choosing network defense strategies. Two cases on a two-arc network arestudied—one when both arcs work, and one when one of the arcs is interdicted. Theauthors also assume that a driver may refuse to travel if the travel time exceedssome reservation time, which creates a penalty. By comparing the total travel timeand penalty time in these two cases, they suggest that more defense effort should beassigned to less congested arcs, and to routes with larger capacity.
Although there are not many studies on interdiction and defense of traffic net-works, there is a rich literature about interdiction and defense of other networks,like power and security systems. These studies provide us an effective strategy forreducing loss from attacks, which is to identify the critical links in the network andthen defend them or allocate fortification resources nearby. For example, Churchand Scaparra [4] apply the p-median model to identify the assets whose failureswould result in the maximum loss to a system. In power systems, Bier et al. [3]identify the transmission lines with the maximum current flow as critical and defendthem against interdictions. The authors propose a nested algorithm to iterativelychoose the critical links to secure. In this chapter, we borrow the idea of a nestedalgorithm, and develop a heuristic method to identify near-optimal defense strate-gies for a road network subject to congestion.
In particular, we address network defense problems subject to traffic congestionon networks of more reasonable size than in [2], but without the concept of res-ervation times. Specifically, we define three types of players (drivers, a defender,and an attacker), and two types of strategic actions (attacking and defending). Theattacker, such as a terrorist, plans an intentional attack on one or more links of aroad network to maximize social loss. The defender knows of the threat from theattacker, but does not know which links will be attacked. In order to minimize theloss, the defender wishes to secure some links so that they cannot be interdicted bythe attacker. The drivers in the network are assumed to be selfish, and the trafficflow can be characterized by UE. We view the problem from the perspective of thedefender and develop a heuristic method to solve for near-optimal defense strate-gies. Numerical experiments are conducted to demonstrate that the proposedmethod can apply to realistic Cartesian-grid networks.
The remainder of this chapter is organized as follows. In Sect. 2, we show ourUE model and present a convex combination method to solve the model. Wepropose a heuristic method to find near-optimal defense strategies for a congestedtraffic network in Sect. 3, and give a simple example of its application in Sect. 4.Section 5 presents two sets of numerical experiments to explore the effectiveness ofour method. We conclude our study in Sect. 6.
A Heuristic Method for Identifying Near-Optimal Defending Strategies … 145

2 Problem Formulation
2.1 Notation
The network can be represented as a graph G = (V, E), where V is a set of nodes andE is a set of links. Let qrs be the travel rate between origin r and destination s,comprising the origin-destination (O-D) demand matrix. In this chapter, the O-Ddemand matrixes are given beforehand. Let xm denote the flow on link m, and tmdenote the travel time on link m. For the case of congestion, tm ¼ t xmð Þ, indicatingthat the travel time on link m is a function of the flow. Let wrs
i be the flow on routei between origin r and destination s. Thus, we have the relationshipxm ¼ P
r
Ps
Pi w
rsi d
rsm;i; 8m, meaning that the flow on each link is the sum of the
flows on all routes using that link, where drsm;i ¼ 1 if route i goes through link m anddrsm;i ¼ 0 if not. Table 1 summarizes the notation.
The assumptions of this chapter are that:
1. The attacker knows what has been defended and won’t waste his/her attack ondefended infrastructure;
2. All flows are simultaneous.
2.2 UE Model
Wardrop’s two principles [18] are commonly used to characterize traffic assignmenton a network. The first principle assumes that the driver chooses the route fromorigin to destination with the shortest travel time among all available routes,neglecting how his or her decision affects other drivers. The second principle [18]assumes that every driver’s route choice is controlled by a central planner who aimsto efficiently utilize the system to obtain the minimum average travel time. UE andsystem optimum (SO) models (stemming from the first and second principles,
Table 1 NotationSymbol Description
G Network
V A set of nodes in the network
E A set of links in the network
xm Flow on link m
tm Travel time on link m
wrsi Flow on route i from origin r to destination s
drsm;i drsm;i ¼ 1 if route i goes through link m and drsm;i ¼ 0if not
qrs Travel rate between origin r and destination s
146 M. Gao et al.

respectively) can be applied to calculate traffic flows and travel times for each route.In this chapter, we assume that the attack on the network is sudden, so that a centralplanner would not be able to react immediately. Therefore, in this case, UE fits theproblem better than SO.
To obtain the link-flow pattern, the UE model can be constructed as a programwith a nonlinear objective function and linear constraints. Beckmann et al. [1] givethe following formulation:
minz x!� � ¼ Xm
Zxm0
t sð Þds ð1aÞ
subject to
Xi
wrsi ¼ qrs 8r; s ð1bÞ
xm ¼Xr
Xs
Xi
wrsi d
rsm;i 8m ð1cÞ
wrsi � 0 8i; r; s: ð1dÞ
In this formula, optimizing the objective function guarantees equilibrium. Theobjective function (1a) is to minimize the sum of the integrals of the travel timefunction for links. It is a strictly mathematical construct to solve equilibriumproblems, without any economic or behavioral indication. Constraint (1b) illustratesthat the flow on all routes from an origin to a destination is equal to the corre-sponding O-D travel demand. Equation (1c) defines the flow on link m. Constraint(1d) is the non-negativity constraint.
Beckmann et al. [1] prove the equivalence of formulation (1a, 1b, 1c, 1d) and theUE problem, as well as the uniqueness of the solution. For details, see [1].
2.3 Convex Combination Algorithm
Researchers have proposed various methods to determine vehicle flows using a UEmodel. Scarf [15], Todd [17], and Garcia and Zangwill [12] develop a fixed pointmethod and explore its application. Pang and Chan [13] create a generalized linearmethod, as well as successive linearization with Lemke’s method. Frank and Wolfe[7] first proposed the convex combination method, which was later improved byFlorian and Nguyen [6]. For comparison of these methods, please refer to Friesz [8]and Sheffi [16]. Here, for reasons of both computational efficiency and accuracy, weselect Frank and Wolfe’s convex combination method to solve our UE model.
A Heuristic Method for Identifying Near-Optimal Defending Strategies … 147

The convex combination method transforms the original nonlinear objectivefunction to a linear approximation function. With subsequent iterations, the opti-mum of the linear program gets closer and closer to the optimum of the originalprogram. Once it satisfies the convergence condition, the optimal solution for theUE model is obtained from the transformed program.
In detail, in the nth iteration, the direction that minimizes z xn!� �
is y!� xn!. The
slope of z xn!� �
in this direction is
�rz xn!� �
�y!� xn
!� �y!� xn
!��� ���T
ð2Þ
Here y! is an auxiliary feasible solution in the feasible region. For any given y!, thedropped objective function can be changed to a linear approximation:
zn y!� � ¼ z xn!� �
� �rz xn!� �
�y!� xn
!� �y!� xn
!��� ���T2
64375 � y!� xn
!��� ���¼ z xn
!� �þrz xn
!� �� y!� xn
!� �ð3Þ
Then, in the nth iteration, the descent direction that minimizes the objectivefunction can be found through the approximate linear program,
min znð y!Þ ¼ zðxn!Þ þrzðxn!Þ � ð y!� xn!Þ ð4aÞ
subject to Xi
wrsi ¼ qrs 8r; s ð4bÞ
ym ¼Xr
Xs
Xi
wrsi d
rsm;i 8m ð4cÞ
wrsi � 0 8i; r; s ð4dÞ
After the direction y!� xn!
is known, it is easy to show that the flow assignment forthe next iteration is
xnþ1��! ¼ xn
!þ a y!� xn!� �
ð5Þ
where a is the step size. Since z is a convex function, when it reaches its maximumvalue, the differential of this function is equal to zero. In this way, a can becalculated from the following formula:
148 M. Gao et al.

ooa
z xn!þ a y!� xn
!� �h i¼ 0 ð6Þ
To conclude, the convex combination algorithm can be stated as follows:
Step 0: Initialization. Load flow x1!
onto the empty network according tot1m ¼ tð0Þ; 8m. Set n ¼ 1.
Step 1: Direction search. Solve the approximate linear program (4a, 4b, 4c, 4d) to
get descent direction y!� xn!.
Step 2: Step size. Find a by solving
ooa
z xn!þ a y!� xn
!� �h i¼ 0 ð7Þ
Step 3: New flow. Set the flow xnþ1��! ¼ xn
!þ a y!� xn!� �
Step 4: Convergence. If the stopping criteria z xn!� �
� z xn�1��!�
\ 0:01�
is
satisfied, output xnþ1��!
; otherwise, set n ¼ nþ 1 and go back to step 1.
3 Algorithm
3.1 A Heuristic Method
In order to improve the road network in terms of congestion after attacks, our task isto deal with two critical issues. The first issue is to find the equilibrium vehicle flow inthe traffic network under the assumption of UE. The convex combination methodintroduced in Sect. 2.3 works here to optimize the UE model. The second issue is toprotect the network against supposed attacks, which will be discussed in this section.
To solve the second issue, we here propose the heuristic of identifying the arcstransporting the largest vehicle flow as the most critical links, and protecting themfrom attack. Specifically, the heuristic interdicts the unprotected link with maxi-mum flow by deleting it from the original network; after multiple “vulnerable” linksare identified in sequentially updated versions of the network, these deleted linksare added back into the network but are considered to be invulnerable to attack.
The complete algorithm combines this heuristic method with the convex com-bination method. At each iteration, the heuristic assumes that terrorists will attackthe link with maximum flow, as computed by the convex combination method, andremoves this link from the original network. We define a set K which stores thesevulnerable links temporarily. When a predetermined number of links have beeninterdicted, these deleted links are selected for protection, removed from K and putinto a protection set X. The specific steps are listed below.
A Heuristic Method for Identifying Near-Optimal Defending Strategies … 149

Step 0–1: Initialization. Set j ¼ 0 and X ¼ Ø.Step 0–2: Initialization. Set l ¼ 0 and K = Ø.
Step 1: Attacks. Run the convex combination method to assign the equilibriumflow. Select the arc with maximum flow and remove it from the network.If there is more than one such arc, select randomly. If the selected arc isalready an element of X, select the arc with the next highest flow toattack, etc. This selected arc is added into K.
Step 2: Set l ¼ lþ1 and go back to step 1, until l equals to u (where u is thepredetermined number of arcs to be added to the set X per iteration).
Step 3: Set X ¼ Xþ K. This is to add the links in K into the protection set X.Step 4: Set j ¼ jþ 1 and return to step 0–2, until j equals to v (where v is a
predetermined number of iterations).
4 An Illustrative Example
4.1 Data Description
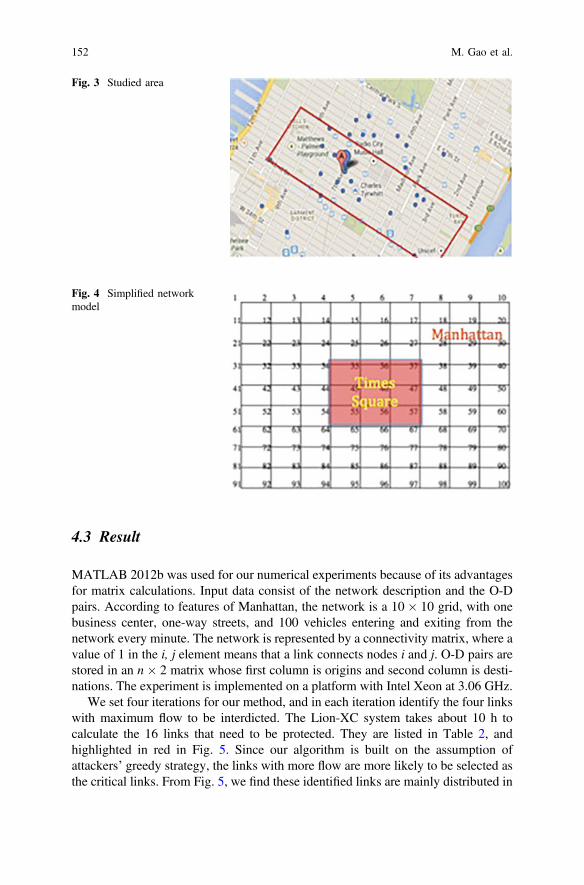
We now apply our method to the Manhattan road network. From Fig. 2, we can tellthat the Manhattan transportation network is a Cartesian grid. The Cartesian gridtraffic network is common in U.S. cities. As a result, our research focuses on thiskind of network. Since actual traffic flows are complicated, we simplify the networkby focusing on a smaller region of ten avenues and ten streets (9 blocks by 9blocks) around Times Square, as displayed in Fig. 3, and labeled as shown in Fig. 4.For simplicity, we further assume that the distance between any pair of adjacentnodes is 0.1 mile, and that all the streets are one-direction. The speed limit is takento be 20 miles/h when there is no congestion. We assume that the relationshipbetween the travel time and flow is quadratic in the form t ¼ bþ cx2. When x = 0,the travel time is 0.1 miles divided by 20 miles/h, or 18 s per block. The congestioncoefficient is assumed to be 0.05, so the congestion function is tm ¼ 18þ 0:05x2m.
Since Times Square is at the center of this network, we set a small square (threeblocks by three blocks) as the center area, and assume 100 vehicles enter or exitfrom this area every minute. The corresponding origins or destinations for these O-D pairs are averagely located in our study area, i.e. Manhattan. Note that in thischapter we measure flow by volume per unit time and allow the flow on a specificarc to be fractional.
4.2 Measurement
This new approach is expected to protect some important streets so as to reduce theimpact of attacks. Based on this goal, the performance of this method can bemeasured as the improvement in overall cost (i.e., travel time) compared to theoverall cost of the unprotected network:
150 M. Gao et al.

improvement ¼ � c2 � c0ð Þ � c1 � c0ð Þc1 � c0
ð8Þ
Here, c2 is the expected system cost of the protected network after a random attack.c1 is the expected cost of the corresponding unprotected network after a randomattack, and c0 is the cost of the original network without attacks.
Fig. 2 Overview ofManhattan
A Heuristic Method for Identifying Near-Optimal Defending Strategies … 151
4.3 Result
MATLAB 2012b was used for our numerical experiments because of its advantagesfor matrix calculations. Input data consist of the network description and the O-Dpairs. According to features of Manhattan, the network is a 10� 10 grid, with onebusiness center, one-way streets, and 100 vehicles entering and exiting from thenetwork every minute. The network is represented by a connectivity matrix, where avalue of 1 in the i, j element means that a link connects nodes i and j. O-D pairs arestored in an n� 2 matrix whose first column is origins and second column is desti-nations. The experiment is implemented on a platform with Intel Xeon at 3.06 GHz.
We set four iterations for our method, and in each iteration identify the four linkswith maximum flow to be interdicted. The Lion-XC system takes about 10 h tocalculate the 16 links that need to be protected. They are listed in Table 2, andhighlighted in red in Fig. 5. Since our algorithm is built on the assumption ofattackers’ greedy strategy, the links with more flow are more likely to be selected asthe critical links. From Fig. 5, we find these identified links are mainly distributed in
Fig. 3 Studied area
Fig. 4 Simplified networkmodel
152 M. Gao et al.

Times Square, which conforms to our anticipation and to our traditional view that acenter area is more vulnerable than other areas.
We randomly attack five links of this network after the 16 links identified aboveare assumed to be protected, to test the effectiveness of our defense. After 100replicates, we get an average improvement of 14.1 % in this network. (The standarddeviation is 1.625 with 99 degrees of freedom, showing that we had enough rep-lications.) Verified by t-test, the average is a good estimate, with statistical sig-nificant of 0.05 and t statistic of 0.875. This indicates that if we protect the criticallinks listed in Table 2, we can get roughly 14 % better performance than that of theunprotected network.
Table 2 Critical linksLink number Link (node, node)
1 (34, 35)
2 (54, 55)
3 (14, 15)
4 (56, 66)
5 (56, 57)
6 (36, 37)
7 (16, 17)
8 (68, 78)
9 (45, 46)
10 (35, 45)
11 (65, 66)
12 (26, 36)
13 (45, 55)
14 (43, 53)
15 (47, 57)
16 (41, 51)
Fig. 5 Protected network
A Heuristic Method for Identifying Near-Optimal Defending Strategies … 153

5 Numeric Experiments
In this section, we conduct two sets of numerical experiments, in order to getinsights into the performance of our heuristic method. The first set of experimentsexplores the range of applicability of the method. The second set of experimentsdetermines the relationship between vulnerability and defense of road networks.
5.1 Experiment 1
Our method may of course perform differently in different networks, even if weprotect the same number of links. To explore the range of applicability, wetherefore vary the networks along four dimensions:
1. Size (numbers of nodes and arcs).2. Traffic flow (amount of travel between given O-D pairs).3. Number of business centers in the network (assuming that most O-D pairs will
have either an origin or a destination within a business center).4. Directionality of streets (one-way or two-way).
In order to figure out which factors affect the performance of our method mostsignificantly, we design a 24�1 fractional factorial experiment and study a set ofeight hypothetical urban traffic networks based on the example in Sect. 4. (Asbefore, we consider only Cartesian grids, and every node except for boundary nodesis assumed to be linked with the four other closest nodes.)
The input parameters are listed in Table 3.For convenience, the high value of each factor is coded as +, and the low value is
coded as −. The resulting two-level fractional factorial design is shown in Table 4.This experiment provides sufficient information to estimate both main effects andtwo-factor interactions between the four factors.
Table 5 summarizes the analysis of variance for this experiment. Of the fourfactors we considered, size appears to be the most significant factor influencing the
Table 3 Data of factors
Codes Factor Level Data Indication
A Size Low 10� 10 nodes Small
High 20� 20 nodes Large
B Flow Low 100 Non-peak hour
High 200 Peak hour
C Center Low 1 Single business center
High 2 Multiple business centers
D Directionality Low 1-direction One-way streets
High 2-direction Two-way streets
154 M. Gao et al.

performance of our algorithm. The p-values of all factors except size (highlighted inbold in the table) are larger than 5 %, suggesting that these factors don’t affect theperformance of our algorithm significantly.
These results indicate that our method is widely applicable to Cartesian gridnetworks with differing numbers of business centers, amounts of traffic, and streetdirectionality. In terms of size, since we protect 16 links in both cases, the per-centage of protected links in a large network (2.1 %) will obviously be lower than ina small network (8.9 %), so it makes sense that measured performance would beworse in large networks.
5.2 Experiment 2
Differing numbers of streets to be protected may of course also result in differentlevels of improvement. Therefore, in this experiment, we will vary the number ofprotected links, keeping the rest of the network constant.
We arbitrarily pick the third network in Table 4 as our study subject. This is a10 × 10 road network, with one business center, 200 vehicles entering and exitingfrom the network every minute, and two-way streets. Protecting different numbers
Table 4 Experimental design
Run Size Flow Center Directionality Improvement (%)
1 − − − − 14.1
2 + − − + 2.3
3 − + − + 22.3
4 + + − − 6.8
5 − − + + 11.8
6 + − + − 4.3
7 − + + − 22.9
8 + + + + 4.7
Table 5 Analysis of variance for improvement (%)
Source DF Seq SSa MS F p
Main effects 4 430.86 107.715 12.23 0.034
Size 1 351.13 351.13 39.87 0.008Traffic flow 1 73.20 73.20 8.31 0.063
Business center 1 0.40 0.40 0.05 0.844
Directionality of streets 1 6.13 6.13 0.70 0.465
Residual error 3 26.42 8.81
Total 7 457.28a Seq SS represents sequential sum of squares
A Heuristic Method for Identifying Near-Optimal Defending Strategies … 155

of links, we get different effectiveness, as shown in Table 6. In this table, we alsocalculate the proportion of protected links and the benefit/cost ratio (improvementdivided by proportion of protected links).
By plotting percent improvement as a function of percent defended in Fig. 6, therelationship is apparent. Below 25 % of links defended, the relationship isapproximately linear. As the percentage of defended links increases, the improve-ment approaches 100 %, so the marginal benefit of additional protection effort mustdecrease.
Analyzing the data for less than 25 % of links protected in Minitab, Table 7shows that the percentage of protection links is significantly related to theimprovement achieved, with p-value = 0.000. The R-squared value of 99.9 % alsoshows the near-perfect linear relationship between protection and improvement, asillustrated in Fig. 7.
Table 6 Improvement as a function of protection effort
Number of linksprotected
Percentage ofprotected linksa
Improvement (%) Improvement/percentageof protected links
8 4.44 12.7 2.86
16 8.89 22.3 2.51
24 13.33 34.1 2.56
32 17.78 45.7 2.57
40 22.22 56.4 2.54
60 33.33 68.1 2.04
80 44.44 74.5 1.68
100 55.56 86.4 1.56
120 66.67 89.7 1.35
140 77.78 94.1 1.21
162 100.00 100.0 1.00a Percentage of protected links is calculated as the number of protected links divided the totalnumber of links in the network (i.e., 180), times 100
Fig. 6 Improvementeffectiveness (%) versusprotected links (%)
156 M. Gao et al.

With this linear relationship, the government has to decide on the acceptable risklevel and/or the available budget for protection, and can then get a near-optimaldecision for this multiple-criteria decision making problem.
6 Conclusion
In this chapter, we developed a heuristic method to identify near-optimal defensestrategies for a road network subject to congestion. In particular, when applied to arealistic-sized Cartesian grid-like network, we can significantly reduce the costcaused by attacks. For instance, in Manhattan, protecting 5 % of the total of 180links in our network, the expected cost associated with an attack can be successfullyreduced by 14 %.
Moreover, we designed a 24�1 fractional factorial experiment to analyze thefactors influencing the improvement achieved by the proposed method. The resultsshow that factors such as traffic demand, the number of business centers, and streetdirectionality (one-way or two-way) have much less impact on the performance ofthe method than the percentage of protected links. Therefore, keeping the otherfactors constant, we change the percentage of protected links, and find that thedegree of improvement is almost perfectly linearly related to the percentage ofsecured links when that percentage is less than a threshold. Once the percentageexceeds that threshold, defending additional links becomes less effective.
In future research, we will extend our study by evaluating the effectiveness ofprotection against attacks that target the most heavily traveled arcs, rather than
Table 7 Regression analysis of improvement as a function of protection effort
The regression equation is improvement (%) = 1.05 + 2.29 protected links (%)
Predictor Coefficient SE Coefficient t p
Constant 1.0076 0.6903 1.46 0.240
Protected links (%) 2.49268 0.04683 53.22 0.000
S = 0.658319 R-Sq = 99.9 % R-Sq (adj) = 99.9 %
Fig. 7 Scatterplot ofimprovement (%) versusprotection effort (%)
A Heuristic Method for Identifying Near-Optimal Defending Strategies … 157

random attacks. Moreover, more numerical tests can be conducted to examine howclose to optimal our heuristic is and what can be done to improve the effectivenessand efficiency of heuristic. In addition, we may explore the problem along anotherdirection by using an SO model to characterize the network traffic under attack,assuming that government agencies are able to respond to an attack rapidly enoughand act as a central planner to control the traffic. It would be interesting to study thedifferences between that case and the UE model.
References
1. Beckmann M, McGuire CB, Winsten CB (1956) Studies in the economics of transportation.Yale University Press, New Haven
2. Bier VM, Hausken K (2013) Defending and attacking a network of two arcs subject to trafficcongestion. Reliab Eng Syst Saf 112:214–224
3. Bier VM, Gratz ER, Haphuriwat NJ, Magua W, Wierzbicki KR (2007) Methodology foridentifying near-optimal interdiction strategies for a power transmission system. Reliab EngSyst Saf 92(9):1155–1161
4. Church RL, Scaparra MP (2007) Protecting critical assets: The r-interdiction median problemwith fortification. Geog Anal 39(2):129–146
5. Feng C, Wen C (2003) Traffic control management for earthquake-raided area. J East Asia SocTransp Stud 5:3261–3275
6. Florian M, Nguyen S (1976) An application and validation of equilibrium trip assignmentmethods. Transp Sci 10(4):374–390
7. Frank M, Wolfe P (1956) An algorithm for quadratic programming. Naval Res Logistics Q 3(1–2):95–110
8. Friesz TL (2010) Dynamic optimization and differential games. International series inoperations research and management science, vol 135. Springer, New York
9. Garcia CB, Zangwill WI (1981) Pathways to solutions, fixed points, and equilibria. Prentice-Hall, Michigan
10. Light Rail Now Project Team (2008) Nearly 3/4 of surface transport terror attacks involvepersonal motor vehicles—so US security officials focus on … trains? Retrieved 23 July 2014,from http://www.lightrailnow.org/
11. Murray-Tuite PM, Mahmassani HS (2004) Methodology for determining vulnerable links in atransportation network. Transp Res Rec J Transp Res Board 1882(1):88–96
12. Ng M, Park J, Waller T (2010) A hybrid bilevel model for the optimal shelter assignment inemergency evacuations. Comput Aided Civ Infrastruct Eng 25:547–556
13. Pang JS, Chan D (1982) Iterative methods for variational and complementarity problems.Math Program 24(1):284–313
14. Royset JO, Wood RK (2007) Solving the bi-objective maximum-flow network-interdictionproblem. INFORMS J Comput 19(2):175–184
15. Scarf H (1967) The approximation of fixed points of a continuous mapping. SIAM J ApplMath 15(5):1328–1343
16. Sheffi Y (1985) Urban transportation networks: equilibrium analysis with mathematicalprogramming methods. Prentice-Hall, Michigan
17. Todd MJ (1976) The computation of fixed points and applications. In: Lecture notes ineconomics and mathematical systems, vol 124. Springer, Berlin
18. Wardrop JG (1952) Some theoretical aspects of road traffic research. ICE Proc Eng Divisions 1(3):325–362
158 M. Gao et al.